
Preparation and Characterization of Patch Loaded with Clarithromycin Nanovesicles for Transdermal Drug Delivery

 ,
,
Abstract
1. Introduction
2. Materials and Methods
2.1. Materials
2.2. Saturation Solubility of CLR
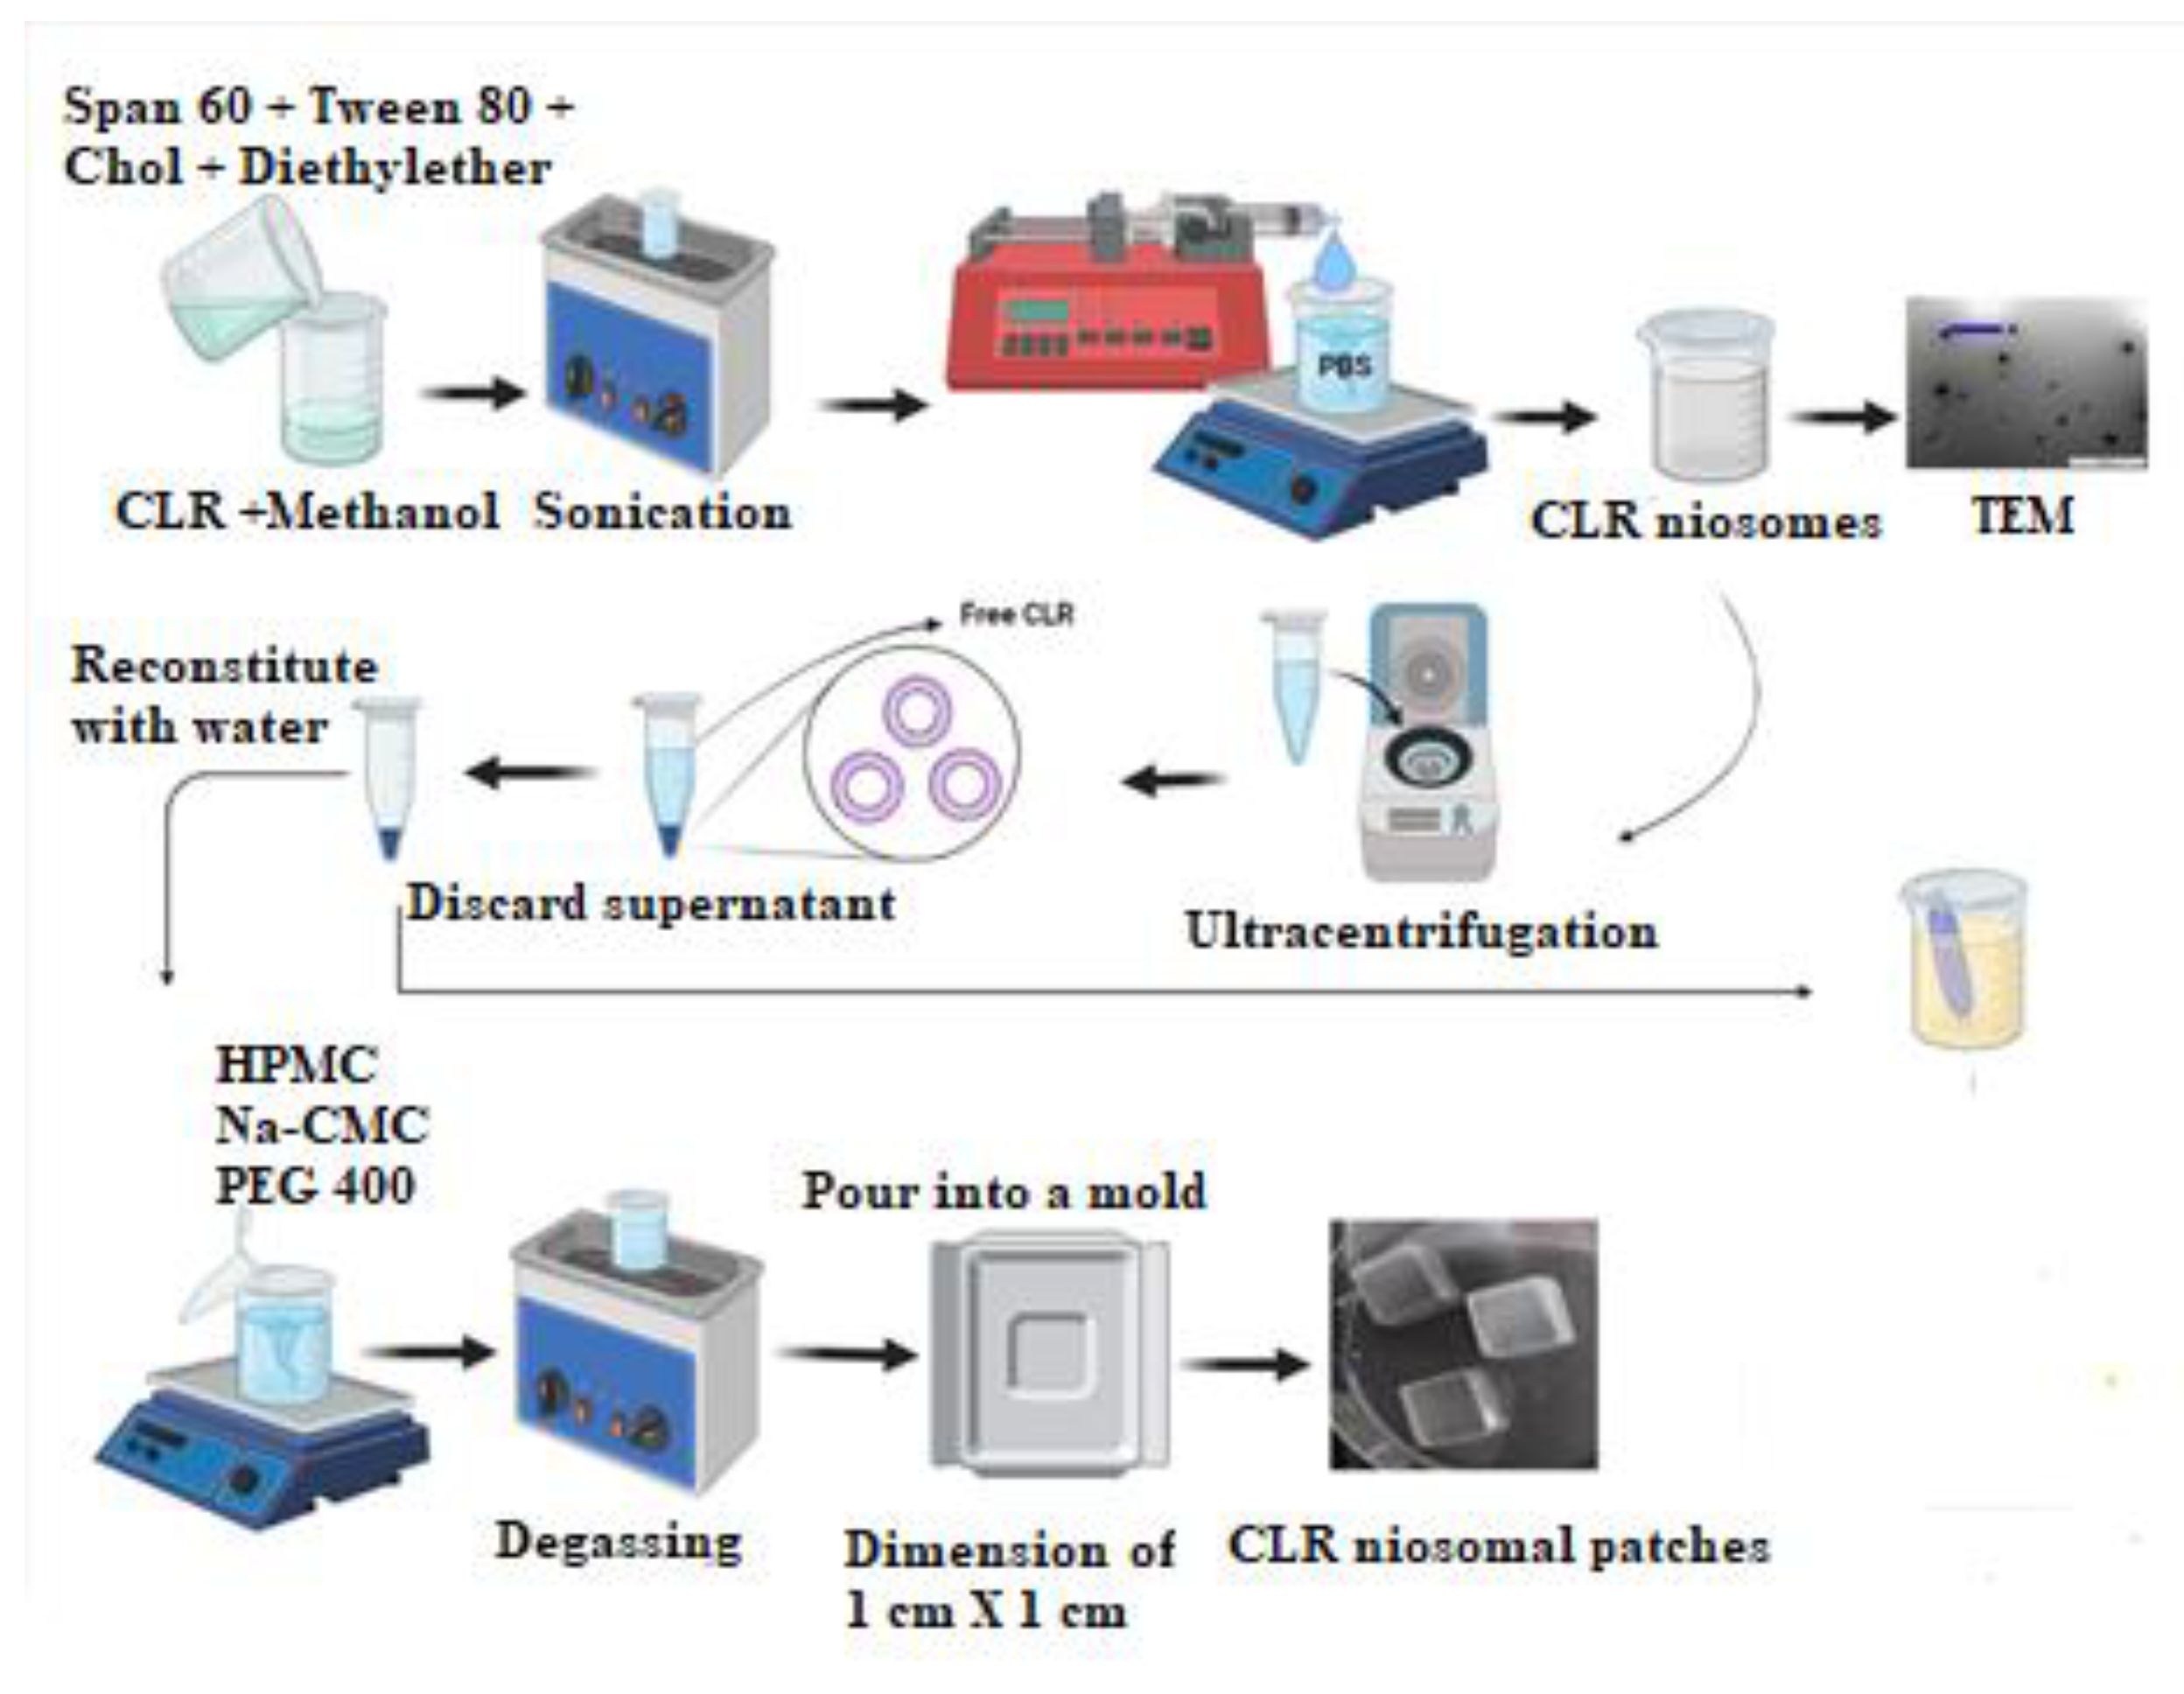
2.3. Preparation of CLR Niosomes
2.4. Characterization of CLR-Loaded Niosomes
2.4.1. Transmission Electron Microscopy (TEM)
2.4.2. Particle Size (PS), Zeta Potential (ZP), and Polydispersity Index (PDI)
2.4.3. Encapsulation Efficiency (EE)
2.4.4. In Vitro Release Studies
2.4.5. Release Kinetics Modeling
2.4.6. Antimicrobial Activity Testing
2.5. Fabrication of CLR-Loaded Niosomal Patches
2.6. Evaluation of Niosomal Patches’ Physicochemical Properties
2.6.1. Physicochemical Evaluation of CLR-Loaded Niosomal Patches (CLR–NPs)
2.6.2. Moisture Content Determination
2.6.3. Drug Content
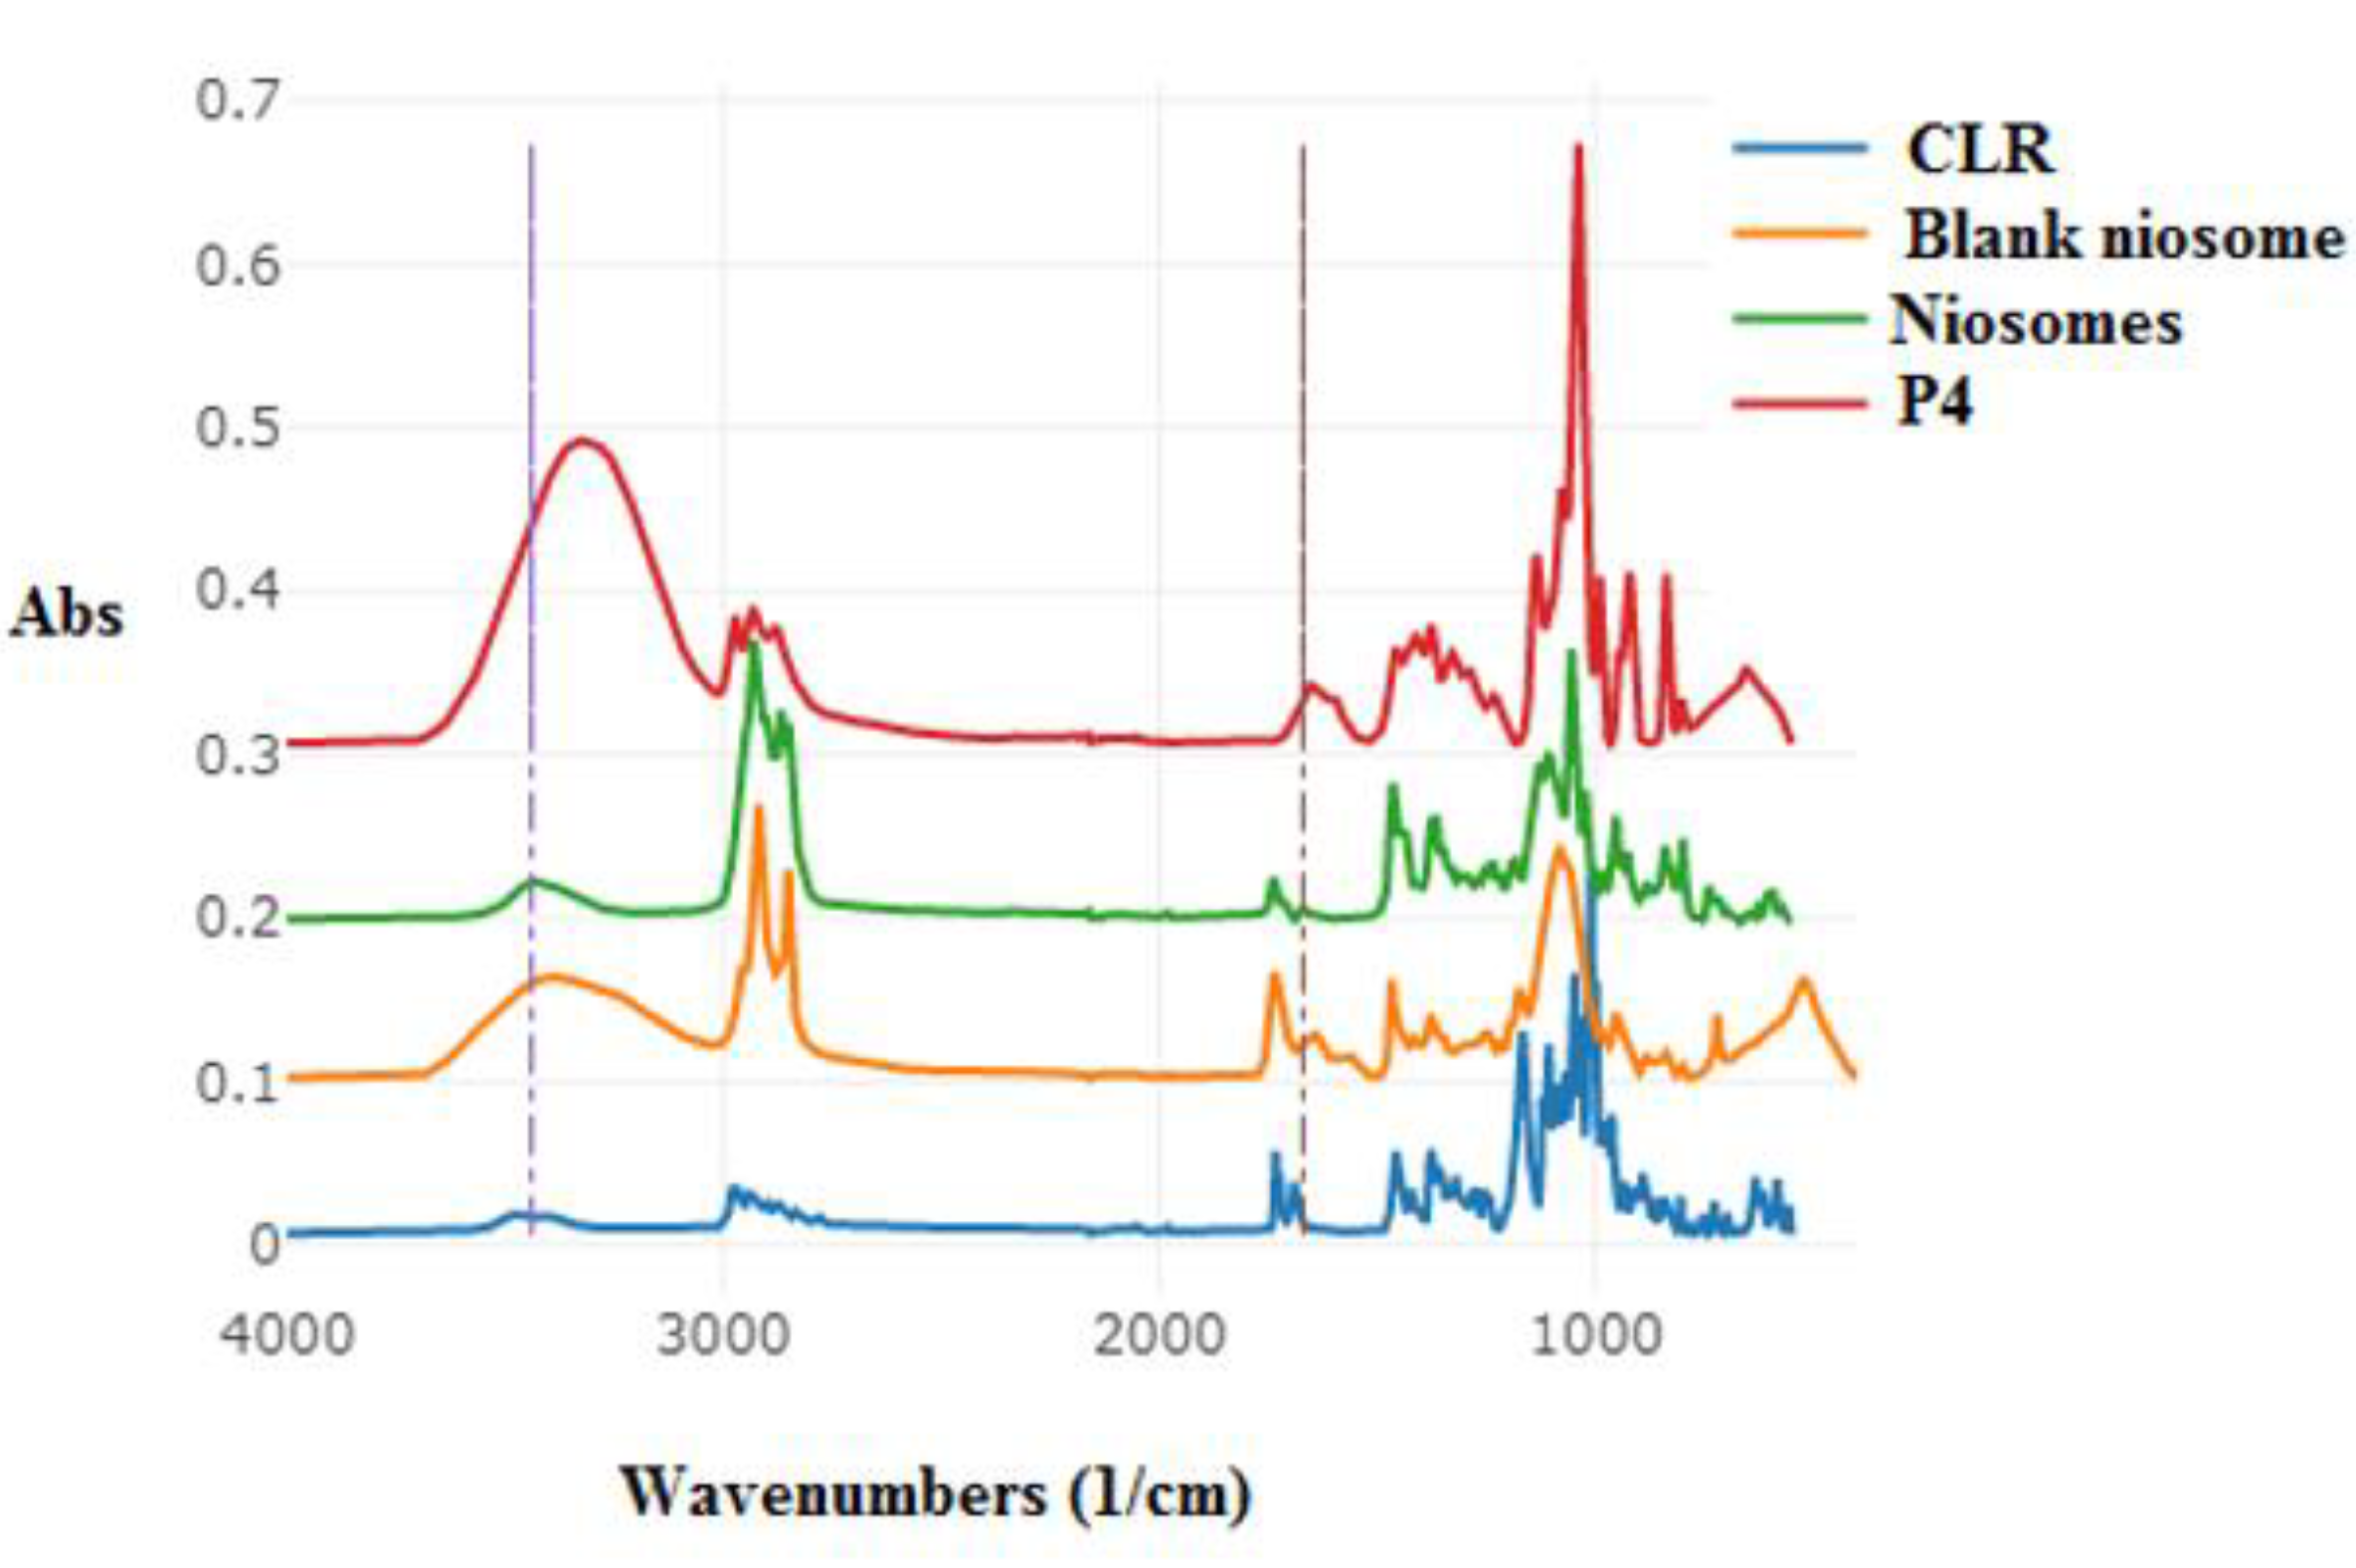
2.6.4. ATR–FTIR
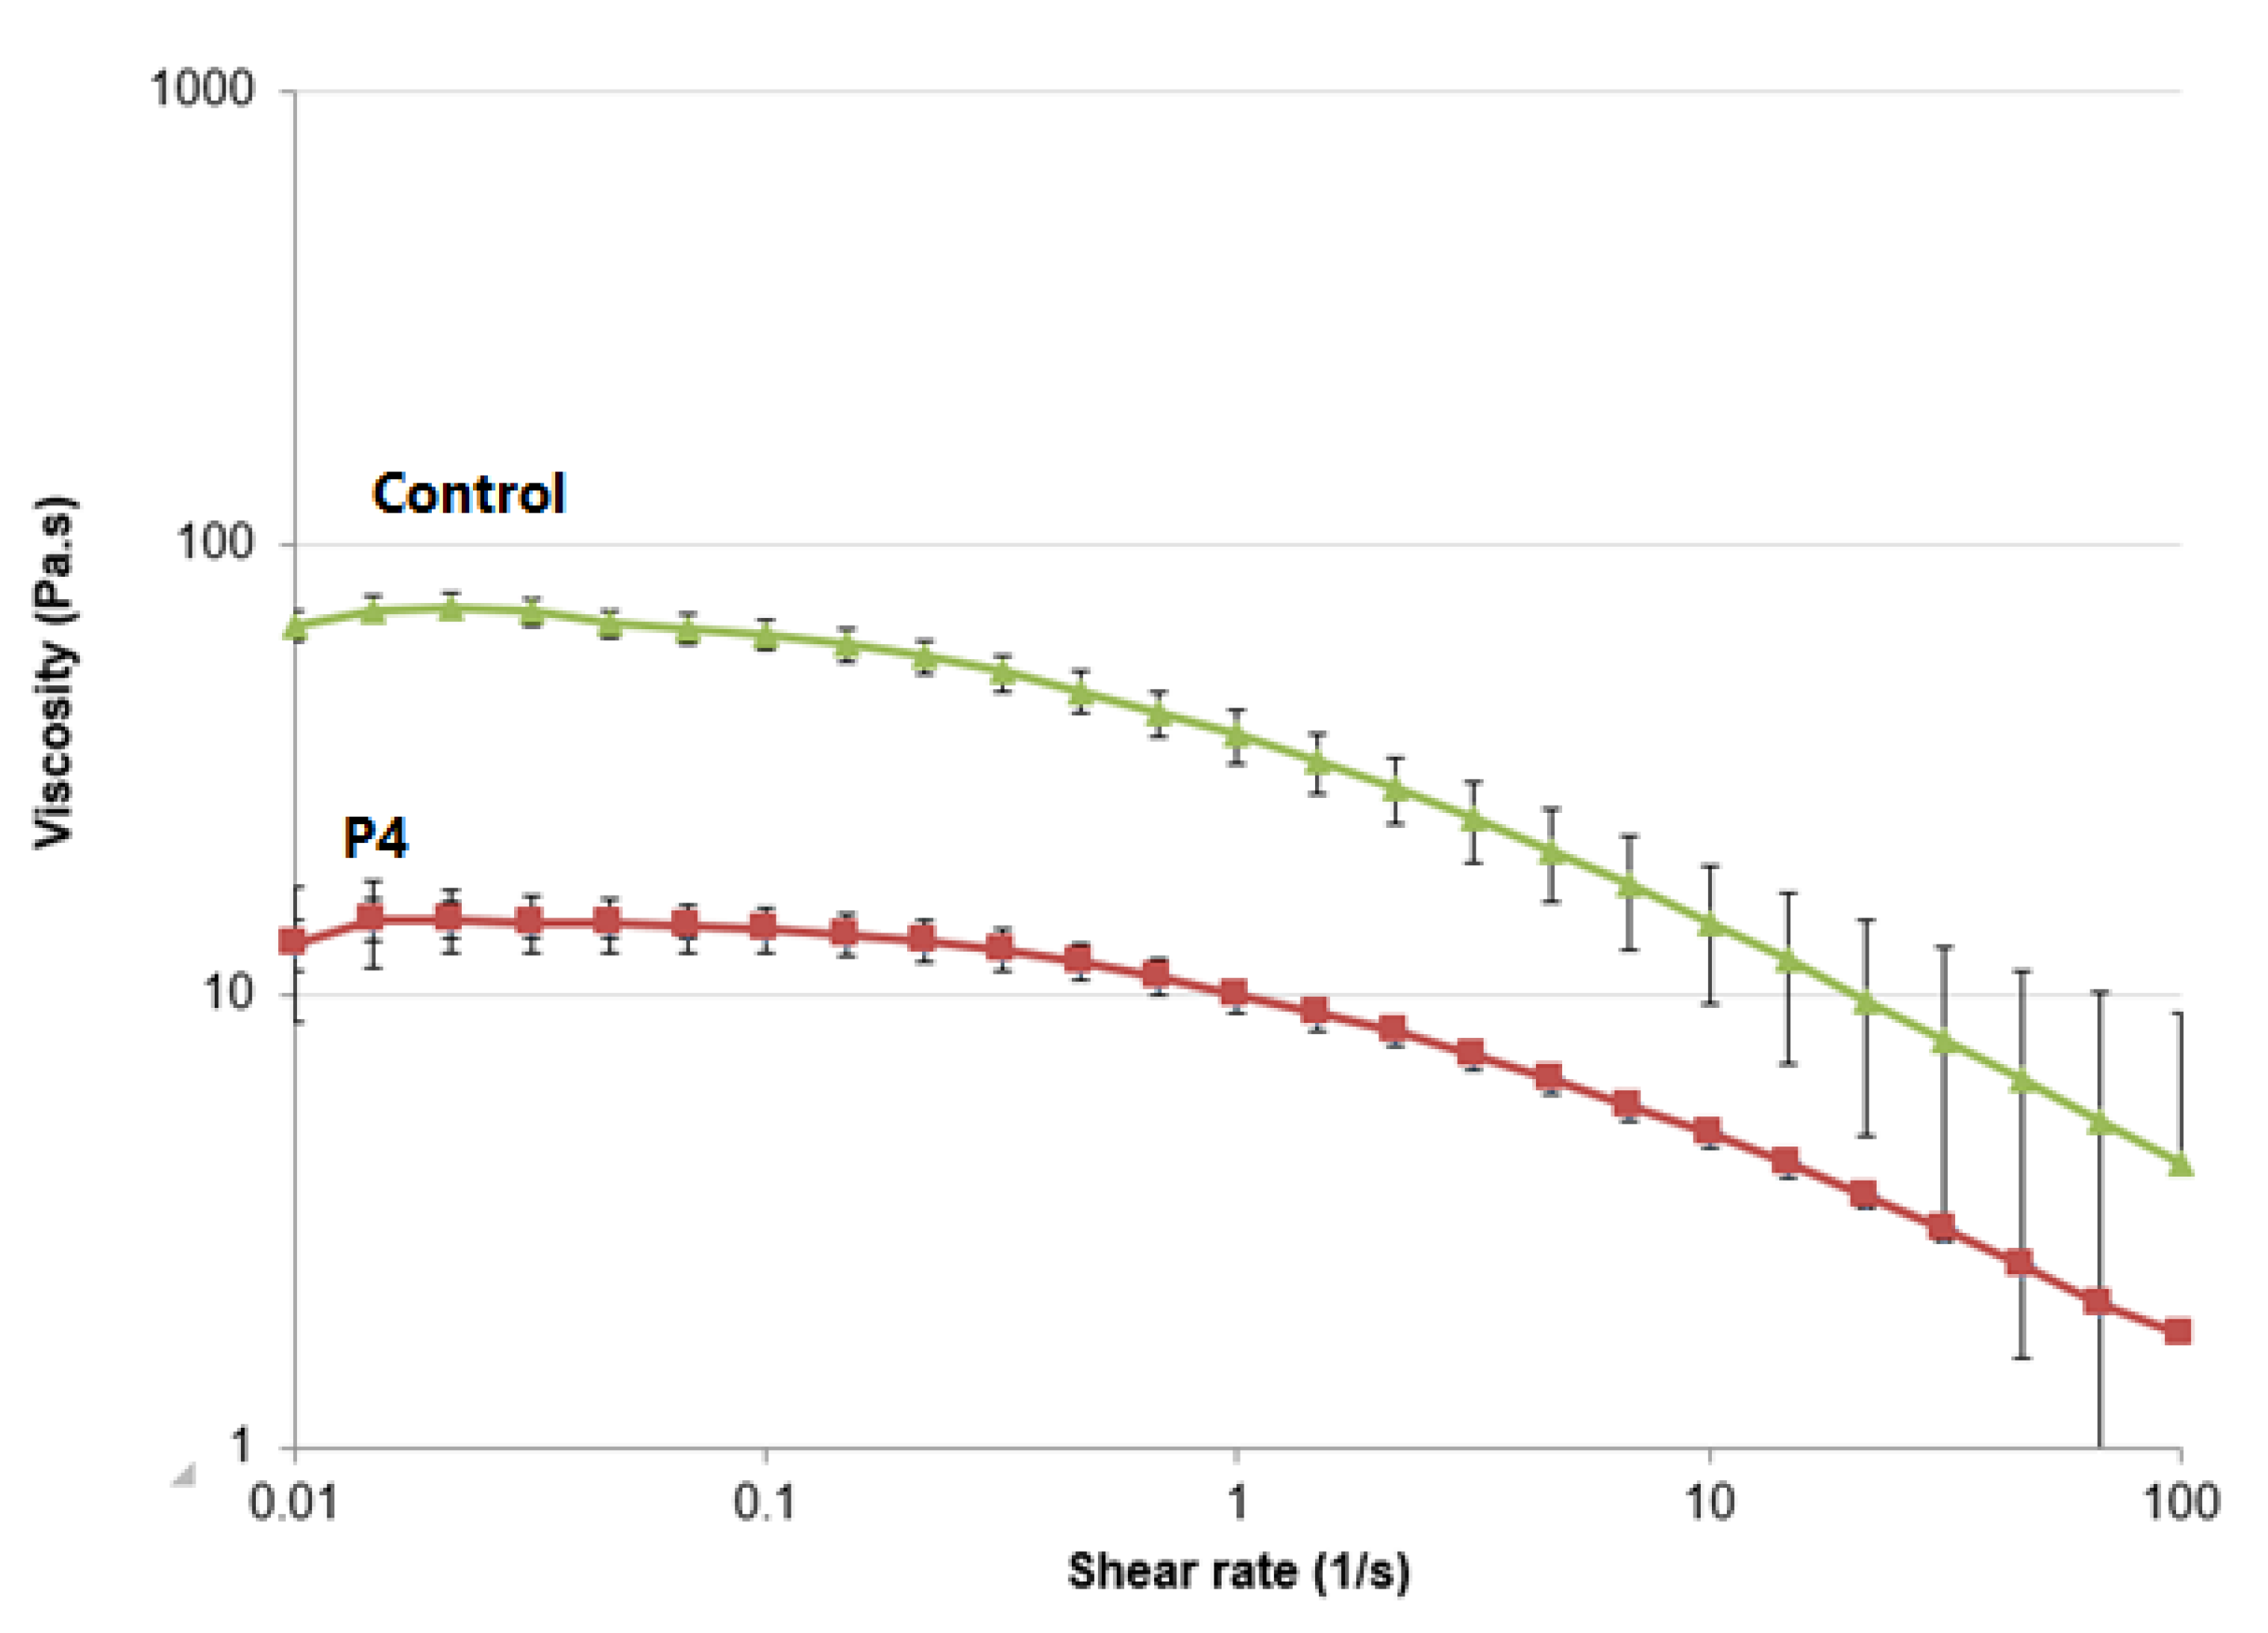
2.7. Rheological Study
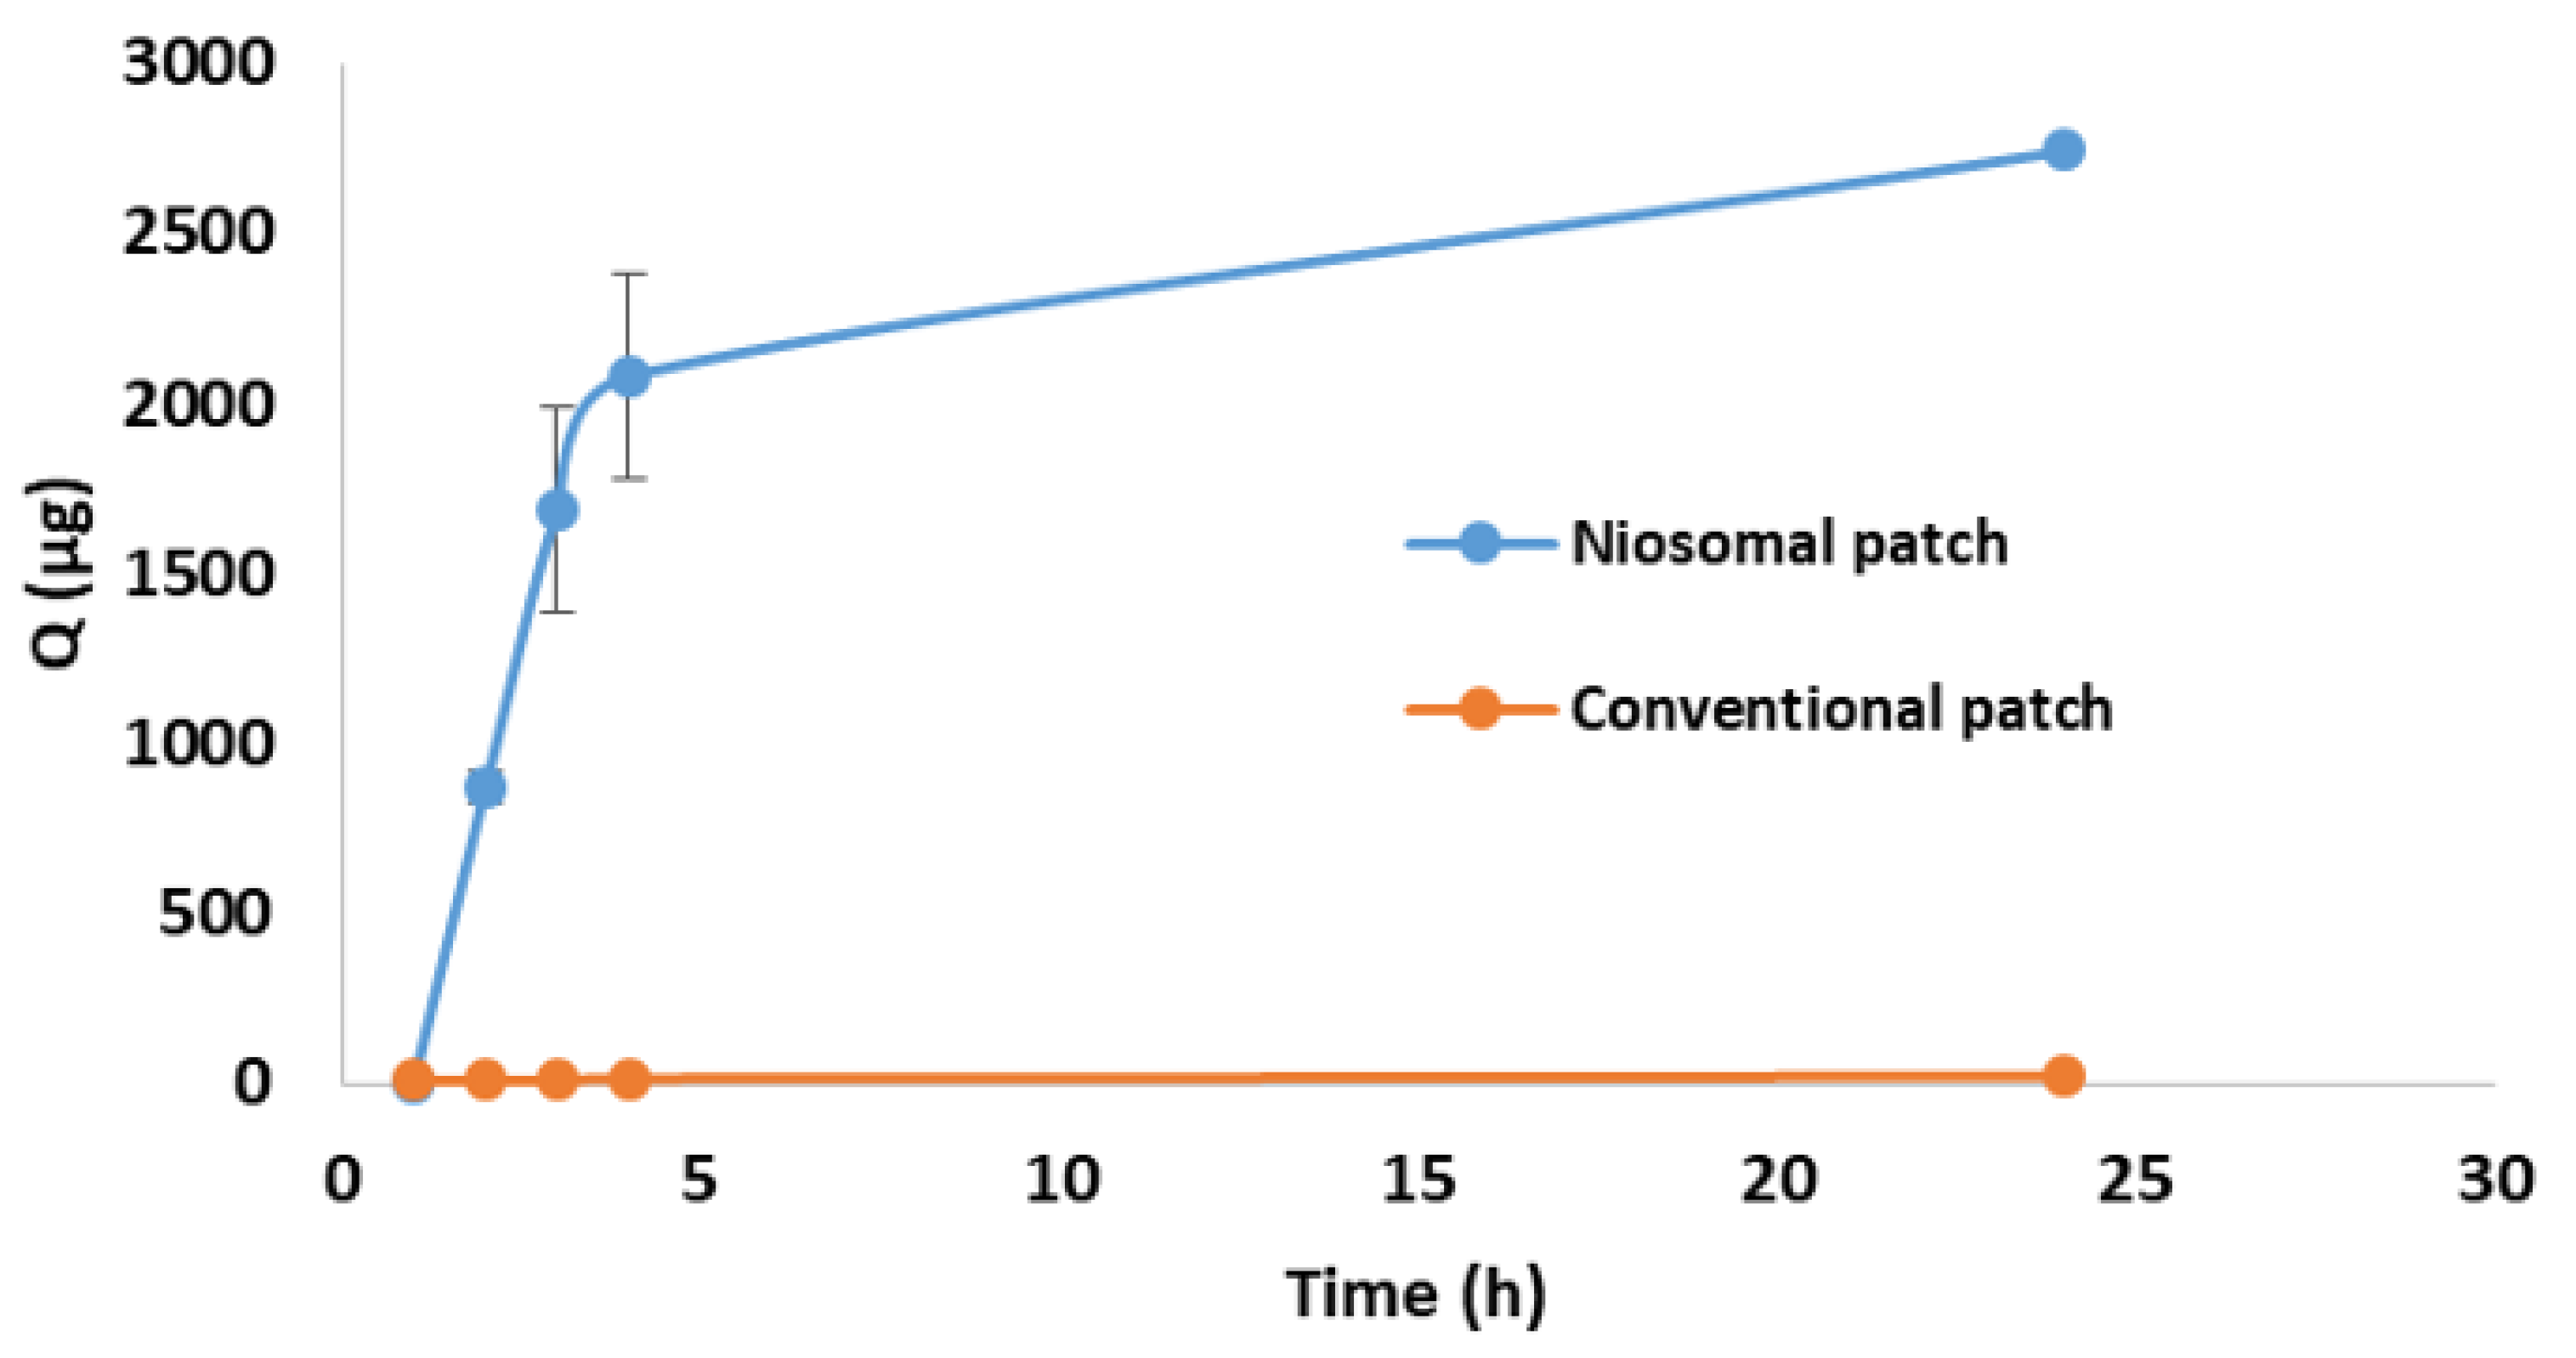
2.8. In Vitro Permeation Studies
2.9. Cytotoxicity Assay
2.10. Assay Method
2.11. Statistical Analysis
3. Results and Discussion
3.1. CLR Saturation Solubility Determination
3.2. Characterization and Assessment of CLR-Loaded Niosomes
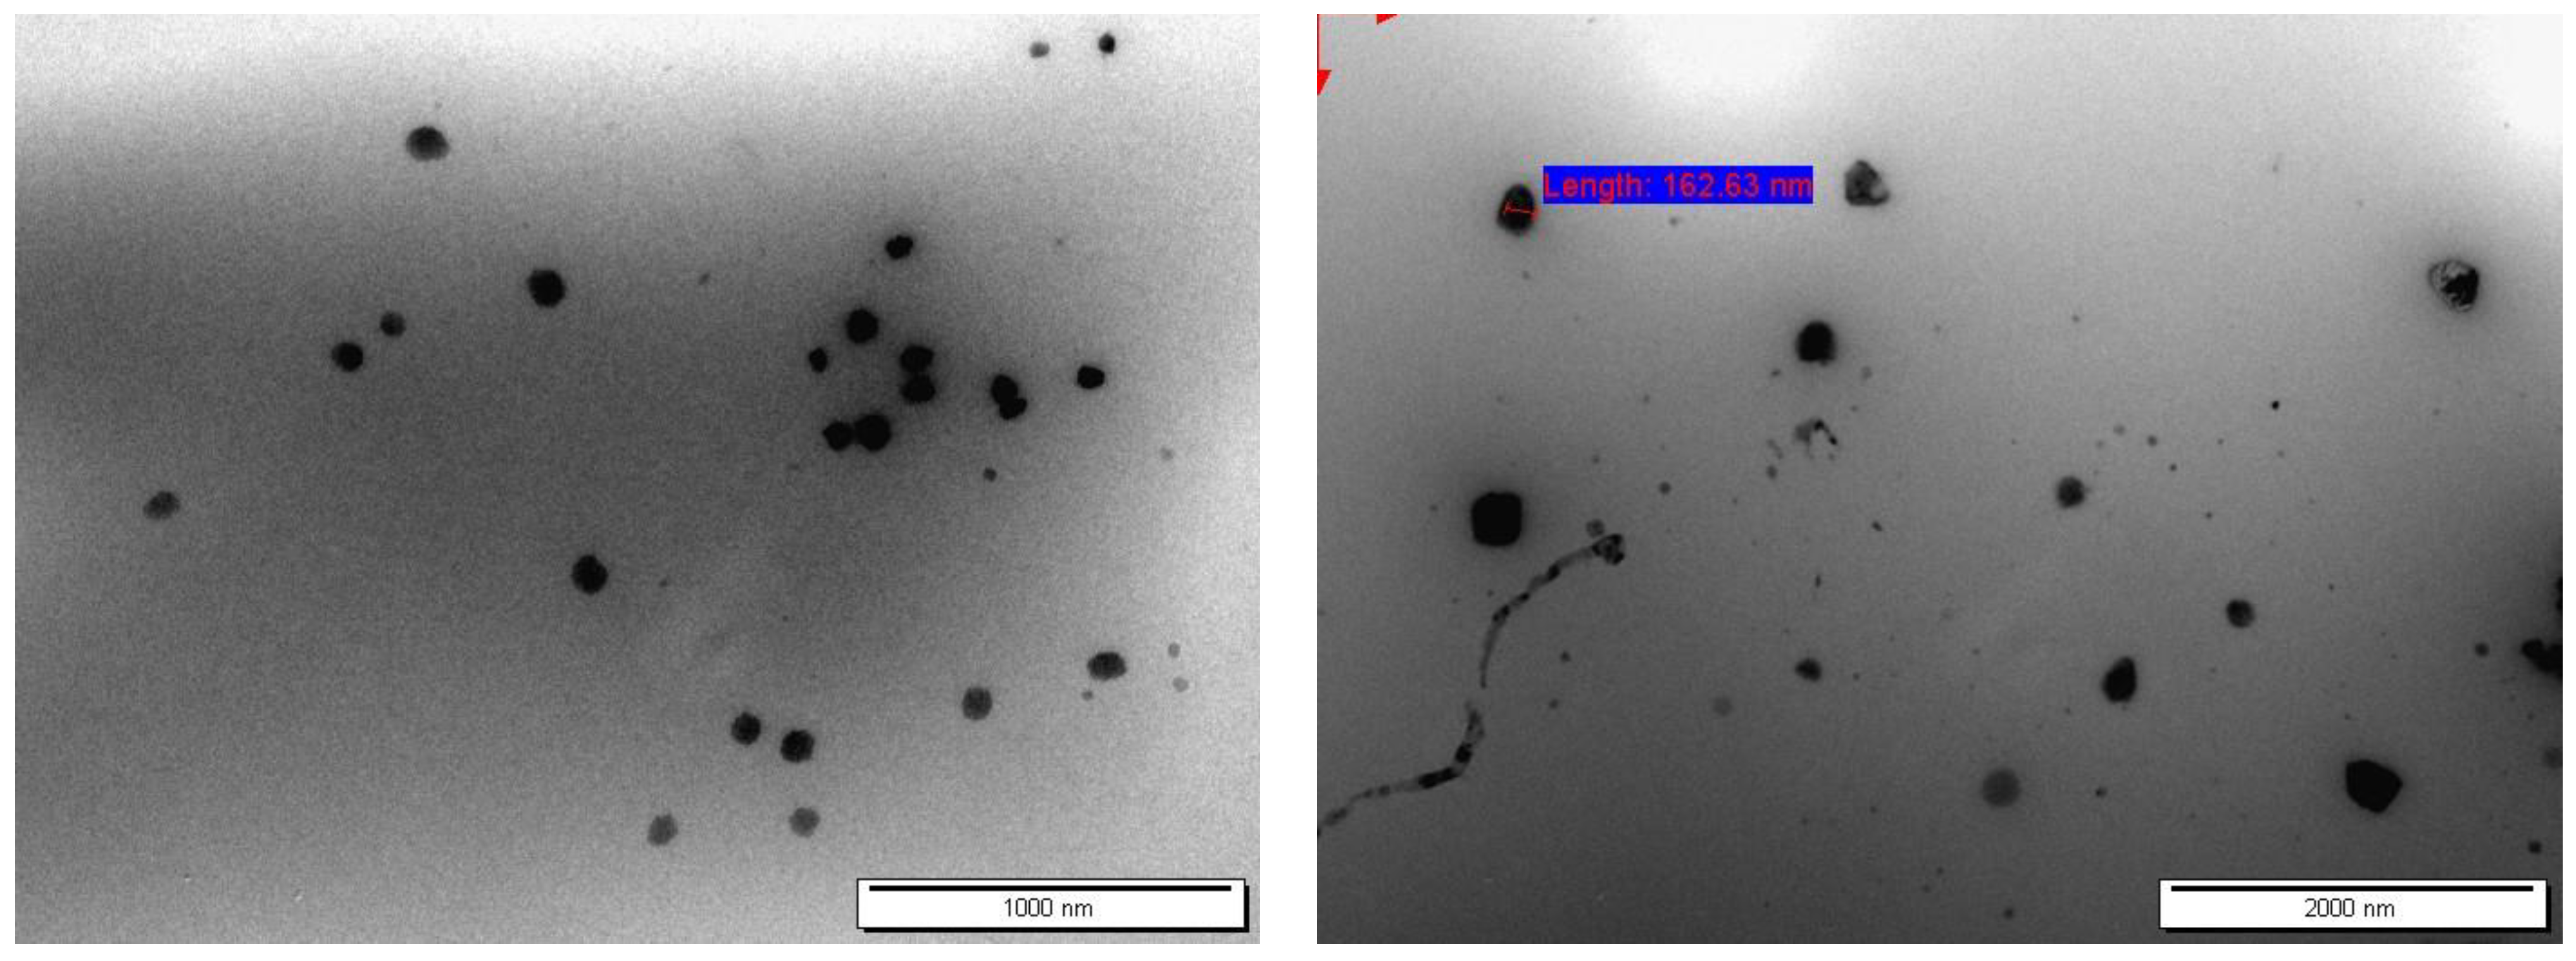
3.2.1. Particle Shape and Morphology
3.2.2. Encapsulation Efficiency (EE)
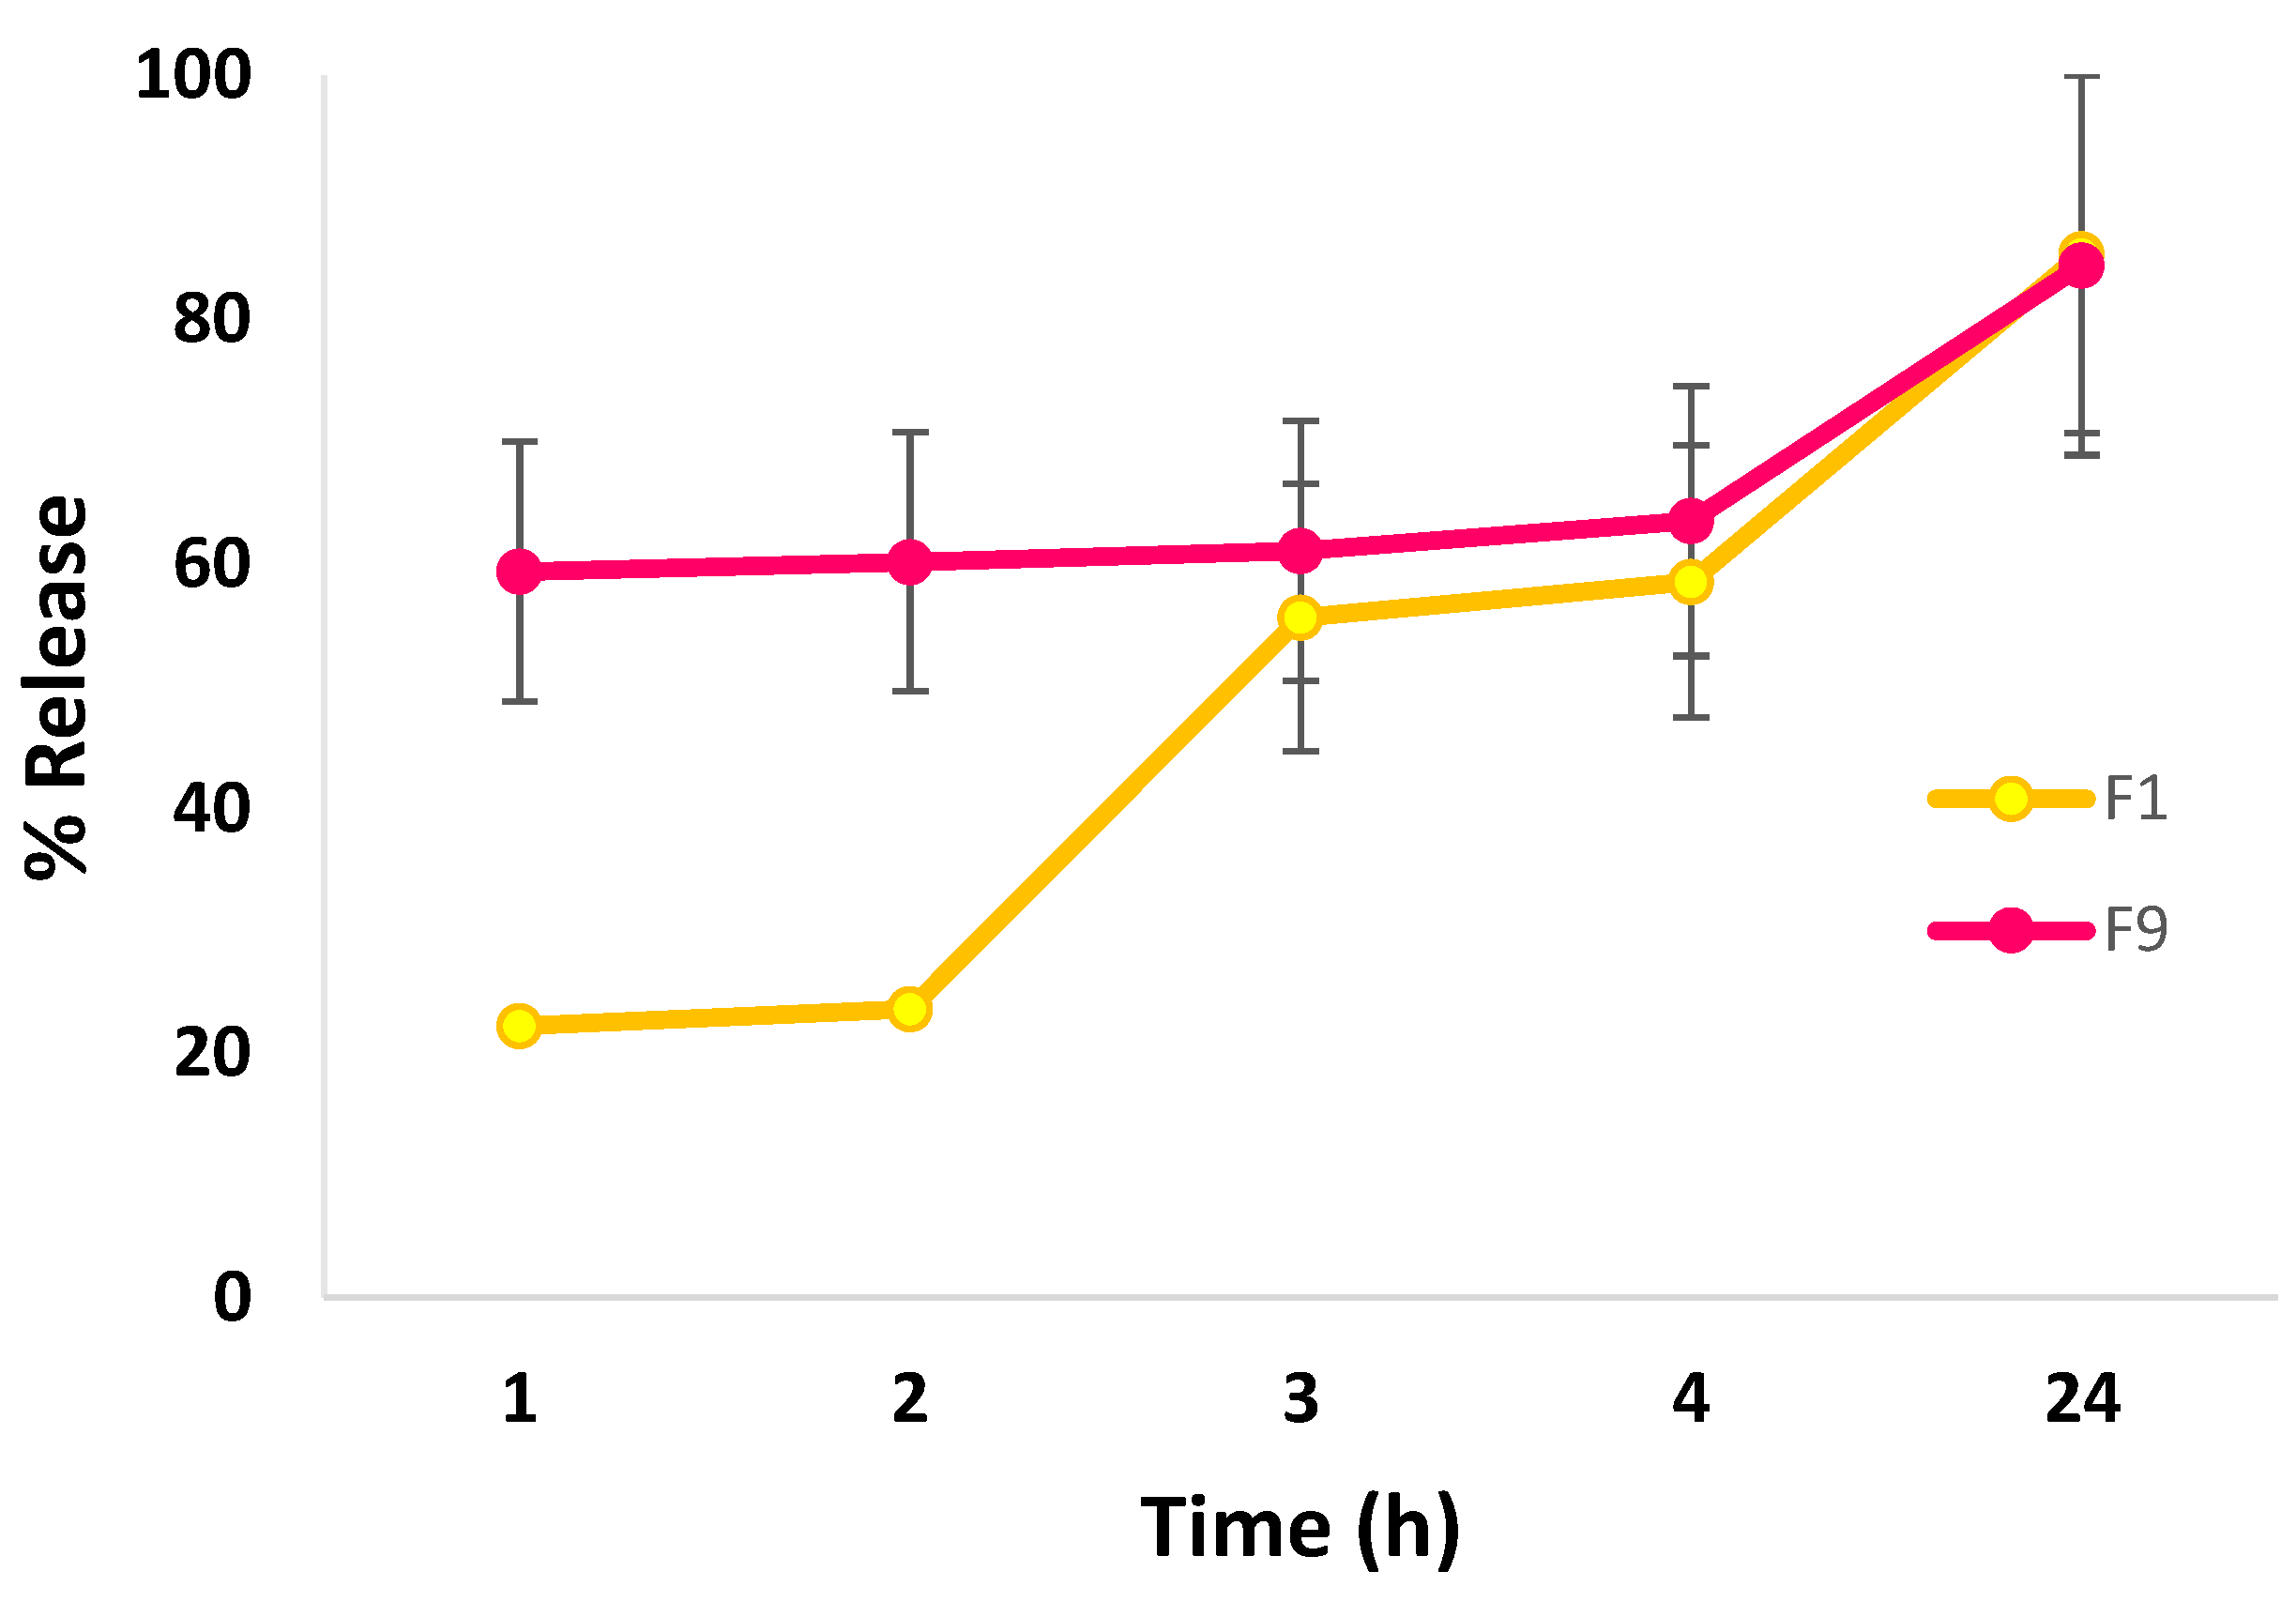
3.2.3. In Vitro Release Studies
3.2.4. Release Kinetics Modeling
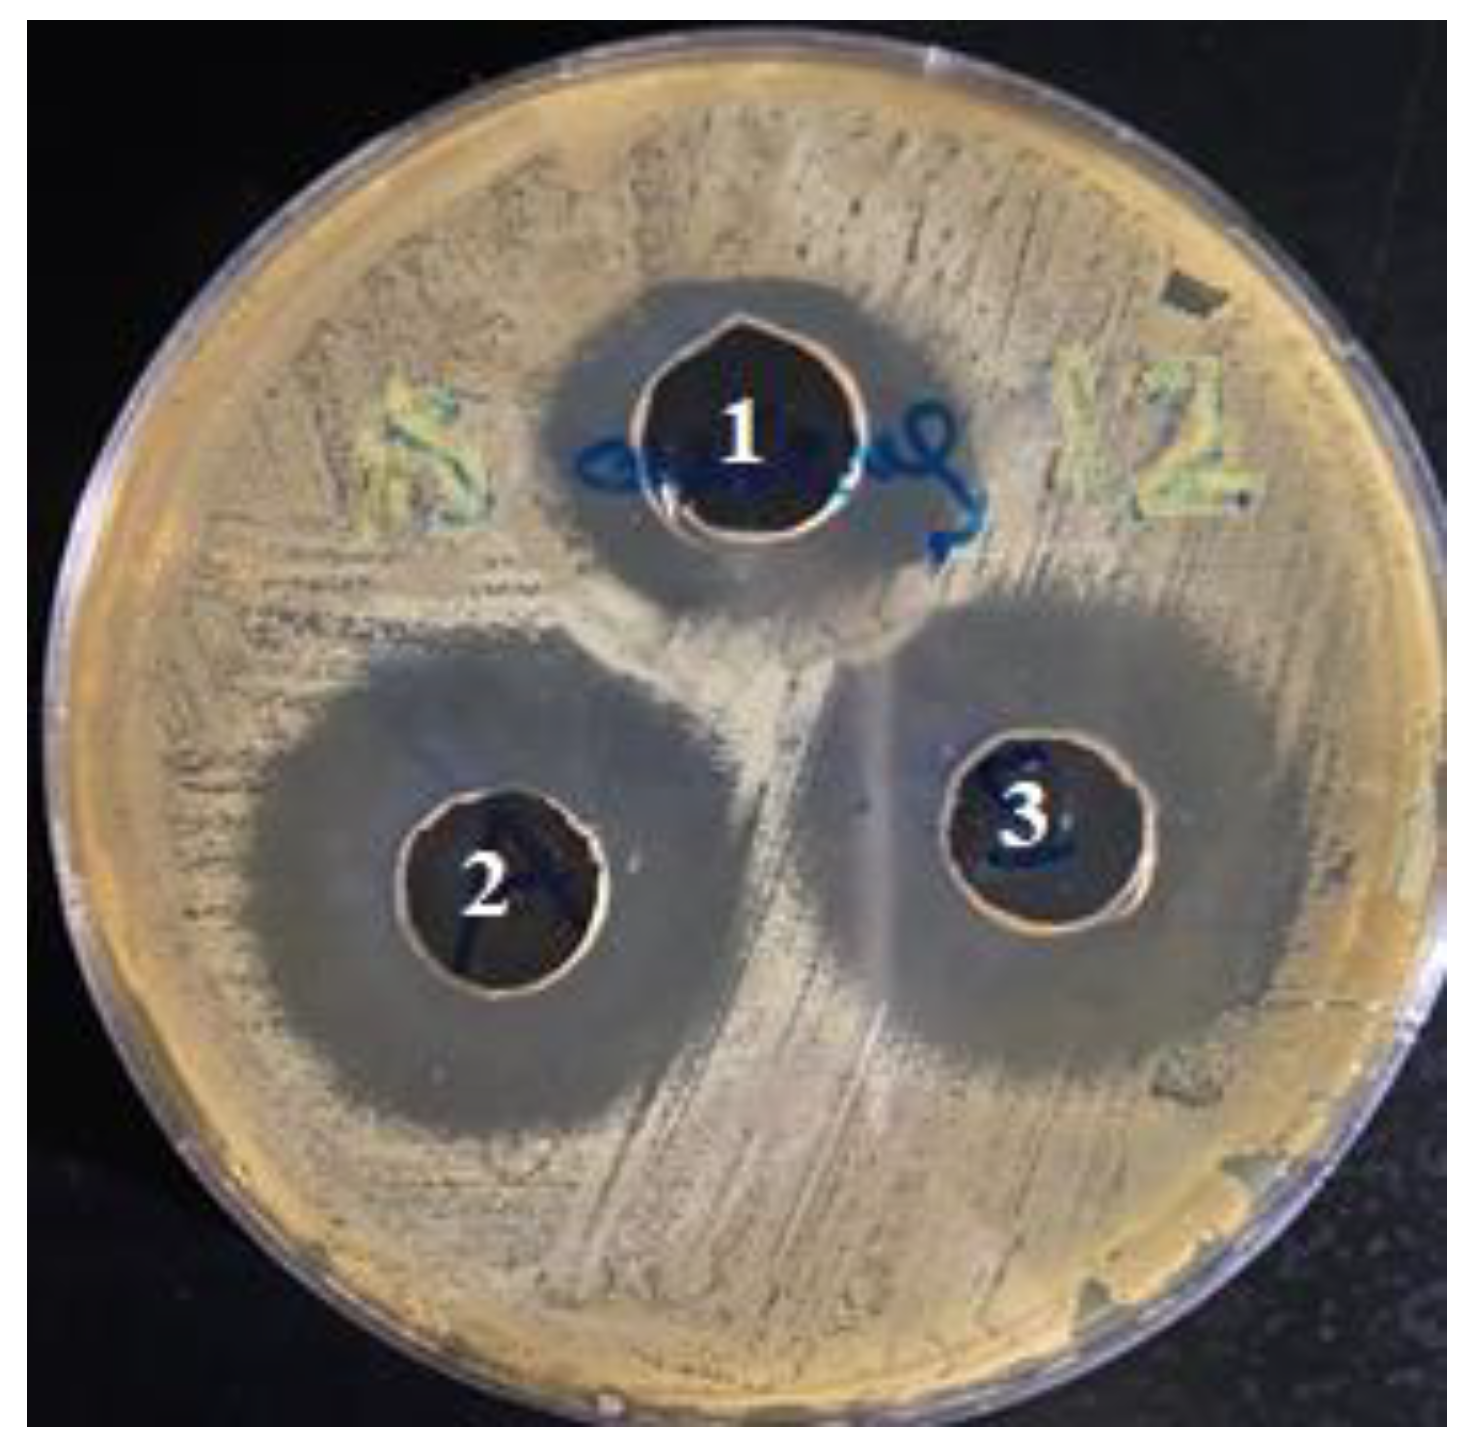
3.3. Antimicrobial Activity of CLR-Loaded Niosomes
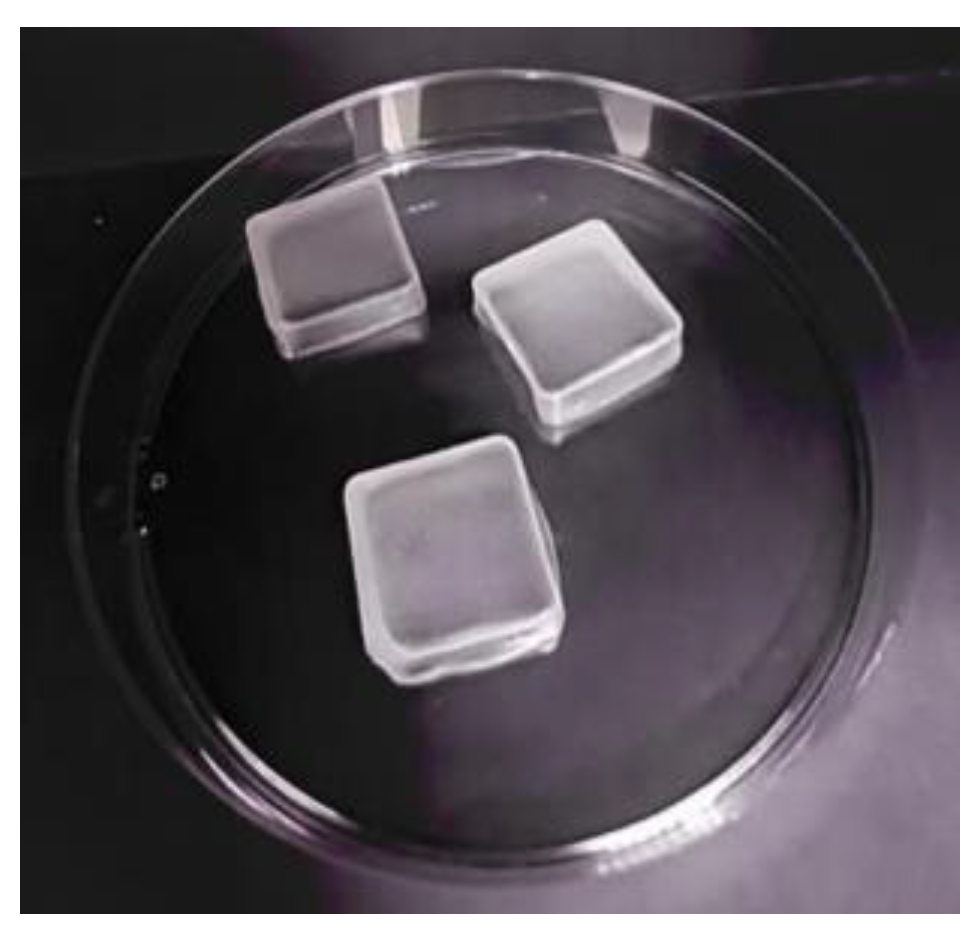
3.4. Fabrication of CLR-Loaded Niosomal Patches (CLR–NP)
3.5. Evaluation of CLR-Loaded Niosomal Patches
3.6. ATR–FTIR
3.7. Rheological Studies
3.8. In Vitro Permeation Study
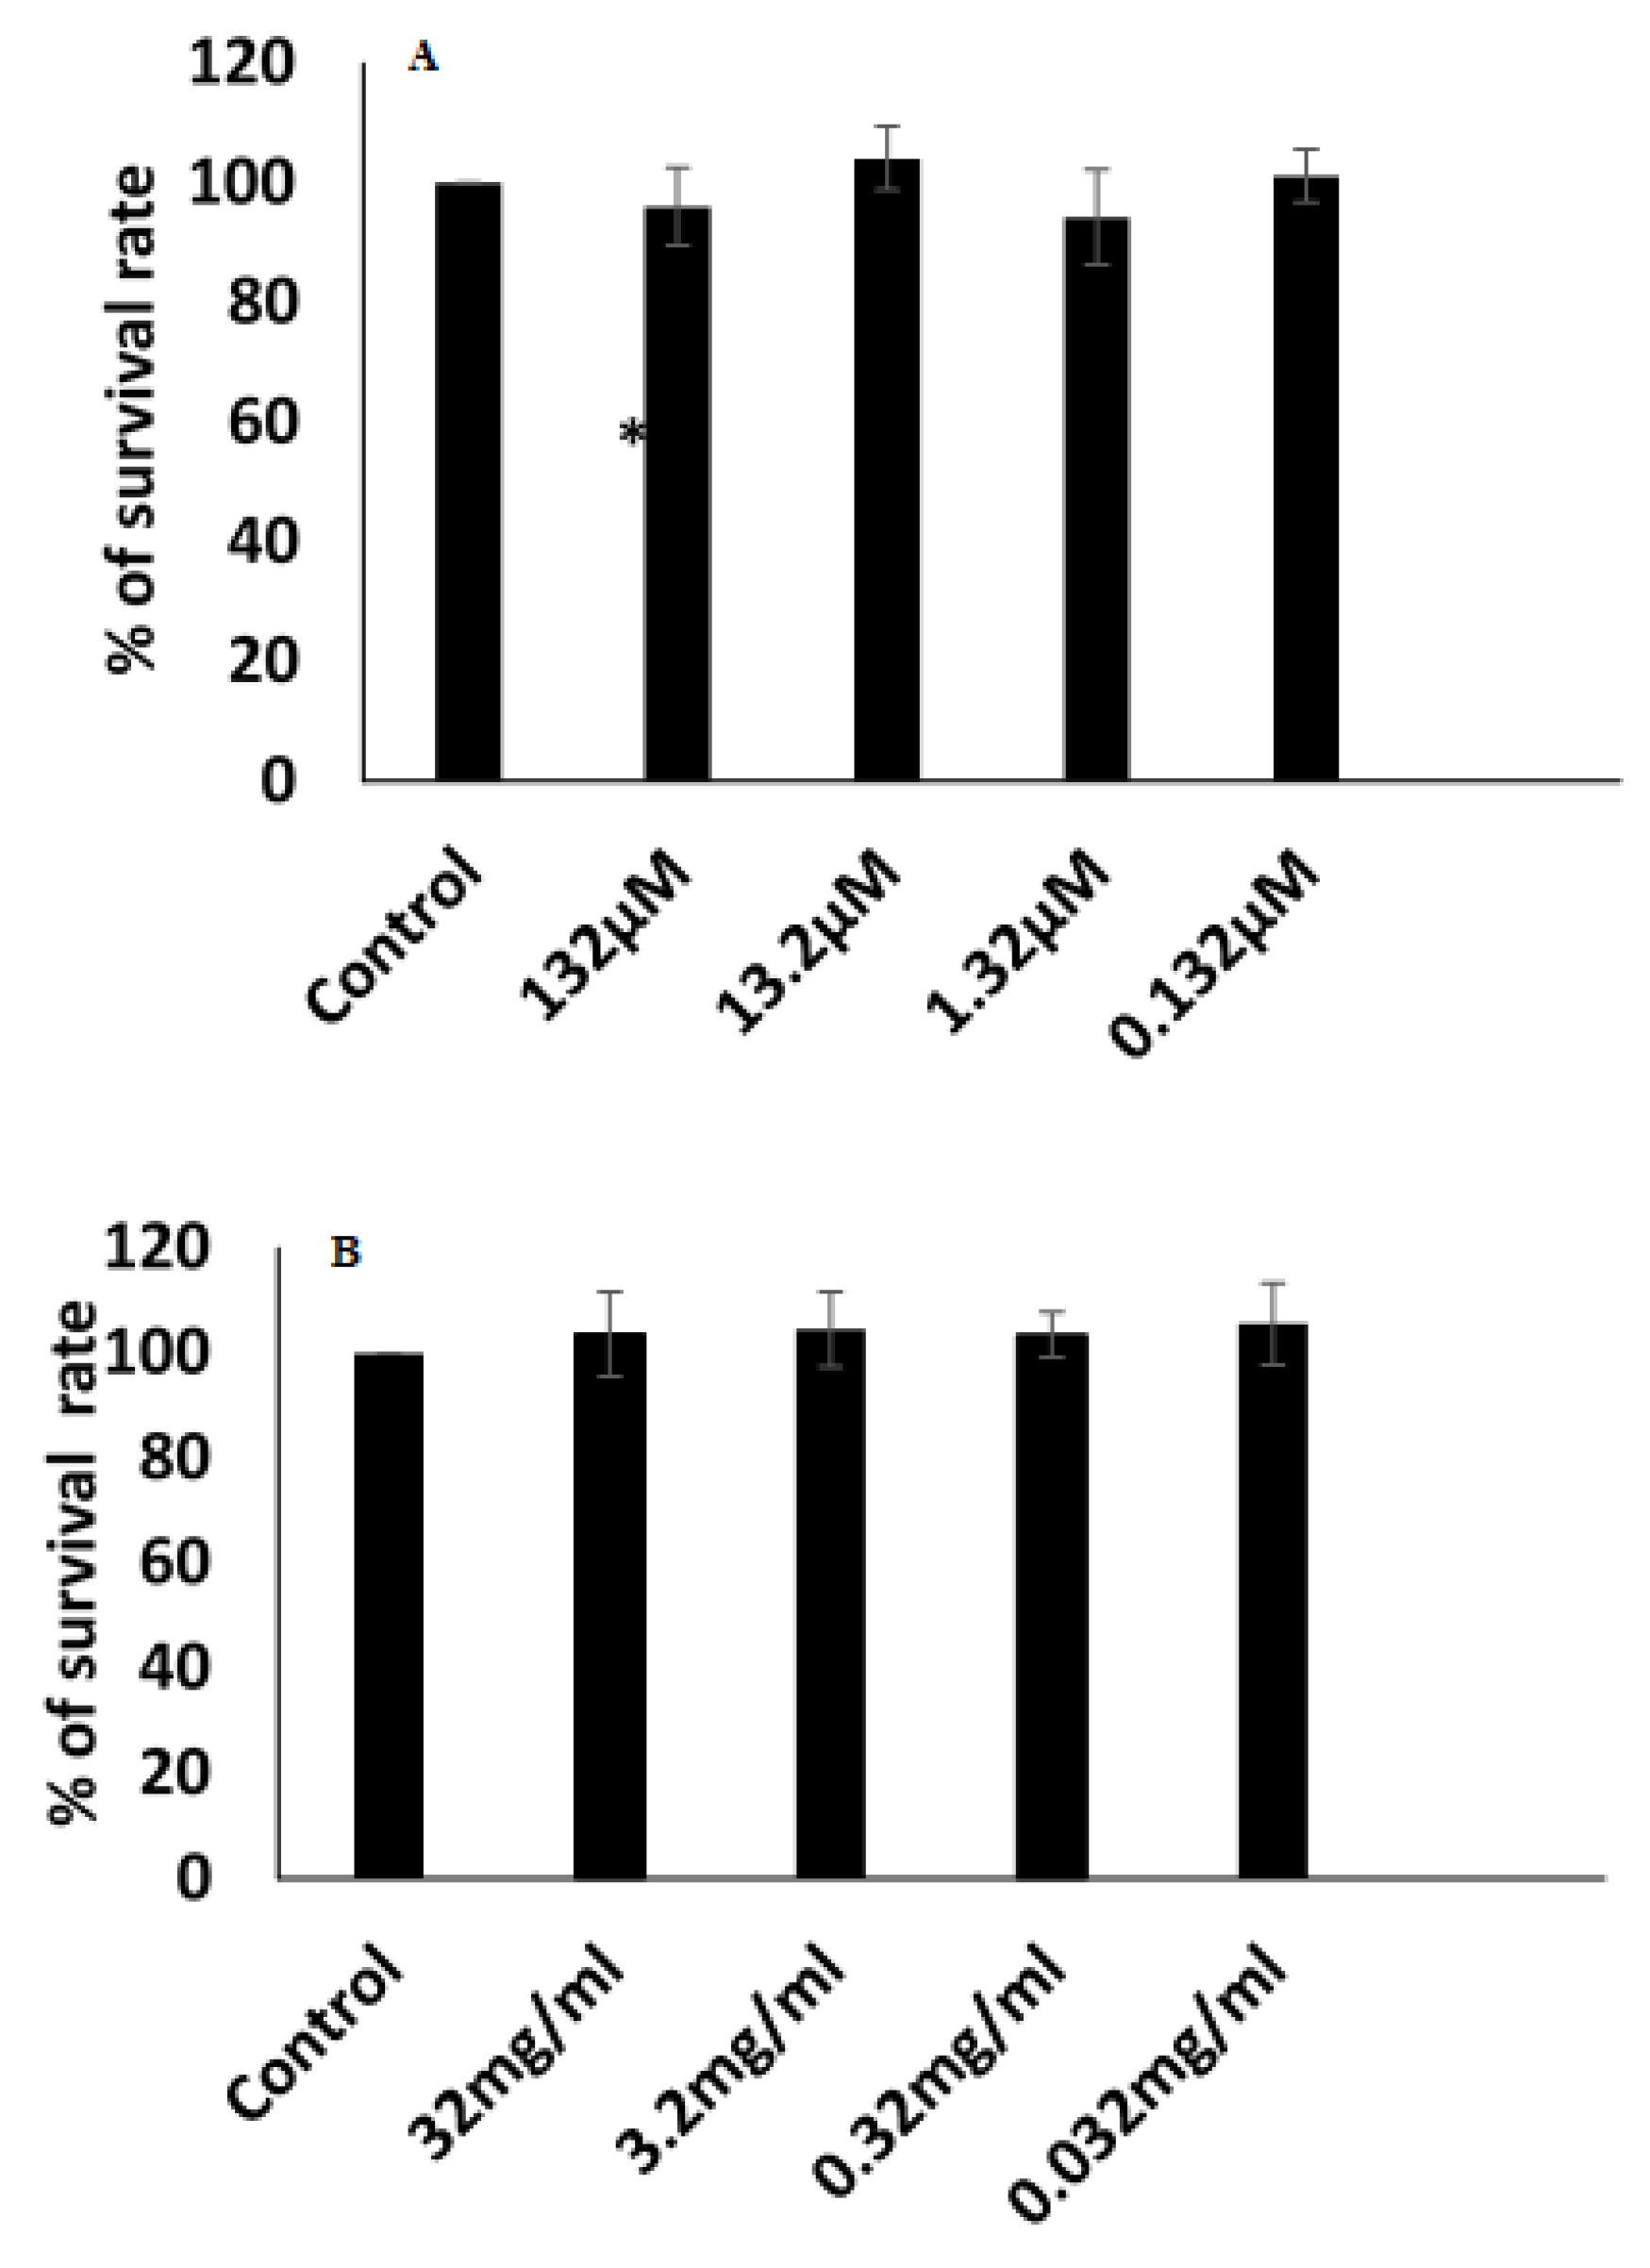
3.9. Cytotoxicity
4. Conclusions
Author Contributions
Funding
Informed Consent Statement
Data Availability Statement
Acknowledgments
Conflicts of Interest
References
- Qu, F.; Geng, R.; Liu, Y.; Zhu, J. Advanced nanocarrier- and microneedle-based transdermal drug delivery strategies for skin diseases treatment. Theranostics 2022, 12, 3372–3406. [Google Scholar] [CrossRef] [PubMed]
- Alkilani, A.Z.; Nasereddin, J.; Hamed, R.; Nimrawi, S.; Hussein, G.; Abo-Zour, H.; Donnelly, R.F. Beneath the Skin: A Review of Current Trends and Future Prospects of Transdermal Drug Delivery Systems. Pharmaceutics 2022, 14, 1152. [Google Scholar] [CrossRef]
- Prausnitz, M.R.; Langer, R. Transdermal drug delivery. Nat. Biotechnol. 2008, 26, 1261–1268. [Google Scholar] [CrossRef] [PubMed]
- Alkilani, A.Z.; McCrudden, M.T.C.; Donnelly, R.F. Transdermal Drug Delivery: Innovative Pharmaceutical Developments Based on Disruption of the Barrier Properties of the Stratum Corneum. Pharmaceutics 2015, 7, 438–470. [Google Scholar] [CrossRef] [PubMed]
- Jeong, W.Y.; Kwon, M.; Choi, H.E.; Kim, K.S. Recent advances in transdermal drug delivery systems: A review. Biomater. Res. 2021, 25, 24. [Google Scholar] [CrossRef] [PubMed]
- Arzani, G.; Haeri, A.; Daeihamed, M.; Bakhtiari-Kaboutaraki, H.; Dadashzadeh, S. Niosomal carriers enhance oral bioavailability of carvedilol: Effects of bile salt-enriched vesicles and carrier surface charge. Int. J. Nanomed. 2015, 10, 4797–4813. [Google Scholar] [CrossRef]
- Yeh, M.I.; Huang, H.C.; Liaw, J.H.; Huang, M.C.; Huang, K.F.; Hsu, F.L. Dermal delivery by niosomes of black tea extract as a sunscreen agent. Int. J. Dermatol. 2013, 52, 239–245. [Google Scholar] [CrossRef]
- Zaid Alkilani, A.; Abu-Zour, H.; Alshishani, A.; Abu-Huwaij, R.; Basheer, H.A.; Abo-Zour, H. Formulation and Evaluation of Niosomal Alendronate Sodium Encapsulated in Polymeric Microneedles: In Vitro Studies, Stability Study and Cytotoxicity Study. Nanomaterials 2022, 12, 3570. [Google Scholar] [CrossRef]
- Ge, X.; Wei, M.; He, S.; Yuan, W.E. Advances of Non-Ionic Surfactant Vesicles (Niosomes) and Their Application in Drug Delivery. Pharmaceutics 2019, 11, 55. [Google Scholar] [CrossRef]
- Zhang, W.; Zhao, X.; Yu, G.; Suo, M. Optimization of propofol loaded niosomal gel for transdermal delivery. J. Biomater. Sci. Polym. Ed. 2021, 32, 858–873. [Google Scholar] [CrossRef]
- Gharbavi, M.; Amani, J.; Kheiri-Manjili, H.; Danafar, H.; Sharafi, A. Niosome: A Promising Nanocarrier for Natural Drug Delivery through Blood-Brain Barrier. Adv. Pharmacol. Sci. 2018, 2018, 6847971. [Google Scholar] [CrossRef] [PubMed]
- Pastore, M.N.; Kalia, Y.N.; Horstmann, M.; Roberts, M.S. Transdermal patches: History, development and pharmacology. Br. J. Pharmacol. 2015, 172, 2179–2209. [Google Scholar] [CrossRef] [PubMed]
- Abu-Qatouseh, L.; Abu-Sini, M.; Mayyas, A.M.A.; Darwish, R.; Aburjai, T.; Sabri, I. Molecular characterization and antibiotic susceptibility profiles of Helicobacter pylori isolated from patients with Gastrodeudenal diseases in Jordan. Int. Arab. J. Antimicrob. Agents 2016, 6. [Google Scholar] [CrossRef]
- Aoki, H.; Iwao, Y.; Mizoguchi, M.; Noguchi, S.; Itai, S. Clarithromycin highly-loaded gastro-floating fine granules prepared by high-shear melt granulation can enhance the efficacy of Helicobacter pylori eradication. Eur. J. Pharm. Biopharm. 2015, 92, 22–27. [Google Scholar] [CrossRef] [PubMed]
- Hoban, D.J.; Nauta, J. Clinical And Bacteriological Impact Of Clarithromycin In Streptococcal Pharyngitis: Findings From A Meta-Analysis Of Clinical Trials. Drug Des. Dev. Ther. 2019, 13, 3551–3558. [Google Scholar] [CrossRef] [PubMed]
- Israr, M.; Pugliese, N. Preparation and Characterization of Controlled-Release Floating Bilayer Tablets of Esomeprazole and Clarithromycin. Molecules 2022, 27, 27. [Google Scholar] [CrossRef]
- Mahdi, W.A.; Hussain, A.; Bukhari, S.I.; Alshehri, S.; Singh, B.; Ali, N. Removal of clarithromycin from aqueous solution using water/triton X-100/ ethanol/ olive oil green nanoemulsion method. J. Water Process Eng. 2021, 40, 101973. [Google Scholar] [CrossRef]
- Shilakari Asthana, G.; Sharma, P.K.; Asthana, A. In Vitro and In Vivo Evaluation of Niosomal Formulation for Controlled Delivery of Clarithromycin. Scientifica 2016, 2016, 6492953. [Google Scholar] [CrossRef]
- Rodvold, K.A. Clinical Pharmacokinetics of Clarithromycin. Clin. Pharmacokinet. 1999, 37, 385–398. [Google Scholar] [CrossRef]
- Abu-Khalaf, N.; Zaid, A.N.; Jaradat, N. The Taste of Commercially Available Clarithromycin Oral Pharmaceutical Suspensions in the Palestinian Market: Electronic Tongue and In Vivo Evaluation. Sensors 2018, 18, 454. [Google Scholar] [CrossRef]
- Zhu, C.; Tian, Y.; Zhang, E.; Gao, X.; Zhang, H.; Liu, N.; Han, X.; Sun, Y.; Wang, Z.; Zheng, A. Semisolid Extrusion 3D Printing of Propranolol Hydrochloride Gummy Chewable Tablets: An Innovative Approach to Prepare Personalized Medicine for Pediatrics. AAPS PharmSciTech 2022, 23, 166. [Google Scholar] [CrossRef] [PubMed]
- El-Rachidi, S.; LaRochelle, J.M.; Morgan, J.A. Pharmacists and Pediatric Medication Adherence: Bridging the Gap. Hosp. Pharm. 2017, 52, 124–131. [Google Scholar] [CrossRef] [PubMed]
- Winnick, S.; Lucas, D.O.; Hartman, A.L.; Toll, D. How do you improve compliance? Pediatrics 2005, 115, e718–e724. [Google Scholar] [CrossRef] [PubMed]
- Haque, F.; Sajid, M.; Cameotra, S.S.; Battacharyya, M.S. Anti-biofilm activity of a sophorolipid-amphotericin B niosomal formulation against Candida albicans. Biofouling 2017, 33, 768–779. [Google Scholar] [CrossRef] [PubMed]
- Sadeghi-Ghadi, Z.; Behjou, N.; Ebrahimnejad, P.; Mahkam, M.; Goli, H.R.; Lam, M.; Nokhodchi, A. Improving Antibacterial Efficiency of Curcumin in Magnetic Polymeric Nanocomposites. J. Pharm. Innov. 2022. [Google Scholar] [CrossRef]
- Zaid Alkilani, A.; Hamed, R.; Hussein, G.; Alnadi, S. Nanoemulsion-based patch for the dermal delivery of ascorbic acid. J. Dispers. Sci. Technol. 2022, 43, 1801–1811. [Google Scholar] [CrossRef]
- Prajapati, S.T.; Patel, C.G.; Patel, C.N. Formulation and evaluation of transdermal patch of repaglinide. ISRN Pharm. 2011, 2011, 651909. [Google Scholar] [CrossRef]
- Hamed, R.; Al-Adhami, Y.; Abu-Huwaij, R. Concentration of a microemulsion influences the mechanical properties of ibuprofen in situ microgels. Int. J. Pharm. 2019, 570, 118684. [Google Scholar] [CrossRef]
- Haq, A.; Goodyear, B.; Ameen, D.; Joshi, V.; Michniak-Kohn, B. Strat-M® synthetic membrane: Permeability comparison to human cadaver skin. Int. J. Pharm. 2018, 547, 432–437. [Google Scholar] [CrossRef]
- Zaid Alkilani, A.; Hamed, R.; Al-Marabeh, S.; Kamal, A.; Abu-Huwaij, R.; Hamad, I. Nanoemulsion-based film formulation for transdermal delivery of carvedilol. J. Drug Deliv. Sci. Technol. 2018, 46, 122–128. [Google Scholar] [CrossRef]
- Jonsdottir, F.; Snorradottir, B.S.; Gunnarsson, S.; Georgsdottir, E.; Sigurdsson, S. Transdermal Drug Delivery: Determining Permeation Parameters Using Tape Stripping and Numerical Modeling. Pharmaceutics 2022, 14, 1880. [Google Scholar] [CrossRef] [PubMed]
- Zaid Alkilani, A.; Hamed, R.; Abdo, H.; Swellmeen, L.; Basheer, H.A.; Wahdan, W.; Abu Kwiak, A.D. Formulation and Evaluation of Azithromycin-Loaded Niosomal Gel: Optimization, In Vitro Studies, Rheological Characterization, and Cytotoxicity Study. ACS Omega 2022. [Google Scholar] [CrossRef] [PubMed]
- De Silva, L.; Fu, J.-Y.; Htar, T.T.; Muniyandy, S.; Kasbollah, A.; Kamal, W.H.B.W.; Chuah, L.-H. Characterization, optimization, and in vitro evaluation of Technetium-99m-labeled niosomes. Int. J. Nanomed. 2019, 14, 1101. [Google Scholar] [CrossRef] [PubMed]
- Maurer, V.; Altin, S.; Ag Seleci, D.; Zarinwall, A.; Temel, B.; Vogt, P.M.; Strauß, S.; Stahl, F.; Scheper, T.; Bucan, V.; et al. In-Vitro Application of Magnetic Hybrid Niosomes: Targeted siRNA-Delivery for Enhanced Breast Cancer Therapy. Pharmaceutics 2021, 13, 394. [Google Scholar] [CrossRef]
- Obeid, M.A.; Gany, S.A.S.; Gray, A.I.; Young, L.; Igoli, J.O.; Ferro, V.A. Niosome-encapsulated balanocarpol: Compound isolation, characterisation, and cytotoxicity evaluation against human breast and ovarian cancer cell lines. Nanotechnology 2020, 31, 195101. [Google Scholar] [CrossRef]
- Sezgin-Bayindir, Z.; Yuksel, N. Investigation of formulation variables and excipient interaction on the production of niosomes. AAPS PharmSciTech 2012, 13, 826–835. [Google Scholar] [CrossRef]
- Danaei, M.; Dehghankhold, M.; Ataei, S.; Hasanzadeh Davarani, F.; Javanmard, R.; Dokhani, A.; Khorasani, S.; Mozafari, M.R. Impact of Particle Size and Polydispersity Index on the Clinical Applications of Lipidic Nanocarrier Systems. Pharmaceutics 2018, 10, 57. [Google Scholar] [CrossRef]
- Waqas, M.K.; Sadia, H.; Khan, M.I.; Omer, M.O.; Siddique, M.I.; Qamar, S.; Zaman, M.; Butt, M.H.; Mustafa, M.W.; Rasool, N. Development and characterization of niosomal gel of fusidic acid: In-vitro and ex-vivo approaches. Des. Monomers Polym. 2022, 25, 165–174. [Google Scholar] [CrossRef]
- Bnyan, R.; Khan, I.; Ehtezazi, T.; Saleem, I.; Gordon, S.; O’Neill, F.; Roberts, M. Surfactant Effects on Lipid-Based Vesicles Properties. J. Pharm. Sci. 2018, 107, 1237–1246. [Google Scholar] [CrossRef]
- Salehi, S.; Nourbakhsh, M.S. Co-encapsulation of curcumin and boswellic acids in chitosan-coated niosome: An in-vitro digestion study. J. Microencapsul. 2022, 39, 226–238. [Google Scholar] [CrossRef]
- Shehata, T.M.; Ibrahim, M.M. Curcumin Niosomes Prepared from Proniosomal Gels: In Vitro Skin Permeability, Kinetic and In Vivo Studies. Polymers 2021, 13, 791. [Google Scholar] [CrossRef] [PubMed]
- Miatmoko, A.; Safitri, S.A.; Aquila, F.; Cahyani, D.M.; Hariawan, B.S.; Hendrianto, E.; Hendradi, E.; Sari, R. Characterization and distribution of niosomes containing ursolic acid coated with chitosan layer. Res. Pharm. Sci. 2021, 16, 660–673. [Google Scholar] [CrossRef]
- Joshi, S.; White, R.; Sahu, R.; Dennis, V.A.; Singh, S.R. Comprehensive Screening of Drug Encapsulation and Co-Encapsulation into Niosomes Produced Using a Microfluidic Device. Processes 2020, 8, 535. [Google Scholar] [CrossRef]
- Tabandeh, H.; Mortazavi, S.A. An Investigation into Some Effective Factors on Encapsulation Efficiency of Alpha-Tocopherol in MLVs and the Release Profile from the Corresponding Liposomal Gel. Iran. J. Pharm. Res. IJPR 2013, 12, 21–30. [Google Scholar]
- Bhardwaj, P.; Tripathi, P.; Gupta, R.; Pandey, S. Niosomes: A review on niosomal research in the last decade. J. Drug Deliv. Sci. Technol. 2020, 56, 101581. [Google Scholar] [CrossRef]
- Akbari, J.; Saeedi, M.; Morteza-Semnani, K.; Hashemi, S.M.H.; Babaei, A.; Eghbali, M.; Mohammadi, M.; Rostamkalaei, S.S.; Asare-Addo, K.; Nokhodchi, A. Innovative topical niosomal gel formulation containing diclofenac sodium (niofenac). J. Drug Target. 2022, 30, 108–117. [Google Scholar] [CrossRef] [PubMed]
- El-Far, S.W.; Abo El-Enin, H.A. Targeting Colorectal Cancer Cells with Niosomes Systems Loaded with Two Anticancer Drugs Models; Comparative In Vitro and Anticancer Studies. Pharmaceuticals 2022, 15, 816. [Google Scholar] [CrossRef] [PubMed]
- Bashash, M.; Varidi, M.; Varshosaz, J. Sucrose stearate based niosomes as an alternative to ordinary vehicles for efficient curcumin delivery. J. Food Meas. Charact. 2022, 16, 2104–2118. [Google Scholar] [CrossRef]
- Sabry, S.; El hakim Ramadan, A.; Abd elghany, M.; Okda, T.; Hasan, A. Formulation, characterization, and evaluation of the anti-tumor activity of nanosized galangin loaded niosomes on chemically induced hepatocellular carcinoma in rats. J. Drug Deliv. Sci. Technol. 2021, 61, 102163. [Google Scholar] [CrossRef]
- Zaki, R.M.; Alfadhel, M.M.; Alshahrani, S.M. Formulation of Chitosan-Coated Brigatinib Nanospanlastics: Optimization, Characterization, Stability Assessment and In-Vitro Cytotoxicity Activity against H-1975 Cell Lines. Pharmaceuticals 2022, 15, 348. [Google Scholar] [CrossRef]
- Chen, S.; Hanning, S.; Falconer, J.; Locke, M.; Wen, J. Recent advances in non-ionic surfactant vesicles (niosomes): Fabrication, characterization, pharmaceutical and cosmetic applications. Eur. J. Pharm. Biopharm. 2019, 144, 18–39. [Google Scholar] [CrossRef] [PubMed]
- Hnin, H.M.; Stefánsson, E.; Loftsson, T. Physicochemical and Stability Evaluation of Topical Niosomal Encapsulating Fosinopril/γ-Cyclodextrin Complex for Ocular Delivery. Pharmaceutics 2022, 14, 1147. [Google Scholar] [CrossRef] [PubMed]
- Briuglia, M.L.; Rotella, C.; McFarlane, A.; Lamprou, D.A. Influence of cholesterol on liposome stability and on in vitro drug release. Drug Deliv. Transl. Res. 2015, 5, 231–242. [Google Scholar] [CrossRef] [PubMed]
- Mansouri, M.; Khayam, N.; Jamshidifar, E.; Pourseif, T.; Kianian, S.; Mirzaie, A.; Akbarzadeh, I.; Ren, Q. Streptomycin Sulfate-Loaded Niosomes Enables Increased Antimicrobial and Anti-Biofilm Activities. Front. Bioeng. Biotechnol. 2021, 9, 745099. [Google Scholar] [CrossRef]
- Sailaja, A.K.; Shreya, M. Preparation and characterization of naproxen loaded niosomes by ether injection method. Nano Biomed. Eng. 2018, 10, 174–180. [Google Scholar] [CrossRef]
- Naderinezhad, S.; Amoabediny, G.; Haghiralsadat, F. Co-delivery of hydrophilic and hydrophobic anticancer drugs using biocompatible pH-sensitive lipid-based nano-carriers for multidrug-resistant cancers. RSC Adv. 2017, 7, 30008–30019. [Google Scholar] [CrossRef]
- Abouelmagd, S.A.; Sun, B.; Chang, A.C.; Ku, Y.J.; Yeo, Y. Release kinetics study of poorly water-soluble drugs from nanoparticles: Are we doing it right? Mol. Pharm. 2015, 12, 997–1003. [Google Scholar] [CrossRef]
- Mazyed, E.A.; Badria, F.A.; ElNaggar, M.H.; El-Masry, S.M.; Helmy, S.A. Development of Cyclodextrin-Functionalized Transethoniosomes of 6-Gingerol: Statistical Optimization, In Vitro Characterization and Assessment of Cytotoxic and Anti-Inflammatory Effects. Pharmaceutics 2022, 14, 1170. [Google Scholar] [CrossRef]
- Milanowski, B.; Wosicka-Frąckowiak, H.; Główka, E. Optimization and Evaluation of the In Vitro Permeation Parameters of Topical Products with Non-Steroidal Anti-Inflammatory Drugs through Strat-M(®) Membrane. Pharmaceutics 2021, 13, 1305. [Google Scholar] [CrossRef]
- Innes, E.; Yiu, H.H.P.; McLean, P.; Brown, W.; Boyles, M. Simulated biological fluids—A systematic review of their biological relevance and use in relation to inhalation toxicology of particles and fibres. Crit. Rev. Toxicol. 2021, 51, 217–248. [Google Scholar] [CrossRef]
- Michnik, A.; Kiełboń, A.; Duch, K.; Sadowska-Krępa, E.; Pokora, I. Comparison of human blood serum DSC profiles in aqueous and PBS buffer solutions. J. Therm. Anal. Calorim. 2022, 147, 6739–6743. [Google Scholar] [CrossRef]
- Akbarzadeh, I.; Keramati, M.; Azadi, A.; Afzali, E.; Shahbazi, R.; Chiani, M.; Norouzian, D.; Bakhshandeh, H. Optimization, physicochemical characterization, and antimicrobial activity of a novel simvastatin nano-niosomal gel against E. coli and S. aureus. Chem. Phys. Lipids 2021, 234, 105019. [Google Scholar] [CrossRef]
- Witika, B.A.; Bassey, K.E.; Demana, P.H.; Siwe-Noundou, X.; Poka, M.S. Current Advances in Specialised Niosomal Drug Delivery: Manufacture, Characterization and Drug Delivery Applications. Int. J. Mol. Sci. 2022, 23, 9668. [Google Scholar] [CrossRef] [PubMed]
- Yaghoobian, M.; Haeri, A.; Bolourchian, N. The Impact of Surfactant Composition and Surface Charge of Niosomes on the Oral Absorption of Repaglinide as a BCS II Model Drug. Int. J. Nanomed. 2020, 15, 8767–8781. [Google Scholar] [CrossRef]
- Taymouri, S.; Varshosaz, J. Effect of different types of surfactants on the physical properties and stability of carvedilol nano-niosomes. Adv. Biomed. Res. 2016, 5, 48. [Google Scholar] [CrossRef] [PubMed]
- Wojcik-Pastuszka, D.; Krzak, J. Evaluation of the Release Kinetics of a Pharmacologically Active Substance from Model Intra-Articular Implants Replacing the Cruciate Ligaments of the Knee. Materials 2019, 12, 1202. [Google Scholar] [CrossRef]
- Kulkarni, P.; Rawtani, D.; Rajpurohit, S.; Vasvani, S.; Barot, T. Self-assembly based aerosolized hyaluronic acid (HA) loaded niosomes for lung delivery: An in-vitro and in-vivo evaluation. J. Drug Deliv. Sci. Technol. 2022, 75, 103627. [Google Scholar] [CrossRef]
- Saafan, H.A.; Ibrahim, K.M.; Thabet, Y.; Elbeltagy, S.M.; Eissa, R.A.; Ghaleb, A.H.; Ibrahim, F.; Elsabahy, M. Intratracheal Administration of Chloroquine-Loaded Niosomes Minimize Systemic Drug Exposure. Pharmaceutics 2021, 13, 957. [Google Scholar] [CrossRef]
- Yuliana, B.; Sartini; Djide, N.; Djabir, Y.Y. Wound healing effect of snakehead fish (Channa striata) mucus containing transdermal patch. J. Appl. Pharm. Sci. 2022, 12, 171–183. [Google Scholar] [CrossRef]
- Latif, M.S.; Al-Harbi, F.F.; Nawaz, A. Formulation and Evaluation of Hydrophilic Polymer Based Methotrexate Patches: In Vitro and In Vivo Characterization. Polymers 2022, 14, 1310. [Google Scholar] [CrossRef]
- Abu-Huwaij, R.; Abbas, M.M.; Al-Shalabi, R.; Almasri, F.N. Synthesis of transdermal patches loaded with greenly synthesized zinc oxide nanoparticles and their cytotoxic activity against triple negative breast cancer. Appl. Nanosci. 2022, 12, 69–78. [Google Scholar] [CrossRef]
- El Nashar, N.F.; Donia, A.A.; Mady, O.Y.; El Maghraby, G.M. Formulation of clarithromycin floating microspheres for eradication of Helicobacter pylori. J. Drug Deliv. Sci. Technol. 2017, 41, 213–221. [Google Scholar] [CrossRef]
- Afreen, U.; Fahelelbom, K.M.; Shah, S.N.H.; Ashames, A.; Almas, U.; Khan, S.A.; Yameen, M.A.; Nisar, N.; Bin Asad, M.H.H.; Murtaza, G. Formulation and evaluation of niosomes-based chlorpheniramine gel for the treatment of mild to moderate skin allergy. J. Exp. Nanosci. 2022, 17, 467–495. [Google Scholar] [CrossRef]
- Kumar, G.P.; Rajeshwarrao, P. Nonionic surfactant vesicular systems for effective drug delivery—An overview. Acta Pharm. Sin. B 2011, 1, 208–219. [Google Scholar] [CrossRef]
- Dilaver, M.; Yurdakoc, K. Fumaric acid cross-linked carboxymethylcellulose/poly(vinyl alcohol) hydrogels. Polym. Bull. 2016, 73, 2661–2675. [Google Scholar] [CrossRef]
- Abu-Rumman, A.; Abu-Huwaij, R.; Hamed, R. Development and in vitro appraisal of Soluplus® and/or Carbopol® 971 buccoadhesive patches releasing atorvastatin. J. Adhes. 2022, 98, 915–933. [Google Scholar] [CrossRef]
- Shirsand, S.B.; Kumar, G.R.; Keshavshetti, G.G.; Bushetti, S.S.; Swamy, P.V. Formulation and evaluation of clotrimazole niosomal gel for topical application. RGUHS J. Pharm. Sci. 2015, 5, 32–38. [Google Scholar] [CrossRef]
- El-Ridy, M.S.; Yehia, S.A.; Mohsen, A.M.; El-Awdan, S.A.; Darwish, A.B. Formulation of Niosomal Gel for Enhanced Transdermal Lornoxicam Delivery: In-Vitro and In-Vivo Evaluation. Curr. Drug Deliv. 2018, 15, 122–133. [Google Scholar] [CrossRef]
- Nigro, F.; Cerqueira Pinto, C.d.S.; dos Santos, E.P.; Mansur, C.R.E. Niosome-based hydrogel as a potential drug delivery system for topical and transdermal applications. Int. J. Polym. Mater. Polym. Biomater. 2022, 71, 444–461. [Google Scholar] [CrossRef]
- Fahmy, S.A.; Ramzy, A.; Sawy, A.M.; Nabil, M.; Gad, M.Z. Ozonated Olive Oil: Enhanced Cutaneous Delivery via Niosomal Nanovesicles for Melanoma Treatment. Antioxidants 2022, 11, 1318. [Google Scholar] [CrossRef]
- Hashemi, S.M.H.; Enayatifard, R.; Akbari, J.; Saeedi, M.; Seyedabadi, M.; Morteza-Semnani, K.; Babaei, A.; Asare-Addo, K.; Nokhodchi, A. Venlafaxine HCl Encapsulated in Niosome: Green and Eco-friendly Formulation for the Management of Pain. AAPS PharmSciTech 2022, 23, 149. [Google Scholar] [CrossRef]
- Hamed, R.; Abu Kwiak, A.D. Microemulsions as Lipid Nanosystems Loaded into Thermoresponsive In Situ Microgels for Local Ocular Delivery of Prednisolone. Pharmaceutics 2022, 14, 1975. [Google Scholar] [CrossRef] [PubMed]
- Hamed, R.; Basil, M.; AlBaraghthi, T.; Sunoqrot, S.; Tarawneh, O. Nanoemulsion-based gel formulation of diclofenac diethylamine: Design, optimization, rheological behavior and in vitro diffusion studies. Pharm. Dev. Technol. 2016, 21, 980–989. [Google Scholar] [CrossRef] [PubMed]
- Jacob, S.; Nair, A.B.; Al-Dhubiab, B.E. Preparation and evaluation of niosome gel containing acyclovir for enhanced dermal deposition. J. Liposome Res. 2017, 27, 283–292. [Google Scholar] [CrossRef] [PubMed]
- Shilakari Asthana, G.; Asthana, A.; Singh, D.; Sharma, P.K. Etodolac Containing Topical Niosomal Gel: Formulation Development and Evaluation. J. Drug Deliv. 2016, 2016, 9324567. [Google Scholar] [CrossRef] [PubMed]
- Negi, P.; Aggarwal, M.; Sharma, G.; Rathore, C.; Sharma, G.; Singh, B.; Katare, O.P. Niosome-based hydrogel of resveratrol for topical applications: An effective therapy for pain related disorder(s). Biomed. Pharmacother. 2017, 88, 480–487. [Google Scholar] [CrossRef]
- Arafa, M.G.; Ayoub, B.M. DOE Optimization of Nano-based Carrier of Pregabalin as Hydrogel: New Therapeutic &Chemometric Approaches for Controlled Drug Delivery Systems. Sci. Rep. 2017, 7, 41503. [Google Scholar] [CrossRef]
- Pfab, C.; Schnobrich, L. Repurposing of Antimicrobial Agents for Cancer Therapy: What Do We Know? Cancers 2021, 13, 3193. [Google Scholar] [CrossRef]


| Formulation Code | Span 60 | Span 40 | Span 80 | Tween 80 | DCP | Cholesterol | CLR | HLB |
|---|---|---|---|---|---|---|---|---|
| (mg) | (mg) | (mg) | (mg) | (mg) | (mg) | (mg) | Value | |
| F1 | 50 | - | - | 50 | - | 100 | 100 | 9.85 |
| F2 | - | 100 | - | - | 5 | 100 | 200 | 6.7 |
| F3 | 100 | - | - | - | 5 | 100 | 200 | 4.7 |
| F4 | 100 | - | - | - | - | 100 | 100 | 4.7 |
| F5 | - | - | 100 | - | 5 | 100 | 200 | 4.3 |
| F6 | - | - | - | 100 | - | 100 | 100 | 15 |
| F7 | 200 | - | - | - | - | 100 | 200 | 6.7 |
| F8 | 200 | - | - | - | - | 100 | 100 | 6.7 |
| F9 | - | - | - | 100 | - | 50 | 100 | 15 |
| Code | HPMC | Na-CMC | PEG-400 | CLR-Niosomal Dispersion |
|---|---|---|---|---|
| w/w (%) | w/w (%) | w/w (%) | w/w (%) | |
| P1 | 60% | - | 20% | 20% |
| P2 | - | 60% | 20% | 20% |
| P3 | 45% | 35% | 15% | 5% |
| P4 | 40% | 30% | 15% | 15% |
| Media | Solubility (mg/mL) |
|---|---|
| PBS | 0.12 ± 0.01 |
| PBS containing 20% isopropanol | 0.37 ± 0.17 |
| Code | PS (nm) | PDI | ZP (mV) | % EE |
|---|---|---|---|---|
| F1 | 143.30 ± 24.90 | 0.15 ± 0.08 | −40.86 ± 1.50 | 86.00 ± 2.00 |
| F2 | 300.00 ± 5.60 | 0.34 ± 0.00 | −50.10 ± 0.42 | 15.00 ± 2.00 |
| F3 | 400.00 ± 3.60 | 0.36 ± 0.00 | −51.82 ± 0.22 | 20.00 ± 4.00 |
| F4 | 169.20 ± 11.90 | 0.18 ± 0.04 | −53.83 ± 0.53 | 52.00 ± 2.00 |
| F5 | 425.70 ± 10.80 | 0.34 ± 0.00 | −51.04 ± 0.17 | 13.00 ± 1.00 |
| F6 | 109.00 ± 11.20 | 0.27 ± 0.04 | −21.59 ± 2.01 | 82.00 ± 7.00 |
| F7 | 437.00 ± 72.30 | 0.04 ± 0.04 | −28.42 ± 1.91 | 12.00 ± 1.00 |
| F8 | 552.10 ± 17.50 | 0.00 ± 0.00 | −59.08 ± 2.15 | 50.00 ± 1.00 |
| F9 | 295.20 ± 71.40 | 0.00 ± 0.00 | −36.22 ± 1.77 | 79.00 ± 10.00 |
| Zones of Inhibition (mm) | |||
|---|---|---|---|
| Bacterial Strain | Well (1) | Well (2) | Well (3) |
| Staphylococcus aureus | 2.4 | 3.2 | 3.2 |
| Escherichia coli | 1.3 | 1.9 | 2.0 |
| CLR–NP | Thickness (mm) | Weight Uniformity (mg) | Moisture Content (%) | Drug Content (%) | pH |
|---|---|---|---|---|---|
| P3 | 0.42 ± 0.02 | 415.40 ± 0.60 | 16.82 ± 0.11 | 96.58 ± 5.38 | 4.84 ± 0.01 |
| P4 | 0.41 ± 0.01 | 421.60 ± 0.70 | 9.89 ± 0.10 | 97.57 ± 5.43 | 4.74 ± 0.01 |
| Formulations | Jss (µg/cm²/h) | p × 10−3 (cm/h) |
|---|---|---|
| Niosomal patch (P4) | 380.2 ± 2.3 | 102.1 ± 0.6 |
| Conventional patch (control) | 1.7 ± 0.0 | 0.5 ± 0.0 |
Disclaimer/Publisher’s Note: The statements, opinions and data contained in all publications are solely those of the individual author(s) and contributor(s) and not of MDPI and/or the editor(s). MDPI and/or the editor(s) disclaim responsibility for any injury to people or property resulting from any ideas, methods, instructions or products referred to in the content. |
© 2023 by the authors. Licensee MDPI, Basel, Switzerland. This article is an open access article distributed under the terms and conditions of the Creative Commons Attribution (CC BY) license (https://creativecommons.org/licenses/by/4.0/).
Share and Cite
Zaid Alkilani, A.; Musleh, B.; Hamed, R.; Swellmeen, L.; Basheer, H.A. Preparation and Characterization of Patch Loaded with Clarithromycin Nanovesicles for Transdermal Drug Delivery. J. Funct. Biomater. 2023, 14, 57. https://doi.org/10.3390/jfb14020057
Zaid Alkilani A, Musleh B, Hamed R, Swellmeen L, Basheer HA. Preparation and Characterization of Patch Loaded with Clarithromycin Nanovesicles for Transdermal Drug Delivery. Journal of Functional Biomaterials. 2023; 14(2):57. https://doi.org/10.3390/jfb14020057
Chicago/Turabian StyleZaid Alkilani, Ahlam, Batool Musleh, Rania Hamed, Lubna Swellmeen, and Haneen A. Basheer. 2023. "Preparation and Characterization of Patch Loaded with Clarithromycin Nanovesicles for Transdermal Drug Delivery" Journal of Functional Biomaterials 14, no. 2: 57. https://doi.org/10.3390/jfb14020057
APA StyleZaid Alkilani, A., Musleh, B., Hamed, R., Swellmeen, L., & Basheer, H. A. (2023). Preparation and Characterization of Patch Loaded with Clarithromycin Nanovesicles for Transdermal Drug Delivery. Journal of Functional Biomaterials, 14(2), 57. https://doi.org/10.3390/jfb14020057