Emotional Intelligence and Emotional Hypersensitivity in Gifted Individuals


Abstract
1. Introduction
1.1. Relationship between Emotional Intelligence and IQ
1.2. Recent Theorizations about EI and Intelligence
1.3. The Current Research
2. Method
2.1. Participants and Procedure
2.2. Measures
2.2.1. The Situational Test of Emotional Understanding-Brief (STEU-SF, MacCann and Roberts 2008) and The Situational Test of Emotional Understanding-Brief (STEU-B, Allen et al. 2014)
2.2.2. The Situational Test of Emotional Management-Brief (STEM-SF, MacCann and Roberts 2008) and the Situational Test of Emotional Management-Brief (STEM-B, Allen et al. 2015)
2.2.3. The Geneva Emotion Recognition Test Short Version (GERT-S, Schlegel and Scherer 2016)
2.2.4. Trait Emotional Intelligence Questionnaire Short Form (TEIQue-SF, Version 1.50, Cooper and Petrides 2010)
2.2.5. The Affect Intensity Measure Short Form (AIM-SF, Larsen 1984)
2.2.6. Positive and Negative Affect Schedule (PANAS-SF, Watson et al. 1988)
2.2.7. The Perth Emotional Reactivity Scale Short Form (PERS-SF, Preece et al. 2019)
2.2.8. The Highly Sensitive Person Scale (HSP-12, Pluess et al. 2020)
2.2.9. The Perceived Stress Scale (PSS-10, Cohen and Williamson 1988)
2.2.10. The Satisfaction with Life Scale (SWLS, Diener et al. 1985)
2.2.11. The Interpersonal Relationships Facet of Ryff Scale (Ryff 1989)
2.2.12. Presence of Neurological or Psychological Disorders
2.2.13. Brief Mood Introspection Scale (BMIS, Mayer and Gaschke 1988)
2.3. Dot-Probe (DP) Task
2.3.1. Material
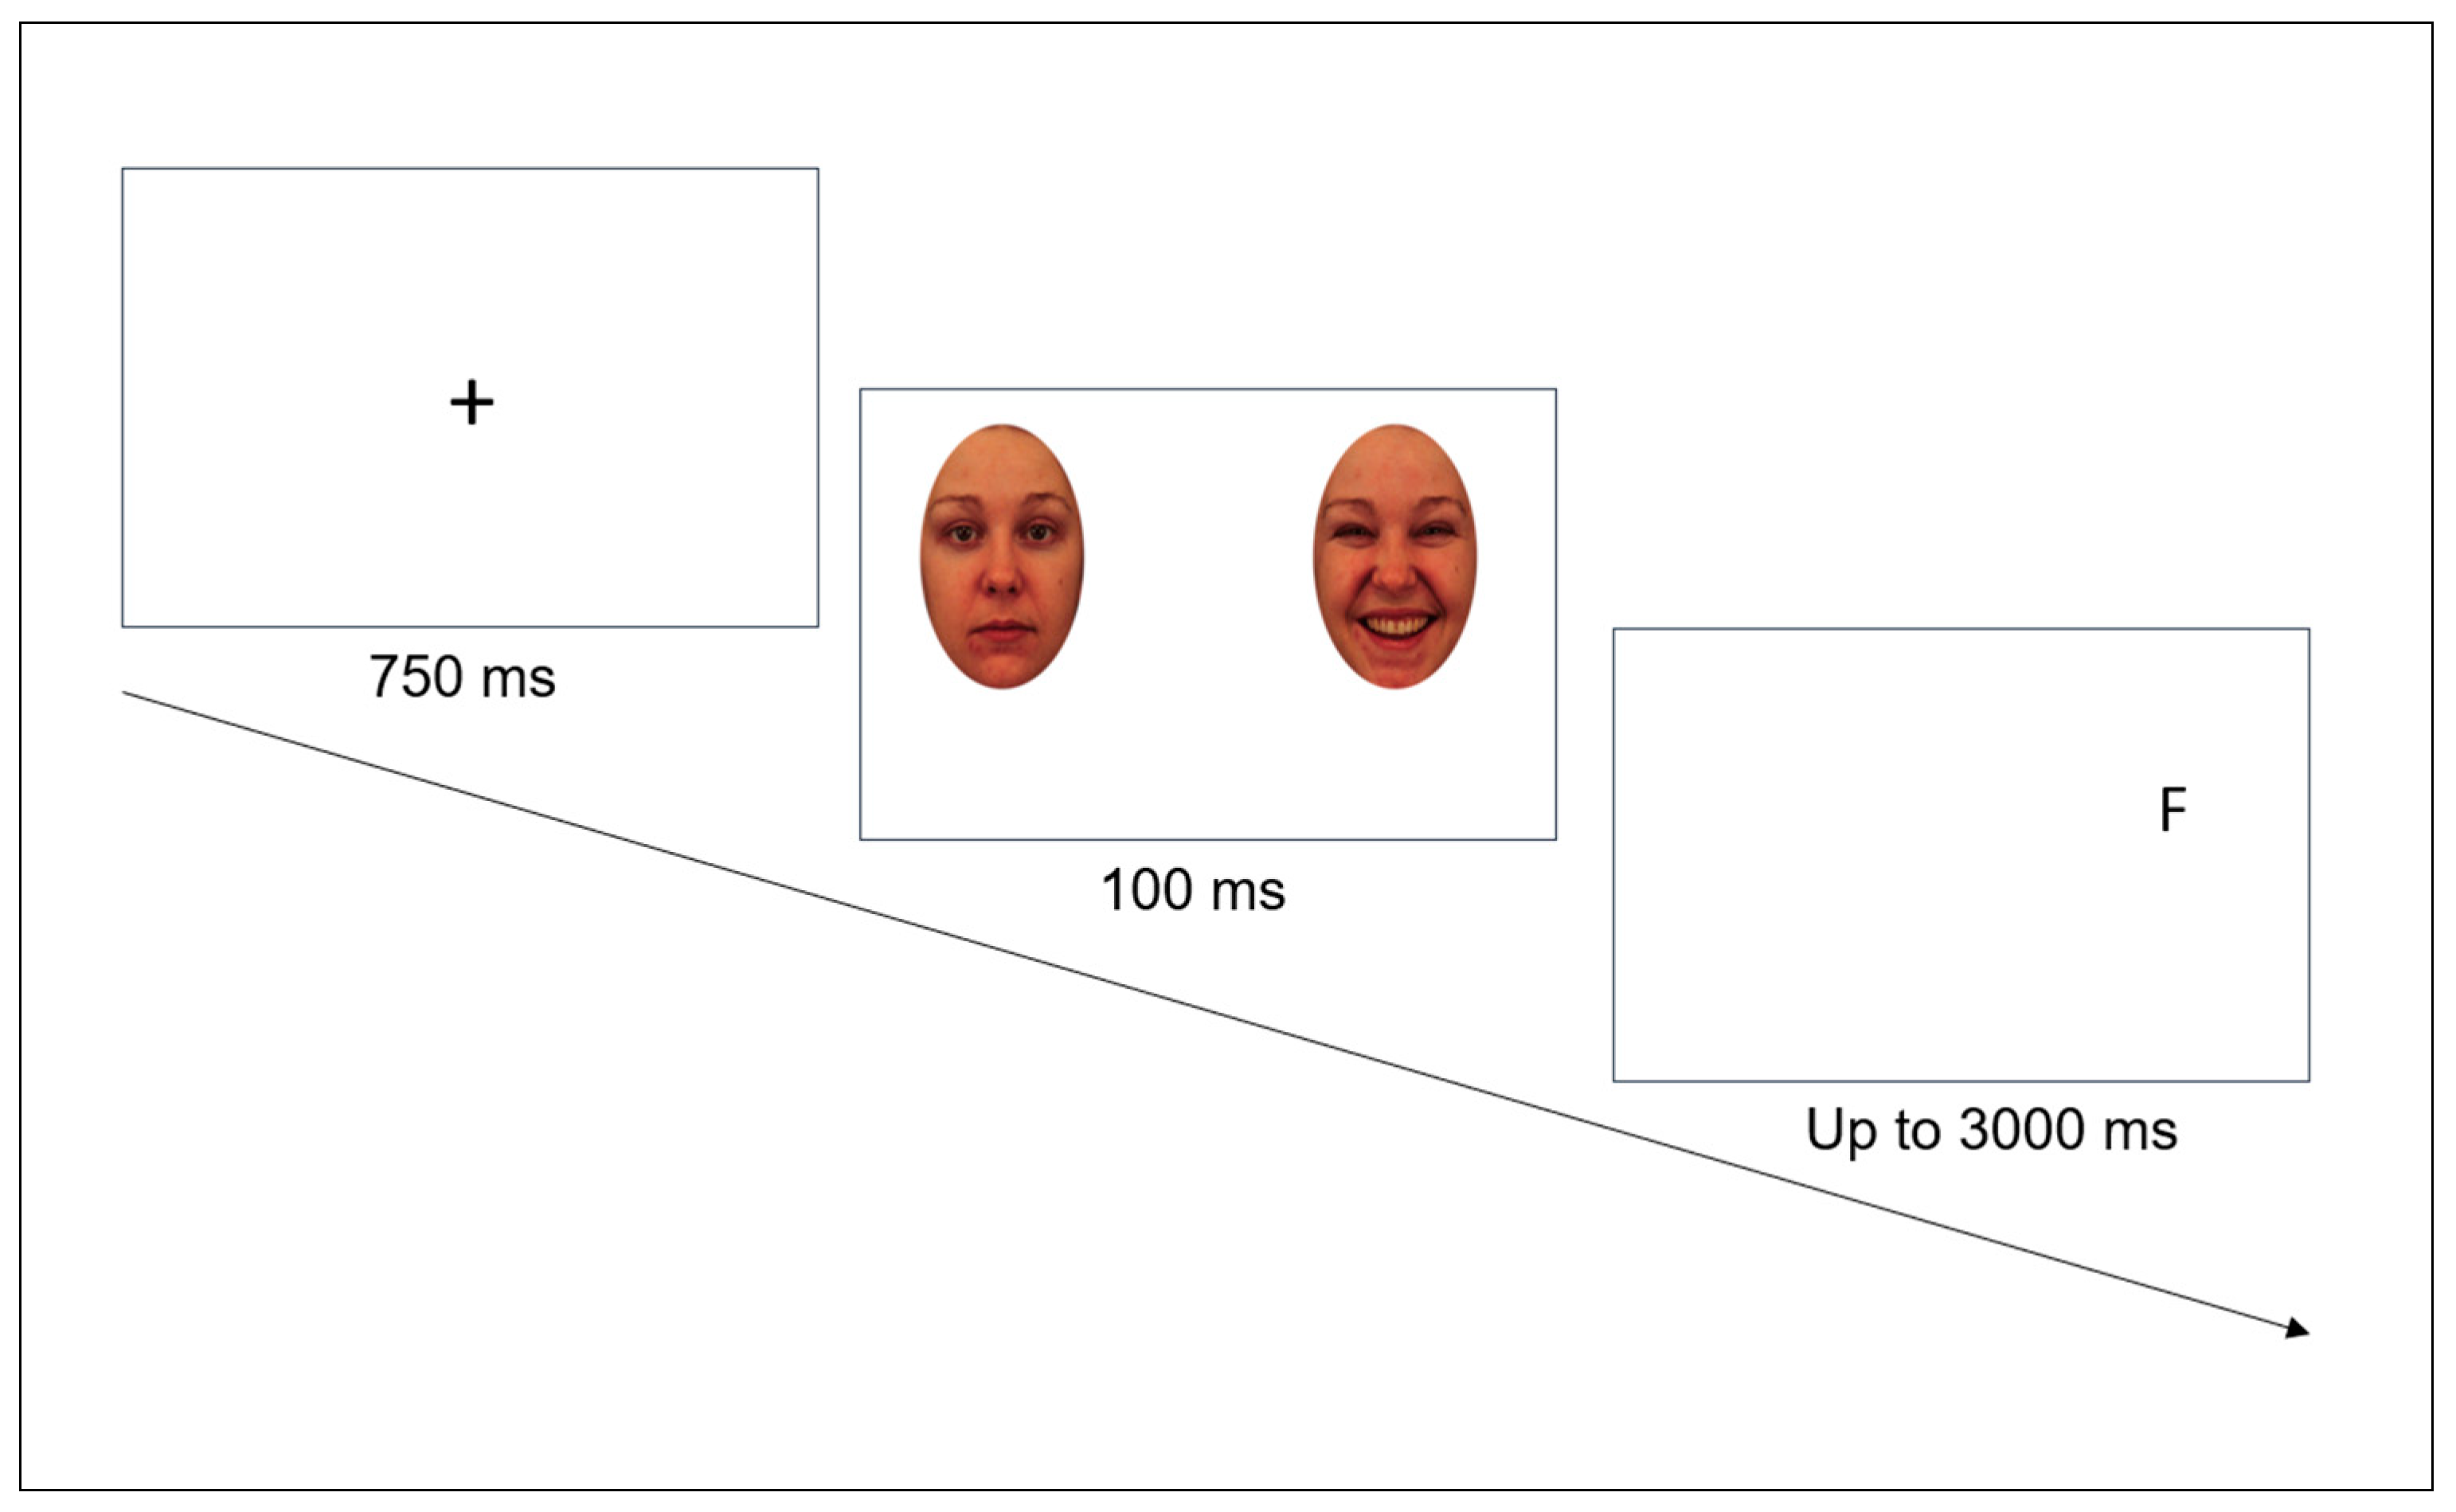
2.3.2. Procedure
3. Results
3.1. Descriptive Statistics and Correlations between Variables
3.2. Analysis of Reaction Times in the DP Task
3.2.1. Data Preprocessing and Analysis
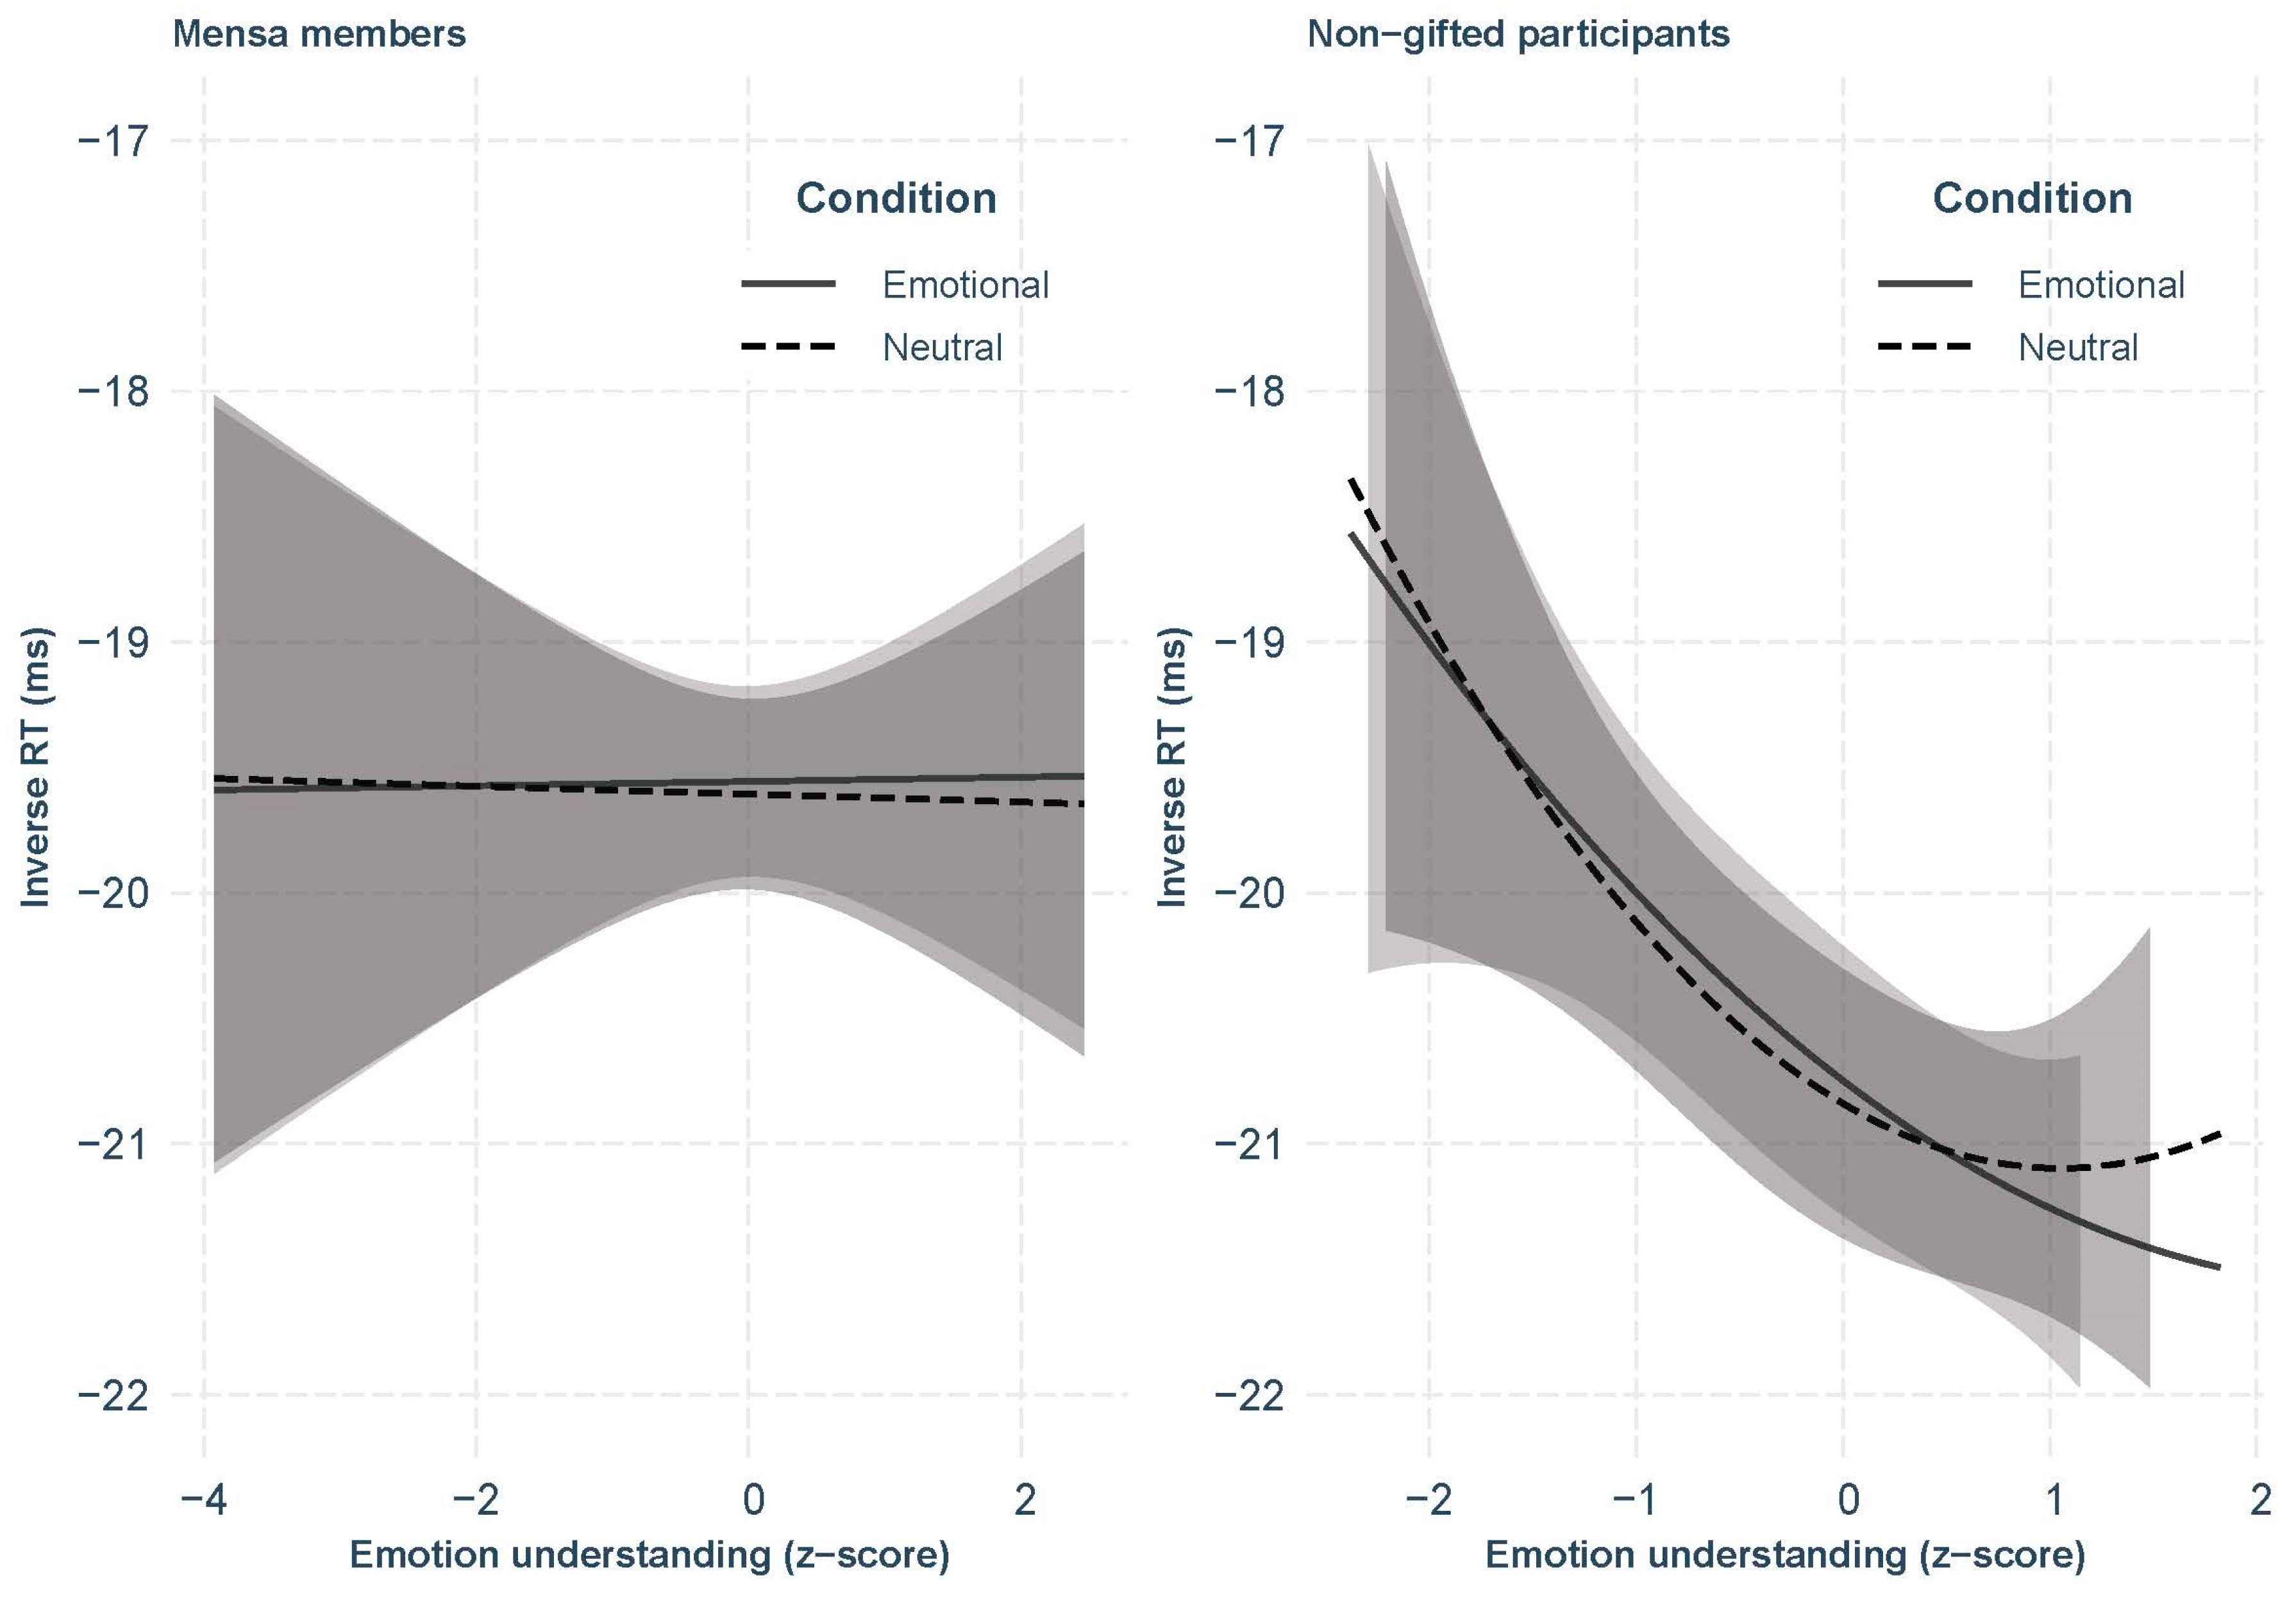
3.2.2. Replication of Nicolet-dit-Félix et al. (2023) Results Regarding the Role of Emotion Understanding
3.2.3. Exploratory Analyses on the Mensa Sample
3.2.4. Other Ability EI Facets, Trait EI, and Self-Reported Reactivity to Emotion
4. Discussion
Strengths and Limitations
5. Conclusions
Author Contributions
Funding
Institutional Review Board Statement
Informed Consent Statement
Data Availability Statement
Conflicts of Interest
| 1 | The 2% threshold corresponds to a score of 131 for the Wechsler tests (WISC and WAIS), 132 for the Stanford-Binet test, or 150 for the Cattell test. |
| 2 | One individual, who scored very low on STEU and STEM measures, was removed from the analysis. |
| 3 | Gender was not a significant predictor in Nicolet-dit-Félix et al. (2023) but was still included in this analysis since it is known to be related to reaction times. Three participants who indicated “other” for this variable were removed from the analysis. Fluid intelligence was not included as we did not ask the Mensa sample to complete Raven’s matrices. |
References
- Allen, Veleka D., Alexander Weissman, Susan Hellwig, Carolyn MacCann, and Richard D. Roberts. 2014. Development of the Situational Test of Emotional Understanding–Brief (STEU-B) using item response theory. Personality and Individual Differences 65: 3–7. [Google Scholar] [CrossRef]
- Allen, Veleka, Nazia Rahman, Alexander Weissman, Carolyn MacCann, Charles Lewis, and Richard D. Roberts. 2015. The Situational Test of Emotional Management–Brief (STEM-B): Development and validation using item response theory and latent class analysis. Personality and Individual Differences 81: 195–200. [Google Scholar] [CrossRef]
- Angela, Fabio Rosa, and Buzzai Caterina. 2022. Creativity, Emotional Intelligence and Coping Style in Intellectually Gifted Adults. Current Psychology 41: 1191–97. [Google Scholar] [CrossRef]
- Anwyl-Irvine, Alexander L., Jessica Massonnié, Adam Flitton, Natasha Kirkham, and Jo K. Evershed. 2020. Gorilla in Our Midst: An Online Behavioral Experiment Builder. Behavior Research Methods 52: 388–407. [Google Scholar] [CrossRef]
- Anwyl-Irvine, Alexander, Edwin S. Dalmaijer, Nick Hodges, and Jo K. Evershed. 2021. Realistic precision and accuracy of online experiment platforms, web browsers, and devices. Behavior Research Methods 53: 1407–25. [Google Scholar] [CrossRef] [PubMed]
- Aron, Elaine N., and Arthur Aron. 1997. Sensory-processing sensitivity and its relation to introversion and emotionality. Journal of Personality and Social Psychology 73: 345–68. [Google Scholar] [CrossRef]
- Baayen, R. Harald, Douglas J. Davidson, and Douglas M. Bates. 2008. Mixed-effects modeling with crossed random effects for subjects and items. Journal of Memory and Language 59: 390–412. [Google Scholar] [CrossRef]
- Barratt, Daniel, and Claus Bundesen. 2012. Attentional capture by emotional faces is contingent on attentional control settings. Cognition & Emotion 26: 1223–37. [Google Scholar] [CrossRef]
- Bates, Douglas, Reinhold Kliegl, Shravan Vasishth, and Harald Baayen. 2018. Parsimonious mixed models. arXiv arXiv:1506.04967. [Google Scholar]
- Baudson, Tanja Gabriele. 2016. The mad genius stereotype: Still alive and well. Frontiers in Psychology 7: 368. [Google Scholar] [CrossRef]
- Baudson, Tanja Gabriele, and Franzis Preckel. 2013. Teachers’ implicit personality theories about the gifted: An experimental approach. School Psychology Quarterly 28: 37–46. [Google Scholar] [CrossRef] [PubMed]
- Becker, George. 1978. The Mad Genius Debate. Beverly Hills: Sage. [Google Scholar]
- Bergold, Sebastian, Matthias R. Hastall, and Ricarda Steinmayr. 2021. Do mass media shape stereotypes about intellectually gifted individuals? Two experiments on stigmatization effects from biased newspaper reports. Gifted Child Quarterly 65: 75–94. [Google Scholar] [CrossRef]
- Box, George, and David R. Cox. 1964. An analysis of transformations. Journal of the Royal Statistical Society: Series B (Methodological) 26: 211–43. [Google Scholar] [CrossRef]
- Brasseur, Sophie. 2021. Fonctionnement social et émotionnel [Social and emotional functionning]. In Psychologie du haut potential [Psychology of High Potential]. Edited by Nathalie Clobert and Nicolas Gauvrit. Louvain-la-Neuve: De Boeck Supérieur, pp. 175–98. [Google Scholar]
- Bryan, Victoria M., and John D. Mayer. 2020. A meta-analysis of the correlations among broad intelligences: Understanding their relations. Intelligence 81: 101469. [Google Scholar] [CrossRef]
- Castro-Johnson, Malaika, and Alvin Wang. 2003. Emotional intelligence and academic performance of college honors and non-honors freshmen. Journal of the National Collegiate Honors Council—Online Archive 125: 105–14. Available online: https://digitalcommons.unl.edu/nchcjournal/125 (accessed on 1 August 2022).
- Cohen, Sheldon, and Gail M. Williamson. 1988. Perceived stress in a probability sample of the United States. In The Social Psychology of Health. Edited by Shirlynn Spacapan and Stuart Oskam. Newbury Park: Sage, pp. 31–67. [Google Scholar]
- Cooper, Andrew, and Konstantinos Vassilis Petrides. 2010. A psychometric analysis of the Trait Emotional Intelligence Questionnaire–Short Form (TEIQue–SF) using item response theory. Journal of Personality Assessment 92: 449–57. [Google Scholar] [CrossRef]
- Czeschlik, Tatiana, and Detlef H. Rost. 1995. Sociometric types and children’s intelligence. British Journal of Developmental Psychology 13: 177–89. [Google Scholar] [CrossRef]
- Dabrowski, Kazimierz. 1964. Positive Disintegration. Little: Brown. [Google Scholar]
- Deary, Ian J., P. Joseph Bell, Andrew J. Bell, Mary L. Campbell, and Nicola D. Fazal. 2004. Sensory discrimination and intelligence: Testing Spearman’s other hypothesis. The American Journal of Psychology 117: 1–18. [Google Scholar] [CrossRef]
- Diener, Ed, Robert A. Emmons, Randy J. Larsen, and Sharon Griffin. 1985. The satisfaction with life scale. Journal of Personality Assessment 49: 71–75. [Google Scholar] [CrossRef]
- Dijkstra, Pieternel, Dick P. H. Barelds, Sieuwke Ronner, and Arnolda P. Nauta. 2012. Personality and well-being: Do the intellectually gifted differ from the general population? Advanced Development 13: 103–18. [Google Scholar]
- Egeland, Jens. 2019. Emotion perception in members of Norwegian Mensa. Frontiers in Psychology 10: 27. [Google Scholar] [CrossRef] [PubMed]
- Fayyad, John, Nancy A. Sampson, Irving Hwang, Tomasz Adamowski, Sergio Aguilar-Gaxiola, Ali Al-Hamzawi, Laura H. Andrade, Guilherme Borges, Giovanni de Girolamo, Silvia Florescu, and et al. 2017. The descriptive epidemiology of DSM-IV Adult ADHD in the World Health Organization World Mental Health Surveys. Attention Deficit and Hyperactivity Disorders 9: 47–65. [Google Scholar] [CrossRef] [PubMed]
- Fiori, Marina, and Ashley-Vesely Maillefer. 2018. Emotional intelligence as an ability: Theory, challenges, and new Directions. In Emotional Intelligence in Education Integrating Research with Practice. Edited by Kateryna V. Keefer, James D. A. Parker and Donald H. Saklofske. Berlin: Springer, pp. 23–47. [Google Scholar] [CrossRef]
- Fiori, Marina, Shagini Udayar, and Ashley Vesely Maillefer. 2022. Emotion information processing as a new component of emotional intelligence: Theoretical framework and empirical evidence. European Journal of Personality 36: 245–64. [Google Scholar] [CrossRef]
- Gaspelin, Nicholas, and Steven J. Luck. 2019. Inhibition as a potential resolution to the attentional capture debate. Current Opinion in Psychology 29: 12–18. [Google Scholar] [CrossRef] [PubMed]
- Glickman, Moshe, and Dominique Lamy. 2018. Attentional capture by irrelevant emotional distractor faces is contingent on implicit attentional settings. Cognition and Emotion 32: 303–14. [Google Scholar] [CrossRef]
- Goeleven, Ellen, Rudi De Raedt, Lemke Leyman, and Bruno Verschuere. 2008. The Karolinska Directed Emotional Faces: A Validation Study. Cognition & Emotion 22: 1094–1118. [Google Scholar] [CrossRef]
- Larsen, Randy J. 1984. Theory and Measurement of Affect Intensity as an Individual Difference Characteristic. Unpublished doctoral dissertation, University of Illinois Urbana-Champaign, Urbana, IL, USA. [Google Scholar]
- Libbrecht, Nele, and Filip Lievens. 2012. Validity evidence for the situational judgment test paradigm in emotional intelligence measurement. International Journal of Psychology 47: 438–47. [Google Scholar] [CrossRef]
- Lundqvist, Daniel, Anders Flykt, and Arne Öhman. 1998. Karolinska Directed Emotional Faces (KDEF). Database Record. Washington: APA PsycTests. [Google Scholar] [CrossRef]
- Lupu, Valentin. 2012. Emotional intelligence in gifted and non-gifted high school students. Buletin Stiintific 17: 128–32. [Google Scholar]
- MacCann, Carolyn, and Richard D. Roberts. 2008. The Brief Assessment of Emotional Intelligence: Short Forms of the Situational Test of Emotional Understanding (STEU) and Situational Test of Emotion Management (STEM). Princeton: Educational Testing Service. [Google Scholar]
- MacCann, Carolyn, Dana L. Joseph, Daniel A. Newman, and Richard D. Roberts. 2014. Emotional intelligence is a second-stratum factor of intelligence: Evidence from hierarchical and bifactor models. Emotion 14: 358–74. [Google Scholar] [CrossRef]
- Martin, Laurie T., Rachel M. Burns, and Matthias Schonlau. 2010. Mental disorders among gifted and nongifted youth: A selected review of the epidemiologic literature. Gifted Child Quarterly 54: 31–41. [Google Scholar] [CrossRef]
- Matheis, Svenja, Lena Kristina Keller, Leonie Kronborg, Manfred Schmitt, and Franzis Preckel. 2020. Do stereotypes strike twice? Giftedness and gender stereotypes in pre-service teachers’ beliefs about student characteristics in Australia. Asia-Pacific Journal of Teacher Education 48: 213–32. [Google Scholar] [CrossRef]
- Mayer, John D. 2008. Personal intelligence. Imagination, Cognition and Personality 27: 209–32. [Google Scholar] [CrossRef]
- Mayer, John D., and Yvonne N. Gaschke. 1988. The experience and meta-experience of mood. Journal of Personality and Social Psychology 55: 102–11. [Google Scholar] [CrossRef] [PubMed]
- Mensa International. n.d. About Us. Available online: https://www.mensa.org/mensa/about-us (accessed on 17 August 2022).
- Nicolet-dit-Félix, Maroussia, Christelle Gillioz, Marcello Mortillaro, David Sander, and Marina Fiori. 2023. Emotional intelligence and attentional bias to emotional faces: Evidence of hypersensitivity towards emotion information. Personality and Individual Differences 201: 111917. [Google Scholar] [CrossRef]
- Ogurlu, Uzeyir. 2021. A Meta-Analytic Review of Emotional Intelligence in Gifted Individuals: A Multilevel Analysis. Personality and Individual Differences 171: 110503. [Google Scholar] [CrossRef]
- Peairs, Kristen F., Martha Putallaz, and Philip R. Costanzo. 2019. From a (aggression) to v (victimization): Peer status and adjustment among academically gifted students in early adolescence. Gifted Child Quarterly 63: 185–200. [Google Scholar] [CrossRef]
- Persson, Roland S. 1998. Paragons of virtue: Teachers’ conceptual understanding of high ability in an egalitarian school system. High Ability Studies 9: 181–96. [Google Scholar] [CrossRef]
- Piechowski, Michael M. 1997. Emotional giftedness: The measure of intrapersonal intelligence. In Handbook of Gifted Education, 2nd ed. Edited by Nicholas Colangelo and Gary A. Davis. Boston: Allyn and Bacon, pp. 366–81. [Google Scholar]
- Pluess, Michael, Francesca Lionetti, Elaine N. Aron, and Arthur Aron. 2020. People differ in their sensitivity to the environment: An integrated theory and empirical evidence. PsyArXiv. [Google Scholar] [CrossRef]
- Posner, Michael I. 1980. Orienting of attention. Quarterly Journal of Experimental Psychology 32: 3–25. [Google Scholar] [CrossRef]
- Pratto, Felicia, and Oliver P. John. 1991. Automatic vigilance: The attention-grabbing power of negative social information. Journal of Personality and Social Psychology 61: 380–91. [Google Scholar] [CrossRef]
- Preece, David, Rodrigo Becerra, and Guillermo Campitelli. 2019. Assessing emotional reactivity: Psychometric properties of the Perth Emotional Reactivity Scale and the development of a short form. Journal of Personality Assessment 101: 589–97. [Google Scholar] [CrossRef] [PubMed]
- R Core Team. 2021. R: A Language and Environment for Statistical Computing. Vienna: R Foundation for Statistical Computing. Available online: https://www.R-project.org/ (accessed on 17 August 2022).
- Rinn, Anne N., and James Bishop. 2015. Gifted adults: A systematic review and analysis of the literature. Gifted Child Quarterly 59: 213–35. [Google Scholar] [CrossRef]
- Ryff, Carol D. 1989. Happiness is everything, or is it? Explorations on the meaning of psychological well-being. Journal of Personality and Social Psychology 57: 1069–81. [Google Scholar] [CrossRef]
- Salari, Nader, Shabnam Rasoulpoor, Shna Rasoulpoor, Shamarina Shohaimi, Sima Jafarpour, Nasrin Abdoli, Behnam Khaledi-Paveh, and Masoud Mohammadi. 2022. The global prevalence of autism spectrum disorder: A comprehensive systematic review and meta-analysis. Italian Journal of Pediatrics 48: 112. [Google Scholar] [CrossRef]
- Sanchez, Christine, Emmanuelle Brigaud, Pascal Moliner, and Nathalie Blanc. 2022. The social representations of gifted children in childhood professionals and the general adult population in France. Journal for the Education of the Gifted 45: 179–99. [Google Scholar] [CrossRef]
- Schlegel, Katja, and Klaus R. Scherer. 2016. Introducing a short version of the Geneva Emotion Recognition Test (GERT-S): Psychometric properties and construct validation. Behavior Research Methods 48: 1383–92. [Google Scholar] [CrossRef]
- Schlegel, Katja, Joëlle S. Witmer, and Thomas H. Rammsayer. 2017. Intelligence and sensory sensitivity as predictors of emotion recognition ability. Journal of Intelligence 5: 35. [Google Scholar] [CrossRef]
- Valadez Sierra, María de los Dolores, Maria Africa Borges del Rosal, Norma Ruvalcaba Romero, Karina Villegas, and Maryurena Lorenzo. 2013. Emotional intelligence and its relationship with gender, academic performance and intellectual abilities of undergraduates. Electronic Journal of Research in Educational Psychology 11: 395–412. [Google Scholar] [CrossRef]
- Watson, David, Lee A. Clark, and Auke Tellegen. 1988. Development and validation of brief measures of positive and negative affect: The PANAS scales. Journal of Personality and Social Psychology 54: 1063–70. [Google Scholar] [CrossRef]
- Winkler, Daniel, and Adam Voight. 2016. Giftedness and overexcitability: Investigating the relationship using meta-analysis. Gifted Child Quarterly 60: 243–57. [Google Scholar] [CrossRef]
- Zeidner, Moshe, Inbal Shani-Zinovich, Gerald Matthews, and Richard D. Roberts. 2005. Assessing emotional intelligence in gifted and non-gifted high school students: Outcomes depend on the measure. Intelligence 33: 369–91. [Google Scholar] [CrossRef]


| Education | Frequency | Percentage |
|---|---|---|
| Compulsory education | 6 | 2.0 |
| Apprenticeship | 8 | 2.6 |
| Upper secondary level | 46 | 15.1 |
| Bachelor’s Degree | 88 | 28.9 |
| Master’s Degree | 108 | 35.5 |
| PhD or higher | 27 | 8.9 |
| Other | 21 | 6.9 |
| Living Area | ||
| Urban | 112 | 36.8 |
| Suburban | 107 | 35.2 |
| Rural | 81 | 26.6 |
| Remote | 4 | 1.3 |
| Controls | Mensa | 1 | 2 | 3 | 4 | 5 | 6 | 7 | 8 | 9 | 10 | 11 | |
|---|---|---|---|---|---|---|---|---|---|---|---|---|---|
| 1. Age | 28.9 (9.8) | 49.2 (15.6) | |||||||||||
| 2. STEU | 0.62 (0.12) | 0.74 (0.11) | −.08 | ||||||||||
| 3. STEM | 0.60 (0.15) | 0.63 (0.10) | .11 | .29 *** | |||||||||
| 4. GERT | 0.58 (0.15) | 0.62 (0.11) | −.31 *** | .00 | .05 | ||||||||
| 5. AIM | 75.6 (11.5) | 71.3 (13.1) | −.12 * | −.12 * | .00 | .18 ** | |||||||
| 6. PANAS p | 31.5 (7.8) | 33.5 (7.1) | −.02 | .00 | −.04 | −.02 | .24 *** | ||||||
| 7. PANAS n | 25.0 (7.8) | 21.8 (7.6) | −.35 *** | −.02 | −.11 | .17 ** | .28 *** | −.10 | |||||
| 8. PERS p | 31.6 (7.5) | .16 ** | .11 | .14 * | −.13 * | .29 *** | .43 *** | −.17 ** | |||||
| 9. PERS n | 26.6 (8.4) | −.19 ** | .10 | .02 | .03 | .38 *** | −.15 * | .52 *** | −.01 | ||||
| 10. HSPS | 4.62 (0.94) | −.17 ** | −.13 * | −.05 | .24 *** | .47 *** | .01 | .42 *** | .03 | .48 *** | |||
| 11. PSS | 20.6 (6.8) | 15.7 (6.8) | −.22 *** | −.02 | −.05 | .17 ** | .28 *** | −.34 *** | .66 *** | −.24 *** | .56 *** | .43 *** | |
| 12. SWLS | 20.6 (7.2) | 22.2 (6.8) | .00 | .08 | .05 | −.04 | .08 | .46 *** | −.24 *** | .31 *** | −.24 *** | −.08 | −.51 *** |
| Anxiety | Bipolar | Depression | Autism | Asperger | ADHD | Borderline | Other | |
|---|---|---|---|---|---|---|---|---|
| Symptoms | 18.8 | 2.3 | 10.9 | 10.9 | 11.8 | 7.9 | 1.3 | 3.6 |
| Diagnosis | 7.9 | 1.0 | 12.5 | 2.6 | 3.9 | 4.9 | 0.7 | 5.6 |
| Predictors | Estimates | CI | p |
|---|---|---|---|
| Intercept | −20.4 | −20.75–−20.06 | <0.001 |
| Condition (1 = emotional) | −0.02 | −0.06–0.02 | 0.393 |
| Group (1 = Mensa) | −0.36 | −0.76–0.04 | 0.074 |
| Age | 1.77 | 1.41–2.13 | <0.001 |
| Trial Number | −0.3 | −0.33–−0.26 | <0.001 |
| Gender (1 = female) | 0.36 | 0.06–0.65 | 0.018 |
| Mood | 0.19 | −0.10–0.48 | 0.207 |
| Condition x Group | 0.04 | −0.00–0.08 | 0.056 |
| STEU (linear) | −49.22 | −119.10–20.66 | 0.167 |
| STEU (quadratic) | 21.58 | −38.62–81.77 | 0.482 |
| Condition × STEU (linear) | −8.97 | −17.70–−0.23 | 0.044 |
| Condition × STEU (quadratic) | −5.67 | −13.17–1.82 | 0.138 |
| Group × STEU (linear) | 60.72 | −9.88–131.33 | 0.092 |
| Group × STEU (quadratic) | −22.9 | −83.32–37.52 | 0.458 |
| Group × Condition × STEU (linear) | 9.17 | 0.44–17.91 | 0.04 |
| Group × Condition × STEU (quadratic) | 9.4 | 1.90–16.89 | 0.014 |
| Random Effects | |||
| σ2 | 10.77 | ||
| τ2 | 5.54 PARTICIPANT | ||
| ICC | 0.34 | ||
| N | 276 PARTICIPANT | ||
| Observations | 33,558 | ||
| Marginal R2/Conditional R2 | 0.155/0.442 | ||
| Predictors | Non-Gifted Participants | Mensa Members | ||||
|---|---|---|---|---|---|---|
| Estimates | CI | p | Estimates | CI | p | |
| Intercept | −20.74 | −21.17–−20.31 | <0.001 | −19.61 | −19.98–−19.24 | <0.001 |
| Condition (1 = emotional) | −0.01 | −0.06–0.04 | 0.69 | 0.03 | −0.02–0.07 | 0.289 |
| STEU (linear) | −89.92 | −146.38–−33.46 | 0.002 | 6.65 | −39.66–52.96 | 0.778 |
| STEU (quadratic) | 27.84 | −27.19–82.88 | 0.321 | 3.63 | −43.63–50.89 | 0.88 |
| Age | 0.9 | 0.49–1.31 | <0.001 | 1.92 | 1.54–2.31 | <0.001 |
| Trial Number | −0.22 | −0.27–−0.17 | <0.001 | −0.39 | −0.44–−0.35 | <0.001 |
| Gender (1 = female) | 0.37 | −0.07–0.82 | 0.096 | 0.38 | −0.01–0.76 | 0.054 |
| Mood | 0.38 | −0.03–0.80 | 0.072 | −0.07 | −0.45–0.31 | 0.728 |
| Condition × STEU (linear) | −7.5 | −14.46–−0.53 | 0.035 | 1.5 | −4.21–7.22 | 0.606 |
| Condition × STEU (quadratic) | −9.09 | −16.05–−2.12 | 0.011 | 2.29 | −3.43–8.01 | 0.432 |
| Random Effects | ||||||
| σ2 | 12.62 | 8.5 | ||||
| τ2 | 6.44 PARTICIPANT | 4.38 PARTICIPANT | ||||
| ICC | 0.34 | 0.34 | ||||
| N | 153 PARTICIPANT | 123 PARTICIPANT | ||||
| Observations | 18,416 | 15,142 | ||||
| Marginal R2/Conditional R2 | 0.089/0.397 | 0.235/0.495 | ||||
Disclaimer/Publisher’s Note: The statements, opinions and data contained in all publications are solely those of the individual author(s) and contributor(s) and not of MDPI and/or the editor(s). MDPI and/or the editor(s) disclaim responsibility for any injury to people or property resulting from any ideas, methods, instructions or products referred to in the content. |
© 2023 by the authors. Licensee MDPI, Basel, Switzerland. This article is an open access article distributed under the terms and conditions of the Creative Commons Attribution (CC BY) license (https://creativecommons.org/licenses/by/4.0/).
Share and Cite
Gillioz, C.; Nicolet-dit-Félix, M.; Fiori, M. Emotional Intelligence and Emotional Hypersensitivity in Gifted Individuals. J. Intell. 2023, 11, 20. https://doi.org/10.3390/jintelligence11020020
Gillioz C, Nicolet-dit-Félix M, Fiori M. Emotional Intelligence and Emotional Hypersensitivity in Gifted Individuals. Journal of Intelligence. 2023; 11(2):20. https://doi.org/10.3390/jintelligence11020020
Chicago/Turabian StyleGillioz, Christelle, Maroussia Nicolet-dit-Félix, and Marina Fiori. 2023. "Emotional Intelligence and Emotional Hypersensitivity in Gifted Individuals" Journal of Intelligence 11, no. 2: 20. https://doi.org/10.3390/jintelligence11020020
APA StyleGillioz, C., Nicolet-dit-Félix, M., & Fiori, M. (2023). Emotional Intelligence and Emotional Hypersensitivity in Gifted Individuals. Journal of Intelligence, 11(2), 20. https://doi.org/10.3390/jintelligence11020020