
Article

Cross-National Statistical Analysis of Multi-Rotor Unmanned Aircraft Accidents: Causal Factors, Flight Phases, and Temporal Trends (2016–2022)


1
Safety & Security Engineering Group—DICMA, SAPIENZA—University of Rome, 00184 Rome, Italy
2
Wessex Institute of Technology, Ashurst Lodge, Ashurst, Southampton SO40 7AA, UK
*
Author to whom correspondence should be addressed.
Computation 2026, 14(9), 214; https://doi.org/10.3390/computation14090214 (registering DOI)
Submission received: 15 August 2026 / Revised: 9 September 2026 / Accepted: 11 September 2026 / Published: 12 September 2026
(This article belongs to the Section Computational Engineering)

Abstract

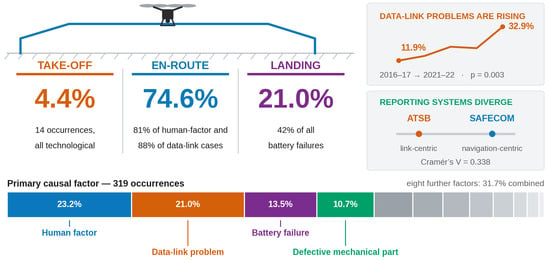
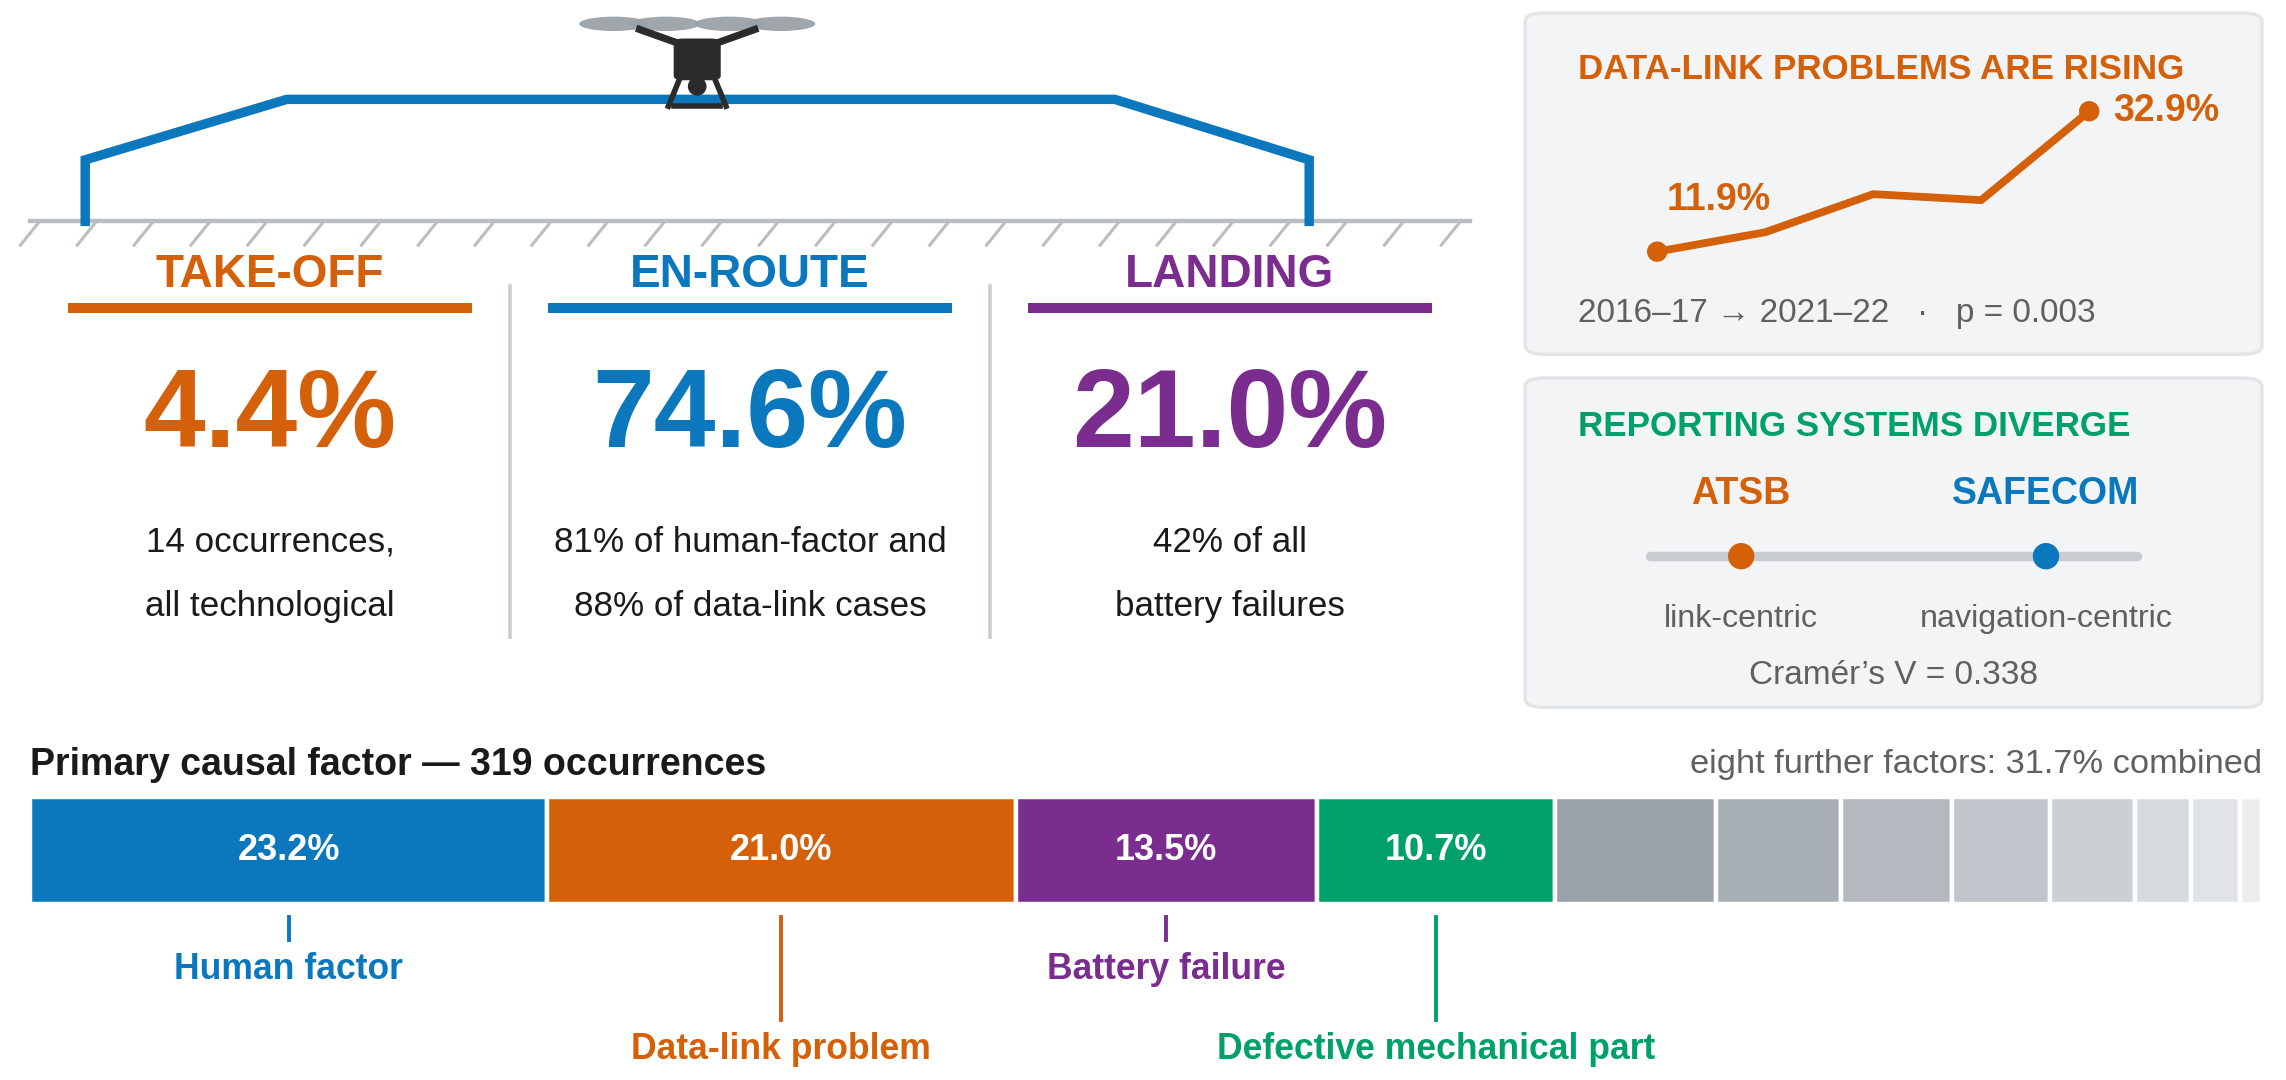
Multi-rotor unmanned aircraft systems (UAS) are now pervasive, yet quantitative evidence on how and why they fail remains fragmented across heterogeneous national reporting systems. This study analyses 319 multi-rotor UAS occurrences (2016–2022) coded from three official sources: the U.S. SAFECOM system (122), the Australian Transport Safety Bureau database (159) and the U.K. Air Accidents Investigation Branch reports (38). Each occurrence was assigned a primary causal factor from a twelve-factor taxonomy and a flight phase (take-off, en route, landing). Analyses comprised distributional estimation with Wilson confidence intervals, chi-squared association tests with permutation p-values for sparse tables, Cochran–Armitage trend tests, and correspondence analysis. Human factors (23.2%, 95% CI 18.9–28.1) and data-link problems (21.0%, CI 16.9–25.8) dominated, and 74.6% of occurrences arose en route—a phase profile opposite to that of manned aviation. Cause and phase were significantly associated (permutation p < 0.001, Cramér’s V = 0.305): all take-off occurrences were technological, none human-related, and battery failures clustered in landing (42%). Causal profiles differed markedly between reporting systems (p < 0.0001, V = 0.338), cautioning against naive pooling, and data-link problems nearly tripled from 11.9% (2016–17) to 32.9% (2021–22). Findings inform operator training, link redundancy, battery management and reporting standardisation.

Graphical Abstract

1. Introduction

Multi-rotor unmanned aircraft systems (UAS) combine vertical take-off and landing, hovering and precise low-speed manoeuvrability in a compact and inexpensive platform, and this combination has driven their adoption across aerial photography, infrastructure inspection, precision agriculture, construction, emergency response, logistics and security operations [1,2,3]. The same diffusion, however, has multiplied the opportunities for failure: loss-of-control events, flyaways and collisions involving multi-rotor platforms can damage property, injure people and—in professional applications such as surveillance and patrolling—disable the very services the platform was deployed to provide.
Understanding how, when and why multi-rotor UAS fail is therefore a prerequisite both for engineering mitigation and for regulation. A growing literature addresses UAS safety from complementary angles: exploratory analyses of national occurrence data [1,4], human-factors analyses of incident causation [5,6], data-driven risk modelling [7], systematic surveys of safety-assessment methods [8] and reviews of risk modelling for civil UAS operations [9]. Yet the quantitative picture remains fragmented in three respects. First, most empirical studies analyse a single national database—for example, Australian occurrences [4] or U.K. airprox and incident reports [5]—leaving open the question of whether the observed causal spectra generalise across jurisdictions and reporting cultures. Second, few studies restrict attention to a technologically homogeneous platform class: fixed-wing and multi-rotor aircraft differ in aerodynamics, failure modes and operating profiles, and pooling them blurs causal attribution. Third, and most practically, published analyses rarely report inferential statistics—confidence intervals, association tests, trend tests—so that differences between causes, phases or years cannot be distinguished from sampling noise.
The risk generated by a multi-rotor occurrence is not confined to the operator and the platform. Because these aircraft are flown inside the mission environment rather than between aerodromes, a loss of control exposes people and property that take no part in the operation—the third-party, or ground, risk that dominates the regulatory treatment of civil UAS. Contemporary frameworks quantify that exposure explicitly: the Specific Operations Risk Assessment (SORA) derives an intrinsic ground-risk class from the characteristic dimension and kinetic energy of the aircraft and from the density of the population overflown, before any mitigation is credited [10], and successive revisions of its ground-risk model change the resulting class for a given operation appreciably [11]. The severity side of that exposure has been characterised experimentally: the FAA ASSURE programme conducted 512 impact tests and simulations with sixteen airframes, including consumer multi-rotors, against crash-test dummies and cadavers, finding lacerations and contusions to be the dominant injuries, fatality a remote outcome for small platforms, and the orientation of the airframe at impact to matter as much as its mass [12]. Occurrence databases, however, record the failure that initiated an event, not the exposure present when it occurred: they carry neither the population density beneath the flight path nor the number of uninvolved persons at risk. The two views are complementary—a ground-risk model requires a credible failure spectrum as input, and that spectrum is what an occurrence-based study supplies. The present work characterises the causal and phase structure of multi-rotor failures; converting those shares into third-party risk would require exposure data that none of the three systems analysed here records, a boundary examined in Section 5.3.
This paper addresses these three gaps through a cross-national statistical analysis of 319 multi-rotor UAS safety occurrences, uniformly screened and coded from three official reporting systems of three countries: the U.S. SAFECOM aviation safety communiqué system [13], the occurrence database of the Australian Transport Safety Bureau (ATSB) [14] and the reports of the U.K. Air Accidents Investigation Branch (AAIB) [15]. The contributions are the following:
  • Take-off occurrences are exclusively technological. All 14 take-off events originate in a technological failure, and not one involves the human factor (0 of 74 human-factor occurrences). The safety lever for this phase is therefore pre-flight technical verification rather than piloting proficiency.
  • The phase profile is inverted with respect to manned aviation, and departures from it are factor-specific. Three-quarters of occurrences (74.6%) arise en route rather than at take-off or landing; against that background, battery failures concentrate at landing (42% versus a dataset-wide 21.0%), where end-of-mission energy exhaustion physically manifests.
  • Data-link degradation is the only causal factor with a significant temporal trend, nearly tripling its share from 11.9% (2016–17) to 32.9% (2021–22) while the causal spectrum as a whole remains stable—which identifies the command-and-control link as the growing weak point of multi-rotor operations rather than one weakness among many.
  • National reporting systems are not interchangeable, and the size of the effect is quantified. Their causal profiles differ strongly (Cramér’s V = 0.338), and correspondence analysis reduces the heterogeneity to a single dominant contrast between link-centric and navigation-centric occurrence profiles accounting for 84.4% of the inertia—a direct measure of what is lost when national databases are pooled without modelling the system effect.
  • The single-initiating-factor coding is shown to be a property of the sources, not an assumption. In the finer source coding, only 6 of 319 occurrences carried a second factor, and in every case the two marks were symptoms of one data-link failure; no occurrence documented two causally distinct factors (Section 3.2).
  • Methodologically, the study contributes a uniformly coded cross-national dataset of 319 electric multi-rotor occurrences (2016–2022) and a complete inferential treatment—Wilson intervals, permutation-based association tests suited to sparse tables, Cochran–Armitage trend tests and correspondence analysis—specified in full for independent reproduction (Section 3.3).
The remainder of the paper is organised as follows. Section 2 reviews related work. Section 3 describes the data sources, the screening and coding procedure, and the statistical methods. Section 4 presents the results. Section 5 discusses findings, limitations and operational implications. Section 6 concludes.

2. Related Work

Empirical analyses of UAS safety occurrences began with the exploratory study of Wild et al. [1], who examined 152 civil drone accidents and incidents worldwide and found that technical failures—rather than the human factors dominating manned aviation—accounted for the majority of events, with the command-and-control (C2) link already emerging as a critical element. Ghasri and Maghrebi [4] applied machine-learning classification to Australian occurrence data, relating accident severity to operational and environmental attributes. On the human-factors side, Grindley et al. [5] analysed over a decade of U.K. UAS incident reports through a human-factors lens, finding that incident causation is multi-factorial and that reporting practices constrain the depth of causal attribution; Xiao et al. [6] combined the Human Factors Analysis and Classification System with random-forest prediction to anticipate operators’ unsafe acts. More recent work has continued to mine real occurrence records with progressively more automated instruments. Yan et al. [16] applied large language models to a corpus of 200 UAV incident reports drawn from the NASA Aviation Safety Reporting System and the NTSB database, coding 3600 instances against an HFACS-UAV taxonomy and showing that automated causal coding is feasible at scale. El Safany and Bromfield [17] analysed 60 loss-of-control accident reports through three human-factors frameworks in parallel—HFACS, AcciMap and the Accident Reporting Matrix—and found that the three return materially different causal pictures for the same events. Both converge on the constraint that motivates the conservative coding rule adopted here (Section 3.2): what can be concluded about causation is bounded by the depth of the source narrative rather than by the sophistication of the analytic scheme.
A second strand addresses risk modelling and assessment. Sun et al. [7] learned data-driven Bayesian networks from UAS accident reports to quantify the interplay of risk factors and predict severity. Du et al. [9] provided a comprehensive review of safety-risk modelling for civil UAS operations, organising the field into risk-management processes, causal models, collision models and ground-risk models. Asghari et al. [8] systematically surveyed UAS safety-assessment methods across more than one hundred publications, highlighting the scarcity of quantitative, data-grounded validation. Platform-level reliability has been addressed through sensor and measurement overviews [3], fault-tolerant configuration design [18] and aerodynamic interaction studies specific to multi-rotor platforms [19]; application-oriented reviews document the expanding operational envelope of multi-rotor systems, from construction safety [2] to cooperative aerial manipulation [20]. Energy storage has become a research strand in its own right, which is directly pertinent here because battery failure is the third-ranked cause in the present dataset. Zhao et al. [21] reviewed battery-system reliability for drones across failure mechanisms, state estimation, fault diagnosis and battery-management architectures, and identified the divergence between nominal and actual usable capacity as the recurring origin of in-flight energy shortfall; Shibl et al. [22] developed a machine-learning battery-management system estimating state of charge and state of health on board, which is precisely the capability required by a return-to-home threshold computed on measured rather than nominal capacity (Section 5.2).
Finally, the regulatory dimension of occurrence reporting—which conditions every empirical study in this field—has been examined by Kasprzyk and Konert [23], who showed that UAS accident-reporting obligations and investigation practices remain heterogeneous across jurisdictions, and that most UAS occurrences involve no manned aircraft, distinguishing them structurally from traditional aviation events. The European regulatory framework [24] and the U.S. small-UAS rule [25] define the operational categories within which the occurrences analysed here took place.
With respect to this literature, the present study is, to the authors’ knowledge, the first to combine (i) a multi-national occurrence base restricted to a homogeneous platform class (electric multi-rotor), (ii) a uniform primary-cause and flight-phase coding, and (iii) a complete inferential treatment including cross-system comparison—precisely the dimension that single-database studies cannot address.

3. Data and Methods

3.1. Data Sources

Three official reporting systems were selected on the joint criteria of public accessibility, structured occurrence records, and sufficient narrative detail to support causal attribution:
  • SAFECOM (U.S. Department of the Interior/U.S. Forest Service Aviation Safety Communiqué system) [13]: a non-punitive reporting system for aviation operations of U.S. federal agencies, including a rapidly growing volume of UAS operations (e.g., wildfire management, surveying). Reports include structured fields and free-text narratives.
  • ATSB occurrence database (Australia) [14]: occurrence notifications and short investigation bulletins collected under the Australian Transport Safety Investigation Act, covering accidents and incidents involving remotely piloted aircraft.
  • AAIB reports (United Kingdom) [15]: investigation reports on accidents and serious incidents, characterised by detailed narratives and engineering analysis.
The three systems differ deliberately in nature—an agency-internal safety system, a national occurrence database and an investigation authority—and this heterogeneity is treated in the analysis as an object of study (Section 4.3) rather than as noise.

3.2. Screening and Coding

From the three systems, the pool was assembled in two stages. The occurrence records of all three databases cover the whole aviation system, so a first filter isolated the reports concerning unmanned aircraft and excluded all manned traffic. Two platform criteria were then applied. (i) Platform class: the aircraft is a multi-rotor; fixed-wing, single-rotor helicopter, hybrid VTOL and lighter-than-air types were excluded, for the reasons set out below. (ii) Propulsion: the platform is electrically powered, the dominant configuration in civil operations; internal-combustion and hybrid-propulsion aircraft were excluded so that the energy-related failure modes analysed in Section 4.2 refer to a single storage technology. Together these two criteria yielded approximately 1000 electric multi-rotor occurrence records for 2016–2022 across the three systems. A third criterion was then applied to that pool. (iii) Evidential sufficiency: the record must contain enough narrative or structured information to attribute, unambiguously and without inference beyond the text, one initiating causal factor from the taxonomy below and one of the three flight phases. Records whose narrative named only an outcome—for example “the aircraft impacted terrain”—without an identifiable initiating condition were excluded, as were records for which the flight phase could not be established, and no record was retained on the basis of a reconstructed or assumed cause. This criterion alone reduced the pool from approximately 1000 to 319 occurrences—122 from SAFECOM, 159 from ATSB and 38 from AAIB—a retention rate of about 32%. Roughly two-thirds of records discarded at this stage were therefore excluded for a single reason: the source report did not support an objective attribution of cause and flight phase. That proportion is itself informative about the three reporting systems, and it is the quantitative counterpart of the reporting-depth constraint discussed below and in Section 5.3.
The restriction to multi-rotor platforms is a substantive requirement rather than a convenience: fixed-wing, hybrid and multi-rotor aircraft do not share a failure space, and pooling them would make both the causal and the phase distribution uninterpretable. Four differences matter for this analysis. First, lift generation: a multi-rotor derives all lift from powered rotors and has no gliding capability, so a propulsion or energy failure is immediately terminal, whereas a fixed-wing aircraft retains a glide path and can convert an equivalent failure into a controlled forced landing—the same initiating factor therefore produces different outcomes and, in investigation practice, different reporting thresholds. Second, phase structure: the take-off, en route, and landing sequence of a multi-rotor consists of a vertical climb, a hover-capable mission segment and a vertical descent, while fixed-wing platforms have launch and recovery phases—catapult, hand launch, belly landing, net or parachute recovery—with failure modes that have no multi-rotor counterpart, so the flight-phase variable would not denote the same thing across types. Third, redundancy architecture: multi-rotors tolerate actuator faults through rotor configuration and control allocation [18], a mechanism absent from single-propeller fixed-wing aircraft, so that the factor “propeller failure” carries a different consequence in the two classes. Fourth, energy profile: hovering imposes a continuous high-power demand with no aerodynamic-efficiency reserve, which is why battery failures show the phase signature reported in Section 4.2; aircraft with combustion or hybrid propulsion have different energy dynamics and were excluded on criterion (ii) for the same reason. Hybrid VTOL platforms combine both regimes and would belong to neither distribution.
Each occurrence was coded along three dimensions:
  • Primary causal factor, from a twelve-factor taxonomy defined from domain expertise and the causal categories recurrent in the literature [1,4,5,9]: adverse weather; electromagnetic interference; bird strike; data-link problem; GPS problem; human factor; battery failure; propeller failure; hardware malfunction; software malfunction; ground control station (GCS) malfunction; defective mechanical component. When multiple factors appeared in a causal chain, the initiating factor was coded as primary.
  • Factor categories, along two orthogonal dichotomies: internal factors originate within the UAS system itself (human factor, battery, propeller, hardware, software, GCS, defective mechanical component; n = 201) versus external factors (adverse weather, electromagnetic interference, bird strike, data-link, GPS; n = 118); and technological factors (data-link, GPS, battery, propeller, hardware, software, GCS, defective mechanical component; n = 215) versus non-technological factors (adverse weather, electromagnetic interference, bird strike, human factor; n = 104).
  • Flight phase: take-off (lift-off and initial climb until mission altitude is reached), en route (all mission phases between take-off and landing, including positioning and task execution), and landing (from the beginning of the recovery approach to touchdown).
The single-factor rule warrants comment, since UAS accidents are commonly described as multi-factorial. Coding was in fact performed on a finer fifteen-factor scheme that permitted more than one factor to be marked per occurrence, and the harmonised twelve-factor taxonomy above was derived from it. Across all 319 occurrences, only six carried a second mark, and in every one of those six cases the pair was “loss of radio signal” together with “loss of video signal”—two manifestations of a single command-and-control link failure, which the harmonised taxonomy merges into the data-link factor. No occurrence in these three systems documented two causally distinct contributing factors. The single-initiating-factor coding is therefore not a simplification imposed on richer data but a faithful representation of what the source narratives support, consistent with the reporting-depth constraints documented for U.K. incident data [5] and for UAS occurrence reporting generally [23]. The consequence for causal-chain modelling is taken up in Section 5.3.
Table 1 summarises the composition of the dataset. The temporal analysis partitions the observation window into five periods of comparable size (2016–17: n = 59; 2018: n = 59; 2019: n = 69; 2020: n = 59; 2021–22: n = 73).

3.3. Statistical Methods

All analyses were performed in Python 3.11 (Python Software Foundation, Beaverton, OR, USA) with NumPy (NumFOCUS, Austin, TX, USA). and SciPy [26]. This section states each estimator and test used, the reason it was preferred to the obvious alternative, and the source from which it is taken; every quantity reported in Section 4 is computed exactly as defined here.
Proportions. For a factor observed k times among N occurrences, the point estimate and the 95% confidence interval are given by the Wilson score interval [27]:
p ^ = k n , C I 1 α p = p ^ + z 2 2 n ± z p ^ 1 p ^ n + z 2 4 n 2 1 + z 2 n
where z = z1 − α/2 = 1.96 for α = 0.05. The Wilson interval was preferred to the Wald interval because several factors have small counts—three occurrences for electromagnetic interference—for which the Wald interval has poor coverage and can extend below zero, whereas the Wilson interval is bounded within [0, 1] and retains close to nominal coverage at small k [27].
Association. Independence in an R × C contingency table was tested with Pearson’s statistic:
χ 2 = i = 1 R j = 1 C O i j E i j 2 E i j , E i j = n i n j N
Cell-level departures were localised with the Pearson residuals
r i j = O i j E i j E i j , i = 1 R j = 1 C r i j 2 = χ 2
whose squares sum exactly to χ2, so that each cell’s contribution to the overall statistic is directly readable, and a cell with |rij| ≥ 1.96 departs from independence at the 5% level under a normal approximation. Pearson residuals are reported in preference to adjusted (standardised) residuals precisely because of this additive decomposition. Effect size is reported as Cramér’s V [28]:
V = χ 2 N m i n R 1 , C 1
which normalises χ2 to the unit interval and is comparable across tables of different size and sample—necessary here, because the tables analysed range from 2 × 3 to 12 × 5.
Permutation inference. In the 12 × 3 cause × phase table, 61% of cells have expected counts below 5, so the asymptotic χ2 distribution is unreliable [28]. For the sparse tables, p-values were therefore obtained by Monte Carlo permutation conditional on both margins: B = 200,000 tables with the observed row and column totals were generated with Patefield’s algorithm [29] as implemented in scipy.stats.random_table SciPy version 1.17.1, NumPy version 2.4.4, statistic (2) was evaluated on each, and
p ^ p e r m = 1 + # b : χ b 2 χ o b s 2 B + 1
The (1 + ·)/(B + 1) form is the unbiased estimator that keeps the test valid at finite B and never returns a p-value of exactly zero [30]. The pseudo-random generator was numpy.random.default_rng seeded with 20240617 and instantiated afresh for each test; all permutation results reported in Section 4 are reproducible from that seed, and at B = 200,000 the Monte Carlo standard error is at most 0.0011. B was set at this value because the cause × phase p-value is of order 10−3, which a smaller number of resamples cannot resolve reliably. Where expected counts are large enough for the asymptotic approximation to be adequate—the two 2 × 3 dichotomy tables of Section 4.2—both p-values are reported, and they agree to within the Monte Carlo error.
Trend. Monotone trend in the share of a factor across the five ordered periods was tested with the Cochran–Armitage statistic [31], using equally spaced scores xk = 0, …, 4:
z = k = 1 K a k x k A x ¯ p ¯ 1 p ¯ k = 1 K n k x k x ¯ 2 , A = k a k , p ¯ = A N , x ¯ = 1 N k n k x k
where ak is the number of occurrences of the factor in period k, nk is the total number of occurrences in that period, N = Σ nk, A = Σ ak, and p ¯ and x ¯ are the pooled proportion and the mean score. Equally spaced scores were adopted because the five periods were constructed to be of comparable size and are treated as an ordinal sequence rather than as calendar time. The statistic carries one degree of freedom and is therefore more powerful against a monotone alternative than the omnibus χ2 on the same table, which is why an overall cause × period test that does not reach significance is compatible with a significant trend in one factor (Section 4.4). Because four factors were tested, trend p-values are also reported after Holm correction [32].
Correspondence analysis. The cause × reporting-system table was decomposed by correspondence analysis [33]. With P the matrix of relative frequencies, r and c its row and column margins and Dr, Dc the corresponding diagonal matrices, the singular value decomposition
S = D r 1 / 2 P r c T D c 1 / 2 = U D α V T , χ 2 N = k α k 2
yields principal inertias αk2 summing to χ2/N, together with row and column principal coordinates Fr = Dr − 1/2 U Dα and Fc = Dc − 1/2 V Dα, which are plotted in a common plane. Correspondence analysis was preferred to inspection of the residual table alone because it summarises the whole R × C departure structure in a small number of orthogonal dimensions and places causes and systems in the same space, so that proximity in the map reads directly as similarity of profile [33]. The significance level was 0.05 throughout.

4. Results

4.1. Causal Factors and Flight Phases

Figure 1 reports the distribution of primary causal factors with Wilson confidence intervals. Two factors dominate: the human factor (74 occurrences, 23.2%, CI 18.9–28.1%) and data-link problems (67, 21.0%, CI 16.9–25.8%), followed by battery failures (43, 13.5%, CI 10.2–17.7%) and defective mechanical components (34, 10.7%, CI 7.7–14.5%). The remaining eight factors individually account for less than 8% each, down to electromagnetic interference (three cases, 0.9%). The two leading factors are statistically indistinguishable from each other (overlapping CIs) but clearly separated from the third-ranked factor.
The distribution across flight phases is strongly asymmetric: 238 occurrences (74.6%, CI 69.6–79.1%) took place en route, 67 (21.0%, CI 16.9–25.8%) during landing and only 14 (4.4%, CI 2.6–7.2%) during take-off. This profile is the opposite of the classical manned-aviation pattern, in which take-off and final approach/landing concentrate the majority of accidents; the difference is discussed in Section 5.1.
Aggregating causes into categories, internal factors account for 63.0% (CI 57.6–68.1%) of occurrences versus 37.0% for external factors, and technological factors for 67.4% (CI 62.1–72.3%) versus 32.6% for non-technological ones.

4.2. Cause–Phase Association

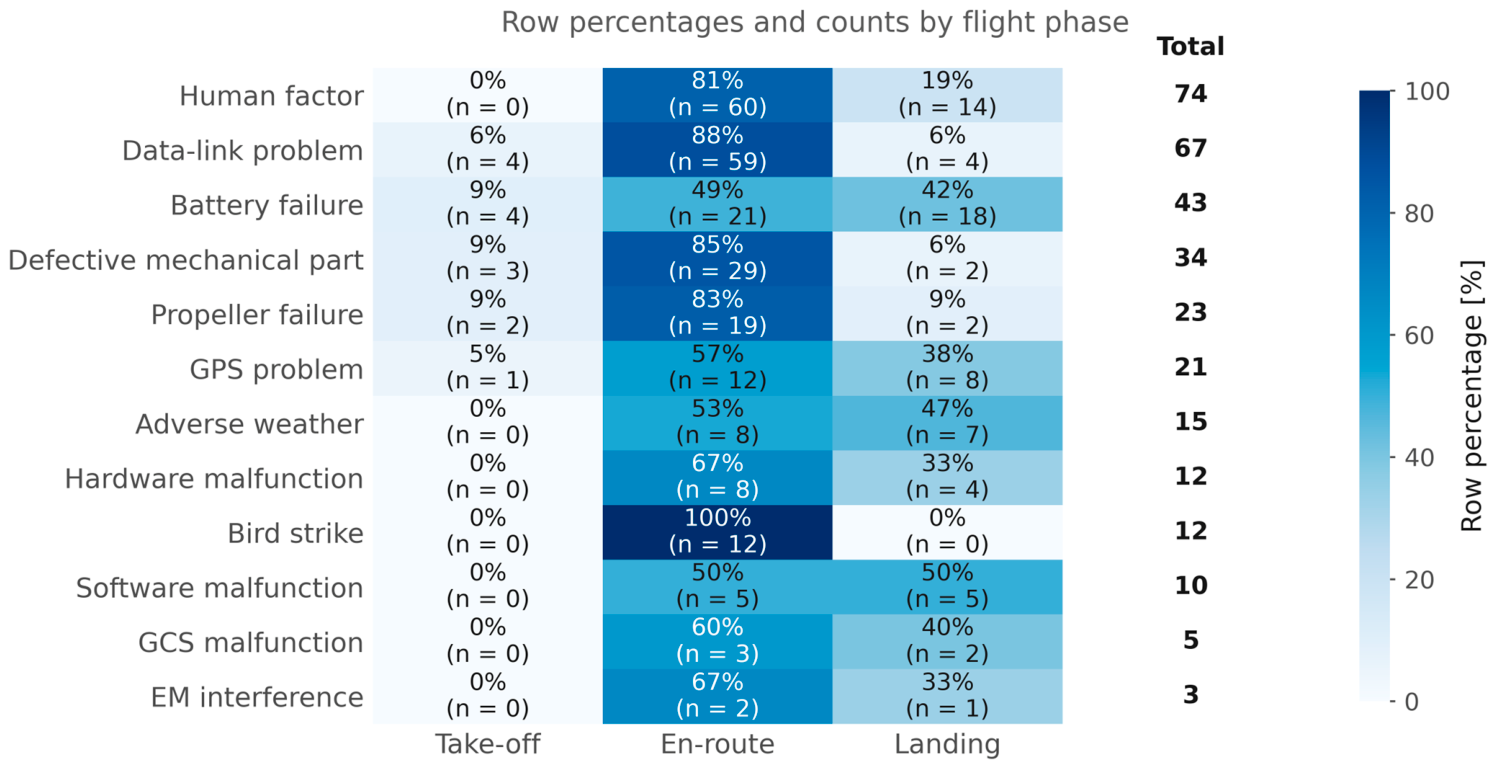
The cause × phase association is significant and of moderate strength (χ2 = 59.2, permutation p < 0.001, Cramér’s V = 0.305). Figure 2 shows the phase distribution within each causal factor and localises the association in three patterns.
First, human-factor occurrences are entirely absent at take-off (0 of 74) and concentrate en route (81%): the take-off sequence of a modern multi-rotor is largely automated, while the en-route phase is where piloting decisions, obstacle proximity, and mission-related workload accumulate. Second, and symmetrically, all 14 take-off occurrences are technological in origin—the technological/non-technological × phase association is itself significant (χ2 = 7.15, permutation p = 0.026, asymptotic p = 0.028, V = 0.150) precisely because of this empty cell. Third, battery failures depart from the general phase profile: 42% of them (18 of 43) occur during landing, versus a dataset-wide landing share of 21%—consistent with the physics of the failure mode, since capacity exhaustion and voltage sag manifest at the end of the mission, during the recovery approach. GPS problems (38% at landing) and adverse weather (47%) show a similar late-flight concentration.
By contrast, the internal/external dichotomy shows no significant association with phase (χ2 = 1.92, permutation p = 0.39, asymptotic p = 0.38, V = 0.078): the phase profile of an occurrence carries information about its technological nature, not about whether its origin is inside or outside the platform.

4.3. Cross-National Comparison

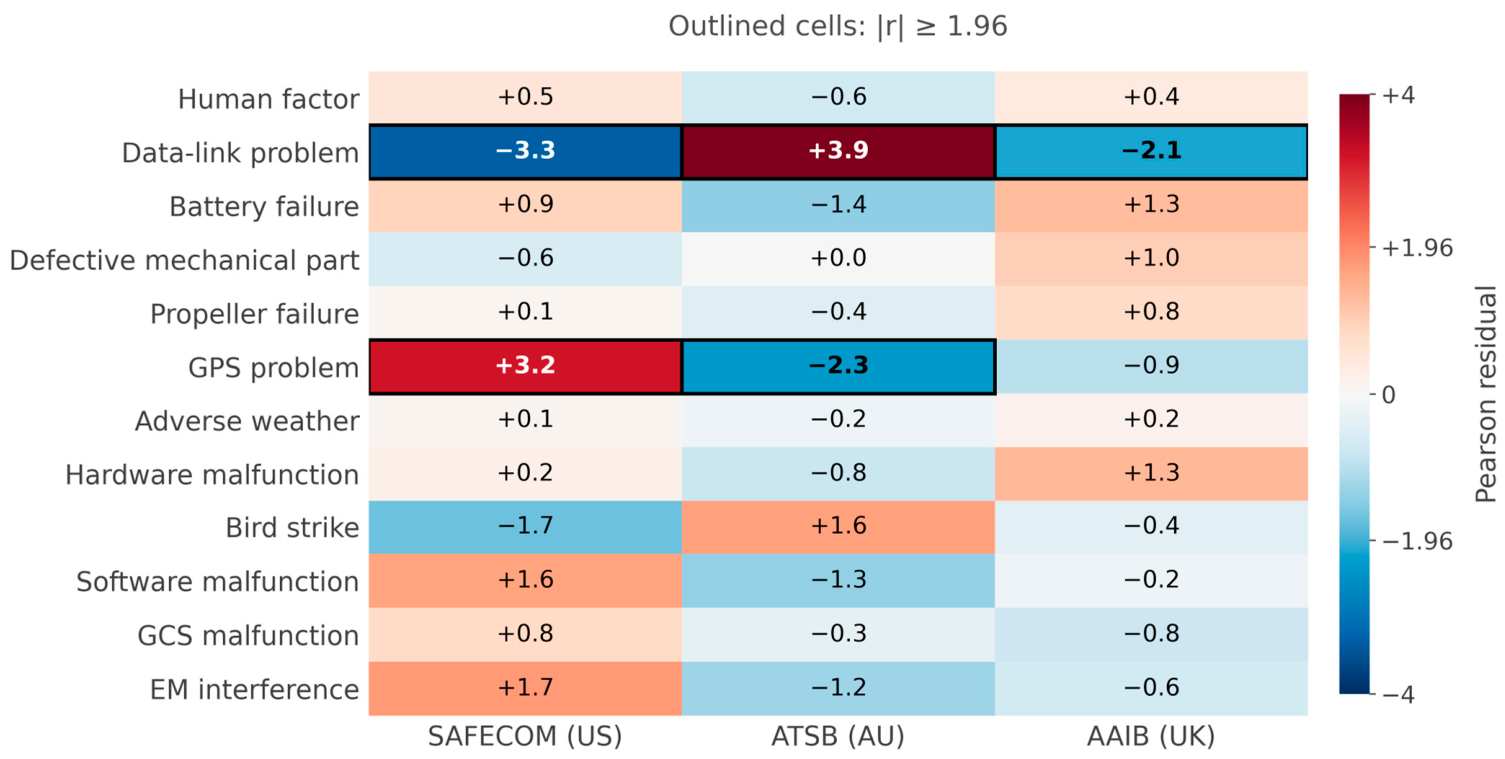
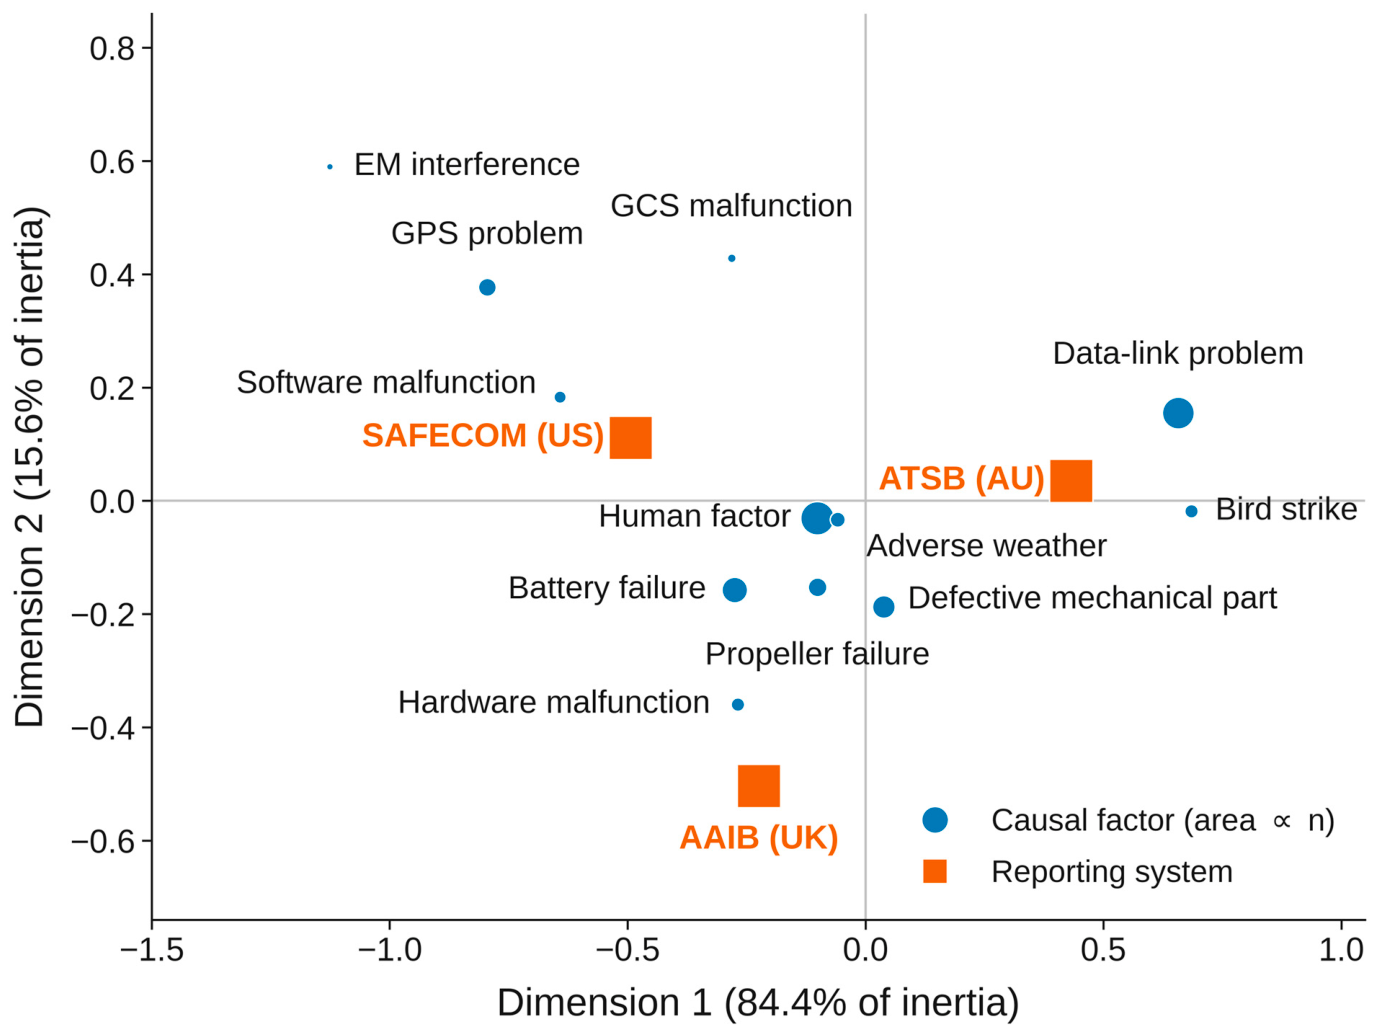
The causal profiles of the three reporting systems differ markedly (χ2 = 72.7, permutation p < 0.0001, Cramér’s V = 0.338). Figure 3 maps the Pearson residuals of the cause × system table, and Figure 4 summarises the same structure through correspondence analysis (dimension 1: 84.4% of inertia; dimension 2: 15.6%). Table 2 reports the underlying counts together with the Pearson residuals of Equation (3).
The dominant contrast opposes the Australian and U.S. systems. Data-link problems are strongly over-represented in ATSB records (residual +3.9) and under-represented in SAFECOM (−3.3) and AAIB (−2.1); GPS problems show the reverse pattern, over-represented in SAFECOM (+3.2) and under-represented in ATSB (−2.3). The phase profiles differ correspondingly (χ2 = 37.7, p < 0.0001): landing occurrences constitute 37.7% of SAFECOM records but only 8.2% of ATSB records. In the correspondence-analysis plane (Figure 4), the first dimension separates ATSB (pulled towards data-link problems) from SAFECOM (pulled towards GPS problems, software and electromagnetic interference), with AAIB in an intermediate position closer to hardware-related factors.
These differences plausibly reflect the nature of the systems more than the nature of national skies: SAFECOM collects occurrences from government-agency operations (frequently in remote or mountainous environments where satellite-navigation degradation is salient), ATSB aggregates a broad spectrum of civil occurrence notifications in which C2-link loss is a prominent, easily identifiable and mandatorily reportable event, and AAIB investigates a smaller number of serious accidents with deep engineering analysis. The operational consequence is examined in Section 5.2.

4.4. Temporal Trends

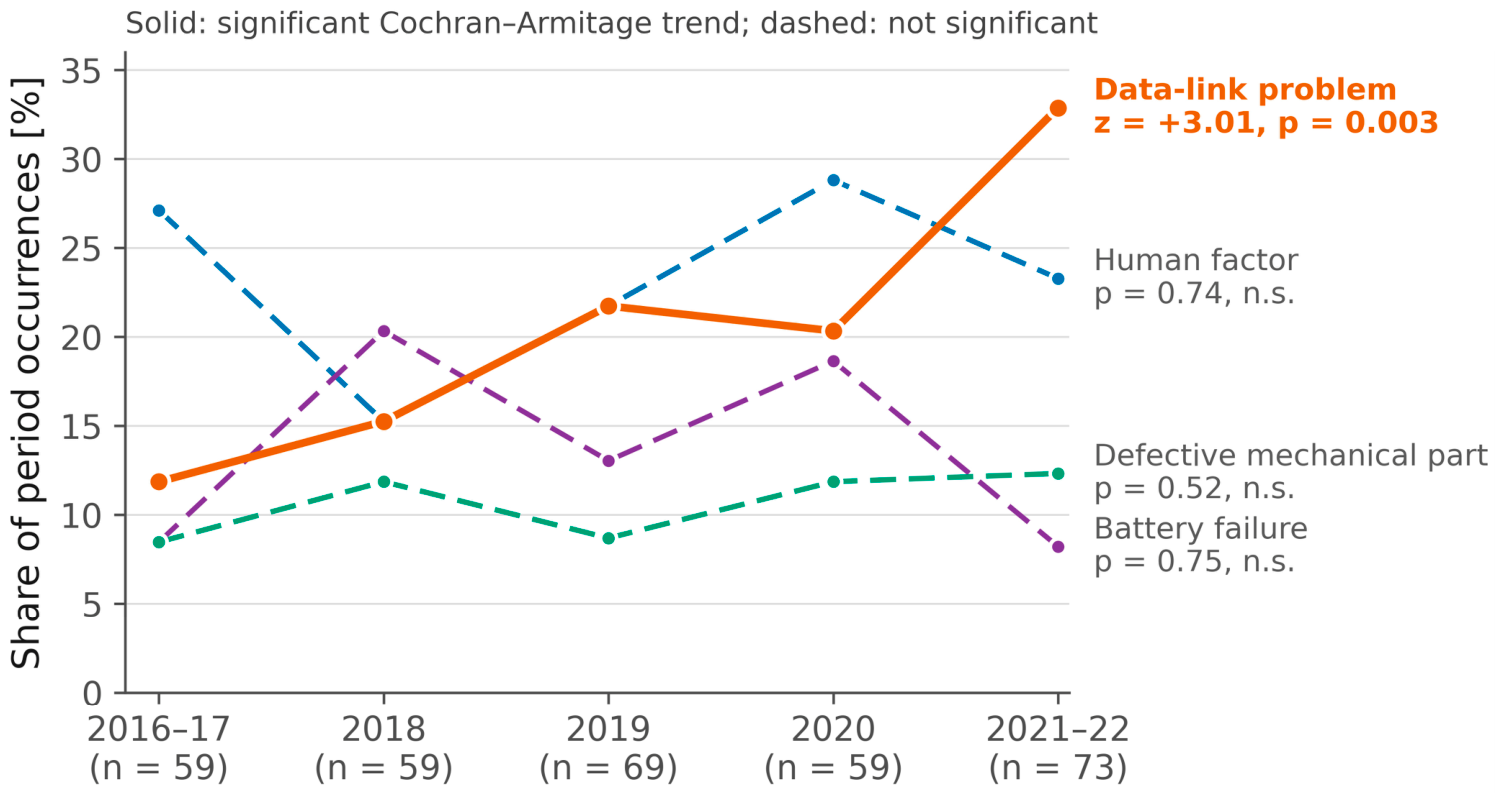
Across the five periods, the overall cause × period association does not reach significance (χ2 = 50.0, permutation p = 0.24): the causal spectrum is, on the whole, stable. Against this stable background, however, the share of data-link problems shows a strong and significant increasing trend (Cochran–Armitage z = 3.01, p = 0.003), rising from 11.9% of occurrences in 2016–17 to 32.9% in 2021–22 (Figure 5). None of the other three leading factors shows a significant trend (human factor: p = 0.74; battery failure: p = 0.75; defective mechanical component: p = 0.52). The data-link trend survives a Holm correction across the four tested factors (adjusted p = 0.010) [32].

4.5. Synthesis

The picture emerging from the four analyses is internally coherent. Multi-rotor occurrences are dominated by two failure classes of entirely different nature—human error during the mission and loss or degradation of the C2 link—with battery-related failures as the leading purely energetic cause, concentrated where the physics places them, at the end of the flight. The en-route phase concentrates the bulk of the risk across all categories; the take-off phase is, in this dataset, exclusively a technological-failure phase. The cross-system heterogeneity is large and structured, and the only temporal signal that clears the significance bar is the growing weight of data-link problems.

5. Discussion

5.1. Interpretation

  • The inverted phase profile. In manned aviation, take-off and landing concentrate accident risk, en-route flight being comparatively benign. The multi-rotor profile observed here is the opposite (74.6% en-route), and the explanation is operational: a multi-rotor mission is flown in the mission environment—near structures, terrain, vegetation, people and electromagnetic clutter—rather than between airports. The en-route phase is where visual-line-of-sight is stretched, workload peaks and the C2 link is most exposed. The phase asymmetry has a second face: the take-off phase, heavily automated and flown at maximum operator attention, produced no human-factor occurrences at all, and all of its 14 events were technological. Pre-flight technical verification, rather than take-off piloting skill, is the lever for this phase.
  • Human factor and automation. The human factor is the leading single cause (23.2%), consistent with the U.K. incident evidence [5] and with the general finding that increasing platform automation displaces, rather than eliminates, human error—from stick-and-rudder mistakes towards decision, perception and management errors during the mission [6]. Its complete absence at take-off and 81% concentration en route indicate that training and procedures should target mission execution: obstacle management, distance estimation, degraded-mode recognition and emergency decision-making, rather than basic handling.
  • The rise in data-link problems. Data-link problems are the second cause overall (21.0%) and the only one growing significantly over time, nearly tripling their share between 2016–17 and 2021–22. Three concurrent explanations deserve attention: (i) exposure growth—operations have moved towards longer ranges and more complex environments, increasing per-flight link stress; (ii) spectrum crowding in the unlicensed bands used by most civil platforms; (iii) reporting sensitivity—link-loss events are unambiguous, often logged automatically, and mandatorily notifiable in some jurisdictions. Whatever the mix, the operational implication is the same: the C2 link is the weakest growing link of multi-rotor operations, and redundant or diversified links (dual-band radio, cellular LTE/5G backup), together with well-configured and well-rehearsed link-loss failsafe behaviour, are the corresponding mitigations. The finding gives quantitative support to the link-reliability concerns raised throughout the risk-modelling literature [7,9].
  • Battery failures at landing. The clustering of battery failures in the landing phase (42%) identifies a failure mode with a precise signature: energy exhaustion at the end of mission. Mitigations are correspondingly specific—conservative energy margins with wind and payload corrections, battery-health monitoring and retirement policies, and failsafe return thresholds set on measured (not nominal) capacity—and are consistent with the platform-reliability literature [3,18].
  • Reporting systems are not interchangeable. The strong cause × system association (V = 0.338) and the divergent phase profiles show that national occurrence databases sample different operational populations, with different thresholds, obligations and narrative depth [23]. Analyses that pool databases without modelling the system effect risk attributing to “drones in general” the artefacts of one reporting culture; conversely, single-database studies should qualify their conclusions accordingly. The correspondence-analysis map (Figure 4) provides a compact diagnostic of this heterogeneity, and its two-dimensional structure (84% of inertia on the first axis) suggests that a single dominant contrast—link-centric versus navigation-centric occurrence profiles—accounts for most of the between-system variation.

5.2. Implications for Practice

Four evidence-grounded measures follow from the results; for each, the dataset allows the first-order size of the target to be stated rather than asserted.
(i)
Command-and-control link redundancy. Data-link degradation initiated 21.0% of all occurrences (67 of 319; 95% CI 16.9–25.8%), and 32.9% of those recorded in 2021–22. Because 88% of link-initiated occurrences arise en route (59 of 67), the mitigation has to hold in the mission segment rather than near the operator: a diversified bearer—a second radio on a different band, or a cellular LTE/5G link whose failure modes are uncorrelated with those of the primary—combined with a link-loss failsafe configured and rehearsed for the actual mission geometry. Under the assumption that a redundant bearer removes the initiating condition in link losses that are not common-mode, the 21.0% share is the upper bound on the achievable reduction in occurrences, while the lower bound is set by the fraction of link losses attributable to airframe-side or antenna common modes, which these narratives do not resolve. What an operations manual can specify is therefore bearer diversity and failsafe behaviour, not a reliability figure.
(ii)
Energy margins computed on measured capacity. Battery failure initiated 13.5% of occurrences (43 of 319; CI 10.2–17.7%), and 42% of these (18 of 43) occurred during landing against a dataset-wide landing share of 21.0%—a two-fold concentration that points to end-of-mission energy exhaustion rather than to cell failure as the dominant mechanism. The corresponding control is a return-to-home threshold computed from measured pack capacity and from the wind and payload of the actual sortie rather than from nominal capacity, which requires the on-board state-of-health estimation reviewed in [21] and implemented in [22], together with a retirement policy that removes packs once measured capacity falls below the value the threshold assumes.
(iii)
Mission-phase-focused training. The human factor is the leading single cause (23.2%, CI 18.9–28.1%); 81% of human-factor occurrences arise en route (60 of 74) and none at take-off. Training and standard operating procedures should accordingly be weighted towards mission execution—obstacle management, distance estimation, recognition of degraded modes and emergency decision-making—rather than towards basic handling.
(iv)
Pre-flight technical verification. All 14 take-off occurrences are technological in origin, and defective mechanical components account for 10.7% of all occurrences (CI 7.7–14.5%). Take-off safety is therefore governed by component quality and pre-flight inspection, not by piloting skill.
At system level, the cross-national heterogeneity documented here argues for the standardisation of UAS occurrence reporting—harmonised causal taxonomies and mandatory fields, including platform class and operational context—as advocated in the regulatory literature [23] and increasingly enabled by the European framework [24].

5.3. Limitations

The following limitations qualify the results. (i) Occurrence counts are numerators without exposure denominators: absolute rates per flight hour cannot be estimated, temporal trends in shares must not be read as trends in risk, and the shares reported here cannot be converted into third-party or ground risk, which would additionally require the population exposed beneath the flight path (Section 1). (ii) The coding attributes a single initiating factor to each occurrence. As documented in Section 3.2, this is what the sources support—across 319 occurrences the finer source coding marked a second factor only six times, and in each of those the two marks were symptoms of one data-link failure—but it does mean that contributing conditions which the narratives leave implicit cannot enter the analysis. Coupling structures of the kind modelled by Bayesian networks [7] therefore remain out of reach at this reporting depth; recovering them would require source systems with structured multi-factor fields, or re-investigation of the primary reports. (iii) The three systems differ in reporting thresholds and obligations; the cross-system analysis quantifies, but cannot fully disentangle, reporting effects from operational ones. (iv) Several contingency-table cells are sparse; permutation inference addresses the validity of the p-values, but low counts limit the power of factor-level comparisons, particularly for the rarest factors. (v) The 2021–22 period is partially truncated in its final year; the period construction (five windows of 59–73 occurrences) balances group sizes but remains a discretisation choice. (vi) The harmonised dataset carries no platform model, mass class or operational context, because the three systems do not record these in comparable form: SAFECOM documents agency mission types in free text, ATSB notifications rarely identify the aircraft beyond “remotely piloted aircraft”, and AAIB reports identify it precisely but for only 38 events. Analyses differentiated by UAV type or application scenario—which would be valuable, since a 25 kg survey platform and a 900 g inspection quadcopter plausibly differ in failure spectrum—are therefore not supported by these sources. The cross-system comparison of Section 4.3 is a partial proxy for that dimension: SAFECOM captures government-agency operations, ATSB a broad civil population and AAIB serious accidents only, so part of the between-system contrast in Figure 4 is presumably an operational-context effect that the data cannot separate from a reporting effect. (vii) The screening is documented at the level of the criteria and of the pool sizes they produce (Section 3.2), but the number of records inspected before the platform and propulsion filters were applied was not recorded, so that first stage of the selection cannot be reproduced count by count from what is reported here.

6. Conclusions

This paper has provided, to the authors’ knowledge, the first cross-national, inferentially complete statistical characterisation of multi-rotor UAS safety occurrences, based on 319 uniformly coded events from the U.S. SAFECOM, Australian ATSB and U.K. AAIB systems over 2016–2022. The analysis establishes with quantified confidence what descriptive studies could only suggest: the dominance of the human factor and of data-link problems; the concentration of three-quarters of occurrences in the en-route phase, inverting the manned-aviation profile; the exclusively technological nature of take-off occurrences; the landing-phase signature of battery failures; the significant and rising trend of data-link problems; and the strong, structured heterogeneity of national reporting systems, which the correspondence analysis reduces to a single dominant link-versus-navigation contrast. A further finding emerged from the coding itself: across 319 occurrences, the source narratives supported a second, causally distinct factor in not one case, which places an empirical bound on what causal-chain modelling can extract from occurrence data of this reporting depth.
Future work will proceed along three lines: incorporating exposure data as they become available, so that occurrence shares can be converted into rates and, in combination with a ground-risk model, into third-party risk; extending the coding to secondary and contributing factors, which—as Section 3.2 shows—will require source systems that record them rather than a different analysis of the same records, enabling causal-chain modelling in the spirit of the Bayesian-network literature [7]; and enlarging the cross-national base to further reporting systems, turning the system-effect diagnostic presented here into a formal meta-analytic model that also carries platform class and operational context.

Author Contributions

Conceptualization, F.G. and A.S.; methodology, F.G. and A.S.; software, F.G.; validation, F.G. and A.S.; formal analysis, F.G.; investigation, F.G.; resources, F.G. and A.S.; data curation, F.G. and A.S.; writing—original draft preparation, F.G.; writing—review and editing, F.G. and A.S.; visualisation, F.G. and A.S.; supervision, F.G. All authors have read and agreed to the published version of the manuscript.

Funding

This research received no external funding.

Data Availability Statement

The coded occurrence dataset supporting the reported results—including the cause × phase, cause × reporting-system, and cause × period contingency tables and the random seed used for the permutation tests—is available from the corresponding author upon reasonable request. The underlying occurrence reports are publicly available from the respective reporting systems [13,14,15].

Conflicts of Interest

The authors declare no conflicts of interest.

References

  1. Wild, G.; Murray, J.; Baxter, G. Exploring Civil Drone Accidents and Incidents to Help Prevent Potential Air Disasters. Aerospace 2016, 3, 22. [Google Scholar] [CrossRef] [Scilit]
  2. Gheisari, M.; Esmaeili, B. Applications and requirements of unmanned aerial systems (UASs) for construction safety. Saf. Sci. 2019, 118, 230–240. [Google Scholar] [CrossRef] [Scilit]
  3. Balestrieri, E.; Daponte, P.; De Vito, L.; Picariello, F. Sensors and Measurements for UAV Safety: An Overview. Sensors 2021, 21, 8253. [Google Scholar] [CrossRef] [Scilit] [PubMed]
  4. Ghasri, M.; Maghrebi, M. Factors affecting unmanned aerial vehicles’ safety: A post-occurrence exploratory data analysis of drones’ accidents and incidents in Australia. Saf. Sci. 2021, 139, 105273. [Google Scholar] [CrossRef] [Scilit]
  5. Grindley, B.; Phillips, K.; Parnell, K.J.; Cherrett, T.; Scanlan, J.; Plant, K.L. Over a decade of UAV incidents: A human factors analysis of causal factors. Appl. Ergon. 2024, 121, 104355. [Google Scholar] [CrossRef] [Scilit] [PubMed]
  6. Xiao, Q.; Li, Y.; Luo, F. Risk early warning for unmanned aerial vehicle operators’ unsafe acts: A prediction model using Human Factors Analysis and Classification System and random forest. Risk Anal. 2025, 45, 4119–4134. [Google Scholar] [CrossRef] [Scilit] [PubMed]
  7. Sun, X.; Hu, Y.; Qin, Y.; Zhang, Y. Risk assessment of unmanned aerial vehicle accidents based on data-driven Bayesian networks. Reliab. Eng. Syst. Saf. 2024, 248, 110185. [Google Scholar] [CrossRef] [Scilit]
  8. Asghari, O.; Ivaki, N.; Madeira, H. UAV Operations Safety Assessment: A Systematic Literature Review. ACM Comput. Surv. 2025, 57, 266. [Google Scholar] [CrossRef] [Scilit]
  9. Du, S.; Zhong, G.; Wang, F.; Pang, B.; Zhang, H.; Jiao, Q. Safety Risk Modelling and Assessment of Civil Unmanned Aircraft System Operations: A Comprehensive Review. Drones 2024, 8, 354. [Google Scholar] [CrossRef] [Scilit]
  10. Joint Authorities for Rulemaking of Unmanned Systems (JARUS). JARUS Guidelines on Specific Operations Risk Assessment (SORA), Main Body, Edition 2.5; JARUS. 2024. Available online: http://jarus-rpas.org/publications/ (accessed on 5 September 2026).
  11. del Estal Herrero, A.; Apter, N.; Hristozov, S. A Parametric Comparison of JARUS SORA 2.0 and 2.5 Ground Risk Models. Eng. Proc. 2025, 90, 47. [Google Scholar] [CrossRef] [Scilit]
  12. Arterburn, D.; Ewing, M.; Prabhu, R.; Zhu, F.; Francis, D. FAA UAS Center of Excellence Task A4: UAS Ground Collision Severity Evaluation, Final Report; ASSURE; Federal Aviation Administration: Washington, DC, USA, 2017.
  13. U.S. Department of the Interior—Office of Aviation Services. SAFECOM Aviation Safety Communiqué System. Available online: https://www.safecom.gov (accessed on 2 June 2022).
  14. Australian Transport Safety Bureau. Aviation Occurrence Database and Short Investigation Bulletins. Available online: https://www.atsb.gov.au (accessed on 2 June 2022).
  15. Air Accidents Investigation Branch. AAIB Reports. Available online: https://www.gov.uk/government/organisations/air-accidents-investigation-branch (accessed on 2 June 2022).
  16. Yan, Y.; Li, B.; Lodewijks, G. UAV Accident Forensics via HFACS-LLM Reasoning: Low-Altitude Safety Insights. Drones 2025, 9, 704. [Google Scholar] [CrossRef] [Scilit]
  17. El Safany, R.; Bromfield, M.A. A human factors accident analysis framework for UAV loss of control in flight. Aeronaut. J. 2025, 129, 1723–1749. [Google Scholar] [CrossRef] [Scilit]
  18. Debele, Y.; Shi, H.-Y.; Wondosen, A.; Kim, J.-H.; Kang, B.-S. Multirotor Unmanned Aerial Vehicle Configuration Optimization Approach for Development of Actuator Fault-Tolerant Structure. Appl. Sci. 2022, 12, 6781. [Google Scholar] [CrossRef] [Scilit]
  19. Shukla, D.; Komerath, N. Multirotor Drone Aerodynamic Interaction Investigation. Drones 2018, 2, 43. [Google Scholar] [CrossRef] [Scilit]
  20. Barakou, S.C.; Tzafestas, C.S.; Valavanis, K.P. A Review of Real-Time Implementable Cooperative Aerial Manipulation Systems. Drones 2024, 8, 196. [Google Scholar] [CrossRef] [Scilit]
  21. Zhao, T.; Zhang, Y.; Wang, M.; Feng, W.; Cao, S.; Wang, G. A Critical Review on the Battery System Reliability of Drone Systems. Drones 2025, 9, 539. [Google Scholar] [CrossRef] [Scilit]
  22. Shibl, M.M.; Ismail, L.S.; Massoud, A.M. A machine learning-based battery management system for state-of-charge prediction and state-of-health estimation for unmanned aerial vehicles. J. Energy Storage 2023, 66, 107380. [Google Scholar] [CrossRef] [Scilit]
  23. Kasprzyk, P.J.; Konert, A. Reporting and Investigation of Unmanned Aircraft Systems (UAS) Accidents and Serious Incidents. Regulatory Perspective. J. Intell. Robot. Syst. 2021, 103, 3. [Google Scholar] [CrossRef] [Scilit]
  24. European Commission. Commission Implementing Regulation (EU) 2019/947 of 24 May 2019 on the rules and procedures for the operation of unmanned aircraft. Off. J. Eur. Union 2019, L 152, 45–71. [Google Scholar]
  25. Federal Aviation Administration. 14 CFR Part 107—Small Unmanned Aircraft Systems; FAA: Washington, DC, USA, 2016.
  26. Virtanen, P.; Gommers, R.; Oliphant, T.E.; Haberland, M.; Reddy, T.; Cournapeau, D.; Burovski, E.; Peterson, P.; Weckesser, W.; Bright, J.; et al. SciPy 1.0: Fundamental algorithms for scientific computing in Python. Nat. Methods 2020, 17, 261–272. [Google Scholar] [CrossRef] [Scilit] [PubMed]
  27. Wilson, E.B. Probable inference, the law of succession, and statistical inference. J. Am. Stat. Assoc. 1927, 22, 209–212. [Google Scholar] [CrossRef]
  28. Agresti, A. Categorical Data Analysis, 3rd ed.; Wiley: Hoboken, NJ, USA, 2013. [Google Scholar]
  29. Patefield, W.M. Algorithm AS 159: An Efficient Method of Generating Random R × C Tables with Given Row and Column Totals. J. R. Stat. Soc. Ser. C Appl. Stat. 1981, 30, 91–97. [Google Scholar] [CrossRef] [Scilit]
  30. Phipson, B.; Smyth, G.K. Permutation P-values Should Never Be Zero: Calculating Exact P-values When Permutations Are Randomly Drawn. Stat. Appl. Genet. Mol. Biol. 2010, 9, 39. [Google Scholar] [CrossRef] [Scilit] [PubMed]
  31. Armitage, P. Tests for linear trends in proportions and frequencies. Biometrics 1955, 11, 375–386. [Google Scholar] [CrossRef] [Scilit]
  32. Holm, S. A simple sequentially rejective multiple test procedure. Scand. J. Stat. 1979, 6, 65–70. [Google Scholar]
  33. Greenacre, M. Correspondence Analysis in Practice, 3rd ed.; Chapman & Hall/CRC: Boca Raton, FL, USA, 2017. [Google Scholar] [CrossRef] [Scilit]
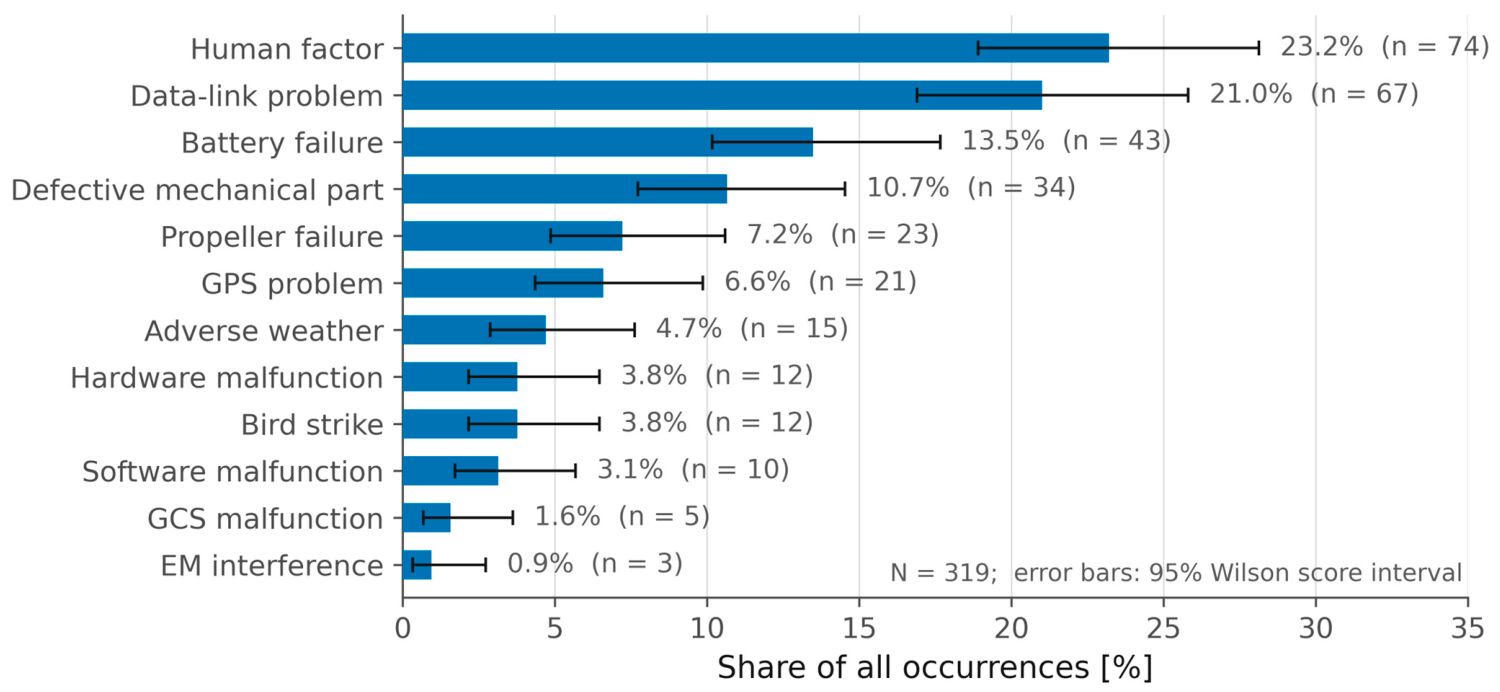
Figure 1. Distribution of primary causal factors with 95% Wilson confidence intervals (N = 319).
Computation 14 00214 g001
Figure 2. Flight-phase distribution within each causal factor (row percentages; counts in parentheses).
Computation 14 00214 g002
Figure 3. Pearson residuals of the cause × reporting-system table; cells with |r| ≥ 1.96 are outlined and set in bold.
Computation 14 00214 g003
Figure 4. Correspondence analysis of the cause × reporting-system table. The area of each circle is proportional to the number of occurrences n attributed to that causal factor (n = 3 to 74; 319 occurrences in total). The square markers denoting the three reporting systems are of fixed size and carry no quantitative meaning.
Computation 14 00214 g004
Figure 5. Temporal evolution of the four leading causal factors across the five periods. Each point is the share of the occurrences of that period attributed to the factor; n is the number of occurrences in the period (319 in total). n.s. = not significant. The p-values shown are the two-sided Cochran–Armitage trend-test p-values before multiplicity correction; the Holm-adjusted p-value for the data-link trend is 0.010.
Computation 14 00214 g005
Table 1. Composition of the dataset.
Reporting SystemCountryNTake-OffEn RouteLanding
SAFECOM [13]USA12267046
ATSB [14]Australia159614013
AAIB [15]UK382288
Total3191423867
Table 2. Cause × reporting-system contingency table: observed counts, with Pearson residuals of Equation (3) in parentheses. Residuals with |r| ≥ 1.96 are shown in bold.
Primary Causal FactorSAFECOM (US)ATSB (AU)AAIB (UK)Total
Human factor31 (+0.5)33 (−0.6)10 (+0.4)74
Data-link problem9 (−3.3)56 (+3.9)2 (−2.1)67
Battery failure20 (+0.9)15 (−1.4)8 (+1.3)43
Defective mechanical part11 (−0.6)17 (+0.0)6 (+1.0)34
Propeller failure9 (+0.1)10 (−0.4)4 (+0.8)23
GPS problem17 (+3.2)3 (−2.3)1 (−0.9)21
Adverse weather6 (+0.1)7 (−0.2)2 (+0.2)15
Hardware malfunction5 (+0.2)4 (−0.8)3 (+1.3)12
Bird strike1 (−1.7)10 (+1.6)1 (−0.4)12
Software malfunction7 (+1.6)2 (−1.3)1 (−0.2)10
GCS malfunction3 (+0.8)2 (−0.3)0 (−0.8)5
EM interference3 (+1.7)0 (−1.2)0 (−0.6)3
Total12215938319
χ2 = 72.7, permutation p < 0.0001 (B = 200,000, seed 20240617), Cramér’s V = 0.338.
Disclaimer/Publisher’s Note: The statements, opinions and data contained in all publications are solely those of the individual author(s) and contributor(s) and not of MDPI and/or the editor(s). MDPI and/or the editor(s) disclaim responsibility for any injury to people or property resulting from any ideas, methods, instructions or products referred to in the content.