Article

From Interfaces to Networks: Energetic Control of Specificity in Bacterial Two-Component Systems

by
Eduardo M. Martin
1,
Alma L. Guerrero-Barrera
1,*,
F. Javier Avelar-Gonzalez
2,
Rogelio Salinas-Gutierrez
3 and
Mario Jacques
4
1
Laboratorio de Biología Celular y Tisular, Departamento de Morfología, Universidad Autónoma de Aguascalientes, Aguascalientes 20100, Mexico
2
Laboratorio de Estudios Ambientales, Departamento de Fisiología y Farmacología, Universidad Autónoma de Aguascalientes, Aguascalientes 20100, Mexico
3
Departamento de Estadística, Universidad Autónoma de Aguascalientes, Aguascalientes 20100, Mexico
4
Groupe de Recherche sur les Maladies Infectieuses du Porc, Faculté de Médecine Vétérinaire, Université de Montréal, Saint-Hyacinthe, QC J2S 2M2, Canada
*
Author to whom correspondence should be addressed.
Computation 2026, 14(6), 123; https://doi.org/10.3390/computation14060123
Submission received: 17 April 2026 / Revised: 18 May 2026 / Accepted: 18 May 2026 / Published: 25 May 2026
(This article belongs to the Section Computational Biology)

Abstract

Bacterial two-component systems (TCSs) mediate environmental sensing and adaptive responses through signal transduction between histidine kinases (HKs) and response regulators (RRs), thereby regulating biochemical processes essential for survival and, in pathogenic species, infection. How signaling specificity and insulation are maintained in organisms encoding multiple paralogous two-component systems remains an open question. Here, we investigate specificity in the Actinobacillus pleuropneumoniae TCS signaling network using an integrated computational framework that combines coevolutionary analysis, structural modeling, molecular dynamics simulations, and free-energy calculations. We show that cognate HK-RR recognition is established locally through clusters of coevolving interface residues, termed the orthologue interface specificity core (OISC), which mediate symmetric molecular recognition at individual interaction interfaces. However, interface-level recognition alone is insufficient to explain signaling fidelity across the network. Instead, system-wide specificity and pathway insulation emerge in this network from asymmetric energetic discrimination among cognate and non-cognate interactions across the ensemble of paralogous interfaces. Graded free-energy profiles reveal that broadly compatible interfaces can coexist with robust signaling insulation, reconciling interface promiscuity with stable network organization. Together, these findings support a two-tiered model for the TCS network analyzed here, in which symmetric interface constraints enable cognate recognition, while asymmetric network-level energetics govern signaling specificity. This framework may extend to other paralogous TCS networks.

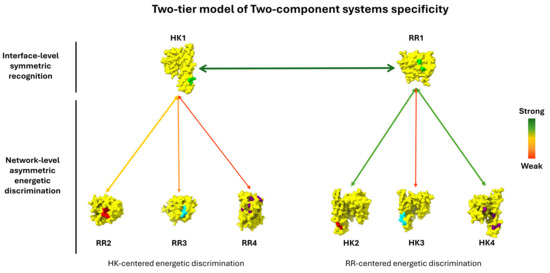
Graphical Abstract

1. Introduction

Actinobacillus pleuropneumoniae is a Gram-negative bacterium. This encapsulated coccobacillus, which is hemolytic, facultative anaerobic, and fermentative, causes porcine pleuropneumonia, a highly contagious disease [1]. Porcine pleuropneumonia is characterized by fibrinohemorrhagic necrotizing bronchopneumonia and fibrinous pleuritis [2]. The disease can progress from hyperacute to chronic [3,4]. The chronic condition has a high prevalence, resulting in growth impairment and increased susceptibility to secondary infections. Chronic infected individuals serve as carriers, and some animals can develop subclinical infections, both responsible for the transmission of the microorganism [1]. The disease has been described worldwide as having serious impacts on the economy, ecology, and animal welfare in domestic pig industrial farming [2,3,4,5].
There are two A. pleuropneumoniae (App) biovars: biovar 1 strains require nicotinamide adenine dinucleotide (NAD), and biovar 2 strains synthesize NAD. Furthermore, biovar 1 is divided into 12 serotypes and biovar 2 into 6 serotypes based on surface polysaccharide antigens. Serotypes 1 and 5 are further differentiated into 1a, 1b, 5a, and 5b based on minor differences in polysaccharide structures [4,5]. Thirteen serotypes have been sequenced so far and, from those serotypes 1, 3, 5b, 7, and 8 are completely sequenced [6,7,8]. Draft genome sequences for the remaining serotypes are available except for serotypes 14 and 15 [9,10,11,12,13].
Every serotype can cause the disease, although some serotypes are more virulent than others. These variations appear to correlate with the production of diverse combinations of Apx toxins, but not solely, with most virulent serotypes producing both ApxI and ApxII [4]. In addition, App pathogenesis is complex involving different virulence factors, among which are related to host colonization, the establishment of infection, essential nutrients acquisition, metabolic adaptation, and persistence within the host [2]. Some of these virulence factors have been suggested to be regulated in App by two-component systems, such as the histidine kinases CpxA, PhoR, and QseC, and the response regulators ArcA and QseB [14,15,16,17,18,19,20,21,22,23,24,25,26,27,28,29].
Two-component systems (TCSs) sense and respond to changes in the bacterial environment through signal transduction mechanisms, the prototypical composition of these is a sensor and a response protein. Sensor proteins are histidine kinases (HKs) that autophosphorylate upon recognition of their specific stimulus and transfer the phosphoryl group to its specific response regulators (RRs) or cognate, turning them in most cases into an active transcriptional state. The specific recognition between cognate HKs and RRs is then a determinant for coupling external stimuli to specific and adequate cellular responses. As soon as a stimulus has been recognized by the HK it autophosphorylates and must recognize its cognate RR among non-cognate substrates, before transferring the phosphoryl group. There are three primary mechanisms for ensuring TCS pathway specificity: molecular recognition, phosphatase activity, and substrate competition. Additionally, spatiotemporal regulation could be involved but it has not been thoroughly assessed. The predominant mechanism enforcing specificity is molecular recognition -the intrinsic ability of an autophosphorylated HK to recognize its cognate partner through protein–protein interaction-, due to specificity-determining residues. Mutations in these residues can occur because they are either accompanied or preceded by compensatory changes in other variable positions. Such compensation would result in a coupling between changes in the two positions, thus co-evolution between interacting proteins [30,31,32,33,34,35,36]. However, in organisms encoding multiple paralogous TCSs, interface-level recognition alone appears insufficient to explain how signaling insulation is maintained across the network in the analyzed systems, suggesting that additional mechanisms contribute to specificity.
Five different two-component systems have been reported for A. pleuropneumoniae: ArcB-ArcA, CpxA-CpxR, PhoR-PhoB, QseC-QseB, and NarQ-NarP; four of these systems are members of the OmpR family, with the latter in the NarL family [6,37]. Collectively, these systems coordinate responses to host-derived signals, metabolic states, and environmental stressors, underpinning biofilm formation, metabolic adaptation, and virulence in A. pleuropneumoniae [2,3,16,17,18,19,20,21,22,23,24,25,26,27,28,29,38,39,40,41,42,43,44,45,46].
However, the quantitative relationship between cognate and non-cognate interactions within this TCS network remains insufficiently characterized. To better understand protein–protein interaction specificity, computational and experimental approaches have employed covariance analysis to identify coevolving residues constrained due to the evolutionary relationship between interacting proteins [32,33,47,48]. Additionally, statistical and computational methods have likewise proven effective [49,50,51], and multiple predictions derived from these approaches have been validated in biological systems, supporting their predictive power [32,36,52,53,54,55]. Together with the rapid expansion of genomic datasets, have enabled system-specific analyses of interaction interfaces.
Previous approaches to TCS specificity have primarily focused on either coevolutionary inference of interface residues or static structural models. While these methods successfully identify interacting residues, they do not quantify how these interactions translate into system-level signaling discrimination across paralogous networks. Existing frameworks lack integration of coevolutionary coupling with energetic evaluation of both cognate and non-cognate interactions within a unified network context. As a result, the relationship between interface-level recognition and network-level specificity remains unresolved.
Despite advances in identifying specificity-determining residues, the relationship between interface-level molecular recognition and system-wide signaling discrimination in paralogous two-component systems remains unresolved. In particular, it is unclear how local interaction constraints translate into robust signaling insulation across complex networks of cognate and non-cognate interactions.
Here, we aim to quantitatively characterize how molecular recognition at HK–RR interfaces relates to network-level specificity in the Actinobacillus pleuropneumoniae TCS network. To address this, we integrate coevolutionary analysis, structural modeling, molecular dynamics simulations, and free-energy calculations to evaluate both cognate and non-cognate interactions within a unified framework.
We hypothesize that while cognate pairing is established through symmetric molecular recognition at the interaction interface, system-wide specificity emerges from asymmetric energetic discrimination across the signaling network. Under this model, interface-level compatibility defines a set of structurally permissible interactions, whereas differential interaction energetics and network context determine functional signaling outcomes, consistent with a two-tier organization of specificity.

2. Materials and Methods

2.1. Identification of Two-Component Systems in Actinobacillus pleuropneumoniae

The complete genome sequences from A. pleuropneumoniae strains 1 4074, 3 JL03, 5b L20, 7 AP76, 8 MIDG2331, App6, KL 16, NCTC10976, NCTC11384, and S4074 [6,7,8,13], together with available draft genome sequences from 2 4226, 2 S1536, 4 M62, 6 Fem φ, 9 CVJ13261, 10 D13039, 11 56153, 12 1096, 13 N273, 18-1342, G1-9626, NCTC11383, NCTC11407, and S8 were used to search for putative TCS protein sequences [9,10,11,12]. These datasets comprise the full set of genome sequences available at the time the analyses were conducted.
Accordingly, no additional selection or randomization criteria were applied. The dataset is therefore constrained by genome availability, completeness, and annotation quality, which are required for reliable identification of TCS components and genomic context.
Putative coding sequences of HKs were identified using the conserved domains dimerization and histidine phosphotransfer (DHp) [CDD:cd0082] and catalytic and ATP-binding (CA) [CDD:cd00075], which together mediate ATP-dependent histidine phosphorylation [56,57]. RRs were identified using the conserved receiver domain (REC) [CDD:cd00156], which is common to all RRs and controls phosphorylation-dependent effector activation [58,59,60]. These domains were chosen due to their conservation and functional relevance across bacterial TCS and are suitable targets for identifying HK or RR through homology. Protein blasts against A. pleuropneumoniae taxid 715 were used with these domains as queries. The putative TCS sequences obtained were processed using NCBI’s Blast Batch CD-Search standard to assess multi-domain homology [61].
Multiple sequence alignments (MSAs) were assembled by homology for each TCS orthologue putative protein coded in A. pleuropneumoniae. These MSAs were used to assess differences among App strains’ orthologue protein sequences. The genomic context for these TCS putative proteins was examined with NCBI Graphical sequence viewer 3.44.0 [62], two proteins that belonged to the same putative operon were defined as cognates.

2.2. Computational Analyses of Cognate Orthologue Systems

2.2.1. Dataset Construction and MSA Processing

Sequence homologues to the TCS proteins coded in A. pleuropneumoniae were retrieved from NCBI’s protein database, by restricted searches. The filters used were reference sequence (RefSeq) databases within the bacteria domain. Ten different databases of putatively homologue proteins were assembled by annotation for each of the TCS proteins from A. pleuropneumoniae. Further processing removed WP_ RefSeq annotations from these databases and only kept YP_ and NP_ annotations from completely sequenced bacterial genomes.
The genomic context for each protein was examined with NCBI Graphical sequence viewer 3.44.0 [62]. Histidine kinases and response regulators belonging to the same predicted operon were operationally defined as cognate pairs, based on the evolutionary conservation of genomic proximity across diverse bacterial genomes. This strategy helps ensure that the interacting proteins are functionally linked and reduces the likelihood of incorrect pairing.
To improve coevolution signal quality, orphan proteins (those not genomically paired with a partner) were excluded from all datasets. Orphans are subjected to distinct selective pressures that can obscure interface residue coevolution, increasing the risk of false positive of non-cognate interaction in the co-evolution analysis.
Cognate TCS datasets (PhoR-PhoB, CpxA-CpxR, QseC-QseB, and NarQ-NarP) were processed using NCBI’s Blast Batch CD-Search standard to identify domain architecture and multi-domain homology [61]. Domain shuffling and modularity has been reported in HKs [63], thus this step ensured that only proteins with the conserved domain architecture characteristic of their orthologue families were retained.
Given that some annotations could be incomplete or inconclusive, only sequence matches with low e-values were included. Protein pairs were excluded if either component lacked homology to the corresponding orthologue or exhibited a non-canonical domain architecture, to avoid conflicting co-evolution signals from proteins that may have undergone substantial changes.
This preprocessing step enabled the construction of high-quality orthologous datasets suitable for assessing system-specific co-evolution and identifying specificity-endowing amino acids in the interaction interface.
To obtain a database greater than 125 sequences for NarQ-NarP in which random MI subsided [33], concatenated co-operonic sequences from both NarQ-NarP and NarX-NarL systems were merged into the MSA. These sequence pairs had homology to both NarQ-NarP proteins, or at least to one of the former and either NarX or NarL but were excluded if they showed homology to both NarX and NarL. Since NarQ can phosphorylate both NarL and NarP (RRs), the rationale was that the interaction interface of both RRs is conserved enough to allow recognition and phosphotransfer in both cognate and non-cognate HK-RRs interactions, NarQ-NarP and NarQ-NarL, respectively [57,64,65,66]. Sequence pairs that did not comply with these criteria were excluded.
Datasets of putatively interacting cognate proteins were merged, and cognate sequence pairs from the same genome were concatenated into a single sequence arranged as histidine kinase-response regulator-wise (HK::RR). Dataset arrangement used the HKs’ ID as the sole identifier for each concatenated sequence. Finally, four cognate TCS protein datasets were assembled: PhoR::PhoB (n = 499), CpxA::CpxR (n = 205), QseC::QseB (n = 145), and NarQ::NarP (n = 165).
Each dataset was processed with Clustal Omega 1.2.1 to generate MSAs, and Jalview 2.11.1.4 was used to ensure a maximum sequence redundancy of 99 percent [67,68]. Additional minor processing was made manually.

2.2.2. Coevolution Computation

Cognate TCS concatenated MSAs were then used to compute mutual information with average product correction (MIp). Calculations were made with an algorithm written with Python 3.6 based on Dunn 2008 but that does consider positions that are not completely represented [33]. In this algorithm each resulting MIp value was subsequently transformed into a weighted MIp (wMIp) (Equation (1)), which adjusts the mutual information to joint occupancy.
w M I p = M I p · j n
j = j o i n t   p a i r   o c c u p a t i o n
n = t o t a l   s e q u e n c e s   i n   M S A

2.3. Protein–Protein Interface and Specificity-Determining Amino Acids

2.3.1. Structural Modeling and Interface Definition

Heterodimers CpxA-CpxR, NarQ-NarP, PhoR-PhoB, and QseC-QseB were modeled using Alphafold 2.3.1 multimer with an AB stoichiometry. For each heterodimer, the best-ranked model was selected and used to define the contact surface between the proteins, hereafter referred to as the modeled interaction interface (MII) [69,70,71,72]. Interface residues were identified in ChimeraX 1.10, which was also used for structural visualization [73]. Residue positions within the MII were then mapped onto the corresponding MSAs based on their three-dimensional structural coordinates (Table S1).

2.3.2. Interface Coupling Index (ICI)

To integrate coevolutionary coupling with structural interface constraints, wMIp values were combined with inter-residue distance measurements within the MII. A script written in Python 3.6 was used to iterate over the non-hydrogen sidechain atoms of amino acids within the MII for each heterodimer. For each HK-RR residue pair, the minimal distance between sidechain atoms was calculated from their three-dimensional coordinates. Distances were computed for all residue pairs within the MII; however, only interprotein HK–RR residue pairs were retained for subsequent analysis.
The global minimum inter-residue distance across all interprotein HK–RR residue pairs was defined as the minimal global distance in the interface (md). For each interprotein residue pair, the minimal inter-residue distance (AApd) was normalized relative to the global minimal distance (md) to obtain the adjusted minimal distance (amd) (Equation (2)). These values were subsequently combined with the corresponding wMIp scores for each residue pair, yielding the interface coupling index (ICI) (Equation (3)).
a m d = A A p d m d
A A p d = m i n i m a l   i n t e r r e s i d u e   d i s t a n c e   f o r   a   g i v e n   r e s i d u e   p a i r
m d = g l o b a l   m i n i m a l   i n t e r r e s i d u e   d i s t a n c e   i n   t h e   i n t e r f a c e
I C I = w M I p a m d
To account for the uncertainty of the interprotein residue distances, short molecular dynamics simulations were performed using GROMACS 2025.2 with OPLS-AA/L forcefield and SPC/E water model, maintaining an AB stoichiometry [74,75,76,77]. The systems correspond to modeled heterodimers of A. pleuropneumoniae 1 4074, namely CpxA-CpxR, NarQ-NarP, PhoR-PhoB, and QseC-QseB. Each simulation ran for 1 ns, and the inter-residue distance for all residue pairs in the MII were measured in 21 time points, spaced every 50 picoseconds from 0 to 1000 ps.
These simulations were performed to estimate the local variability of interface atomic distances used in the ICI metric. Because the quantity of interest is the fluctuation of atomic distances within an already formed interface, the trajectories primarily capture local sidechain and packing fluctuations occurring on picosecond–nanosecond timescales, rather than long-timescale conformational rearrangements of the protein complexes. The variability associated with each ICI value was therefore estimated as the standard deviation of the corresponding inter-residue distances measured across the 21 sampled frames.
Additional analyses of the trajectories confirmed that the mean interface distances and their standard deviations remain stable when computed from different trajectory segments, indicating that the estimated variability is statistically converged.
ICI values greater than the 99th percentile were retrieved from the datasets and define the Orthologue interface specificity core (OISC). Statistical processing was made with software R 3.2.3 [78].
Sequence logos for the MII composition were generated from the parental MSA datasets and for each TCS from A. pleuropneumoniae, using WebLogo 3.7.11 [79]. Positions conform to the protein’s residue positions in the modeled heterodimer (Table S1).

2.4. Free Energy Calculation Using Umbrella Sampling

2.4.1. System Setup and Equilibration

To assess the role of residue pairs identified by the ICI metric, wildtype and mutant cognate HK–RR complexes were used to estimate changes in binding free energy. Mutant variants were generated by substituting residues predicted to belong to the OISC. Residue substitution was performed in ChimeraX 1.10 by swapping selected residues with alanine, using the automated Dunbrack rotamer library for sidechain optimization [73].
For non-cognate HK-RR pairs, protein complexes were generated using HADDOCK 2.4 [80]. Multiple docking solutions were obtained for each protein–protein interaction and grouped into clusters according to structural similarity by the HADDOCK workflow. For subsequent molecular dynamics and free-energy calculations, the representative structure from the docking cluster with the highest Nstruc value was selected, thereby prioritizing the most populated docking state and the interaction geometry most consistently recovered across docking solutions.
Each protein pair was then prepared for molecular dynamics (MD) simulations using GROMACS 2025.2 [77]. The simulation box was defined as at least twice the pulling distance along the pulling axis (5 nm), with the complex positioned approximately 1 nm from the remaining box boundaries. Energy minimization followed by NPT equilibration was performed to generate the starting configuration for umbrella sampling [81].

2.4.2. Umbrella Sampling and Potential Mean Force Reconstruction

A 500 ps pulling simulation was performed in which the center-of-mass (COM) of the RR was pulled away from the HK COM along the z-axis using a harmonic force constant of 1000 kJ mol−1 nm−2. During the pulling simulation, the HK was position restrained. COMs were defined using residues belonging to the interaction interface. Trajectory snapshots were saved every 1 ps.
From the resulting trajectory, 23 evenly spaced configurations along the reaction coordinate, COMs separated by ~0.2 nm, were selected as initial umbrella sampling windows. Additional windows were added when adjacent sampling distributions failed to exhibit sufficient overlap. In such cases, intermediate windows were placed at the midpoint between neighboring states while avoiding configurations exhibiting reaction-coordinate oscillations.
The total number of umbrella windows varied between systems and was determined adaptatively based on convergence criteria. Additional windows were introduced when adjacent windows showed insufficient overlap (20%), with new windows placed at dynamically selected stable configurations along the reaction coordinate. This procedure resulted in non-uniform window spacing, including cases with separation below 0.05 nm, ensuring continuous and reliable PMF profiles.
For each window, an additional NPT equilibration and a 10 ns MD simulation were performed. The potential of mean force (PMF) for each protein pair was then calculated using the Weighted Histogram Analysis Method (WHAM) as implemented in GROMACS 2025.2 [82,83].
Simulations lengths and windows spacing were chosen to balance sampling quality with tractability across all pairwise interactions in the signaling network. Accordingly, the resulting PMFs are interpreted as representative energetics profiles suitable for comparative analysis across the interaction network rather than an absolute binding free energies for individual pairs.
An automated script, combining and improving on individual scripts by Justin Lemkul (MD setup) and Mike Harms (distance calculation), is openly available at: https://gitlab.com/PhDEMMartin/free-energy-umbrella-sampling (accessed on 17 May 2026).
All raw data, curated sequence datasets, computational scripts, modeled structures, molecular dynamics trajectories, and the full implementation of the interface coupling index (ICI) algorithm used in this study are openly available at: https://github.com/PhDEMMartin/Interface-coupling-index (accessed on 17 May 2026).

3. Results

3.1. Two-Component Systems in Actinobacillus pleuropneumoniae

Based on protein blast analysis described in Section 2.1, ten different TCS proteins were identified in each of the A. pleuropneumoniae reference strains’ sequenced genomes. These proteins were grouped into five TCS pairs with homology to ArcB-ArcA, CpxA-CpxR, NarQ-NarP, PhoR-PhoB, and QseC-QseB. These systems have been implicated in stress adaptation, biofilm formation, metabolic regulation, and virulence in A. pleuropneumoniae, highlighting their relevance for host colonization and environmental responsiveness. Of these identified systems, only CpxA-CpxR, PhoR-PhoB, and QseC-QseB are in the same putative operon. In contrast, the remaining proteins ArcB, ArcA, NarQ, and NarP are orphans. Genomic context analysis was performed using all Actinobacillus pleuropneumoniae genomes available as complete assemblies in NCBI at the time of dataset construction (June 2021; n = 10). This represents the full set of complete genomes accessible when the analyses were conducted. Additional genomes deposited subsequently were not included, as they became available after completion of the dataset and analyses.
The architecture of TCSs in A. pleuropneumoniae suggests that these are phosphotransfer systems, except for ArcB-ArcA, which exhibits an unorthodox architecture. ArcB harbors two additional domains in its C-terminal portion, with homology to a receiver domain (REC) and a histidine phosphotransfer domain (HPt), following the catalytic and phosphorylation domain (CA). This constitutes a multidomain, unorthodox HK that forms part of multicomponent phosphorelay system [31,84,85]. To the best of our knowledge, no solved unorthodox protein complex is available from which the interaction interface could be inferred or modeled; therefore, this system was excluded from this study.

3.2. Specificity-Determining Amino Acids in Interaction Interfaces

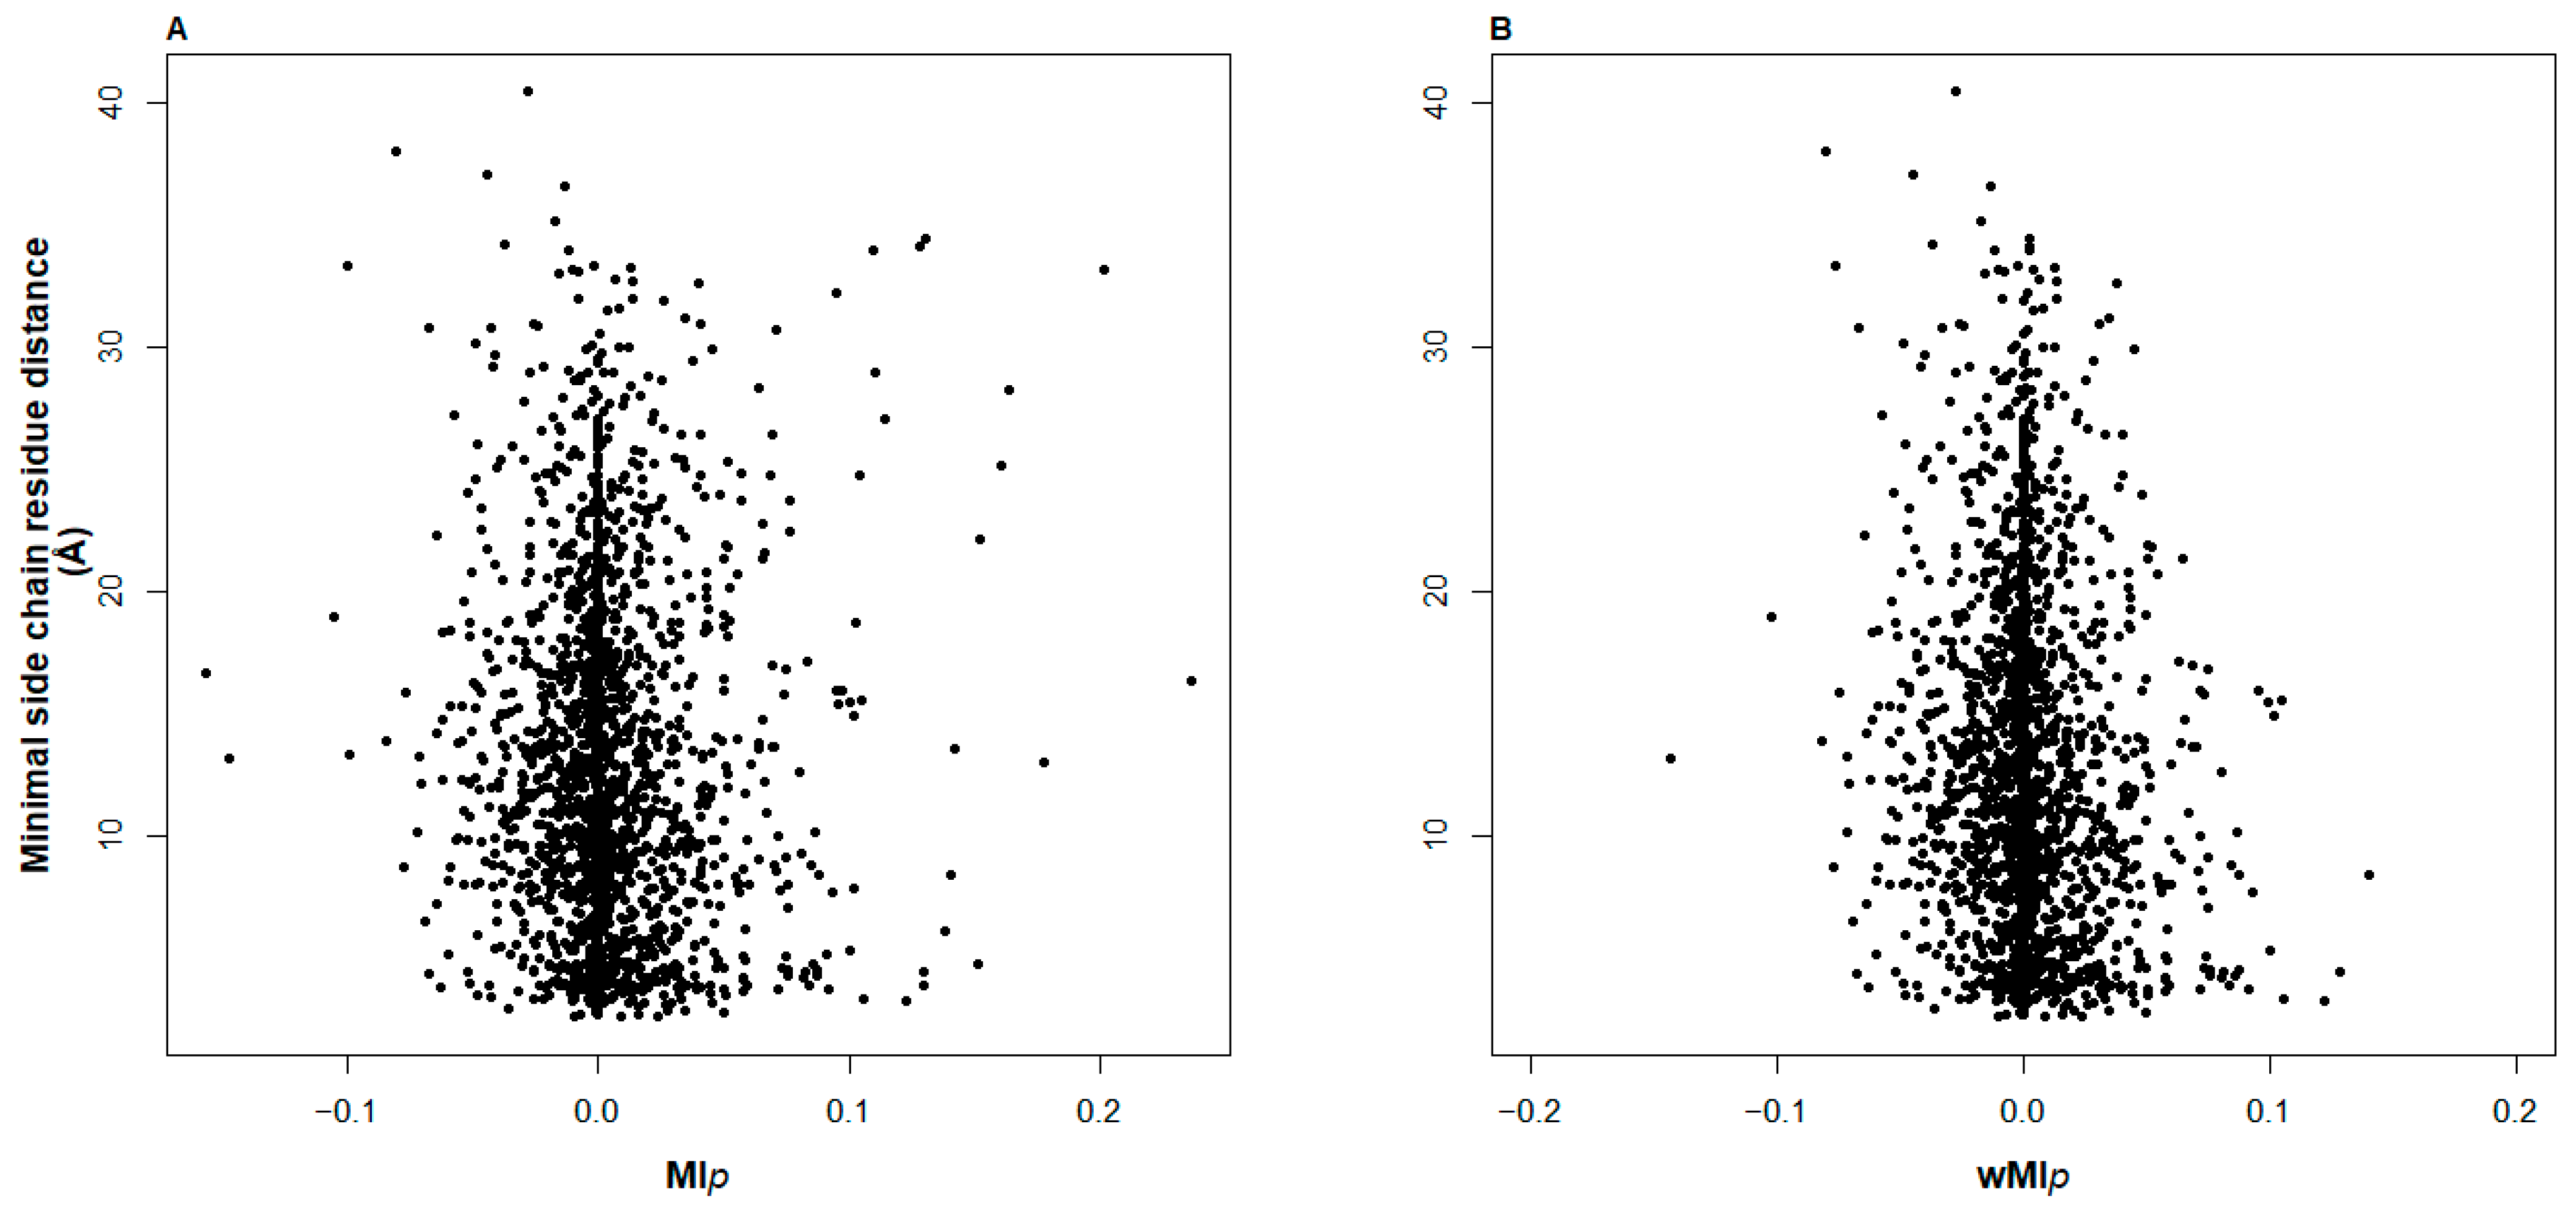
Mutual information (MI) theory is often applied to predict positional correlations in a multiple sequence alignment, to make possible the analysis of those positions structurally or functionally important in a given fold or protein family. In order to identify co-evolving positions between putative cognate prototypical TCS proteins, orthologue protein MSA datasets of prototypical TCSs coded in App were used to compute MIp. Which accurately estimates and removes background information from phylogeny and entropy, correctly identifying co-evolving positions [33]. The wMIp parameter introduced in the methodology allows for adjusting for positions that are not completely represented, while still revealing that the raw coevolutionary signal alone does not distinguish interacting residue pairs (Figure 1).
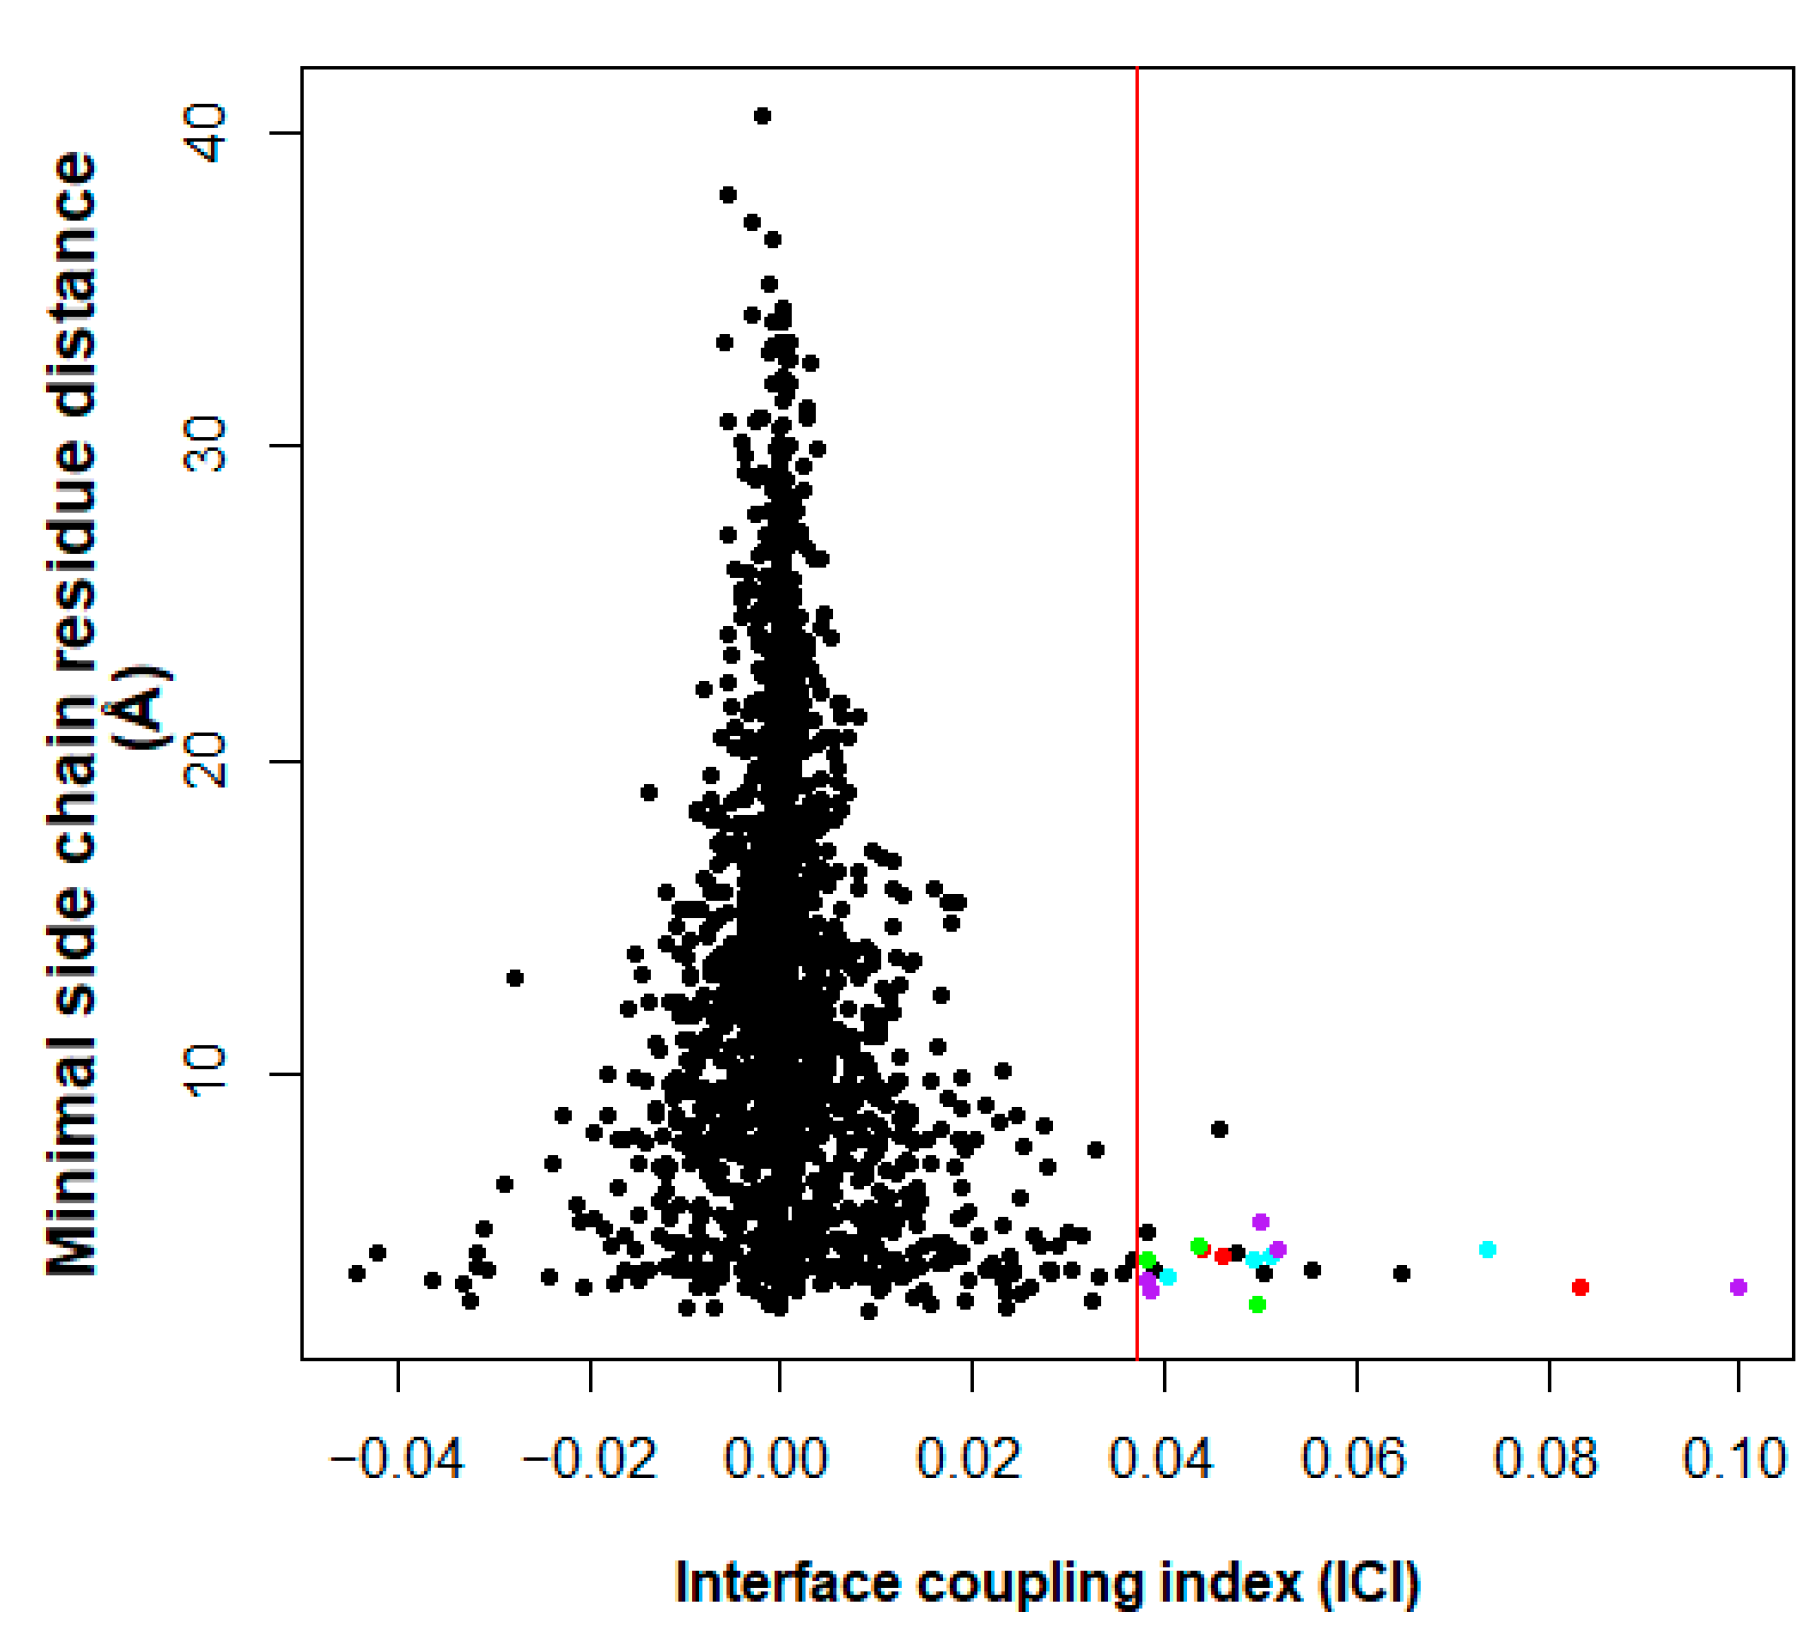
The interface coupling index (ICI) estimates both co-evolution and close contact for residue pairs, the 99 percent cutoff was used to ensure that only those amino acid pairs with the highest co-evolution rate and which were spatially nearby were selected (Figure 2).
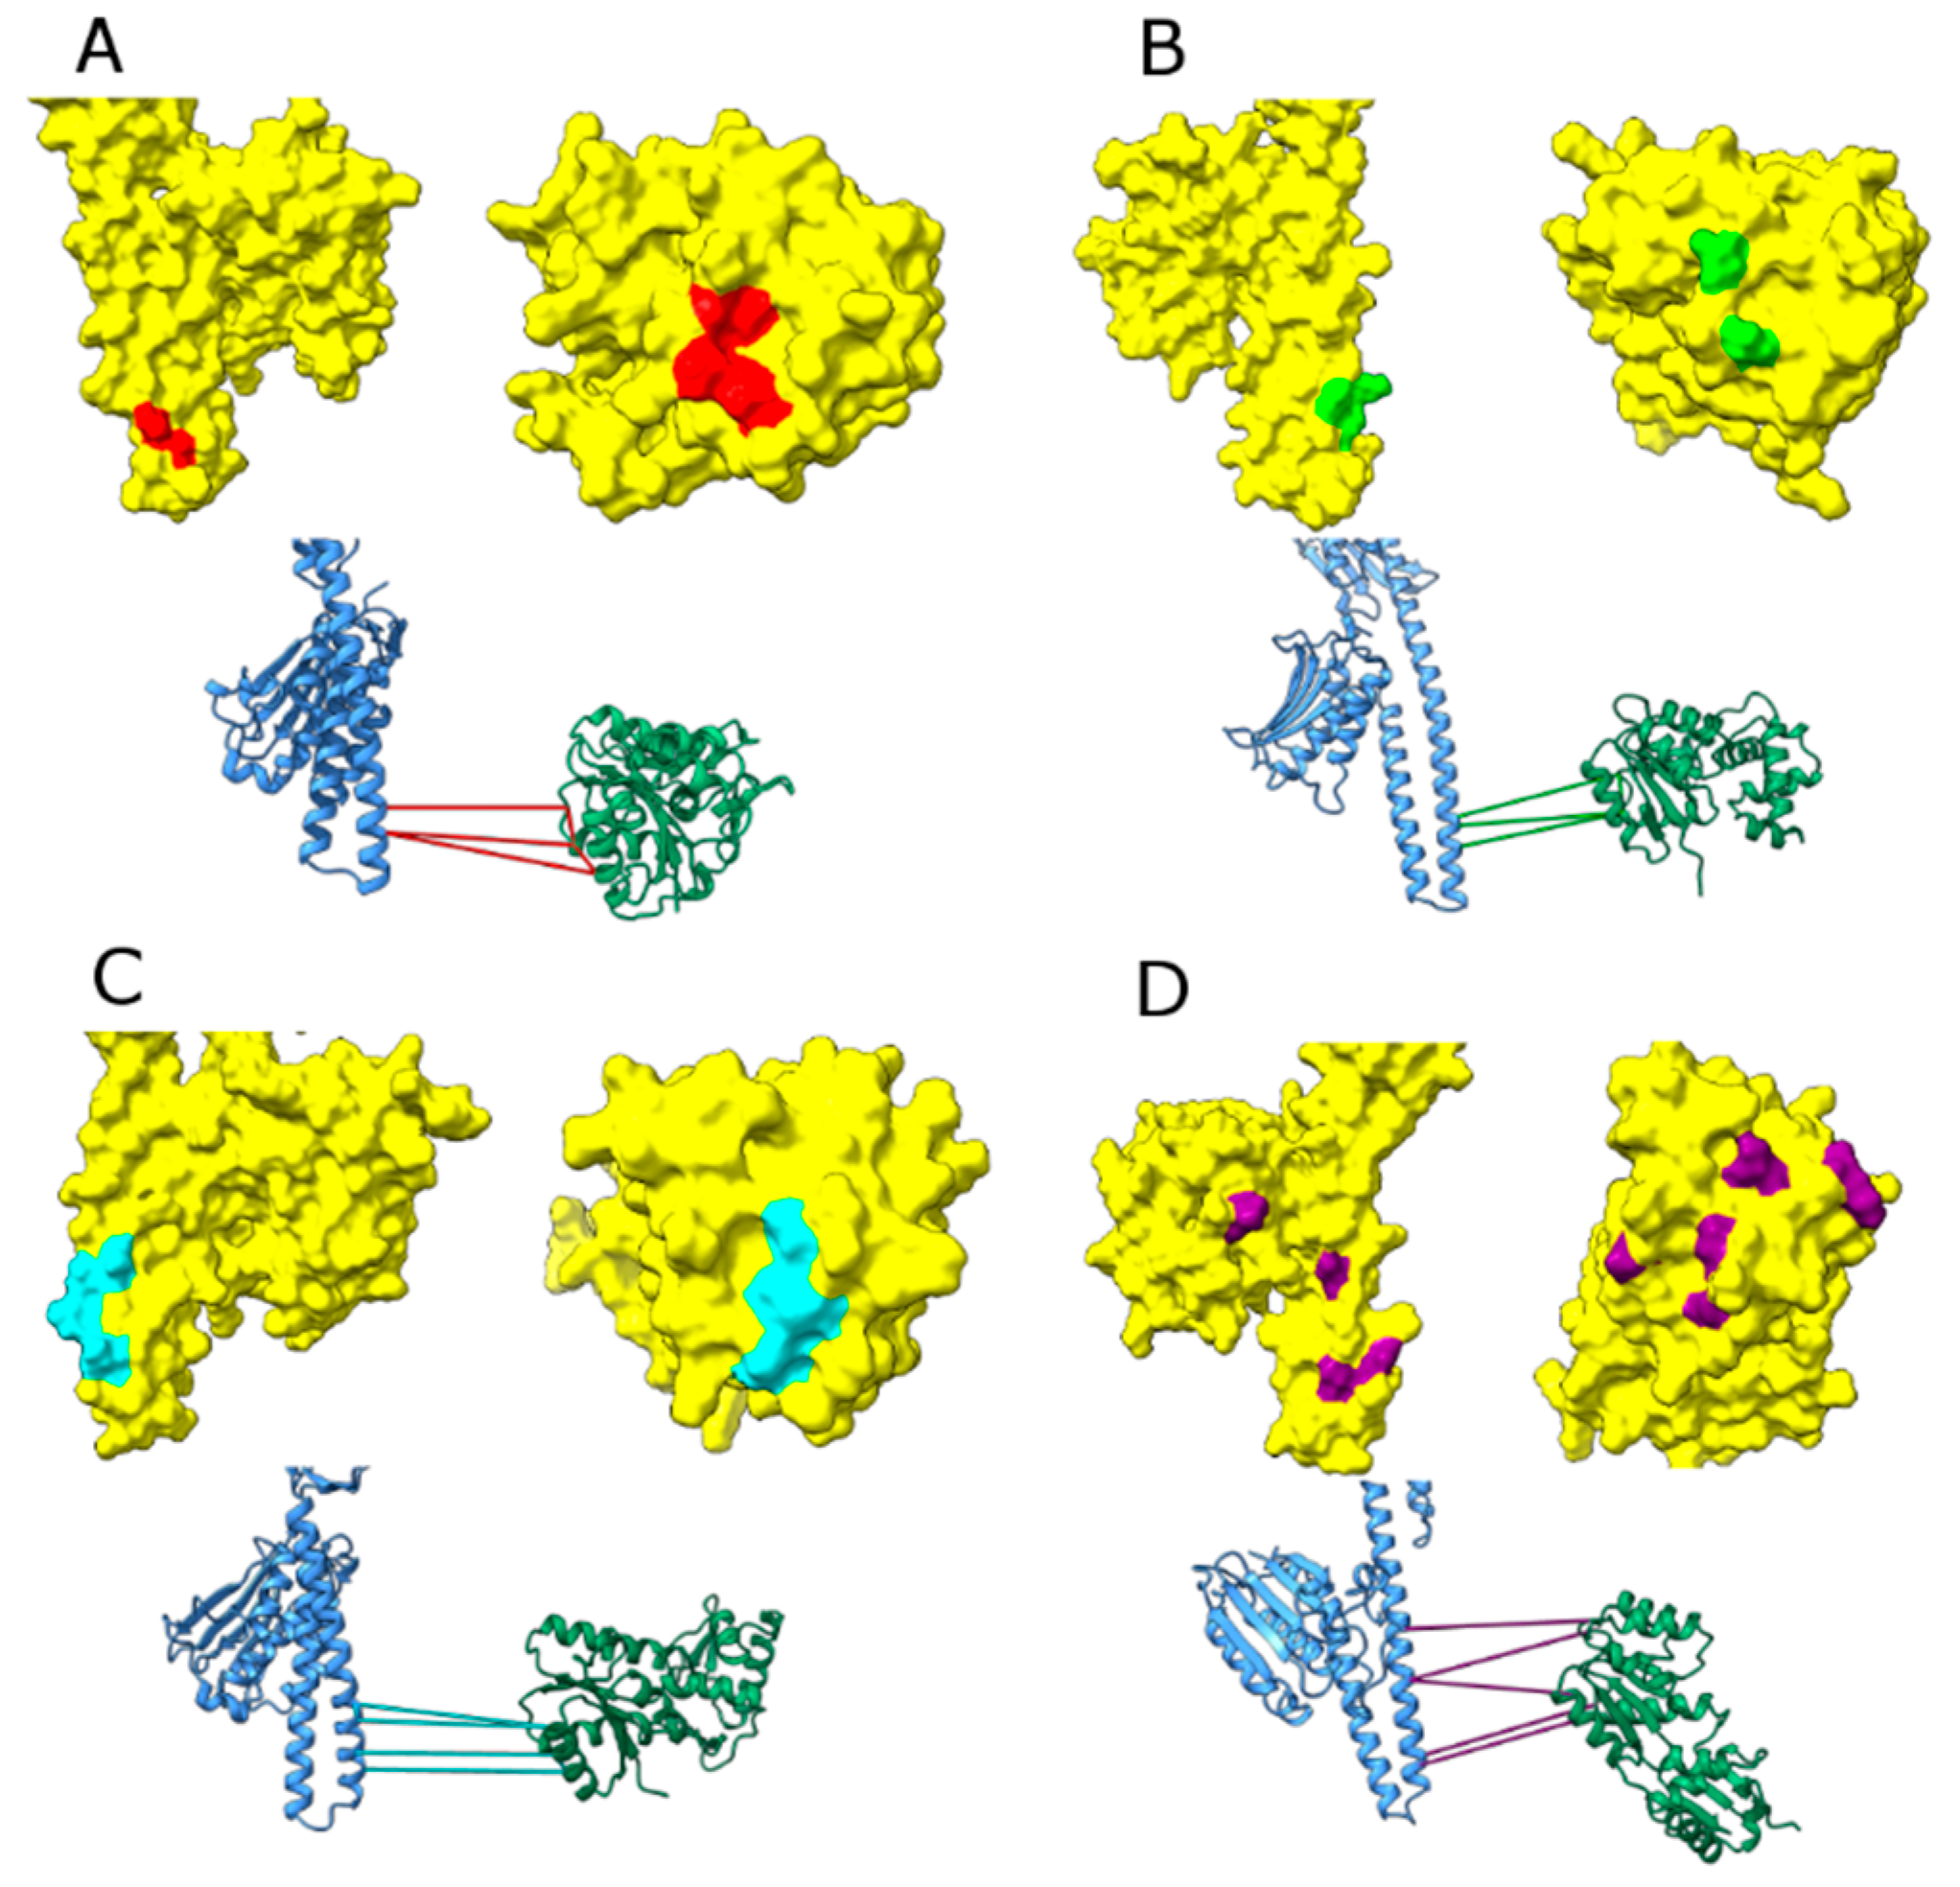
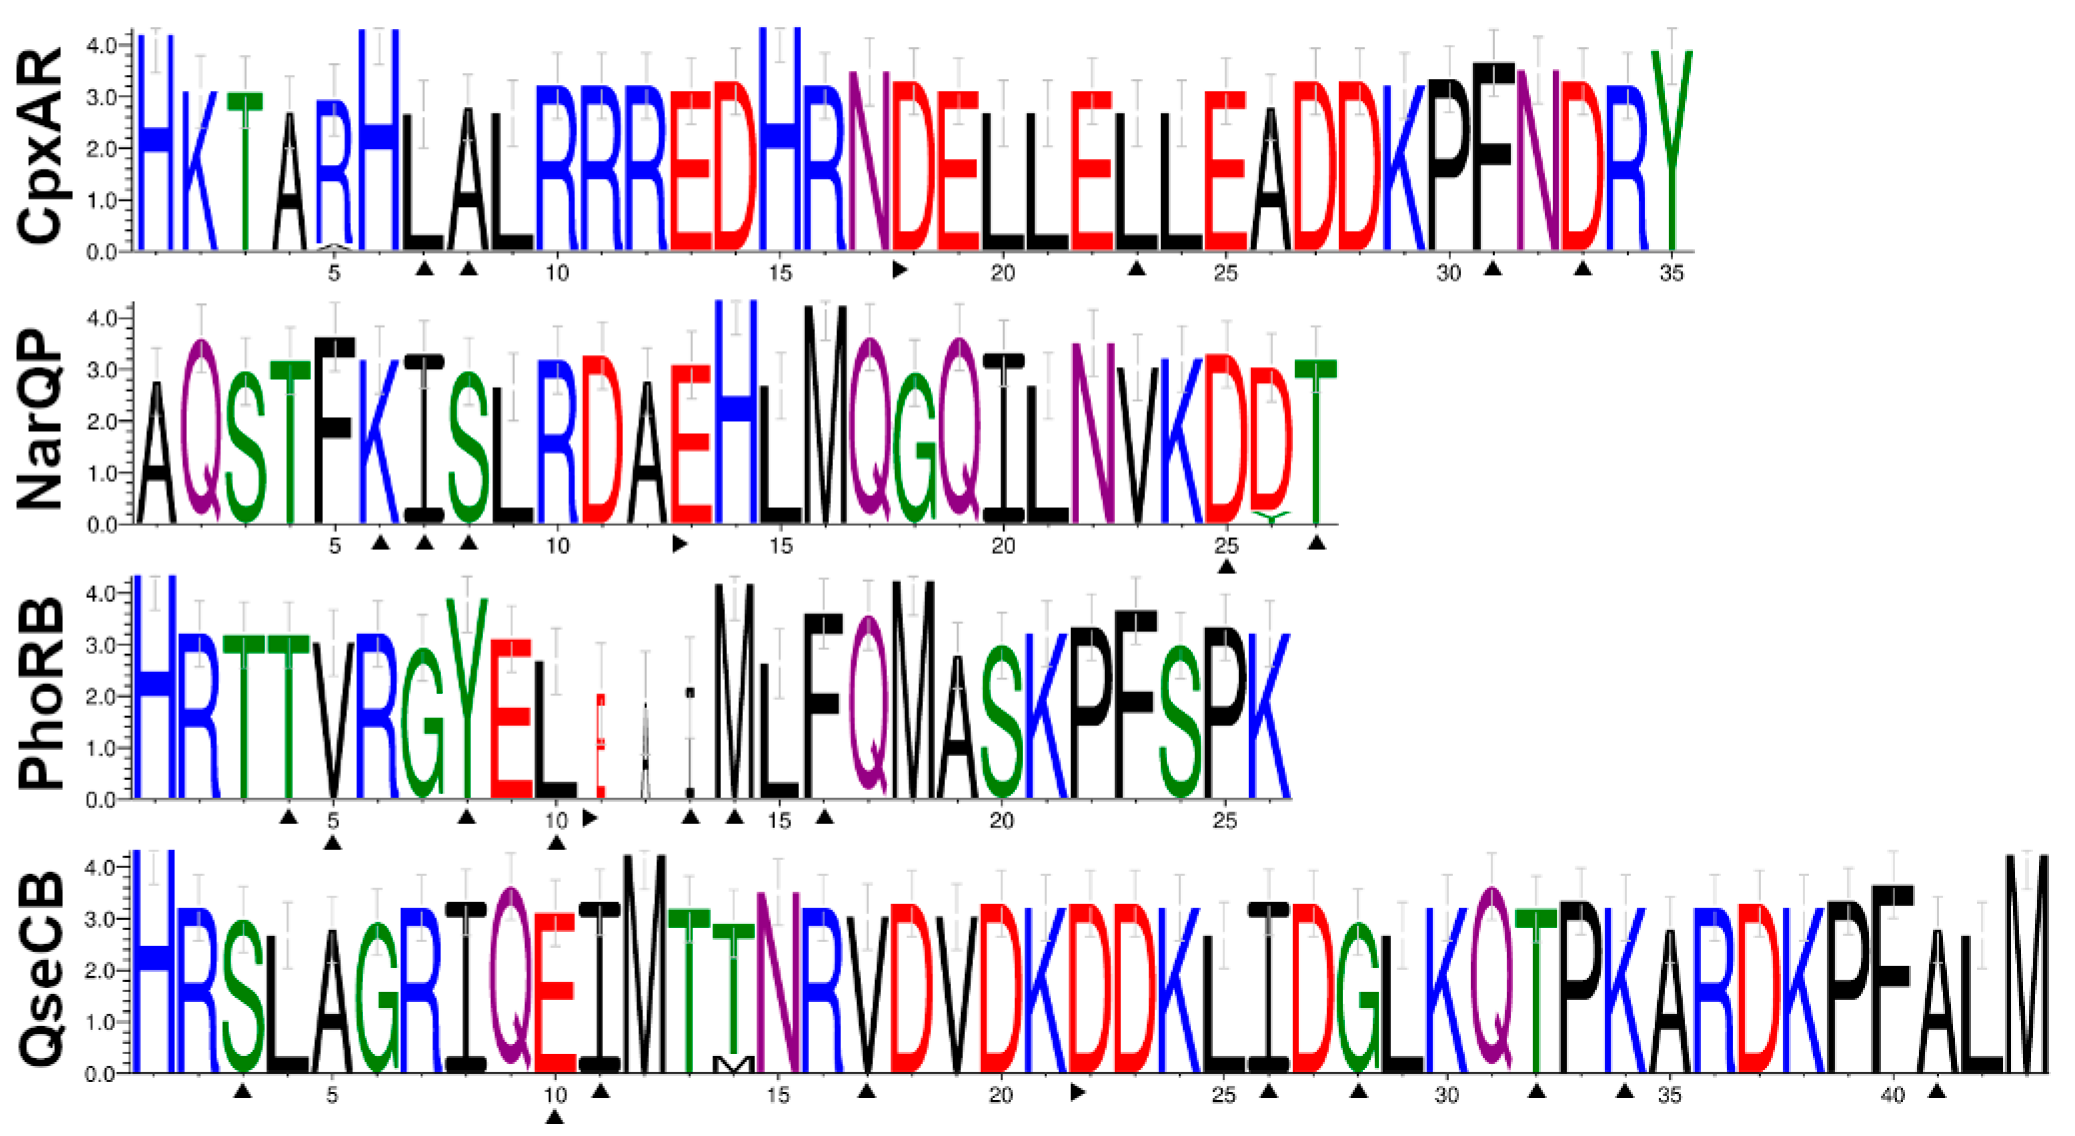
From the predicted residue pairs, clusters emerged for each system. The pattern distribution among systems forms clusters of neighboring residue pairs with varying ICI values (Figure 3 and Table 1). Cluster formation is system-specific and amino acid chemical identity and frequency are distinct among systems (Figure 3 and Figure 4 and Figure S1). A lysine in positions 29, 24, 21, and 38 corresponding to CpxR, NarP, PhoB, and QseB, respectively, is the only chemical identity highly conserved that is shared among response regulators. OmpR family’s response regulators share the consensus KPF which is spatially near the phosphoacceptor aspartate in the α5-β5 loop from the RR’s tridimensional models (Figure S1). Even though some residue positions are completely conserved in different systems’ MIIs, their individual or cumulative contribution cannot be assessed directly by methods that rely on mutual information theory, for it is an inherent liability in its calculations.
These results define the symmetric constraints governing cognate recognition at the interaction interface in the analyzed systems.

3.3. Binding Energy of Wildtype and Mutant Cognate Systems from OISC

To assess how well the interface coupling index (ICI) identified amino acid pairs that confer TCS specificity, umbrella sampling coupled to WHAM analysis was performed for both wildtype and mutant complexes [81,82]. Mutants were generated by substituting all ICI-predicted specificity pairs to alanine. For each system, free binding energy (ΔG) and ΔΔG relative to wildtype were calculated and error estimation was based on 50 bootstraps [83]. The free binding energies calculated for the complexes are in accordance with affinities of transient interactions typical for TCS.
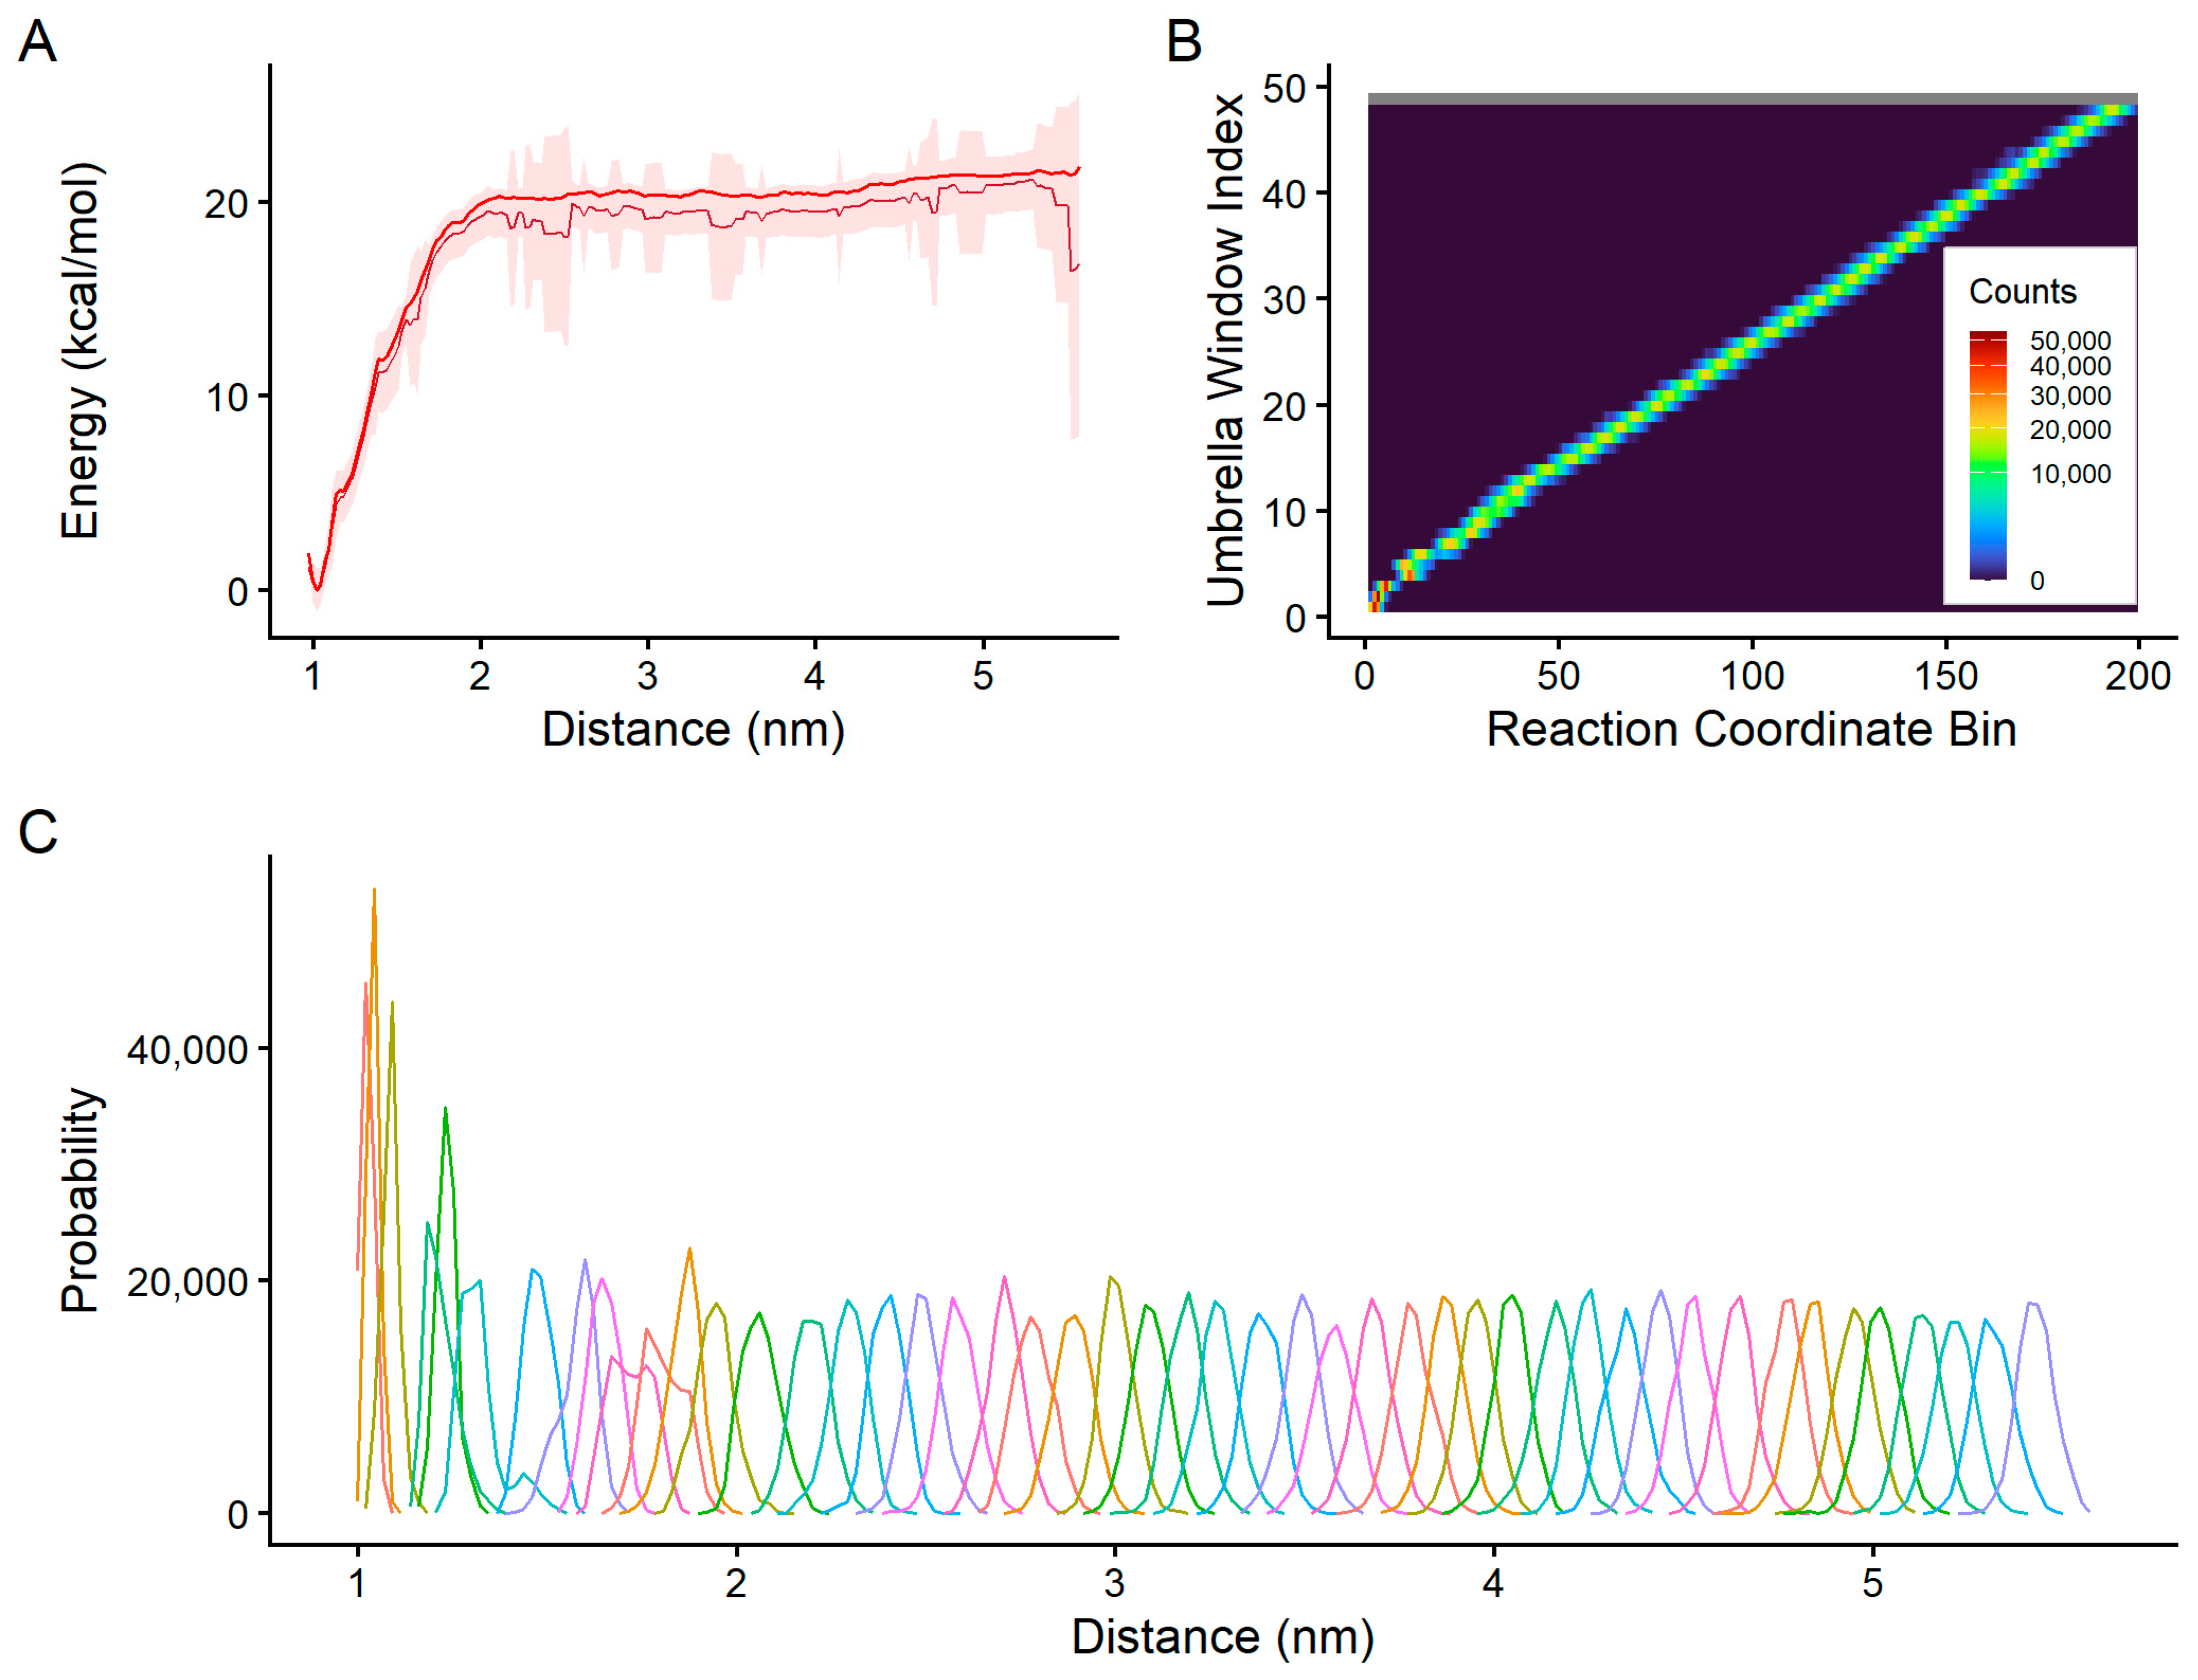
The dissociation free-energy profiles were estimated using umbrella sampling along the center-of-mass separation coordinate (Figure 5 and Supplementary Figure S3). Convergence diagnostics demonstrate substantial overlap between adjacent umbrella windows and continuous sampling along the reaction coordinate (Figure 5), indicating appropriate window spacing and stable sampling.
To ensure the robustness of the free-energy estimates, we performed multiple complementary convergence analyses. First, all PMF profiles exhibited clear plateaus at large separations, indicating convergence of dissociation free energies (Figure S2). Second, histogram overlap analysis confirmed consistent overlap across the entire reaction coordinate, supporting reliable WHAM reconstruction (Figure 5 and Figure S3). Third, time autocorrelation functions of the reaction coordinate showed rapid and consistent decay across all systems (including cognate, non-cognate, and mutant complexes) indicating efficient configurational decorrelation and absence of longed-lived correlations (Figure S4). Similar behavior was observed for all umbrella sampling simulations performed in this study.
Together, these independent diagnostics demonstrate that the umbrella sampling simulations are well converged and that the reported energetic differences are quantitatively robust.
Across cognate interactions, mutations resulted in a loss of binding affinity (positive ΔΔG) in three out of four systems. The most pronounced effect was observed for CpxAR (ΔΔG = +8.19 kcal/mol) and NarQP (ΔΔG = +6.19 kcal/mol), supporting that the ICI-predicted residues contribute to cognate molecular recognition. PhoRB showed a modest ΔΔG of +2.09 kcal/mol. Unexpectedly, QseCB exhibited stronger binding in the mutant that in the wildtype complex (ΔΔG = −6.87 kcal/mol (Table 2 and Figure S2).
To investigate this unexpected result, we compared the equilibrated bound-state conformations of WT and mutant QseCB complexes. Structural analysis revealed local remodeling of interface residue participation within the docking surface following alanine substitution. However, refined interface-specific analyses showed that the mutant and WT complexes maintain broadly comparable buried interfacial surface area, backbone interface RMSD, and minimum interfacial distances throughout the bound-state trajectory. These observations suggest that the enhanced affinity of the alanine-substituted mutant does not arise from increased interface burial or large-scale conformational stabilization, but rather from local energetic redistribution and altered interaction topology within the remodeled binding interface.
This indicates that interface-level constraints are necessary but not sufficient to predict energetic discrimination beyond cognate interactions.

3.4. Non-Cognate Interaction Binding Energies of Wildtype Proteins

To analyze whether these symmetric interface constraints are sufficient to explain specificity at the signaling network level, cognate and non-cognate binding energies were calculated.
Non-cognate interaction energies showed broader variation and were highly system-dependent (Table 3). Some histidine kinases, such as NarQ, retained strong affinity for multiple non-cognate response regulators, suggesting promiscuity or substrate competition (Figure S2). Moreover, the distance between the histidine and aspartate for phosphate transduction is too far apart.
While other, such as PhoR, displayed more discriminatory behavior. It is worth mentioning that non-cognate interactions were modelled using a docking tool HADDOCK the complexes here portraited are those that had the highest probability according to the tools ranking [80,86,87].
However, these docked configurations do not remain artificially stabilized upon molecular dynamics relaxation, as reflected by their heterogeneous free-energy profiles (Figure S2) and the frequent sampling of non-reactive His–Asp distances (Figure S5).
These results highlight that specificity within these TCSs is highly modulated at a system level through the combined effects of molecular recognition, cognate vs. non-cognate substrate competition, and histidine kinase phosphorylation and phosphatase activities. These contributions are governed by geometric and interfacial features, including relative orientation, catalytic residue distances, interface compatibility, and buried surface area.
Notably, catalytic geometry alone does not explain the observed specificity. Analysis of His–Asp distances shows that similar or even shorter separations can occur in non-cognate pairs complexes (Figure S5), indicating that catalytic proximity permissive but not selective for productive signaling interactions.
Thus, while molecular recognition is symmetrically constrained at cognate protein interfaces, discrimination across this network emerges asymmetrically through differential energetic profiles.

4. Discussion

Two-component systems’ signal transduction is based on the formation of a transient complex between Histidine Kinases (HKs) and Response Regulators (RRs), in which an interaction interface forms between heterodimers. These systems couple environmental cues and metabolic states to appropriate cellular responses through activation of downstream biochemical pathways. Pathway specificity is achieved by different mechanisms: HK phosphatase activity over its cognate RR due to non-cognate activation [88,89,90], substrate competition between cognate and non-cognate RRs [91,92,93,94], spatiotemporal localization of cognate components or regulatory elements [95,96,97,98,99,100,101], and, fundamentally, molecular recognition between cognate HKs and RRs [32,36,54,55,63], upon which the other mechanisms ultimately depend. Molecular recognition is the intrinsic ability of HKs and RRs to recognize their cognate partner through interface interactions. Hence, it was rationalized that orthologue cognate interface composition can be thoroughly analyzed for co-evolving and close contact amino acid residues, inferring TCS system-wide insulation and intra-system selectivity. TCS specificity is then, the capability of a system to effectively recognize its cognate component over non-cognate substrates.
Laub proposed that the system-wide kinetic preference of HKs for their cognate RRs is a fundamental mechanism by which bacterial cells maintain the insulation of two-component signaling pathways [102]. Insulation is then defined as the capability of an orthologue two-component system to discriminate and choose cognate over non-cognate network components [102].

4.1. Interface-Level Discrimination and Symmetric Molecular Recognition

Understanding precisely how proteins discriminate between cognate and non-cognate partners at the molecular level has remained elusive. Solid evidence supports molecular recognition as the primary force for cognate proteins’ specific recognition, though the fine underlying effect of the residues that result in specificity has not been thoroughly established. Measuring MI over multiple sequence alignments generated by substantial numbers of protein sequences from diverse paralogue proteins from a single family creates a sample selection bias, in which the composition of the MSA overrepresents some protein families relative to others [32,48,50,51]. Therefore, the results are suitable for the whole protein family, though lack the sensitivity to distinguish differences among paralogous systems. However, this trade-off is understandable as larger datasets provide more statistical certainty.
The approach here envisioned attempts to pinpoint specificity-determining residues in the interaction interface throughout two-component systems’ paralogous families (Table 1). Co-evolution was computed from whole HK-RR concatenated sequences and correlated with structural information, to comprise all information available and preserve the in vivo relationship between interacting proteins. Unlike previous works where only the DHp and REC domains were used to compute co-evolution among protein residues [32,48,50,51]. Moreover, the present does not deprecate columns that have gaps thus using all available information in the protein sequences by weighing their contribution as the joint pair occupation observed divided by the total number of sequences in the MSA. This methodology combines structural, biological, physicochemical, and biophysics data to improve specificity prediction in protein–protein interactions.
Residue pairs with high ICI values are considered to confer specificity to orthologous cognate proteins and to insulate components of paralogous system. In contrast, low values correspond to residue position that are either redundant, highly variable, or spatially distant, features that suggest a limited role in recognition or specificity (Table 1).
Predicted pairs of residues with high ICI values are located on the α1 and α5-β5 loop from the RRs and α1 and α1-α2 loop from the HKs (Table 1 and Figure 3), these findings are in accordance with previously published experimental and computational data [32,48,54,64,92]. Emerging specificity clusters are mostly formed by spatial neighboring residue pairs in the interaction interface with varying ICI values (Figure 3) which are defined collectively as Orthologue Interface Specificity Cluster (Table 1 and Table 4). OISC’s size and number of residues in the MII are different among systems (Table S1). The modeled interaction interface composition for each system can be seen in the parental TCS dataset sequence logos (Figure S1) enabling a detailed analysis of the specificity determining residues, their relations, and interactions among them (Table 1). Making it clearer how OISC composition endows proteins the capability (trough molecular recognition) to discriminate between orthologue and paralogue proteins.
Clusters composition is system-specific, and data suggests specificity in the interaction interface is driven by the cumulative effect of neighboring residues through electrostatic, size, hydrophilic, and/or hydrophobic interaction and/or structural pockets with inter- and intraprotein associations (Table 1 and Figure 3 and Figure 4 and Figure S1). The involvement of intraprotein residues in specificity is outside the scope of the present work, though it would be interesting to assess whether these belong to structural pockets in which all components interact or if their associations are non-essential (Figure 2), this will be worked upon in the future.
The 99th percentile threshold applied to the OISC selects amino acid pairs that predominantly fall within ~5 Å of each other, a distance commonly used to distinguish true interacting residues from false positives. Specificity-determining residues emerge as extreme outliers in the joint distribution of coevolutionary coupling and spatial proximity (Figure 2). While this cutoff can be lowered, doing so increases the likelihood of including residue pairs that do not contribute to system specificity or lack structural relevance, many of which can be identified and excluded based on their spatial separation. This approach enables the identification of amino acid pairs that confer specificity toward cognate over non-cognate substrates, while preserving their spatial arrangement within the interaction interface, which is critical for defining system-specific interaction patterns.

4.2. Network-Level Asymmetric Discrimination

Molecular recognition in cognate systems is mediated by residue pairs with high ICI values, collectively defined as the Orthologue interface specificity core (OISC) (Table 1). These clusters exhibit a strong bias towards cognate interaction interfaces, reflecting symmetric coevolutionary constraint concentrated at the HK-RR interaction interface (Figure 3, Figures S2 and S5). The OISC composition varies in size, spatial arrangement, topology, chemical identity, and residue pair ICI values, effectively constituting molecular recognition fingerprints, with minimal overlap across non-cognate interfaces (Figure 3 and Table 1). The synergic and context-dependent interactions among these interface components give rise to selective molecular recognition, enabling discrimination between cognate and non-cognate substrates. Accordingly, system-wide discrimination appears to depend substantially on OISC composition across paralogous systems (Table 2). However, these findings also indicate that while interface-level recognition is necessary, insulation across paralogous systems emerges asymmetrically at the network level, with cognate components displaying system-specific energetic response that range from gradual to strongly insulated, rather than a uniform mode of discrimination (Table 3 and Figure S2).
While OISC-defined structural and coevolutionary constraints establish cognate recognition at the interface, they are insufficient to explain how insulation is enforced across the signaling network (Figures S2 and S5). Cognate HK-RR pairs exhibit symmetric mutual recognition, yet the observed interaction energetics are inconsistent with simplistic one-to-all or all-to-one models of specificity (Table 2 and Table 3 and Figure S2). Thus, ICI values reflect the strength of coevolutionary coupling between spatially nearby residues in each interaction interface (Table 1 and Figure 3 and Figure S5), rather than absolute binding energies (Table 2). Accordingly, the functional relevance of residue pairs is best evaluated within each system. Because datasets, interface geometries, and evolutionary pressures differ among systems, direct comparison of ICI values across different TCSs is not appropriate.
While the His Nε2–Asp Oδ1 distance provides a direct measure of proximity between catalytically relevant residues, the lack of correspondence between this metric and the computed free-energy profiles indicates that additional structural determinants govern interaction specificity (Table 2 and Table 3 and Figures S2 and S5). Productive interactions require not only appropriate inter-residue distances, but also correct orientation of reactive groups, complementarity between cavity and protrusion at the interface, and sufficient burial of interacting surfaces. These features, which are not captured by a single distance metric, are inherently reflected in the free-energy values, explaining the observed discrepancies between geometric proximity and binding energetics across cognate, mutant, and non-cognate systems.
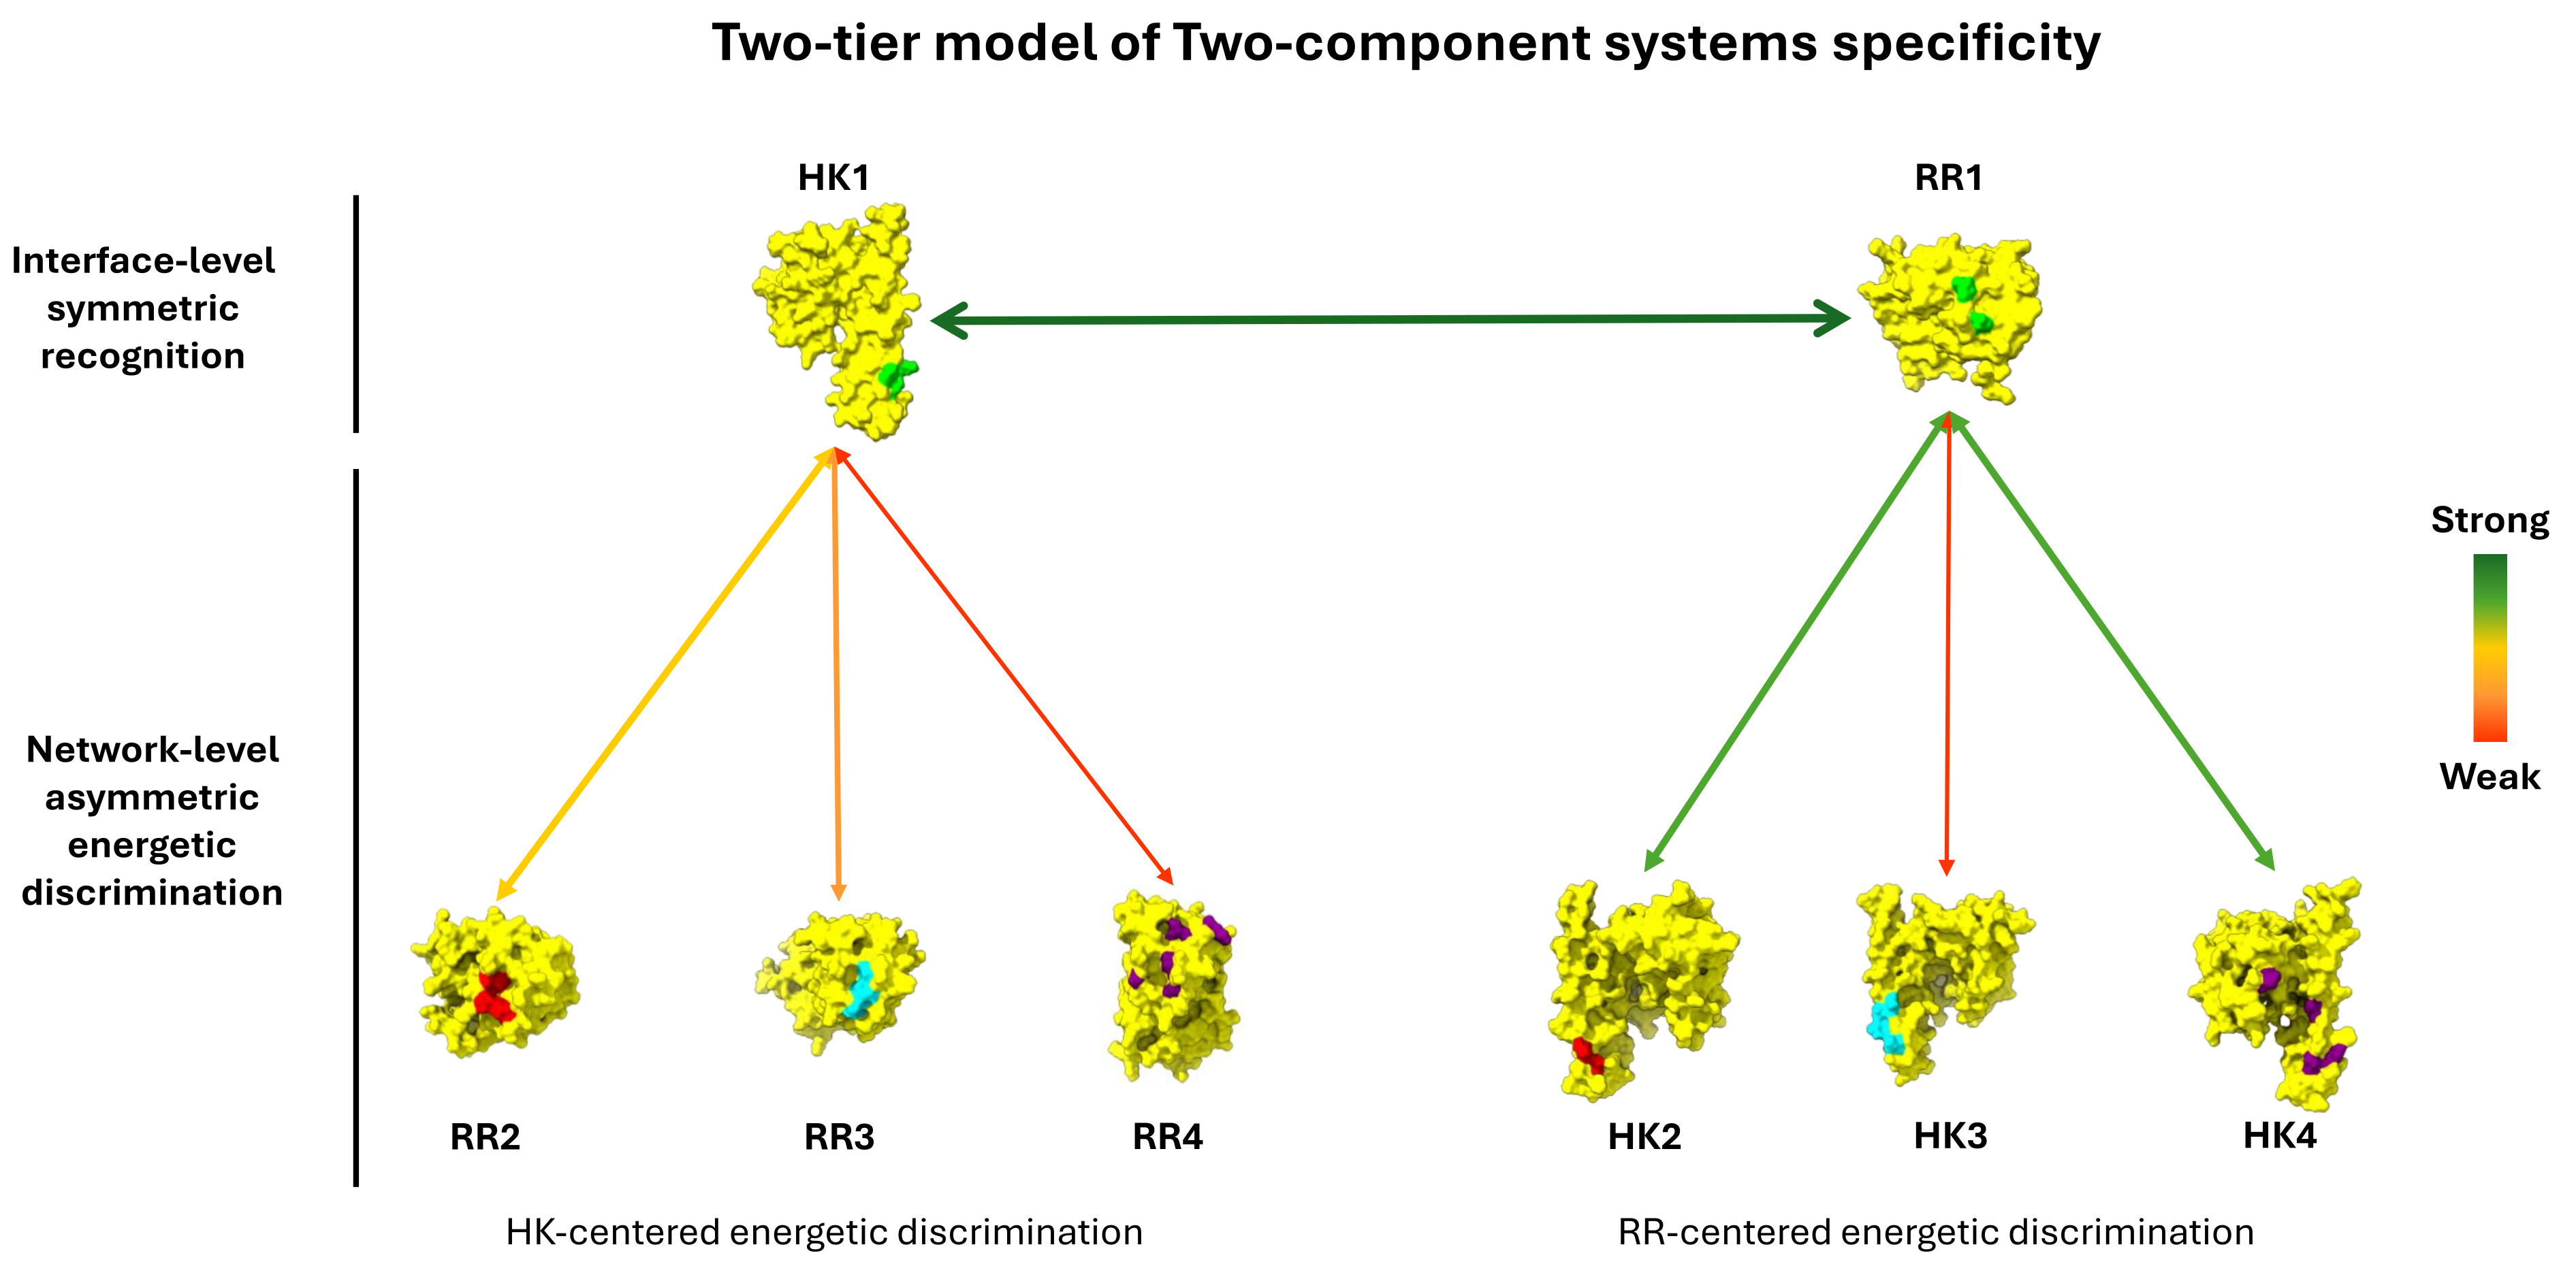
Together, these results support a two-tiered mechanism in which local geometric compatibility (Figure S5) and graded interaction energetics (Table 2 and Figure S2) are further constrained by network-level effects that enforce signaling discrimination in the analyzed TCS network (Table 3 and Figure S2). These constraints impose insulation across a continuum from weak to strong depending on system context (Table 3 and Figures S2 and S5), such that asymmetric energetic discrimination converts broadly compatible interfaces into functionally insulated signaling pathways. Within the analyzed TCS network, symmetric coevolutionary constraints shape molecular recognition at the interface, whereas asymmetric energetic discrimination governs system-wide signaling fidelity.

4.3. Interplay Between Interface Symmetry and Network-Level Asymmetry

To understand how such asymmetric discrimination can arise within structurally conserved interaction surfaces, it is necessary to consider the spatial and physicochemical constraints imposed by finite interface architecture. The architecture and structure of the interacting domains between TCS proteins are highly similar among all paralogue families, which constrains the total available interaction interface. As a result, a spatial limitation on the number of residues participating in productive contacts arises, and the maximal interaction interface is not fully realized in all protein complexes. Moreover, not all residue couplings are favorable due to steric constraints, charge compatibility, and hydropathic balance, for which docking complementarity and transient binding are fundamental.
Consequently, two traits are of primary importance: spatial availability and residue coupling. Although residue couplings arise from stochastic mutational processes, their realization within a finite interface is constrained by structural and functional requirements, resulting in a limited set of viable interaction patterns that sustain network stability. This is reflected in the non-cognate binding energies (Table 3), where several non-cognate HK–RR pairs exhibit moderately favorable interaction energies rather than uniformly unfavorable values (Table 4). These observations indicate that insulation does not arise from absolute energetic exclusion at the interface level. Rather, partial energetic compatibility and promiscuous interactions are unavoidable consequences of finite interface space and the reuse of compatible residue couplings across paralogue systems. These results suggest a potential mechanistic basis by which graded non-cognate energetics can be reconciled with robust signaling insulation in the two-tiered model (Table 2, Table 3 and Table 4 and Figure S2).
While promiscuity is often interpreted as reduced specificity, it can alternatively reflect the presence of multiple energetically accessible interaction states within a single interface (Table 4) [53]. Environmental or mutational perturbations bias the system toward distinct functional states without abolishing binding (Table 3). Such energetic promiscuity therefore underlies context-dependent signaling behavior emerging from the interaction network.
Specificity is maintained through spatial permutations of residue couplings that do not overlap productively within the interaction interface (Figures S2 and S5), consistent with the patterns described by the OISC (Table 1). As the number of paralogue systems increases in an organism and orphan systems become more prevalent, the reuse of compatible residue couplings intensifies, making these patterns increasingly important for maintaining network stability and function. Together, these considerations provide a conceptual framework for understanding how asymmetric energetic discrimination can arise within structurally conserved interfaces.

4.4. OISC and System-Wide Network Discrimination

System-specific analysis further illustrates how OISC composition varies among paralogues (Table 1 and Table 4). The PhoRB system is described first, as most of its edges have been reported previously; systems containing novel edges are addressed thereafter. A three-coordinate reference scheme is employed: positions followed by r indicate the residue’s relative position with respect to the referred RR; positions followed by a indicate the corresponding MSA column; plain numbers represent the absolute position in the protein sequence.
PhoRB’s edge T10r–N16r (T543a–N944a) is consistent with previous reports [52,64], although in the modeled heterodimer this pair corresponds to L228–F21 in A. pleuropneumoniae. Three residues previously reported to be involved in molecular recognition T220 (T4r|T535a), V221 (V5r|V536a), and Y225 (Y8r|Y540a), were also identified here [37], together with their corresponding residue pairs I14 (I13r|I937a), I14 (I13r|I937a), and M17 (M14r|M940a), respectively (Table 1). These residue pairs may contribute to the formation of a hydrophobic pocket, as suggested by Podgornaia et al. 2013 [36,64]. The ability of the ICI to recover residue pairs already known to influence PhoRB molecular recognition, based on structural or biochemical assays, supports the reliability of the predictions and increases confidence in the residue pairs identified for systems that have not been thoroughly studied before (Figure 2 and Table 1).
PhoRB exhibits an asymmetric free energy profile at the level of the cognate pair, in which PhoB shows low compatibility with non-cognate HK partners, while PhoR displays generally unfavorable interactions except for CpxR, which is phylogenetically closer (Table 3). This intra-pair asymmetry demonstrates that network-level specificity is not uniformly distributed, but partitioned between components within this system, with insulation preferentially associated with the RR in this context (Table 4).
CpxAR’s OISC consists of three edges in which the CpxA surface involved is predominantly positively charged, whereas the corresponding CpxR surface is predominantly negatively charged. A previous report showed that mutation P109D in OmpR, among others, enabled phosphorylation by CpxA; likewise, mutations E257A, V250T, and Y254L introduced to RstB allowed partial phosphorylation by of CpxR [54]. Of these, residues D105 (D33r|D780a), A269 (A8r|A391a), and L266 (L7r|L388a) correspond to mutations P109D, E257A, and Y254L, respectively. These positions are present in the predicted OISCs (Table 1), supporting the capability of this methodology to identify residue pairs that contribute to molecular recognition.
CpxA exhibits a graded free energy interaction profile with non-cognate response regulators, whereas CpxR maintains favorable interactions with multiple non-cognate histidine kinases (Table 3). This distinction highlights an asymmetric distribution of network-level energetics, with variability concentrated in the HK and relative stability in the RR (Table 4).
NarQP has three edges in its OISC; of those, the K389–D108 (K6r–D25r|K739a–D1137a) interaction is electrostatically highly favorable [103]. In this system, the OISC composition between parental and species-specific datasets changes the most among the TCSs studied, not only in residue identities but also in physicochemical properties (Table 1 and Figure 4 and Figure S1). Although this residue pairing exhibits favorable opposite charge statistical compatibility, the ΔΔG between wildtype and mutant NarQP does not directly or proportionally reflect a loss associated with compatibility (Table 2). This apparent discrepancy indicates that binding energetics are influenced by synergistic and context-dependent interactions not explicitly captured by pairwise compatibility alone. In this system, an asymmetric interaction profile emerges in which NarP displays a more permissive binding behavior, whereas NarQ appears more insulated (Table 3 and Table 4). This contrasts with OmpR-family systems and reflects a distinct structural organization in which catalytic residues are spatially decoupled from the primary interaction interface.
This behavior is consistent with the structural characteristics of the NarL/FixJ subfamily. In the modeled NarQP heterodimer, the conserved histidine of NarQ responsible for phosphotransfer is located outside the predicted interaction interface and is separated by 12.11 Å from the conserved aspartate of NarP (Table 2 and Figure 3 and Figures S1 and S5), indicating a distinct spatial organization compared to OmpR/PhoB systems. Accurate prediction for the NarL/FixJ subfamily remains limited by the lack of resolved co-crystal structure for this subfamily. While the inclusion of NarX/NarL paralogues may dilute the coevolutionary signal, the method remains sufficient to identify energetically relevant residue pairs (Table 1 and Table 2). Together, these observations support an alternative docking arrangement in NarL/FixJ systems (Figure S5), leading to a distinct interaction interface in which energetic outcomes are not directly proportional to individual residue-pair compatibility [64].
This decoupling between interface coupling and energetic outcome becomes more pronounced in QseCB. This system exhibits the most extensive OISC network, with the highest number of residue pair edges among all systems in this TCS network, as well as the highest individual ICI value and the largest inter-residue separation (Table 1). Despite exhibiting the most extensive OISC network and strongest coevolutionary coupling, the mutant displays a more favorable binding free energy than the wildtype (Table 2 and Table 4). This inversion demonstrates that strong interface-level coupling does not necessarily correspond to maximal energetic stabilization, directly challenging a purely interface-driven model of specificity. Instead, QseC operates as a permissive node at the network level, maintaining compatibility across multiple partners, while QseB remains comparatively insulated (Table 3 and Table 4). While the increased alanine content in the mutant may enhance local packing and van der Waals contributions (Figure S5), the more favorable binding free energy is better interpreted within the context of the network-level model, where QseC operates across both cognate and non-cognate favorable interactions (Table 3 and Table 4, and Figure S2). Under this framework, wildtype QseC may be tuned to maintain compatibility across multiple partners rather than to maximize affinity for its cognate, consistent with its role as a conditionally promiscuous node within the signaling network.
Accordingly, network-level discrimination emerges asymmetrically, with histidine kinases and response regulators exhibiting distinct interaction profiles across paralogous partners (Table 4). Rather than a uniform mode of specificity, each component contributes differently to insulation, resulting in a directional and system-dependent energetic architecture.
Some of the aforementioned pairs have been identified before [32,52,54], though this is the first time that residue pairs have been determined for distinct systems. Previously unreported co-evolving positions are due to us further dissecting the TCS family in orthologues and assessing them as paralogues.
It is suggested that changes to components of these interface networks will substantially modify the overall molecular recognition capability of any system, rendering the system unable to efficiently discriminate cognate from non-cognate proteins (Table 2). Moreover, changes to a given interface network will directly affect a cognate system, but it is possible that the whole signaling network becomes unstable and considerable crosstalk arises among paralogue systems [52,54,92,104].
Even though it would be interesting to analyze the ICI value and relations among amino acid pairs, their contribution to specificity and discrimination in vivo cannot be inferred by the current method. In addition, their contribution is highly context-dependent and could be synergetic, non-additive, or epistatic. The predicted interface networks could be used as an a priori inference to assess the in vivo context dependency and synergetic contribution of vertex edges and their network. Major molecular recognition disruption can be achieved by substituting residue pairs with opposing chemical properties, the same charge, or greater size. Hence, replacing any of these residues will lead to intersystem promiscuous paralogue interactions, such behavior has been reported for PhoR [52].
On the other hand, replacing residue pairs that match another paralogue system’s OISC can result in rewiring specificity, though the exact outcome will depend on the residues being substituted due to context dependency and spatiotemporal interactions with other components of the interaction interface [32,52,54,64]. Withal, HK and RR interface mutants from the literature highlight the importance of coevolving HK-RR interaction interfaces to the system-wide discrimination, avoiding detrimental crosstalk between paralogue TCSs or eliciting slight crosstalk as functional or salvaging mechanism from deleterious loss of HKs or RRs [37,70,71,79,83,84,85].
The complete rewiring of a system would require the cumulative effect from more interacting residues than those present in the system’s OISC, which might be present in lower percentiles; however, lowering the filtering threshold would increase the detection of false positives with the present methodology. Moreover, residues that are completely conserved among orthologue interfaces should not be overlooked; although their contribution cannot be directly measured by methods such as the present one, in vivo experiments should identify its contribution both to intrasystem selectivity (symmetric specificity) and intersystem insulation (asymmetric insulation) (Figure S1). These factors could also explain why, in some systems, the ΔΔG between mutant and wildtype proteins is not consistent across TCS, as the individual contribution of completely conserved residues is not assessed in this study (Table 2). Taking everything into consideration, gross discrimination could be overridden and specificity significantly disrupted by substituting all components of a given OISC network (Table 1).

4.5. TCSs’ Discrimination in Actinobacillus pleuropneumoniae

Two-component systems in A. pleuropneumoniae have been associated with diverse physiological and pathogenic processes, yet their organization, specificity, and integration at the network level remain poorly understood. To date, the QseC-QseB and NarQ-NarP systems have been implicated in response to catecholamines [16,27]; regulatory targets of NarP have been identified under anaerobiosis and nitrate supplementation [24,25,26,27]; QseC-QseB has been associated with stress resistance, biofilm formation, iron acquisition, and virulence [16,27,28]; CpxA-CpxR has been linked to biofilm formation, stress adaptation, adhesion, metabolism, and virulence [17,18,19,20,21,22,29,38]; and ArcBA has been related to central metabolism, biofilm formation, and virulence [14,15]. Notably, A. pleuropneumoniae is a highly prevalent pathogenic bacterium that forms mono- and multispecies biofilms and successfully accomplishes host colonization, infection establishment, nutrient acquisition, metabolic adaptation, and persistence within the host, despite encoding a relatively limited repertoire of environmental sensory systems [2,3,16,17,18,39,40,41,42,43,44,45,46]. These observations suggest that signal discrimination and integration in A. pleuropneumoniae are achieved through a two-tiered mechanism rather than by a strict one-to-one correspondence between environmental cues and individual HK-RR pairs.
Sequences from all sequenced A. pleuropneumoniae strains were used to build MSAs and retrieve the species-specific MII (Table 1 and Figure 4). Comparison with the parental datasets support that species-specific OISCs largely preserve parental residue composition, albeit with distinct system-specific configurations (Figure 4 and Figure S1). Consequently, interaction interface discrimination is both system-dependent and species-specific: interfaces are differentially insulated yet collectively maintain system-wide discrimination against non-cognate substrates (Table 2 and Table 3). Cognate interfaces are preferentially recognized through symmetric OISC composition, while non-cognate asymmetric energetics modulate the final network discriminatory outcome. Interface composition is the primary source of TCS specificity, enabling selective recognition of cognate partners while maintaining insulation of non-cognates interfaces in a two-tiered architecture.
Strain-specific variations further illustrate how network insulation can persist despite local perturbations. In most A. pleuropneumoniae strains PhoB lacks critical residues from the acidic pocket that coordinate Mg2+ or other divalent ions that catalyze the phosphorylation of the conserved aspartate from the phosphorylation site [105,106]. This should disrupt PhoB’s ability to phosphorylate, hindering the downstream signaling cascade of phosphate starvation response mediated by the PhoR-PhoB system, with inorganic phosphate (Pi) as its specific stimulus [107,108,109]. Likewise, the MII lacks, in most cases, one residue that contributes to specificity, I14 (I13r|I937a), as only 5 out of 25 sequences retain this initial portion of the RR (Table 1, Figure 4 and Figure S1) [64]. Strains 1 4074, 18-1342, G1-9626, S8, and S4074 are the only ones that encode a fully functional PhoB, hence a completely functional PhoR-PhoB signaling pathway and its OISC. No compensatory changes were detected in the OISC from strains that have truncated versions of PhoB; the composition is similar to that of the parental interaction interface and is conserved across all observed strains (Figure 4 and Figure S1). Therefore, intersystem discrimination of non-cognate substrates is maintained over salvaging crosstalk (Table 3) [52,110].
CpxR proteins from A. pleuropneumoniae strains 2 4226, 2 S1536, 3 JL03, and NCTC10976 have an 18 amino acid gap. None of the missing residues belong to the interaction interface from CpxA-CpxR; however, the gap starts after CpxR P731a, which alters the overall tridimensional structure of the protein and slightly modifies the docking properties, although the MII in both models is quite similar. The discrimination capability of this system might be hindered to some extent, though not thoroughly compromised, as strains 2 S1536 and 3 JL03 are prevalent swine pathogens in Europe and China, respectively [7,10,44].
NCTC11383 is the only strain that presents a fragmentary NarQ sensor protein, and it is missing the conserved histidine, leading to a nonfunctional HK and a hampered upstream signaling pathway. By contrast, the QseC and QseB proteins in A. pleuropneumoniae do not have any noteworthy features, thus a fully functional QseCB system is encoded in every strain.
Interestingly, the contrasting transcriptional response of the QseCB and NarQP systems to epinephrine (EPI) and norepinephrine (NE) can be explained by considering the asymmetric energetic architecture of the TCS signaling network rather than strict cognate specificity [27]. QseC has been described as a sensor with multiple proposed input signals; however, its interaction interface with QseB exhibits less favorable energetics relative to other cognate pairs in A. pleuropneumoniae (Table 2). Mutations in the QseC-QseB OISC indicate that the wildtype interface is submaximal and not energetically favorable for exclusive cognate interaction (Table 2 and Table 3), supporting the notion that a single sensory input does not necessarily lead to a unique downstream output. In contrast, the NarQ-NarP pair, which responds to the specific stimulus nitrate, exhibits strong cognate predilection and effective insulation from non-cognate response regulators (Table 2 and Table 3) [24]. Consistent with these features, QseC displays comparable or stronger energetic compatibility with NarP than with its cognate partner, suggesting it functions as a conditional signaling hub capable of modulating NarP activation depending on network state and environmental cues.
Within this framework, the literature reports that EPI exposure is associated with increased qseB, qseC, and narQ expression alongside repression of narP, a pattern consistent with increased competition for response regulator substrates and with known regulatory properties of HKs [27]. Histidine kinases have been shown to modulate output specificity through shifts in kinase–phosphatase balance toward their cognate RRs [65,88]. These network conditions would favor QseB activation. Conversely, NE downregulates qseB, qseC, and narQ while selectively increasing narP expression, reducing substrate competition and exposing the insulated NarQ-NarP axis, favoring NarP activation [27]. Although direct phosphorylation, phosphatase, or enzymatic activities were not assayed here, these published transcriptional patterns are compatible with network-level redistribution of signaling flux driven by differential HK and RR abundance combined with the asymmetric interaction energies measured in this study.
Together, these observations support an asymmetric model in which specificity emerges not from uniformly strong cognate interfaces, but from graded energetic compatibilities that are selectively accommodated at the network level. This framework explains previously reported hormone dependent regulatory behaviors of the QseC-QseB and NarQ-NarP without invoking ligand-specific receptor activation alone, and instead highlights the role of weak or permissive interfaces in enabling context dependent signal routing [27]. Importantly, this two-tiered model does not exclude ligand sensing; rather, it reframes ligand input as a bias imposed on pre-existing signal topology. Under conditions where a single stimulus predominates, the network may yield a focused response, whereas multiple concomitant environmental cues can be integrated through energetically asymmetric interactions to produce an adaptive, combinatorial output. In this way, a limited number of encoded TCSs can respond to a far broader and context dependent repertoire of environmental cues and metabolic responses.
Therefore, interaction interfaces may operate within a spatial constrained permutational framework coupled with asymmetric energetic discrimination, offering a mechanistic basis for how bacteria such as Myxococcus xanthus and Geobacter sulfurreducens achieve system-wide discrimination despite encoding hundreds of TCSs [111]. Even though, at the prices of systems showing asymmetric promiscuity. Though further research of bigger two-component system networks will be required to support this suggestion as now it relies only on predictions from a small network. Collectively, the interaction interfaces form a tridimensional puzzle in which symmetric interface complementarity and physicochemical properties enable cognate recognition locally, while asymmetric energetic profiles across paralogous interfaces enforce pathway insulation at the network level. This model considers the coordinated behavior of multiple, structurally related yet compositionally distinct interfaces encoded within the same species-specific signaling network.

4.6. Limitations and Interpretation of Energetic Modeling

For some HK-RR pairs, multiple plausible docking configurations were identified by HADDOCK, indicating that more than one interaction geometry may exist for a given interaction pair. The present analysis does not attempt to enumerate all such local minima; instead, it captures dominant interaction modes sufficient to assess relative discrimination and system-wide specificity (Table 2 and Table 3). A complete description of interactions between non-cognate pairs would require extensive computation of free energy values across all probable configurations and appropriate weighting of their contributions. While this is outside of the scope of the current work, a detailed mechanistic understanding of these transient non-cognate interactions will be essential to further elucidate molecular details of how system-wide specificity is achieved.
Moreover, coupling the current molecular dynamics framework with quantum mechanics–based simulations would provide a clearer view of how geometric constraints and substrate competition shape robust TCS signaling. Such approaches could also enable evaluation of catalytically competent configurations by explicitly accounting for the steric bulk of the bound phosphate during phosphotransfer between HK and RR residues, as well as conformational transitions between inactive and active states.
Additionally, the free-energy calculating methodology employed here does not explicitly account for system-specific differences in the underlying energy protein complex interaction. This is reflected in the observations that some systems required a greater number of umbrella sampling windows than others (Table 2 and Figure 5 and Figure S3). Accordingly, a more detailed description of individual mechanistic processes may require tailored pulling protocols, allowing for reduced uncertainty and a more accurate characterization of system-specific interaction dynamics.
The use of Alphafold multimer modeling that predicts the tridimensional structure of interacting proteins based on their amino acid sequence allowed to infer a more adequate interaction interface and enhance the performance of the measurements for it uses structural data to determine specificity components [69,70,71,72]. Moreover, solving crystals for more interacting proteins in complex for diverse TCS families must be highlighted as Alphafold relies heavily upon MSA and homology modeling, some protein structures that are not thoroughly represented in the databases might present biases in the modeled structure.
Despite some drawbacks, there are also strengths to this methodology. The exponential growth in the total number of available genomes from organisms completely or partially sequenced and the availability of tools that predict protein structure will allow the creation of datasets big enough to describe or model putative interacting interfaces from TCSs that are rarely distributed, such as hybrid HKs, HPt, CheA, LytTR, PleD, PrrA or YesN, just to mention a few [111]. The forgoing coupled to an algorithm that considers variables such as size-volume, charge, and hydropathicity compatibility as well as tridimensional docking complementarity will provide more reliable results in the assessment of interaction interface specificity components. Enhancing the current understanding of the systems’ capabilities to discriminate among cognate and non-cognate components, enabling modeling more complex TCS system-wide networks from prokaryote or archaeal organisms.

4.7. Implications for Network-Level Specificity and Future Directions

Mutual information has been used in several methods to predict residues involved in protein–protein interactions [32,47,48,53,103]. These approaches typically rely on multiple sequence alignments restricted to domains known to interact, whereas the present method aims to detect subtleties specific to individual systems by using complete protein sequences to compute coevolution (Table 1). Consequently, although MI was computed for each MSA, these raw values may be less predictive than in previous studies due to dilution of coevolutionary signals.
To the best of our knowledge, spatiotemporal properties of TCS networks have not been thoroughly investigated [95,96,100,101]. It has been reported that RRs are present at concentrations ~35-fold higher than their corresponding histidine kinases [112,113,114]. It would therefore be of interest to determine whether this relative abundance is time-dependent, as persistent excess of RRs could place non-cognate complexes in continuous substrate competition with cognate ones. Such a mechanism could contribute to biochemical buffering or modulation of cellular responses at the network level.
Amino acid pairs from specificity interaction interface components were calculated from datasets built from approximately 2500 genomes available at the time [115]. The datasets were built only of orthologue sequences, thus describing the whole orthologue’s family specificity. Therefore, this systematic procedure serves to infer species-specific system-wide TCSs’ specificity in bacteria. The interface specificity from the components of the network is context-dependent and species-specific and will depend on the total number, type, architecture, and phylogeny of the systems coded (Table 1). Within this context, signaling fidelity reflects not from any particular optimal interface, but in the emergent outcome of graded interface compatibility accommodated by the organization and composition of the signaling network (Table 2 and Table 3). Importantly, asymmetric discrimination operates along a continuum rather than a binary on/off threshold, enabling flexible signal routing within the same network architecture.
Bacterial two-component system networks comprise phosphotransfer and phosphorelay systems, our current methodology is unable to describe hybrid or unorthodox interaction interfaces. This arises as a liability to describe system-wide signal transduction networks and highlights the lack of work done over hybrid, unorthodox, or components from seldom-found families. Solving crystals of interacting proteins from these systems will clarify the interaction interface from different TCS architectures and families, solving docking properties from HK-RR heterodimer formation and allowing the assessment of differences and similarities among interaction interfaces and how these properties emerge into a highly modulated system network.
A fundamental implication of the present framework is that there exists a limit to the diversity of residue coupling patterns that can be encoded within a finite interaction interface while maintaining effective signaling insulation. As this combinatorial space becomes saturated, the reuse of compatible residue couplings becomes unavoidable, progressively reducing the distinctiveness of interaction patterns and increasing the likelihood of crosstalk or network destabilization. Characterizing this limit, and the strategies by which biological systems accommodate or circumvent it, represents an important direction for future work.

4.8. Similar Works

EVcomplex similarly infers interaction residues based on coevolutionary signals; however, it does not explicitly incorporate molecular dynamics into its framework and relies on static structural representations derived from solved crystal complexes or homology models. As such, it does not directly account for the thermodynamic and physicochemical properties of protein–protein interactions. In contrast, the present methodology uses modeled interaction interfaces as a starting point to compute ICI values, allowing energetic evaluation of residue-pair contributions, whereas EVcomplex provides probable docking configurations based on inferred coupling values [50]. While EVcomplex benefits from automated dataset generation, these datasets are often assembled using paralogous proteins, which may reduce sensitivity to system-specific features. Additionally, reliance on static three-dimensional structures may limit capture of attributes unique to the proteins under study that emerge from dynamic behavior.
A conceptually related approach was used to infer amino acid pairs conferring interaction specificity in the ParD-ParE toxin–antitoxin system. In that work, co-evolution among residues was measured, and the highest-scoring residue pairs were mapped onto the ParD-ParE crystal structure, successfully identifying specificity-determining residues; however, structural information was not incorporated directly into the computational inference, nor were biochemical or biophysical properties of the complex explicitly considered [53].
At a broader scale, a Bayesian framework has been applied to predict global TCS signaling network interactions, including systems containing orphan components, without resolving the molecular basis of interaction specificity [51]. Although this approach does not address how specificity is achieved at the interface level, its predictive power is well suited for inferring system-wide connectivity in organisms with several orphan systems. Such network-level predictions could be naturally integrated with the present methodology to further investigate how specificity is enforced among all TCSs within a given organism. In the case examined here, explicit network inference was not required, as three of the five encoded systems are co-operonic and their connectivity can be straightforwardly inferred.
Taken together, these observations support the proposed two-tier framework in which interface-level molecular recognition and network-level energetic discrimination collectively govern signaling specificity in the analyzed TCS network. These findings are synthesized in the following Conclusions Section 5.

5. Conclusions

This study demonstrates that specificity in the A. pleuropneumoniae two-component system signaling network cannot be explained by interface molecular recognition alone but instead emerges from a two-tiered mechanism integrating symmetric interface constraints with asymmetric, network-level energetic discrimination (Table 4). Using the Interface Coupling Index (ICI) in combination with protein–protein interaction modeling, molecular dynamics, and free-energy calculations, cognate recognition is established locally within each interaction interface through conserved, coevolving residues, while system-wide insulation arises from energetic compatibility across the ensemble of paralogous interfaces in the signaling network.
At the interface level, specificity is mediated within each cognate interface by clusters of coevolving residue pairs, defined here as the Orthologue Interface Specificity Core (OISC), that confer selective molecular recognition between cognate histidine kinases and response regulators. These residues, primarily located on the response regulator α5-β5 loop and paired with histidine kinase α1 and α2, assemble into spatially neighboring residue clusters within each interaction interface, including previously unreported positions that contribute to paralogue discrimination. However, while these symmetric interface constraints are necessary to establish cognate pairing, they are insufficient to explain signaling fidelity across the network.
At the network level, specificity and insulation emerge through asymmetric energetic discrimination across the full set of cognate and non-cognate interfaces, many of which remain energetically permissive yet functionally filtered at the network level. Graded free-energy profiles reveal that broadly compatible interfaces can coexist with robust pathway insulation, indicating that signaling fidelity reflects the integration of local molecular recognition with system-level energetic context, rather than the existence of particular optimal interfaces. While energetic compatibility provides the structural basis for asymmetric discrimination, its functional consequences are modulated in vivo by kinase–phosphatase balance and substrate competition among network components [88]. This framework reconciles the coexistence of interface promiscuity with stable signaling architectures and provides a mechanistic explanation for how bacteria encoding a limited number of two-component systems can exhibit context-dependent responsiveness to diverse environmental cues and cellular responses, consistent with the behavior observed in the analyzed TCS network.
In A. pleuropneumoniae, specificity within the analyzed TCS network is structured by asymmetric energetic discrimination, with limited evidence for intrinsic compensatory rewiring among paralogous systems. This suggests that once network-level insulation is established, signaling stability reflects properties of the collective architecture rather than plasticity of individual interfaces. Consequently, disruption of a single component may not immediately destabilize the broader signaling network.
From a biological perspective, this energetic organization suggests a mechanistic basis for how A. pleuropneumoniae may coordinate diverse regulatory responses associated with environmental adaptation and host colonization while preserving signaling fidelity. Rather than enforcing strict exclusion of non-cognate interactions, graded energetic discrimination across paralogous interfaces is compatible with context-dependent modulation of biofilm formation, metabolic adaptation, and virulence-associated pathways reported for these systems [116]. In this view, network stability and adaptive flexibility arise from collective energetic constraints that govern signal integration across the TCS repertoire. Such an architecture may help explain how A. pleuropneumoniae maintains robust environmental responsiveness during host colonization despite encoding a relatively limited set of two-component systems.
Importantly, the framework developed here is not inherently restricted to two-component systems. By integrating coevolutionary coupling with comparative free-energy landscapes, this approach provides a generalizable strategy for dissecting specificity in transient protein–protein interaction networks, demonstrated here in the context of TCS signaling. Thus, beyond elucidating natural signaling architectures, such quantitative mapping of compatibility and discrimination facilitates the rational analysis and potential rewiring of complex signaling systems.
Taken together, these results support a two-tier model in which symmetric interface-level recognition defines structurally permissible interactions, while asymmetric energetic discrimination across the network governs signaling specificity (Table 4). In this framework, specificity emerges not as a binary property of individual complexes but as a system-level balance between compatibility and discrimination shaped by the collective organization of the network.
While the present study is limited to a defined set of two-component systems within a single organism, the framework established here provides a basis for systematically linking coevolutionary constraints, structural organization, and interaction energetics in signaling networks. Future work integrating experimental validation, expanded system sampling across larger paralogous networks, and systematic exploration of alternative docking orientations and interface geometries for both cognate and non-cognate complexes, together with explicit modeling of kinetic processes, will be essential to further refine and generalize this model. More broadly, this approach offers a conceptual and quantitative foundation for understanding how specificity emerges in complex paralogous systems, with potential applications in the design and engineering of synthetic signaling networks.

Supplementary Materials

The following supporting information can be downloaded at https://www.mdpi.com/article/10.3390/computation14060123/s1: Figure S1. Modeled interaction-interface positions derived from the original orthologous two-component system datasets (Table S1). Triangles below the y-axes indicate positions belonging to the orthologue interaction specificity core (Figure 3 and Table 1). Amino acid frequencies are shown in bits; a right-facing triangle marks the beginning of the response regulator (RR). Amino acid chemical properties are color-coded as follows: polar (green), neutral (purple), basic (blue), acidic (red), and hydrophobic (black); Figure S2. Potential of mean force (PMF) profiles describing unbinding free energies as a function of center-of-mass separation for histidine kinase–response regulator (HK–RR) complexes. For each HK, PMFs are shown for the cognate RR alongside non-cognate RRs, enabling direct comparison of specificity and interface perturbation effects. Cognate pairs are highlighted with thicker traces (WT) and darker hues (nALA multi-alanine interface mutant), whereas non-cognate interactions are shown as thinner, more transparent lines. PMFs are plotted on their native free-energy scales without artificial alignment, preserving absolute ΔΔG differences between systems. All PMF profiles exhibited stable plateaus at large separation, indicating convergence of the dissociation free-energy estimates; Figure S3. Convergence diagnostics for representative umbrella sampling simulations. Histogram overlap plots and sampling convergence maps are shown for three representative systems: (A) PhoR–NarP non-cognate interaction, and (B) QseC–RR nALA interface mutant. Adjacent umbrella windows exhibit substantial overlap across the reaction coordinate, indicating appropriate window spacing for WHAM reconstruction. Sampling convergence maps show continuous diagonal distributions corresponding to restrained window centres, confirming stable sampling and absence of gaps along the coordinate. Similar behaviour was observed for all umbrella sampling simulations performed in this study; Figure S4. Autocorrelation analysis of umbrella sampling trajectories. Time autocorrelation functions C(t) of the reaction coordinate are shown for all simulated systems. Cognate pairs (colored lines scheme as used throughout the manuscript) and non-cognate or mutant systems (grey lines) exhibit similar decay profiles, indicating comparable sampling efficiency and absence of long-lived correlations. The consistent and relatively rapid decay of C(t) across systems supports adequate decorrelation of configurations within the sampled time window; Figure S5. Distance between catalytically relevant residues (His Nε2 and Asp Oδ1) for cognate and non-cognate response regulator interactions across four two-component systems: CpxA–CpxR, NarQ–NarP, PhoR–PhoB, and QseC–QseB. The analyzed residue pairs correspond to 255H–52D, 378H–57D, 213H–52D, and 249H–51D, respectively; combinations with non-cognate catalytic residues are also shown. Distances were computed from 10 ns molecular dynamics simulations. Cognate interactions (wild-type and mutant) are shown alongside non-cognate response regulators using a consistent color scheme across panels; mutants are depicted in darker hues. Each system exhibits a characteristic distance regime: CpxA–CpxR and PhoR–PhoB maintain compact separations (~0.5–0.8 nm), whereas NarQ–NarP adopts a more extended configuration (~1.5–1.7 nm). Mutations generally preserve the His–Asp separation within each system despite differences in their free-energy profiles. Non-cognate interactions typically sample larger separations; however, in some cases (e.g., QseC with CpxR), comparable or shorter distances are observed. These observations indicate that His–Asp proximity, even when defined using catalytically relevant atoms, does not uniquely determine interaction specificity or stability, underscoring the importance of the broader energetic and structural context; Table S1. Modeled interaction interface (MII) amino acid positions of two-component systems (TCS) in Actinobacillus pleuropneumoniae strain 1 4074.

Author Contributions

Conceptualization, E.M.M., M.J., F.J.A.-G. and A.L.G.-B.; methodology, E.M.M. and R.S.-G.; software, E.M.M.; validation, E.M.M., M.J., F.J.A.-G. and A.L.G.-B.; formal analysis, E.M.M.; investigation, E.M.M.; resources, A.L.G.-B.; data curation, E.M.M.; writing—original draft preparation, E.M.M.; writing—review and editing, E.M.M., M.J., F.J.A.-G. and A.L.G.-B.; visualization, E.M.M. and R.S.-G.; supervision, A.L.G.-B. All authors have read and agreed to the published version of the manuscript.

Funding

The present work was supported by projects from Universidad Autónoma de Aguascalientes: PIBT16-3 and PIBT12 4 from A. L. Guerrero-Barrera, and PIT14-3N and PIT16-3 from F. J. Avelar-Gonzalez. The project also was supported by Special Resource UAA for Research 2017 and 2018. CONACYT scholarship No. 297145 from E. M. Martin. Natural Sciences and Engineering Research Council of Canada RGPIN-2016-04203 from M. Jacques.

Data Availability Statement

All raw data, curated sequence datasets, computational scripts, modeled structures, molecular dynamics trajectories, and the full implementation of the interface coupling index (ICI) algorithm used in this study are openly available at GitHub: https://github.com/PhDEMMartin/Interface-coupling-index accessed on (17 May 2026). Complete simulation data for the potential of mean force (PMF) calculations are available from the corresponding author upon reasonable request due to their large file size. An automated script for free-energy umbrella sampling (US), combining and extending individual scripts originally developed by Justin Lemkul (molecular dynamics setup) and Mike Harms (distance calculations), is openly available at GitLab: https://gitlab.com/PhDEMMartin/free-energy-umbrella-sampling (accessed on 17 May 2026).

Acknowledgments

We sincerely thank Eunice Ponce de León for providing the computational infrastructure that was essential for the completion of this work.

Conflicts of Interest

The authors declare no conflicts of interest.

Abbreviations

The following abbreviations are used in this manuscript:
AppActinobacillus pleuropneumoniae
NADNicotinamide adenine dinucleotide
TCSTwo-component system
HKHistidine kinase
RRResponse regulator
DHpDimerization and histidine phosphotransfer
CACatalytic and ATP-binding
RECReceiver domain
HPtHistidine phosphotransfer domain
MSAMultiple sequence alignment
MIIModeled interaction interface
MIMutual information
MIpMutual information with average product correction
wMIpWeighted mutual information
amdAdjusted minimal distance
ICIInterface coupling index
OISCOrthologue interface specificity core
MDMolecular dynamics
USUmbrella sampling
WHAMWeighted histogram analysis method
PMFPotential mean force

References

  1. Dubreuil, J.D.; Jacques, M.; Mittal, K.R.; Gottschalk, M. Actinobacillus pleuropneumoniae Surface Polysaccharides: Their Role in Diagnosis and Immunogenicity. Anim. Health Res. Rev. 2000, 1, 73–93. [Google Scholar] [CrossRef]
  2. Chiers, K.; De Waele, T.; Pasmans, F.; Ducatelle, R.; Haesebrouck, F. Virulence Factors of Actinobacillus pleuropneumoniae Involved in Colonization, Persistence and Induction of Lesions in Its Porcine Host. Vet. Res. 2010, 41, 65. [Google Scholar] [CrossRef]
  3. Hathroubi, S.; Fontaine-Gosselin, S.-È.; Tremblay, Y.D.N.; Labrie, J.; Jacques, M. Sub-Inhibitory Concentrations of Penicillin G Induce Biofilm Formation by Field Isolates of Actinobacillus pleuropneumoniae. Vet. Microbiol. 2015, 179, 277–286. [Google Scholar] [CrossRef]
  4. Sassu, E.L.; Bossé, J.T.; Tobias, T.J.; Gottschalk, M.; Langford, P.R.; Hennig-Pauka, I. Update on Actinobacillus pleuropneumoniae -Knowledge, Gaps and Challenges. Transbound. Emerg. Dis. 2018, 65, 72–90. [Google Scholar] [CrossRef] [PubMed]
  5. Soto Perezchica, M.M.; Guerrero Barrera, A.L.; Avelar Gonzalez, F.J.; Quezada Tristan, T.; Macias Marin, O. Actinobacillus pleuropneumoniae, Surface Proteins and Virulence: A Review. Front. Vet. Sci. 2023, 10, 1276712. [Google Scholar] [CrossRef]
  6. Foote, S.J.; Bossé, J.T.; Bouevitch, A.B.; Langford, P.R.; Young, N.M.; Nash, J.H.E. The Complete Genome Sequence of Actinobacillus pleuropneumoniae L20 (Serotype 5b). J. Bacteriol. 2008, 190, 1495–1496. [Google Scholar] [CrossRef]
  7. Xu, Z.; Zhou, Y.; Li, L.; Zhou, R.; Xiao, S.; Wan, Y.; Zhang, S.; Wang, K.; Li, W.; Li, L.; et al. Genome Biology of Actinobacillus pleuropneumoniae JL03, an Isolate of Serotype 3 Prevalent in China. PLoS ONE 2008, 3, e1450. [Google Scholar] [CrossRef] [PubMed]
  8. Bossé, J.T.; Chaudhuri, R.R.; Li, Y.; Leanse, L.G.; Fernandez Crespo, R.; Coupland, P.; Holden, M.T.G.; Bazzolli, D.M.; Maskell, D.J.; Tucker, A.W.; et al. Complete Genome Sequence of MIDG2331, a Genetically Tractable Serovar 8 Clinical Isolate of Actinobacillus pleuropneumoniae. Genome Announc. 2016, 4, e01667-15. [Google Scholar] [CrossRef]
  9. Zhan, B.; Angen, Ø.; Hedegaard, J.; Bendixen, C.; Panitz, F. Draft Genome Sequences of Actinobacillus pleuropneumoniae Serotypes 2 and 6. J. Bacteriol. 2010, 192, 5846–5847. [Google Scholar] [CrossRef]
  10. Xu, Z.; Chen, X.; Li, L.; Li, T.; Wang, S.; Chen, H.; Zhou, R. Comparative Genomic Characterization of Actinobacillus pleuropneumoniae. J. Bacteriol. 2010, 192, 5625–5636. [Google Scholar] [CrossRef]
  11. Li, G.; Xie, F.; Zhang, Y.; Wang, C. Draft Genome Sequence of Actinobacillus pleuropneumoniae Serotype 7 Strain S-8. J. Bacteriol. 2012, 194, 6606–6607. [Google Scholar] [CrossRef]
  12. Pereira, M.F.; Rossi, C.C.; De Carvalho, F.M.; De Almeida, L.G.P.; Souza, R.C.; De Vasconcelos, A.T.R.; Bazzolli, D.M.S. Draft Genome Sequences of Six Actinobacillus pleuropneumoniae Serotype 8 Brazilian Clinical Isolates: Insight into New Applications. Genome Announc. 2015, 3, e01585-14. [Google Scholar] [CrossRef]
  13. Donà, V.; Perreten, V. Comparative Genomics of the First and Complete Genome of “Actinobacillus porcitonsillarum” Supports the Novel Species Hypothesis. Int. J. Genom. 2018, 2018, 5261719. [Google Scholar] [CrossRef] [PubMed]
  14. Buettner, F.F.R.; Bendallah, I.M.; Bosse, J.T.; Dreckmann, K.; Nash, J.H.E.; Langford, P.R.; Gerlach, G.-F. Analysis of the Actinobacillus pleuropneumoniae ArcA Regulon Identifies Fumarate Reductase as a Determinant of Virulence. Infect. Immun. 2008, 76, 2284–2295. [Google Scholar] [CrossRef] [PubMed]
  15. Buettner, F.F.R.; Maas, A.; Gerlach, G.-F. An Actinobacillus pleuropneumoniae arcA Deletion Mutant Is Attenuated and Deficient in Biofilm Formation. Vet. Microbiol. 2008, 127, 106–115. [Google Scholar] [CrossRef] [PubMed]
  16. Liu, J.; Hu, L.; Xu, Z.; Tan, C.; Yuan, F.; Fu, S.; Cheng, H.; Chen, H.; Bei, W. Actinobacillus pleuropneumoniae Two-Component System QseB/QseC Regulates the Transcription of PilM, an Important Determinant of Bacterial Adherence and Virulence. Vet. Microbiol. 2015, 177, 184–192. [Google Scholar] [CrossRef]
  17. Auger, E.; Deslandes, V.; Ramjeet, M.; Contreras, I.; Nash, J.H.E.; Harel, J.; Gottschalk, M.; Olivier, M.; Jacques, M. Host-Pathogen Interactions of Actinobacillus pleuropneumoniae with Porcine Lung and Tracheal Epithelial Cells. Infect. Immun. 2009, 77, 1426–1441. [Google Scholar] [CrossRef]
  18. Deslandes, V.; Denicourt, M.; Girard, C.; Harel, J.; Nash, J.H.; Jacques, M. Transcriptional Profiling of Actinobacillus pleuropneumoniae during the Acute Phase of a Natural Infection in Pigs. BMC Genom. 2010, 11, 98. [Google Scholar] [CrossRef]
  19. Li, H.; Liu, F.; Peng, W.; Yan, K.; Zhao, H.; Liu, T.; Cheng, H.; Chang, P.; Yuan, F.; Chen, H.; et al. The CpxA/CpxR Two-Component System Affects Biofilm Formation and Virulence in Actinobacillus pleuropneumoniae. Front. Cell. Infect. Microbiol. 2018, 8, 72. [Google Scholar] [CrossRef]
  20. Yan, K.; Liu, T.; Duan, B.; Liu, F.; Cao, M.; Peng, W.; Dai, Q.; Chen, H.; Yuan, F.; Bei, W. The CpxAR Two-Component System Contributes to Growth, Stress Resistance, and Virulence of Actinobacillus pleuropneumoniae by Upregulating wecA Transcription. Front. Microbiol. 2020, 11, 1026. [Google Scholar] [CrossRef]
  21. Liu, F.; Yao, Q.; Huang, J.; Wan, J.; Xie, T.; Gao, X.; Sun, D.; Zhang, F.; Bei, W.; Lei, L. The Two-Component System CpxA/CpxR Is Critical for Full Virulence in Actinobacillus pleuropneumoniae. Front. Microbiol. 2022, 13, 1029426. [Google Scholar] [CrossRef]
  22. Liu, F.; Peng, W.; Yan, K.; Huang, J.; Yuan, F.; He, Q.; Chen, H.; Bei, W. CpxAR of Actinobacillus pleuropneumoniae Contributes to Heat Stress Response by Repressing Expression of Type IV Pilus Gene apfA. Microbiol. Spectr. 2022, 10, e02523-22. [Google Scholar] [CrossRef]
  23. Wan, J.; Zhang, R.; Jia, Y.; Xie, T.; Dai, L.; Yao, Q.; Zhang, W.; Xiao, H.; Gao, X.; Huang, J.; et al. The Two-Component System CpxAR Is Required for the High Potassium Stress Survival of Actinobacillus pleuropneumoniae. Front. Microbiol. 2023, 14, 1259935. [Google Scholar] [CrossRef] [PubMed]
  24. Zhang, Q.; Tang, H.; Yan, C.; Han, W.; Peng, L.; Xu, J.; Chen, X.; Langford, P.R.; Bei, W.; Huang, Q.; et al. The Metabolic Adaptation in Response to Nitrate Is Critical for Actinobacillus pleuropneumoniae Growth and Pathogenicity under the Regulation of NarQ/P. Infect. Immun. 2022, 90, e00239-22. [Google Scholar] [CrossRef] [PubMed]
  25. Zhang, Q.; Huang, Q.; Fang, Q.; Li, H.; Tang, H.; Zou, G.; Wang, D.; Li, S.; Bei, W.; Chen, H.; et al. Identification of Genes Regulated by the Two-Component System Response Regulator NarP of Actinobacillus pleuropneumoniae via DNA-Affinity-Purified Sequencing. Microbiol. Res. 2020, 230, 126343. [Google Scholar] [CrossRef] [PubMed]
  26. Li, L.; Zhu, J.; Yang, K.; Xu, Z.; Liu, Z.; Zhou, R. Changes in Gene Expression of Actinobacillus pleuropneumoniae in Response to Anaerobic Stress Reveal Induction of Central Metabolism and Biofilm Formation. J. Microbiol. 2014, 52, 473–481. [Google Scholar] [CrossRef]
  27. Li, L.; Xu, Z.; Zhou, Y.; Sun, L.; Liu, Z.; Chen, H.; Zhou, R. Global Effects of Catecholamines on Actinobacillus pleuropneumoniae Gene Expression. PLoS ONE 2012, 7, e31121. [Google Scholar] [CrossRef]
  28. Duan, B.; Peng, W.; Yan, K.; Liu, F.; Tang, J.; Yang, F.; Chen, H.; Yuan, F.; Bei, W. The QseB/QseC Two-Component System Contributes to Virulence of Actinobacillus pleuropneumoniae by Downregulating Apf Gene Cluster Transcription. Anim. Dis. 2022, 2, 2. [Google Scholar] [CrossRef]
  29. Yao, Q.; Xie, T.; Fu, Y.; Wan, J.; Zhang, W.; Gao, X.; Huang, J.; Sun, D.; Zhang, F.; Bei, W.; et al. The CpxA/CpxR Two-Component System Mediates Regulation of Actinobacillus pleuropneumoniae Cold Growth. Front. Microbiol. 2022, 13, 1079390. [Google Scholar] [CrossRef]
  30. Stock, J.B.; Stock, A.M.; Mottonen, J.M. Signal Transduction in Bacteria. Nature 1990, 344, 395–400. [Google Scholar] [CrossRef]
  31. Stock, A.M.; Robinson, V.L.; Goudreau, P.N. Two-Component Signal Transduction. Annu. Rev. Biochem. 2000, 69, 183–215. [Google Scholar] [CrossRef]
  32. Skerker, J.M.; Perchuk, B.S.; Siryaporn, A.; Lubin, E.A.; Ashenberg, O.; Goulian, M.; Laub, M.T. Rewiring the Specificity of Two-Component Signal Transduction Systems. Cell 2008, 133, 1043–1054. [Google Scholar] [CrossRef]
  33. Dunn, S.D.; Wahl, L.M.; Gloor, G.B. Mutual Information without the Influence of Phylogeny or Entropy Dramatically Improves Residue Contact Prediction. Bioinformatics 2008, 24, 333–340. [Google Scholar] [CrossRef] [PubMed]
  34. Jung, K.; Fried, L.; Behr, S.; Heermann, R. Histidine Kinases and Response Regulators in Networks. Curr. Opin. Microbiol. 2012, 15, 118–124. [Google Scholar] [CrossRef]
  35. Salazar, M.E.; Laub, M.T. Temporal and Evolutionary Dynamics of Two-Component Signaling Pathways. Curr. Opin. Microbiol. 2015, 24, 7–14. [Google Scholar] [CrossRef] [PubMed]
  36. Podgornaia, A.I.; Laub, M.T. Determinants of Specificity in Two-Component Signal Transduction. Curr. Opin. Microbiol. 2013, 16, 156–162. [Google Scholar] [CrossRef]
  37. Grebe, T.W.; Stock, J.B. The Histidine Protein Kinase Superfamily. In Advances in Microbial Physiology; Elsevier: Amsterdam, The Netherlands, 1999; Volume 41, pp. 139–227. ISBN 978-0-12-027741-4. [Google Scholar]
  38. Tremblay, Y.D.; Lévesque, C.; Segers, R.P.; Jacques, M. Method to Grow Actinobacillus pleuropneumoniae biofilm on a Biotic Surface. BMC Vet. Res. 2013, 9, 213. [Google Scholar] [CrossRef] [PubMed]
  39. Loera-Muro, V.M.; Jacques, M.; Tremblay, Y.D.N.; Avelar-González, F.J.; Loera Muro, A.; Ramírez-López, E.M.; Medina-Figueroa, A.; González-Reynaga, H.M.; Guerrero-Barrera, A.L. Detection of Actinobacillus pleuropneumoniae in Drinking Water from Pig Farms. Microbiology 2013, 159, 536–544. [Google Scholar] [CrossRef]
  40. Loera-Muro, A.; Avelar-González, F.J.; Loera-Muro, V.M.; Jacques, M.; Guerrero-Barrera, A.L. Presence of Actinobacillus pleuropneumoniae, Streptococcus suis, Pasteurella multocida, Bordetella bronchiseptica, Haemophilus parasuis and Mycoplasma hyopneumoniae; in Upper Respiratory Tract of Swine in Farms from Aguascalientes, Mexico. Open J. Anim. Sci. 2013, 3, 132–137. [Google Scholar] [CrossRef][Green Version]
  41. Loera-Muro, A.; Ramírez-Castillo, F.Y.; Moreno-Flores, A.C.; Martin, E.M.; Avelar-González, F.J.; Guerrero-Barrera, A.L. Actinobacillus pleuropneumoniae Surviving on Environmental Multi-Species Biofilms in Swine Farms. Front. Vet. Sci. 2021, 8, 722683. [Google Scholar] [CrossRef]
  42. Labrie, J.; Pelletier-Jacques, G.; Deslandes, V.; Ramjeet, M.; Auger, E.; Nash, J.H.E.; Jacques, M. Effects of Growth Conditions on Biofilm Formation by Actinobacillus pleuropneumoniae. Vet. Res. 2010, 41, 3. [Google Scholar] [CrossRef]
  43. Bossé, J.T.; Janson, H.; Sheehan, B.J.; Beddek, A.J.; Rycroft, A.N.; Simon Kroll, J.; Langford, P.R. Actinobacillus pleuropneumoniae: Pathobiology and Pathogenesis of Infection. Microbes Infect. 2002, 4, 225–235. [Google Scholar] [CrossRef] [PubMed]
  44. Jacques, M. Surface Polysaccharides and Iron-Uptake Systems of Actinobacillus pleuropneumoniae. Can. J. Vet. Res. 2004, 68, 81. [Google Scholar]
  45. Hälli, O.; Ala-Kurikka, E.; Wallgren, P.; Heinonen, M. Actinobacillus pleuropneumoniae Seroprevalence in Farmed Wild Boars in Finland. J. Zoo Wildl. Med. 2014, 45, 813–818. [Google Scholar] [CrossRef] [PubMed]
  46. Reiner, G.; Fresen, C.; Bronnert, S.; Haack, I.; Willems, H. Prevalence of Actinobacillus pleuropneumoniae Infection in Hunted Wild Boars (Sus Scrofa) in Germany. J. Wildl. Dis. 2010, 46, 551–555. [Google Scholar] [CrossRef][Green Version]
  47. Szurmant, H.; Bobay, B.G.; White, R.A.; Sullivan, D.M.; Thompson, R.J.; Hwa, T.; Hoch, J.A.; Cavanagh, J. Co-Evolving Motions at Protein−Protein Interfaces of Two-Component Signaling Systems Identified by Covariance Analysis. Biochemistry 2008, 47, 7782–7784. [Google Scholar] [CrossRef] [PubMed]
  48. Weigt, M.; White, R.A.; Szurmant, H.; Hoch, J.A.; Hwa, T. Identification of Direct Residue Contacts in Protein–Protein Interaction by Message Passing. Proc. Natl. Acad. Sci. USA 2009, 106, 67–72. [Google Scholar] [CrossRef]
  49. Burger, L.; Van Nimwegen, E. Accurate Prediction of Protein–Protein Interactions from Sequence Alignments Using a Bayesian Method. Mol. Syst. Biol. 2008, 4, 165. [Google Scholar] [CrossRef]
  50. Hopf, T.A.; Schärfe, C.P.I.; Rodrigues, J.P.G.L.M.; Green, A.G.; Kohlbacher, O.; Sander, C.; Bonvin, A.M.J.J.; Marks, D.S. Sequence Co-Evolution Gives 3D Contacts and Structures of Protein Complexes. eLife 2014, 3, e03430. [Google Scholar] [CrossRef]
  51. Ovchinnikov, S.; Kamisetty, H.; Baker, D. Robust and Accurate Prediction of Residue–Residue Interactions across Protein Interfaces Using Evolutionary Information. eLife 2014, 3, e02030. [Google Scholar] [CrossRef]
  52. Capra, E.J.; Perchuk, B.S.; Skerker, J.M.; Laub, M.T. Adaptive Mutations That Prevent Crosstalk Enable the Expansion of Paralogous Signaling Protein Families. Cell 2012, 150, 222–232. [Google Scholar] [CrossRef]
  53. Aakre, C.D.; Herrou, J.; Phung, T.N.; Perchuk, B.S.; Crosson, S.; Laub, M.T. Evolving New Protein-Protein Interaction Specificity through Promiscuous Intermediates. Cell 2015, 163, 594–606. [Google Scholar] [CrossRef] [PubMed]
  54. Capra, E.J.; Perchuk, B.S.; Lubin, E.A.; Ashenberg, O.; Skerker, J.M.; Laub, M.T. Systematic Dissection and Trajectory-Scanning Mutagenesis of the Molecular Interface That Ensures Specificity of Two-Component Signaling Pathways. PLoS Genet. 2010, 6, e1001220. [Google Scholar] [CrossRef]
  55. Capra, E.J.; Perchuk, B.S.; Ashenberg, O.; Seid, C.A.; Snow, H.R.; Skerker, J.M.; Laub, M.T. Spatial Tethering of Kinases to Their Substrates Relaxes Evolutionary Constraints on Specificity. Mol. Microbiol. 2012, 86, 1393–1403. [Google Scholar] [CrossRef] [PubMed]
  56. Stewart, R.C. Protein Histidine Kinases: Assembly of Active Sites and Their Regulation in Signaling Pathways. Curr. Opin. Microbiol. 2010, 13, 133–141. [Google Scholar] [CrossRef] [PubMed]
  57. Casino, P.; Rubio, V.; Marina, A. Structural Insight into Partner Specificity and Phosphoryl Transfer in Two-Component Signal Transduction. Cell 2009, 139, 325–336. [Google Scholar] [CrossRef]
  58. Mack, T.R.; Gao, R.; Stock, A.M. Probing the Roles of the Two Different Dimers Mediated by the Receiver Domain of the Response Regulator PhoB. J. Mol. Biol. 2009, 389, 349–364. [Google Scholar] [CrossRef]
  59. Galperin, M.Y. Diversity of Structure and Function of Response Regulator Output Domains. Curr. Opin. Microbiol. 2010, 13, 150–159. [Google Scholar] [CrossRef]
  60. Bourret, R.B. Receiver Domain Structure and Function in Response Regulator Proteins. Curr. Opin. Microbiol. 2010, 13, 142–149. [Google Scholar] [CrossRef]
  61. Marchler-Bauer, A.; Lu, S.; Anderson, J.B.; Chitsaz, F.; Derbyshire, M.K.; DeWeese-Scott, C.; Fong, J.H.; Geer, L.Y.; Geer, R.C.; Gonzales, N.R.; et al. CDD: A Conserved Domain Database for the Functional Annotation of Proteins. Nucleic Acids Res. 2011, 39, D225–D229. [Google Scholar] [CrossRef]
  62. Rangwala, S.H.; Kuznetsov, A.; Ananiev, V.; Asztalos, A.; Borodin, E.; Evgeniev, V.; Joukov, V.; Lotov, V.; Pannu, R.; Rudnev, D.; et al. Accessing NCBI Data Using the NCBI Sequence Viewer and Genome Data Viewer (GDV). Genome Res. 2021, 31, 159–169. [Google Scholar] [CrossRef]
  63. Capra, E.J.; Laub, M.T. Evolution of Two-Component Signal Transduction Systems. Annu. Rev. Microbiol. 2012, 66, 325–347. [Google Scholar] [CrossRef]
  64. Podgornaia, A.I.; Casino, P.; Marina, A.; Laub, M.T. Structural Basis of a Rationally Rewired Protein-Protein Interface Critical to Bacterial Signaling. Structure 2013, 21, 1636–1647. [Google Scholar] [CrossRef]
  65. Noriega, C.E.; Schmidt, R.; Gray, M.J.; Chen, L.-L.; Stewart, V. Autophosphorylation and Dephosphorylation by Soluble Forms of the Nitrate-Responsive Sensors NarX and NarQ from Escherichia coli K-12. J. Bacteriol. 2008, 190, 3869–3876. [Google Scholar] [CrossRef] [PubMed]
  66. Noriega, C.E.; Lin, H.; Chen, L.; Williams, S.B.; Stewart, V. Asymmetric Cross-regulation between the Nitrate-responsive NarX–NarL and NarQ–NarP Two-component Regulatory Systems from Escherichia coli K-12. Mol. Microbiol. 2010, 75, 394–412. [Google Scholar] [CrossRef] [PubMed]
  67. Waterhouse, A.M.; Procter, J.B.; Martin, D.M.A.; Clamp, M.; Barton, G.J. Jalview Version 2—A Multiple Sequence Alignment Editor and Analysis Workbench. Bioinformatics 2009, 25, 1189–1191. [Google Scholar] [CrossRef]
  68. Sievers, F.; Wilm, A.; Dineen, D.; Gibson, T.J.; Karplus, K.; Li, W.; Lopez, R.; McWilliam, H.; Remmert, M.; Söding, J.; et al. Fast, Scalable Generation of High-quality Protein Multiple Sequence Alignments Using Clustal Omega. Mol. Syst. Biol. 2011, 7, 539. [Google Scholar] [CrossRef]
  69. Senior, A.W.; Evans, R.; Jumper, J.; Kirkpatrick, J.; Sifre, L.; Green, T.; Qin, C.; Žídek, A.; Nelson, A.W.R.; Bridgland, A.; et al. Improved Protein Structure Prediction Using Potentials from Deep Learning. Nature 2020, 577, 706–710. [Google Scholar] [CrossRef] [PubMed]
  70. Yang, J.; Anishchenko, I.; Park, H.; Peng, Z.; Ovchinnikov, S.; Baker, D. Improved Protein Structure Prediction Using Predicted Interresidue Orientations. Proc. Natl. Acad. Sci. USA 2020, 117, 1496–1503. [Google Scholar] [CrossRef]
  71. Jumper, J.; Evans, R.; Pritzel, A.; Green, T.; Figurnov, M.; Ronneberger, O.; Tunyasuvunakool, K.; Bates, R.; Žídek, A.; Potapenko, A.; et al. Highly Accurate Protein Structure Prediction with AlphaFold. Nature 2021, 596, 583–589. [Google Scholar] [CrossRef]
  72. Evans, R.; O’Neill, M.; Pritzel, A.; Antropova, N.; Senior, A.; Green, T.; Žídek, A.; Bates, R.; Blackwell, S.; Yim, J.; et al. Protein Complex Prediction with AlphaFold-Multimer. bioRxiv 2021. [Google Scholar] [CrossRef]
  73. Pettersen, E.F.; Goddard, T.D.; Huang, C.C.; Meng, E.C.; Couch, G.S.; Croll, T.I.; Morris, J.H.; Ferrin, T.E. UCSF ChimeraX: Structure Visualization for Researchers, Educators, and Developers. Protein Sci. 2021, 30, 70–82. [Google Scholar] [CrossRef]
  74. Berendsen, H.J.C.; Postma, J.P.M.; Van Gunsteren, W.F.; Hermans, J. Interaction Models for Water in Relation to Protein Hydration. In Intermolecular Forces; Pullman, B., Ed.; The Jerusalem Symposia on Quantum Chemistry and Biochemistry; Springer: Dordrecht, The Netherlands, 1981; Volume 14, pp. 331–342. ISBN 978-90-481-8368-5. [Google Scholar]
  75. Robertson, M.J.; Tirado-Rives, J.; Jorgensen, W.L. Improved Peptide and Protein Torsional Energetics with the OPLS-AA Force Field. J. Chem. Theory Comput. 2015, 11, 3499–3509. [Google Scholar] [CrossRef]
  76. Dodda, L.S.; Cabeza de Vaca, I.; Tirado-Rives, J.; Jorgensen, W.L. LigParGen Web Server: An Automatic OPLS-AA Parameter Generator for Organic Ligands. Nucleic Acids Res. 2017, 45, W331–W336. [Google Scholar] [CrossRef] [PubMed]
  77. Páll, S.; Zhmurov, A.; Bauer, P.; Abraham, M.; Lundborg, M.; Gray, A.; Hess, B.; Lindahl, E. Heterogeneous Parallelization and Acceleration of Molecular Dynamics Simulations in GROMACS. J. Chem. Phys. 2020, 153, 134110. [Google Scholar] [CrossRef]
  78. Sawitzki, G. Computational Statistics; Chapman and Hall/CRC: Boca Raton, FL, USA, 2009; ISBN 978-1-4200-8681-2. [Google Scholar]
  79. Crooks, G.E.; Hon, G.; Chandonia, J.-M.; Brenner, S.E. WebLogo: A Sequence Logo Generator: Figure 1. Genome Res. 2004, 14, 1188–1190. [Google Scholar] [CrossRef]
  80. Honorato, R.V.; Trellet, M.E.; Jiménez-García, B.; Schaarschmidt, J.J.; Giulini, M.; Reys, V.; Koukos, P.I.; Rodrigues, J.P.G.L.M.; Karaca, E.; Van Zundert, G.C.P.; et al. The HADDOCK2.4 Web Server for Integrative Modeling of Biomolecular Complexes. Nat. Protoc. 2024, 19, 3219–3241. [Google Scholar] [CrossRef]
  81. Lemkul, J.A.; Bevan, D.R. Assessing the Stability of Alzheimer’s Amyloid Protofibrils Using Molecular Dynamics. J. Phys. Chem. B 2010, 114, 1652–1660. [Google Scholar] [CrossRef] [PubMed]
  82. Hub, J.S.; De Groot, B.L. Does CO2 Permeate through Aquaporin-1? Biophys. J. 2006, 91, 842–848. [Google Scholar] [CrossRef]
  83. Hub, J.S.; De Groot, B.L.; Van Der Spoel, D. G_wham—A Free Weighted Histogram Analysis Implementation Including Robust Error and Autocorrelation Estimates. J. Chem. Theory Comput. 2010, 6, 3713–3720. [Google Scholar] [CrossRef]
  84. Seshasayee, A.S.; Bertone, P.; Fraser, G.M.; Luscombe, N.M. Transcriptional Regulatory Networks in Bacteria: From Input Signals to Output Responses. Curr. Opin. Microbiol. 2006, 9, 511–519. [Google Scholar] [CrossRef]
  85. Goulian, M. Two-Component Signaling Circuit Structure and Properties. Curr. Opin. Microbiol. 2010, 13, 184–189. [Google Scholar] [CrossRef]
  86. Van Dijk, A.D.J.; Bonvin, A.M.J.J. Solvated Docking: Introducing Water into the Modelling of Biomolecular Complexes. Bioinformatics 2006, 22, 2340–2347. [Google Scholar] [CrossRef]
  87. Kastritis, P.L.; Visscher, K.M.; Van Dijk, A.D.J.; Bonvin, A.M.J.J. Solvated Protein–Protein Docking Using Kyte-Doolittle-based Water Preferences. Proteins Struct. Funct. Bioinforma. 2013, 81, 510–518. [Google Scholar] [CrossRef] [PubMed]
  88. Fisher, S.L.; Jiang, W.; Wanner, B.L.; Walsh, C.T. Cross-Talk between the Histidine Protein Kinase VanS and the Response Regulator PhoB. J. Biol. Chem. 1995, 270, 23143–23149. [Google Scholar] [CrossRef]
  89. Gao, R.; Stock, A.M. Molecular Strategies for Phosphorylation-Mediated Regulation of Response Regulator Activity. Curr. Opin. Microbiol. 2010, 13, 160–167. [Google Scholar] [CrossRef]
  90. Huynh, T.N.; Stewart, V. Negative Control in Two-Component Signal Transduction by Transmitter Phosphatase Activity: Transmitter Phosphatase in Two-Component Signalling. Mol. Microbiol. 2011, 82, 275–286. [Google Scholar] [CrossRef] [PubMed]
  91. Laub, M.T.; Goulian, M. Specificity in Two-Component Signal Transduction Pathways. Annu. Rev. Genet. 2007, 41, 121–145. [Google Scholar] [CrossRef]
  92. Siryaporn, A.; Perchuk, B.S.; Laub, M.T.; Goulian, M. Evolving a Robust Signal Transduction Pathway from Weak Cross-talk. Mol. Syst. Biol. 2010, 6, 452. [Google Scholar] [CrossRef] [PubMed]
  93. Huynh, T.N.; Chen, L.-L.; Stewart, V. Sensor–Response Regulator Interactions in a Cross-Regulated Signal Transduction Network. Microbiology 2015, 161, 1504–1515. [Google Scholar] [CrossRef]
  94. Typas, A.; Sourjik, V. Bacterial Protein Networks: Properties and Functions. Nat. Rev. Microbiol. 2015, 13, 559–572. [Google Scholar] [CrossRef] [PubMed]
  95. Jensen, R.B.; Wang, S.C.; Shapiro, L. Dynamic Localization of Proteins and DNA during a Bacterial Cell Cycle. Nat. Rev. Mol. Cell Biol. 2002, 3, 167–176. [Google Scholar] [CrossRef]
  96. Ryan, K.R.; Shapiro, L. Temporal and Spatial Regulation in Prokaryotic Cell Cycle Progression and Development. Annu. Rev. Biochem. 2003, 72, 367–394. [Google Scholar] [CrossRef]
  97. Batchelor, E.; Goulian, M. Imaging OmpR Localization in Escherichia coli. Mol. Microbiol. 2006, 59, 1767–1778. [Google Scholar] [CrossRef] [PubMed]
  98. Sourjik, V.; Armitage, J.P. Spatial Organization in Bacterial Chemotaxis. EMBO J. 2010, 29, 2724–2733. [Google Scholar] [CrossRef]
  99. Di Ventura, B.; Sourjik, V. Self-organized Partitioning of Dynamically Localized Proteins in Bacterial Cell Division. Mol. Syst. Biol. 2011, 7, 457. [Google Scholar] [CrossRef]
  100. Sommer, E.; Koler, M.; Frank, V.; Sourjik, V.; Vaknin, A. The Sensory Histidine Kinases TorS and EvgS Tend to Form Clusters in Escherichia coli Cells. PLoS ONE 2013, 8, e77708. [Google Scholar] [CrossRef]
  101. Siryaporn, A.; Goulian, M. Cross-talk Suppression between the CpxA–CpxR and EnvZ–OmpR Two-component Systems in E. coli. Mol. Microbiol. 2008, 70, 494–506. [Google Scholar] [CrossRef]
  102. Laub, M.T.; Biondi, E.G.; Skerker, J.M. Phosphotransfer Profiling: Systematic Mapping of Two-Component Signal Transduction Pathways and Phosphorelays. In Methods in Enzymology; Elsevier: Amsterdam, The Netherlands, 2007; Volume 423, pp. 531–548. ISBN 978-0-12-373852-3. [Google Scholar]
  103. Procaccini, A.; Lunt, B.; Szurmant, H.; Hwa, T.; Weigt, M. Dissecting the Specificity of Protein-Protein Interaction in Bacterial Two-Component Signaling: Orphans and Crosstalks. PLoS ONE 2011, 6, e19729. [Google Scholar] [CrossRef] [PubMed]
  104. Guckes, K.R.; Kostakioti, M.; Breland, E.J.; Gu, A.P.; Shaffer, C.L.; Martinez, C.R.; Hultgren, S.J.; Hadjifrangiskou, M. Strong Cross-System Interactions Drive the Activation of the QseB Response Regulator in the Absence of Its Cognate Sensor. Proc. Natl. Acad. Sci. USA 2013, 110, 16592–16597. [Google Scholar] [CrossRef]
  105. Lukat, G.S.; Stock, A.M.; Stock, J.B. Divalent Metal Ion Binding to the CheY Protein and Its Significance to Phosphotransfer in Bacterial Chemotaxis. Biochemistry 1990, 29, 5436–5442. [Google Scholar] [CrossRef]
  106. Needham, J.V.; Chen, T.Y.; Falke, J.J. Novel Ion Specificity of a Carboxylate Cluster Magnesium(II) Binding Site: Strong Charge Selectivity and Weak Size Selectivity. Biochemistry 1993, 32, 3363–3367. [Google Scholar] [CrossRef]
  107. Lamarche, M.G.; Wanner, B.L.; Crépin, S.; Harel, J. The Phosphate Regulon and Bacterial Virulence: A Regulatory Network Connecting Phosphate Homeostasis and Pathogenesis. FEMS Microbiol. Rev. 2008, 32, 461–473. [Google Scholar] [CrossRef]
  108. Crépin, S.; Chekabab, S.-M.; Le Bihan, G.; Bertrand, N.; Dozois, C.M.; Harel, J. The Pho Regulon and the Pathogenesis of Escherichia coli. Vet. Microbiol. 2011, 153, 82–88. [Google Scholar] [CrossRef]
  109. Santos-Beneit, F. The Pho Regulon: A Huge Regulatory Network in Bacteria. Front. Microbiol. 2015, 6, 402. [Google Scholar] [CrossRef]
  110. Rowland, M.A.; Deeds, E.J. Crosstalk and the Evolution of Specificity in Two-Component Signaling. Proc. Natl. Acad. Sci. USA 2014, 111, 5550–5555. [Google Scholar] [CrossRef]
  111. Barakat, M.; Ortet, P.; Jourlin-Castelli, C.; Ansaldi, M.; Méjean, V.; Whitworth, D.E. P2CS: A Two-Component System Resource for Prokaryotic Signal Transduction Research. BMC Genom. 2009, 10, 315. [Google Scholar] [CrossRef]
  112. Cai, S.J.; Inouye, M. EnvZ-OmpR Interaction and Osmoregulation in Escherichia coli. J. Biol. Chem. 2002, 277, 24155–24161. [Google Scholar] [CrossRef]
  113. Yoshida, T.; Cai, S.J.; Inouye, M. Interaction of EnvZ, a Sensory Histidine Kinase, with Phosphorylated OmpR, the Cognate Response Regulator. Mol. Microbiol. 2002, 46, 1283–1294. [Google Scholar] [CrossRef]
  114. Miyashiro, T.; Goulian, M. Stimulus-Dependent Differential Regulation in the Escherichia coli PhoQ–PhoP System. Proc. Natl. Acad. Sci. USA 2007, 104, 16305–16310. [Google Scholar] [CrossRef]
  115. Benson, D.A.; Cavanaugh, M.; Clark, K.; Karsch-Mizrachi, I.; Lipman, D.J.; Ostell, J.; Sayers, E.W. GenBank. Nucleic Acids Res. 2012, 41, D36–D42. [Google Scholar] [CrossRef]
  116. Martin, E.M.; Guerrero-Barrera, A.L.; Avelar-Gonzalez, F.J. Two-Component Systems in Pasteurellaceae and Their Roles in Virulence. Vet. Sci. 2025, 12, 1140. [Google Scholar] [CrossRef]
Figure 1. Dot blots of all computed values versus the minimal distance between residue pair’s last side chain atoms from all four datasets obtained from heterodimer modeling in AlphaFold (A) Mutual information with average product correction (MIp) and (B) weighted MIp.
Computation 14 00123 g001
Figure 2. Interface coupling index versus the minimal distance between residue pair’s last side chain atoms dots blot of all computed datasets from heterodimer modeled in Alphafold, the ninety-nine percent cutoff is shown as a red line. The dots’ color coding is red, green, cyan, and purple, corresponding to CpxA-CpxR, NarQ-NarP, PhoR-PhoB, and QseC-QseB, respectively. Black dots that are beyond the red cutoff line correspond to ICI values of interprotein residue pairs.
Computation 14 00123 g002
Figure 3. Spatial localization of the determined OISC on the interaction surfaces of histidine kinases and response regulator heterodimers modeled in Alphafold from Actinobacillus pleuropneumoniae: (A) CpxA-CpxR, (B) NarQ-NarP, (C) PhoR-PhoB, and (D) QseC-QseB. OISC residue pairs are color-coded red, green, cyan, and purple, for CpxA-CpxR, NarQ-NarP, PhoR-PhoB, and QseC-QseB, respectively. The exact chemical composition and ICI values of each OISC can be found in Table 1. Ribbon representations show intraprotein interactions, with response regulators colored green and histidine kinases colored blue. Proteins are not shown to scale and are presented only to illustrate the relative localization of the interaction interfaces.
Computation 14 00123 g003
Figure 4. Modeled interaction interface positions from A. pleuropneumoniae (Table S1). Triangles below y-axes highlight positions that belong to the orthologue interaction specificity core (Figure 2). Amino acid frequencies are in bits, right-facing triangle marks where the RR begins. Polar, neutral, basic, acidic, and hydrophobic, amino acid chemical properties appear as green, purple, blue, red, and black, respectively.
Computation 14 00123 g004
Figure 5. Convergence diagnostics for umbrella sampling CpxA-CpxR simulations. (A) Potential of mean force (PMF) describing dissociation of the complex along the center-of-mass separation coordinate. The shaded region represents bootstrap uncertainty estimated from WHAM analysis. (B) Sampling convergence map showing the distribution of sampled reaction-coordinate bins for each umbrella window. The continuous diagonal ridge indicates stable sampling across the reaction coordinate. (C) Histogram overlap of umbrella sampling windows demonstrating substantial overlap between adjacent windows, supporting reliable WHAM reconstruction of the free-energy profile. Each colored histogram corresponds to an individual umbrella sampling window positioned along the reaction coordinate.
Computation 14 00123 g005
Table 1. Orthologue interface specificity core’s amino acid pairs for the heterodimer modeled proteins.
MSAaxMSAayAAxAAyMIIrxMIIryHKxRRyAAxAAyICIMeanDistance
SDÅ
CpxAR388778LF731266103LF0.04390.00794.4719
391692AL82326920AL0.04624.2527
391780AD833269105AD0.08353.2885
NarQP7391137KD625389108KD0.04350.01044.5475
7401140IP727390111IT0.03834.1032
7431140QP827393111ST0.04972.7145
PhoRB535937TI41322014TI0.04930.01084.1379
536937VI51322114VI0.05134.2781
540940YM81422517YM0.07374.4342
543944TN101622821LF0.04033.6431
QseCB334630SI32625312SI0.05180.00704.4570
334674ST33225353ST0.04995.2943
344727EA1041263104EA0.09933.2464
345633VG112826415IG0.03843.1168
516677PG172841156VK0.03833.4844
Polar, neutral, basic, acidic, and hydrophobic, amino acid chemical properties appear as green, purple, blue, red, and black, respectively.
Table 2. Binding free energy for wildtype and mutant cognate complexes.
TCSWindows (n)ΔG (kcal/mol)SD (kcal/mol)ΔΔG (kcal/mol)
CpxAR wt48−21.84±2.16+8.19
CpxAR mut47−13.65±2.84
NarQP wt56−24.96±2.81+6.19
NarQP mut52−18.77±2.41
PhoRB wt51−20.05±2.67+2.09
PhoRB mut49−17.97±1.66
QseCB wt50−17.76±2.23−6.87
QseCB mut48−24.64±3.06
ΔΔG values represent differences in binding free energy relative to the wildtype. ΔG values are color-coded according to interaction strength using a global min–max scaling of |ΔG| values across all binding free energies reported in this study (8.29–24.96 kcal/mol). Values were linearly partitioned into five equally spaced intervals and mapped onto a red–yellow–green color scale, where green indicates stronger interactions and red indicates weaker interactions. The corresponding dissociation free-energy profiles underlying these values are shown in Figure S2.
Table 3. Non-cognate binding free energies (kcal/mol).
CpxANarQPhoRQseC
CpxR −21.84 ± 2.16−15.56 ± 3.17−23.63 ± 3.18−18.07 ± 2.70
NarP−18.47 ± 2.43−21.83 ± 2.81−9.41 ± 1.94−18.82 ± 2.45
PhoB−13.45 ± 3.68−10.66 ± 2.58−20.05 ± 2.67−8.55 ± 2.10
QseB−11.97 ± 1.82−8.29 ± 2.17−11.84 ± 2.59−17.78 ± 2.23
Each non-cognate HK-RR pair is associated with a distinct binding free-energy value, reported together with the estimated standard deviation obtained from bootstrap resampling. Error estimates are given in kcal/mol. ΔG values are color-coded according to interaction strength using a global min–max scaling of |ΔG| values across all binding free energies reported in this study (8.29–24.96 kcal/mol). Values were linearly partitioned into five equally spaced intervals and mapped onto a red–yellow–green color scale, where green indicates stronger interactions and red indicates weaker interactions. The graded nature of non-cognate interaction energetics is further illustrated in the PMF profiles provided in Figure S2.
Table 4. Summary of system-specific interface and network-level energetic properties in the analyzed two-component systems.
TCSOISCCognateMutationNetwork-Level Behavior
(Pairs)EnergeticsEffectHKRR
CpxAR3FavorableDestabilizedGradually
insulated
Permissive
NarQP3Highly
favorable
DestabilizedInsulatedPermissive
PhoRB4FavorableMild
destabilization
Partially
insulated
Insulated
QseCB5Less favorable energeticsStabilizedPermissiveInsulated
Qualitative summary of the principal interaction and network-level characteristics observed for the analyzed histidine kinase–response regulator (HK–RR) systems. The number of residue pairs comprising the orthologue interface specificity core (OISC), cognate interaction energetics, and the energetic effect of OISC mutations are summarized from the quantitative free-energy analyses presented in Table 1, Table 2 and Table 3. Network-level behavior describes the relative degree of energetic insulation or permissiveness displayed by histidine kinases (HKs) and response regulators (RRs) across cognate and non-cognate interactions within the analyzed signaling network.
Disclaimer/Publisher’s Note: The statements, opinions and data contained in all publications are solely those of the individual author(s) and contributor(s) and not of MDPI and/or the editor(s). MDPI and/or the editor(s) disclaim responsibility for any injury to people or property resulting from any ideas, methods, instructions or products referred to in the content.