
Article

Numerical Investigation on Cathode Gas Diffusion Layer with Conical Frustum Grooves for Enhancing Performance of Proton Exchange Membrane Fuel Cell


1
State Key Laboratory of Advanced Refractories, Wuhan University of Science and Technology, Wuhan 430081, China
2
National-Provincial Joint Engineering Research Center of High Temperature Materials and Lining Technology, Wuhan University of Science and Technology, Wuhan 430081, China
3
Key Laboratory of Ferrous Metallurgy and Resources Utilization of Ministry of Education, Wuhan University of Science and Technology, Wuhan 430081, China
*
Author to whom correspondence should be addressed.
Computation 2026, 14(6), 118; https://doi.org/10.3390/computation14060118
Submission received: 28 April 2026 / Revised: 19 May 2026 / Accepted: 21 May 2026 / Published: 22 May 2026

Abstract

To address performance limitations in proton exchange membrane fuel cells (PEMFCs), this work proposes and numerically investigates a cathode gas diffusion layer (GDL) with conical frustum grooves. A systematic comparison is performed across three GDL configurations: a baseline structure without grooves, a design with cylindrical grooves, and the proposed conical frustum grooves. The results demonstrate that the conical frustum grooves effectively enhance liquid water removal, oxygen mass transport, membrane current density, and peak power density. This improvement arises as the grooves expand transport pathways for both liquid water and oxygen, facilitating more robust electrochemical reactions. A parametric analysis is further conducted to evaluate the effects of groove spacing, depth, top radius, and bottom radius. Reduced groove spacing, together with increased groove depth, top radius, and bottom radius, consistently improves water management and oxygen delivery. However, membrane current density and power density do not vary monotonically with groove depth and bottom radius. The optimal values for these two parameters are identified as 0.3 mm and 0.5 mm, respectively.

1. Introduction

Recently, countries around the world have faced increasingly severe challenges from climate change and reducing carbon emissions has become the main goal of governments [1,2]. Applications of zero/low carbon power sources are the key solution for reducing carbon emissions and promoting sustainable social development [3,4]. Proton exchange membrane fuel cells (PEMFCs) exhibit significant promise as power sources for vehicles, ships, and unmanned aerial vehicles [5,6], owing to their inherent advantages of zero emissions, rapid startup, and high-power density [7,8,9]. However, the widespread adoption of PEMFCs remains hindered by persistent challenges in performance enhancement [10,11].
To address these limitations, optimizing the PEMFC flow field is a widely adopted strategy [12,13]. The cathode region involves multiple complex processes, including oxygen supply, gas–liquid transport, and water drainage. Characterized by high mass transfer resistance and significant flooding issues, it represents a critical bottleneck limiting improvements in output performance of PEMFCs. Therefore, optimizing the design of the cathode flow channels and gas diffusion layer is of great practical significance for improving internal mass transfer characteristics, mitigating flooding, and enhancing fuel cell performance [14,15,16]. Traditional channel designs, such as parallel, single-serpentine, and multi-serpentine configurations, have been proposed for bipolar plate engineering to enhance gas transport and liquid water removal, ultimately improving the electrical performance of PEMFCs [17,18]. Based on the channel layout, modifying the channel cross section is a popular way. A tapered channel [19], wave channel [20] and baffled channel [21,22] are widely used. Beyond the above conventional design, bionic design offers us a more creative design approach. The bionic leaf vein channel [23,24], biomimetic droplet flow-blocking channel [25], shark dermal denticle blocking channel [26], and bionic fish scale porous channel [27] are also applied.
However, compared to bipolar plate flow field optimization, gas diffusion layer (GDL) modification represents a more challenging yet highly effective approach. Gerteisen et al. [28] modified the GDL via laser perforation and experimentally evaluated the performance of laser-treated GDLs. The PEMFCs integrated with perforated GDLs demonstrated superior dynamic and overall performance relative to those equipped with unmodified GDLs. Iglesia et al. [29] employed a picosecond laser to fabricate periodic grooves on the GDL surface. The results indicated that power density was doubled at a periodic groove depth of 20 μm. Wang et al. [30] investigated the effects of perforation diameter and spacing on water transport. Results showed that the water transport was the best at the perforation diameter of 100 μm and the perforation pitch of 2 mm. Niu et al. [31] explored the influence of perforation depth and diameter on liquid water transport in perforated GDLs. Results showed that the GDL with a perforation diameter and depth of 100 μm exhibited the optimal performance. Yin et al. [32] punched elliptical grooves in GDLs of PEMFCs. Results showed that the elliptical groove could greatly enhance the reactant and product transport.
To summarize, introducing patterned grooves into the cathode GDL is a viable and effective strategy for improving PEMFC performance. Unlike previous studies, this work proposes conical frustum grooves on the cathode GDL, whose performance is compared with both unmodified and cylindrical-grooved GDL. Subsequently, effects of key geometric parameters of the conical frustum grooves, including spacing, depth, top radius, and bottom radius, on PEMFC performance are systematically investigated. This study aims to elucidate the performance enhancement mechanism of patterned conical frustum grooves in the cathode GDL.

2. Methodology

2.1. Geometrical and Physical Model

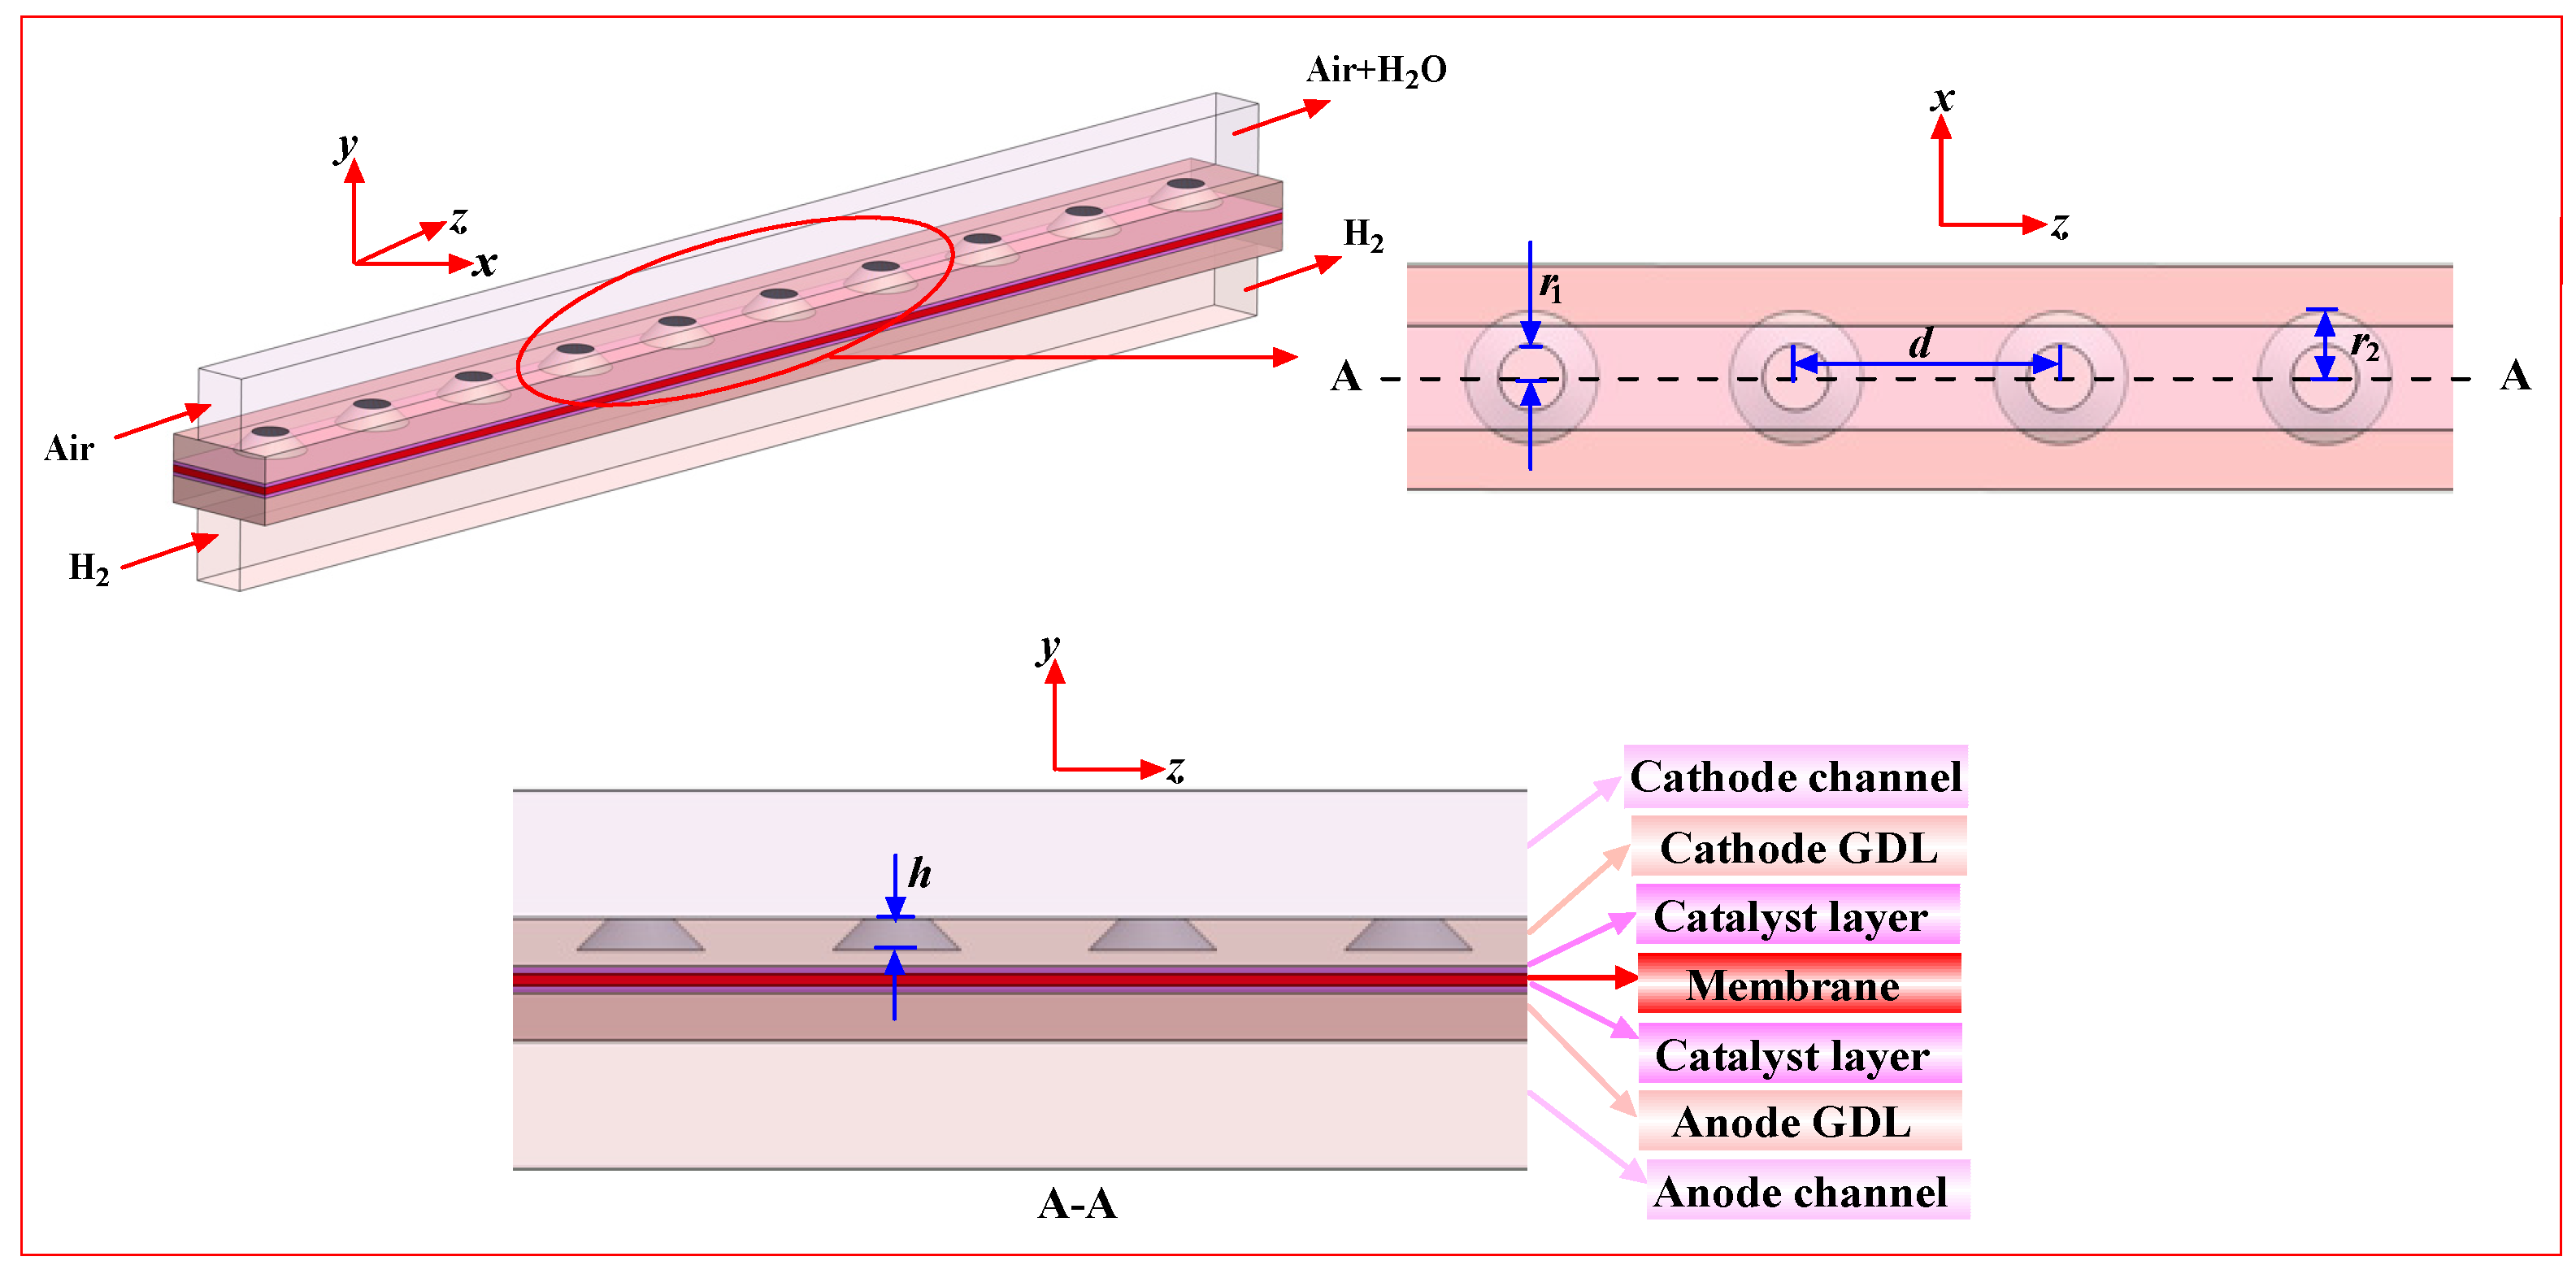
In this work, conical frustum grooves are uniformly patterned on the cathode GDL of the PEMFC, as illustrated in Figure 1. This structure can be fabricated by precise laser ablation or micro-CNC milling. Laser ablation ensures high precision of conical microstructures, while micro-CNC milling enables reliable control over depth and radius. The geometric dimensions and operating parameters of the PEMFC are presented in Table 1 and Table 2, respectively. To reveal the performance enhancement mechanism of conical frustum grooves, the effects of groove spacing (d), depth (h), top radius (r1), and bottom radius (r2) are analyzed, with corresponding cases detailed in Table 3.

2.2. Governing Equations

Prior to constructing the mathematical model of the PEMFC, the following assumptions are adopted [34]: (a) steady operation; (b) incompressible and laminar flow in channel; (c) gravitational effects and interfacial contact resistance are neglected; (d) isotropic and homogeneous porous medium; and (e) the membrane is impermeable to electrons and gases. The corresponding mass, momentum, energy, species, and charge conservation equations are described as follows [35,36,37,38,39]:
Mass conservation:
ρ u = S m ,
S m = M H 2 j a 2 F           A n o d e M H 2 O j c 2 F M O 2 j c 4 F     C a t h o d e ,
where ρ denotes the fluid density, u the velocity vector, and Sm the mass source term. M H 2 , M O 2 and M H 2 O represent the molar masses of hydrogen, oxygen and water, respectively. ja and jc refer to the exchange current densities of the anode and cathode catalytic layers, respectively, and F represents the Faraday constant (F = 96,485 C·mol−1).
Momentum conservation:
1 ε 2 ρ u u = p + 1 ε μ u + S u ,
S u = ε 2 μ K p u         CL   and   GDL 0                             Other   regions ,
where ɛ represents the porosity, p represents the pressure, µ represents the dynamic viscosity, and Su represents the momentum source term, and Kp represents the permeability of porous media.
Energy conservation:
ρ c p u T = k eff T + S T ,
k e f f = ε k f + 1 ε k s ,
S T = h react j a / c η a / c + I 2 R ohm + h phase   All   domain ,
where cp represents the constant-pressure specific heat capacity, T represents the operating temperature, and keff represents the effective thermal conductivity. kf and ks represent the thermal conductivity of fluid and solid phases, respectively, and hreact represents the net enthalpy change associated with the electrochemical reaction, while ƞa/c is the activation overpotential within the anode or cathode catalyst layer, and I denotes the area-specific surface current density, Rohm the ohmic resistance, and hphase the enthalpy change from water condensation or vaporization.
Species conservation:
ε c i t + ε u c i = D i eff c i + S i ,
D i eff = ε 1.5 1 s 2.5 D i 0 p 0 p T T 0 1.5 ,
S i = j a 2 F M H 2         CL j c 4 F M O 2         CL j c 2 F M H 2 O     CL
where ci represents the molar concentration of species, Si represents the source term of species, Dieff represents the effective diffusivity of species, s represents the water saturation, and Di0 represents the mass diffusion coefficient at T0 and p0.
Charge conservation:
σ s ϕ s + R s = 0 σ m e m ϕ m e m + R m e m = 0 ,
σ mem = 0.514 λ 0.326 e 1268 1 303 1 T ,
R m e m = R s = j a     Anode   CL R s = R m e m = j c     Cathode   CL ,
where σs and σmem represent the electrical conductivity of the solid phase and membrane, respectively, ϕs and ϕmem refer to their corresponding potentials. Rs and Rmem represent the volumetric transfer current densities in the solid and membrane phases, respectively, and λ represents the membrane water content.
Additionally, as the catalytic layer involves a variety of electrochemical reactions, the Butler–Volmer equation is adopted to describe the relationship between current and activation polarization loss:
j = A v i 0 , a c H 2 c H 2 , ref γ a exp α a F η a R T exp α c F η a R T A n o d e A v i c O 2 c O 2 , ref γ c exp α c F η c R T exp α a F η c R T Cathode 0 , c ,
where Av represents the specific surface-to-volume ratio of the catalyst layer, γa and γc denote the concentration exponents for the anode and cathode reactions, with γa = 0.5 and γc = 1. i0,a and i0,c refer to the exchange current densities of the anode and cathode, respectively, and αa and αc are the anodic and cathode charge transfer coefficients. R is the universal gas constant, with R = 8.314 J·mol−1·K−1.
The equations about the above parameters are expressed as follows, respectively:
i 0 = i 0 , r e f , a exp E a , a c t R T 1 T T r e f , a       Anode i 0 , r e f , c exp E c , a c t R T 1 T T r e f , c       Cathode ,
η = φ s φ mem                             A n o d e φ s φ mem E 0         C a t h o d e ,
E 0 = 1.23 0.9 × 1 0 3 T 298 ,
where Ea,act and Ec,act represent the anodic and cathodic activation energy, respectively, Tref,a and Tref,c represent the reference temperature of anode and cathode, respectively, i0,ref,a and i0,ref,c represent the reference exchange current density of the anode and cathode at the specified reference temperature, respectively, and E0 represents the open-circuit voltage.
Dissolved water exists in the catalyst layer and the PEM, and its generation and transport are described as follows:
I i o n 2.5 22 F λ M H 2 O = M H 2 O D λ λ + S w + S v l d ,
where Iion represents the ionic current density, Sw represents the source term for dissolved water, Svl−d represents the mass change rate between dissolved water and liquid or vapor water, and Dλ is the water diffusivity in the membrane; λ represents balance moisture content.
The equations about the above parameters are expressed as follows, respectively:
S w = M H 2 O 2 F j c       C a t h o d e   C L 0                           PEM   a n d   a n o d e   C L ,
S v l d = 1 s γ v d ρ m e m E W λ e q λ s γ l d ρ m e m E W λ e q λ ,
D λ = 3.1 × 1 0 7 λ e 0.28 λ 1 e 2346 / T 0 < λ 3 4.17 × 1 0 8 λ λ + 161 e λ e 2346 / T λ > 3 ,
where EW represents the equivalent weight of the membrane, λeq represents the equilibrium water content, ρmem represents the density of the membrane, and γvd and γld represent the mass change rates of water vapor to dissolved water and liquid water to dissolved water.
The transport of liquid water in porous medium is driven by capillary forces:
ρ l K K r μ l p c + p + S v l = 0 ,
p c = σ cos θ c K / ε 0.5 1.417 1 s 2.12 1 s 2 + 1.263 1 s 3 θ c < 90 ° σ cos θ c K / ε 0.5 1.417 s 2.12 s 2 + 1.263 s 3 θ c > 90 ° ,
where K and Kr represent the absolute permeability and relative permeability, respectively, pc represents the capillary pressure, θc represents the contact angle, and Sv−l refers to the phase change between liquid and vapor water, which is expressed as follows:
S v l = γ e ε s M H 2 O R T p ln p p sat p p wv p wv p sat γ e ε 1 s M H 2 O R T p ln p p sat p p wv p wv > p sat ,
where γe represents the geometric correction factor for droplet size, and pwv and psat represent the vapor pressure of water and saturated water, respectively.
The transport of liquid water in the channel is described by:
ρ l u s = D l s ,
where Dl represents the diffusion coefficient of liquid water.

2.3. Boundary Conditions

A symmetry boundary condition is employed at the outer surfaces of the GDL and CL, while zero fluxes and a non-slip boundary condition is used at all other surfaces excluding the channel inlet and outlet. Reference potentials are specified at the channel–GDL interfaces of the anode and cathode. Specifically, the anode and cathode voltage is 0 V and the open-circuit voltage, respectively [40]. In the numerical investigations, the cathode voltage is changed from 0.9 V to 0.35 V in steps of 0.05 V [41].

2.4. Grid Independence Study

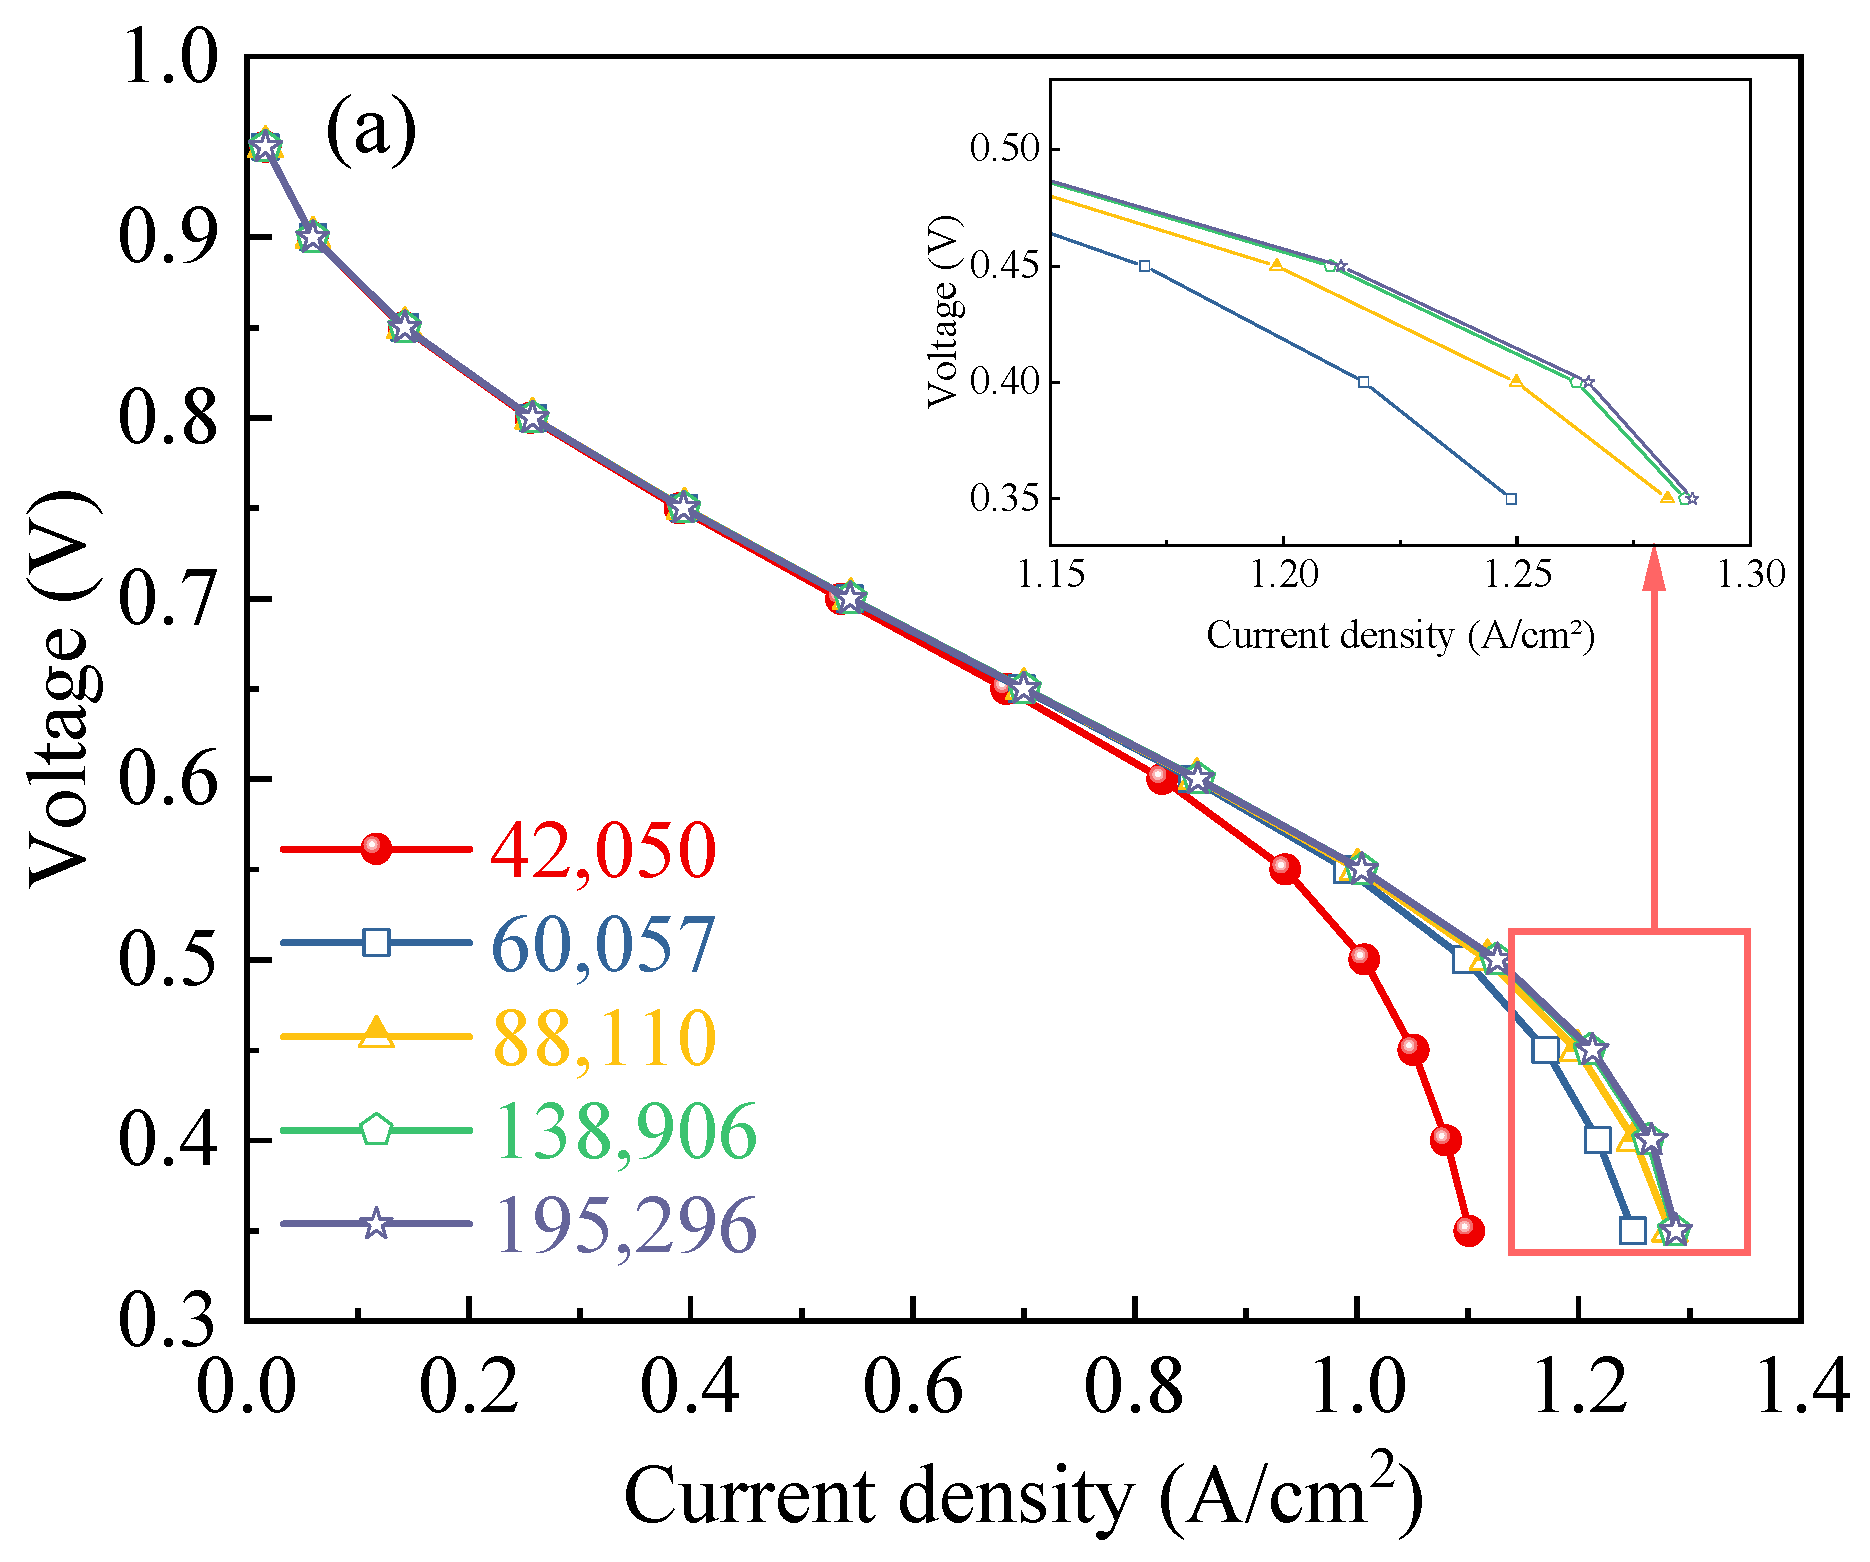
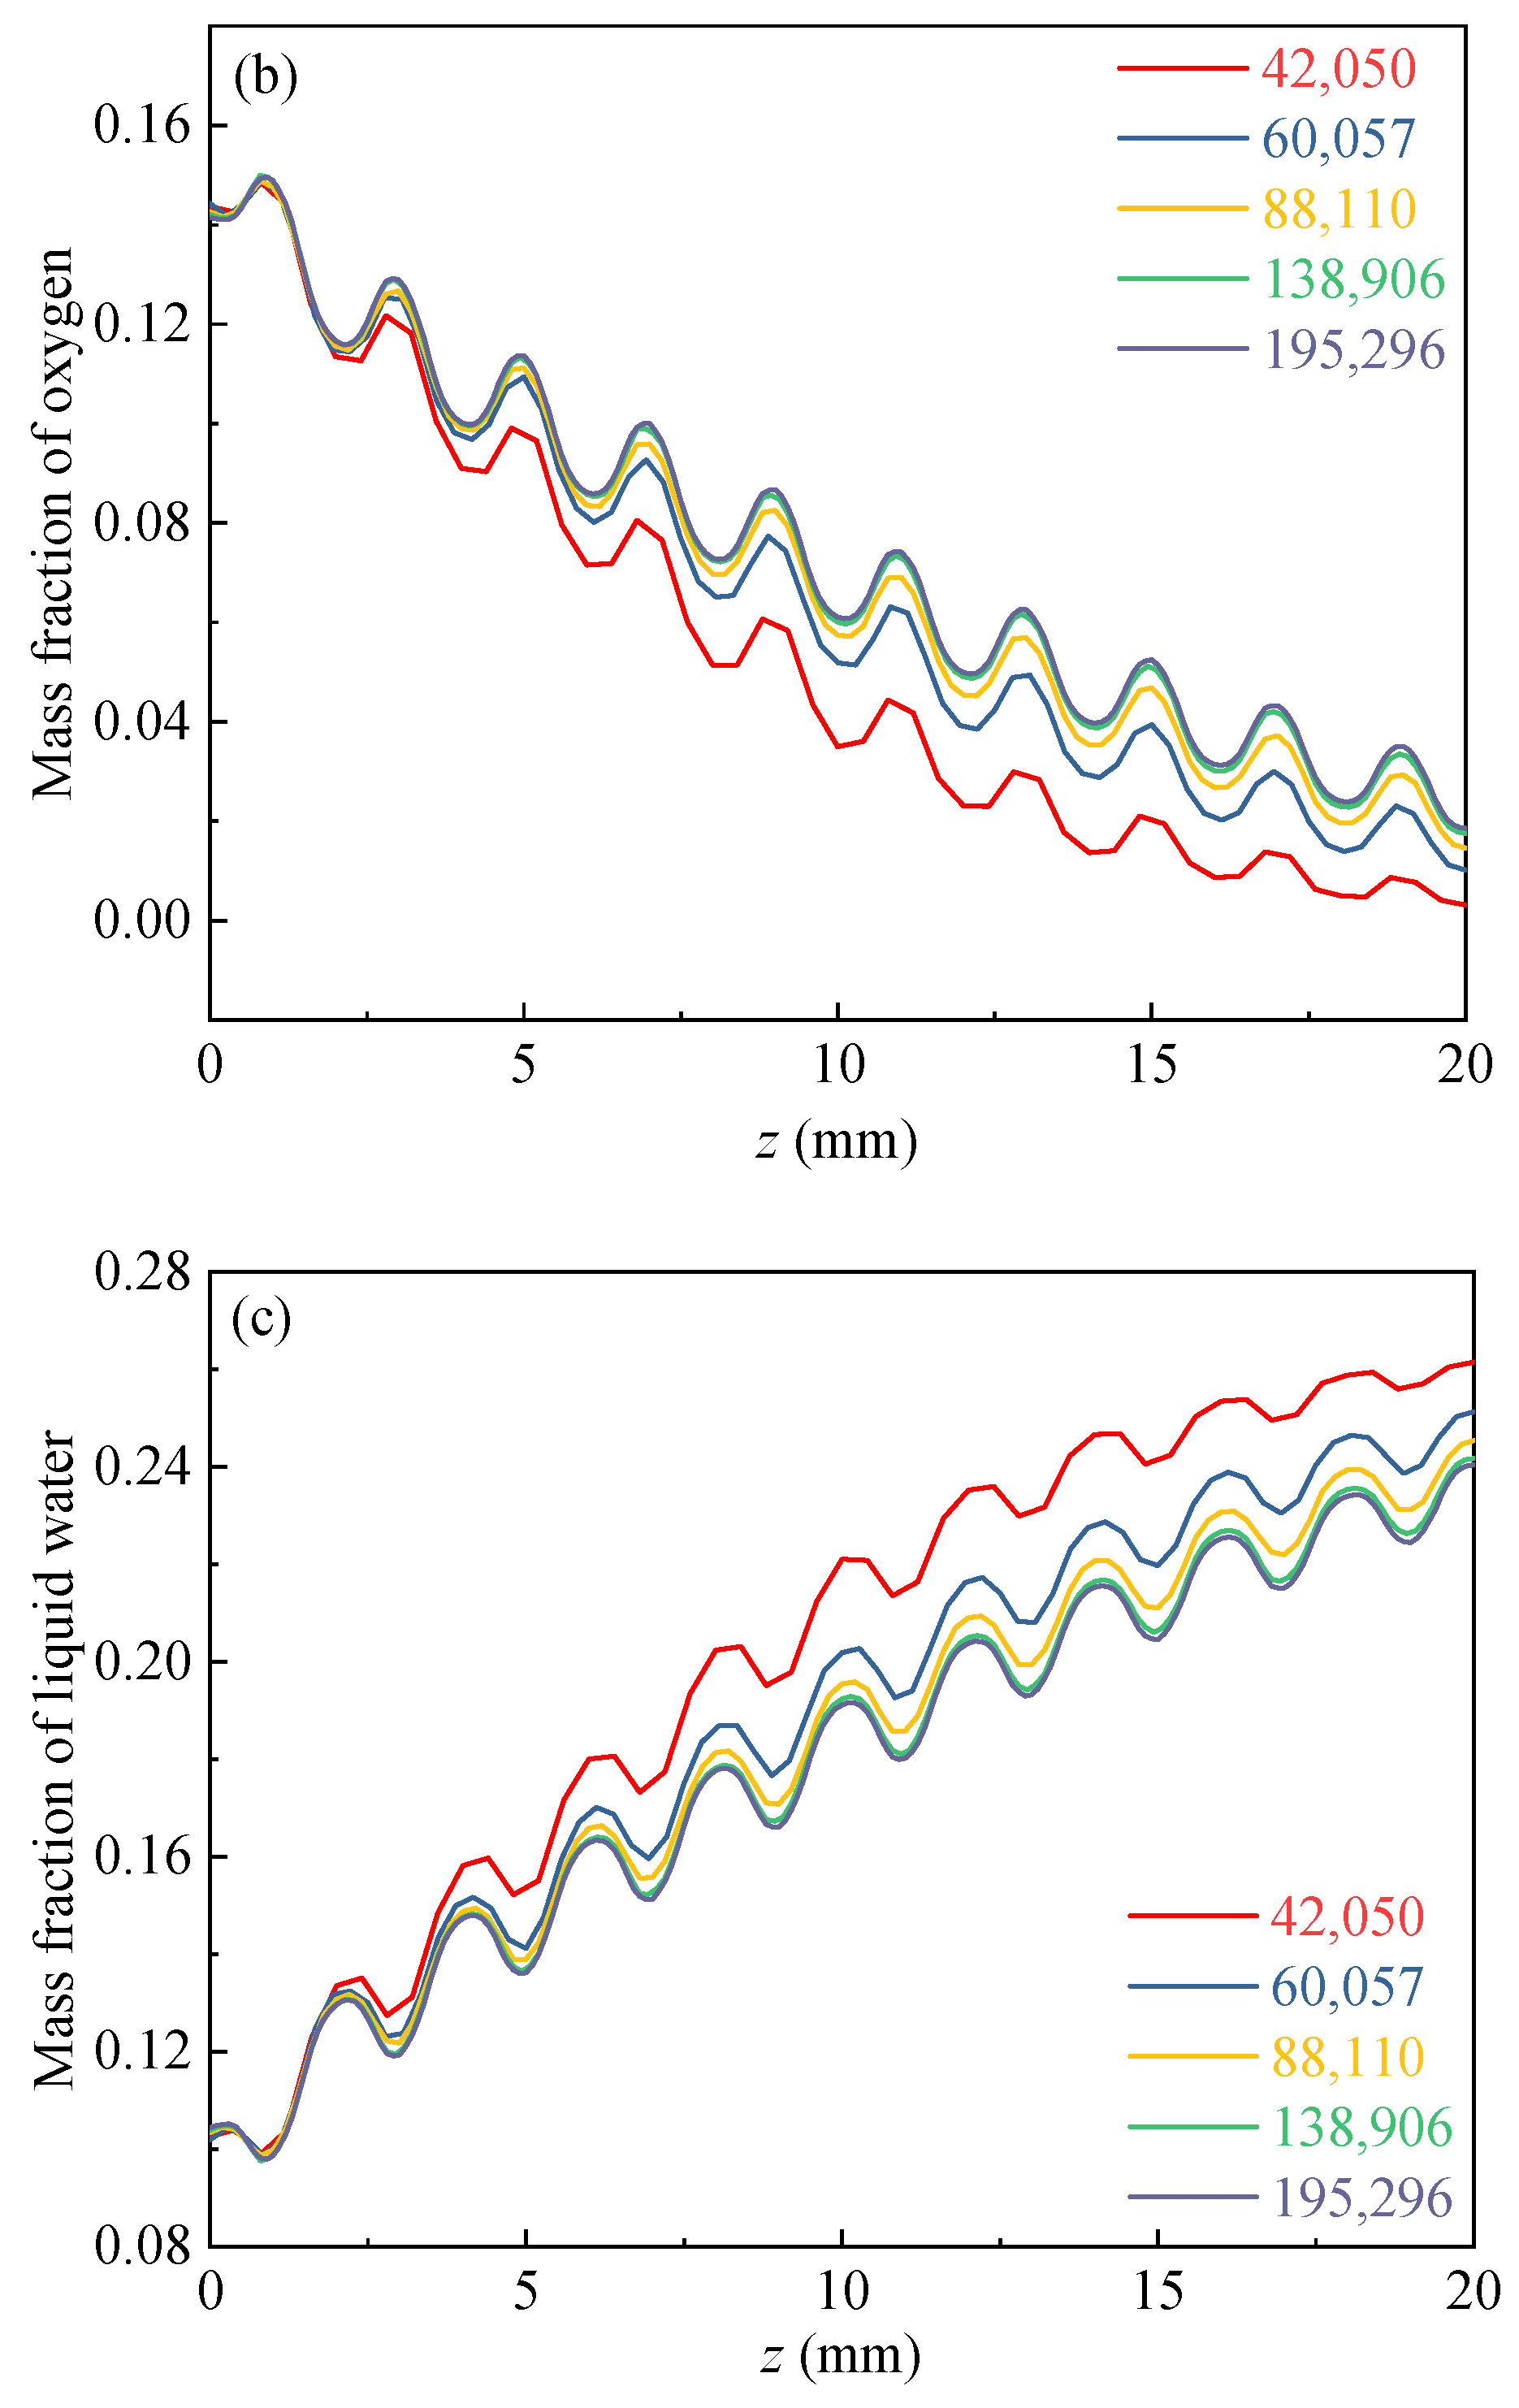
To select an appropriate grid size for balancing numerical accuracy and computational time, five mesh models of Case 3 are generated, and the software COMSOL Multiphysics 6.0 is used to compute the above numerical model. As shown in Figure 2a, the polarization curves gradually converge as the grid number increases. When the grid count reaches 138,906 and 195,296, the polarization curves are basically overlapped. Meanwhile, as illustrated in the distribution profiles of oxygen mass fraction (Figure 2b) and liquid water mass fraction (Figure 2c) along the flow channel for different grid numbers, the simulated two-phase transport characteristics exhibit no significant variations with further mesh refinement once the grid number reaches 138,906. This means that the grid number of 138,906 is enough for capturing the performance characteristics of the PEMFC. And the overall computational cost is within a reasonable range. Therefore, the mesh model with the grid number of 138,906 is adopted in the subsequent studies.

2.5. Model Validation

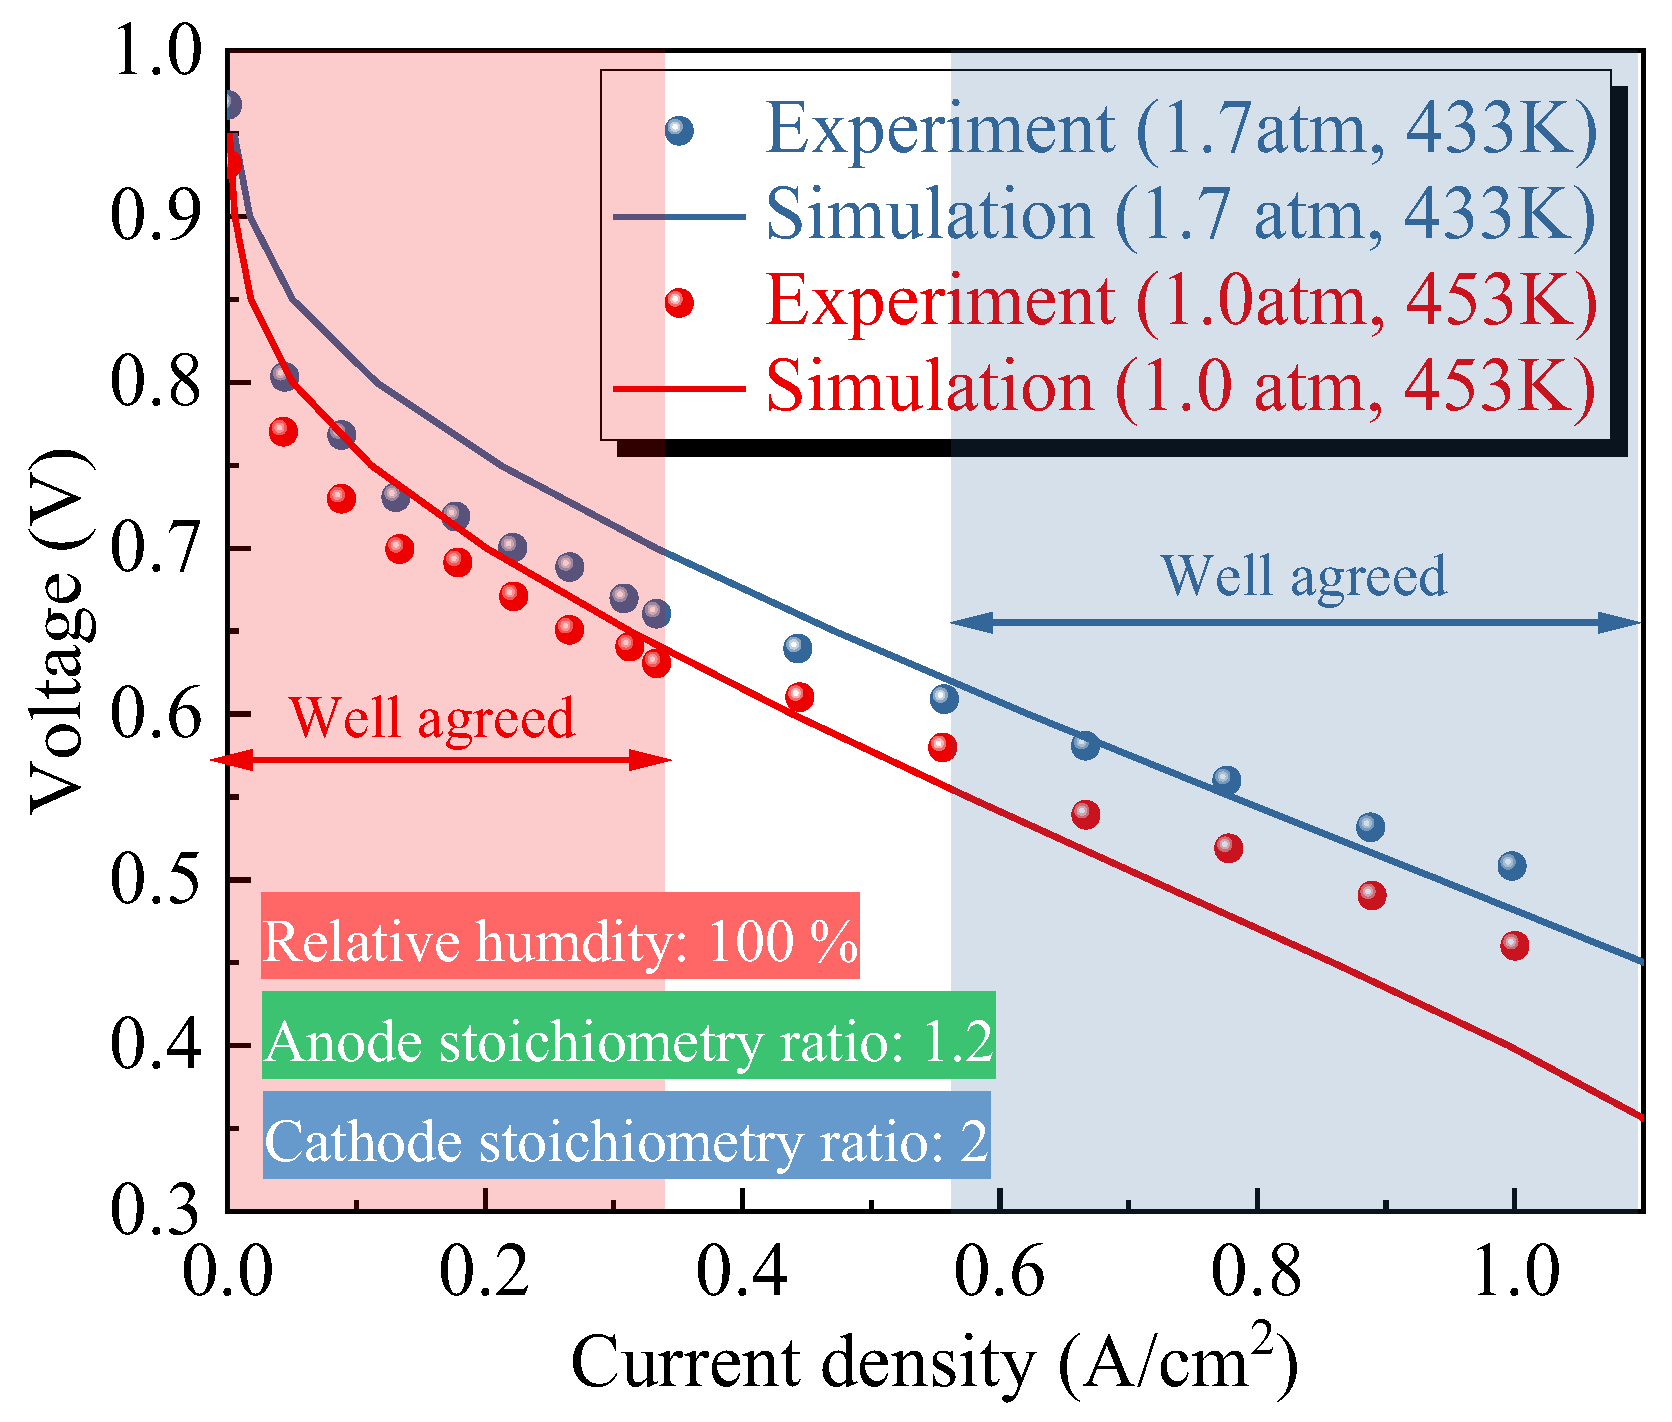
To validate the above numerical model, the polarization curve results are compared with experimental data from the literature [42,43]. To ensure the objectivity of model validation, all parameters in the numerical model are kept identical to those used in the experiments. As observed in Figure 3, under operating conditions of 1.7 atm and 433 K, the numerical results agree well with the experimental data at high current densities, while a larger relative error is observed at low current densities. When the operating pressure and temperature are 1.0 atm and 453 K, respectively, the numerical results show good agreement with the experimental data at low current densities, but the relative error increases at high current densities. Therefore, with the above experiment validation, the above numerical model is considered to be reliable and accurate, and it can be used for subsequent simulations.

3. Results

3.1. Effects of Groove Structure

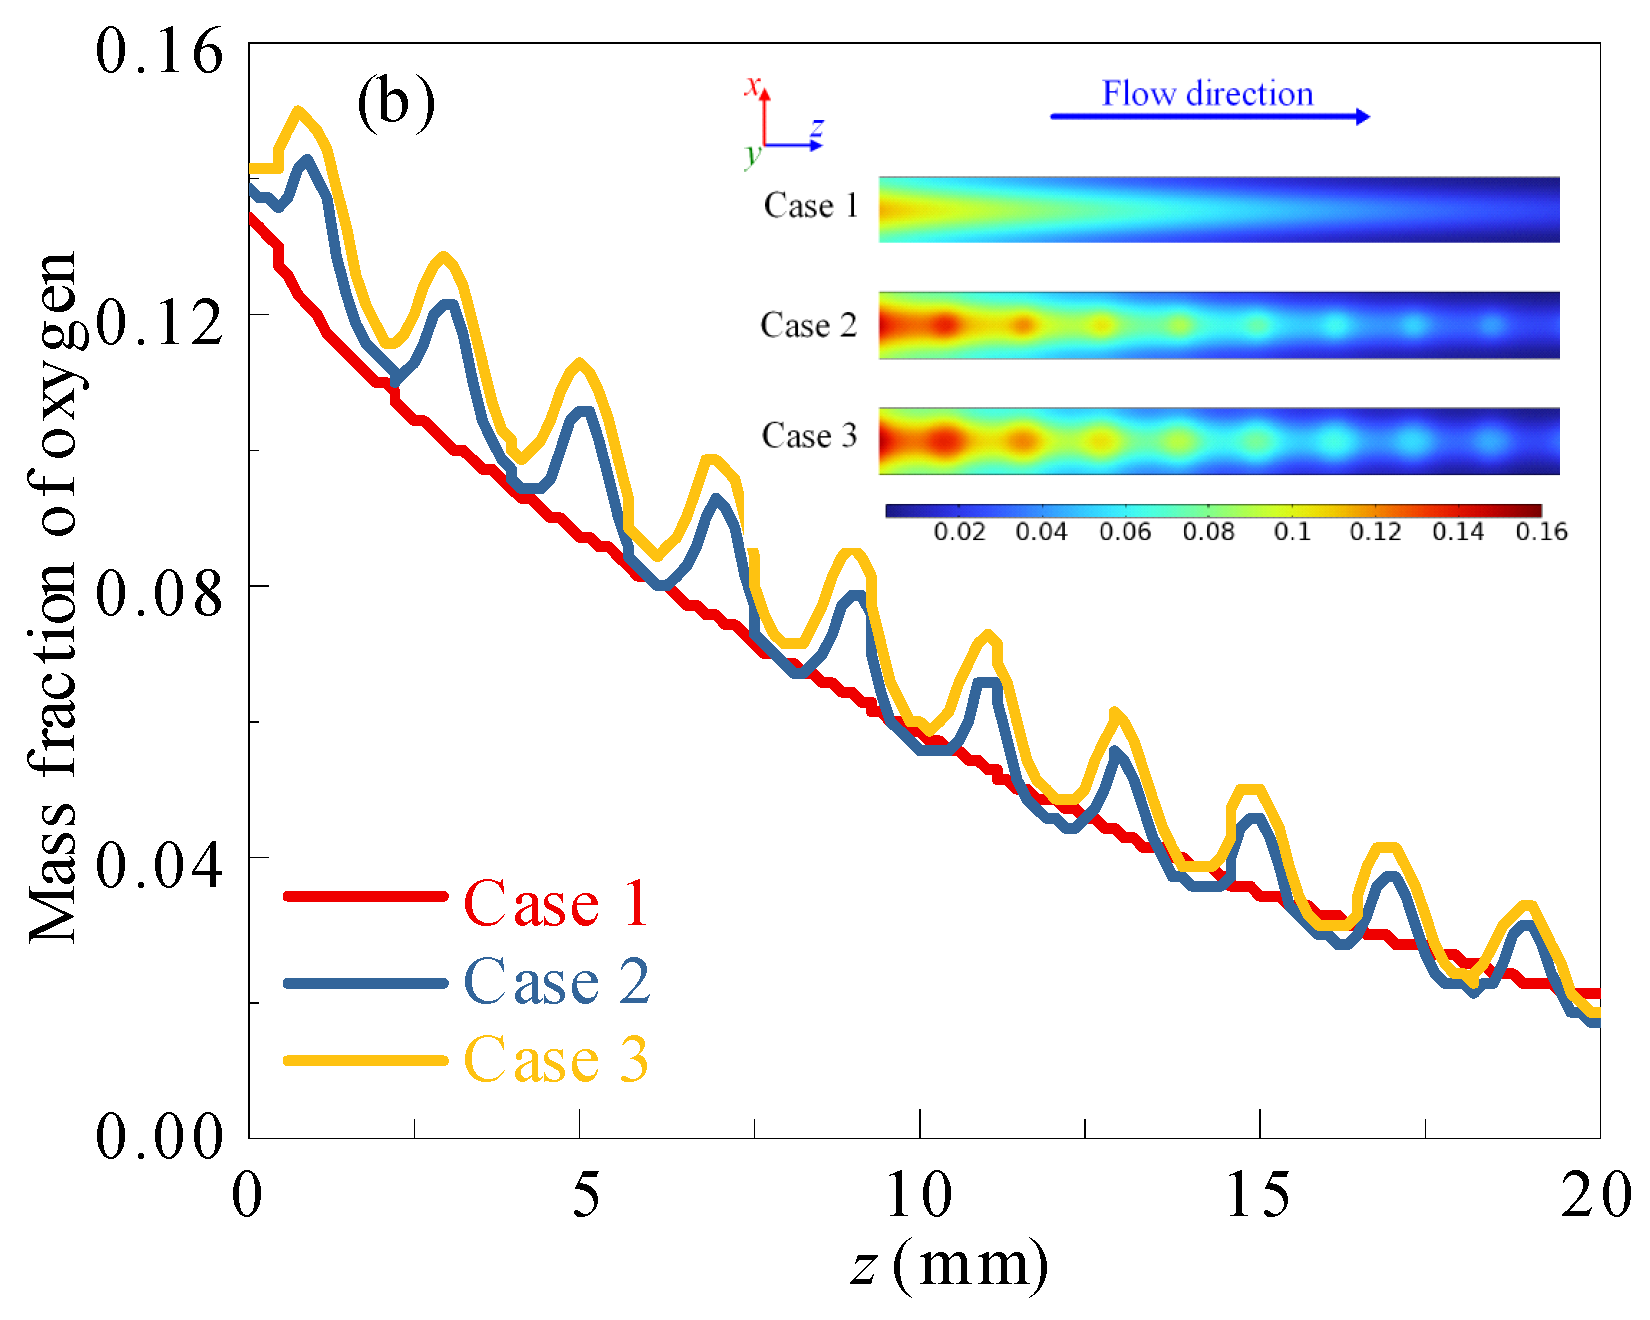
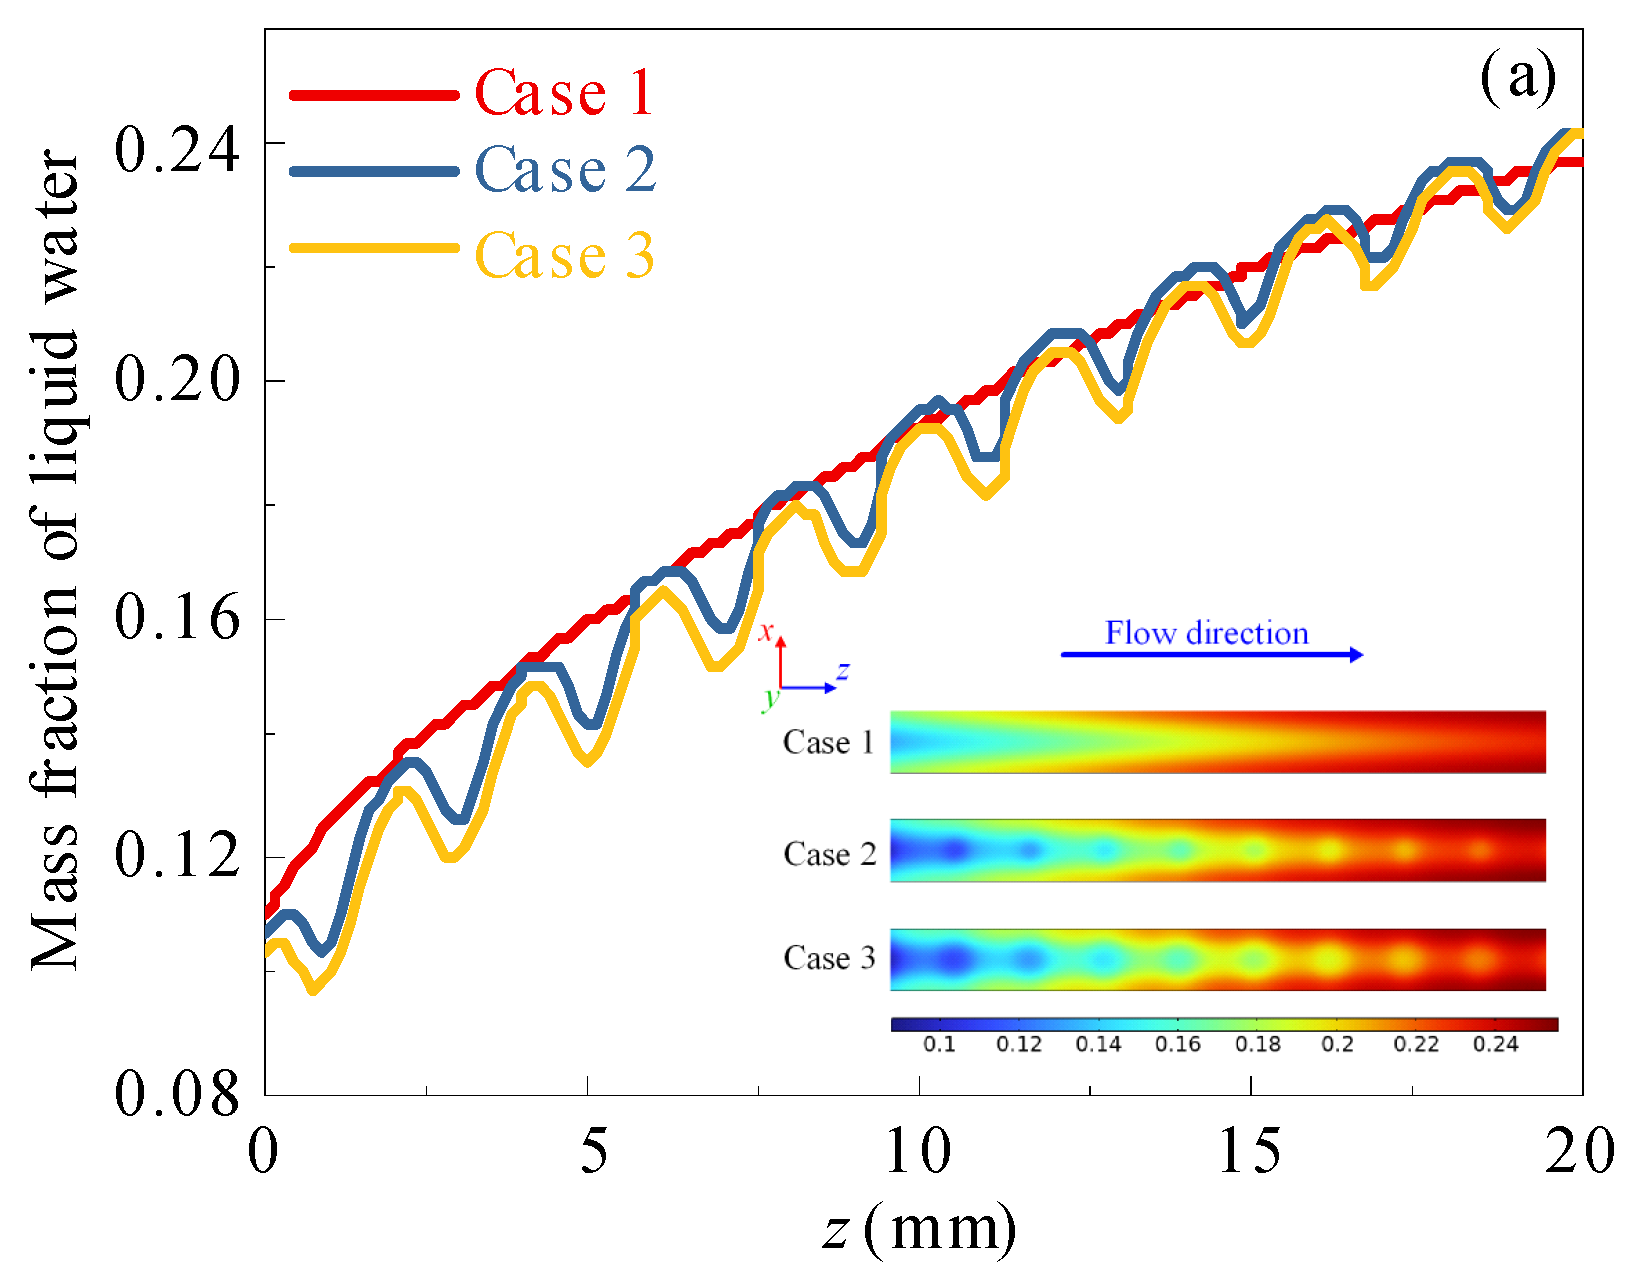
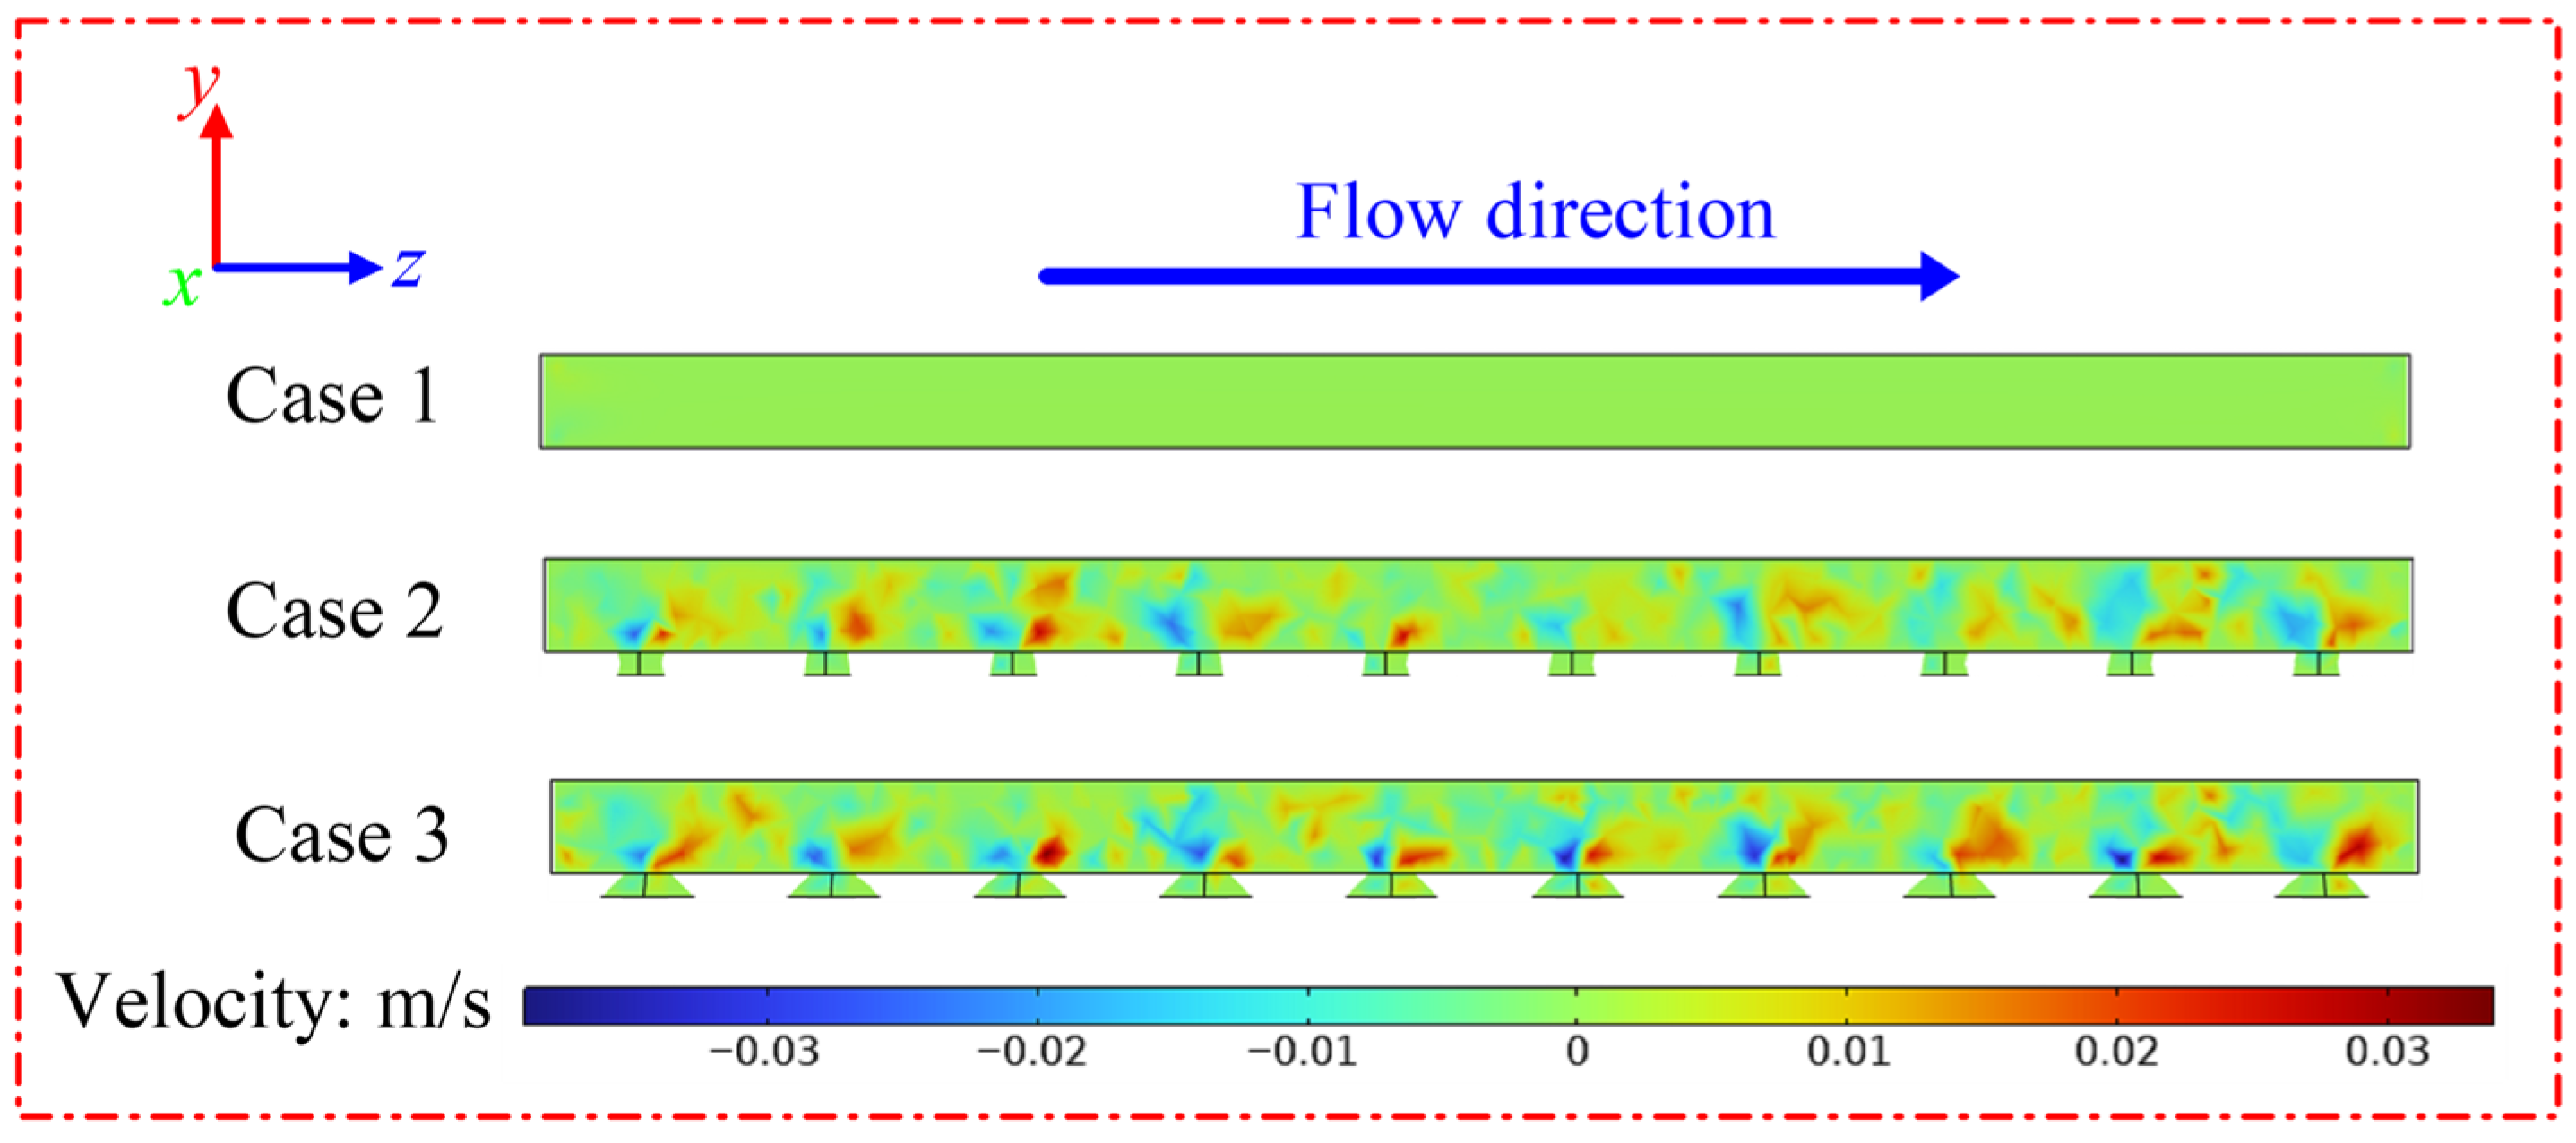
Liquid water accumulation hinders oxygen transport and exacerbates concentration polarization. This severely impairs the electrochemical reaction at the cathode GDL-CL interface and further reduces power density. Figure 4 illustrates the effects of groove structure on the liquid water and oxygen distributions at the cathode GDL-CL interface under 0.5 V. It is observed that the mass fraction of liquid water gradually increases along the flow direction, while the mass fraction of oxygen gradually decreases. This occurs because water is generated and oxygen is consumed as the electrochemical reaction proceeds. Moreover, when pouching grooves in the cathode GDL, the mass fraction variation curves of liquid water and oxygen around the grooves fluctuate. Liquid water is discharged into the channel by capillary pressure. The oxygen transfer distance to the CL surface is shortened by the reduction in GDL thickness at the grooves. This allows oxygen to more easily penetrate the GDL and reach the CL surface. Finally, Case 3 exhibits the lowest liquid water mass fraction and the highest oxygen mass fraction. This indicates that Case 3 has superior water removal and oxygen transport performance compared to Case 1 and Case 2. This is due to gas diffusion being the main driving force of gas entering into the GDL when no grooves pouch in the cathode GDL. However, when grooves are patterned, the water removal and oxygen transport pathways are widened. Especially, the bottom radius of conical frustum grooves is larger than that of cylindrical grooves, significantly improving the y-direction gas velocity of the cathode channel, as observed in Figure 5.
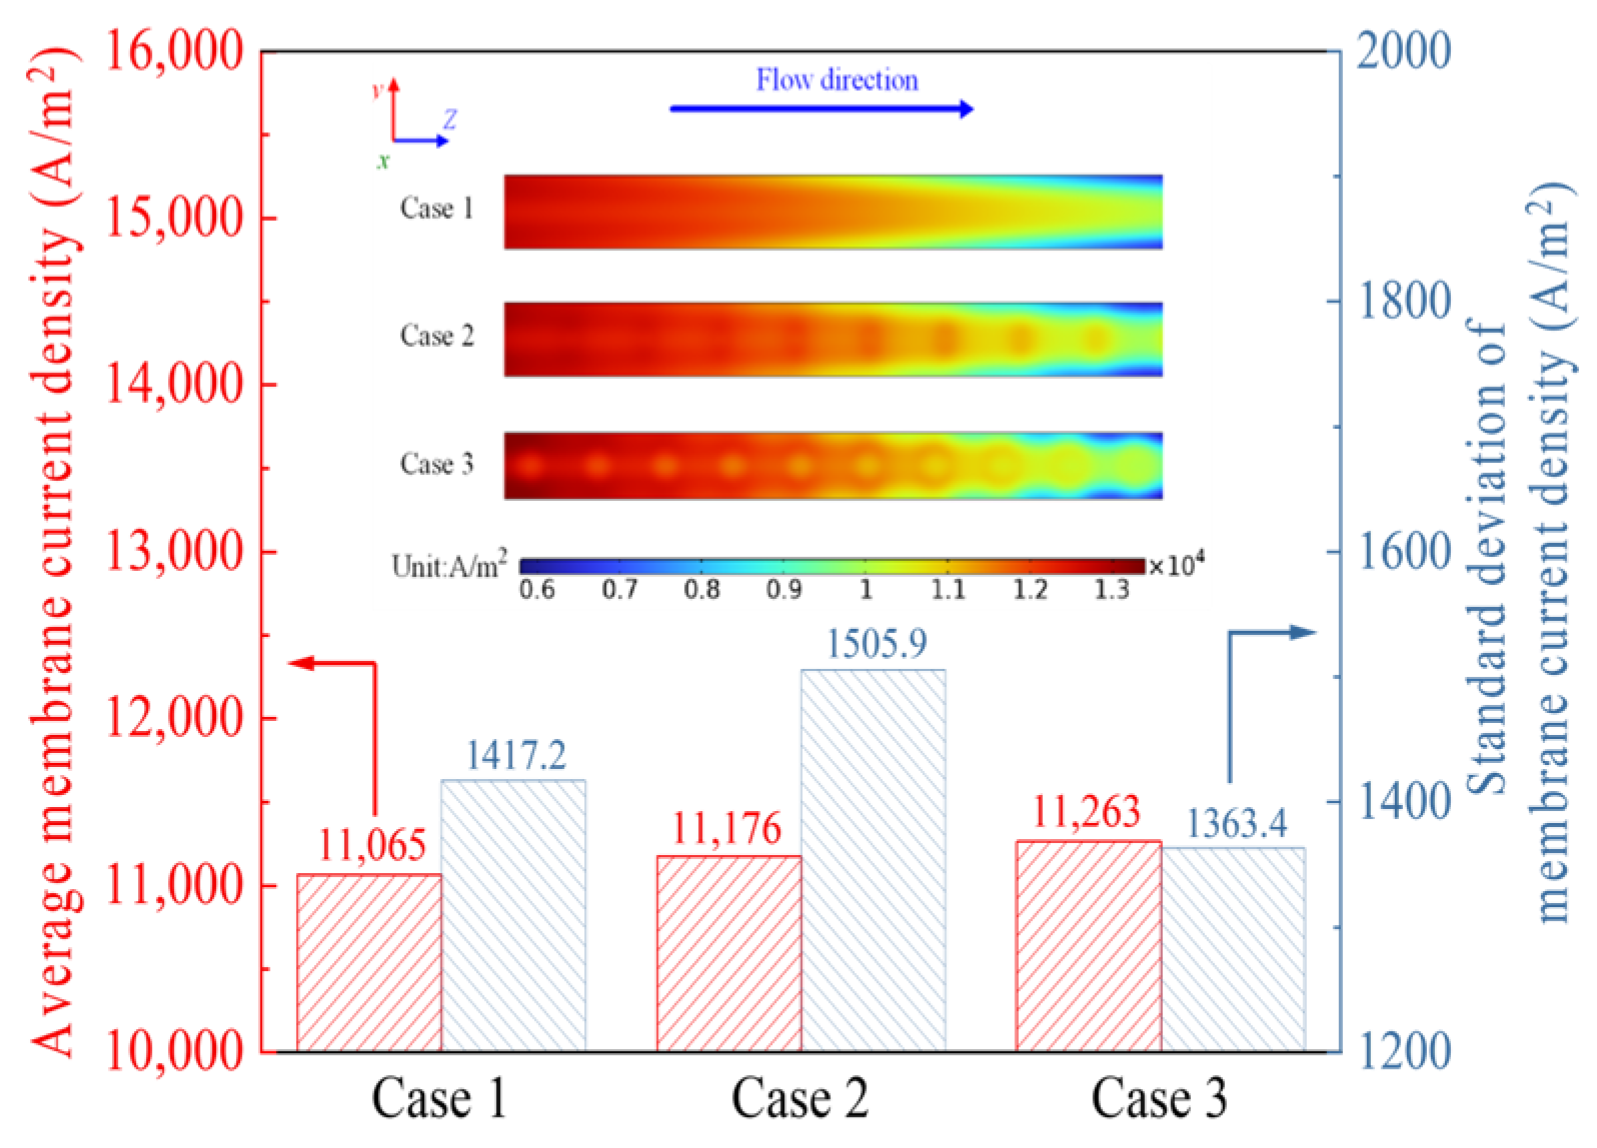
A higher and more uniform membrane current density is beneficial for achieving good PEMFC performance. Figure 6 illustrates the effects of groove structure on the membrane current density at 0.5 V. The results show that Case 2 has a higher average membrane current density and a larger standard deviation than Case 1. This suggests that pouching cylindrical grooves in the cathode GDL can improve the membrane current density but its uniformity becomes poor. Additionally, Case 3 exhibits the highest average membrane current density and the lowest standard deviation. This suggests that compared with pouching cylindrical grooves in the cathode GDL, pouching conical frustum grooves are more effective at achieving a higher and more uniform membrane current density.
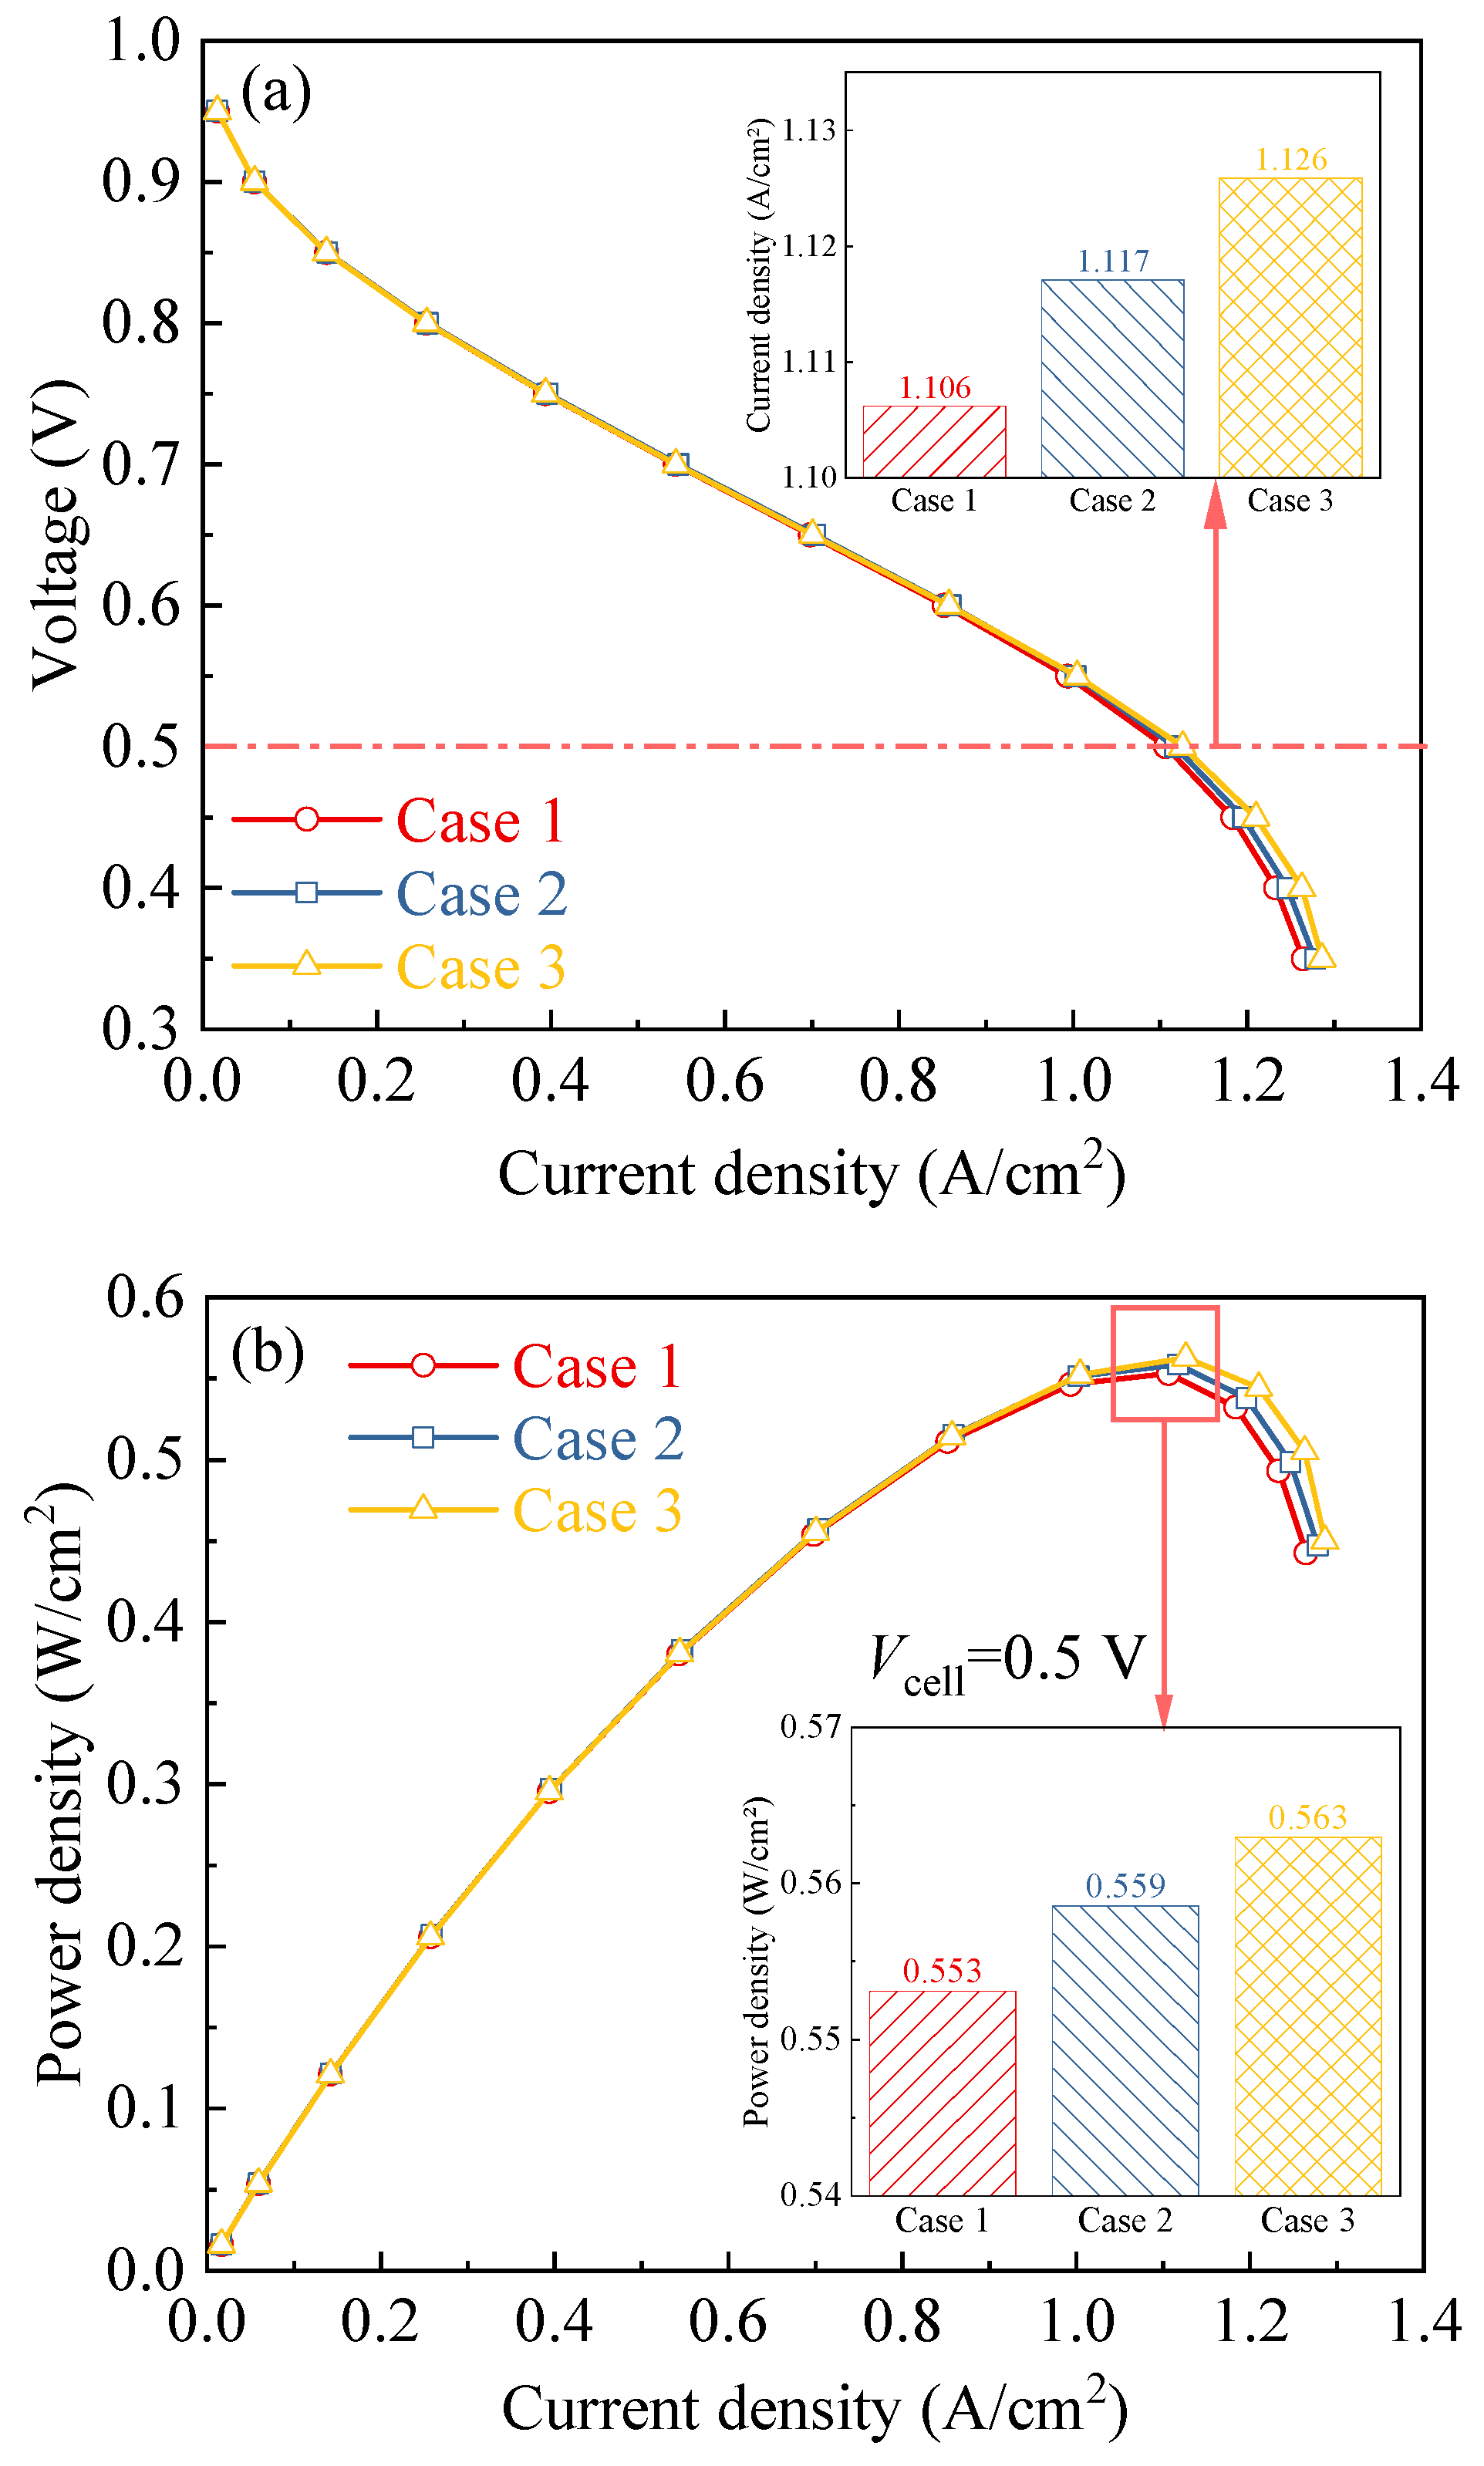
Figure 7 shows the effects of groove structure on the electrical performance. It can be seen that at low current densities, the polarization and power density curves of all cases are nearly identical. However, at high current densities, Case 3 achieves the highest power density. Specifically, when the voltage is 0.5 V, the maximum power density of Case 3 is 0.7% higher than that of Case 2, and 1.8% higher than that of Case 1. This suggests that pouching conical frustum grooves in the cathode GDL is more effective for improving electrical performance.

3.2. Effects of Conical Frustum Groove Spacing

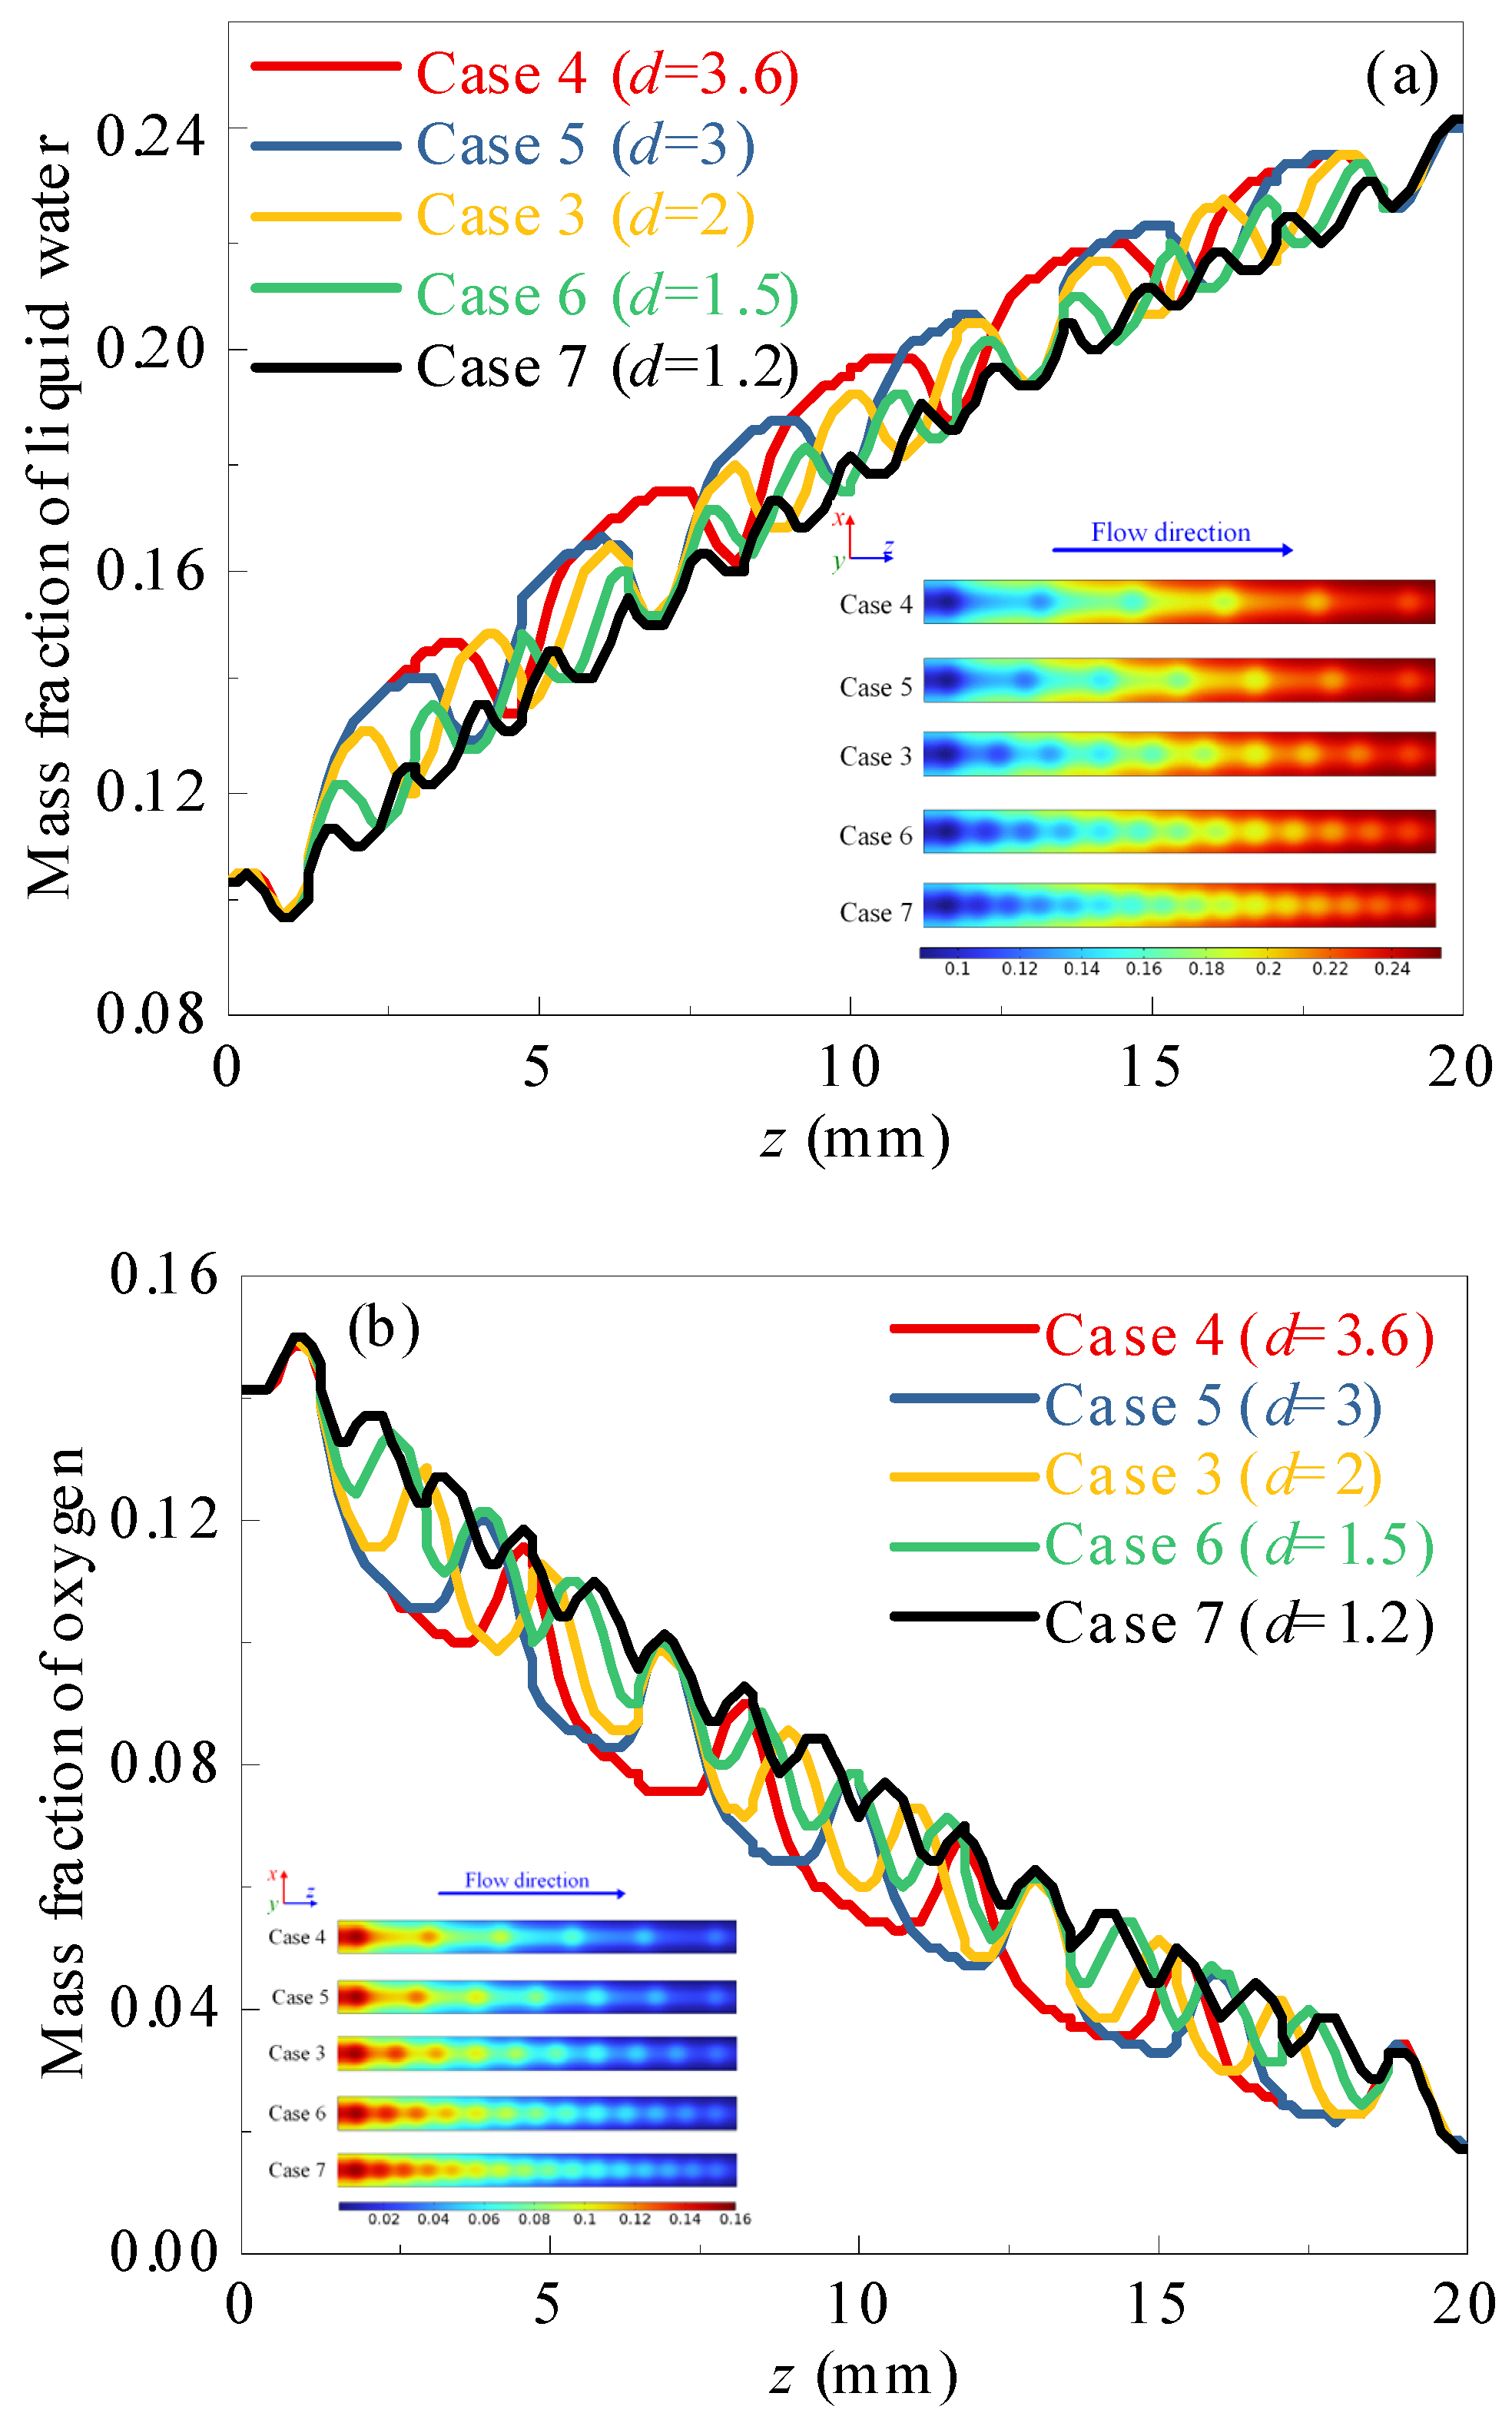
Figure 8 illustrates the effects of conical frustum groove spacing on liquid water and oxygen distribution at the cathode GDL-CL interface at 0.5 V. The results show that both the fluctuation amplitude and period of the mass fraction profiles for liquid water and oxygen decrease as groove spacing is shortened. Additionally, the average mass fraction of liquid water decreases while the average mass fraction of oxygen increases with smaller groove spacing. This indicates that smaller groove spacing yields better water removal and oxygen transport performance. This is because a smaller spacing allows more grooves to be patterned, which widens the pathways for water removal and oxygen transport.
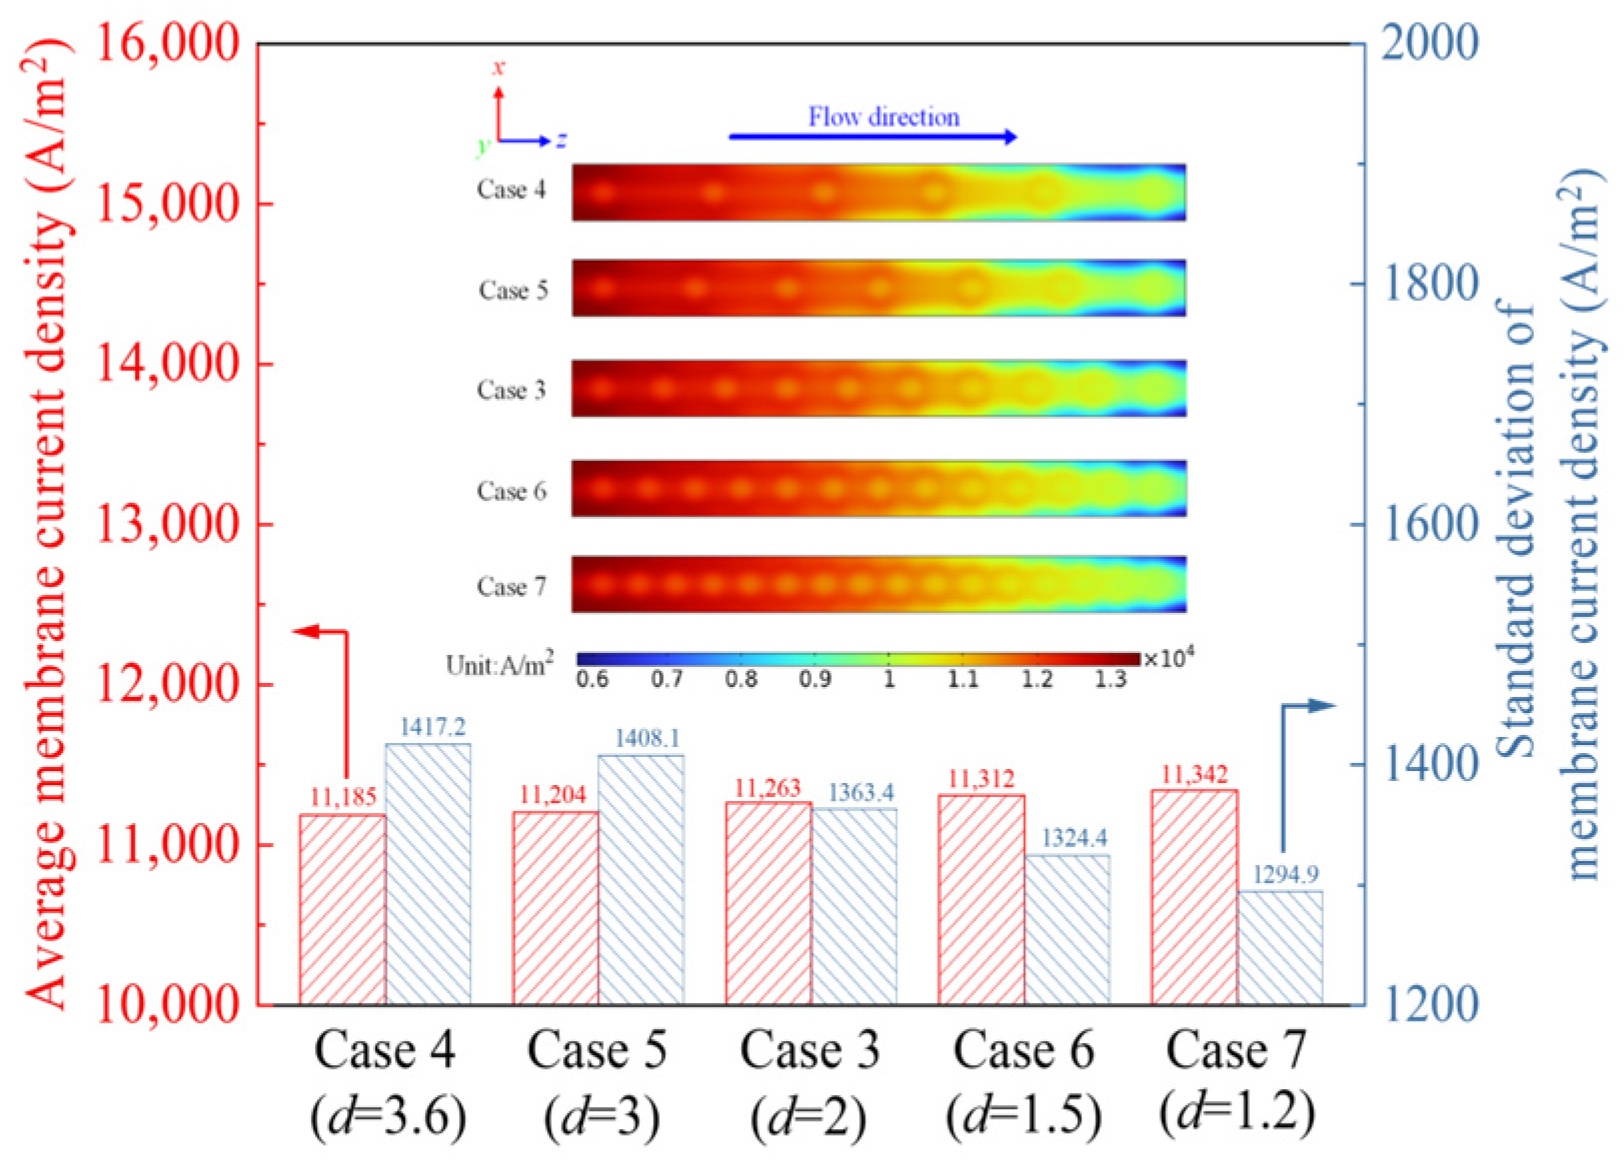
Figure 9 illustrates the effects of conical frustum groove spacing on the membrane current density at 0.5 V. It can be seen that the average membrane current density gradually increases as the groove spacing decreases. The standard deviation of the current density also gradually reduces. This indicates that the smaller groove spacing leads to a higher and more uniform membrane current density. This is because a reduced spacing allows more grooves to be patterned. This expands the pathways for water removal and oxygen transport, leading to more intense electrochemical reactions.
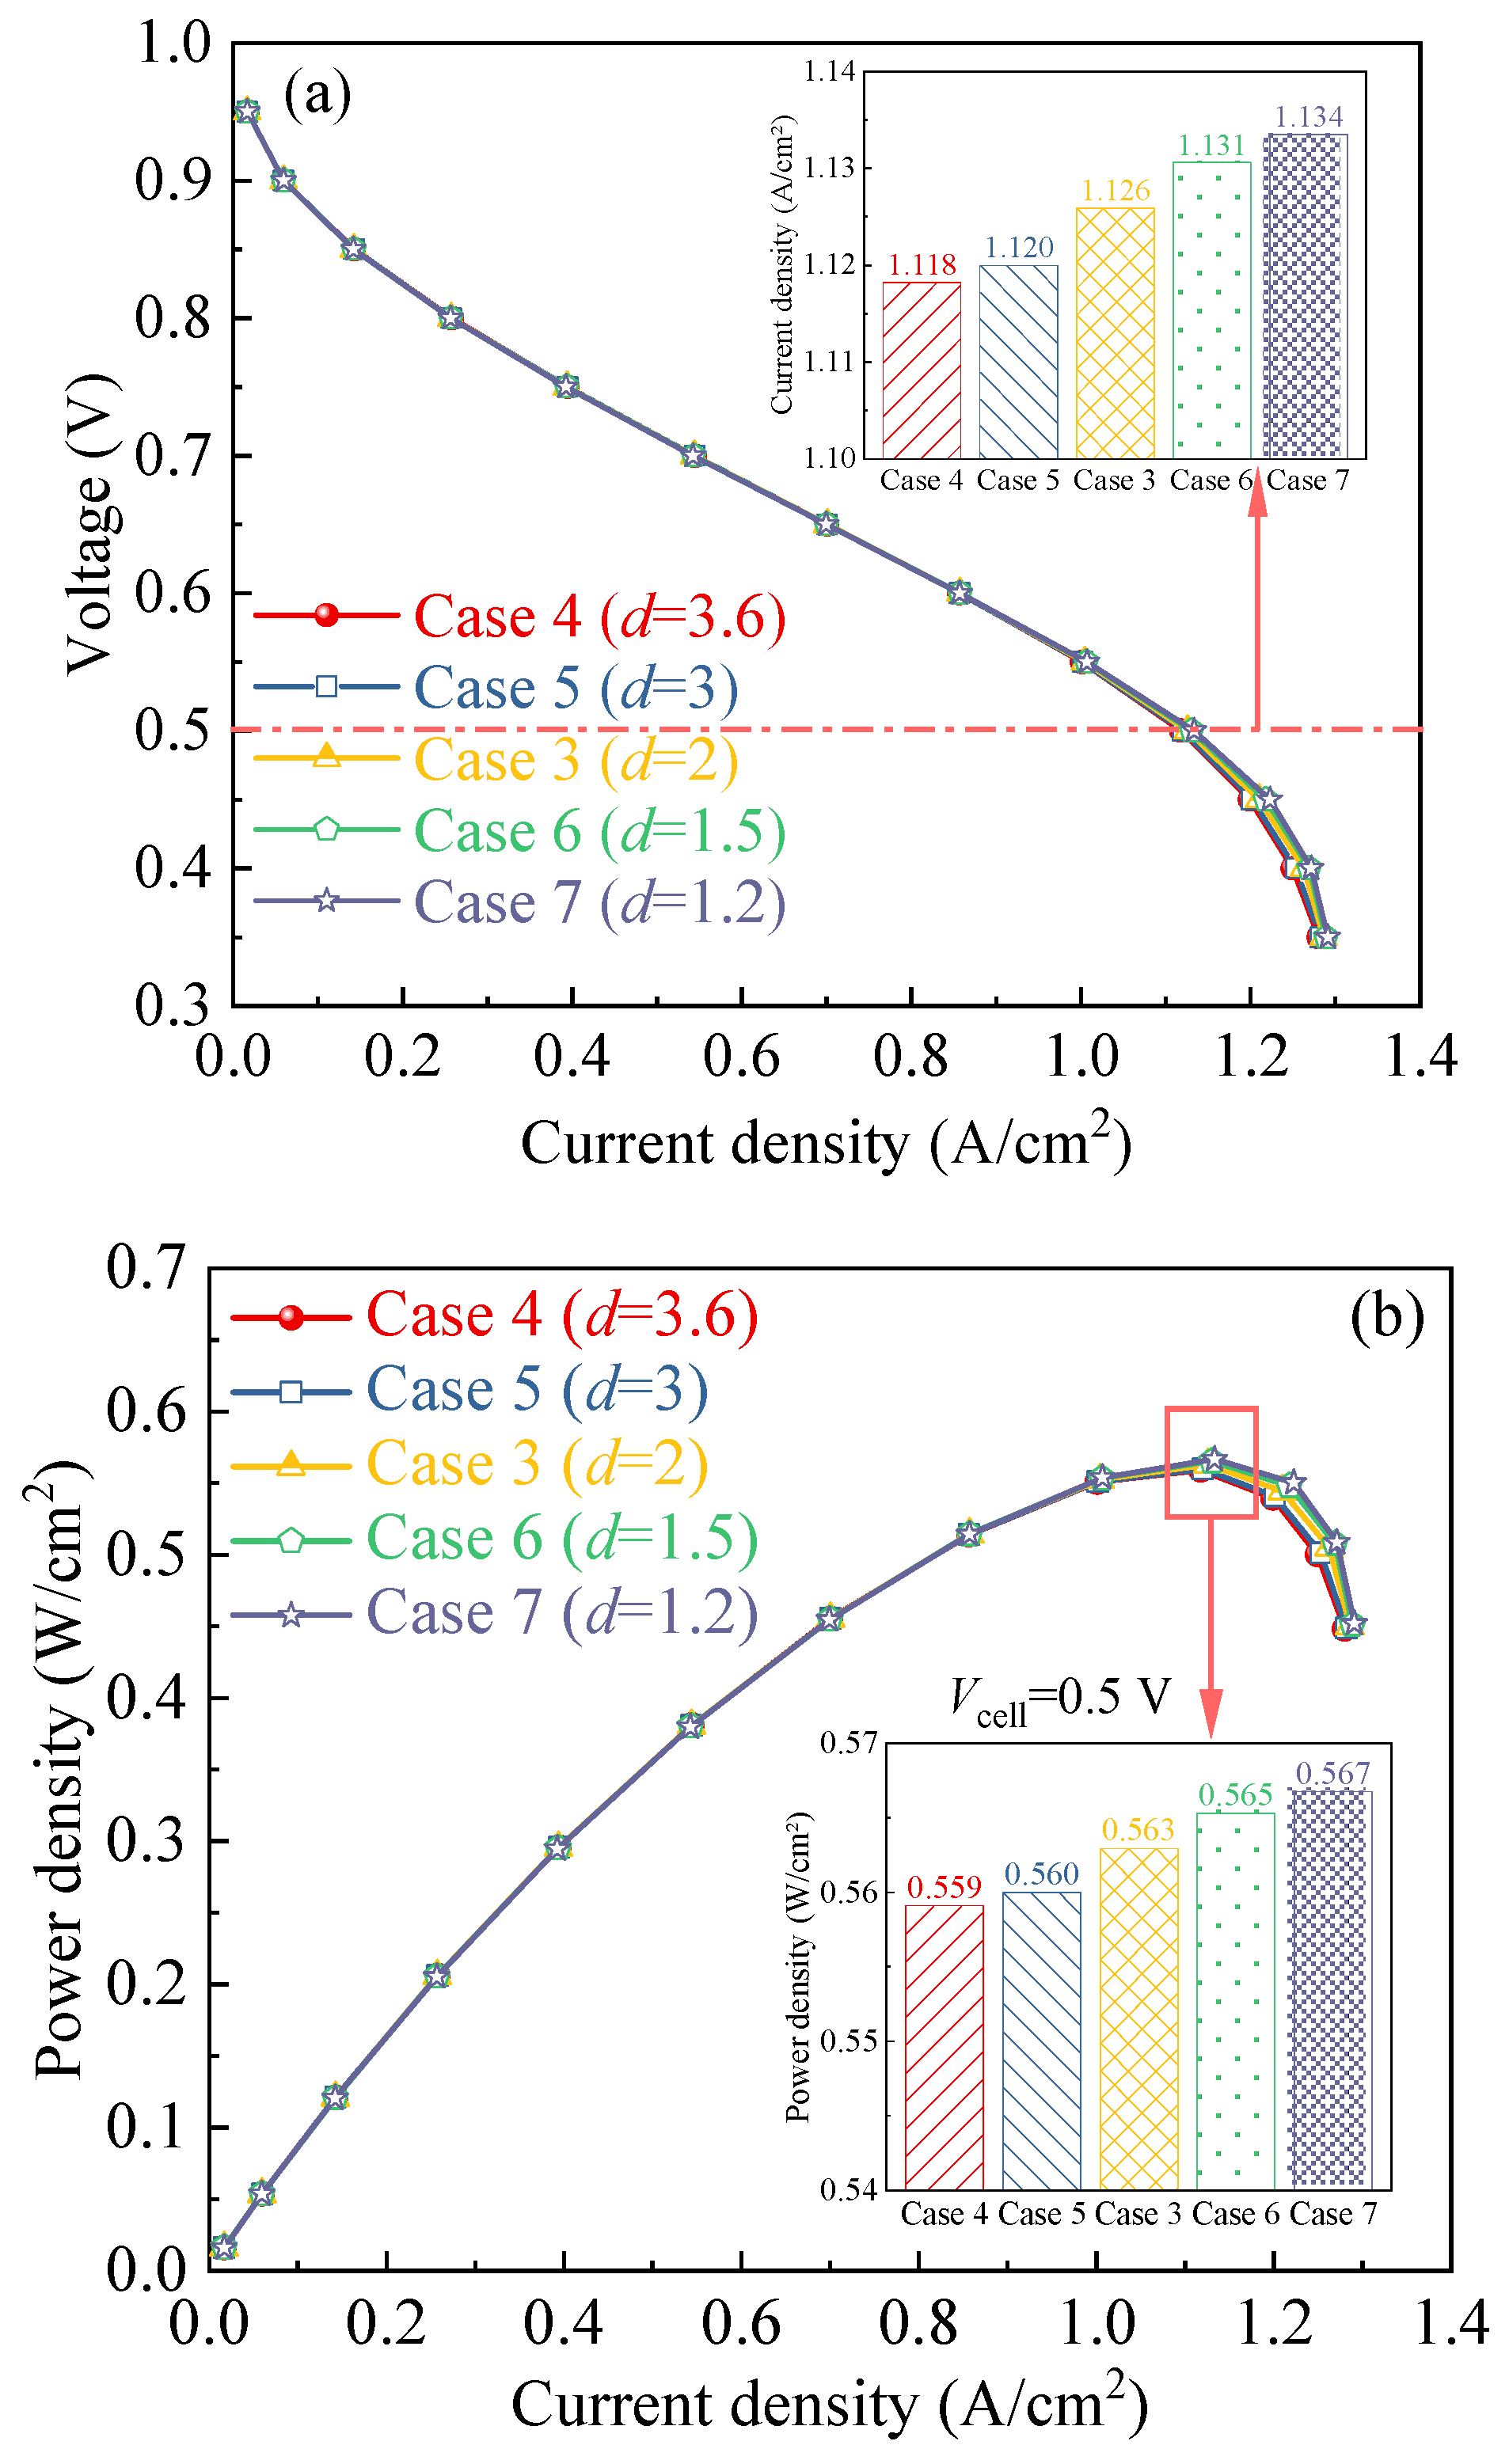
Figure 10 presents the effects of conical frustum groove spacing on electrical performance. The results show that at low current densities, the polarization and power density curves for all cases are nearly identical. However, at high current densities, power density increases as the groove spacing is reduced. Specifically, when the voltage is 0.5 V, the maximum power density rises from 0.559 W/cm2 to 0.567 W/cm2 as the groove spacing decreases from 3.6 mm to 1.2 mm.

3.3. Effects of Conical Frustum Groove Depth

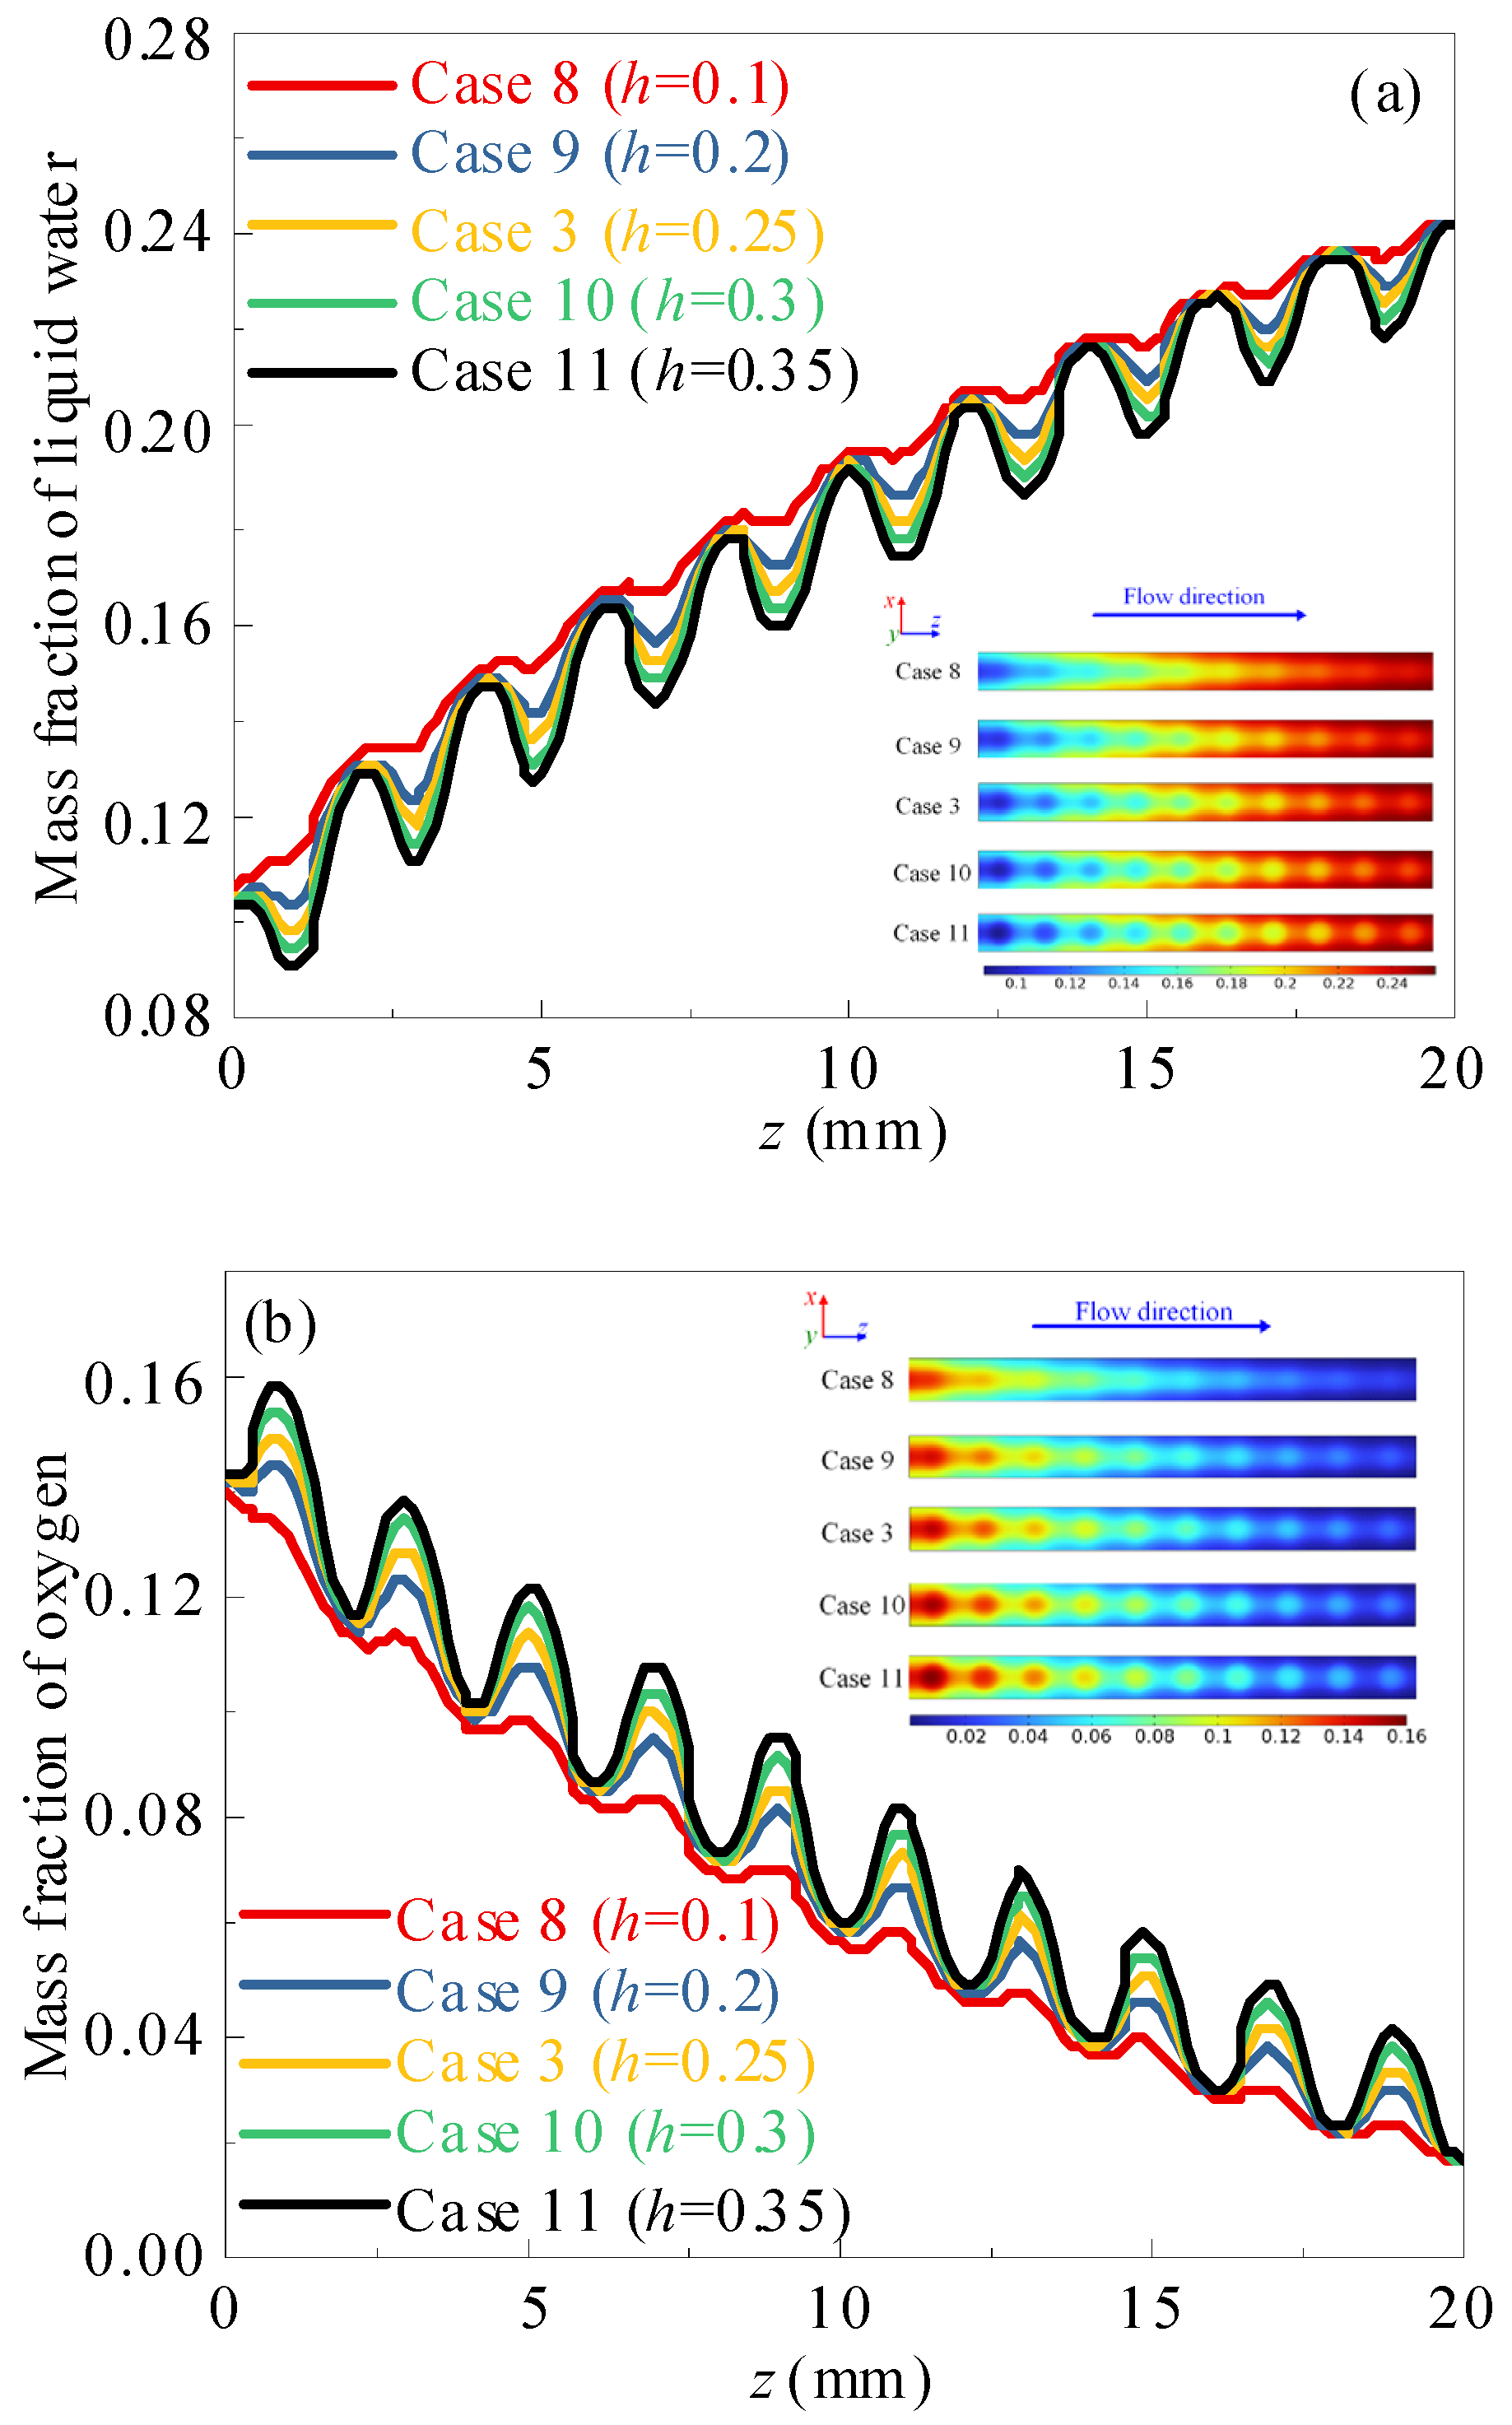
Figure 11 illustrates the effects of conical frustum groove depth on liquid water and oxygen distribution at the cathode GDL-CL interface at 0.5 V. The results show that the fluctuation amplitude of the mass fraction profiles for both liquid water and oxygen increases with greater groove depth. Additionally, the average mass fraction of liquid water decreases while the average mass fraction of oxygen increases as the groove depth increases. This indicates that deeper grooves yield better water removal and oxygen transport performance. This is because deeper grooves reduce the local GDL thickness, which diminishes the water removal and oxygen transport resistance.
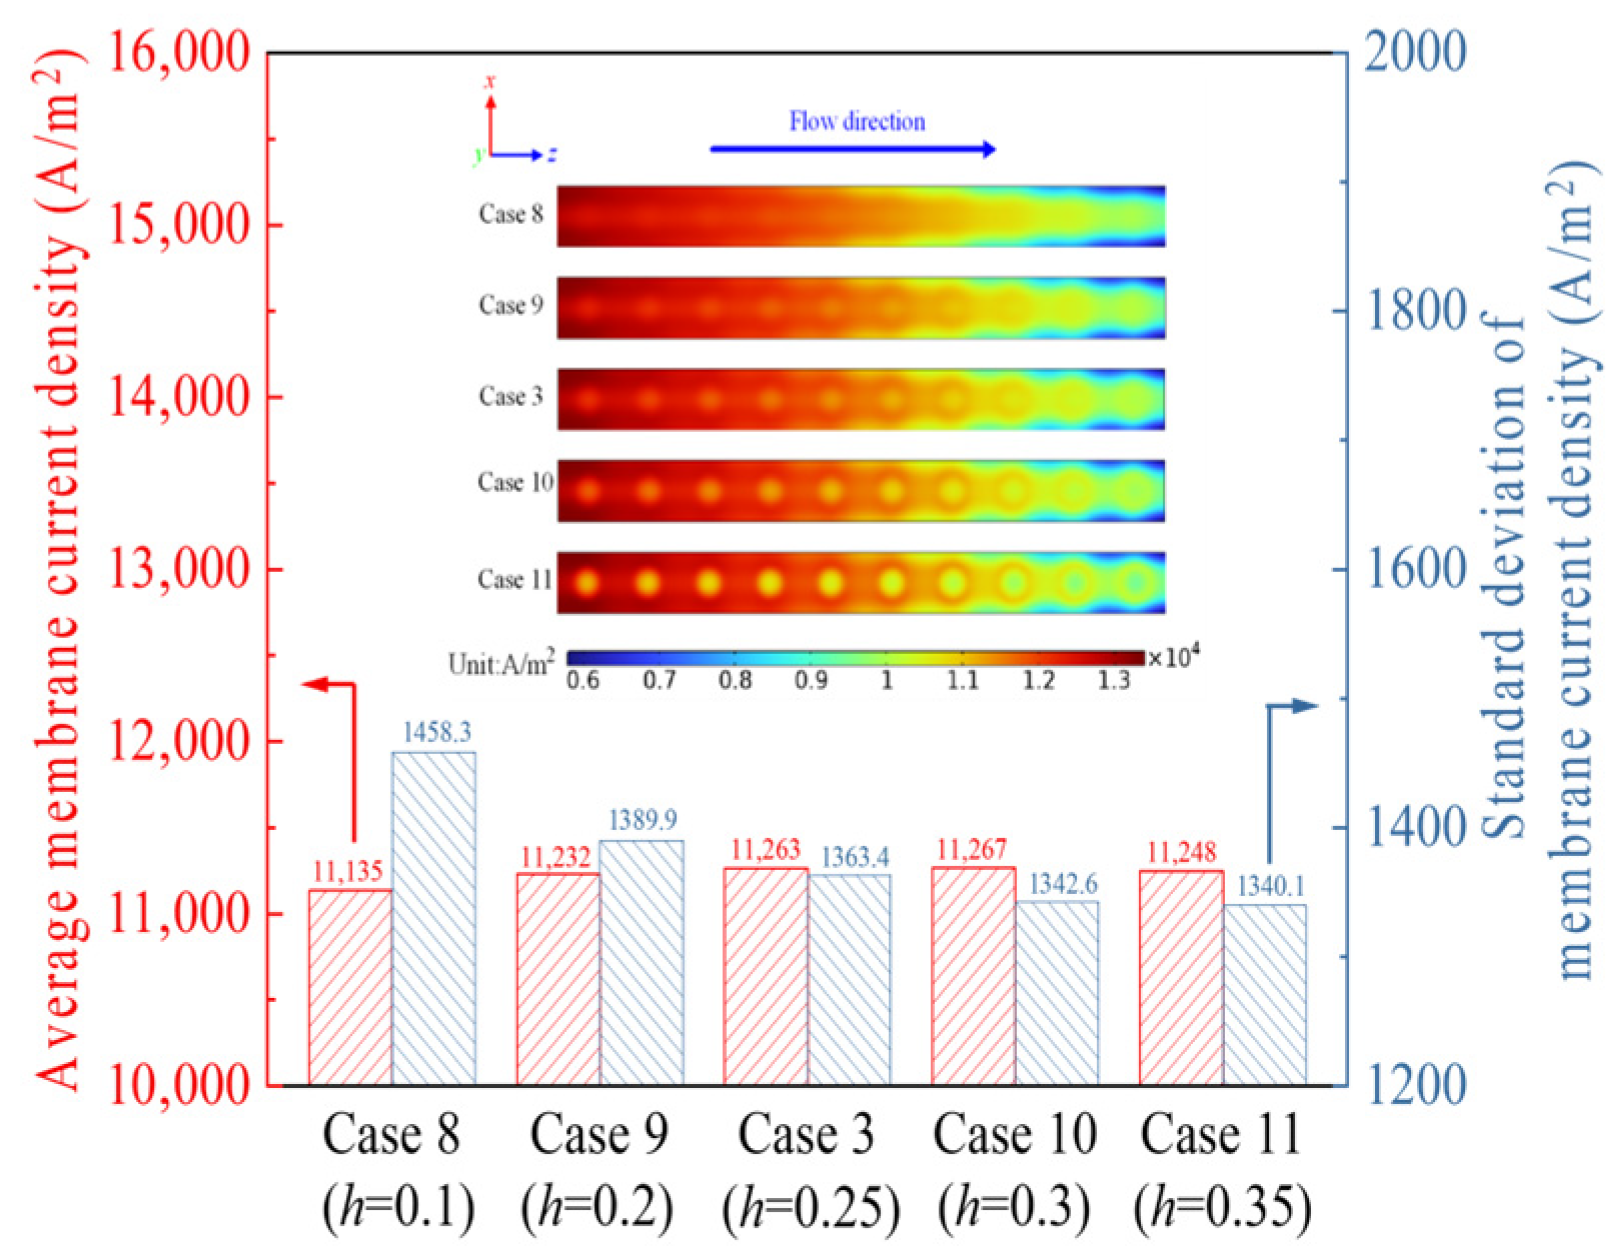
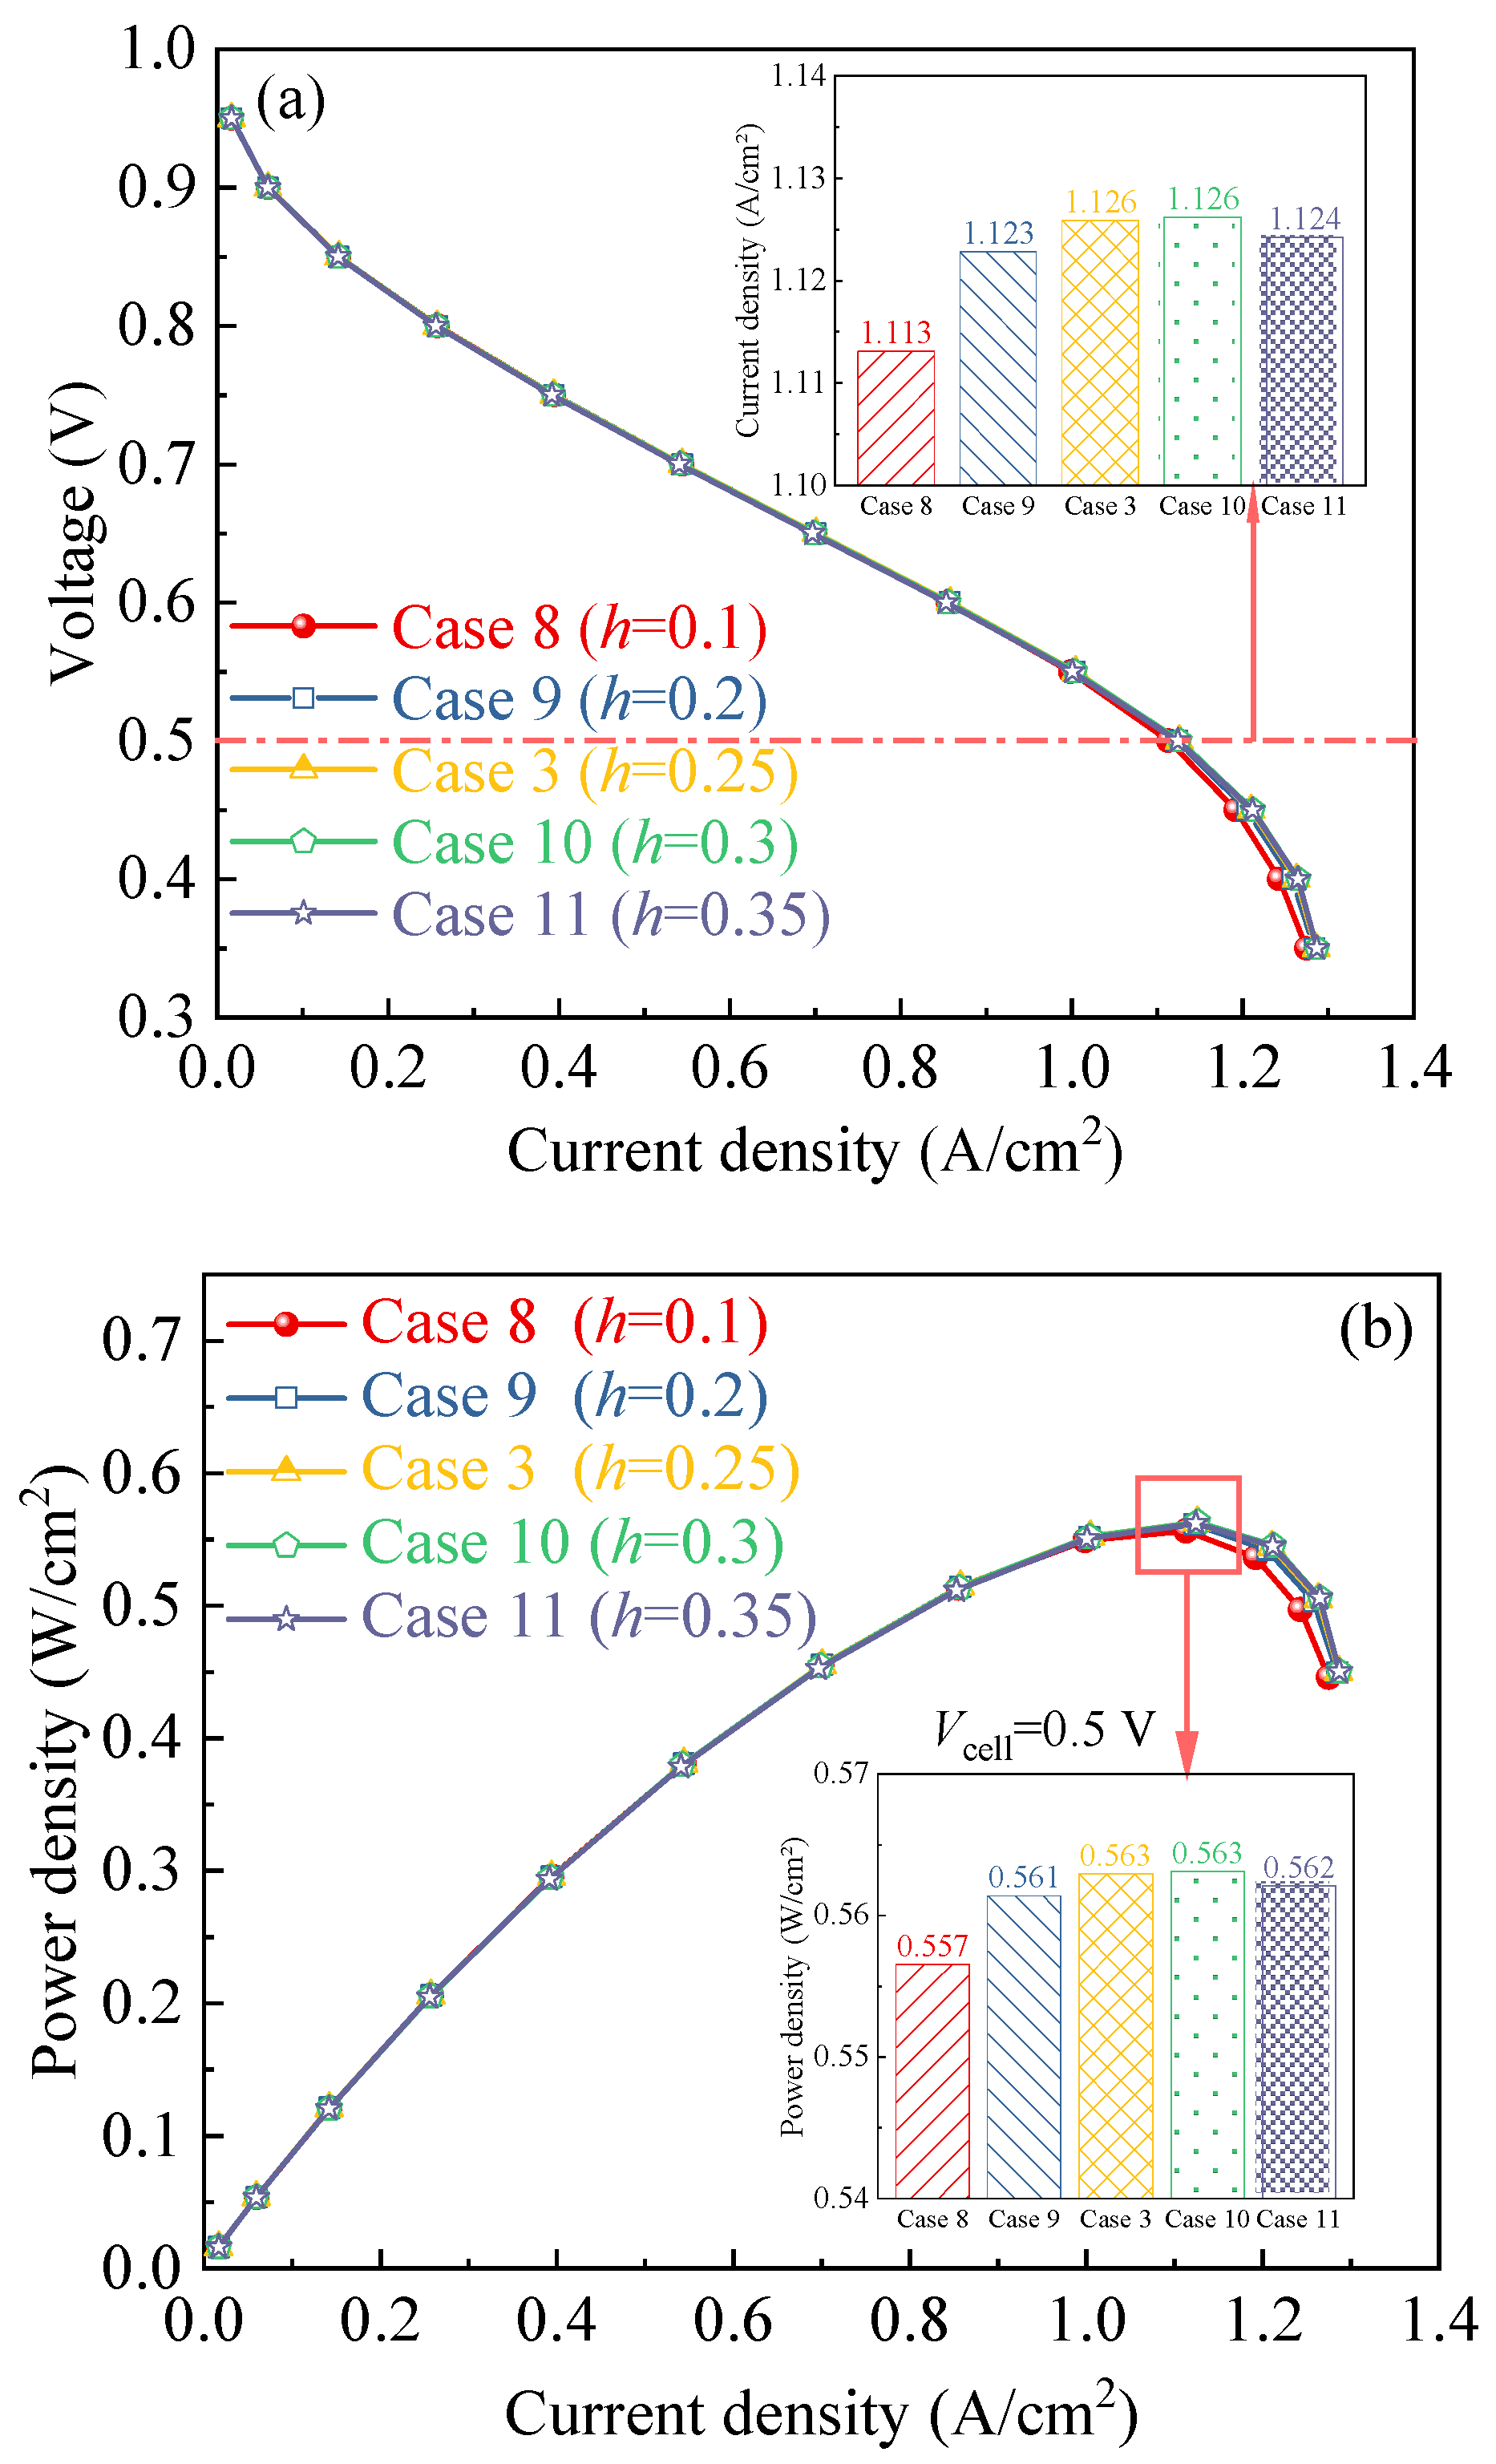
Figure 12 illustrates how conical frustum groove depth affects membrane current density at 0.5 V. The average membrane current density initially rises with increasing depth, peaks at 0.3 mm, and then decreases as depth continues to grow. However, the standard deviation of membrane current density gradually declines with greater groove depth. When the groove depth is increased from 0.3 mm to 0.35 mm, the change in standard deviation is negligible. This suggests that a higher and more uniform membrane current density is obtained at 0.3 mm. This is because the deeper the groove the thinner the GDL thickness, which diminishes the water removal and oxygen transport resistance, leading to a more intense electrochemical reaction. However, a deeper groove not only decreases the mechanical strength of the GDL but also increases the electron conduction resistance.
Figure 13 describes the influence of conical frustum groove depth on cell performance. The results show that at low current densities, the polarization and power density curves for all cases are nearly indistinguishable. At high current densities, however, power density first increases with groove depth, reaches its maximum at 0.3 mm, and then decreases as the depth further increases. Specifically, at 0.5 V, the maximum power density reaches 0.563 W/cm2 when the groove depth is 0.3 mm.

3.4. Effects of Top Radius of Conical Frustum Groove

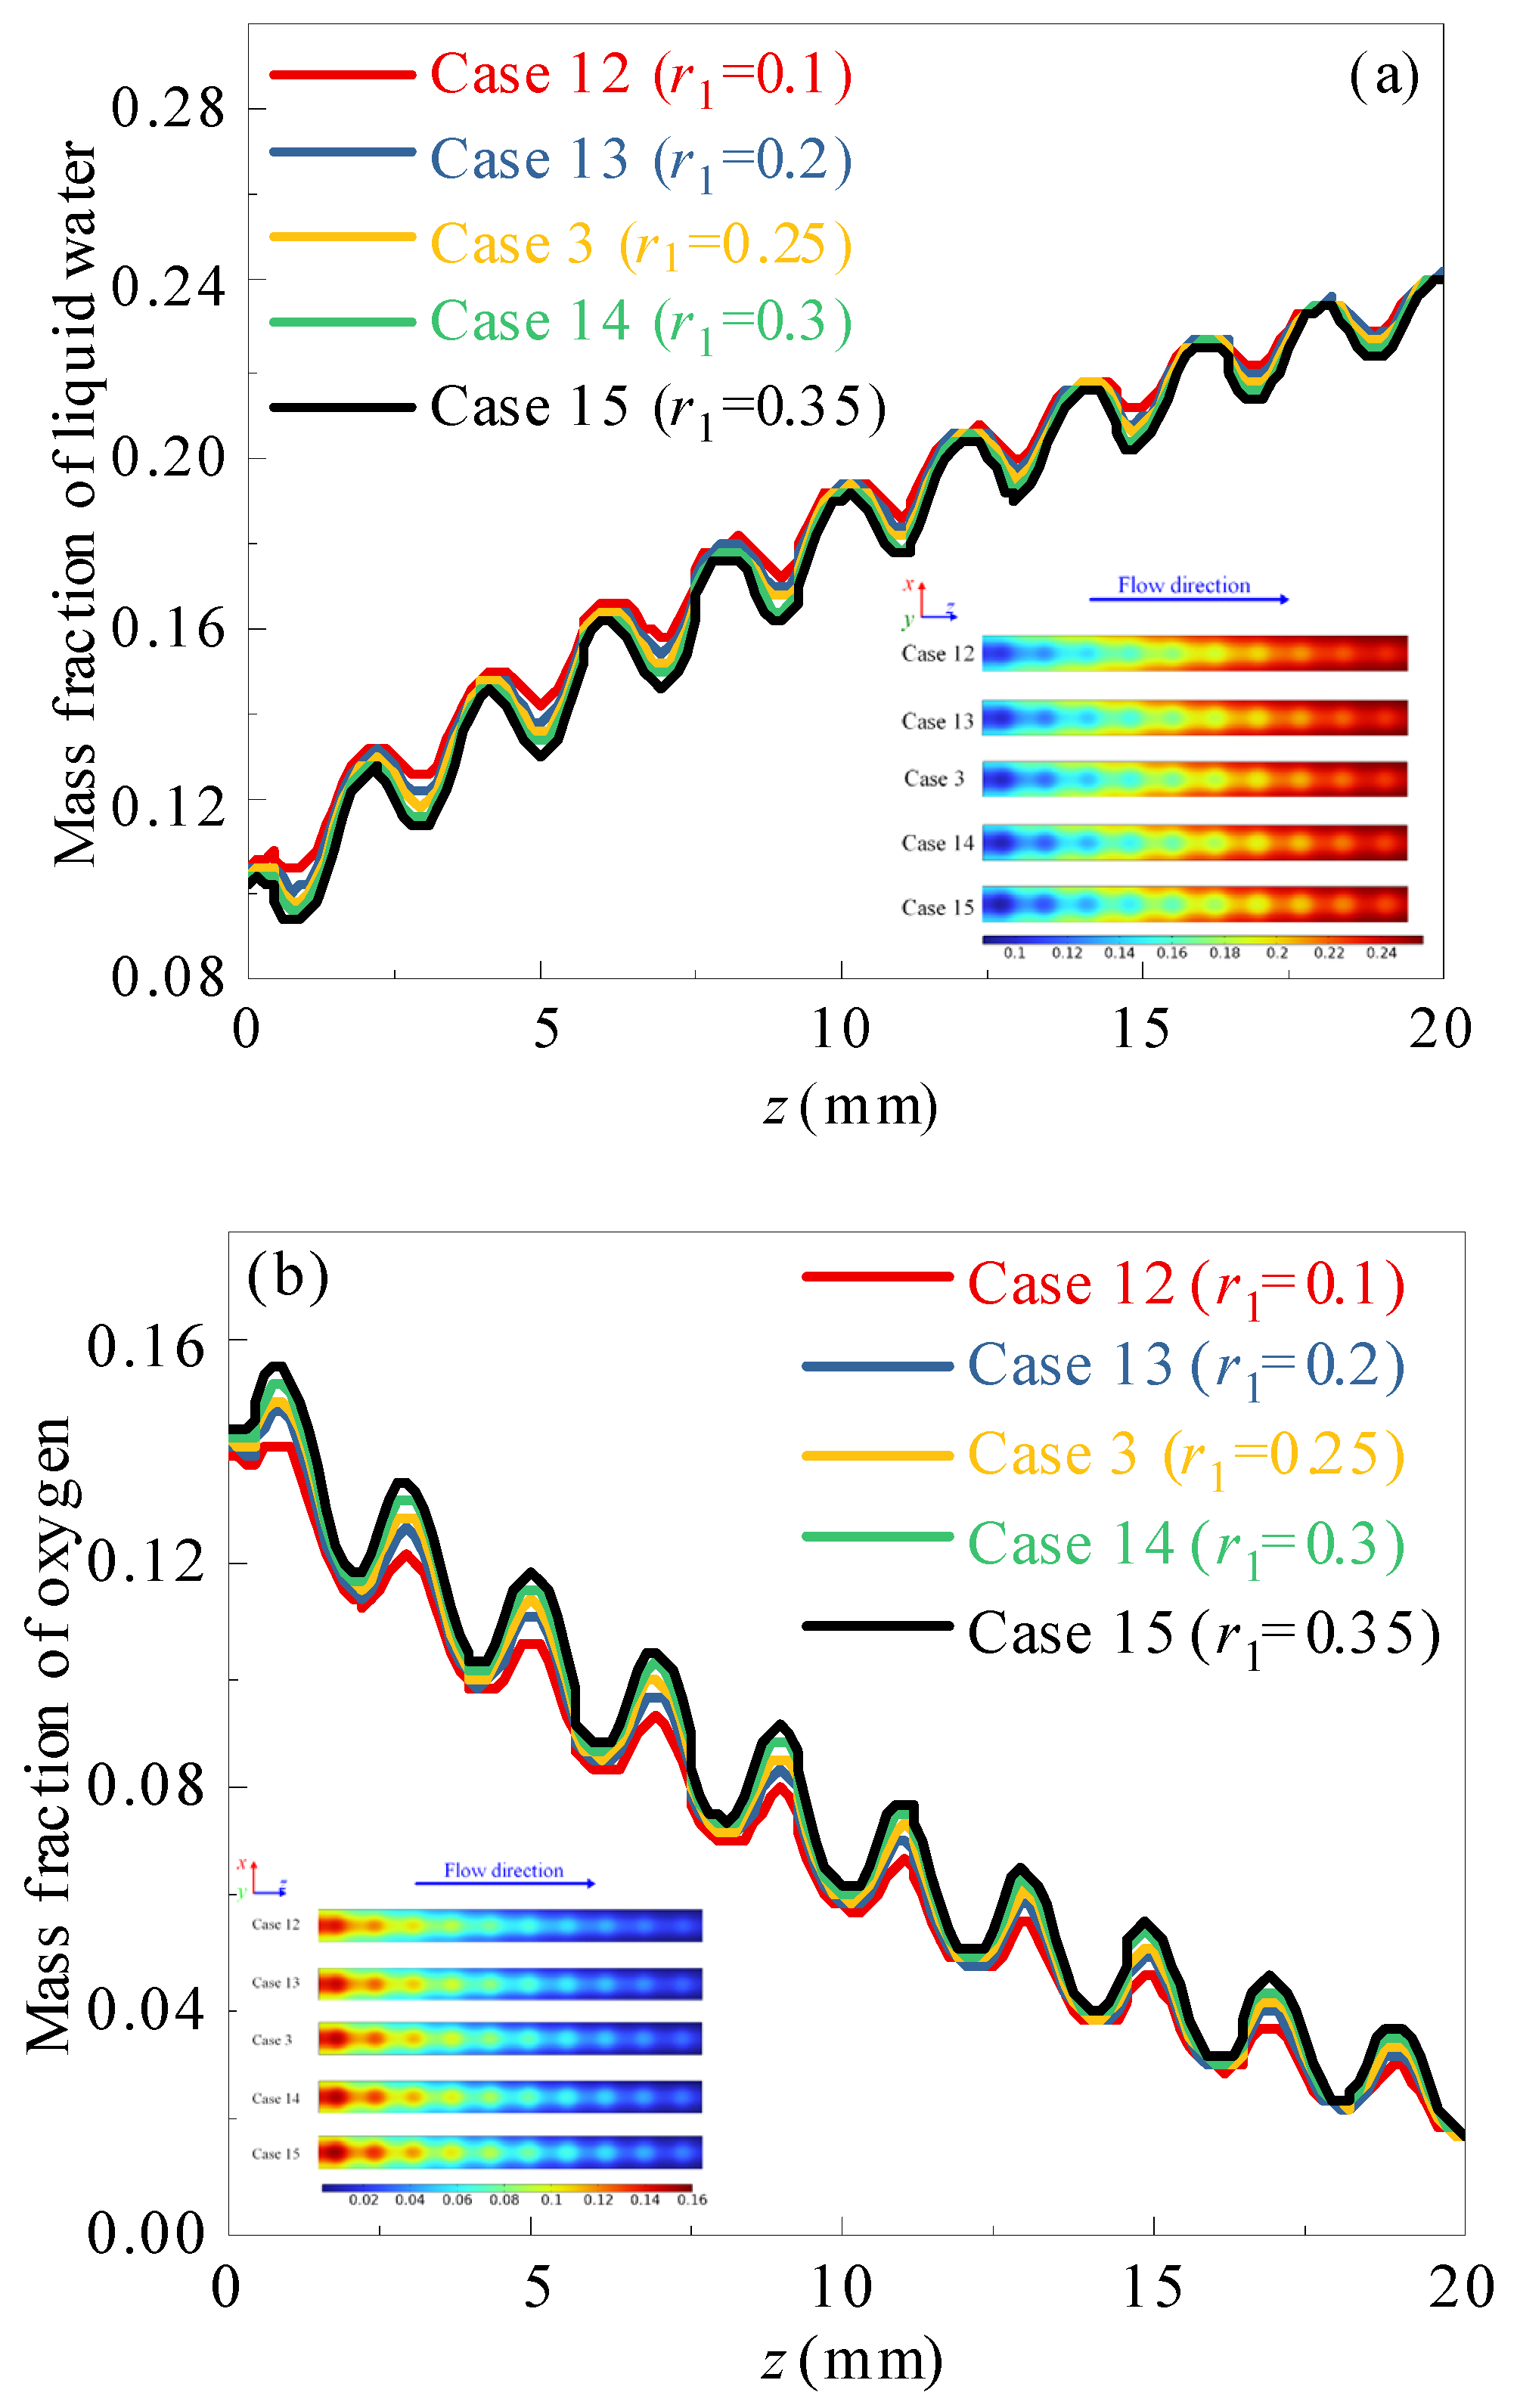
Figure 14 illustrates how the top radius of conical frustum grooves affects liquid water and oxygen distributions at the cathode GDL-CL interface at 0.5 V. The results show that the fluctuation amplitude of the mass fraction profiles for both liquid water and oxygen increases as the top radius grows. The average mass fraction of liquid water decreases while the average mass fraction of oxygen rises with a lager top radius. This indicates that a larger top radius improves water removal and oxygen transport performance. This is because a wider transport pathway is created as the top radius increases, which facilitates more efficient water and oxygen transport.
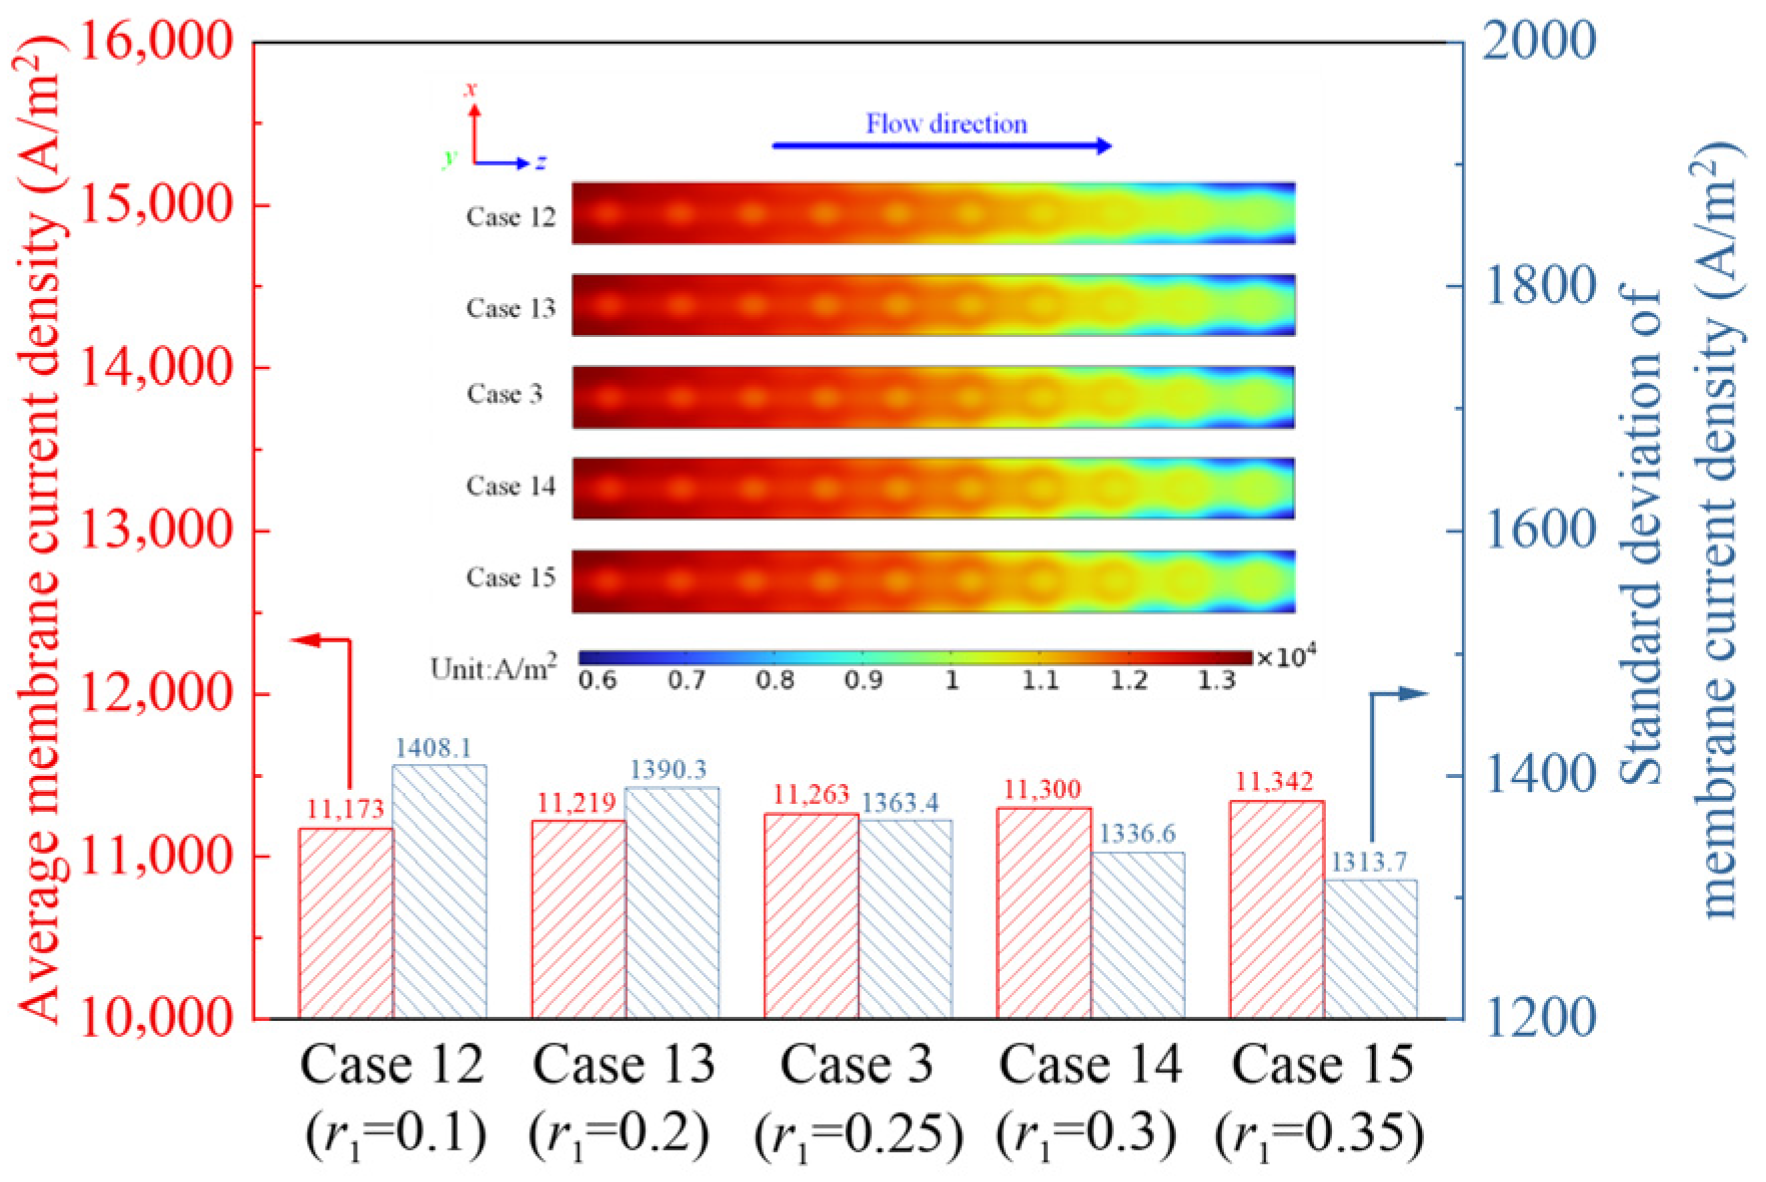
Figure 15 illustrates the influence of the top radius on membrane current density at 0.5 V. The average membrane current density gradually increases with the top radius. Meanwhile, the standard deviation of membrane current density decreases. This suggests that a larger top radius yields a higher and more uniform membrane current density. This is because the wider transport pathways enhance water removal and oxygen transport, which in turn promotes more intense electrochemical reactions.
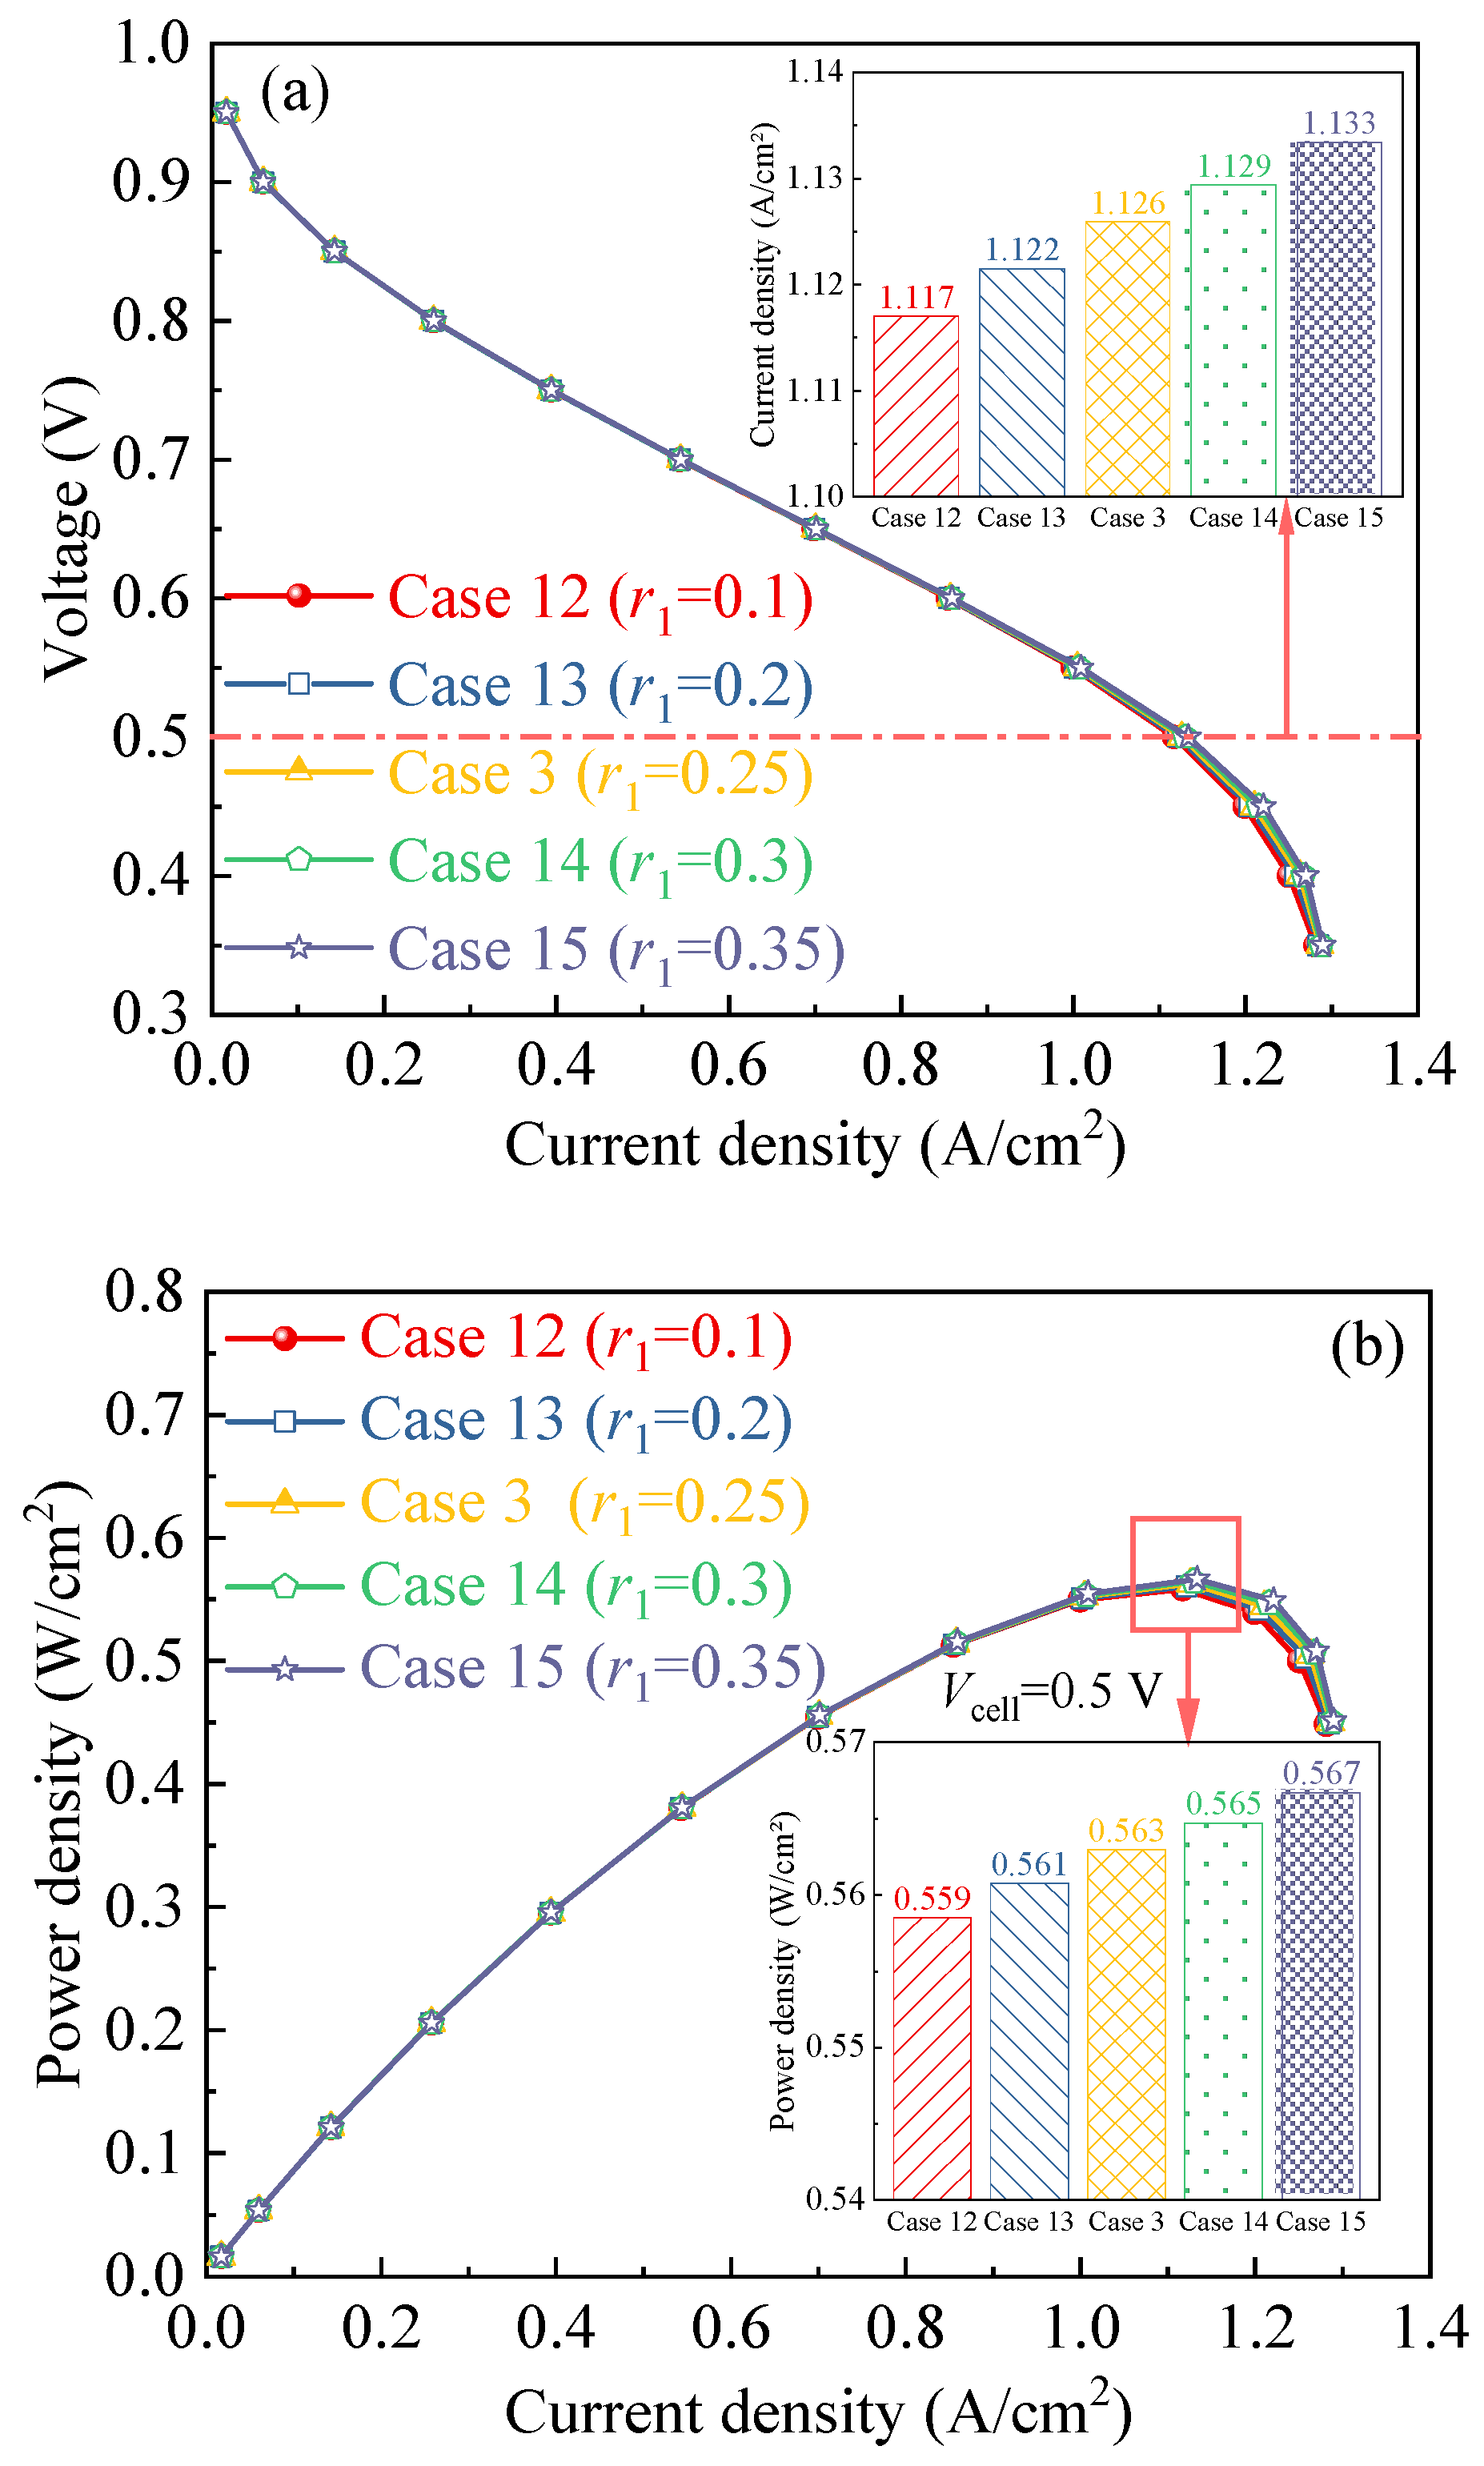
Figure 16 shows the effects of the top radius on cell performance. At low current densities, the polarization and power density curves for all cases are nearly indistinguishable. At high current densities, however, power density increases as the top radius grows. Specifically, when the voltage is 0.5 V, the maximum power density rises from 0.559 W/cm2 to 0.567 W/cm2 as the top radius increases from 0.1 mm to 0.35 mm.

3.5. Effects of Bottom Radius of Conical Frustum Groove

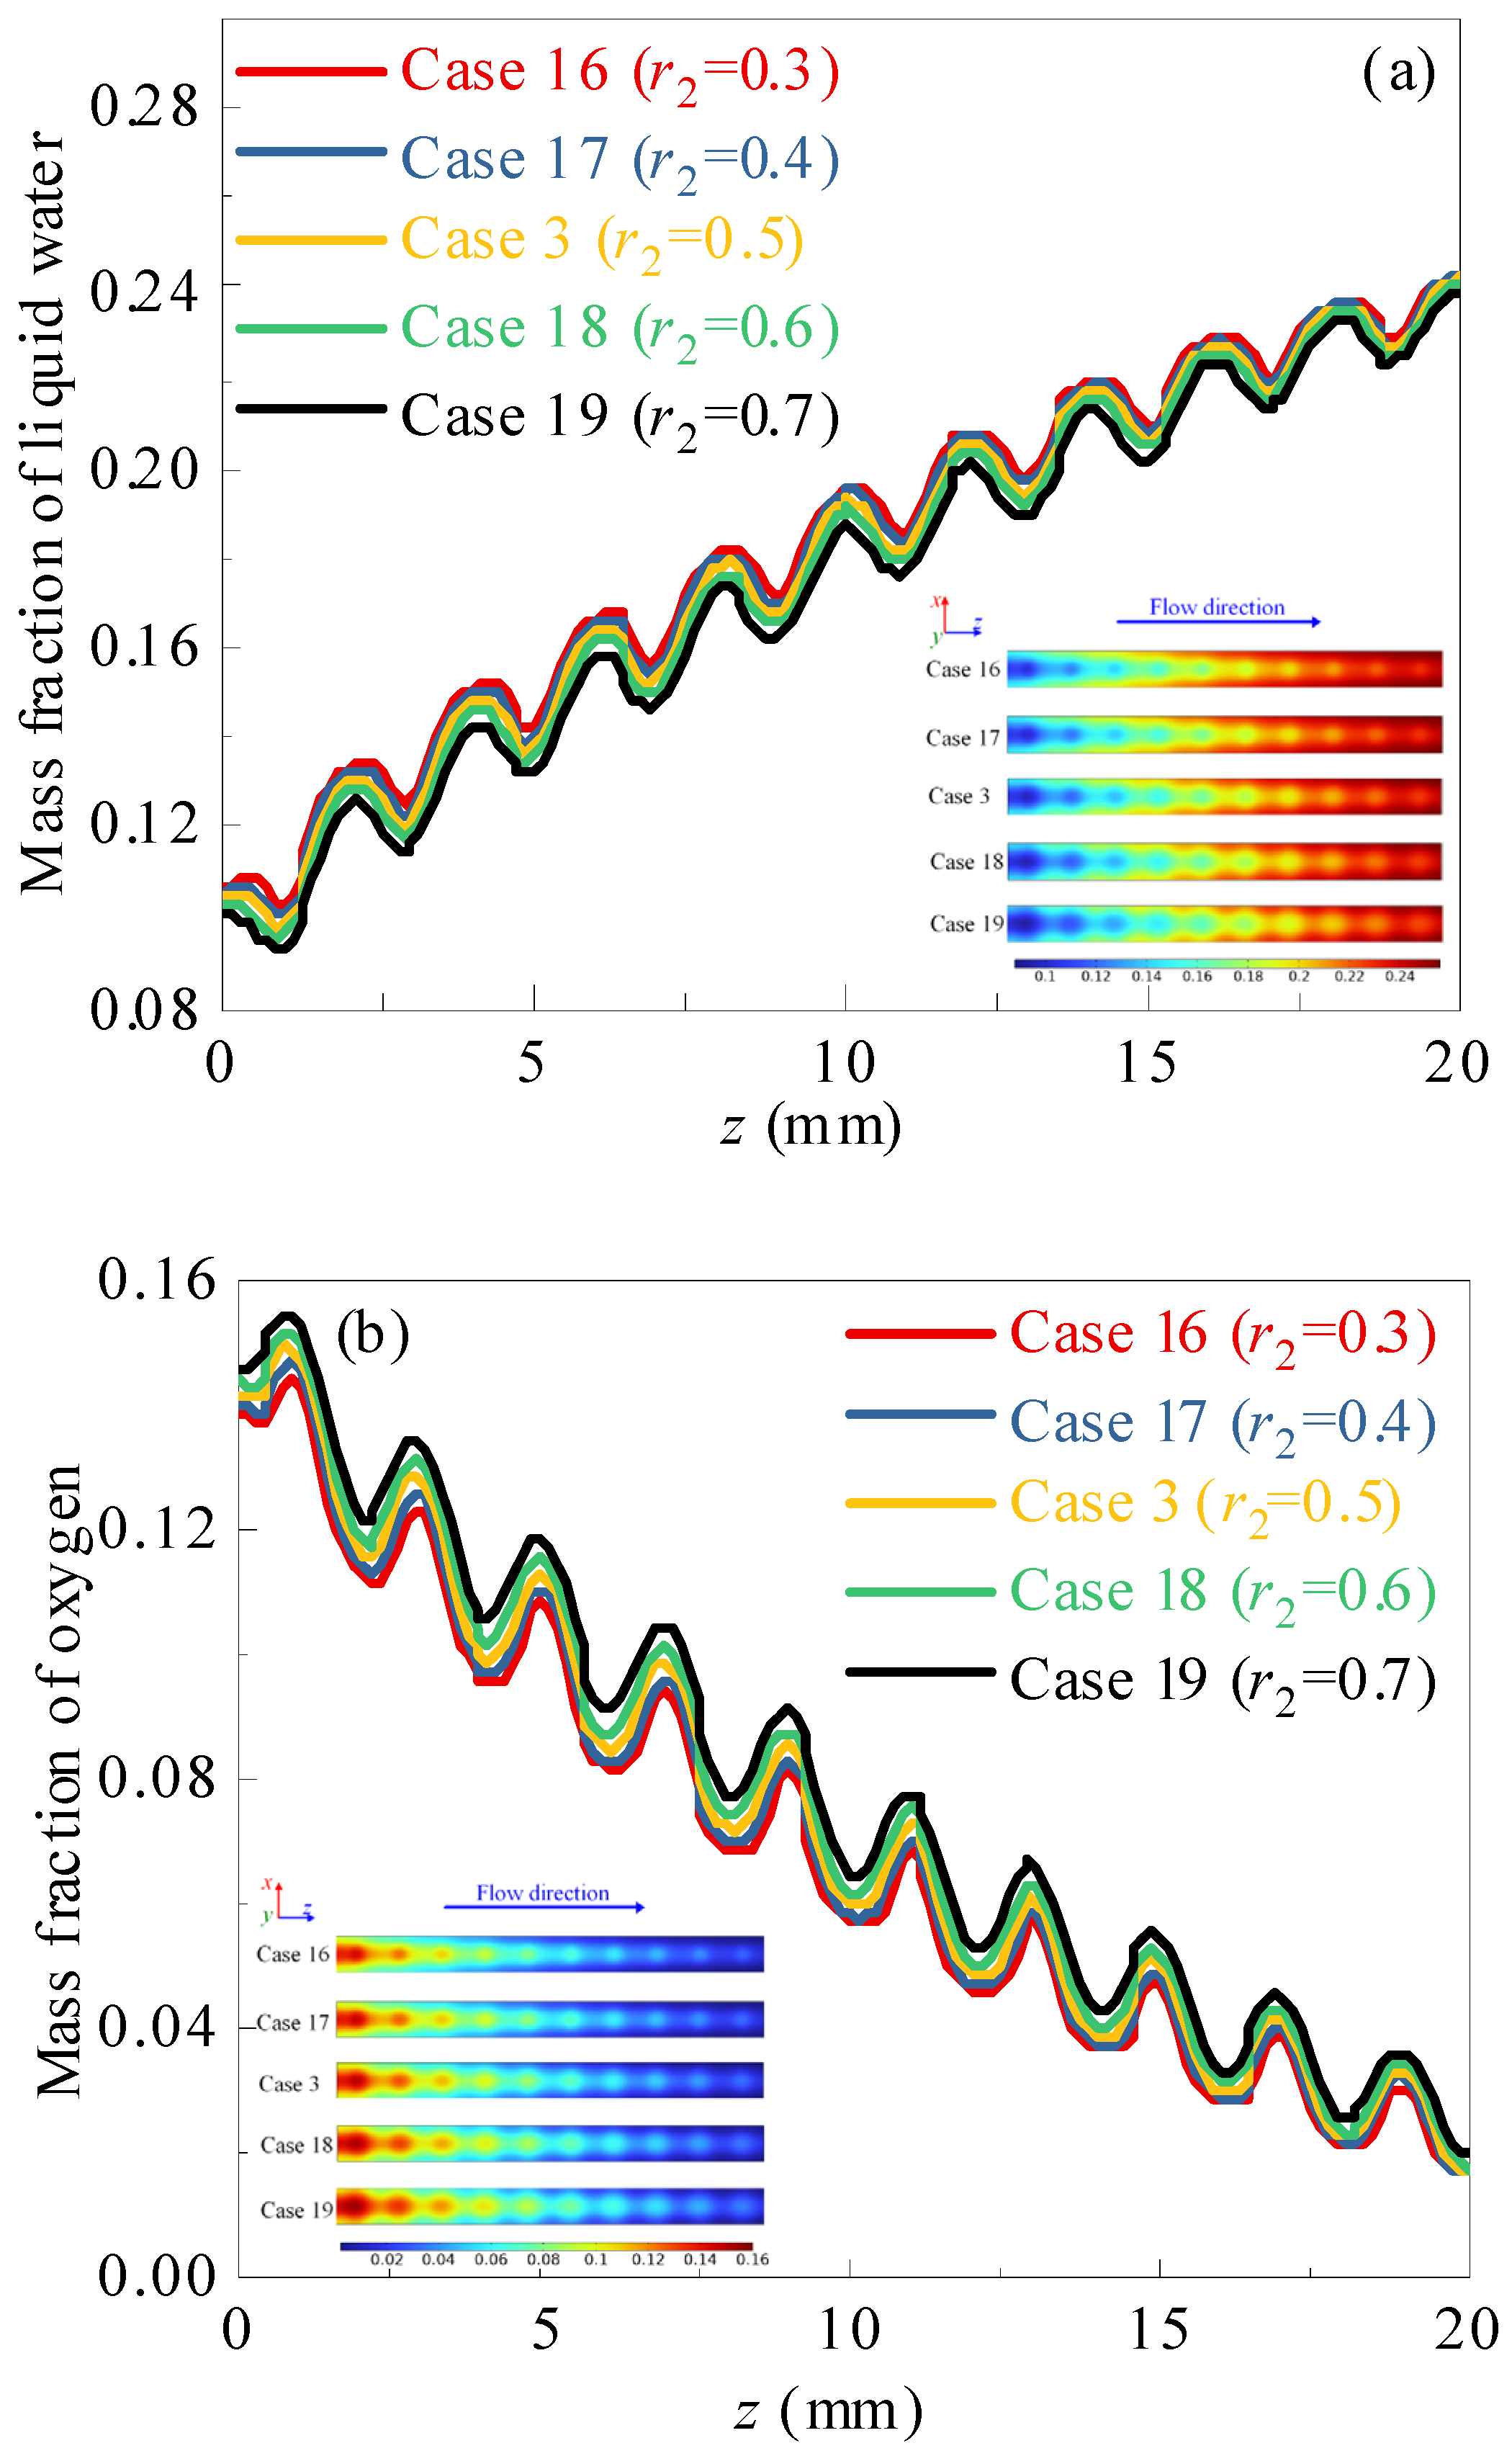
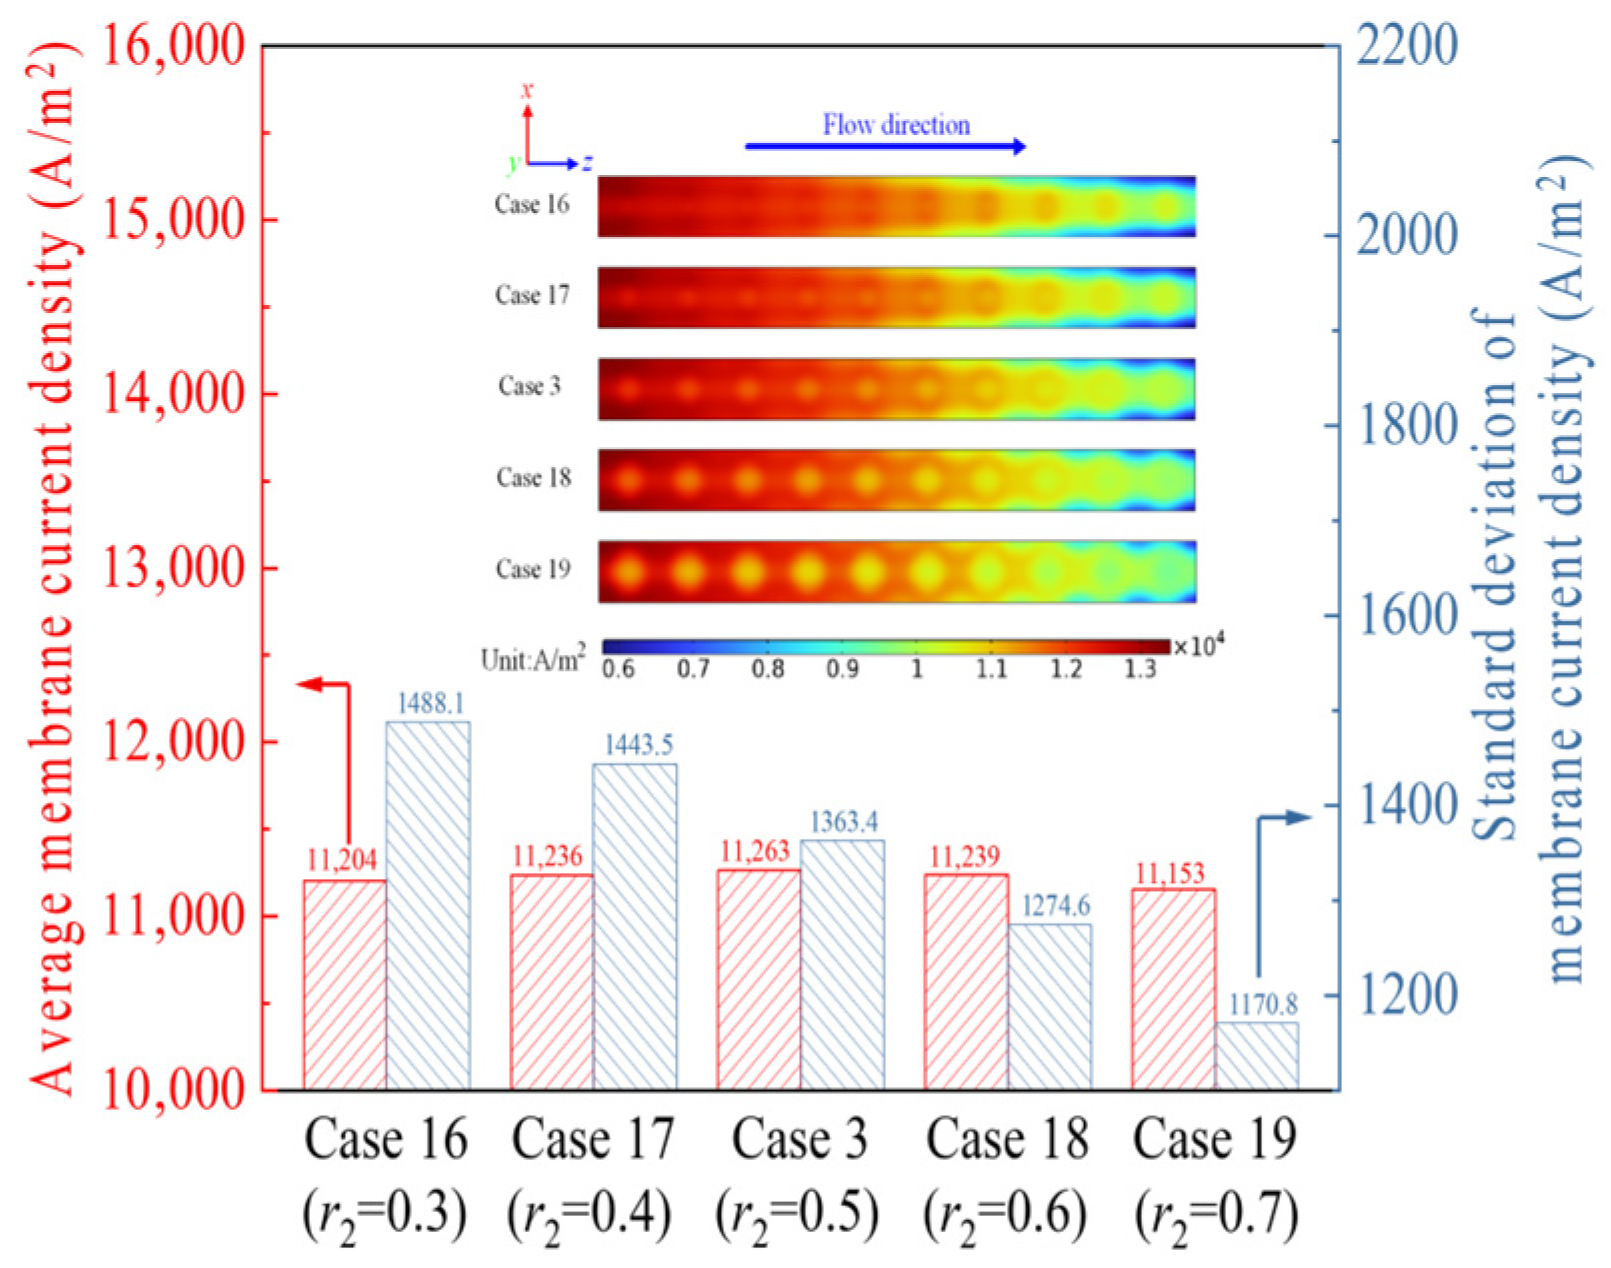
Figure 17 illustrates how the bottom radius of conical frustum grooves affects liquid water and oxygen distributions at the cathode GDL-CL interface at 0.5 V. The results show that the fluctuation amplitude of the mass fraction profiles for both liquid water and oxygen increases as the bottom radius grows. The average mass fraction of liquid water decreases while the average mass fraction of oxygen rises with a larger bottom radius. This indicates that a larger bottom radius improves water removal and oxygen transport performance. This is because the transport pathways for water and oxygen are widened with increasing bottom radius, which facilitates more efficient water removal and oxygen transport.
Figure 18 illustrates the influence of the bottom radius on membrane current density at 0.5 V. The average membrane current density initially rises with increasing bottom radius, peaks at 0.5 mm, and then decreases as the radius continues to grow. Meanwhile, the standard deviation of membrane current density gradually declines with a larger bottom radius. The results show that a bottom radius of 0.5 mm yields the highest and most uniform membrane current density. This is because wider transport pathways promote more intense electrochemical reactions. However, a larger bottom radius not only decreases the mechanical strength of the GDL but also increases the electron conduction resistance.
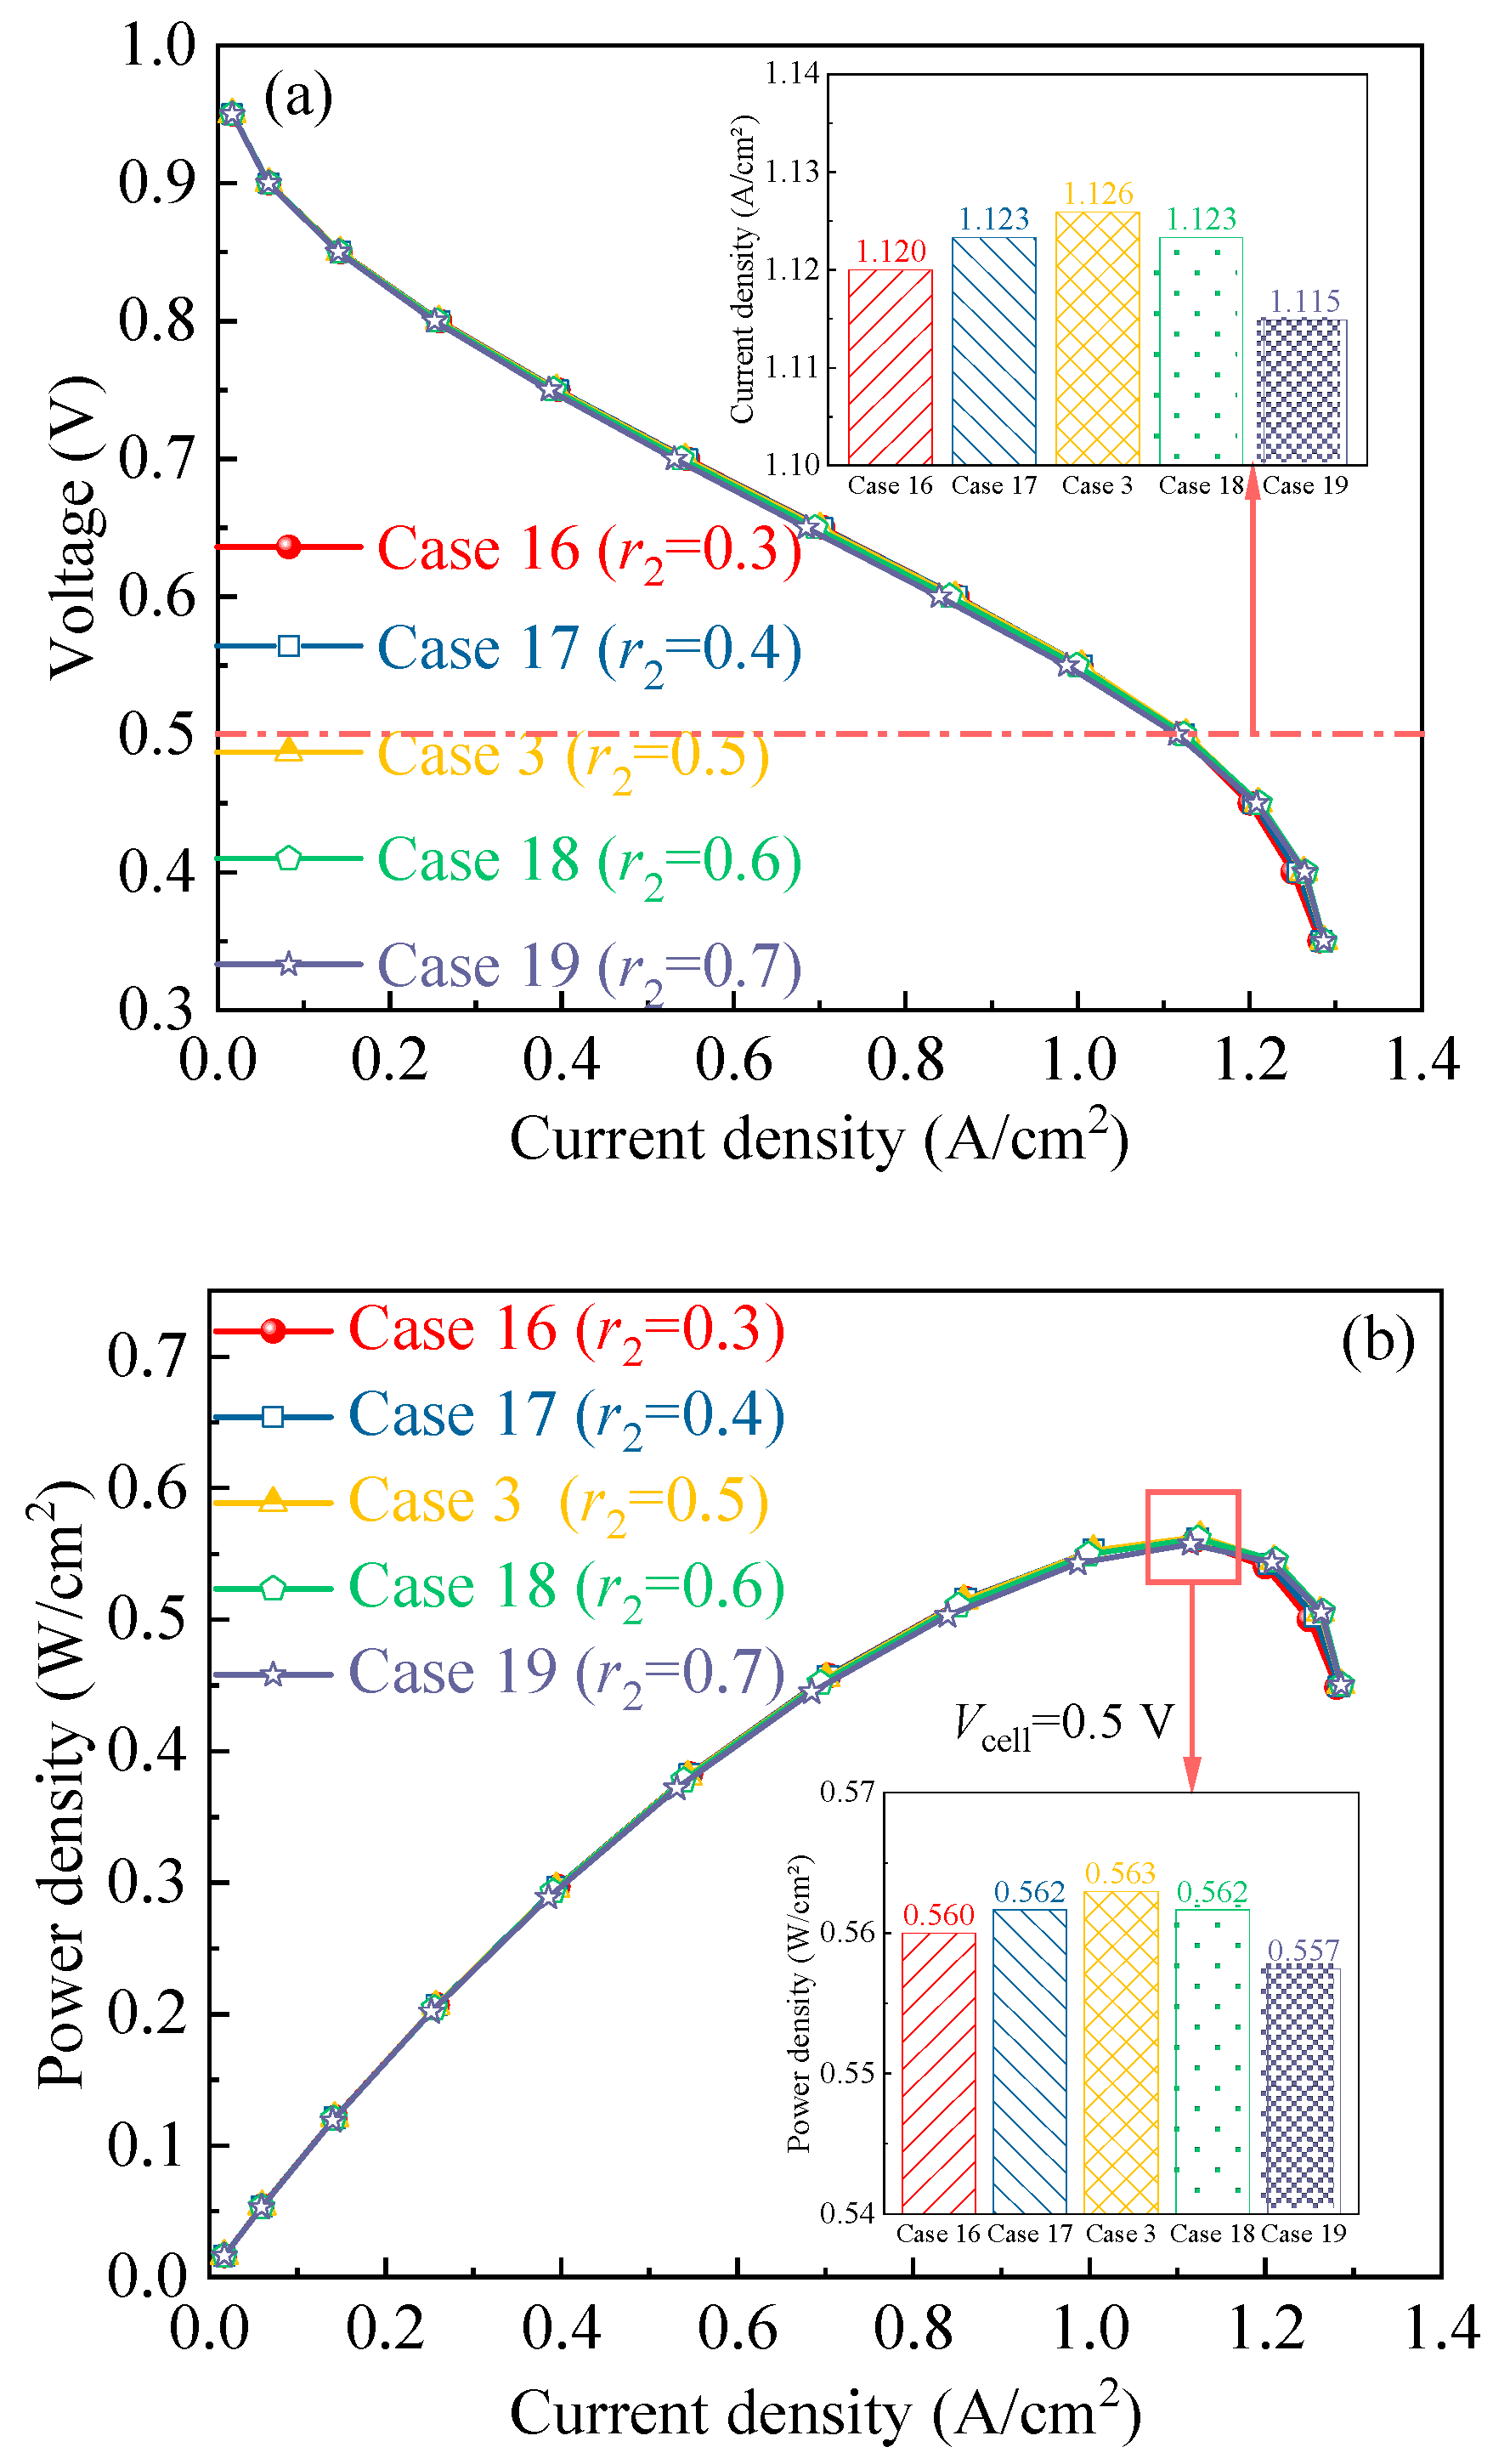
Figure 19 shows the influence of the bottom radius on cell performance. The results show that at low current densities, the polarization and power density curves for all cases are nearly indistinguishable. At high current densities, however, power density first rises with increasing bottom radius, peaks at 0.5 mm, and then decreases as the radius continues to grow. Specifically, at 0.5 V, the maximum power density reaches 0.563 W/cm2 when the bottom radius is set to 0.5 mm.

4. Conclusions

In this work, conical frustum grooves are introduced into the cathode GDL of a PEMFC, and compared with no grooves and pouching cylindrical grooves. The effects of spacing, depth, top radius and bottom radius on cell performance are systematically analyzed and discussed. The main findings are summarized as follows:
(1)
Compared with no grooves and pouching cylindrical grooves, the conical frustum grooves deliver improved water removal and oxygen transport performance. They also yield a higher and more uniform membrane current density, as well as a higher power density. This is due to the grooves widening the transport pathways, which facilitates more intense electrochemical reactions.
(2)
Reducing groove spacing improves water removal and oxygen transport performance. It also leads to a higher and more uniform membrane current density, as well as increased power density.
(3)
With the increment of groove depth, better liquid water removal and oxygen transport ability is obtained. However, the optimal groove depth of 0.3 mm yields the highest and most uniform membrane current density, as well as the peak power density.
(4)
Increasing the top radius improves water removal and oxygen transport performance. It also leads to a higher and more uniform membrane current density, as well as an increased power density.
(5)
With the increase of the bottom radius, the liquid water removal and oxygen transport ability is gradually improved. However, the optimal bottom radius of 0.5 mm yields the highest and most uniform membrane current density, as well as the peak power density.
Overall, with conical frustum grooves in the cathode GDL, the PEMFC can achieve better oxygen transport and liquid water removal, higher and more uniform membrane current density, and higher power density. However, there are also some challenges in manufacturing feasibility and cost. In future work, more factors such as temperature, humidity, pressure and load will be considered. Additionally, response surface methodology (RSM), non-dominated sorting genetic algorithm II (NSGA-II) and technique for order preference by similarity to an ideal solution (TOPSIS) are combined to obtain the optimal design project for practical engineering applications.

Author Contributions

Conceptualization, Y.L.; methodology, Y.L.; software, Y.L.; validation, X.Y. and Y.L.; formal analysis, Y.L.; investigation, Y.L.; resources, W.Z.; data curation, Y.L.; writing—original draft preparation, X.Y. and Y.L.; writing—review and editing, W.Z. and Q.L.; visualization, Y.L.; supervision, W.Z. and Q.L.; project administration, W.Z.; funding acquisition, W.Z. All authors have read and agreed to the published version of the manuscript.

Funding

This work is supported by the National Natural Science Foundation of China-Hubei Joint Fund (No. U22A20127).

Data Availability Statement

The original findings presented in this study are included in this paper. If you have any further questions, please contact the corresponding author.

Conflicts of Interest

The authors declare that they have no known competing financial interests or personal relationships that could have appeared to influence the work reported in this paper.

References

  1. Pan, Z.F.; An, L.; Wen, C.Y. Recent advances in fuel cells based propulsion systems for unmanned aerial vehicles. Appl. Energy 2019, 240, 473–485. [Google Scholar] [CrossRef] [Scilit]
  2. Mei, B.; Barnoon, P.; Toghraie, D.; Su, C.; Nguyen, H.; Khan, A. Energy, exergy, environmental and economic analyzes (4E) and multi-objective optimization of a PEM fuel cell equipped with coolant channels. Renew. Sustain. Energy Rev. 2022, 157, 112021. [Google Scholar] [CrossRef] [Scilit]
  3. Zhang, J.; Huang, P.; Ding, H.; Xin, D.; Sun, S. Investigation of the three-dimensional flow field for proton exchange membrane fuel cell with additive manufactured stainless steel bipolar plates: Numerical simulation and experiments. Energy 2023, 269, 126709. [Google Scholar] [CrossRef] [Scilit]
  4. Zhang, J.; Wang, Z.; Ding, H.; Pan, Z.; Huang, X.; Pan, X. Heat and mass transfer characteristics of a novel three-dimensional flow field metal bipolar plate for PEMFC by laser 3D printing. Int. J. Hydrogen Energy 2024, 50, 1036–1049. [Google Scholar] [CrossRef] [Scilit]
  5. Zhang, G.; Jiao, K. Multi-phase models for water and thermal management of proton exchange membrane fuel cell: A review. J. Power Sources 2018, 391, 120–133. [Google Scholar] [CrossRef] [Scilit]
  6. Wang, Y.; Xu, H.; Wang, X.; Gao, Y.; Su, X.; Qin, Y.; Xing, L. Multi-sub-inlets at cathode flow-field plate for current density homogenization and enhancement of PEM fuel cells in low relative humidity. Energy Convers. Manag. 2022, 252, 115069. [Google Scholar] [CrossRef] [Scilit]
  7. Lim, I.S.; Park, J.Y.; Kang, D.G.; Choi, S.H.; Kang, B.; Kim, M.S. Numerical study for in-plane gradient effects of cathode gas diffusion layer on PEMFC under low humidity condition. Int. J. Hydrogen Energy 2020, 45, 19745–19760. [Google Scholar] [CrossRef] [Scilit]
  8. Hu, X.; Jiang, W.; Ying, X.; Eslami, M. The application of a new design of bat optimizer for energy efficiency enhancement in PEMFCs based on fractional order theory. Sustain. Energy Technol. Assess. 2023, 55, 102904. [Google Scholar] [CrossRef] [Scilit]
  9. Cheng, M.; Luo, L.; Feng, Y.; Feng, Q.; Yan, X.; Shen, S.; Guo, Y.; Zhang, J. Numerical studies on porous water transport plates applied in PEMFCs under pure oxygen condition. Appl. Energy 2024, 362, 122903. [Google Scholar] [CrossRef] [Scilit]
  10. Wang, Z.; Zeng, Y.; Sun, S.; Shao, Z.; Yi, B. Improvement of PEMFC water management by employing water transport plate as bipolar plate. Int. J. Hydrogen Energy 2017, 42, 21922–21929. [Google Scholar] [CrossRef] [Scilit]
  11. Liu, Y.; Fan, L.; Pei, P.; Yao, S.; Wang, F. Asymptotic analysis for the inlet relative humidity effects on the performance of proton exchange membrane fuel cell. Appl. Energy 2018, 213, 573–584. [Google Scholar] [CrossRef] [Scilit]
  12. Vazifeshenas, Y.; Sedighi, K.; Shakeri, M. Numerical investigation of a novel compound flow-field for PEMFC performance improvement. Int. J. Hydrogen Energy 2015, 40, 15032–15039. [Google Scholar] [CrossRef] [Scilit]
  13. Wang, C.T.; Hu, Y.C.; Zheng, P.L. Novel biometric flow slab design for improvement of PEMFC performance. Appl. Energy 2010, 87, 1366–1375. [Google Scholar] [CrossRef] [Scilit]
  14. Li, C.; Zhao, Y.; Liu, Z.; Liu, Z.; Shen, X.N.; Gao, Y.B.; Liu, J.X. Prescribed Performance Control for PEM Fuel Cell Air Supply System Based on Fully Actuated Approach with Fixed Regulation Time. Int. J. Circuit Theory Appl. 2025, 53, 4657–4672. [Google Scholar] [CrossRef] [Scilit]
  15. Phan, V.D.; Trinh, H.A.; Ahn, K.K. Finite-Time Command Filtered Control for Oxygen-Excess Ratio of Proton Exchange Membrane Fuel Cell Systems with Prescribed Performance. Mathematics 2023, 11, 914. [Google Scholar] [CrossRef] [Scilit]
  16. Yu, Q.R.; Wang, J.; Huang, W.H.; Li, X.M.; Liu, Z.H.; Dong, H.Y. Sliding Mode Integral Separation PID Control for Hydrogen Fuel Cell Systems. Appl. Sci. 2024, 14, 7650. [Google Scholar] [CrossRef] [Scilit]
  17. Zhu, W.; Zheng, M. Radial Flow Field of Circular Bipolar Plate for Proton Exchange Membrane Fuel Cells. Int. J. Heat Technol. 2019, 37, 733–740. [Google Scholar] [CrossRef] [Scilit]
  18. Rahimi-Esbo, M.; Ranjbar, A.A.; Ramiar, A.; Alizadeh, E.; Aghaee, M. Improving PEM fuel cell performance and effective water removal by using a novel gas flow field. Int. J. Hydrogen Energy 2016, 41, 3023–3037. [Google Scholar] [CrossRef] [Scilit]
  19. Mancusi, E.; Fontana, É.; de Souza, A.A.; de Souza, S.M. Numerical study of two-phase flow patterns in the gas channel of PEM fuel cells with tapered flow field design. Int. J. Hydrogen Energy 2014, 39, 2261–2273. [Google Scholar] [CrossRef] [Scilit]
  20. Chen, X.; Yu, Z.; Yang, C.; Chen, Y.; Jin, C.; Ding, Y.; Li, W.; Wan, Z. Performance investigation on a novel 3D wave flow channel design for PEMFC. Int. J. Hydrogen Energy 2021, 46, 11127–11139. [Google Scholar] [CrossRef] [Scilit]
  21. Wang, X.; Qin, Y.; Wu, S.; Shangguan, X.; Zhang, J.; Yin, Y. Numerical and experimental investigation of baffle plate arrangement on proton exchange membrane fuel cell performance. J. Power Sources 2020, 457, 228034. [Google Scholar] [CrossRef] [Scilit]
  22. Heidary, H.; Kermani, M.J.; Advani, S.G.; Prasad, A.K. Experimental investigation of in-line and staggered blockages in parallel flow field channels of PEM fuel cells. Int. J. Hydrogen Energy 2016, 41, 6885–6893. [Google Scholar] [CrossRef] [Scilit]
  23. Zhang, Y.; Wang, R.; Zou, L.; Tang, S.; Cui, Y.; Li, S.; Wan, Z. Performance investigation on the new bionic leaf vein flow field for a proton exchange membrane fuel cell. Appl. Therm. Eng. 2025, 272, 126359. [Google Scholar] [CrossRef] [Scilit]
  24. Li, J.; Sun, R. Study on the output performance of proton exchange membrane fuel cells with bionic leaf-like bifurcating vein channels based on fractal transport characteristics. Fuel 2026, 406, 136934. [Google Scholar] [CrossRef] [Scilit]
  25. Miao, W.; Fan, F.; Fang, H.; Zhang, Y.; Liu, Q. Three-dimensional simulation investigation of mass transfer characteristics in the proton exchange membrane fuel cell: Full-scale cell inspired by bionic droplet-like structures. Int. J. Hydrogen Energy 2025, 148, 150097. [Google Scholar] [CrossRef] [Scilit]
  26. Qiao, Y.; Yu, Z.; Wang, D. Design and optimization of the bionic shark dermal denticle structure for proton exchange membrane fuel cell. J. Power Sources 2025, 647, 237348. [Google Scholar] [CrossRef] [Scilit]
  27. Wang, N.; Cheng, Y.; Zhang, L.; Ma, Y.; Fan, X. Performance of proton exchange membrane fuel cell with bionic fish scale porous flow field design. Energy 2026, 344, 139912. [Google Scholar] [CrossRef] [Scilit]
  28. Gerteisen, D.; Heilmann, T.; Ziegler, C. Enhancing liquid water transport by laser perforation of a GDL in a PEM fuel cell. J. Power Sources 2008, 177, 348–354. [Google Scholar] [CrossRef] [Scilit]
  29. Iglesia, J.; Lang, C.C.; Chen, Y.M.; Chen, S.Y.; Tseng, C.J. Raising the maximum power density of nanoporous catalyst film-based polymer-electrolyte-membrane fuel cells by laser micro-machining of the gas diffusion layer. J. Power Sources 2019, 436, 226886. [Google Scholar] [CrossRef] [Scilit]
  30. Wang, X.; Chen, S.; Fan, Z.; Li, W.; Wang, S.; Li, X.; Zhao, Y.; Zhu, T.; Xie, X. Laser-perforated gas diffusion layer for promoting liquid water transport in a proton exchange membrane fuel cell. Int. J. Hydrogen Energy 2017, 42, 29995–30003. [Google Scholar] [CrossRef] [Scilit]
  31. Niu, Z.; Wu, J.; Bao, Z.; Wang, Y.; Yin, Y.; Jiao, K. Two-phase flow and oxygen transport in the perforated gas diffusion layer of proton exchange membrane fuel cell. Int. J. Heat Mass Transf. 2019, 139, 58–68. [Google Scholar] [CrossRef] [Scilit]
  32. Yin, B.; Xu, S.; Yang, S.; Dong, F. Influence of micro elliptical groove gas diffusion layer (GDL) on transport behavior of proton exchange membrane fuel cell (PEMFC). Int. J. Heat Mass Transf. 2021, 180, 121793. [Google Scholar] [CrossRef] [Scilit]
  33. Gabriel, R.O.; Junior, E.S.L.; Braga, S.L.; Pradelle, F.; Serra, E.T.; Vieira, C.L.C.S. Technical, economic and environmental analysis of a hybrid CHP system with a 5 kW PEMFC, photovoltaic panels and batteries in the Brazilian scenario. Energy Convers. Manag. 2022, 269, 116042. [Google Scholar] [CrossRef] [Scilit]
  34. Shahverdian, M.H.; Sohani, A.; Sayyaadi, H. A 3E water energy nexus based optimum design for a hybrid PV-PEMFC electricity production systems for off-gird applications. Energy Convers. Manag. 2022, 267, 115911. [Google Scholar] [CrossRef] [Scilit]
  35. Li, W.; Zhang, Q.; Wang, C.; Yan, X.; Shen, S.; Xia, G.; Zhu, F.; Zhang, J. Experimental and numerical analysis of a three-dimensional flow field for PEMFCs. Appl. Energy 2017, 195, 278–288. [Google Scholar] [CrossRef] [Scilit]
  36. Li, S.; Sundén, B. Three-dimensional modeling and investigation of high temperature proton exchange membrane fuel cells with metal foams as flow distributor. Int. J. Hydrogen Energy 2017, 42, 27323–27333. [Google Scholar] [CrossRef] [Scilit]
  37. Ghasabehi, M.; Jabbary, A.; Shams, M. Cathode side transport phenomena investigation and multi-objective optimization of a tapered parallel flow field PEMFC. Energy Convers. Manag. 2022, 265, 115761. [Google Scholar] [CrossRef] [Scilit]
  38. Sun, Y.; Lin, Y.; Wan, Z.; Wang, Q.; Yang, C.; Yin, W.; Qiu, T. Water management and performance enhancement in proton exchange membrane fuel cell through metal foam flow field with hierarchical pore structure. Chem. Eng. J. 2024, 494, 152944. [Google Scholar] [CrossRef] [Scilit]
  39. Zhang, Z.; Liu, H.; Yang, D.; Li, J.; Lu, K.; Ye, Y.; Tan, D. Performance enhancements of power density and exergy efficiency for high-temperature proton exchange membrane fuel cell based on RSM-NSGA III. Energy 2024, 301, 131687. [Google Scholar] [CrossRef] [Scilit]
  40. Chen, X.; Li, W.; Gong, G.; Wan, Z.M.; Tu, Z.K. Parametric analysis and optimization of PEMFC system for maximum power and efficiency using MOEA/D. Appl. Therm. Eng. 2017, 121, 400–409. [Google Scholar] [CrossRef] [Scilit]
  41. Li, H.; Xu, B.; Lu, G.; Du, C.H.; Huang, N. Multi-objective optimization of PEM fuel cell by coupled significant variables recognition, surrogate models and a multi-objective genetic algorithm. Energy Convers. Manag. 2021, 236, 114063. [Google Scholar] [CrossRef] [Scilit]
  42. Ubong, E.U.; Shi, Z.; Wang, X. Three-dimensional modeling and experimental study of a high temperature PBI-based PEM fuel cell. J. Electrochem. Soc. 2009, 156, B1276. [Google Scholar] [CrossRef] [Scilit]
  43. Das, S.K.; Gibson, H.A. Three-dimensional multi-physics modeling and simulation for assessment of mass transport impact on the performance of a high temperature polymer electrolyte membrane fuel cell. J. Power Sources 2021, 499, 229844. [Google Scholar] [CrossRef] [Scilit]
Figure 1. Geometrical model of the PEMFC with conical frustum grooves in the cathode GDL.
Computation 14 00118 g001
Figure 2. Verification of mesh independence: (a) Polarization curves; (b) mass fraction of oxygen; (c) mass fraction of liquid water.
Computation 14 00118 g002aComputation 14 00118 g002b
Figure 3. Model validation about polarization curve.
Computation 14 00118 g003
Figure 4. Effects of groove structure on liquid water and oxygen distribution at the cathode GDL-CL interface at 0.5 V: (a) Liquid water; (b) Oxygen.
Computation 14 00118 g004aComputation 14 00118 g004b
Figure 5. y-direction gas velocity in the cathode channel with different groove structures at 0.5 V.
Computation 14 00118 g005
Figure 6. Effects of groove structure on the membrane current density at 0.5 V.
Computation 14 00118 g006
Figure 7. Effects of groove structure on the electrical performance: (a) Polarization curve; (b) Power density curve.
Computation 14 00118 g007
Figure 8. Effects of conical frustum groove spacing on the liquid water and oxygen distribution of cathode GDL-CL interface at 0.5 V: (a) Liquid water; (b) Oxygen.
Computation 14 00118 g008
Figure 9. Effects of conical frustum groove spacing on the membrane current density at 0.5 V.
Computation 14 00118 g009
Figure 10. Effects of conical frustum groove spacing on the electrical performance: (a) Polarization curve; (b) Power density curve.
Computation 14 00118 g010
Figure 11. Effects of conical frustum groove depth on liquid water and oxygen distribution at the cathode GDL-CL interface at 0.5 V: (a) Liquid water; (b) Oxygen.
Computation 14 00118 g011
Figure 12. Effects of conical frustum groove depth on the membrane current density at 0.5 V.
Computation 14 00118 g012
Figure 13. Effects of conical frustum groove depth on the electrical performance: (a) Polarization curve; (b) Power density curve.
Computation 14 00118 g013
Figure 14. Effects of top radius of conical frustum groove on liquid water and oxygen distribution of cathode GDL-CL interface at 0.5 V: (a) Liquid water; (b) Oxygen.
Computation 14 00118 g014
Figure 15. Effects of top radius of conical frustum groove on membrane current density at 0.5 V.
Computation 14 00118 g015
Figure 16. Effects of top radius of conical frustum groove on electrical performance: (a) Polarization curve; (b) Power density curve.
Computation 14 00118 g016
Figure 17. Effects of bottom radius of conical frustum groove on liquid water and oxygen distribution of cathode GDL-CL interface at 0.5 V: (a) Liquid water; (b) Oxygen.
Computation 14 00118 g017
Figure 18. Effects of bottom radius of conical frustum groove on membrane current density at 0.5 V.
Computation 14 00118 g018
Figure 19. Effects of bottom radius of conical frustum groove on electrical performance: (a) Polarization curve; (b) Power density curve.
Computation 14 00118 g019
Table 1. Dimensions of PEMFC with conventional GDL.
DimensionsValues (mm)
Channel length20.0
Membrane thickness0.1
CL thickness0.05
Channel width0.7874
GDL thickness0.38
Rib width0.90932
Channel height1.0
Table 2. Operation parameters.
ParameterValueRef.
Working temperature (K)343.15[33]
Reference temperature (K)453.15[20]
Pressure (Pa)101,325[20]
Hydrogen stoichiometric ratio1.2[33]
Air stoichiometric ratio2[33]
Membrane permeability (m2)1.80 × 10⁻¹¹[20]
Cathodic charge transfer coefficient1[33]
Membrane ionic conductivity (S·m−1)9.825[20]
H2 mole fraction0.96268[20]
O2 mole fraction0.20216[20]
H2O mole fraction0.037319[20]
Open-circuit voltage (V)0.95[20]
Surface-to-volume ratio (m−1)1.00 × 10⁷[20]
GDL porosity0.4[20]
GDL electrical conductivity (S·m−1)222[20]
GDL permeability (m2)2.36 × 10⁻¹²[20]
Table 3. Geometrical parameters of cases.
Case No.Top Radius (r1)
/mm
Bottom Radius (r2)
/mm
Depth (h)
/mm
Spacing (d)
/mm
Case 1----
Case 20.250.250.252
Case 30.250.50.252
Case 40.250.50.253.6
Case 50.250.50.253
Case 60.250.50.251.5
Case 70.250.50.251.2
Case 80.250.50.12
Case 90.250.50.22
Case 100.250.50.32
Case 110.250.50.352
Case 120.10.50.252
Case 130.20.50.252
Case 140.30.50.252
Case 150.350.50.252
Case 160.250.30.252
Case 170.250.40.252
Case 180.250.60.252
Case 190.250.70.252
Case 200.350.50.31.2
Disclaimer/Publisher’s Note: The statements, opinions and data contained in all publications are solely those of the individual author(s) and contributor(s) and not of MDPI and/or the editor(s). MDPI and/or the editor(s) disclaim responsibility for any injury to people or property resulting from any ideas, methods, instructions or products referred to in the content.