Article

Artificial Intelligence Optimization of Polyaluminum Chloride (PAC) Dosage in Drinking Water Treatment: A Hybrid Genetic Algorithm–Neural Network Approach

by
Darío Fernando Guamán-Lozada
1,
Lenin Santiago Orozco Cantos
1,
Guido Patricio Santillán Lima
1 and
Fabian Arias Arias
2,3,*
1
Grupo de Investigación Estudios Interdisciplinarios, Facultad de Ingeniería, Universidad Nacional de Chimborazo, Av. Antonio José de Sucre km 1½ vía Guano, Riobamba 060103, Ecuador
2
Facultad de Ciencias, Escuela Superior Politécnica de Chimborazo (ESPOCH), Riobamba 060155, Ecuador
3
Department of Chemistry and Chemical Technologies, University of Calabria, Via P. Bucci, Cubo 9 15D, 87036 Arcavacata di Rende, Italy
*
Author to whom correspondence should be addressed.
Computation 2025, 13(8), 179; https://doi.org/10.3390/computation13080179
Submission received: 30 June 2025 / Revised: 18 July 2025 / Accepted: 21 July 2025 / Published: 1 August 2025
(This article belongs to the Section Computational Engineering)

Abstract

The accurate dosing of polyaluminum chloride (PAC) is essential for achieving effective coagulation in drinking water treatment, yet conventional methods such as jar tests are limited in their responsiveness and operational efficiency. This study proposes a hybrid modeling framework that integrates artificial neural networks (ANN) with genetic algorithms (GA) to optimize PAC dosage under variable raw water conditions. Operational data from 400 jar test experiments, collected between 2022 and 2024 at the Yanahurco water treatment plant (Ecuador), were used to train an ANN model capable of predicting six post-treatment water quality indicators, including turbidity, color, and pH. The ANN achieved excellent predictive accuracy (R2 > 0.95 for turbidity and color), supporting its use as a surrogate model within a GA-based optimization scheme. The genetic algorithm evaluated dosage strategies by minimizing treatment costs while enforcing compliance with national water quality standards. The results revealed a bimodal dosing pattern, favoring low PAC dosages (~4 ppm) during routine conditions and higher dosages (~12 ppm) when influent quality declined. Optimization yielded a 49% reduction in median chemical costs and improved color compliance from 52% to 63%, while maintaining pH compliance above 97%. Turbidity remained a challenge under some conditions, indicating the potential benefit of complementary coagulants. The proposed ANN–GA approach offers a scalable and adaptive solution for enhancing chemical dosing efficiency in water treatment operations.

1. Introduction

The global demand for clean water continues to rise, driven by rapid population growth, urbanization, industrial expansion, and intensified agricultural activity. These pressures have led to the degradation of water sources and increased stress on existing water infrastructure. In response, the United Nations General Assembly adopted Sustainable Development Goal 6 (SDG 6): Clean Water and Sanitation, as part of the 2030 Agenda for Sustainable Development in September 2015 [1]. This goal highlights the urgent need to ensure universal access to safe drinking water—an essential component for protecting public health, preserving environmental integrity, and sustaining economic growth [2].
Water treatment processes are central to achieving this objective. Conventional drinking water treatment typically includes coagulation, flocculation, sedimentation, filtration, and disinfection [3,4]. Among these, coagulation is a critical step aimed at destabilizing and aggregating colloidal and dissolved particles that are otherwise difficult to remove by filtration alone. Chemical coagulants neutralize surface charges of suspended matter, allowing particle agglomeration into larger flocs that can be separated through sedimentation and filtration [4].
Polyaluminum chloride (PAC), a pre-hydrolyzed aluminum-based coagulant, is widely used in water treatment due to its high charge density, stability across a broad pH range, rapid floc formation, and reduced sludge volume compared to conventional aluminum sulfate (alum) [5,6]. Its molecular structure allows for more efficient destabilization of particles and organic matter, improving removal efficiency even under challenging conditions such as low alkalinity or high turbidity [7,8]. PAC has also been associated with lower residual aluminum concentrations in treated water, contributing to better compliance with health-based standards.
Despite its advantages, the performance of PAC is highly sensitive to raw water characteristics, including pH, turbidity, color, temperature, and ionic strength. Consequently, determining the optimal PAC dosage is straightforward and requires careful adjustment to achieve treatment objectives without overdosing—an outcome that can increase operational costs, cause filter clogging, or lead to residual coagulant in the distribution system [9]. The jar test remains the standard method for dosage determination; however, it is a batch-based, manual technique that lacks real-time adaptability and depends heavily on operator experience [10].
Given these limitations, recent research has emphasized the need to optimize PAC dosing to enhance treatment efficiency, reduce costs, and ensure regulatory compliance. Hybrid modeling approaches that integrate artificial neural networks (ANNs) and genetic algorithms (GAs) have demonstrated superior performance in capturing the complex nonlinear relationships inherent in water treatment processes, outperforming both conventional methods and standalone models [3,5,11,12,13].
ANN-based models have shown high predictive accuracy for determining optimal PAC doses, achieving low error metrics such as Mean Absolute Percentage Error (MAPE) and Root Mean Square Error (RMSE), thereby enabling reliable and efficient coagulation control [5,8,11,14]. The combination of ANNs with GAs—known as hybrid ANN–GA models (HANN)—further enhances modeling capabilities by improving the extrapolation and generalization of results, even under rapidly changing raw water conditions. These hybrid systems allow for real-time operational adjustments, ensuring consistent compliance with potability standards [3,12,15].
Among various AI techniques, ANNs have emerged as powerful tools for modeling and optimization in complex water treatment scenarios. These models are particularly effective in capturing nonlinear interactions among water quality variables and predicting treatment outcomes [8,16,17,18]. ANNs can learn from historical operational data and generalize to new conditions, making them ideal for applications where physical modeling is difficult or infeasible. Their successful use has been reported in various tasks, including prediction of turbidity removal efficiency, coagulant demand, filtration performance, and chemical dosing optimization [5,8,17].
The key advantage of hybrid ANN–GA approaches lies in their capacity to minimize operating costs by preventing chemical overdosing. Automated optimization enables more efficient coagulant utilization, reduces sludge production, and consequently lowers both chemical and disposal costs [3,5,14,19]. Additionally, these models can identify multiple optimal operating points (Pareto front), facilitating decision-making that balances cost-efficiency and performance [3,19].
Multilayer perceptrons (MLPs), a specific type of feedforward ANN, have demonstrated particularly strong predictive performance in water treatment applications [20]. When integrated with evolutionary algorithms such as GAs, MLPs can be embedded within optimization frameworks designed to search for ideal input configurations (e.g., coagulant dosage) in accordance with predefined objective functions. GA-based optimization provides robust search capabilities across complex, multi-dimensional solution spaces and can incorporate constraints such as cost limitations and regulatory thresholds [21,22]. Several studies have validated the performance of ANN–GA hybrid systems in optimizing PAC dosing, especially in treatment plants facing variable raw water quality or stringent compliance requirements [5,23]. These systems have achieved significant reductions in chemical consumption and improved treatment reliability while offering real-time adaptability and automation potential [24].
In addition, intelligent hybrid systems contribute to regulatory compliance by maintaining key water quality parameters, such as turbidity, within acceptable limits despite fluctuations in source water conditions [12,15,25]. Their predictive capabilities support proactive control strategies that respond to anticipated changes in raw water quality or regulatory demands [3].
This study proposes a hybrid ANN–GA framework for optimizing PAC dosage in a high-altitude drinking water treatment plant in Ecuador. The ANN model is trained using historical jar test data to predict six key post-treatment quality indicators, while the GA component identifies the PAC dose that minimizes operational cost while maintaining compliance with regulatory standards. The overarching objective is to support the development of intelligent, self-regulating water treatment systems capable of adapting to dynamic environmental and operational conditions, thereby improving efficiency, sustainability, and resilience.

2. Materials and Methods

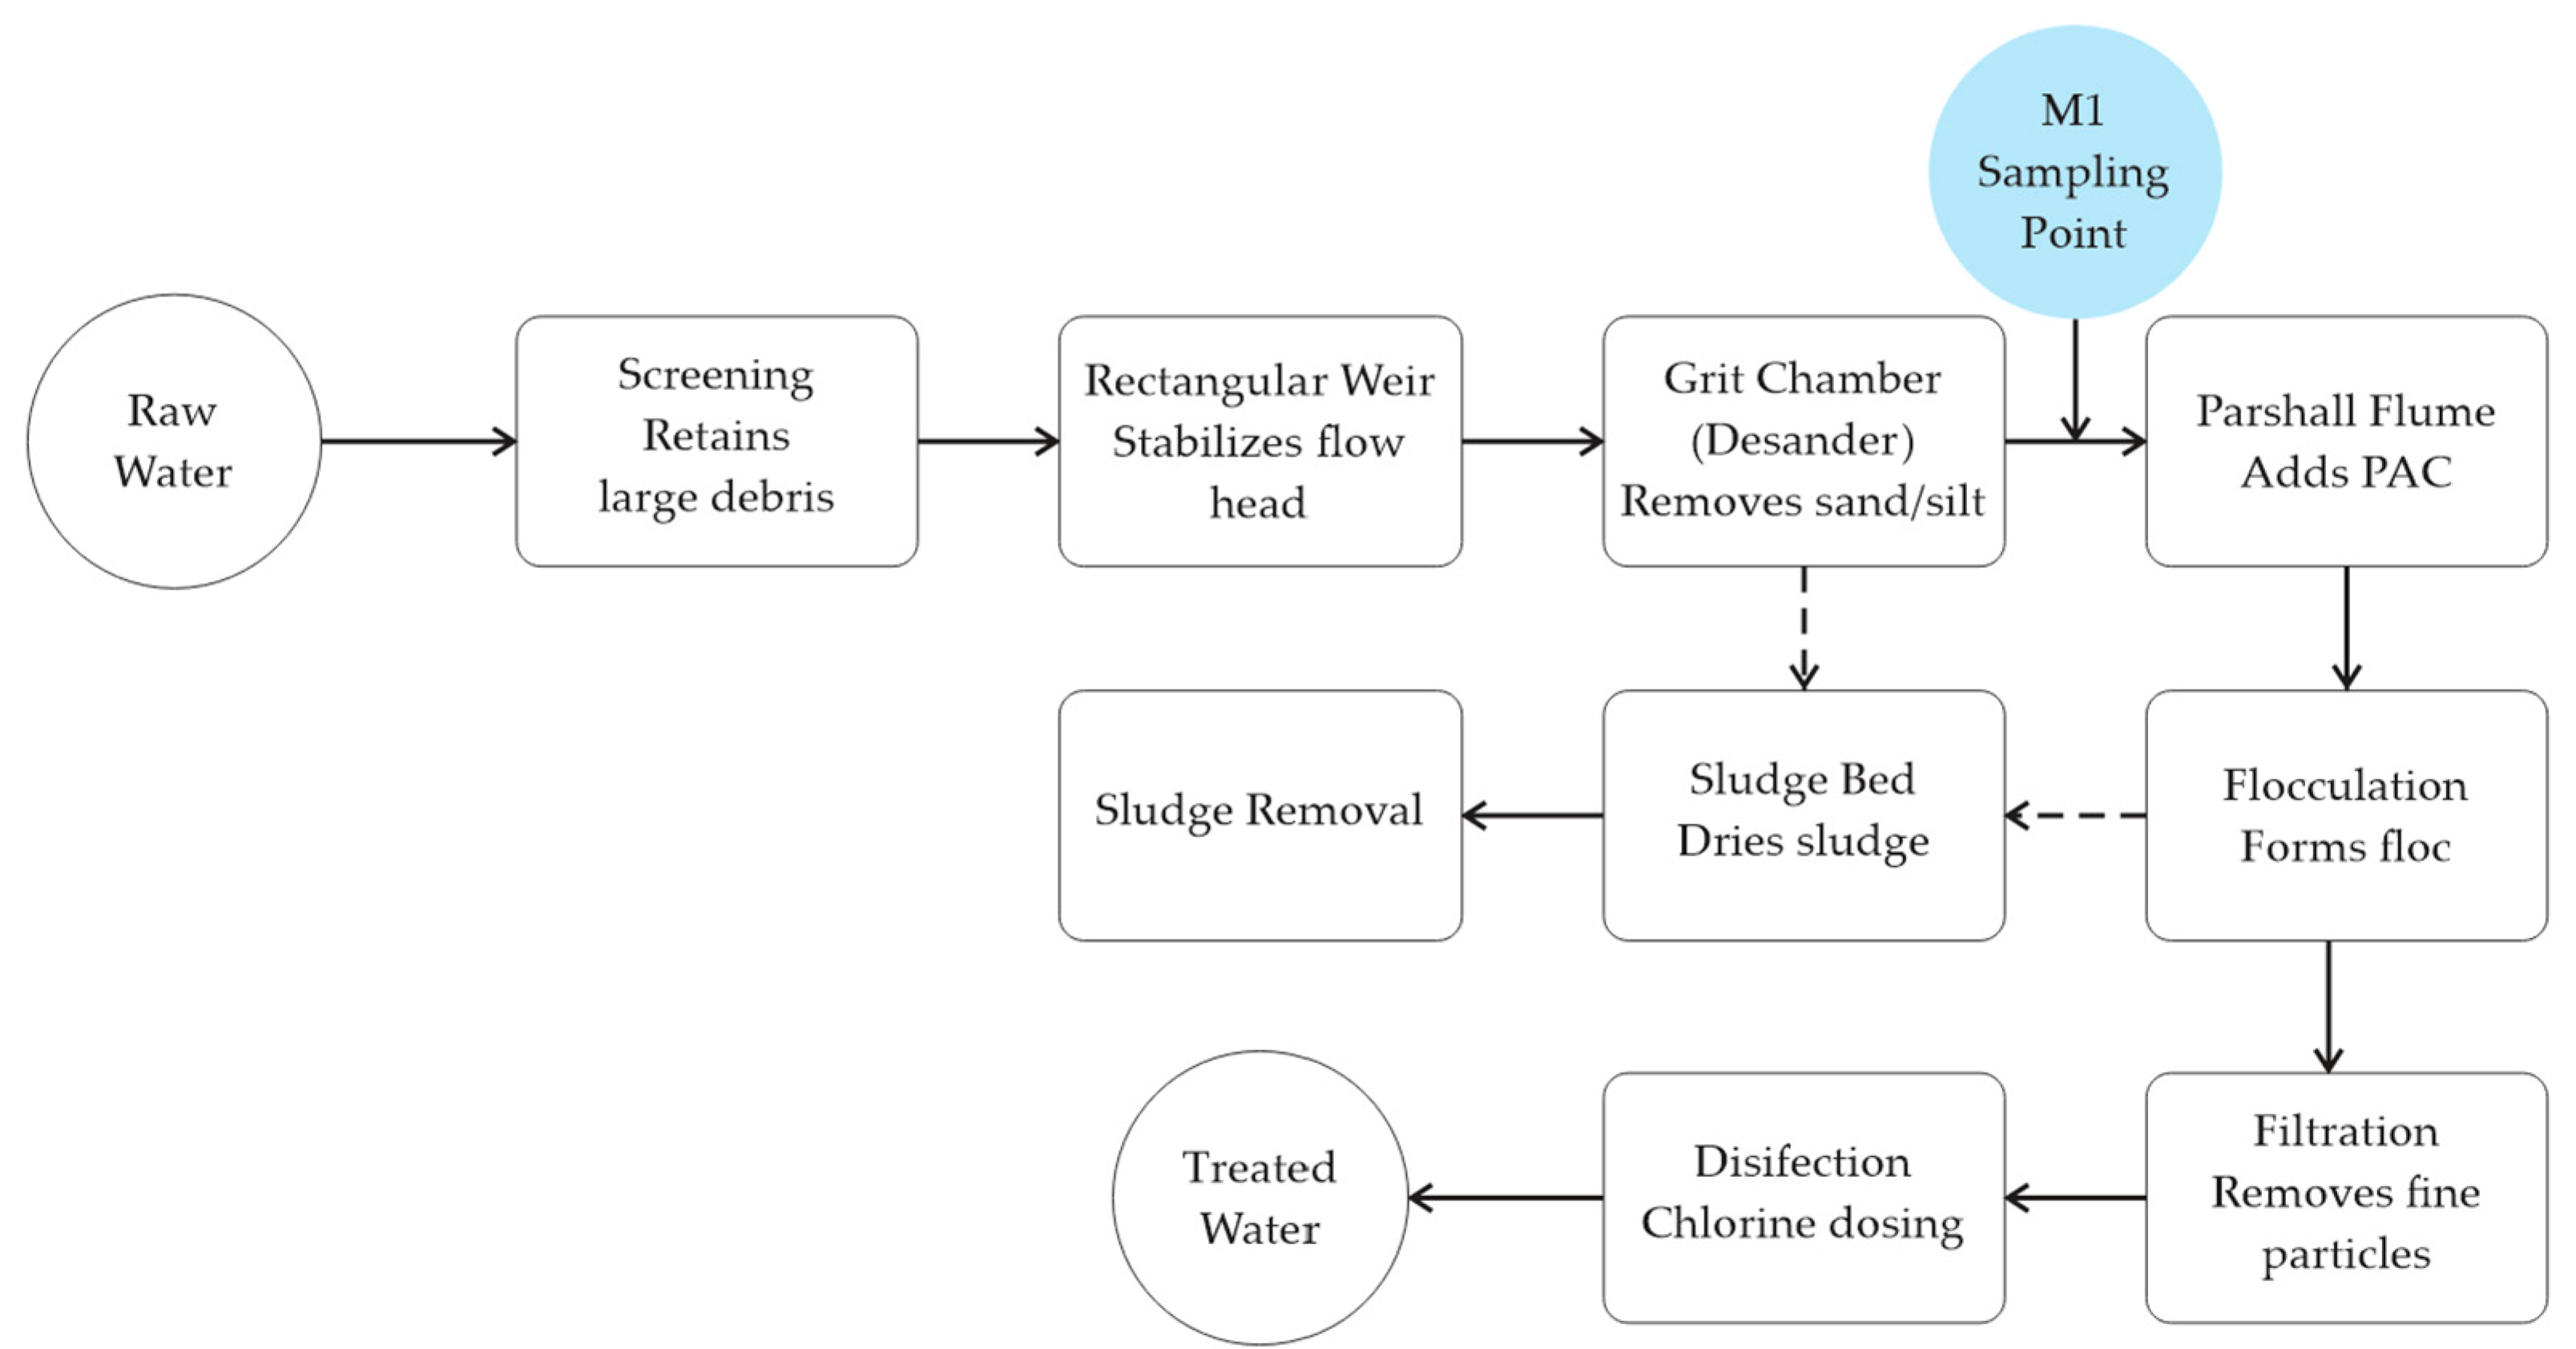
2.1. Site Description and Process Layout

The study was conducted at the Yanahurco Water-Treatment Plant (JAAPARY), located in Mocha, Tungurahua, Ecuador (UTM coordinates 17M, 758,630 m E; 9,841,842 m N; 3333 m a.s.l.). The plant treats approximately 8000 m3 of water per day, supplying around 15,000 inhabitants. The raw water source is glacial melt from Mt. Carihuayrazo (3890 m a.s.l.), characterized by low alkalinity (12–18 mg CaCO3 L−1), slightly acidic pH (6.5–6.8), and highly variable turbidity—typically below 5 NTU during the dry season and exceeding 50 NTU during heavy rainfall. The treatment train (adapted from Muyón, 2017) includes coarse screening, a rectangular weir, a horizontal grit chamber, a Parshall flume (used for chemical dosing and flow measurement), a hydraulic flocculator, a horizontal clarifier, and rapid sand filters. Polyaluminum chloride (PAC, 10% w/w Al2O3) is the sole coagulant used, dosed in liquid form at the Parshall flume. Samples for the study were collected at two key points: upstream of the Parshall flume (M1, raw water) and at the clarifier overflow (M2, clarified water). Figure 1 shows the geographic setting of the catchment and plant location, and Figure 2 presents the detailed unit-process flow.
Raw water enters through a screened inlet channel that retains coarse debris (>25 mm) and flows over a rectangular weir that stabilizes the hydraulic head. It then passes through a horizontal grit chamber (desander), where sand and silt are removed. Just downstream, a Parshall flume is used for flow measurement and PAC (polyaluminum chloride) injection. The coagulant is rapidly mixed in a hydraulic flocculator to promote floc formation. Subsequent treatment includes filtration for fine particle removal and chlorine dosing for disinfection. The sampling point (M1) was located immediately upstream of the Parshall flume, before coagulant addition.

2.2. Data Collection

All experimental data used in this study were provided by the public water utility JAAPARY and correspond to the operational records of a single drinking water treatment plant (DWTP) between January 2022 and March 2024. The dataset includes average operational parameters, water quality indicators, and production volumes, comprising a total of 400 jar test records collected. These jar tests were performed in 1 L beakers using polyaluminum chloride (PAC) at concentrations ranging from 8 to 17 mg/L, aimed at evaluating the removal efficiency of turbidity and color. The experimental procedure consisted of a rapid mixing phase at 150 rpm for 60 s to simulate the hydraulic energy of a Parshall flume, followed by slow mixing at 40 rpm for 15 min to promote floc formation under a velocity gradient of approximately 40 s−1. Subsequently, the flocculated suspension was allowed to settle under quiescent conditions for 30 min at a controlled temperature of 20 ± 2 °C. After sedimentation, supernatant samples were collected at two-thirds of the total water depth. The instrumentation employed included a PB-900 jar tester (Phipps & Bird, 6 paddles, 5–300 rpm) compliant with ASTM D2035 for controlled mixing.
The physicochemical characterization of the supernatant obtained after coagulation with polyaluminum chloride (PAC) was immediately analyzed, in order to prevent alterations due to oxidative or microbiological processes.
Turbidity was measured using a Hach 2100Q turbidimeter (range: 0–1000 NTU), following the guidelines of EPA Method 180.1. This method is based on the nephelometric principle, which involves light scattering at a 90° angle. Optical cells were thoroughly rinsed with distilled water and a portion of the sample prior to measurement. Each sample was analyzed in triplicate, and the mean value was reported. Apparent color was assessed using a Hach DR 900 portable spectrophotometer at a wavelength of 455 nm, according to Standard Methods 2120 B. Prior to analysis, samples were filtered through 0.45 µm cellulose acetate membranes to remove suspended solids that could interfere with absorbance. Results were expressed in platinum–cobalt units (Pt-Co).
pH was measured using a Thermo Scientific Orion Star A211 benchtop pH meter equipped with a combined glass electrode. The electrode was calibrated daily with standard buffer solutions at pH 4.01, 7.00, and 10.01. Measurements were performed at room temperature (22 ± 1 °C), ensuring that the electrode bulb was fully immersed in the sample. Electrical conductivity (EC) and total dissolved solids (TDS) were determined using a conductivity cell with a cell constant of K = 0.1 cm−1, coupled to the Hach DR 900, in accordance with Standard Methods 2510 B. Calibration was performed using a 0.01 M potassium chloride (KCl) standard solution (1413 µS/cm). TDS values were calculated based on the instrument’s automatic temperature-compensated conversion factor
Table 1 presents the statistical summary of the 400 jar tests, including key descriptive parameters and a comparison with the permissible limits established by the Ecuadorian Standardization Institute (INEN, Instituto Ecuatoriano de Normalización) [26].

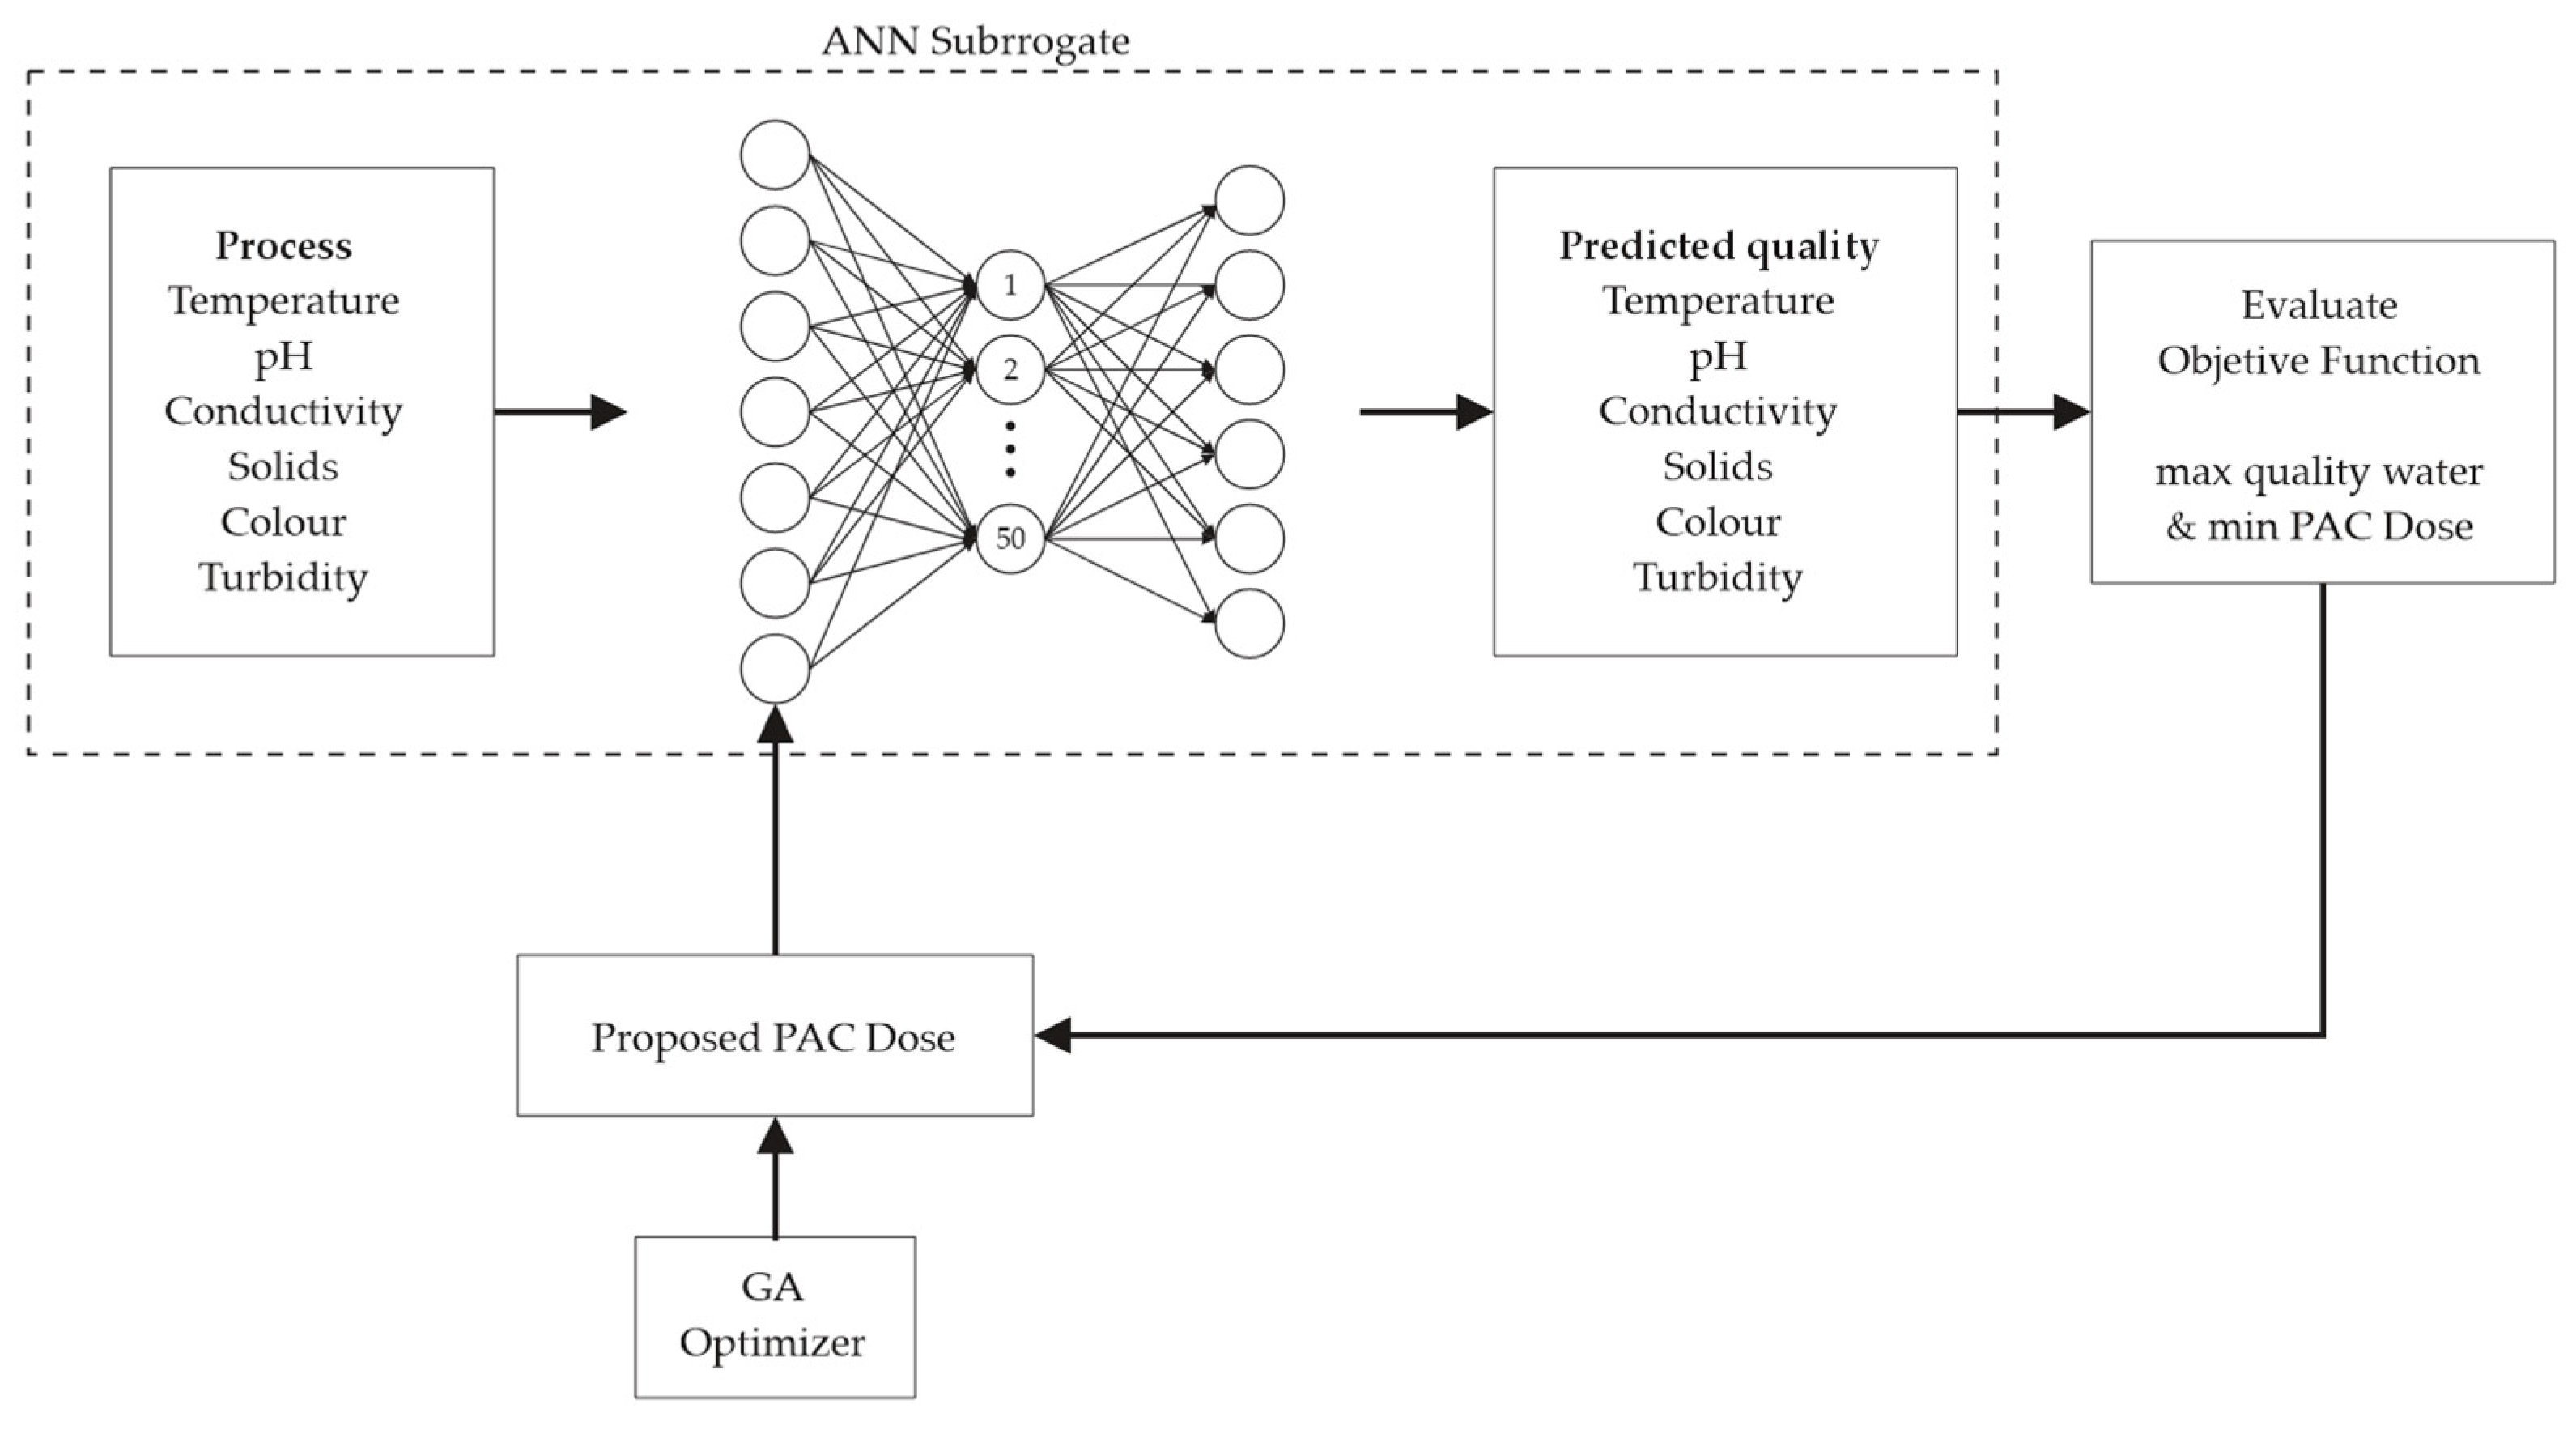
2.3. Data Analysis and Artificial Neural Network Development

The development of the predictive model was based on a structured set of input and output variables to represent the physicochemical behavior of raw and treated water at the Yanahurco Water-Treatment Plant (JAAPARY). The input variables, sourced from the xdata.csv dataset, comprised seven key characteristics of the untreated water: color (Pt-Co units), turbidity (NTU), conductivity (μS/cm), total dissolved solids (mg/L), temperature (°C), influent pH (dimensionless), and historical polyaluminum chloride (PAC) dosage (ppm). These variables were selected for their critical role in influencing coagulation dynamics and floc formation efficiency under variable water quality conditions.
The ANN was designed to predict six post-treatment quality indicators of the clarified water, stored in the ydata.csv dataset and designated with the prefix “Y_”:
Y_Color (Pt-Co units);
Y_Turbidity (NTU);
Y_pH (dimensionless);
Y_Conductivity (μS/cm);
Y_Temperature (°C);
Y_TDS (mg/L).
These outputs reflect the standard parameters employed in evaluating the efficiency of water treatment processes, particularly in coagulation–flocculation systems.
A supervised machine learning approach based on feedforward artificial neural networks (ANNs) was employed for computational analysis. Prior to model construction, a two-stage data preprocessing pipeline was implemented. First, outliers were detected and removed through a combination of graphical inspection and robust statistical criteria, a critical step to reduce variance inflation, stabilize the learning process, and mitigate bias in parameter estimation. Second, all input and output variables were normalized using min-max scaling to the unit interval [0,1], according to the equation:
X n = X X m i n X m a x X m i n
where Xn is the normalized value, and Xmin, Xmax are the minimum and maximum values within the training dataset. This normalization facilitates numerical stability and accelerates convergence during gradient-based optimization in multilayer networks.

2.3.1. ANN Architecture and Training Protocol

The ANN topology was designed with seven input neurons (Figure 3), corresponding to the input variables (color, turbidity, conductivity, total dissolved solids, temperature, influent pH, historical PAC dosage), one hidden layer with 50 neurons, and six output neurons corresponding to the post-treatment quality parameters (Y_Color, Y_Turbidity, Y_pH, Y_Conductivity, Y_Temperature, Y_TDS). The hidden layer used the hyperbolic tangent sigmoid activation function (tansig):
f t a n s i g x = 2 1 + e 2 x 1
While the output layer employed a linear activation function (purelin):
f t a n s i g x = x
This configuration was well-suited for multivariate regression tasks, capturing nonlinear relationships in the hidden layer while providing unbounded output responses for the quality parameters. Training was performed using the Scaled Conjugate Gradient Backpropagation (trainscg) algorithm, selected for its computational efficiency in high-dimensional datasets, as implemented in MATLAB’s fitnet function (version R2022b). The model architecture was fixed with 50 hidden neurons; the configuration was selected based on established practices in ANN modeling for water treatment, where architectures with 10–100 neurons effectively capture nonlinear relationships in coagulation processes without overfitting [27]. For the Yanahurco dataset (400 jar tests) and the task of predicting six post-treatment quality parameters, 50 neurons provided sufficient capacity to model complex dynamics while ensuring computational efficiency, aligning with prior studies on similar multivariate regression tasks.
This configuration was well-suited for multivariate regression tasks, capturing nonlinear relationships in the hidden layer while providing unbounded output responses for the quality parameters. The ANN was implemented using MATLAB’s fitnet function with the Scaled Conjugate Gradient Backpropagation (trainscg) algorithm (version R2022b), selected for its computational efficiency in high-dimensional datasets. The dataset of 400 jar test records was randomly partitioned into 70% for training, 15% for validation, and 15% for testing, using a fixed random seed (rng(42,’twister’)) to ensure reproducibility. The training process used custom indices (divideind) to assign data splits, with early stopping applied after six consecutive increases in validation error (max_fail = 6) to prevent overfitting. Training was conducted in serial mode to ensure platform independence, as enforced by disabling parallel processing. The model architecture was fixed with 50 hidden neurons, determined through prior empirical testing to balance model complexity and predictive performance, without iterative hyperparameter tuning.
Model performance was evaluated using the Coefficient of Determination (R2), calculated as follows:
R 2 = 1 i = 1 n y i y i ^ 2 i = 1 n y i y i ¯ 2
where y i represents the actual values and y i ^ the predicted values, computed across all outputs. Mean Squared Error (MSE) was monitored during training to assess convergence, with the learning curve (MSE versus epoch) to confirm robust model performance without overfitting.
M S E = 1 n i = 1 n y i y i ^ 2

2.3.2. Genetic Algorithm Optimization

The overall optimization framework, depicted in Figure 4, combines a genetic algorithm (GA) with the trained artificial neural network (ANN) to determine the optimal dosage of polyaluminum chloride (PAC) for drinking water treatment. The goal is to minimize coagulant use while ensuring that treated water meets regulatory quality standards.
As shown in the lower-left section of Figure 3, the GA begins by generating candidate PAC doses within the operational range of 4–12 ppm. These proposed values are combined with normalized real-time process variables including temperature, pH, conductivity, solids, color, and turbidity, as shown in the first input block on the left.
The search window of 4–12 ppm is justified because it lies at the core of the 3–15 mg L−1 optimum range reported for PAC in low-alkalinity waters [6,10,20,28]. Below roughly 4 ppm, particle surface charge is typically not fully neutralized, leading to incomplete flocculation and, consequently, insufficient removal of turbidity and color [6,10]. At the opposite end, doses above about 12 ppm yield only marginal improvements in effluent quality while disproportionately increasing chemical costs and operational risks associated with pH depression and elevated residual aluminum [20,28]. Therefore, constraining the genetic algorithm to the 4–12 ppm interval prevents both ineffective under-dosing and uneconomical over-dosing, keeping the optimization within the most promising and well-documented band for this type of water.
The combined input vector is then fed into the trained ANN surrogate model, represented in the center of Figure 4. The ANN outputs the expected values of key parameters, such as color, turbidity, pH, temperature, conductivity, and solids, as indicated in the output block to the right of the neural network.
These predicted values are then passed to the objective function module, located at the far right of Figure 4, where the GA evaluates each candidate dosage. The fitness function combines economic and regulatory components.
J = λ P + α P μ 2 + pen max 0 , Y color 1.5 2 + max 0 , Y turb 0.8 2 + max 0 , 6.4 Y pH 2 + max 0 , Y pH 7.0 2
Penalties for regulatory violations, applied if
Color exceeds 1.5 Pt-Co;
Turbidity exceeds 0.8 NTU;
pH falls outside the range 6.4–7.0.
Y_Conductivity, Y_Temperature, and Y_TDS were excluded from the penalty function as their historical values (40–220 μS/cm, 8–13 °C, 0–20 mg/L) consistently comply with INEN 1108:2014 standards [26] and exhibit low sensitivity to PAC dosing at Yanahurco, prioritizing color, turbidity, and pH for regulatory compliance.
Additionally, three weighting terms are used in the fitness function:
λ = 3, to emphasize minimizing PAC cost;
α = 0.10, to penalize large deviations from the historical average dosage;
A hard penalty P of 5 × 10⁴ for non-compliance with regulatory limits.
The entire GA process was implemented in MATLAB using the ga function (version R2022b), with a population size of 30 and a maximum of 120 generations. This configuration strikes a balance between computational efficiency and solution quality, with preliminary testing confirming convergence beyond 100 generations. To maintain platform independence and reproducibility, the GA was executed in serial mode (UseParallel = false). Furthermore, a vectorized fitness function (UseVectorized = true) enabled simultaneous evaluation of all jar test records, reducing computational time.
It is important to note that, although the ANN predicts six outputs, only Y_Color, Y_Turbidity, and Y_pH were included in the penalty terms of the fitness function. These parameters are the most critical for compliance with Ecuadorian drinking water regulations [26]. The remaining variables—conductivity, temperature, and solids—were excluded from the penalty component, as they have either secondary relevance or minimal influence on coagulation performance at the JAAPARY plant.
The genetic algorithm proposes PAC dosages that, combined with process variables, are evaluated through an artificial neural network surrogate. The ANN predicts treated water quality, and an objective function assesses each dosage based on cost and regulatory compliance. This loop is repeated until convergence to the optimal PAC dosage.
The diary cost area is calculated as follows:
C o s t U S D = P A C p p m × 8000 × 10 3 × 0.25

3. Results and Discussion

A hybrid ANN–GA framework was implemented to refine polyaluminum chloride (PAC) dosing at the Yanahurco DWTP. The section below reports network skill, cost savings, and regulatory performance, referencing the eleven figures generated during the optimization study.

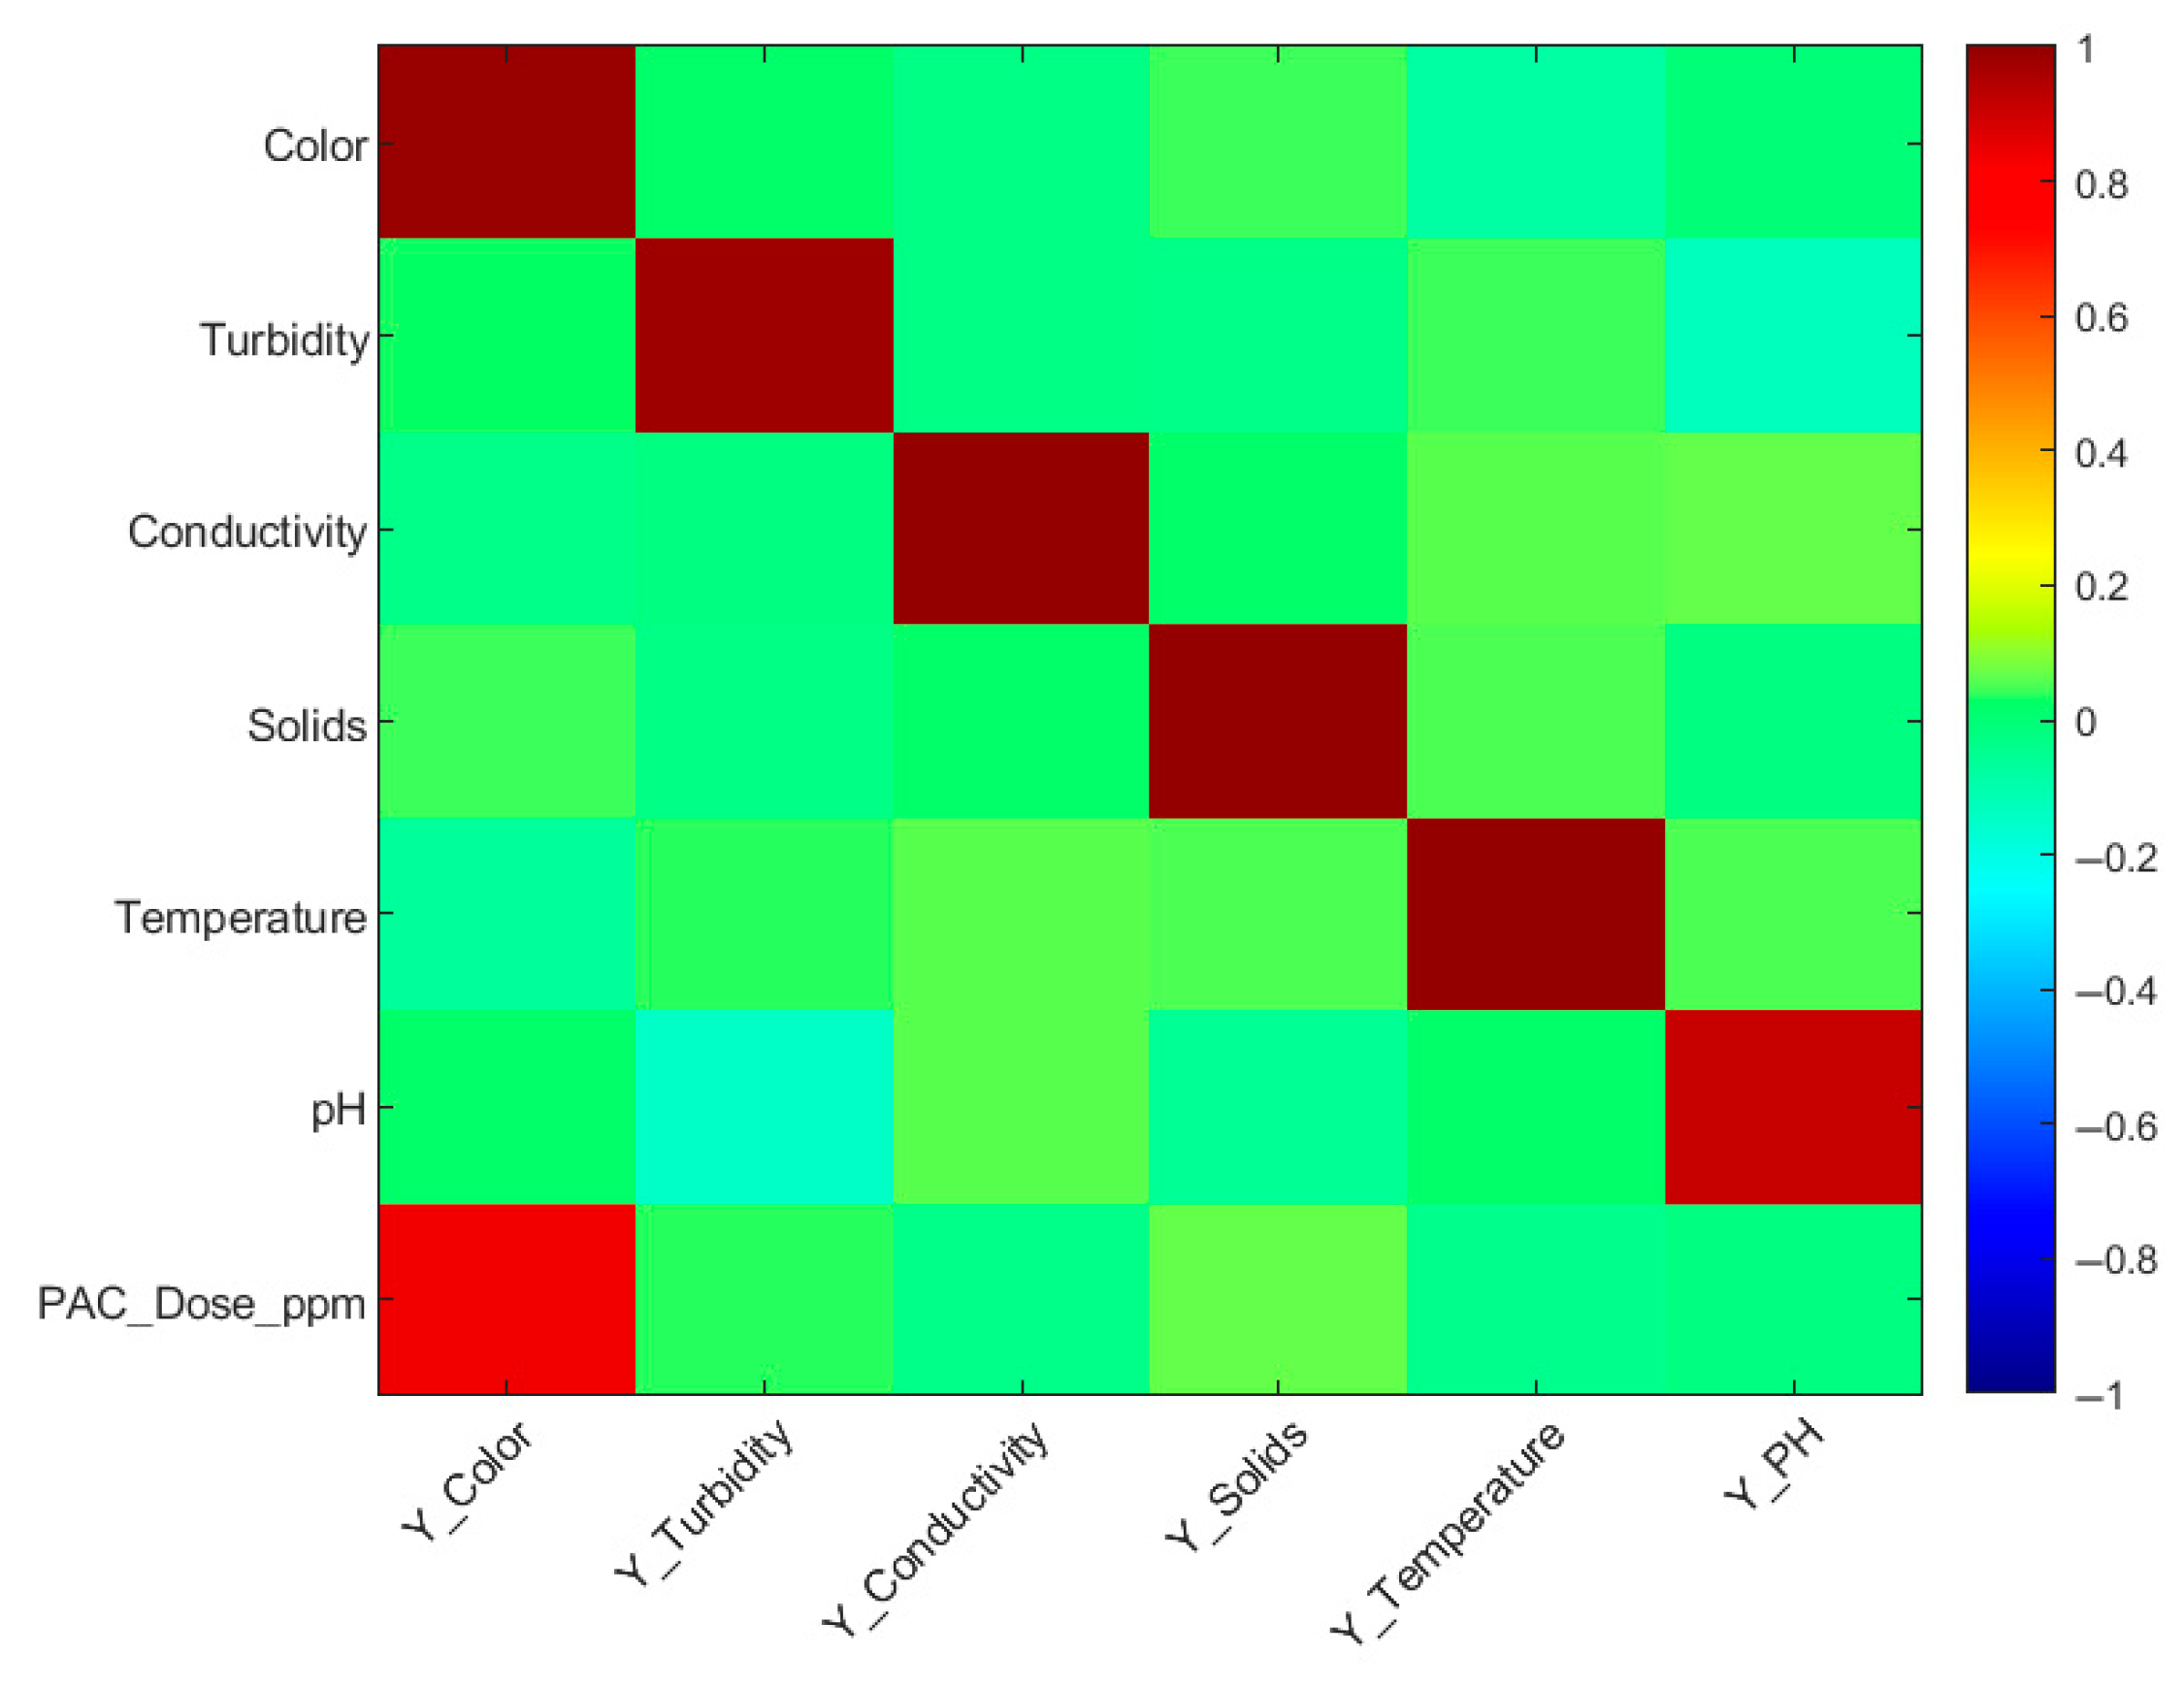
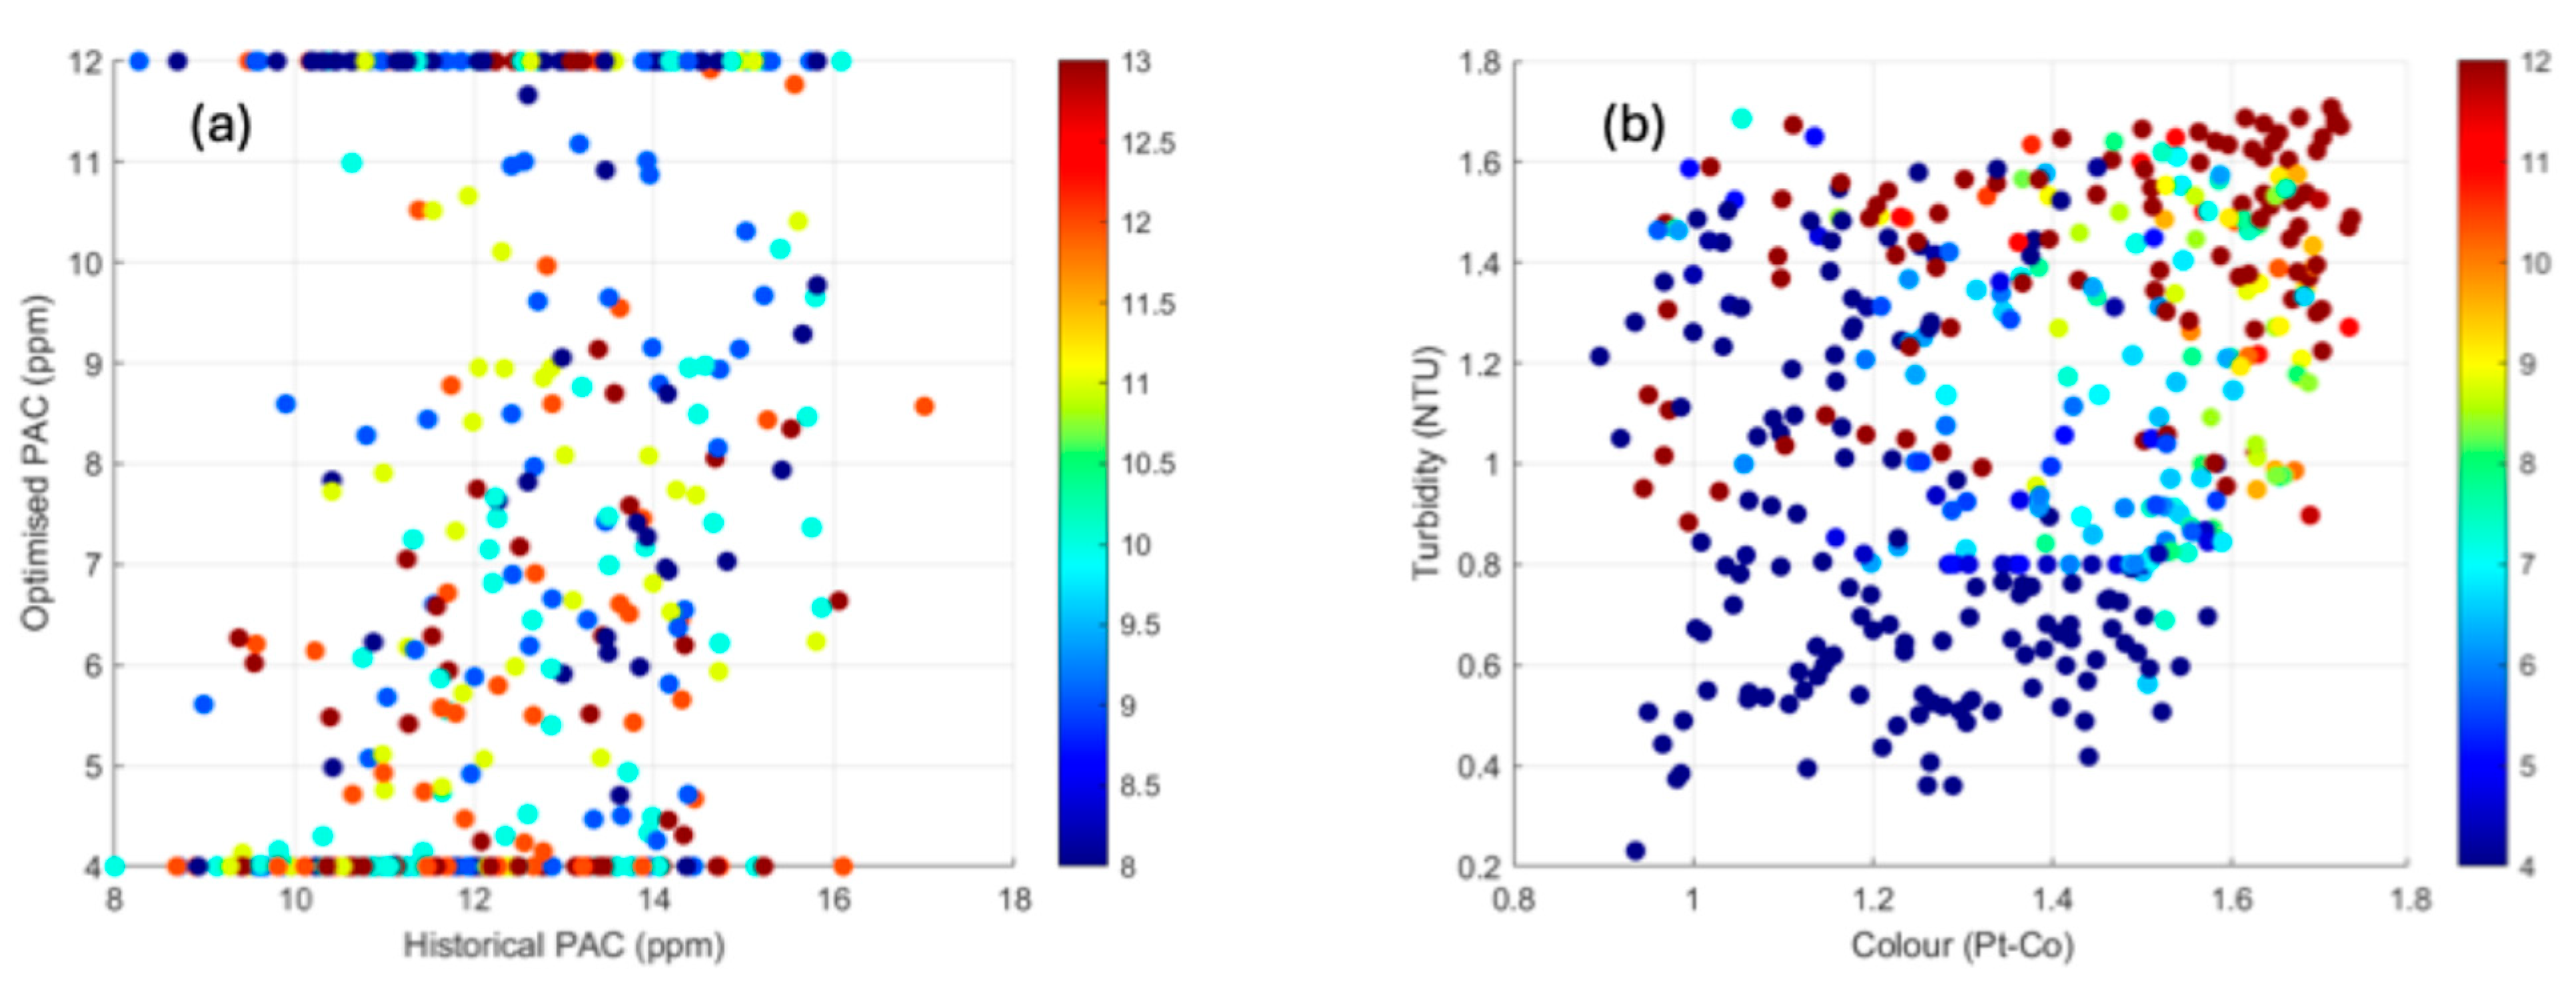
3.1. Exploratory Insight

The first step was to visualize linear interactions between variables. The correlation heat-map (Figure 5) reveals only weak pairwise links between raw-water descriptors (rows 1–6) and treated-water quality (columns). The single strong, positive coefficient is observed between PAC_Dose_ppm and Y_Colour, plus a moderate association with Y_pH. The absence of clear linear structure justifies the choice of a nonlinear learner.

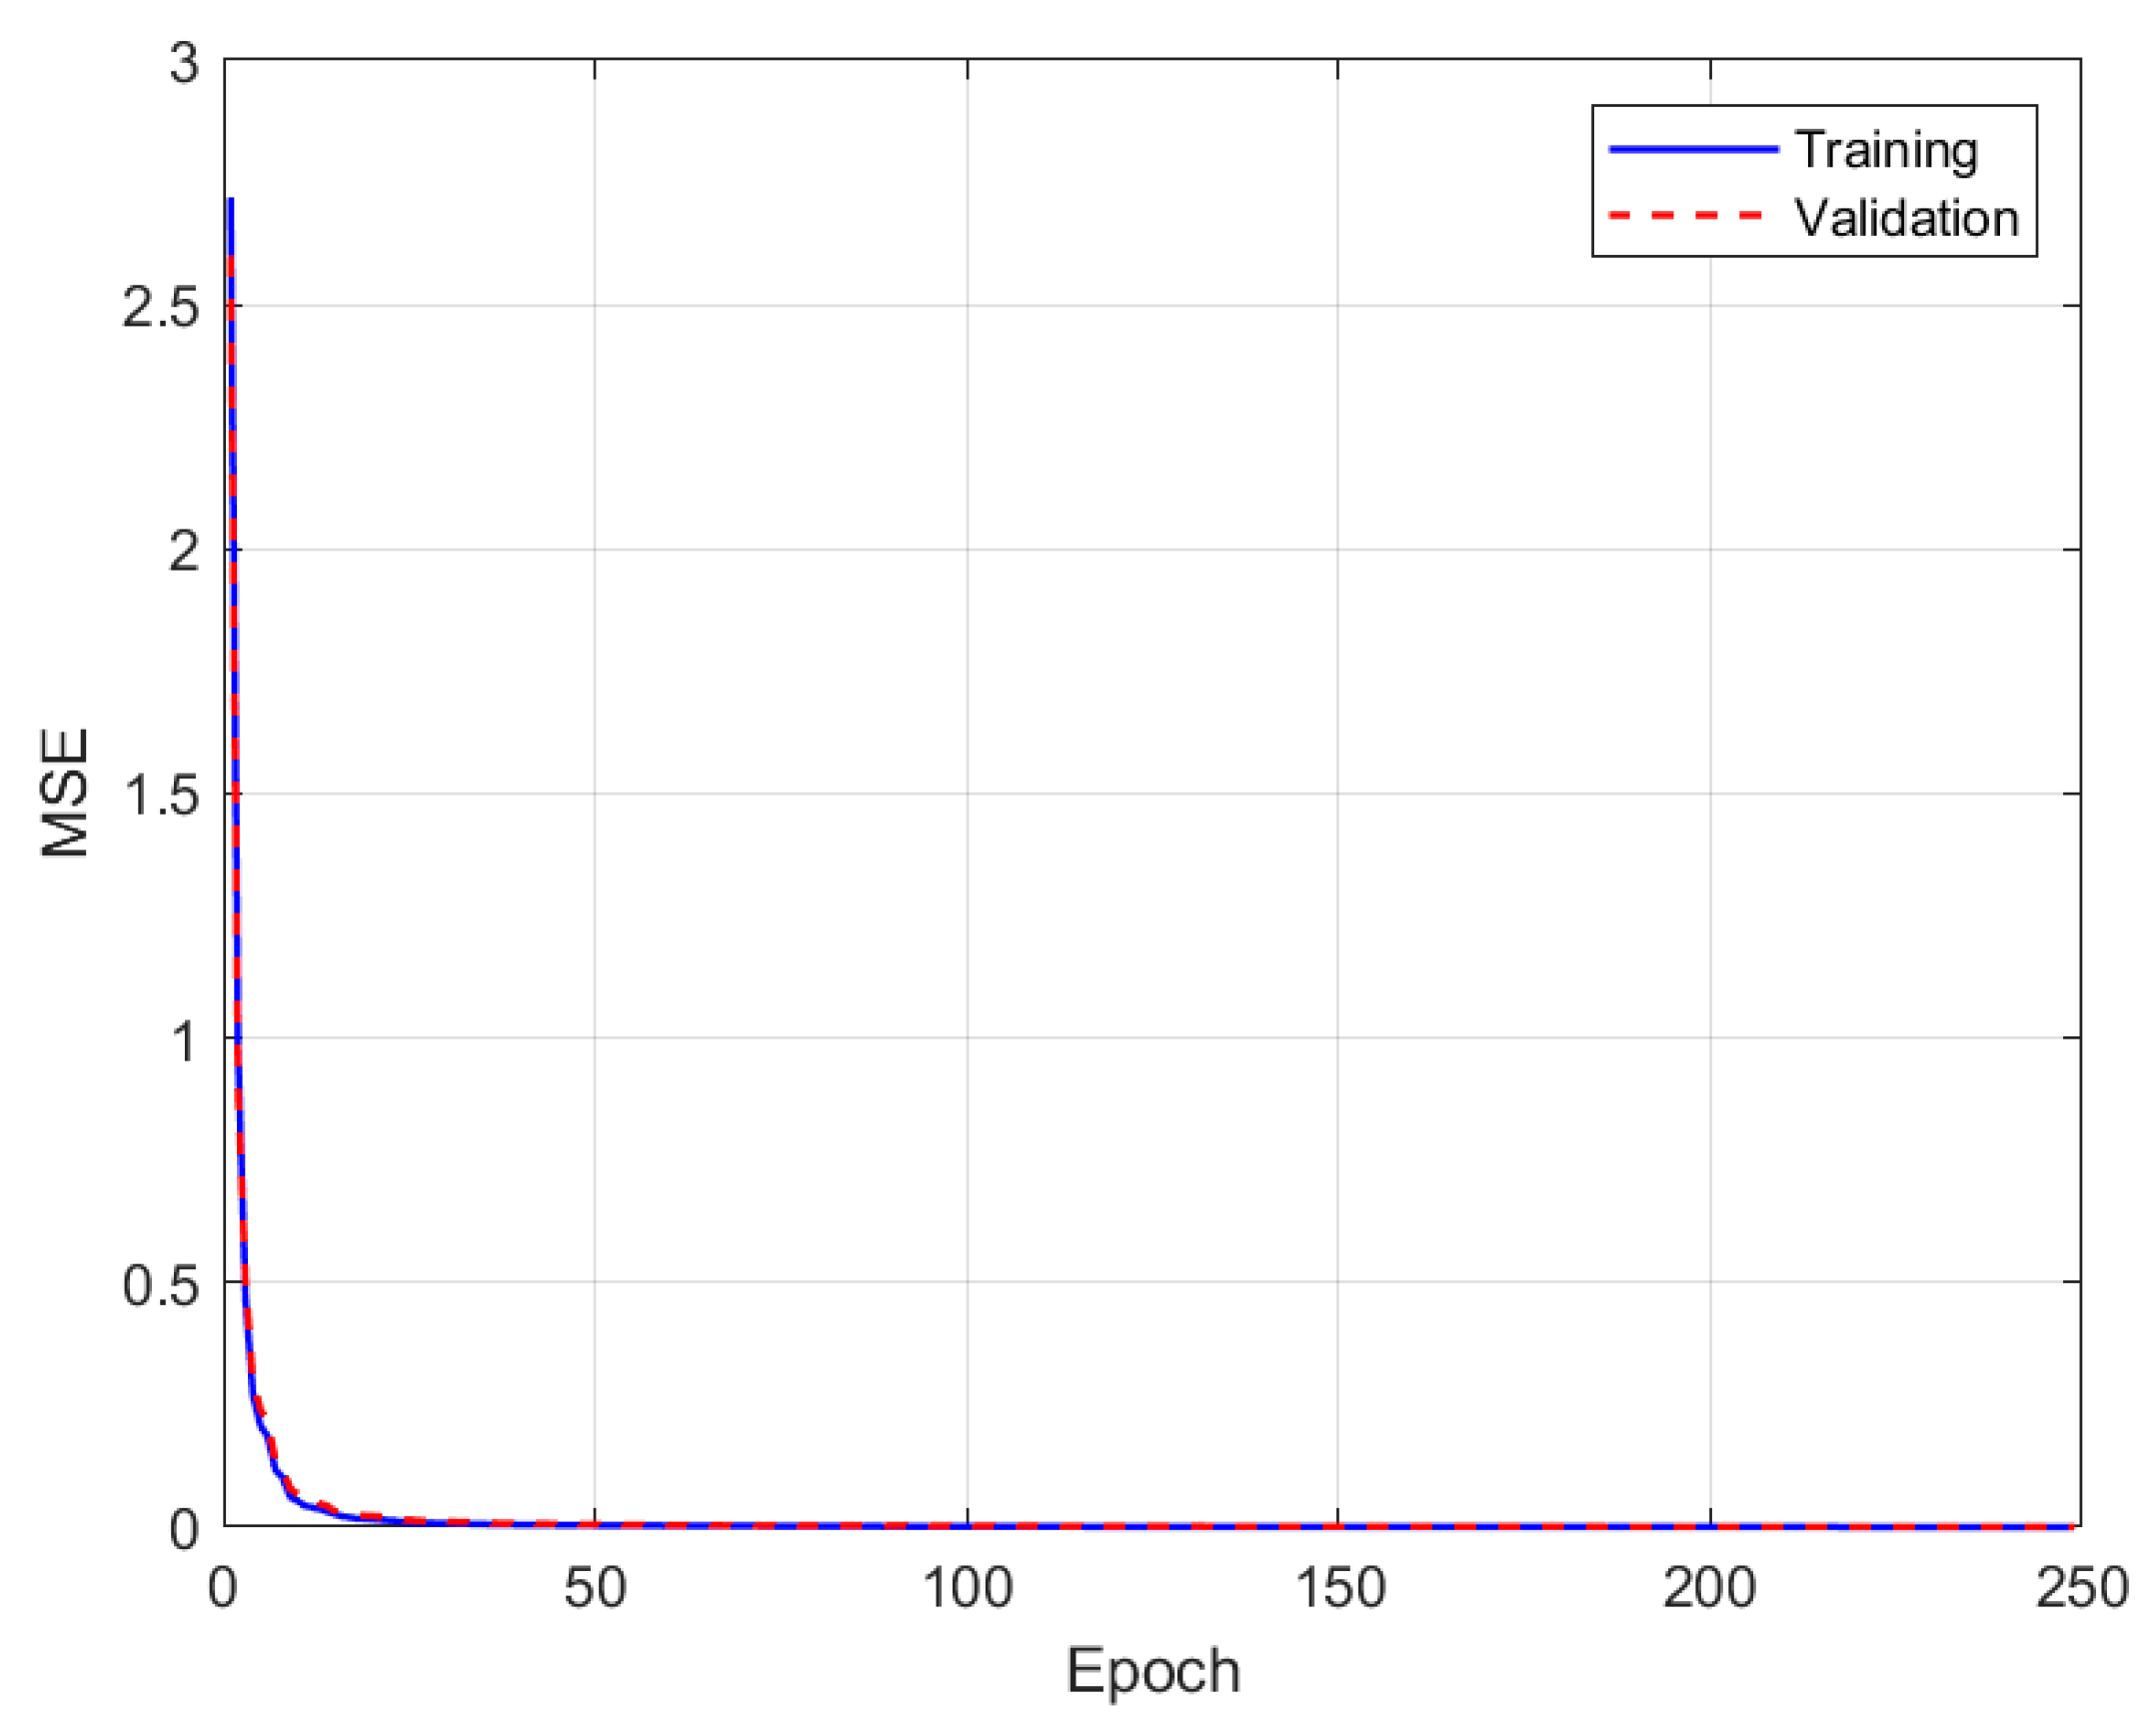
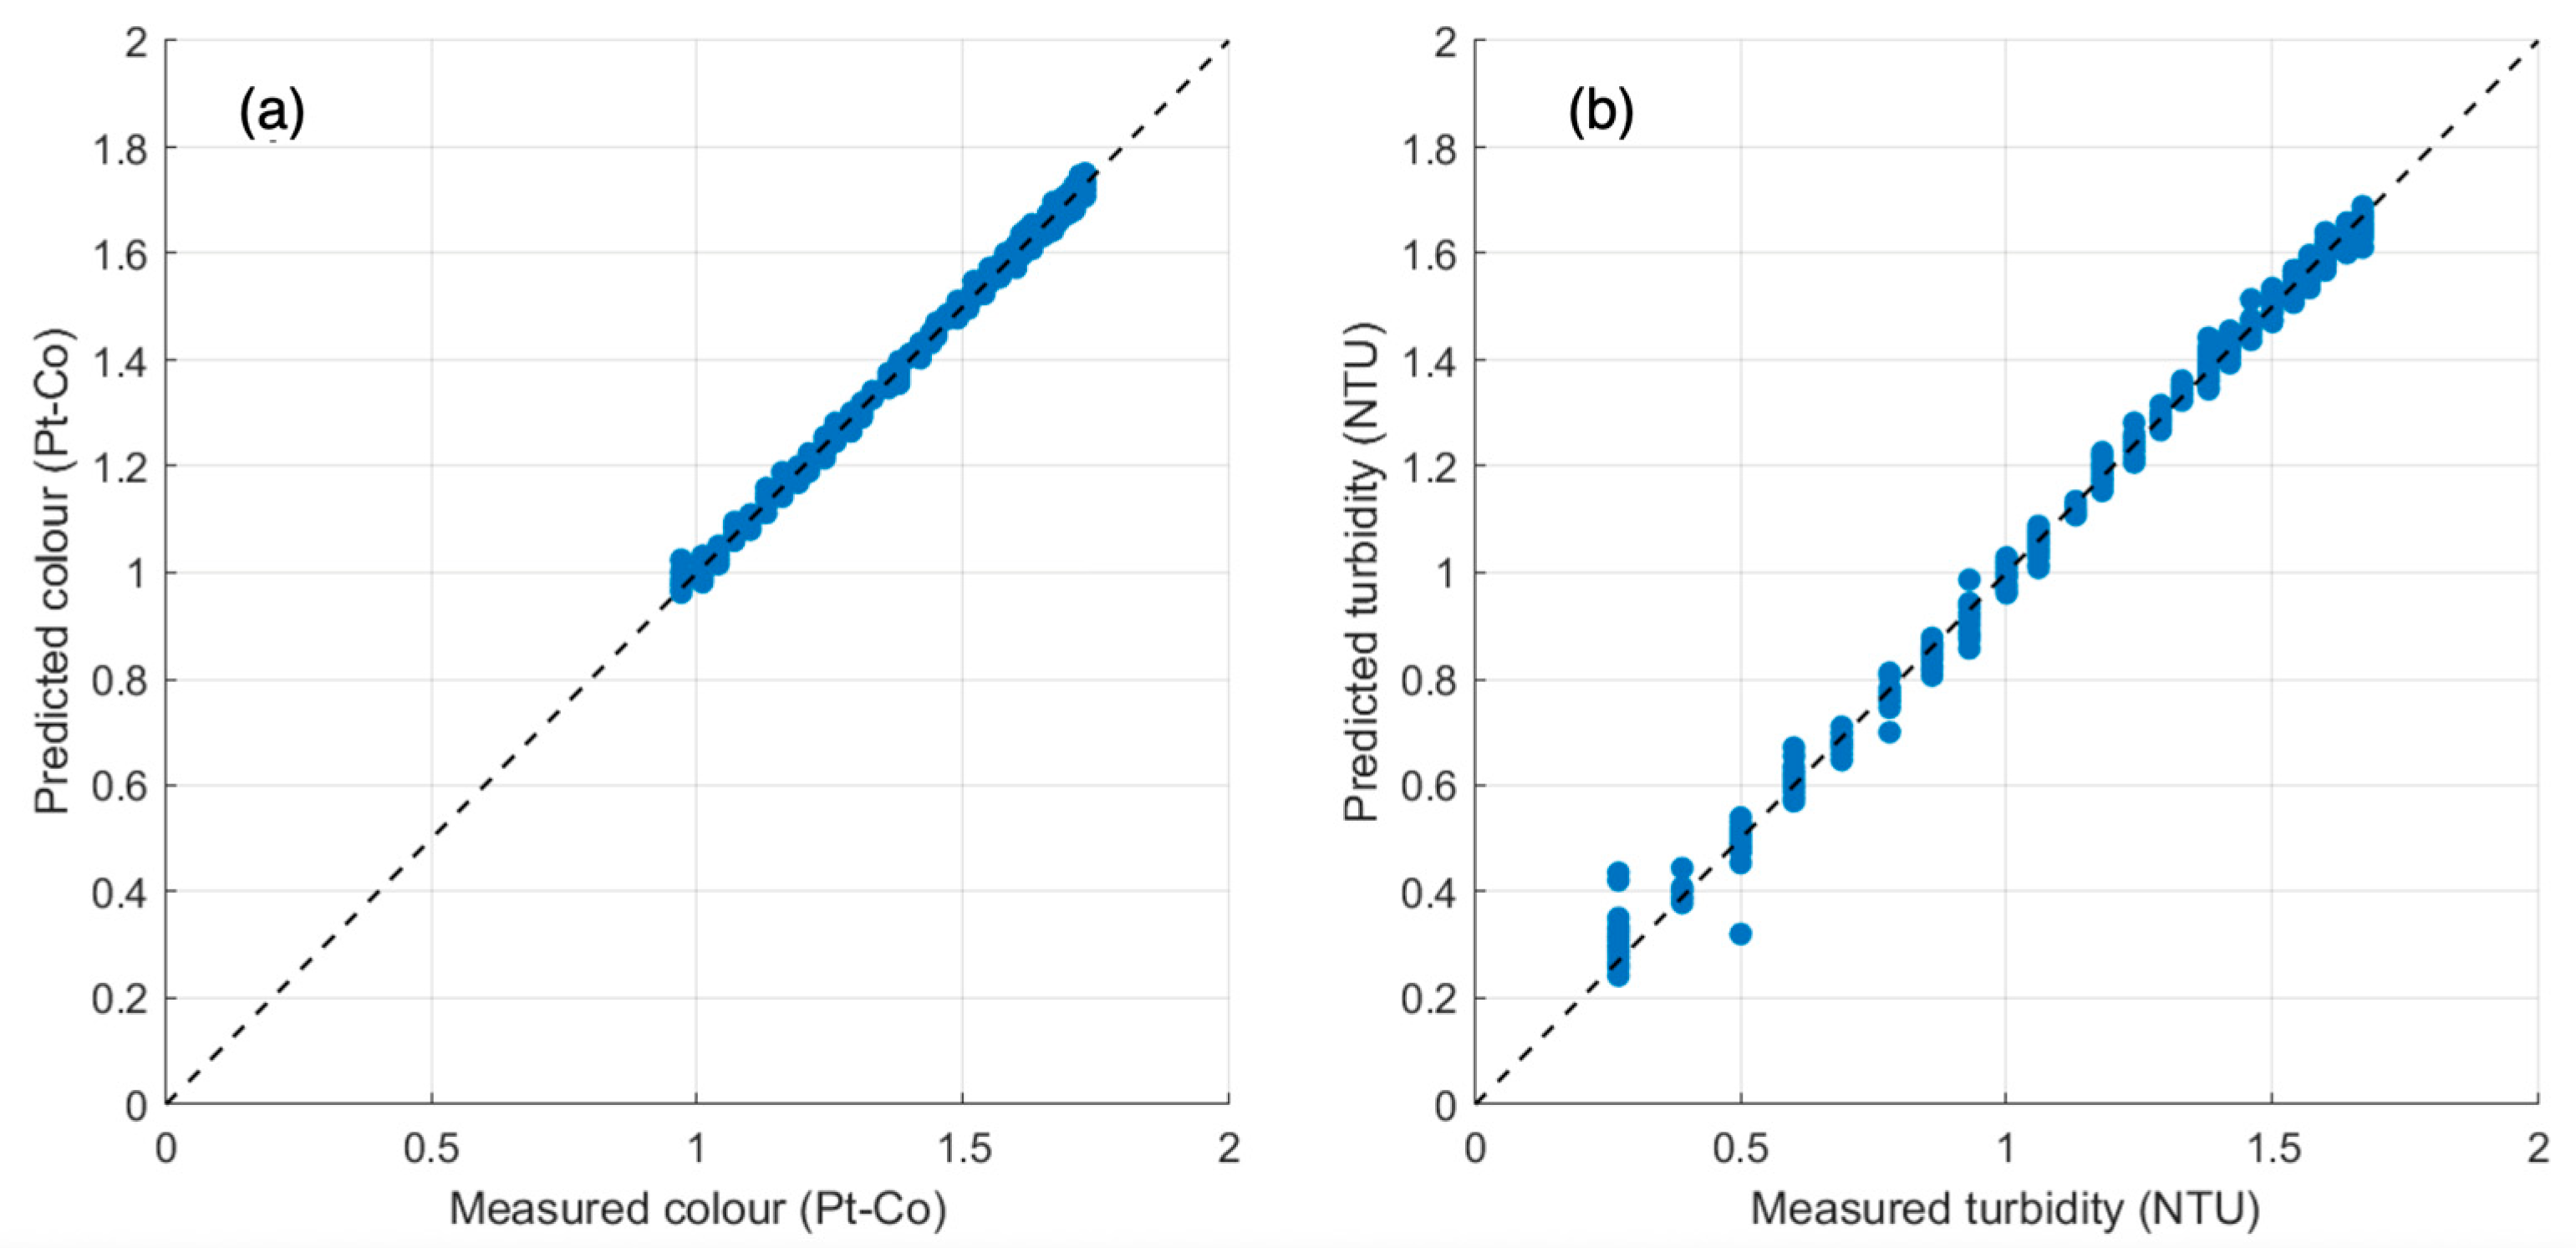
3.2. ANN Predictive Performance

Training of the multilayer perceptron converged in fewer than 25 epochs. In the learning curve (Figure 6), the training (blue) and validation (red) MSE traces collapse to <0.01 and then proceed in lock-step, indicating excellent generalization. Model skill is confirmed by the measured-vs-predicted turbidity scatter (Figure 7a): points fall tightly along the 1:1 line, yielding R2 ≈ 0.96 and RMSE ≈ 0.07 NTU. A similar alignment was observed for color (Figure 7b), with RMSE = 0.05 Pt-Co.
Table 2 summarizes the predictive performance of the neural network across the training, validation, and test sets for each output variable. Metrics are expressed as RMSE/R2. Results show consistently low RMSE values and high R2 across all variables, indicating strong model fit and generalization. For instance, turbidity predictions on the test set yielded an R2 of 0.995 and RMSE of 0.022, while pH predictions reached an R2 of 0.982 with an RMSE of 0.040. These results confirm that the network successfully captured the relationships between process variables and output quality indicators, supporting its application in both historical reconstruction and operational forecasting.
The artificial neural network (ANN) employed in this study exhibited superior performance compared to traditional linear modeling approaches in predicting treated water quality parameters. This enhanced performance is attributed to the ANN’s ability to capture complex, nonlinear relationships inherent in water quality data [3,29,30,31,32]. The model achieved excellent predictive accuracy, with R2 values consistently exceeding 0.98 across all output variables (Table 2), outperforming support vector machines (SVM) and other machine learning methods reported in the literature [29,30]. This capability is especially valuable for modeling multifactorial water quality indicators such as turbidity, color, and pH, where linear models often fail to account for the underlying nonlinear interactions [3,31,32].

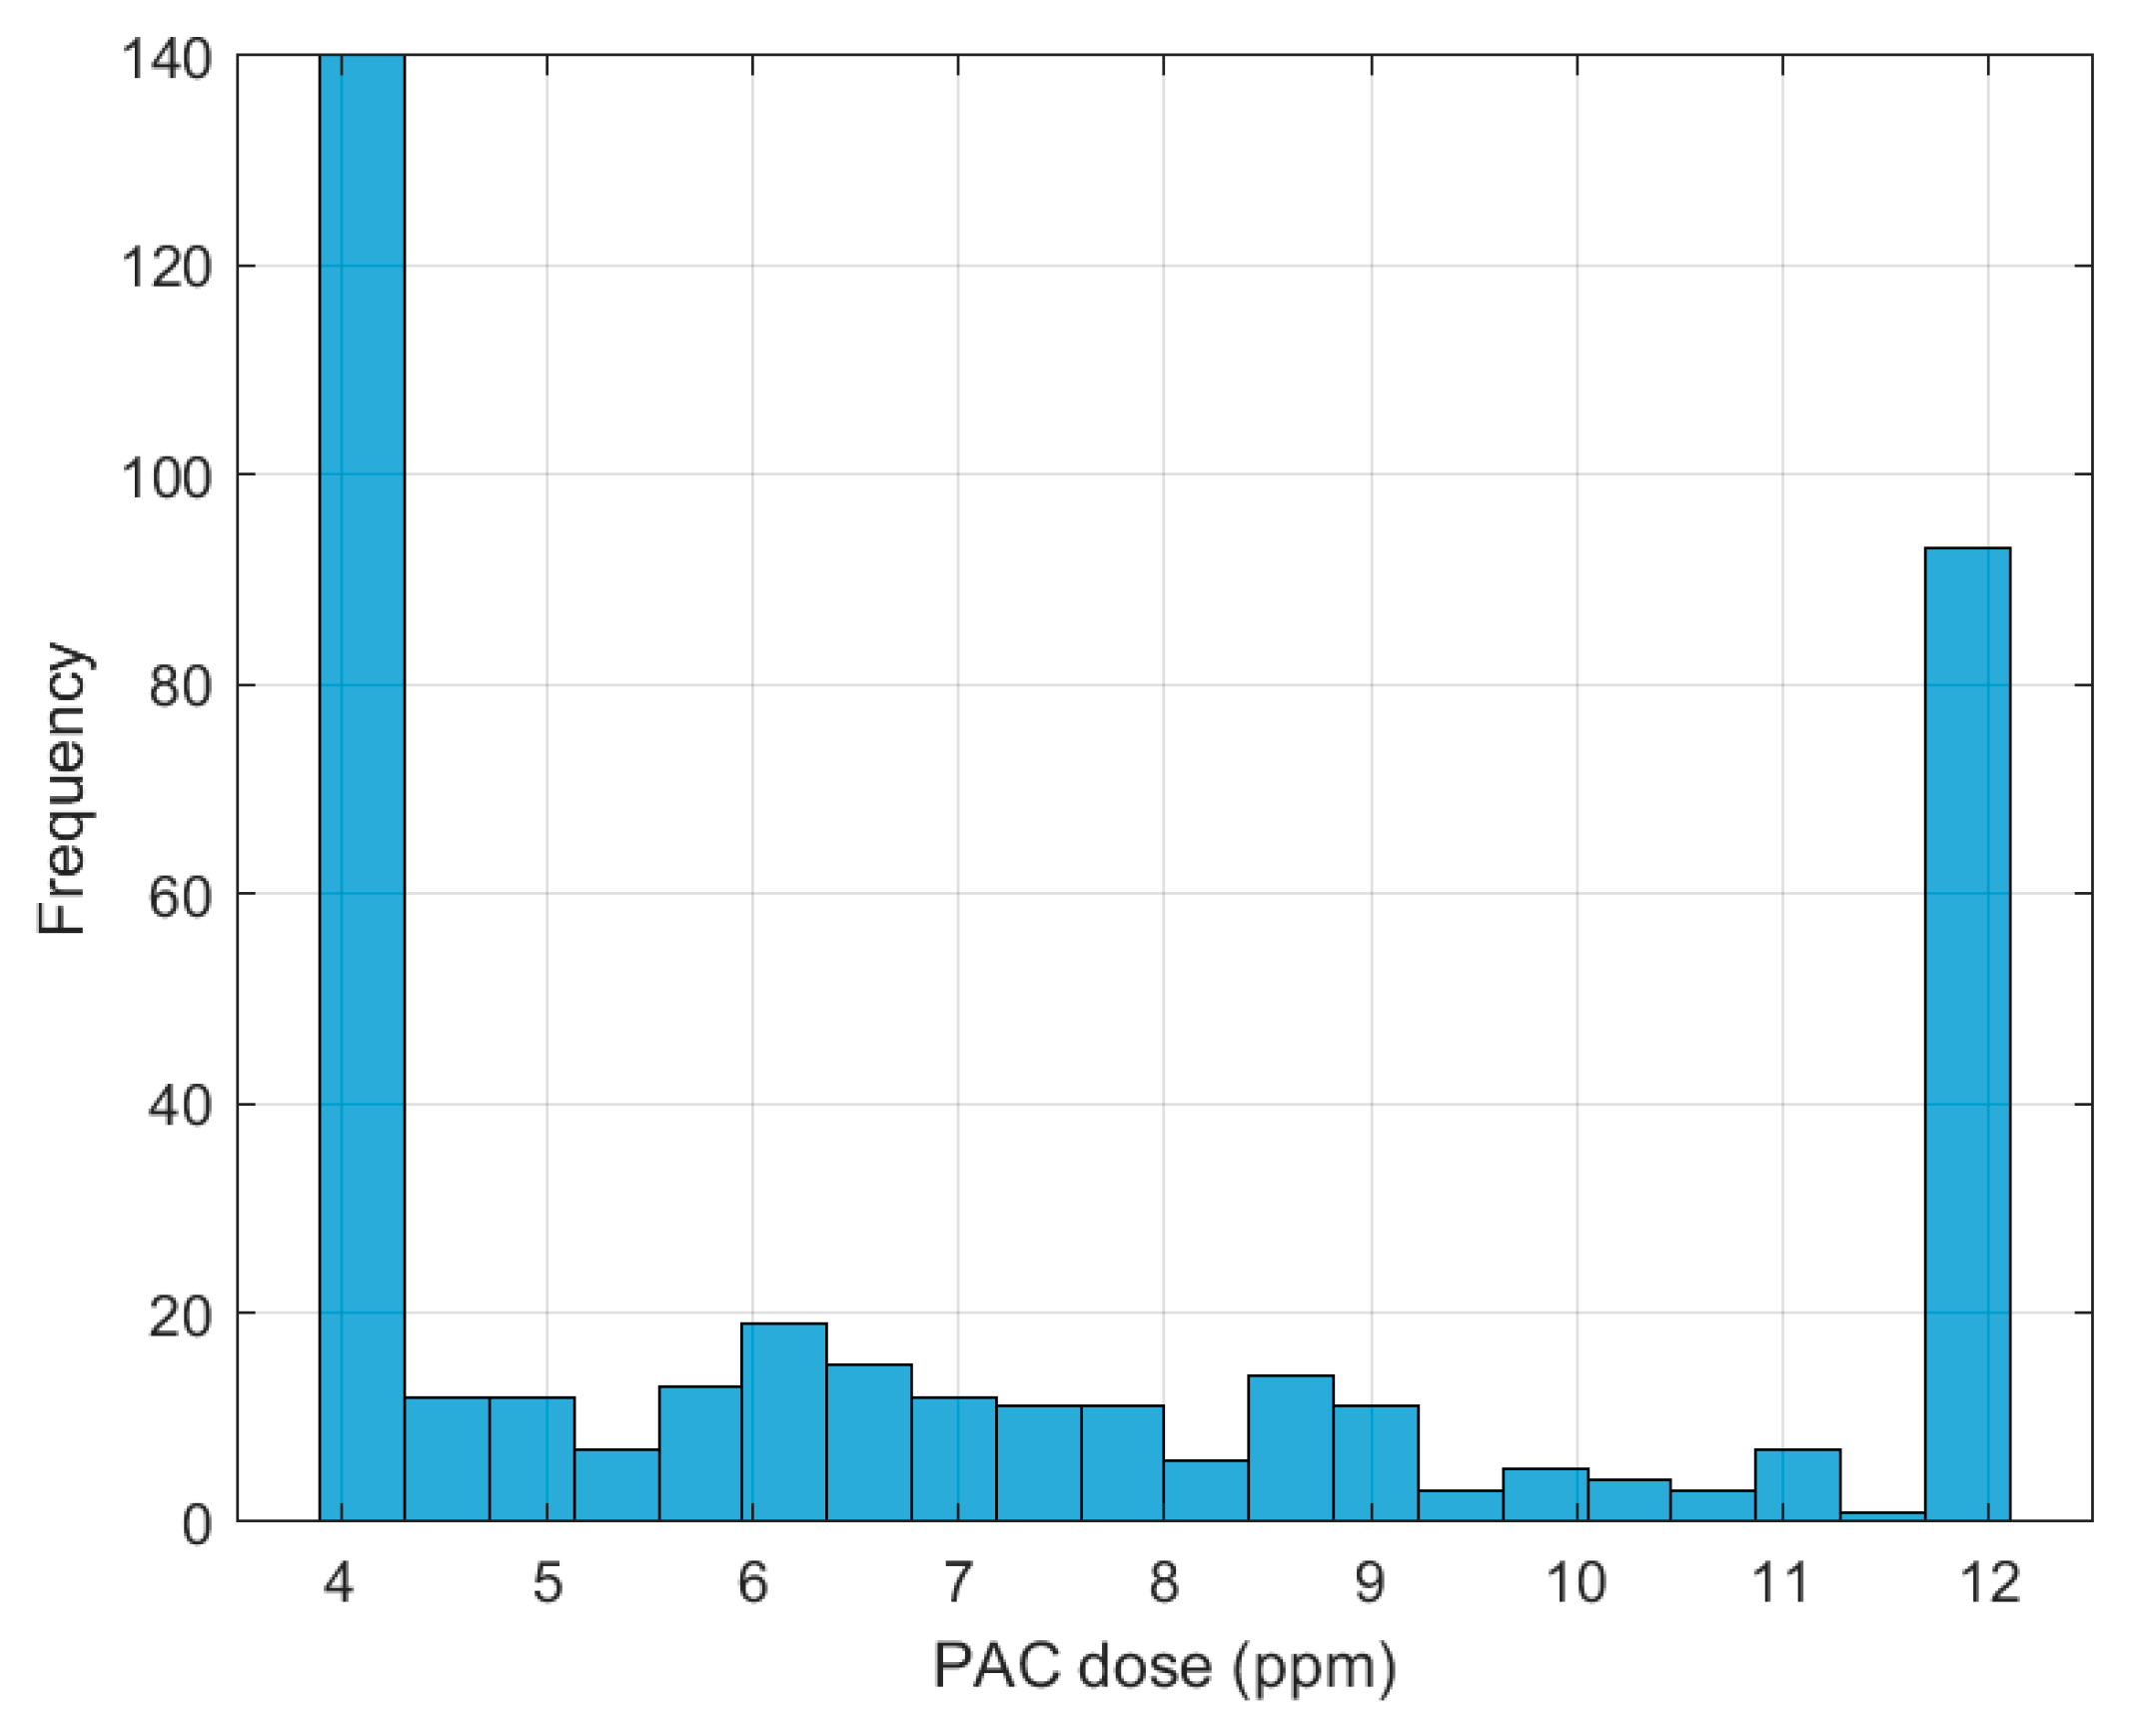
3.3. Optimized PAC Dose Distribution

Figure 8 shows that the genetic algorithm explored the entire allowable range of PAC doses yet settled most frequently on two well-defined operating zones. At the lower end, recommendations cluster around 4 ppm, a level that consistently meets color requirements at the lowest possible cost during routine plant operation. At the opposite end of the spectrum, the optimizer favors a second, narrower cluster near 12 ppm; this higher dose is selected only when raw-water quality degrades and additional coagulant is necessary to safeguard compliance. Between these two zones, the algorithm still evaluates intermediate doses but identifies no meaningful cost-to-quality advantage there, so selections in the 6–10 ppm band are understandably sparse. The resulting bimodal pattern therefore reflects two equally valid, context-dependent control strategies rather than a limitation in the search process.
The optimization of PAC dosing using the GA revealed a bimodal distribution, with doses clustering around 4 ppm and 12 ppm (Figure 8). However, the recent literature does not explicitly report such bimodal patterns in coagulant dosing optimization, focusing instead on predictive accuracy and adaptability to raw-water variability [20,28,33]. Machine learning models, including Random Forest and LSTM, have improved dosing precision but do not describe distinct bimodal regimes [20,33,34]. The bimodal pattern observed here likely reflects context-specific operational strategies at Yanahurco DWTP, driven by fluctuating raw-water conditions, suggesting that clustering techniques could further refine dosing strategies by segmenting data into distinct operational regimes [35].
The bimodal dosing pattern (Figure 8) reflects context-specific water quality dynamics. The 4 ppm cluster corresponds to routine conditions with low turbidity (<5 NTU) and color (<20 Pt-Co), where PAC efficiently neutralizes colloidal charges. Conversely, the 12 ppm cluster is selected during degraded influent quality (e.g., turbidity > 50 NTU, color > 40 Pt-Co), necessitating higher doses for enhanced sweep coagulation, as discussed further in Section 3.7. This bimodality likely arises from PAC’s nonlinear reactivity, such as charge reversal thresholds at higher doses, and operational constraints, including cost optimization by the GA. Future PCA or clustering analyses could identify additional raw water parameters driving these clusters.

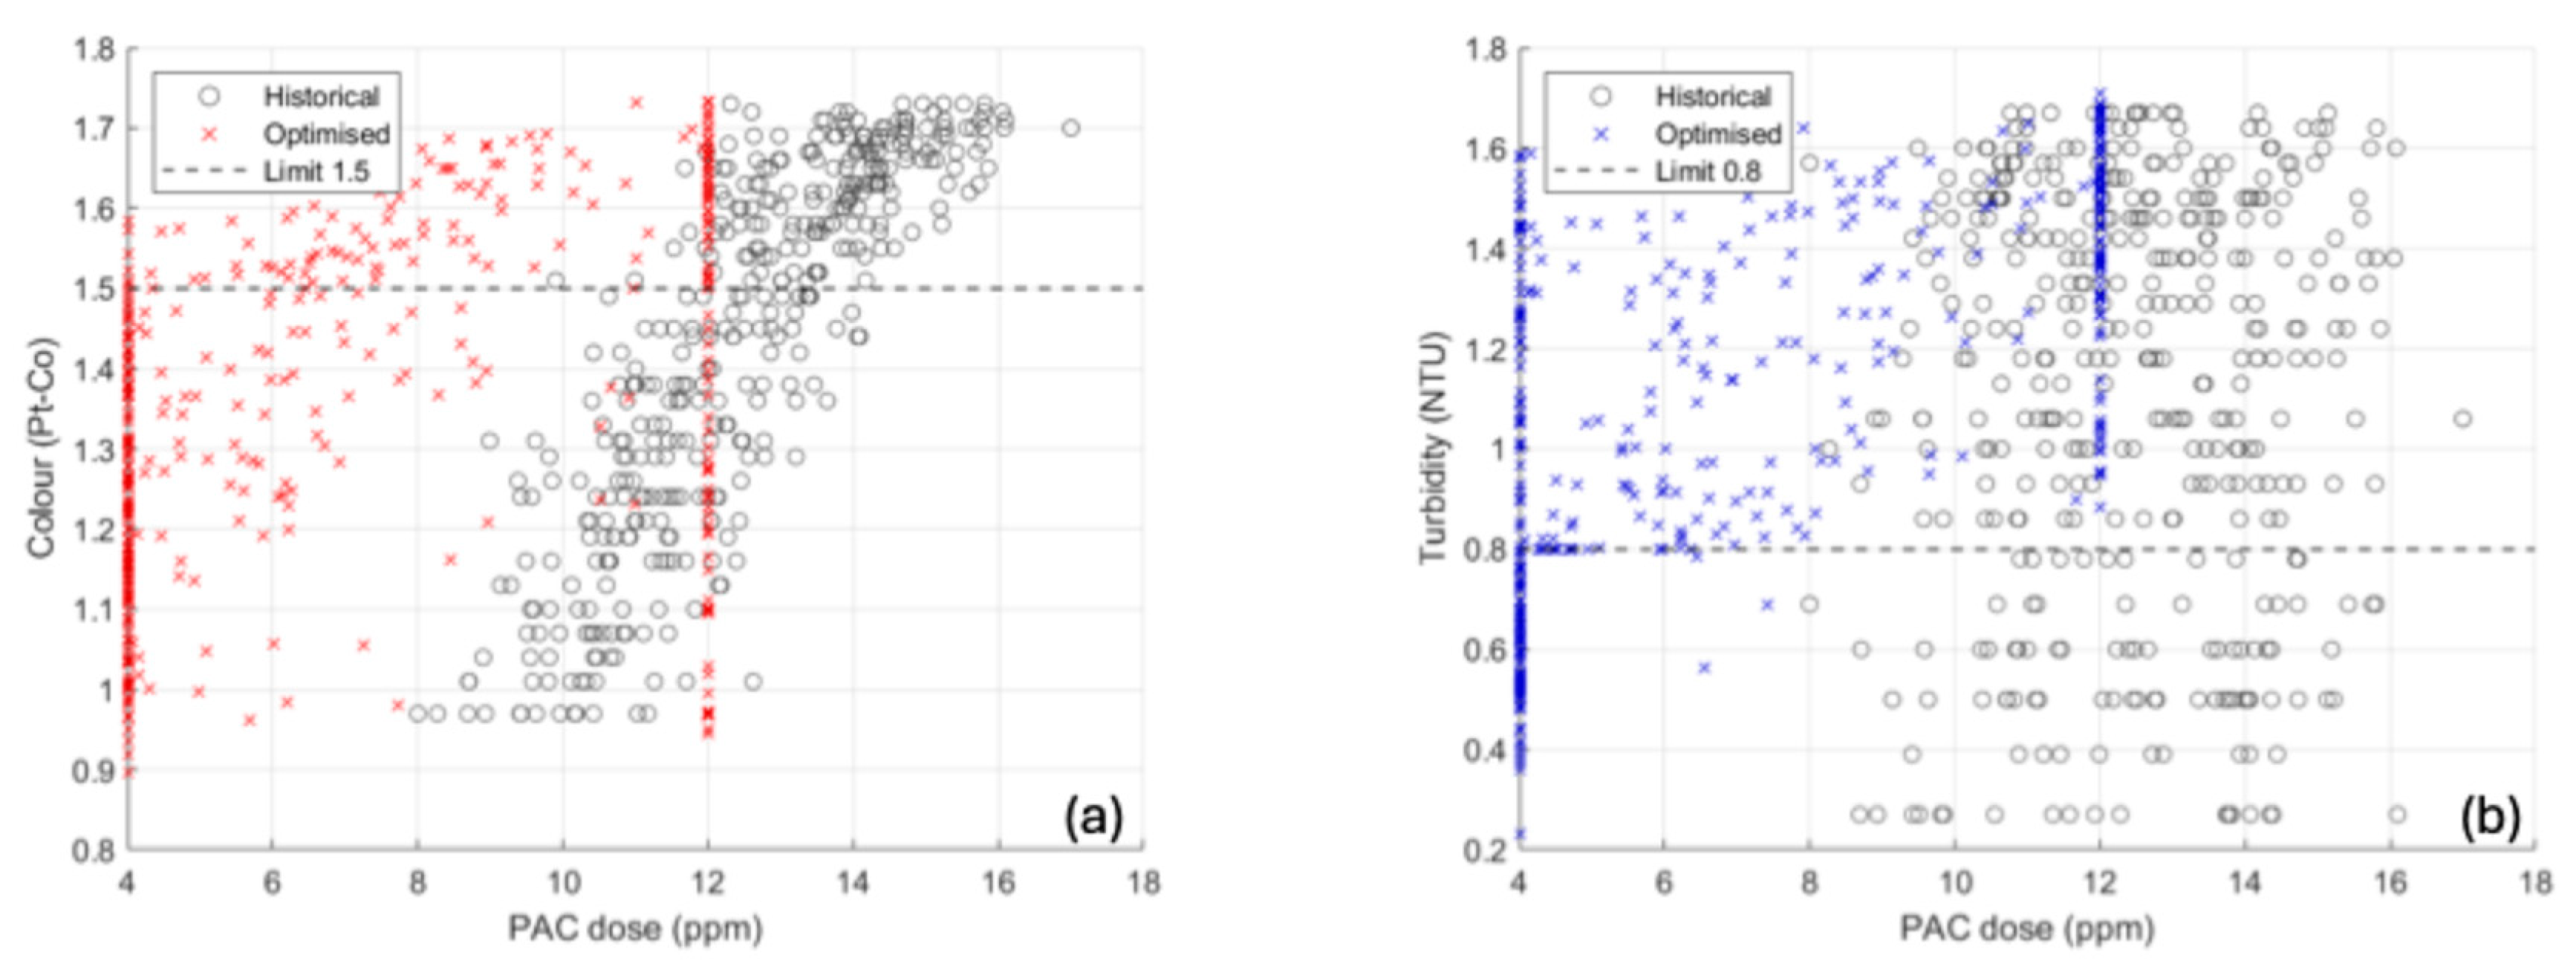
3.4. Dose–Response Relationships

With respect to color (Figure 9a), historical operation (open circles) often drifts above the 1.5 Pt-Co guideline, illustrating an excessive reliance on intermediate PAC dosages that offer limited benefit. In contrast, the genetic algorithm places its recommendations exclusively within two compliance “corridors”: a cost-efficient band around 4 ppm and a color-polishing band near 12 ppm. Both lie at or below the regulatory threshold, demonstrating that the optimizer can maintain color removal while systematically avoiding the mid-range doses that were least effective in past practice.
A different picture emerges for turbidity (Figure 9b). The scatter indicates that clarified turbidity rarely drops below the 0.8 NTU limit regardless of how much PAC is applied. Recognizing this, the optimizer defaults to the economical 4 ppm setting whenever it predicts that the turbidity target will be exceeded, reserving the more expensive 12 ppm option for those occasions when color—rather than turbidity—governs compliance. This adaptive behavior minimizes chemical use without compromising treated-water quality.
While PAC effectively reduces turbidity (up to 90% under optimal conditions), its limitations as a sole coagulant are evident, particularly in removing organic matter and achieving simultaneous color and turbidity compliance. Studies indicate that PAC removes less than 60% of organic compounds (measured as UV254), with performance highly dependent on dose and pH [36,37,38]. In this study, the GA-optimized PAC doses achieved color compliance in 63% of cases but struggled with turbidity below 0.8 NTU (Figure 9b), consistent with findings that PAC alone is less effective for non-clay particles and high organic content waters [39,40].
These limitations are largely attributed to the nature of PAC’s Al13 hydrolysis species, which effectively neutralize charges on inorganic particles, such as clays, through electrostatic interactions, but are less efficient against hydrophobic organic compounds due to their lower affinity for non-polar organic matter. This constrains both turbidity and color removal in organic-rich waters [41,42].
Combining PAC with natural coagulants like Moringa oleifera or modified composites (e.g., PAC-PSi-PDMDAAC) could enhance removal efficiencies, achieving up to 98% turbidity reduction and improved color outcomes [43,44]. Such composite coagulants enhance sweep flocculation by improving floc formation and settling, thereby increasing removal efficiency for both turbidity and color [45,46].

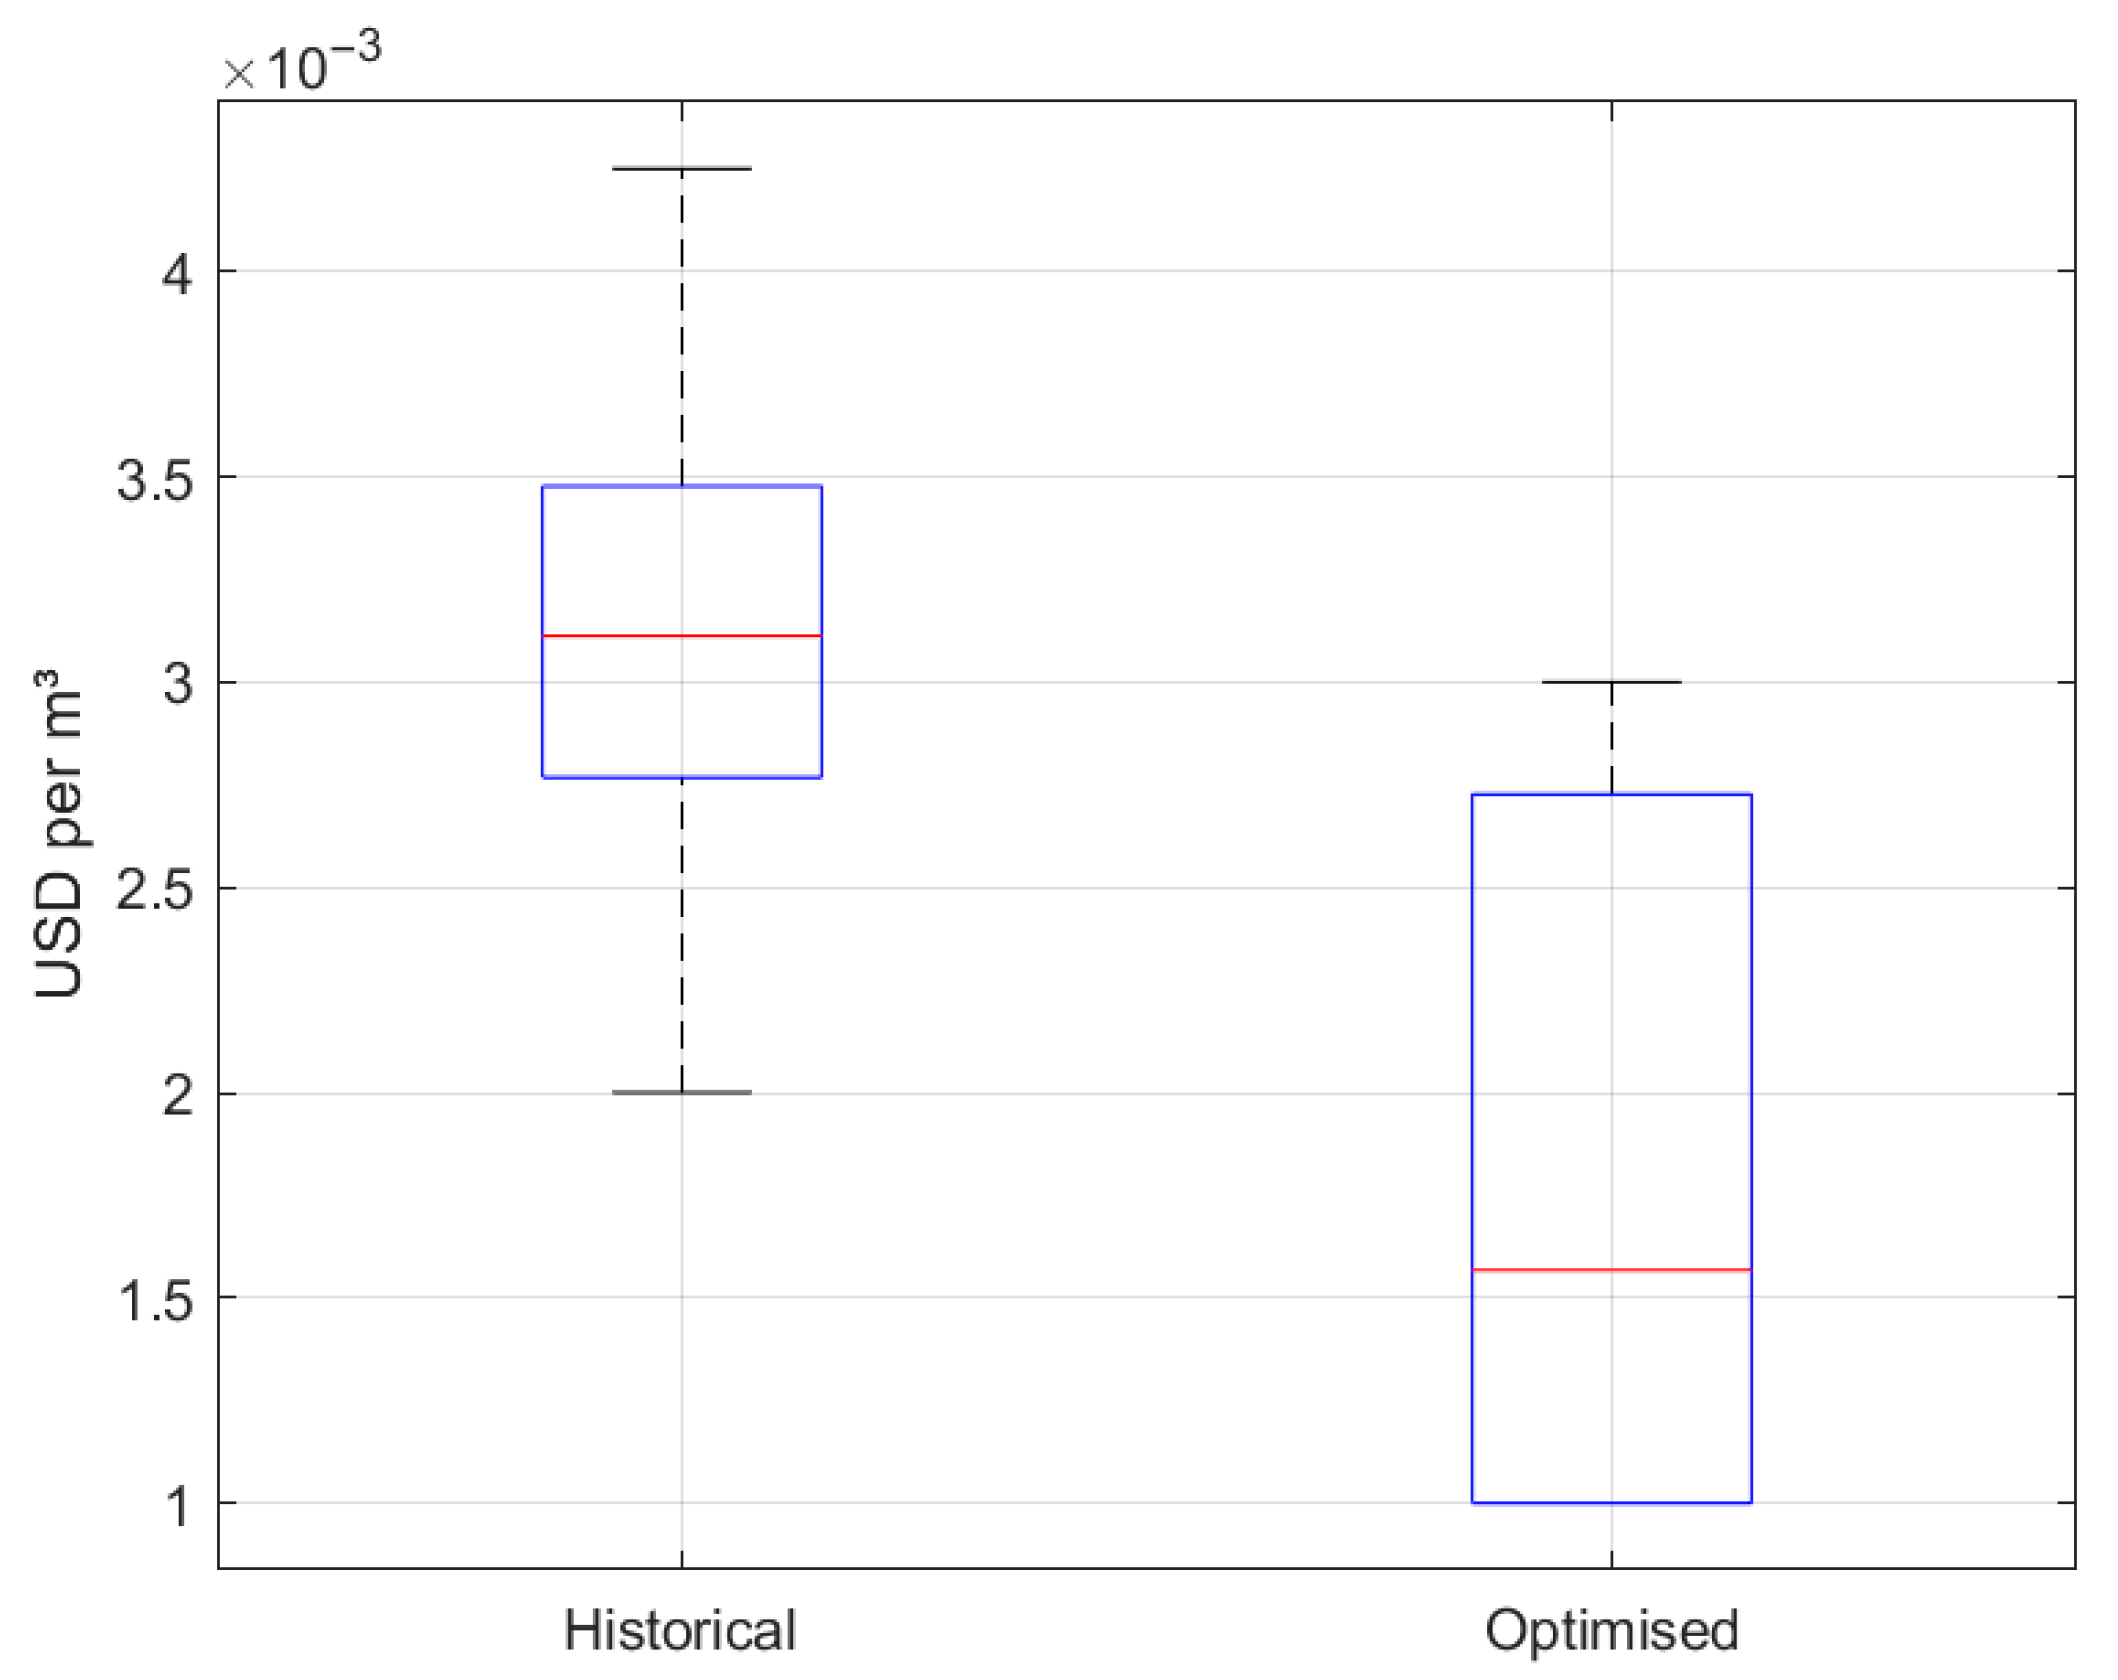
3.5. Economic Impact

The treatment–cost boxplot (Figure 10) documents a 49% reduction in median chemical cost—from 3.1 × 10⁻³ to 1.6 × 10⁻³ USD m−3—together with a narrower inter-quartile range, signifying day-to-day cost stability.
The application of AI, specifically the ANN-GA framework, has significantly reduced operational costs at Yanahurco DWTP, with a 49% decrease in median chemical costs (Figure 10). This aligns with broader trends in AI-driven water treatment, where automation and predictive modeling reduce energy consumption by up to 50% in desalination and 30% in wastewater treatment [47,48]. Real-time monitoring and predictive maintenance further minimize operational errors and downtime, enhancing cost stability [49]. However, challenges such as data quality and model explainability remain critical for broader adoption [48,50], underscoring the need for robust data management to sustain these benefits.

3.6. Regulatory Compliance

Figure 11 summarizes compliance. Optimization lifts color compliance from 52% to 63%, keeps pH > 97%, and trims turbidity compliance slightly (25% → 21%), reflecting the intrinsic difficulty of meeting the 0.8 NTU target with PAC alone.

3.7. Drivers of Dose Variability

The scattered dose–turbidity relationship observed during high turbidity and color conditions (Figure 12a) illustrates the need for elevated PAC doses under degraded influent quality. Scatter of raw-water turbidity versus optimized PAC (Figure 12a) displays no monotonic trend: doses between 4 and 12 ppm are recommended across the 8–13 NTU range, underscoring that coagulation performance is governed by multiple interacting factors.
The color–turbidity map colored by PAC (Figure 12b) pinpoints the few samples that simultaneously satisfy both limits (lower-left quadrant). These cases cluster at 4–6 ppm (cool colors on the scale), suggesting that modest PAC coupled with an auxiliary coagulant or polymer could consolidate flocs and push clarified turbidity under 0.8 NTU.
For waters with high color and low turbidity, PAC alone often fails to meet stringent regulatory limits for both parameters simultaneously, as observed in this study (Figure 9). Literature confirms that while PAC achieves 88–99% turbidity removal, color removal ranges from 50 to 90%, often insufficient for waters with high organic content [9,51,52]. Combining PAC with coagulants like FeCl3 or polymers significantly improves outcomes, achieving up to 95% color removal and 99% turbidity reduction [52,53,54]. These findings suggest that future optimizations at Yanahurco DWTP could incorporate combined coagulant strategies to enhance compliance with Ecuadorian standards for both color and turbidity.

4. Conclusions

This work presents the development and assessment of a hybrid modeling framework that combines artificial neural networks (ANN) with genetic algorithms (GA) for optimizing polyaluminum chloride (PAC) dosing in a full-scale drinking water treatment facility. The ANN, trained on a dataset comprising 400 jar test experiments under real operational conditions, accurately predicted six key post-treatment water quality parameters. The model achieved determination coefficients (R2) above 0.95 for both color and turbidity, confirming its ability to represent complex, nonlinear interactions between raw water characteristics and treatment outcomes.
By incorporating the ANN into a GA-based optimization routine, it was possible to determine PAC dosages that reduced chemical usage while ensuring compliance with regulatory standards. The optimization process consistently identified two distinct dosage strategies: a low-dose regime near 4 ppm for typical water quality conditions and a higher-dose regime around 12 ppm for periods of deteriorated influent quality. This bimodal behavior reflects responsive process management grounded in system performance and compliance thresholds, rather than pre-defined or rigid dosing rules.
The optimization strategy resulted in a 49% decrease in median PAC-related treatment costs and increased compliance with color limits from 52% to 63%, while maintaining pH compliance above 97%. Turbidity, however, proved more difficult to control, indicating that PAC alone may not suffice in all cases. The use of supplementary coagulants or polymers could be necessary to achieve compliance under more demanding conditions.
The ANN–GA framework outlined here offers a reproducible and scalable method to refine chemical dosing in water treatment plants. It enables operators to adapt dosing strategies in response to changing raw water conditions. Future lines of work should evaluate model robustness under seasonal and hydrological variability, extend the range of quality parameters considered—such as microbiological or organic contaminants—and test coagulant blends or process enhancements within the same optimization framework.
A limitation of this study is that the model was developed and validated solely with data from a single DWTP. Future research should assess model transferability by testing it on independent datasets from other plants.
PAC’s reliance on charge neutralization limits its effectiveness for turbidity removal below 0.8 NTU, particularly for organic-rich waters (Figure 9b). Future work should explore complementary strategies, such as natural coagulants (e.g., Moringa oleifera) [43], synthetic polymers, or filtration optimization, to achieve consistent turbidity compliance alongside color and pH standards.

Author Contributions

D.F.G.-L.: conceptualization, methodology, supervision, investigation, writing—original draft preparation. G.P.S.L.: software, validation, formal analysis. L.S.O.C.: investigation, data curation. F.A.A.: formal analysis, writing—original draft preparation, writing—review and editing. All authors have read and agreed to the published version of the manuscript.

Funding

This research received no external funding.

Data Availability Statement

The original contributions presented in this study are included in the article. Further inquiries can be directed to the corresponding author.

Acknowledgments

The authors would like to thank the Yanahurco Water-Treatment Plant (JAAPARY) for providing the data used in this research, as well as the laboratory staff for their technical support.

Conflicts of Interest

The authors declare no conflicts of interest.

References

  1. Assembly, U.G. Resolution Adopted by the General Assembly on 25 September 2015. Transforming Our World: The 2030 Agenda for Sustainable Development. 2015. Available online: http://www.un.org/en/development/desa/population/migration/generalassembly/docs/globalcompact/A_RES_70_1_E.pdf (accessed on 21 June 2025).
  2. Tubon-Usca, G.; Centeno, C.; Pomasqui, S.; Beneduci, A.; Arias, F.A. Enhanced Adsorption of Methylene Blue in Wastewater Using Natural Zeolite Impregnated with Graphene Oxide. Appl. Sci. 2025, 15, 2824. [Google Scholar] [CrossRef]
  3. Zhang, Y.; Gao, X.; Smith, K.; Inial, G.; Liu, S.; Conil, L.B.; Pan, B. Integrating water quality and operation into prediction of water production in drinking water treatment plants by genetic algorithm enhanced artificial neural network. Water Res. 2019, 164, 114888. [Google Scholar] [CrossRef] [PubMed]
  4. Igwegbe, C.A.; Ovuoraye, P.E.; Białowiec, A.; Onukwuli, O.D.; Balogun, P.A. Green flocculation for sustainable remediation of municipal landfill leachate using Parkia biglobosa extract: Optimization, mechanistic insights and implication for design. Clean Technol. Environ. Policy 2024, 26, 3429–3456. [Google Scholar] [CrossRef]
  5. Izquierdo, C.; Pezántes, B.; Ayala, E. Prediction of the Optimal Dosage of Poly Aluminum Chloride for Coagulation in Drinking Water Treatment using Artificial Neural Networks. Rev. Técnica Energía 2023, 20, 93–99. [Google Scholar] [CrossRef]
  6. Shen, Y.-H.; Dempsey, B.A. synthesis and speciation of polyaluminum chloride for water treatment. Environ. Int. 1998, 24, 899–910. [Google Scholar] [CrossRef]
  7. Ebrahimzade, H.; Khayati, G.R.; Schaffie, M. PSO–ANN-based prediction of cobalt leaching rate from waste lithium-ion batteries. J. Mater. Cycles Waste Manag. 2020, 22, 228–239. [Google Scholar] [CrossRef]
  8. Gyparakis, S.; Trichakis, I.; Diamadopoulos, E. Using Artificial Neural Networks to Predict Operational Parameters of a Drinking Water Treatment Plant (DWTP). Water 2024, 16, 2863. [Google Scholar] [CrossRef]
  9. Kassa, A.E.; Shibeshi, N.T.; Tizazu, B.Z. Synthesis of polyaluminum chloride: Optimization of process parameters, characterization and performance investigation for water treatment. J. Water Process. Eng. 2024, 57, 104700. [Google Scholar] [CrossRef]
  10. Yateh, M.; Lartey-Young, G.; Li, F.; Li, M.; Tang, Y. Application of Response Surface Methodology to Optimize Coagulation Treatment Process of Urban Drinking Water Using Polyaluminium Chloride. Water 2023, 15, 853. [Google Scholar] [CrossRef]
  11. Gyparakis, S.; Trichakis, I.; Daras, T.; Diamadopoulos, E. Artificial Neural Networks (ANNs) and Multiple Linear Regression (MLR) Analysis Modelling for Predicting Chemical Dosages of a Water Treatment Plant (WTP) of Drinking Water. Water 2025, 17, 227. [Google Scholar] [CrossRef]
  12. Wu, G.-D.; Lo, S.-L. Predicting real-time coagulant dosage in water treatment by artificial neural networks and adaptive network-based fuzzy inference system. Eng. Appl. Artif. Intell. 2008, 21, 1189–1195. [Google Scholar] [CrossRef]
  13. Guamán-Lozada, D.; Heredia, M.J.T.; Zambrano-Vinueza, M.; Ortiz, R.A.P.; Moscoso-Martínez, M.; Pinto, P.M.M. Predictive Modeling and Optimization of Plywood Drying: An Artificial Neural Network Approach. Recent Innov. Chem. Eng. (Former. Recent Pat. Chem. Eng.) 2024, 17, 208–220. [Google Scholar] [CrossRef]
  14. Vinitha, E.V.; Ahammed, M.M.; Gadekar, M.R. Chemical coagulation of greywater: Modelling using artificial neural networks. Water Sci. Technol. 2018, 2017, 869–877. [Google Scholar] [CrossRef] [PubMed]
  15. Narges, S.; Ghorban, A.; Hassan, K.; Mohammad, K. Prediction of the optimal dosage of coagulants in water treatment plants through developing models based on artificial neural network fuzzy inference system (ANFIS). J. Environ. Health Sci. Eng. 2021, 19, 1543–1553. [Google Scholar] [CrossRef] [PubMed]
  16. Wu, G.D.; Lo, S.L. Effects of data normalization and inherent-factor on decision of optimal coagulant dosage in water treatment by artificial neural network. Expert Syst. Appl. 2010, 37, 4974–4983. [Google Scholar] [CrossRef]
  17. Tariq, R.; Abatal, M.; Vargas, J.; Vázquez-Sánchez, A.Y. Deep learning artificial neural network framework to optimize the adsorption capacity of 3-nitrophenol using carbonaceous material obtained from biomass waste. Sci. Rep. 2024, 14, 20250. [Google Scholar] [CrossRef] [PubMed]
  18. Sutherland, C.; Chittoo, B.S.; Venkobachar, C. Application of an artificial neural network–genetic algorithm methodology for modelling and optimization of the improved biosorption of a chemically modified peat moss: Kinetic studies. Desalination Water Treat. 2017, 84, 69–84. [Google Scholar] [CrossRef]
  19. Shirkoohi, M.G.; Tyagi, R.D.; Vanrolleghem, P.A.; Drogui, P. Artificial neural networks and genetic algorithms: An efficient modelling and optimization methodology for active chlorine production using the electrolysis process. Can. J. Chem. Eng. 2021, 99, S389–S403. [Google Scholar] [CrossRef]
  20. Achite, M.; Samadianfard, S.; Elshaboury, N.; Sharafi, M. Modeling and optimization of coagulant dosage in water treatment plants using hybridized random forest model with genetic algorithm optimization. Environ. Dev. Sustain. 2023, 25, 11189–11207. [Google Scholar] [CrossRef]
  21. Yel, E.; Onen, V.; Tezel, G.; Yilmazturk, D. Performance prediction modeling of andesite processing wastewater physicochemical treatment via artificial neural network. Arab. J. Geosci. 2020, 13, 985. [Google Scholar] [CrossRef]
  22. Dharshini, S.D.; Anurag; Kumar, A.; Satpal; Kumar, M.; Priyanka, P.; Pugazenthi, K. Evaluation of machine-learning algorithms in estimation of relative water content of sorghum under different irrigated environments. J. Arid Environ. 2025, 229, 105390. [Google Scholar] [CrossRef]
  23. Ji, X.; Li, Z.; Wang, M.; Yuan, Z.; Jin, L. Response Surface Methodology Approach to Optimize Parameters for Coagulation Process Using Polyaluminum Chloride (PAC). Water 2024, 16, 1470. [Google Scholar] [CrossRef]
  24. Li, L.; Rong, S.; Wang, R.; Yu, S. Recent advances in artificial intelligence and machine learning for nonlinear relationship analysis and process control in drinking water treatment: A review. Chem. Eng. J. 2021, 405, 126673. [Google Scholar] [CrossRef]
  25. Wang, D.; Chang, X.; Ma, K. Predicting flocculant dosage in the drinking water treatment process using Elman neural network. Environ. Sci. Pollut. Res. 2022, 29, 7014–7024. [Google Scholar] [CrossRef] [PubMed]
  26. Instituto Ecuatoriano de Normalización (INEN). Drinking Water. Requirements, NTE INEN 1108:2014, 5th rev., Quito, Ecuador. 2014. Available online: https://www.insistec.ec/images/insistec/02-cliente/07-descargas/NTE%20INEN%201108%20-%20AGUA%20POTABLE.%20REQUISITOS.pdf (accessed on 23 June 2025).
  27. Maier, H.R.; Dandy, G.C. Neural networks for the prediction and forecasting of water resources variables: A review of modelling issues and applications. Environ. Model. Softw. 2000, 15, 101–124. [Google Scholar] [CrossRef]
  28. Huang, C.Y.; Chen, Y.Y.; Chuang, S.H.; Hsu, Y.S.; Wu, R.S.; Ko, K.Y. A precise dosing system based on a coagulation reaction model for water treatment. J. Water Process Eng. 2025, 70, 106962. [Google Scholar] [CrossRef]
  29. Chatterjee, S.; Sarkar, S.; Dey, N.; Sen, S.; Goto, T.; Debnath, N.C. Water quality prediction: Multi objective genetic algorithm coupled artificial neural network based approach. In Proceedings of the 2017 IEEE 15th International Conference on Industrial Informatics, INDIN 2017, Emden, Germany, 24–26 July 2017; pp. 963–968. [Google Scholar] [CrossRef]
  30. Mohadesi, M.; Aghel, B. Use of ANFIS/Genetic Algorithm and Neural Network to Predict Inorganic Indicators of Water Quality. J. Chem. Pet. Eng. 2020, 54, 155–164. [Google Scholar] [CrossRef]
  31. Ding, Y.R.; Cai, Y.J.; Sun, P.D.; Chen, B. The Use of Combined Neural Networks and Genetic Algorithms for Prediction of River Water Quality. J. Appl. Res. Technol. 2014, 12, 493–499. [Google Scholar] [CrossRef]
  32. Gholami, V.; Sahour, H.; Khaleghi, M.R.; Ghajari, Y.E.; Sahour, S. Combining artificial neural networks and genetic algorithms to model nitrate contamination in groundwater. Nat. Hazards 2024, 120, 4789–4809. [Google Scholar] [CrossRef]
  33. Achite, M.; Farzin, S.; Elshaboury, N.; Anaraki, M.V.; Amamra, M.; Toubal, A.K. Modeling the optimal dosage of coagulants in water treatment plants using various machine learning models. Environ. Dev. Sustain. 2024, 26, 3395–3421. [Google Scholar] [CrossRef]
  34. Sharafi, M.; Rezaverdinejad, V.; Behmanesh, J.; Samadianfard, S. Development of long short-term memory along with differential optimization and neural networks for coagulant dosage prediction in water treatment plant. J. Water Process Eng. 2024, 65, 105784. [Google Scholar] [CrossRef]
  35. Kim, C.M.; Parnichkun, M. Prediction of settled water turbidity and optimal coagulant dosage in drinking water treatment plant using a hybrid model of k-means clustering and adaptive neuro-fuzzy inference system. Appl. Water Sci. 2017, 7, 3885–3902. [Google Scholar] [CrossRef]
  36. Wang, W.-F.; Ruan, R. Study of PFS and PAC coagulation effect on Pi River Water. E3S Web Conf. 2021, 272, 01012. [Google Scholar] [CrossRef]
  37. Jia, R.-S.; Weng, C.H. Experimental Research on Removal of Turbidity and UV254 by Poly-aluminum Chloride (PAC). E3S Web Conf. 2018, 53, 04006. [Google Scholar] [CrossRef]
  38. Campinas, M.; Viegas, R.M.C.; Coelho, R.; Lucas, H.; Rosa, M.J. Adsorption/Coagulation/Ceramic Microfiltration for Treating Challenging Waters for Drinking Water Production. Membranes 2021, 11, 91. [Google Scholar] [CrossRef] [PubMed]
  39. Nakazawa, Y.; Abe, T.; Matsui, Y.; Shinno, K.; Kobayashi, S.; Shirasaki, N.; Matsushita, T. Differences in removal rates of virgin/decayed microplastics, viruses, activated carbon, and kaolin/montmorillonite clay particles by coagulation, flocculation, sedimentation, and rapid sand filtration during water treatment. Water Res. 2021, 203, 117550. [Google Scholar] [CrossRef] [PubMed]
  40. Kirchen, F.; Fundneider, T.; Gimmel, L.; Thomann, M.; Pulfer, M.; Lackner, S. Scattered and transmitted light as surrogates for activated carbon residual in advanced wastewater treatment processes: Investigating the influence of particle size. Water Res. X 2024, 23, 100222. [Google Scholar] [CrossRef] [PubMed]
  41. Sun, H.; Zhou, Y.; Du, M.; Du, Z. Enhanced Removal of Refractory Organic Compounds from Coking Wastewater Using Polyaluminum Chloride with Coagulant Aids. Water 2024, 16, 2662. [Google Scholar] [CrossRef]
  42. Yan, M.; Wang, D.; Ni, J.; Qu, J.; Yan, Y.; Chow, C.W. Effect of polyaluminum chloride on enhanced softening for the typical organic-polluted high hardness North-China surface waters. Sep. Purif. Technol. 2008, 62, 401–406. [Google Scholar] [CrossRef]
  43. Balbinoti, J.R.; Jorge, R.M.M.; Junior, R.E.d.S.; Balbinoti, T.C.V.; Coral, L.A.d.A.; Bassetti, F.d.J. Treatment of low-turbidity water by coagulation combining Moringa oleifera Lam and polyaluminium chloride (PAC). J. Environ. Chem. Eng. 2024, 12, 111624. [Google Scholar] [CrossRef]
  44. Wu, L.; Deng, J.; Liu, H.; Yu, H.; Zhang, H.; Tong, Y.; Sun, L.; Meng, F.; Zhao, L. Understanding synergistic mechanisms of silicate decorated polyaluminium chloride and organic polymer flocculation for enhancing polymer-flooding wastewater treatment. Process Saf. Environ. Prot. 2023, 170, 1–10. [Google Scholar] [CrossRef]
  45. Olukowi, O.M.; Xie, Y.; Zhou, Z.; Adebayo, I.O.; Zhang, Y. Performance improvement and mechanism of composite PAC/PDMDAAC coagulant via enhanced coagulation coupled with rapid sand filtration in the treatment of micro-polluted surface water. J. Environ. Chem. Eng. 2022, 10, 108450. [Google Scholar] [CrossRef]
  46. Al-Jadabi, N.; Laaouan, M.; El Hajjaji, S.; Mabrouki, J.; Benbouzid, M.; Dhiba, D. The Dual Performance of Moringa Oleifera Seeds as Eco-Friendly Natural Coagulant and as an Antimicrobial for Wastewater Treatment: A Review. Sustainability 2023, 15, 4280. [Google Scholar] [CrossRef]
  47. Alenezi, A.; Alabaiadly, Y. Artificial Intelligence Applications in Water Treatment and Desalination: A Comprehensive Review. Water 2025, 17, 1169. [Google Scholar] [CrossRef]
  48. Dalibard, A.; Kriem, L.S.; Beckett, M.; Scherle, S.; Yeh, Y.-C.; Schließmann, U. Challenges and requirements of AI-based waste water treatment systems. At-Automatisierungstechnik 2025, 73, 40–49. [Google Scholar] [CrossRef]
  49. Ojadi, J.O.; Owulade, O.A.; Researcher, N.I.; Odionu, C.S.; Researcher, U.I.; Onukwulu, E.C.; Researcher, L.I. AI-Driven Optimization of Water Usage and Waste Management in Smart Cities for Environmental Sustainability. Eng. Technol. J. 2025, 10, 4284–4306. [Google Scholar] [CrossRef]
  50. Lowe, M.; Qin, R.; Mao, X. A Review on Machine Learning, Artificial Intelligence, and Smart Technology in Water Treatment and Monitoring. Water 2022, 14, 1384. [Google Scholar] [CrossRef]
  51. Ghafari, S.; Aziz, H.A.; Isa, M.H.; Zinatizadeh, A.A. Application of response surface methodology (RSM) to optimize coagulation–flocculation treatment of leachate using poly-aluminum chloride (PAC) and alum. J. Hazard. Mater. 2009, 163, 650–656. [Google Scholar] [CrossRef] [PubMed]
  52. Mahmudabadi, T.Z.; Ebrahimi, A.A.; Eslami, H.; Mokhtari, M.; Salmani, M.H.; Ghaneian, M.T.; Mohamadzadeh, M.; Pakdaman, M. Optimization and economic evaluation of modified coagulation–flocculation process for enhanced treatment of ceramic-tile industry wastewater. AMB Express 2018, 8, 172. [Google Scholar] [CrossRef] [PubMed]
  53. Yanza-López, J.; Rivera-Hernández, R.; Gómez-Torres, L.; Zafra-Mejía, C. Evaluación de FeCl3 y PAC para la potabilización de agua con alto contenido de color y baja turbiedad. TecnoLógicas 2019, 22, 9–21. [Google Scholar] [CrossRef]
  54. Fernández, J.; Montenegro, S.; Ledezma, C.; Yanza, J. Sedimentabilidad de partículas floculentas en aguas con alto contenido de color y baja turbiedad, coaguladas con FeCl3 + PAC versus PAC. TecnoLógicas 2021, 24, e1789. [Google Scholar] [CrossRef]
Figure 1. Geographic location of the JAAPARY water treatment plant, situated in Yanahurco, Mocha, Tungurahua, Ecuador.
Computation 13 00179 g001
Figure 2. Unit-process flow diagram of the PTAP-Yanahurco.
Computation 13 00179 g002
Figure 3. ANN architecture (MLP).
Computation 13 00179 g003
Figure 4. Schematic of the GA–ANN optimization framework.
Computation 13 00179 g004
Figure 5. Correlation heat-map between the six process inputs (rows) and the six quality outputs (columns).
Computation 13 00179 g005
Figure 6. ANN learning curve (MSE versus epoch).
Computation 13 00179 g006
Figure 7. Comparison between measured and predicted values of clarified water: (a) turbidity and (b) color.
Computation 13 00179 g007
Figure 8. Frequency distribution of GA-optimized PAC dose.
Computation 13 00179 g008
Figure 9. (a) PAC dose versus effluent color; the dashed line denotes the 1.5 Pt-Co limit. (b) PAC dose versus clarified turbidity; the dashed line denotes the 0.8 NTU limit.
Computation 13 00179 g009
Figure 10. Distribution of unit treatment cost before and after optimization.
Computation 13 00179 g010
Figure 11. Compliance with Ecuadorian limits for color, turbidity and pH: measured data, historical predictions, and GA-optimized predictions.
Computation 13 00179 g011
Figure 12. Effects of GA-optimized PAC dosage: (a) raw-water turbidity (NTU) versus optimized dose (ppm); (b) joint plot of clarified-water turbidity (NTU) and color (Pt-Co), with point colors representing PAC dosage levels (blue–green: 4–6 ppm).
Computation 13 00179 g012
Table 1. Descriptive statistical summary of jar test results and comparison with INEN 1108:2014 drinking water quality standards.
ParametersUnitMediaMinimumMaximumStandard DeviationPermissible Limits INEN 1108 2014
ColorPt-Co39.9206012.215
TurbidityNTU13.42256.95
Conductivityμm/S130.34022055<1000
Solidsmg/L9.80206.3<500
Temperature°C10.38131.75–15
pH-6.6670.46.5–8.5
Dosage PACmg/L12.28173.2--
Table 2. Performance metrics by output variable (RMSE/R2).
DatasetColorTurbidityConductivitySolidsTemperaturepH
Train0.015/0.9980.014/0.9980.014/0.9980.015/0.9980.014/0.9980.025/0.994
Validation0.019/0.9950.032/0.9880.020/0.9950.019/0.9960.017/0.9980.039/0.988
Test0.017/0.9970.022/0.9950.020/0.9960.019/0.9960.022/0.9960.040/0.982
Disclaimer/Publisher’s Note: The statements, opinions and data contained in all publications are solely those of the individual author(s) and contributor(s) and not of MDPI and/or the editor(s). MDPI and/or the editor(s) disclaim responsibility for any injury to people or property resulting from any ideas, methods, instructions or products referred to in the content.

