Abstract
This article proposes an optimization methodology to address the joint placement as well as the capacity design of PV units and D-STATCOMs within unbalanced three-phase distribution systems. The proposed model adopts a mixed-integer nonlinear programming structure using complex-valued variables, with the objective of minimizing the total annual cost—including investment, maintenance, and energy purchases. A leader–followeroptimization framework is adopted, where the leader stage utilizes the Generalized Normal Distribution Optimization (GNDO) algorithm to generate candidate solutions, while the follower stage conducts power flow calculations through successive approximation to assess the objective value. The proposed approach is tested on 25- and 37-node feeders and benchmarked against three widely used metaheuristic algorithms: the Chu and Beasley Genetic Algorithm, Particle Swarm Optimization, and Vortex Search Algorithm. The results indicate that the proposed strategy consistently achieves highly cost-efficient outcomes. For the 25-node system, the cost is reduced from USD 2,715,619.98 to USD 2,221,831.66 (18.18%), and for the 37-node system, from USD 2,927,715.61 to USD 2,385,465.29 (18.52%). GNDO also surpassed the alternative algorithms in terms of solution precision, robustness, and statistical dispersion across 100 runs. All numerical simulations were executed using MATLAB R2024a. These findings confirm the scalability and reliability of the proposed method, positioning it as an effective tool for planning distributed energy integration in practical unbalanced networks.
1. Introduction
1.1. Background and Motivation
At present, power distribution infrastructures are undergoing a profound transformation driven by the rapid growth in demand, the integration of new technologies, and the progressive decentralization of energy generation [1,2]. These dynamics have made distribution networks increasingly complex and less predictable, posing significant challenges for both their operation and planning [3]. Additionally, the inherently unbalanced nature of three-phase distribution networks—caused by the geometric configuration of network segments and the nature of connected loads—introduces further complexity. This imbalance leads to multiple adverse effects, including increased energy losses, line overloading, degradation of service quality, and higher operational costs [4,5,6]. Consequently, inadequate planning can seriously compromise the long-term performance and dependability of the power network.
In response to this context, various strategies have been explored to enhance the technical and economic performance of distribution networks. These include network reconfiguration [7], the installation of capacitor banks [8], optimal substation placement [9], conductor sizing [10], and the incorporation of energy storage technologies [11]. However, one of the most effective strategies is the coordinated deployment of distributed energy resources (DERs), including photovoltaic (PV) units and D-STATCOM devices, due to their capability to minimize technical losses, enhance voltage regulation, and increase the operational adaptability of the network [12,13,14]. Nevertheless, their effectiveness relies heavily on proper location and sizing, which gives rise to a highly nonlinear planning problem involving both discrete and continuous variables, as well as stringent technical constraints. Therefore, it becomes essential to develop mathematically robust solution strategies capable of efficiently handling this complexity and delivering feasible, repeatable, and high-quality results suitable for real or near-real operational conditions.
1.2. Literature Review and Current Advances
Several methodologies have been introduced in the academic literature to address the coordinated placement of PV generators and D-STATCOM units in power distribution systems. In [15], the authors propose the joint deployment of PV sources and D-STATCOM compensators using an enhanced artificial colony optimization technique aimed at minimizing power losses, refining voltage regulation, and supporting voltage stability. A statistical analysis was conducted to validate the results, comparing them with those derived from Particle Swarm Optimization. The study underscores the importance of ongoing performance enhancement in distribution system planning to address the demands introduced by renewable integration. The study in [16] explored the coordinated use of DERs within electrical networks, emphasizing the joint management of photovoltaic units, energy storage solutions, and D-STATCOM compensators. It showed that integrated deployment can lead to considerable reductions in energy losses. Nonetheless, the authors pointed out the mathematical difficulty of the proposed approaches and the importance of applying multi-objective optimization frameworks that incorporate technical, economic, and environmental considerations.
In [17], the authors examine the coordinated deployment of PV generators and a gas turbine together with D-STATCOM units, applying three parameter-free metaheuristic techniques: Student Psychology-Based Optimization, Symbiotic Organism Search, and Harris Hawks Optimization. The aim is to boost efficiency, reinforce system stability, and mitigate energy losses by optimizing active power dissipation, voltage deviation, voltage regulation, and overall system expenses. Article [18] presents an optimization strategy based on the Black Widow algorithm for determining the optimal location and rating of PV units and D-STATCOMs in three-phase unbalanced distribution feeders (IEEE 12-, 33-, and 69-node systems), with a focus on reducing power losses and enhancing voltage behavior. In contrast, Ref. [19] suggests a reconfiguration methodology for radial distribution networks that incorporates DGs and D-STATCOM compensators to lower energy losses, addressing critical planning and operational challenges in light of increasing electricity demand.
Additionally, Ref. [20] investigates the coordinated use of PV-STATCOM units within distribution systems to reduce annual energy consumption and capital expenditures. The mathematical formulation corresponds to a mixed-integer nonlinear optimization scheme, which is subsequently approximated through a convex reformulation to enable optimal solutions without relying on heuristics—applicable to both radial and meshed configurations. Similarly, Ref. [21] integrates an enhanced lion ant optimization method and the bat algorithm to identify the best location and rating of PV generators and D-STATCOM devices in radial topologies, with the goal of lowering energy dissipation, improving voltage conditions, and decreasing operational expenses.
In [22], the authors address the challenge of determining the optimal placement and capacity of PV generators and D-STATCOM units in power distribution networks using the Grasshopper Optimization Algorithm. The main objective is to reduce active power dissipation and improve the Voltage Stability Index. The proposed method was assessed on the IEEE 33-node benchmark, showing notable enhancements in energy loss mitigation and Voltage Stability Index performance through the integrated allocation of multiple PV units and D-STATCOMs. Similarly, Ref. [23] presents an optimization framework based on the Grasshopper Optimization Algorithm to perform the optimal reconfiguration of radial distribution systems incorporating PV generation along with D-STATCOM units. The objective function seeks to minimize energy losses and improve voltage regulation under varying load conditions. The proposed approach was validated on the IEEE 33-, 69-, and 118-bus test systems, showing significant performance gains compared to existing methods such as the modified pollination algorithm and fuzzy ant colony optimization.
Finally, in [24], a modified Horned Lizard Optimization Algorithm is proposed to address the coordinated deployment of PV generators and D-STATCOM units under uncertain conditions. The formulated multi-objective function seeks to minimize total costs, limit pollutant emissions, reduce voltage deviations, and decrease active power losses. The IEEE 33-node benchmark network was employed for validation, yielding promising results in both economic and technical dimensions.
Drawing from the preceding literature review, one can observe that incorporating PV generators and D-STATCOM units with the goal of minimizing power losses has been extensively studied in the literature. However, most existing works focus solely on optimizing technical performance indicators, often neglecting economic criteria. This omission prevents distribution system operators from accurately assessing the long-term financial impact of the implemented solutions. Furthermore, research addressing the simultaneous integration of both components remains limited, representing a significant opportunity for the development of new methodologies and algorithms that enable joint evaluation. Lastly, the review reveals a marked gap in studies considering unbalanced three-phase distribution systems. Most authors prefer simplified single-phase equivalent models due to the inherent mathematical complexity of three-phase systems, making this topic an emerging and promising area for further research.
1.3. Main Contributions and Novelty
Based on the gaps identified in the specialized literature and the challenges faced by modern distribution systems, this article presents an optimization methodology to simultaneously address the location and dimensioning of PV generators and D-STATCOM units in unbalanced three-phase distribution feeders, with the aim of minimizing the overall system expenditures—encompassing energy procurement, capital costs, and upkeep requirements. The innovation of this research lies in the construction of a comprehensive mathematical formulation using complex variables that incorporates both technical and economic considerations, together with the development of a robust and scalable optimization framework suitable for unbalanced three-phase systems under realistic demand and renewable generation scenarios.
The principal contributions of this study are outlined below:
- The accurate formulation of an MINLP model in complex variables, capable of faithfully representing the operational conditions of unbalanced three-phase distribution networks, incorporating technical constraints, operational limits, and cost components associated with the investment, maintenance, and operation of distributed resources.
- The development of a robust and replicable optimization methodology, statistically validated through 100 consecutive executions per test system, which enables the evaluation of the economic implications of concurrently deploying PV generators alongside D-STATCOM devices under realistic load and generation conditions.
- Quantitative comparison with three benchmark metaheuristic algorithms, demonstrating that the developed approach consistently delivers superior outcomes regarding overall cost minimization for distribution system operators, exhibiting high consistency and low variability across 25- and 37-node test networks.
To efficiently address the proposed MINLP formulation, this study employs an optimization framework structured under a leader–follower scheme. At the leader level, a metaheuristic known as Generalized Normal Distribution Optimization is applied to determine the most suitable locations and capacities of PV units and D-STATCOM compensators. This process is integrated with a follower stage, which performs unbalanced three-phase power flow analysis using the successive approximation technique to evaluate the objective and verify compliance with the constraints specified in the mathematical formulation.
1.4. Organization of the Paper
This manuscript is structured as follows: Section 2 details the mathematical formulation of the MINLP problem using complex-number representation, addressing the simultaneous allocation and sizing of PV units and D-STATCOMs in unbalanced three-phase grids. Section 3 outlines the principles of the optimization algorithm implemented, as well as the unbalanced power flow model based on successive approximation used to evaluate the cost function. Section 4 describes the main features of the 25- and 37-bus networks, including standard solar and demand profiles for a typical day in Medellín, Colombia, and the parametric inputs used in the evaluation of the objective metric. Section 5 discusses the numerical outcomes, comparison of the tested methods, statistical assessments, and related insights. Lastly, Section 6 summarizes the key findings and proposes avenues for future investigation.
2. Mathematical Model Description
This section introduces the mathematical representation of the optimal integration challenge involving PV generation and reactive power support through D-STATCOM units in unbalanced three-phase distribution systems. The model is expressed as a Mixed-Integer Nonlinear Programming (MINLP) formulation in complex-number form, enabling a precise characterization of the electrical interactions among phases, as well as the operational and investment limitations related to the system. The approach addresses both the allocation and sizing of distributed assets, aiming to minimize overall system expenditures while satisfying the technical constraints of the grid [25].
The mathematical expression of the objective function and associated constraints of the optimization framework is described below.
2.1. Objective Function
The cost function defined in the model seeks to minimize the total annual expenditure incurred by the network operator, including both operational and capital costs. This encompasses the energy procurement at the substation bus, assessed over the designated planning period, as well as the costs related to the deployment and maintenance of PV generators and D-STATCOM units. The formal definition of this objective function is given in expressions (1) to (4). The total annual cost used in the manuscript is the annualized version of the Net Present Value, obtained through the Capital Recovery Factor, as mentioned in [26].
where Z denotes the total yearly expenditure associated with the three-phase distribution system. accounts for the energy acquisition costs at the substation bus, covered by the network operator. corresponds to the annualized capital and maintenance expenses related to the PV units. Finally, represents the annualized investment cost of the D-STATCOM devices.
The energy purchase costs are presented in Equation (2):
with
where denotes the average price paid by the network operator for acquiring 1 kWh of energy from the spot market. T refers to the number of days in a year (i.e., 365). indicates the complex power injected at substation bus k, for phase p, during time interval h. corresponds to the time step over which electrical quantities are considered constant. is a constant parameter used to annualize costs—in this case, the cost of acquiring energy at the substation bus—while denotes a coefficient reflecting the projected rise in energy prices over time. Additionally, is the internal rate of return, indicates the number of years in the planning horizon, and refers to the expected annual escalation in energy prices. Finally, , , , and are defined as the sets corresponding to system phases, network nodes, hourly intervals in a standard daily operation cycle, and years within the planning period, respectively.
On the other hand, the capital and upkeep expenditures associated with PV units are represented by Equation (3):
Here, denotes the average installation cost per kWp of PV capacity in the distribution system. is the rated complex power of the PV unit located at node k. refers to the average upkeep cost for a PV unit deployed at node k. Finally, represents the complex power output of the PV installation at node k, for phase p, during time interval h. It is important to note that factor is used to annualize capital costs throughout the planning horizon, which aligns with the estimated service life of the PV units—approximately 20 years.
Finally, the investment costs of the D-STATCOM devices are represented by Equation (4):
with
where denotes the factor used to annualize capital expenditures for D-STATCOM units. corresponds to the annualized cost of investment, while indicates the expected service life of the D-STATCOM equipment. , , and are the coefficients for the cubic, quadratic, and linear terms, respectively, employed to model the cost function associated with installing a D-STATCOM unit with rated power at node k [27].
2.2. Model Constraints
The collection of constraints defined in the model guarantees the correct operational behavior of the unbalanced three-phase distribution network. These restrictions encompass active and reactive power balancing, voltage regulation bounds, upper limits on PV unit generation, compensation limits of the D-STATCOM systems, and spatial–allocation constraints involving the placement and sizing of both PV and D-STATCOM devices.
2.3. Three Phase Power Balance
Equation (5) defines the three-phase power balance condition at node k within the distribution network.
where denotes the complex power injected by the D-STATCOM device located at node k, for phase p, during time interval h. indicates the complex power consumption at node k, for phase p, at time interval h. Terms and correspond to the complex voltage values at nodes k and j, respectively, for phase p and time interval h. Finally, characterizes the complex admittance that electrically connects nodes k and j in phases p and f.
It should be emphasized that all PV units, D-STATCOMs, and loads are modeled with a wye connection, as this configuration is the most commonly adopted due to its lower installation cost and simplified protection scheme [28].
2.4. Power Injection from PV and D-STATCOM
Equation (6) indicates that the complex power injected by PV units is uniformly allocated across all system phases. Furthermore, it is worth highlighting that the power generation of a PV system is influenced by both the available solar irradiance and its nominal capacity.
Here, represents the available solar irradiance during time interval h. Similarly, Equation (7) establishes that PV units are restricted to supplying active power within the distribution network. This equation supports the use of PV generators with tracking systems, as such systems allow for a more efficient utilization of the solar resource by increasing the incident radiation (which is reflected in variable ), thereby enhancing the output power of the PV generator [29].
With respect to D-STATCOM units, Equation (8) guarantees that the injected complex power is uniformly allocated among the system’s three phases.
As with the PV units, Equation (9) indicates that D-STATCOM devices are limited to supplying reactive power to the distribution system.
2.5. Capacity Limitation of the Substation, PV Generators, and D-STATCOM Devices
Constraint (10) defines that substations are restricted to supplying power to the network—they are not authorized to draw energy from it.
Constraint (11) guarantees that the nominal capacity assigned to each PV unit falls within specified minimum and maximum limits.
Here, and denote the lower and upper bounds, respectively, of the complex power capacity for a PV unit located at node k.
Constraint (12) likewise ensures that the rated capacity of each D-STATCOM unit to be deployed remains within predetermined minimum and maximum thresholds.
In this expression, and represent the minimum and maximum permissible complex power ratings for a D-STATCOM device located at node k. It is worth highlighting that variables and are binary, indicating the presence or absence of a PV unit or a D-STATCOM, respectively, at node k.
2.6. Voltage Regulation
Constraint (13) enforces voltage regulation requirements within the distribution system. Specifically, the voltage level at node k must remain bounded by the permissible limits established by the network operator.
Here, and denote the lower and upper voltage thresholds, respectively, as established by regulatory standards.
2.7. Device Installation Limits
Constraints (14) and (15) define the upper limits on the number of PV units and D-STATCOM devices that may be deployed within the distribution network.
where and are fixed parameters indicating the highest number of PV systems and D-STATCOM units, respectively, that may be allocated throughout the distribution system.
2.8. Mathematical Model Analysis
The formulation developed for the simultaneous allocation and sizing of PV systems and D-STATCOM units in unbalanced three-phase networks presents considerable mathematical and computational challenges. These challenges stem mainly from the nonlinear behavior of the power flow constraints, which are expressed using complex-number representations [30,31].
Another major source of difficulty stems from the existence of non-convex elements within the model, affecting both the objective functions—particularly due to the cubic cost terms associated with D-STATCOMs—and in some of the constraints, such as the power balance equations. These non-convexities make it impossible to guarantee global optimality using classical optimization techniques, and even exact algorithms for MINLP problems (such as branch-and-bound or branch-and-cut) may become computationally infeasible for medium- to large-scale systems, especially when time horizons involving multiple operating periods (e.g., 24 h operation) are considered [32,33,34].
Additionally, the problem includes binary variables related to the siting decisions of the devices, reinforcing its mixed-integer nature and further complicating its resolution due to the discretization of the solution space. In this context, metaheuristic algorithms offer a viable and efficient alternative [35,36,37,38]. These techniques allow for the flexible and robust exploration of highly nonlinear and discontinuous solution spaces, with reasonable computational times and without requiring extensive mathematical formulation [39].
3. Solution Strategy
This study introduces a two-level optimization approach based on a leader–follower structure to address the joint allocation and sizing of PV units and D-STATCOM devices in unbalanced three-phase distribution grids. The mathematical formulation of the underlying problem corresponds to an MINLP model (see Section 2), where the installation decision is modeled via binary variables, and the nominal capacities are defined through continuous variables.
In the leader stage, the Generalized Normal Distribution Optimization (GNDO) algorithm is applied using a hybrid encoding strategy to explore both siting and sizing solutions simultaneously [40]. The follower stage handles the resolution of the power flow problem in complex form, using an iterative method rooted in successive approximation. This stage evaluates the objective function while ensuring all operational constraints are met [41].
The coordinated operation between both stages promotes convergence toward economically and technically sound network planning. An illustration of the proposed optimization architecture is provided in Figure 1.
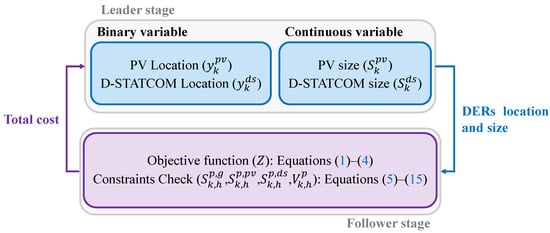
Figure 1.
Leader–follower strategy for optimal allocation and sizing of PV units and D-STATCOM devices in three-phase distribution systems.
Figure 1 illustrates the leader–follower computational architecture developed to address the joint optimization of siting and sizing for PV systems and D-STATCOM devices in unbalanced three-phase distribution networks. This scheme separates the overall optimization task into two interlinked stages, enabling the effective navigation of the solution space while maintaining feasibility with respect to operational requirements [42].
The leader stage is tasked with producing potential solution candidates. It specifies the binary decision variables for locating PV systems () and D-STATCOMs (), along with the continuous variables corresponding to their nominal capacities ( and ). These variables represent the decision vector optimized by the GNDO, which iteratively refines the proposed locations and capacities of distributed energy resources.
The follower stage receives the candidate configuration from the leader stage and evaluates its feasibility and economic performance. Specifically, it computes objective function Z, as defined in Equations (1)–(4), which incorporates the costs related to electricity acquisition, infrastructure investment, and system upkeep. In addition, it checks compliance with the technical constraints of the system, such as power equilibrium, capacity thresholds, and voltage regulation, as formulated in Equations (5)–(15). This evaluation is carried out through a successive approximation approach applied to the solution of power flow equations expressed in complex form.
3.1. Leader Stage: Generalized Normal Distribution Optimization Algorithm
GNDO is a metaheuristic technique based on population dynamics that emulates the behavior of candidate solutions statistically dispersed across the decision space [40,43]. The core principle of this method relies on the modeling of exploration and exploitation mechanisms through Gaussian distribution theory [44].
Initially, GNDO generates a population of solutions using a uniform distribution, which progressively transforms into a structure where decision variables are treated as random variables governed by a Gaussian distribution. During each iteration, both the population’s mean vector and standard deviation are dynamically adjusted: at initial stages, the deviation is large to encourage broad exploration, whereas in later stages, it narrows, focusing the search on the most promising regions of the decision space. This adaptive mechanism facilitates convergence toward either local or global optima with high consistency and minimal parameter calibration. The algorithm is structured to handle both continuous and discrete optimization problems without predefined control settings. Its primary parameters include the population size and the total number of iterations.
For those seeking a more detailed explanation of the algorithm’s mathematical basis, the original reference [40] is recommended. The sequential procedure designed to solve the joint placement and sizing of PV systems and D-STATCOM units in unbalanced three-phase distribution networks is presented below:
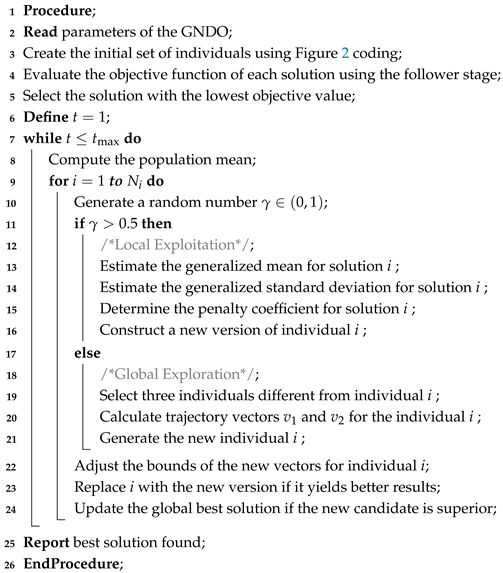
- Initial Population Generation: The GNDO algorithm starts by creating an initial set of candidate solutions that are randomly and uniformly distributed over the decision space. In this work, a mixed encoding scheme combining discrete and continuous variables is used to model the decision parameters related to the optimization task. Each member of the population is organized as shown in Figure 2.
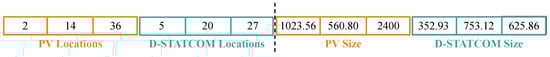 Figure 2. Coding used for individual generation at the leader stage.In this solution vector, the initial elements represent the installation locations of PV generators and D-STATCOM devices (discrete variables), while the remaining elements correspond to their nominal capacities (continuous variables). In the presented example, three PV generators are installed at nodes 2, 14, and 36, and three D-STATCOM units are installed at nodes 5, 20, and 27. The installed capacities of the PV generators are 1023.56 kW, 560.80 kW, and 2400 kW, respectively. Meanwhile, the D-STATCOM devices have installed capacities of 352.93 kVAr, 753.12 kVAr, and 625.86 kVAr, respectively. This representation enables the simultaneous handling of both device location and sizing within a unified solution framework.The initialization procedure ensures that all individuals are distributed within the bounds defined by the distribution system operator, thus ensuring compliance with constraints (6) through (12) and (14) through (15). This encoding scheme not only allows for the direct implementation of the GNDO algorithm but also facilitates its integration within the leader–follower methodology, in which each candidate solution must be evaluated through an unbalanced three-phase power flow analysis (i.e., the follower stage).
 - Local Exploitation: In the GNDO algorithm, local exploitation is designed to enhance the refinement of promising candidates by improving their quality based on a strategy that leverages the current solution, the best-found candidate, and the population’s average. These three reference points are used to compute a localized mean, which guides the application of Gaussian perturbations, regulated by a generalized standard deviation reflecting their spread. A stochastic penalty term modulates the intensity of this refinement process, enabling the algorithm to dynamically shift between exploration and exploitation based on the random parameters generated at each iteration.This formulation enables the introduction of adaptive perturbations in both magnitude and direction, facilitating the escape from local optima without compromising intensification. Moreover, the dynamic calculation of the population mean keeps the algorithm focused on the most relevant regions of the solution space.
- Global Exploration: The global exploration phase in the GNDO algorithm is intended to avoid early convergence toward suboptimal solutions and to enhance the effectiveness of the search for the global optimum. To achieve this, new candidate solutions are produced by recombining individuals from the population through differential movement strategies, with weights determined by parameters sampled from Gaussian and uniform distributions. A new solution substitutes the current one only if it leads to a better objective value.Each element of the generated solution is examined and corrected if it violates predefined constraints, ensuring the validity of the candidate before evaluation. This mechanism improves population heterogeneity and reinforces the algorithm’s capacity to efficiently navigate complex optimization landscapes.
- Evolution of the population: In the GNDO algorithm, population evolution follows an elitist replacement strategy designed to gradually enhance solution quality. At each iteration, newly generated individuals—via local or global search—substitute existing ones only if they produce a superior objective value. This mechanism maintains a continuous improvement process within the population.The algorithm proceeds iteratively until reaching a predefined maximum number of generations (), which acts as the termination condition. Through this process, the method preserves a proper trade-off between exploration and exploitation, helping to retain population diversity and ensuring convergence to high-quality solutions.
Algorithm 1 summarizes the GNDO-based approach developed for determining the optimal placement and capacity of PV units and D-STATCOM devices in unbalanced three-phase distribution networks.
| Algorithm 1: GNDO applied to the optimization of siting and sizing PV units and D-STATCOM devices in unbalanced three-phase distribution networks. |
 |
3.2. Follower Stage: Successive Approximation Three-Phase Power Flow
The three-phase formulation of the successive approximation method facilitates the iterative resolution of the complex power balance constraint introduced in Equation (5), which serves as the foundation of the evaluation process in the follower stage. With this iterative scheme, it becomes feasible to estimate the electrical variables corresponding to each candidate solution provided by the leader stage. This enables the computation of the objective value and verifies compliance with all technical restrictions defined in the MINLP framework.
The recursive expression used to perform the power flow analysis is detailed in Equation (16).
Here, t denotes the iteration index. represents the vector of three-phase voltages at the demand buses during time interval h. is the admittance matrix component linking demand buses, while corresponds to the admittance terms connecting demand and generation buses. contains the three-phase voltage values at the generation buses for time period h. is the current vector at the demand nodes for that same time step. holds the three-phase output currents from the PV units, and refers to the three-phase current vector associated with the D-STATCOM units during time h.
Given that loads, PV systems, and D-STATCOM units are modeled with a wye connection, the current contribution of each component installed at node k is computed according to the following expressions [41]:
The iterative procedure is considered to have converged when the maximum variation in voltage magnitudes at the demand buses—measured between two successive iterations—remains below a specified tolerance level [45].
After achieving convergence in the power flow solution, the objective function specified in Equation (1) can be evaluated. However, solving the power flow alone does not ensure that all model constraints are satisfied. For this reason, the adaptation function described in Equation (20) is employed; it penalizes constraint violations and integrates this effect into the solution evaluation process to discard infeasible candidates.
Here, represents the fitness function. Parameter is a constant used to apply a penalty to the objective value Z in the event of violations of specific constraints in the mathematical model—namely, constraints (10) and (13)—since the remaining restrictions are inherently satisfied during the power flow computation and individual generation process in the leader stage, following the encoding structure illustrated in Figure 2. In this context, the parameter is heuristically set to .
3.3. Computational Complexity and Scalability Analysis
The computational complexity of the proposed optimization framework arises from its two-stage structure, consisting of a leader–follower (formerly master–slave) architecture. The leader stage is responsible for exploring the decision space to identify optimal the siting and sizing of PV generators and D-STATCOM devices, while the follower stage evaluates the technical and economic feasibility of each candidate solution via power flow calculations.
- Leader Stage: The leader stage uses GNDO, which is a population-based metaheuristic. The computational burden in this stage scales with the interaction of three factors [40]: the number of decision variables (), the population size (), and the number of iterations (). Thus, its time complexity can be approximated as [40]While GNDO introduces a slightly higher computational cost than simpler heuristics, this is compensated by its superior performance in terms of solution quality, robustness, and repeatability (see Section 5).
- Follower Stage: Each candidate configuration generated by the leader stage is evaluated by a three-phase unbalanced power flow solver based on successive approximations. The complexity of this stage is primarily influenced by the number of nodes (), the number of phases (), the number of time steps (), and the number of required iterations for convergence (t).Given that each iteration updates the nodal voltages using a numerical method, the power flow method converges in a computational time that is linear with respect to and . Therefore, the follower stage scales approximately as
The overall computational complexity of the methodology is the product of the complexities of the leader and the follower, since each candidate solution generated by the leader requires a full evaluation by the follower.
The computational complexity of the proposed leader–follower methodology scales primarily with the number of nodes in the distribution network. This is because each candidate solution generated by the leader algorithm must be evaluated via a full three-phase power flow calculation in the follower stage, which inherently processes all network nodes at each time period. Although the leader stage involves multiple candidate evaluations, its internal parameters—such as population size and number of iterations—remain fixed throughout the optimization process. Similarly, the number of time periods and system phases are predefined and constant across all scenarios.
As a result, the number of nodes is the key parameter that drives the overall scalability of the method. A larger system size directly increases the computational effort required in the follower stage, leading to higher total execution times. This behavior is expected in high-fidelity planning models that simulate detailed system dynamics and constraints. Nevertheless, such complexity can be mitigated through parallelization strategies, surrogate modeling, or hybrid algorithms, enabling the proposed methodology to remain tractable for realistic large-scale applications.
4. Three-Phase Distribution Systems
In order to assess the performance of the proposed method and examine its effectiveness in addressing the joint allocation and sizing of PV systems and D-STATCOM devices in unbalanced three-phase distribution networks, two benchmark models commonly cited in the literature were employed: the 25-bus and 37-bus distribution cases [46]. These reference networks are well established in the academic field and allow for a detailed analysis of the model’s performance under different network topologies, sizes, and degrees of unbalance. Furthermore, they provide a basis for comparing the proposed approach against existing methodologies.
4.1. Twenty-Five-Node Distribution System
The 25-node distribution system operates at a nominal line-to-line voltage of 4.16 kV and comprises 24 branches and 22 load points. The total installed three-phase demand is distributed as follows: 946 kW and 648 kvar for phase A, 573.6 kW and 430.6 kvar for phase B, and 771.8 kW and 554 kvar for phase C [46]. The single-line representation of this network is provided in Figure 3.

Figure 3.
Network topology of the 25-node distribution system [46].
Table 1 and Table 2 present the key parameters of the 25-node system, detailing the load demand at each node and the impedance matrix of the network lines.

Table 1.
Nodal three-phase load demand profile for the 25-node distribution system [46].
Table 2.
Impedance matrix corresponding to the conductor type used in the 25-node distribution system [46].
4.2. Thirty-Seven-Node Distribution System
The 37-node distribution system operates at a nominal line-to-line voltage of 4.8 kV and comprises 35 branches and 25 load points. The total installed three-phase demand is distributed as follows: 727 kW and 357 kvar for phase A, 639 kW and 314 kvar for phase B, and 1091 kW and 530 kvar for phase C [46]. The single-line representation of this network is provided in Figure 4.

Figure 4.
Network topology of the 37-node distribution system [46].
Table 3 and Table 4 present the key parameters of the 25-node system, detailing the load demand at each node and the impedance matrix of the network lines.
Table 3.
Nodal three-phase load demand profile for the 37-node distribution system [46].
Table 4.
Impedance matrix corresponding to the conductor type used in the 37-node distribution system [46].
4.3. Additional Parametric Information
To analyze the impact of incorporating PV systems and D-STATCOM units on the economic objective of the three-phase distribution networks, typical daily time series of electrical load and solar irradiance data from Medellín, Colombia, were utilized. These time series, depicted in Figure 5, were derived from actual measurements reported in [47], offering a realistic operational framework for evaluating the effectiveness of the proposed approach.
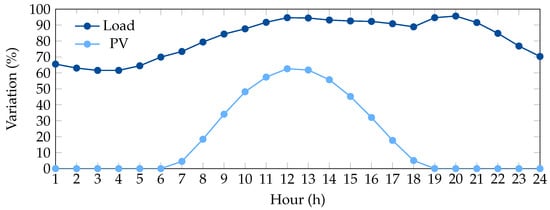
Figure 5.
Typical daily profiles of load demand and PV output in Medellín, Colombia [47].
In a similar manner, the formulation of the total cost function relies on the parametric dataset provided in Table 5, which includes the economic parameters required to assess both investment and maintenance expenditures associated with the distributed devices. These values are based on the data reported in [25].
Table 5.
Parameter set used for objective function evaluation [25].
As indicated in the table, it is considered that the network operator can deploy up to three PV systems and three D-STATCOM units throughout the distribution grid. The rated capacities of these components are handled as decision variables within the optimization framework, subject to a maximum limit of 5000 kVA per unit. This restriction narrows the solution space and aligns with typical capacity constraints observed in medium-voltage networks.
It is worth emphasizing that the methodology aims to identify the optimal sizing configuration that minimizes the total cost of the system. These upper bounds are specifically incorporated to support the encoding mechanism depicted in Figure 2.
Lastly, the voltage regulation criterion permits node voltages to vary within the acceptable range of 0.9 to 1.1 p.u., relative to the system’s nominal voltage.
5. Computational Outcomes and Interpretation
This section reports the outcomes derived from applying the proposed optimization framework to unbalanced three-phase distribution networks, specifically the 25- and 37-bus benchmark cases. All simulations were performed using a system equipped with a 12th-generation Intel Core i7-12700T processor running at 1.40 GHz, 32 GB of RAM, and a 64-bit Windows 11 Pro operating system. The methodology was coded and executed in MATLAB R2024a.
To evaluate the robustness and effectiveness of the proposed strategy, a benchmarking study was performed using three widely recognized metaheuristic techniques: the Chu and Beasley Genetic Algorithm (CBGA) [48], the Vortex Search Algorithm (VSA) [49], and Particle Swarm Optimization (PSO) [50]. These methods were selected based on their extensive application and demonstrated capability to solve complex combinatorial optimization problems in the context of power system planning.
Each optimization algorithm was run independently 100 times on both test networks to ensure a robust statistical assessment. The evaluation metrics include the best-obtained solution, mean performance, worst-case result, variability in the objective function, and average computation time. This comparative study was intended to offer insight into the reliability, consistency, and computational efficiency of the proposed approach relative to other benchmark methods.
5.1. Parameters of the Algorithms Used
In order to ensure a fair and consistent comparison among the metaheuristic algorithms employed in this study (CBGA, VSA, PSO, and GNDO), an automatic parameter tuning procedure was conducted prior to their application. The selection of appropriate parameter configurations is crucial, as it significantly impacts the convergence behavior, solution quality, and robustness of metaheuristic-based optimization methods [51,52].
Rather than relying on manual trial-and-error or exhaustive sensitivity analysis, which can be computationally intensive and time-consuming, the parameter tuning process was automated using the PSO algorithm as a meta-optimizer. This approach allowed for an efficient search across the parameter space by concentrating the exploration on promising regions and avoiding unnecessary evaluations of suboptimal configurations.
Figure 6 presents the flowchart of the automated parameter tuning process used in this work.
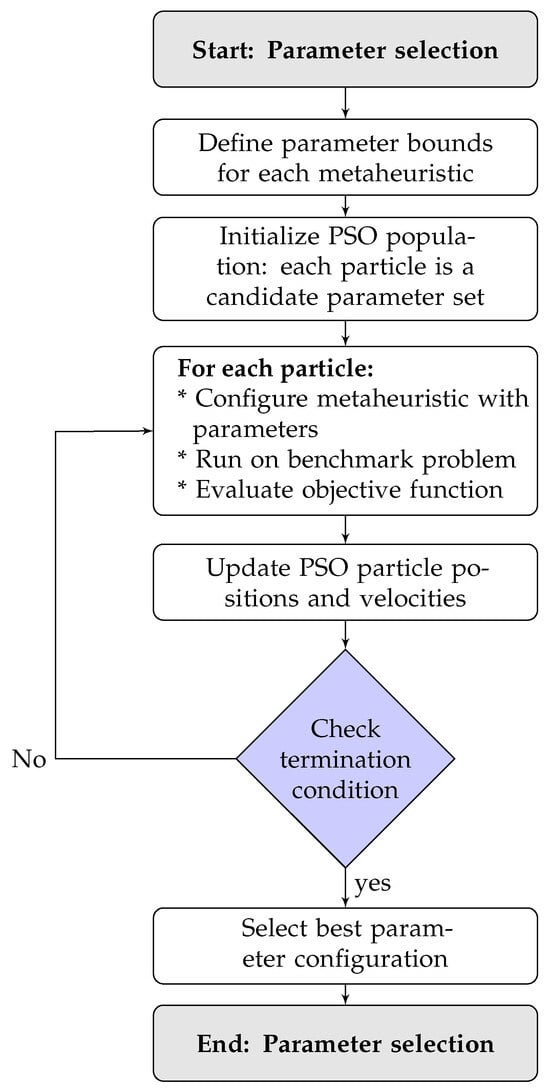
Figure 6.
Automated parameter tuning process using PSO as a meta-optimizer.
The procedure begins with the definition of the search ranges for each parameter involved in the metaheuristics. Then, a PSO-based meta-optimization is executed, where each particle represents a candidate set of parameters. Each candidate configuration is evaluated by running the associated metaheuristic (e.g., GNDO) on a benchmark test case (25-node system), and its performance is assessed using the objective function value. Based on these evaluations, the particles’ positions and velocities are updated according to PSO dynamics. This iterative process continues until a termination condition is met (e.g., maximum number of iterations), after which the best-performing parameter set is selected and adopted for subsequent experiments.
The PSO-based tuning strategy was implemented with 100 particles and a linearly decreasing inertia weight from 1.0 to 0.0. The social and cognitive acceleration coefficients were both set to 1.494, following guidelines from recent studies [53,54,55].
This tuning process was uniformly applied to all algorithms to guarantee methodological consistency. The resulting configurations, which reflect the best-performing parameter sets within predefined bounds, are summarized in Table 6. These configurations were subsequently used in all case studies to ensure an equitable evaluation of algorithmic performance.
Table 6.
Configuration of metaheuristic algorithm parameters used for benchmarking.
5.2. Quantitative Assessment of the Proposed Strategy
Table 7 and Table 8 present a consolidated view of the computational results obtained for the 25- and 37-bus networks using the proposed optimization framework. The performance of the four metaheuristic techniques—CBGA, VSA, PSO, and GNDO—is shown in each case. The tables report the selected locations and corresponding capacities of the deployed PV units and D-STATCOMs for each algorithm. Furthermore, the total annualized system cost in USD is provided, along with the percentage cost savings relative to the base scenario, which assumes no integration of distributed energy resources (indicated in the first row).
Table 7.
Quantitative assessment for the 25-node distribution system.
Table 8.
Quantitative assessment for the 37-node distribution system.
- In the 25-node system, the most frequently selected locations for PV generator installation are nodes 11, 17, and 22, with node 22 standing out as it was chosen by three out of the four algorithms. Among all the methodologies, GNDO proved to be the most efficient, placing the generators at nodes 11, 14, and 22, with a total installed capacity of 3.49238 MW.
- In the 37-node system, the most commonly selected nodes are 19 and 35. GNDO also demonstrates superior performance in this case, installing the generators at nodes 9, 18, and 35, resulting in a total installed capacity of 3.75693 MW.
- In the 25-node system, the most commonly selected nodes for D-STATCOM installation are nodes 11, 14, and 22. The total installed reactive power by each algorithm was 0.98360 MVAr for CBGA, 0.73985 MVAr for VSA, 0.87759 MVAr for PSO, and 0.74914 MVAr for GNDO. Although GNDO does not install the highest total reactive power, it stands out for its efficient use of installed capacity by placing devices at strategically significant nodes—11, 14, and 22—allowing it to achieve the lowest annual system cost.
- In the 37-node system, the most frequently selected nodes are 19, 27, and 35. The total installed capacities by each algorithm were 1.16076 MVAr for CBGA, 0.46397 MVAr for VSA, 0.36456 MVAr for PSO, and 0.42421 MVAr for GNDO. Once again, GNDO demonstrates a more efficient approach, installing devices at nodes 14, 19, and 35, with lower individual capacities, thereby ensuring more localized compensation adapted to the operational conditions of the network—particularly in peripheral areas where voltage drop and phase unbalance effects are more pronounced.
- In the 25-node system, the base case without distributed resources results in an annual cost of USD 2,715,619.98. When the proposed methodology (GNDO) is applied, the annual cost is reduced to USD 2,221,831.66, representing an absolute annual savings of USD 493,788.32—equivalent to an 18.18% reduction compared to the base case. Compared to the other methodologies, GNDO achieves an additional savings of USD 437.71 over PSO (cost of USD 2,222,269.37), USD 392.69 over VSA (cost of USD 2,222,224.35), and USD 5,342.45 over CBGA (cost of USD 2,227,174.11). Although these differences may appear numerically small, they demonstrate the consistent and stable performance advantage of the GNDO methodology over the alternatives.
- For the 37-node system, the base case cost amounts to USD 2,927,715.61, while the cost achieved by GNDO is USD 2,385,465.29, resulting in absolute annual savings of USD 542,250.32 and an 18.52% reduction compared to the scenario without distributed resources. In comparative terms, GNDO outperforms PSO by USD 213.73, VSA by USD 752.68, and CBGA by USD 6,234.01. As in the previous case, although the differences are relatively small, they demonstrate GNDO’s consistent ability to deliver the most efficient solutions within the defined resource and constraint framework.
Although all evaluated algorithms demonstrate robust performance and achieve significant reductions in the system’s operational costs, the proposed methodology based on GNDO consistently delivers the most cost-effective solutions across both test systems. Although the improvement may seem modest in absolute terms, it demonstrates greater efficiency in navigating the solution space and simultaneously optimizing the placement and sizing of distributed energy resources.
This outcome can be partially attributed to the prior calibration of algorithm parameters, which guides the methods toward converging on similar strategic locations and closely aligned total installed capacities. However, GNDO stands out for its consistency in identifying configurations that maximize economic benefits through the rational use of resources. This makes it a particularly effective tool for the optimal planning of unbalanced three-phase distribution networks.
5.3. Performance Analysis of Used Methodologies
In contrast, Table 9 and Table 10 present the computational results obtained by applying the metaheuristic algorithms to the 25- and 37-node networks, respectively. Each table includes five core performance indicators: the best-obtained solution (corresponding to the lowest objective function value), mean performance, worst-case outcome, standard deviation (reported as a percentage of the mean) to quantify result variability, and the average runtime in seconds over 100 independent executions per algorithm.
Table 9.
Numerical performance obtained for the 25-node distribution system.
Table 10.
Numerical performance obtained for the 37-node distribution system.
The data presented in these tables lead to the following key insights:
- In both test systems, GNDO achieves the best solution. In the 25-node system, it reaches a minimum cost of USD 2,221,831.66, representing a reduction of 493,788.32 USD compared to the base case (without distributed energy resources), and the lowest among all evaluated algorithms. When compared to PSO, the cost difference is USD 437.71; to VSA, USD 392.69; and to CBGA, USD 5342.45. This trend is repeated in the 37-node system, where GNDO achieves an optimal solution of USD 2,385,465.29, resulting in savings of USD 542,250.32 relative to the base case. The advantage over the other algorithms is USD 213.73 (PSO), USD 752.68 (VSA), and USD 6234.01 (CBGA), demonstrating that GNDO more effectively explores the solution space and identifies economically superior configurations.
- GNDO once again stands out by achieving the lowest average solutions in both systems: USD 2,222,378.24 for the 25-node system and USD 2,385,679.19 for the 37-node system. In comparison, PSO—ranked second—yields average costs of USD 2,223,089.70 and USD 2,386,218.72, which translates into improvements of USD 711.46 and USD 539.53 in favor of GNDO. When compared to CBGA, which performs the worst, the differences are significantly more pronounced: USD 47,328.75 and USD 37,684.00 for the 25- and 37-node systems, respectively. This behavior highlights GNDO’s ability to consistently maintain high-quality solutions, in contrast to other methodologies that may rely more heavily on randomness or favorable initial conditions.
- Regarding the worst-case solution, GNDO once again leads, with worst outcomes of USD 2,223,290.70 (25-node system) and USD 2,386,022.13 (37-node system). These results outperform those of PSO (USD 2,224,145.46 and USD 2,386,598.73), VSA (USD 2,229,755.42 and USD 2,388,169.81), and especially CBGA (USD 2,313,758.23 and USD 2,472,130.31), with particularly significant margins over the latter. For example, in the 25-node system, GNDO’s worst solution is USD 86,108.18 better than that of CBGA. This metric is crucial in practical applications, as an algorithm that yields poor results under adverse conditions may pose operational or economic risks. In contrast, GNDO ensures high solution quality even in unfavorable scenarios, reinforcing its value as a reliable tool for decision making.
- In terms of standard deviation, GNDO reports the lowest values in both systems: 0.01951% for the 25-node case and 0.00734% for the 37-node case. This indicates that GNDO not only delivers high-quality solutions but does so consistently. PSO and VSA also perform well in this metric, though they exhibit slightly higher variability, with deviations two to three times greater than those of GNDO. In contrast, CBGA shows the highest fluctuations, with standard deviations of 1.31670% and 0.89993%, respectively, highlighting a strong dependence on execution conditions and lower reliability. GNDO’s combination of solution quality and stability makes it particularly well suited for real-world applications, where consistent performance is a critical requirement.
- Regarding average execution time, although GNDO is not the fastest among the evaluated algorithms, its computational time remains acceptable within the context of long-term planning studies. The average execution time for GNDO is 4070.06 s in the 25-node system and 6841.94 s in the 37-node system. These values are comparable to those obtained with PSO and VSA, indicating a similar level of computational complexity among these methods. In contrast, CBGA achieves significantly shorter runtimes—below 5% of GNDO’s time in both cases—primarily due to its simpler exploration mechanics and reduced internal iterations.However, this acceleration comes at a clear cost in terms of performance. As shown in the comparative analysis, GNDO consistently achieves superior outcomes across all statistical measures, including the minimum, average, and worst-case results, as well as standard deviation. In this context, execution time must be interpreted not in isolation, but relative to solution quality and robustness.From a practical standpoint, the slight increase in runtime incurred by GNDO is justifiable, especially in distribution network planning problems where the analysis is performed offline and solution quality directly impacts long-term operational costs and reliability. The difference of several hundred or even a few thousand seconds becomes negligible when weighed against potential savings in the range of tens of thousands of USD over a 20-year horizon. Moreover, GNDO’s stability—reflected in its low variance—reduces the need for repeated simulations or post-optimization adjustments, which indirectly contributes to greater overall computational efficiency. Therefore, while CBGA might be preferred in time-constrained scenarios where solution quality is secondary, GNDO provides the best balance when reliability, consistency, and economic performance are critical, as is the case in real-world power system planning.
The comparative analysis of the five performance metrics confirms that GNDO is the most effective methodology for solving the joint placement and sizing of distributed energy resources in unbalanced three-phase distribution networks. Across both the 25- and 37-node test systems, GNDO consistently achieves the lowest total planning costs and exhibits superior performance in terms of average, worst-case, and standard deviation metrics. Although not the fastest algorithm, GNDO maintains competitive computational efficiency, and the quality, consistency, and robustness of its solutions clearly justify the additional processing time—especially in planning contexts where long-term performance is prioritized over computational speed.
Importantly, the leader–follower methodology developed in this work was conceived with scalability in mind. The leader stage—based on metaheuristic optimization—operates using a discrete and compact representation of decision variables (i.e., the siting and sizing of DERs), which keeps the search space tractable as the system size increases. Meanwhile, the follower stage leverages a successive approximations power flow algorithm capable of handling arbitrary N-node unbalanced networks with high numerical stability and acceptable computational cost. This modular design allows for independent control over the optimization and simulation processes, enhancing both flexibility and extensibility.
Moreover, the proposed approach functions as a black-box optimization framework, requiring only standard network data—such as line impedances, phase-specific demand, and solar availability profiles—to be applicable. This generality ensures its adaptability to a wide range of practical planning scenarios. Nonetheless, we recognize that in much larger systems (e.g., with more than 100 nodes), further acceleration strategies may be necessary to maintain tractable execution times. These may include the parallelization of the power flow module, search space reduction techniques, or the hybridization of GNDO with local search mechanisms.
The proposed methodology demonstrates not only outstanding performance in medium-scale test systems, but also strong potential for deployment in larger real-world distribution networks. Its ability to deliver high-quality, repeatable solutions under diverse conditions makes it a reliable and scalable tool for advanced DER planning, where accuracy, consistency, and long-term economic efficiency are essential.
5.4. Discussion on Policy Transitions and Regulatory Implications
The deployment and operation of DERs are increasingly influenced by evolving regulatory frameworks and tariff structures. Recent policy shifts—particularly the transition from net metering to net billing, the emergence of energy communities, and the interconnection of remote or weakly meshed systems—introduce new design and operational constraints that can significantly affect the outcomes of distribution network planning algorithms.
In the present study, the proposed optimization model assumes a fixed purchase price for electricity at the substation, without considering differentiated export tariffs or temporal variability in energy prices. This assumption is consistent with many planning scenarios in Latin American countries and other regions where static tariffs remain prevalent. However, under net billing regimes, the compensation for surplus energy injected into the grid is typically lower than the retail price and varies dynamically with market signals. As highlighted in [56], this alters the economic feasibility of PV deployment and demands new optimization strategies that account for bidirectional flows, differentiated tariffs, and time-dependent export constraints.
Additionally, the work of Fotopoulou et al. [29] emphasizes that modern DER integration in rural and semi-urban contexts must also consider the technical limitations of interconnecting distant nodes, voltage regulation in weakly supported feeders, and the operational coordination of distributed assets. These aspects are particularly relevant for systems with high DER penetration and limited hosting capacity, where regulatory requirements impose strict constraints on power injection, reverse flows, and even export ceilings.
To address these emerging challenges, future developments of our methodology will include
- The integration of time-of-use pricing schemes and net billing mechanisms, allowing the algorithm to capture dynamic energy tariffs and differentiated import/export valuations;
- A shift from single-stage planning to multi-period formulations, incorporating daily or seasonal variations in generation, demand, and prices;
- The adoption of stochastic or robust optimization models, capable of addressing uncertainty in generation forecasts, market signals, and policy changes;
- The modeling of interconnection constraints and capacity limits, especially for remote or islanded feeders with limited infrastructure reinforcement.
These extensions will improve the realism and applicability of the proposed approach to evolving regulatory environments. While the current formulation offers valuable insights into cost-effective DER deployment under simplified regulatory assumptions, its modular architecture allows for straightforward adaptation to more complex tariff and policy scenarios. This flexibility enhances the practical relevance of the method for real-world planning applications in distribution networks undergoing regulatory transformation.
6. Conclusions and Future Investigations
This study introduces an optimization strategy for simultaneously determining the placement and sizing of PV units and D-STATCOMs within unbalanced three-phase distribution systems. The proposed formulation adopts a leader–follower structure, in which the GNDO algorithm generates candidate configurations, while the objective function is assessed using a power flow solver based on successive approximation. Validation was performed on two standard test feeders (25 and 37 nodes), and the results were benchmarked against those of the CBGA, VSA, and PSO algorithms.
The numerical results show that GNDO systematically outperforms the other algorithms in both test systems across most evaluation metrics. Regarding the best solution, GNDO achieved the lowest total annual cost in both cases, with savings of USD 493,788.32 and USD 542,250.32 compared to the base cases without distributed resources. On average, GNDO delivered better solutions of more than USD 700 compared to PSO and over USD 47,000 compared to CBGA in the 25-node distribution system; for the 37-node distribution system, the average advantage was approximately USD 540 over PSO and more than USD 37,600 over CBGA. Moreover, GNDO also yielded the best worst-case solutions, ensuring robust performance even under unfavorable conditions. It also reported the lowest standard deviations in both systems (0.01951% and 0.00734%), demonstrating remarkable stability. Although GNDO is not the fastest algorithm, its computation time is acceptable for planning applications. These results confirm that GNDO is a highly effective and reliable tool for distribution system planning, particularly in contexts where both economic efficiency and solution robustness are essential.
Future research directions include (i) broadening the methodology to incorporate energy storage devices aimed at improving energy management; (ii) incorporating uncertainty modeling in solar irradiance and load profiles using stochastic or robust optimization techniques; (iii) integrating the operational dispatch of PV units and D-STATCOMs to enhance the network’s technical and economic indicators; and (iv) developing hybrid optimization strategies that combine GNDO with deterministic local search techniques to improve convergence speed and solution accuracy.
Author Contributions
Conceptualization, L.S.A.-G., B.C.-C., and O.D.M.; methodology, L.S.A.-G., B.C.-C., and O.D.M.; software, L.S.A.-G., B.C.-C., and O.D.M.; validation, L.S.A.-G., B.C.-C., and O.D.M.; formal analysis, L.S.A.-G., B.C.-C., and O.D.M.; investigation, L.S.A.-G., B.C.-C., O.D.M., and J.M.L.-L.; resources, L.S.A.-G., B.C.-C., O.D.M., and J.M.L.-L.; data curation, L.S.A.-G., B.C.-C., and O.D.M.; writing—original draft preparation, L.S.A.-G., B.C.-C., and O.D.M.; writing—review and editing, L.S.A.-G., B.C.-C., O.D.M., and J.M.L.-L.; visualization, L.S.A.-G., B.C.-C., and O.D.M.; supervision, L.S.A.-G., B.C.-C., O.D.M., and J.M.L.-L.; project administration, L.S.A.-G., B.C.-C., and O.D.M.; funding acquisition, L.S.A.-G., B.C.-C., O.D.M., and J.M.L.-L. All authors have read and agreed to the published version of the manuscript.
Funding
This research received no external funding.
Data Availability Statement
The original contributions presented in this study are included in the article. Further inquiries can be directed to the corresponding author.
Acknowledgments
The authors acknowledge the support provided by Thematic Network 723RT0150, i.e., Red para la integración a gran escala de energías renovables en sistemas eléctricos (RIBIERSE-CYTED), funded through the 2022 call for thematic networks of the CYTED (Ibero-American Program of Science and Technology for Development).
Conflicts of Interest
The authors declare no conflicts of interest.
References
- Yumbla, J.; Home-Ortiz, J.M.; Pinto, T.; Catalão, J.P.; Mantovani, J.R. Optimal operational planning of distribution systems: A neighborhood search-based matheuristic approach. Sustain. Energy Grids Netw. 2024, 38, 101330. [Google Scholar] [CrossRef]
- Razon, A.; Thomas, T.; Banunarayanan, V. Advanced distribution management systems: Connectivity through standardized interoperability protocols. IEEE Power Energy Mag. 2019, 18, 26–33. [Google Scholar] [CrossRef]
- Caballero-Pena, J.; Cadena-Zarate, C.; Parrado-Duque, A.; Osma-Pinto, G. Distributed energy resources on distribution networks: A systematic review of modelling, simulation, metrics, and impacts. Int. J. Electr. Power Energy Syst. 2022, 138, 107900. [Google Scholar] [CrossRef]
- Rao, B.V.; Kupzog, F.; Kozek, M. Three-phase unbalanced optimal power flow using holomorphic embedding load flow method. Sustainability 2019, 11, 1774. [Google Scholar] [CrossRef]
- Mehmood, A.; Yang, F.; Dong, J.; Luo, Z.; Yi, L.; Wu, T. Modeling and Load Flow Analysis for Three phase Unbalanced Distribution System. In Proceedings of the 2021 4th International Conference on Energy, Electrical and Power Engineering (CEEPE), Chongqing, China, 23–25 April 2021; pp. 44–48. [Google Scholar] [CrossRef]
- Lou, C.; Yang, J.; Li, T.; Vega-Fuentes, E. New phase-changing soft open point and impacts on optimising unbalanced power distribution networks. Iet Gener. Transm. Distrib. 2020, 14, 5685–5696. [Google Scholar] [CrossRef]
- Aziz, T.; Lin, Z.; Waseem, M.; Liu, S. Review on optimization methodologies in transmission network reconfiguration of power systems for grid resilience. Int. Trans. Electr. Energy Syst. 2021, 31, e12704. [Google Scholar] [CrossRef]
- Leghari, Z.H.; Kumar, M.; Shaikh, P.H.; Kumar, L.; Tran, Q.T. A critical review of optimization strategies for simultaneous integration of distributed generation and capacitor banks in power distribution networks. Energies 2022, 15, 8258. [Google Scholar] [CrossRef]
- Țiboacă Ciupăgeanu, M.E.; Țiboacă Ciupăgeanu, D.A. Optimal substation placement: A paradigm for advancing electrical grid sustainability. Sustainability 2024, 16, 4221. [Google Scholar] [CrossRef]
- Waswa, L.; Chihota, M.J.; Bekker, B. Toward Optimal Active Distribution Network Planning: A Critical Review of Conductor Size Selection Methods. IEEE Access 2023, 11, 144812–144830. [Google Scholar] [CrossRef]
- Stecca, M.; Elizondo, L.R.; Soeiro, T.B.; Bauer, P.; Palensky, P. A comprehensive review of the integration of battery energy storage systems into distribution networks. IEEE Open J. Ind. Electron. Soc. 2020, 1, 46–65. [Google Scholar] [CrossRef]
- Yenealem, M.G. Optimum Allocation of Microgrid and D-STATCOM in Radial Distribution System for Voltage Profile Enhancement Using Particle Swarm Optimization. Int. J. Photoenergy 2024, 2024, 5550897. [Google Scholar] [CrossRef]
- Rezaeian-Marjani, S.; Galvani, S.; Talavat, V.; Farhadi-Kangarlu, M. Optimal allocation of D-STATCOM in distribution networks including correlated renewable energy sources. Int. J. Electr. Power Energy Syst. 2020, 122, 106178. [Google Scholar] [CrossRef]
- Rohouma, W.; Metry, M.; Balog, R.S.; Peerzada, A.A.; Begovic, M.M.; Zhou, D. Analysis of the capacitor-less D-STATCOM for voltage profile improvement in distribution network with high PV penetration. IEEE Open J. Power Electron. 2022, 3, 255–270. [Google Scholar] [CrossRef]
- Kandasamy, M.; Thangavel, R.; Arumugam, T.; Kumaravel, S.; Aruchamy, S.; Kim, W.W.; Geem, Z.W. Strategic incorporation of DSTATCOM and distributed generations in balanced and unbalanced radial power distribution networks considering time varying loads. Energy Rep. 2023, 9, 4345–4359. [Google Scholar] [CrossRef]
- Guzmán-Henao, J.A.; Bolaños, R.I.; Montoya, O.D.; Grisales-Noreña, L.F.; Chamorro, H.R. On integrating and operating distributed energy resources in distribution networks: A review of current solution methods, challenges, and opportunities. IEEE Access 2024, 12, 55111–55133. [Google Scholar] [CrossRef]
- Dash, S.K.; Mishra, S.; Abdelaziz, A.Y.; Hong, J.; Geem, Z.W. Optimal planning of multitype DGs and D-STATCOMs in power distribution network using an efficient parameter free metaheuristic algorithm. Energies 2022, 15, 3433. [Google Scholar] [CrossRef]
- Shaikh, R.; Stojcevski, A.; Seyedmahmoudian, M.; Chandran, J. A Multi-Objective Approach for Optimal Sizing and Placement of Distributed Generators and Distribution Static Compensators in a Distribution Network Using the Black Widow Optimization Algorithm. Sustainability 2024, 16, 4577. [Google Scholar] [CrossRef]
- Salkuti, S.R. Minimization of losses in a distribution system with network reconfiguration, distributed generation and D-STATCOM. Int. J. Adv. Technol. Eng. Explor. 2021, 8, 1557. [Google Scholar] [CrossRef]
- Garrido-Arévalo, V.M.; Gil-González, W.; Montoya, O.D.; Chamorro, H.R.; Mírez, J. Efficient Allocation and Sizing the PV-STATCOMs in Electrical Distribution Grids Using Mixed-Integer Convex Approximation. Energies 2023, 16, 7147. [Google Scholar] [CrossRef]
- BC, S.; RS, G. Optimal Planning of PV Sources and D-STATCOM Devices with Network Reconfiguration Employing Modified Ant Lion Optimizer. Energies 2024, 17, 2238. [Google Scholar] [CrossRef]
- Frahat, M.; Y Hatata, A.; M Saadawi, M.; S Kaddah, S. Grasshopper optimization-based optimal sizing of DG/DSTATCOM in distribution networks. MEJ-Mansoura Eng. J. 2022, 47, 6–16. [Google Scholar] [CrossRef]
- Sambaiah, K.S.; Jayabarathi, T. Optimal reconfiguration of distribution network in presence of D-STATCOM and photovoltaic array using a metaheuristic algorithm. Eur. J. Electr. Eng. Comput. Sci. 2020, 4, 244. [Google Scholar] [CrossRef]
- Hachemi, A.T.; Ebeed, M.; Hashem, M.; Jurado, F.; Saim, A. Techno-economic-environmental Assessment of Distribution Networks with Integrated PV Systems and D-STATCOMs Under Uncertainty. In Proceedings of the 2024 25th International Middle East Power System Conference (MEPCON), Cairo, Egypt, 17–19 December 2024; pp. 1–6. [Google Scholar] [CrossRef]
- Rincón-Miranda, A.; Gantiva-Mora, G.V.; Montoya, O.D. Simultaneous integration of d-statcoms and pv sources in distribution networks to reduce annual investment and operating costs. Computation 2023, 11, 145. [Google Scholar] [CrossRef]
- Khan, A.; Javaid, N. TACMA: Total annual cost minimization algorithm for optimal sizing of hybrid energy systems. J. Ambient. Intell. Humaniz. Comput. 2020, 11, 5785–5805. [Google Scholar] [CrossRef]
- Rezaeian Marjani, S.; Talavat, V.; Galvani, S. Optimal allocation of D-STATCOM and reconfiguration in radial distribution network using MOPSO algorithm in TOPSIS framework. Int. Trans. Electr. Energy Syst. 2019, 29, e2723. [Google Scholar] [CrossRef]
- Sepúlveda, S.; Ruíz, A.G.; Mora-Flórez, J.J. Optimal power flow for three-phase unbalanced active distribution networks with delta connections. In Proceedings of the 2022 IEEE ANDESCON, Barranquilla, Colombia, 16–19 November 2022; pp. 1–6. [Google Scholar] [CrossRef]
- Fotopoulou, M.; Rakopoulos, D.; Malamaki, K.N.; Andriopoulos, N.; Lampsidis, G.; Kaousias, K. Photovoltaic penetration potential in the Greek island of Ikaria. Sol. Compass 2024, 12, 100080. [Google Scholar] [CrossRef]
- Aldik, A.; Venkatesh, B. Reactive power planning using convex line-wise power balance equations for radial distribution systems. IET Gener. Transm. Distrib. 2020, 14, 2399–2406. [Google Scholar] [CrossRef]
- Sun, Y.; Zhang, B.; Ge, L.; Sidorov, D.; Wang, J.; Xu, Z. Day-ahead optimization schedule for gas-electric integrated energy system based on second-order cone programming. Csee J. Power Energy Syst. 2020, 6, 142–151. [Google Scholar] [CrossRef]
- Narimani, M.R.; Molzahn, D.K.; Wu, D.; Crow, M.L. Empirical investigation of non-convexities in optimal power flow problems. In Proceedings of the 2018 Annual American Control Conference (ACC), Milwaukee, WI, USA, 27–29 June 2018; pp. 3847–3854. [Google Scholar] [CrossRef]
- Yang, H.; Antonante, P.; Tzoumas, V.; Carlone, L. Graduated non-convexity for robust spatial perception: From non-minimal solvers to global outlier rejection. IEEE Robot. Autom. Lett. 2020, 5, 1127–1134. [Google Scholar] [CrossRef]
- Byers, C.; Hug, G. Economic impacts of near-optimal solutions with non-convex pricing. Electr. Power Syst. Res. 2022, 211, 108287. [Google Scholar] [CrossRef]
- Ezugwu, A.E.; Adeleke, O.J.; Akinyelu, A.A.; Viriri, S. A conceptual comparison of several metaheuristic algorithms on continuous optimisation problems. Neural Comput. Appl. 2020, 32, 6207–6251. [Google Scholar] [CrossRef]
- SS, V.C.; HS, A. Nature inspired meta heuristic algorithms for optimization problems. Computing 2022, 104, 251–269. [Google Scholar] [CrossRef]
- Turgut, O.E.; Turgut, M.S.; Kırtepe, E. A systematic review of the emerging metaheuristic algorithms on solving complex optimization problems. Neural Comput. Appl. 2023, 35, 14275–14378. [Google Scholar] [CrossRef]
- Halim, A.H.; Ismail, I.; Das, S. Performance assessment of the metaheuristic optimization algorithms: An exhaustive review. Artif. Intell. Rev. 2021, 54, 2323–2409. [Google Scholar] [CrossRef]
- Almufti, S.M.; Shaban, A.A.; Ali, Z.A.; Ali, R.I.; Fuente, J.D. Overview of metaheuristic algorithms. Polaris Glob. J. Sch. Res. Trends 2023, 2, 10–32. [Google Scholar] [CrossRef]
- Zhang, Y.; Jin, Z.; Mirjalili, S. Generalized normal distribution optimization and its applications in parameter extraction of photovoltaic models. Energy Convers. Manag. 2020, 224, 113301. [Google Scholar] [CrossRef]
- Montoya, O.D.; Garces, A.; Gil-Gonzalez, W. Three-phase power flow tool for electric distribution grids: A julia implementation for electrical engineering students. Ingeniería 2023, 28, 113301. [Google Scholar] [CrossRef]
- Xiao, Y.; Zhang, Y.; Kulturel-Konak, S.; Konak, A.; Xu, Y.; Zhou, S. The aperiodic facility layout problem with time-varying demands and an optimal master-slave solution approach. Int. J. Prod. Res. 2021, 59, 5216–5235. [Google Scholar] [CrossRef]
- Abualigah, L.; Altalhi, M. A novel generalized normal distribution arithmetic optimization algorithm for global optimization and data clustering problems. J. Ambient. Intell. Humaniz. Comput. 2024, 15, 389–417. [Google Scholar] [CrossRef]
- Abdel-Basset, M.; Mohamed, R.; El-Fergany, A.; Abouhawwash, M.; Askar, S. Parameters identification of PV triple-diode model using improved generalized normal distribution algorithm. Mathematics 2021, 9, 995. [Google Scholar] [CrossRef]
- Liang, H.; Zhao, J. A New Method of Continuous Power Flow for Voltage Stability Analysis. In Proceedings of the 2021 IEEE Asia-Pacific Conference on Image Processing, Electronics and Computers (IPEC), Dalian, China, 14–16 April 2021; pp. 337–340. [Google Scholar] [CrossRef]
- Cortés-Caicedo, B.; Avellaneda-Gómez, L.S.; Montoya, O.D.; Alvarado-Barrios, L.; Chamorro, H.R. Application of the vortex search algorithm to the phase-balancing problem in distribution systems. Energies 2021, 14, 1282. [Google Scholar] [CrossRef]
- Cortés-Caicedo, B.; Grisales-Noreña, L.F.; Montoya, O.D.; Rodriguez-Cabal, M.A.; Rosero, J.A. Energy management system for the optimal operation of pv generators in distribution systems using the antlion optimizer: A colombian urban and rural case study. Sustainability 2022, 14, 16083. [Google Scholar] [CrossRef]
- Chu, P.C.; Beasley, J.E. A genetic algorithm for the generalised assignment problem. Comput. Oper. Res. 1997, 24, 17–23. [Google Scholar] [CrossRef]
- Doğan, B.; Ölmez, T. A new metaheuristic for numerical function optimization: Vortex Search algorithm. Inf. Sci. 2015, 293, 125–145. [Google Scholar] [CrossRef]
- Kennedy, J.; Eberhart, R. Particle swarm optimization. In Proceedings of the ICNN’95-International Conference on Neural Networks, Perth, WA, Australia, 27 November–1 December 1995; Volume 4, pp. 1942–1948. [Google Scholar] [CrossRef]
- Kazikova, A.; Pluhacek, M.; Senkerik, R. Why tuning the control parameters of metaheuristic algorithms is so important for fair comparison? In Proceedings of the Mendel, Online, 21 December 2020; Volume 26, pp. 9–16. [Google Scholar] [CrossRef]
- Huang, C.; Li, Y.; Yao, X. A survey of automatic parameter tuning methods for metaheuristics. IEEE Trans. Evol. Comput. 2019, 24, 201–216. [Google Scholar] [CrossRef]
- Rahayu, E.S.; Ma’arif, A.; Cakan, A. Particle swarm optimization (PSO) tuning of PID control on DC motor. Int. J. Robot. Control Syst. 2022, 2, 435–447. [Google Scholar] [CrossRef]
- Papazoglou, G.; Biskas, P. Review and comparison of genetic algorithm and particle swarm optimization in the optimal power flow problem. Energies 2023, 16, 1152. [Google Scholar] [CrossRef]
- Verdejo, H.; Pino, V.; Kliemann, W.; Becker, C.; Delpiano, J. Implementation of particle swarm optimization (PSO) algorithm for tuning of power system stabilizers in multimachine electric power systems. Energies 2020, 13, 2093. [Google Scholar] [CrossRef]
- Fotopoulou, M.; Tsekouras, G.J.; Vlachos, A.; Rakopoulos, D.; Chatzigeorgiou, I.M.; Kanellos, F.D.; Kontargyri, V. Day Ahead Operation Cost Optimization for Energy Communities. Energies 2025, 18, 1101. [Google Scholar] [CrossRef]
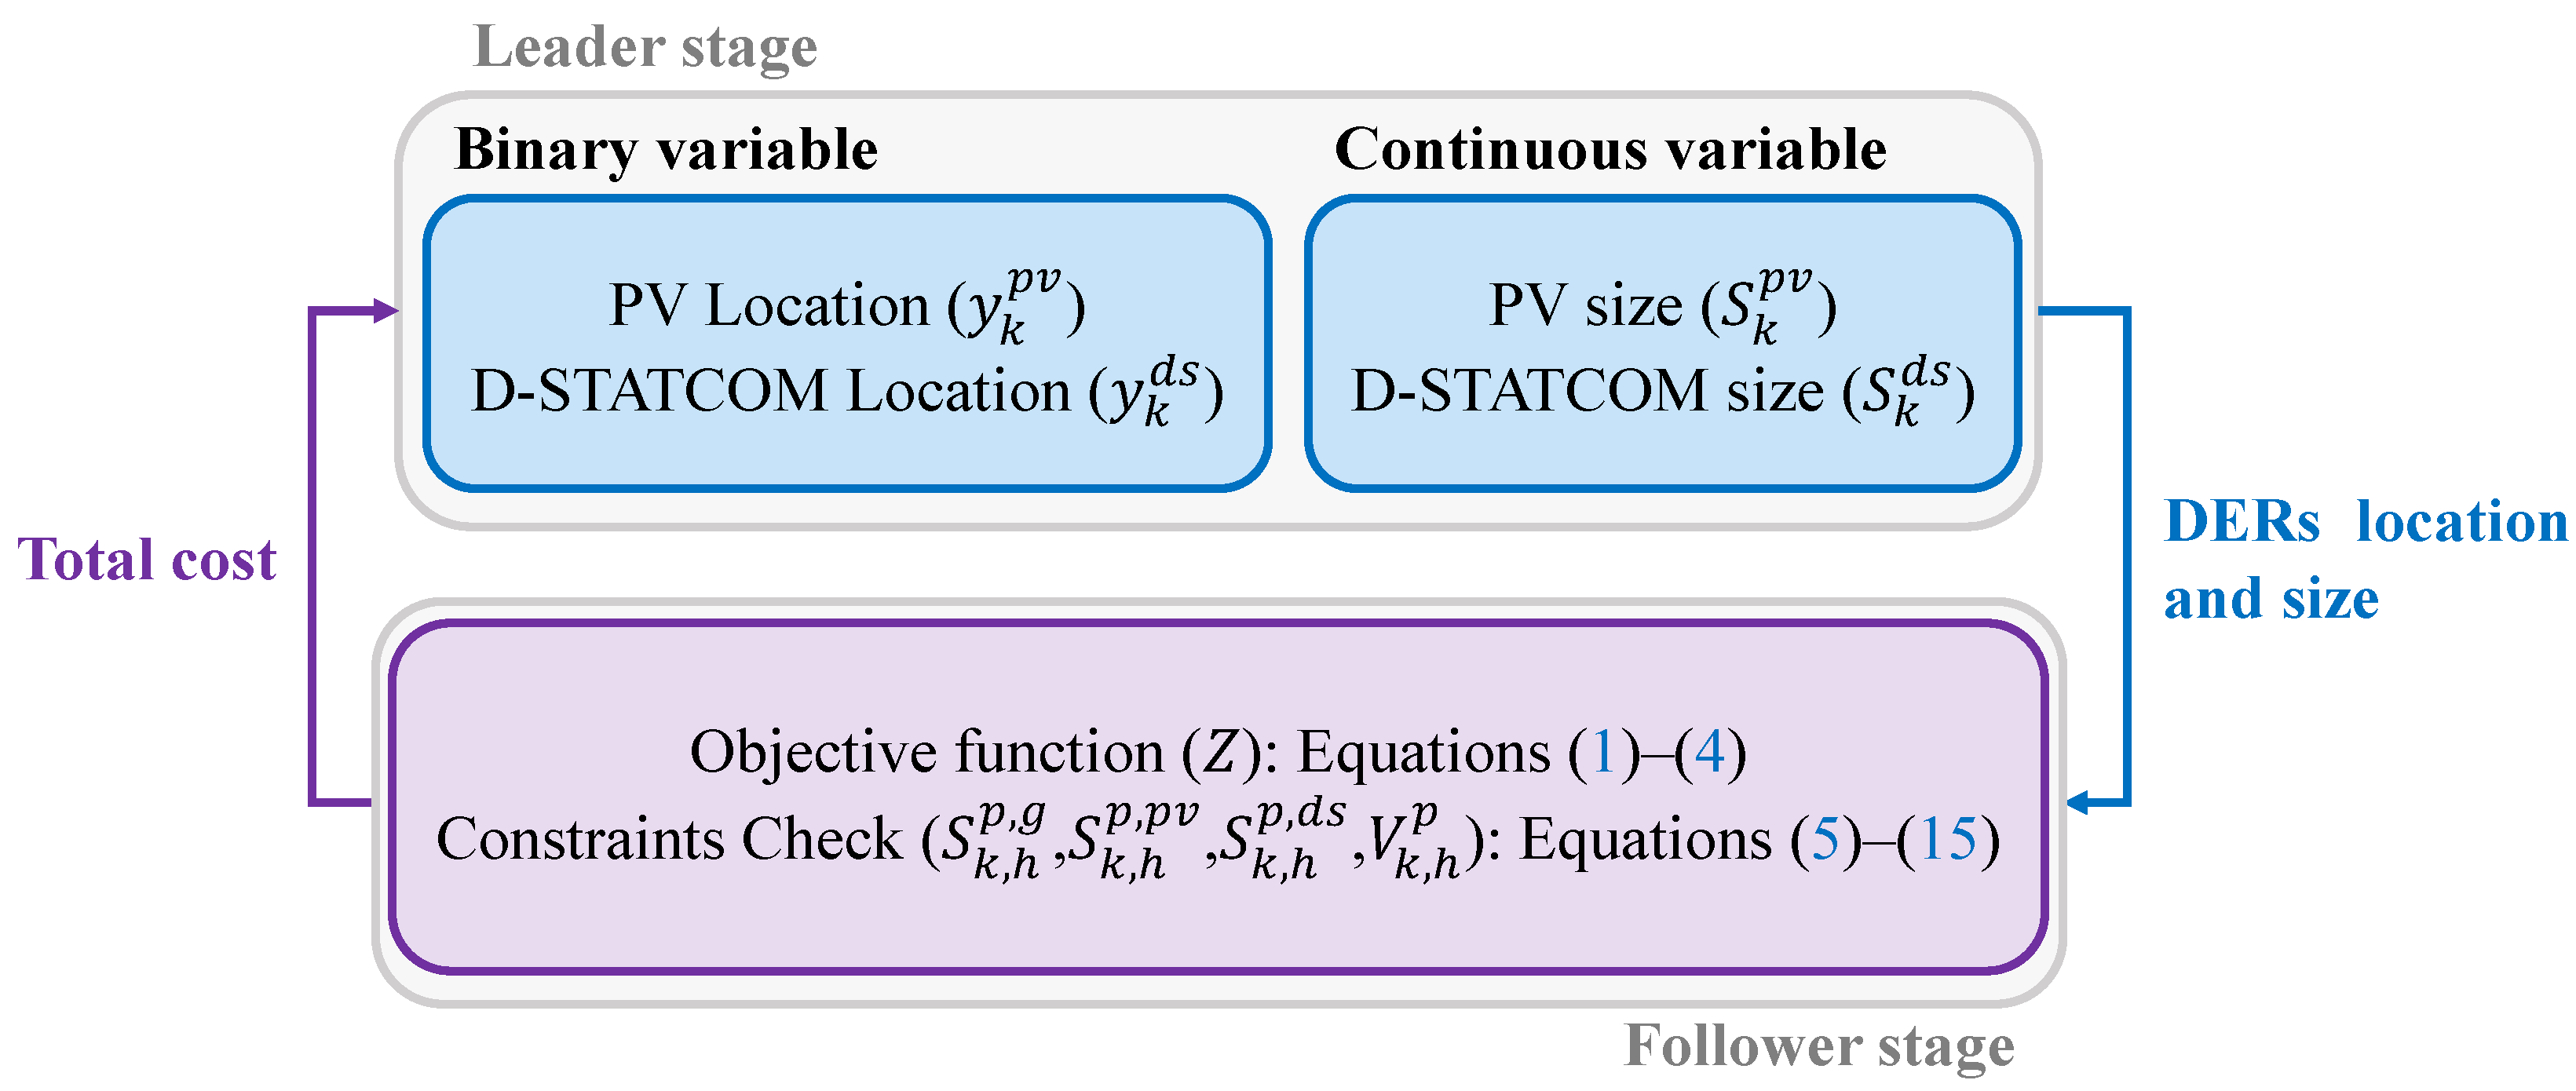
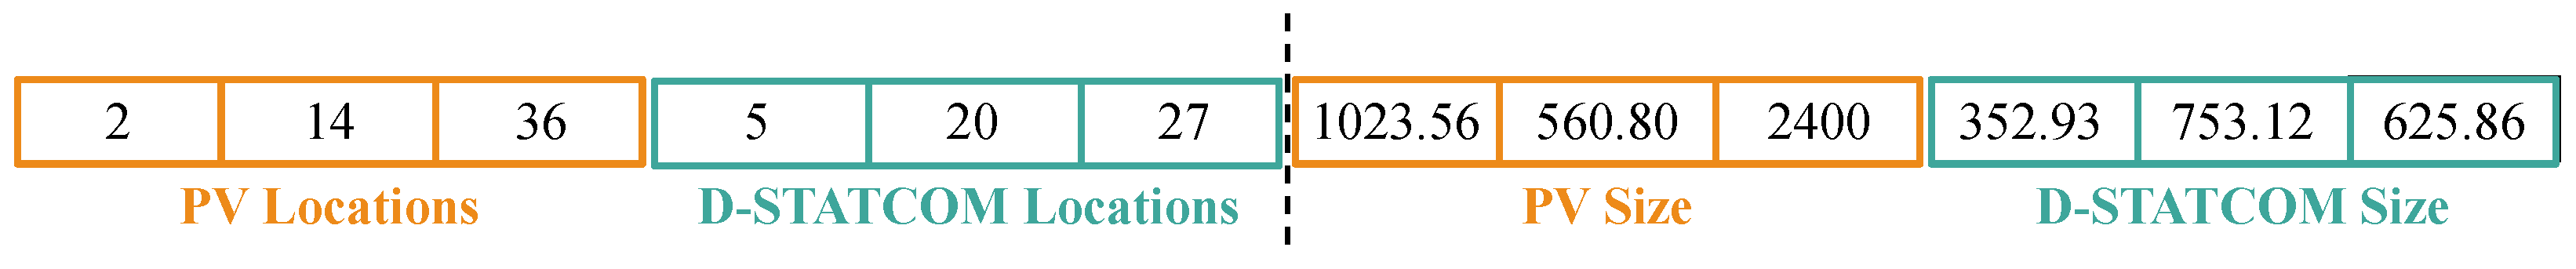
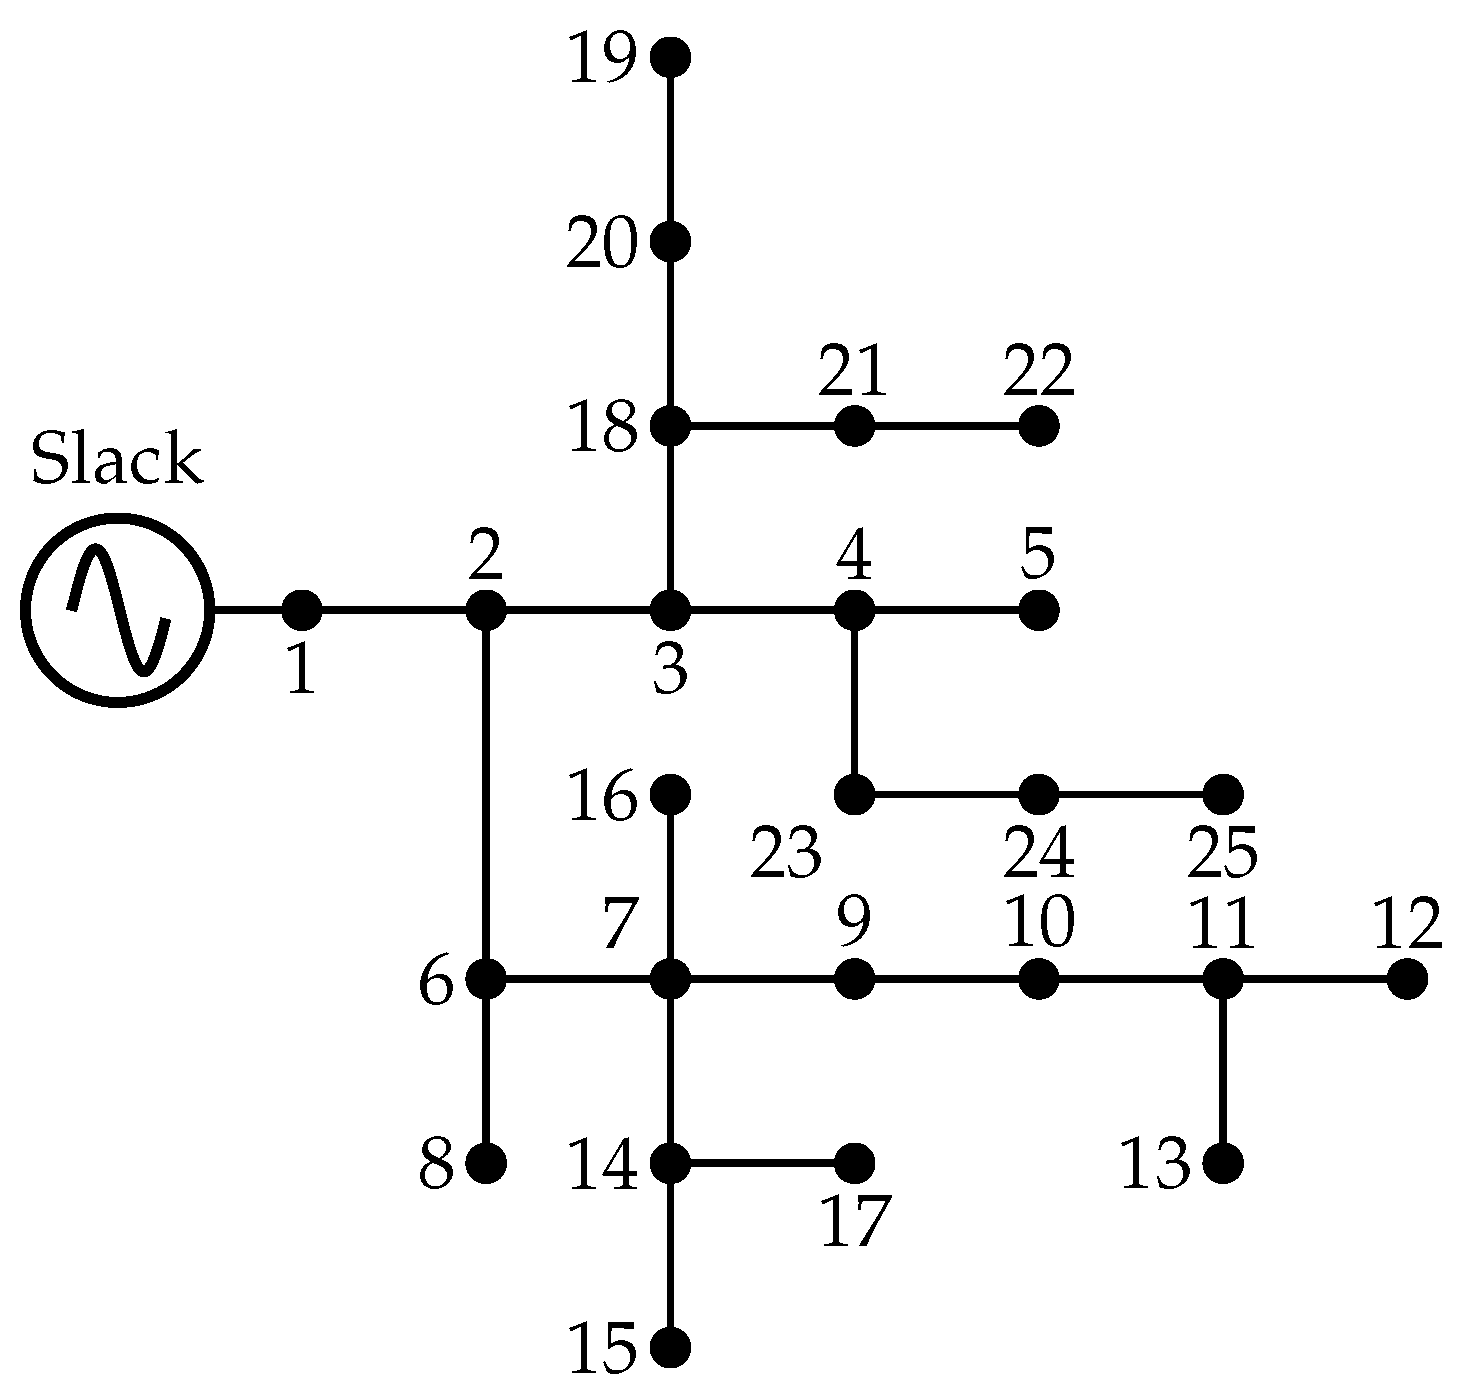
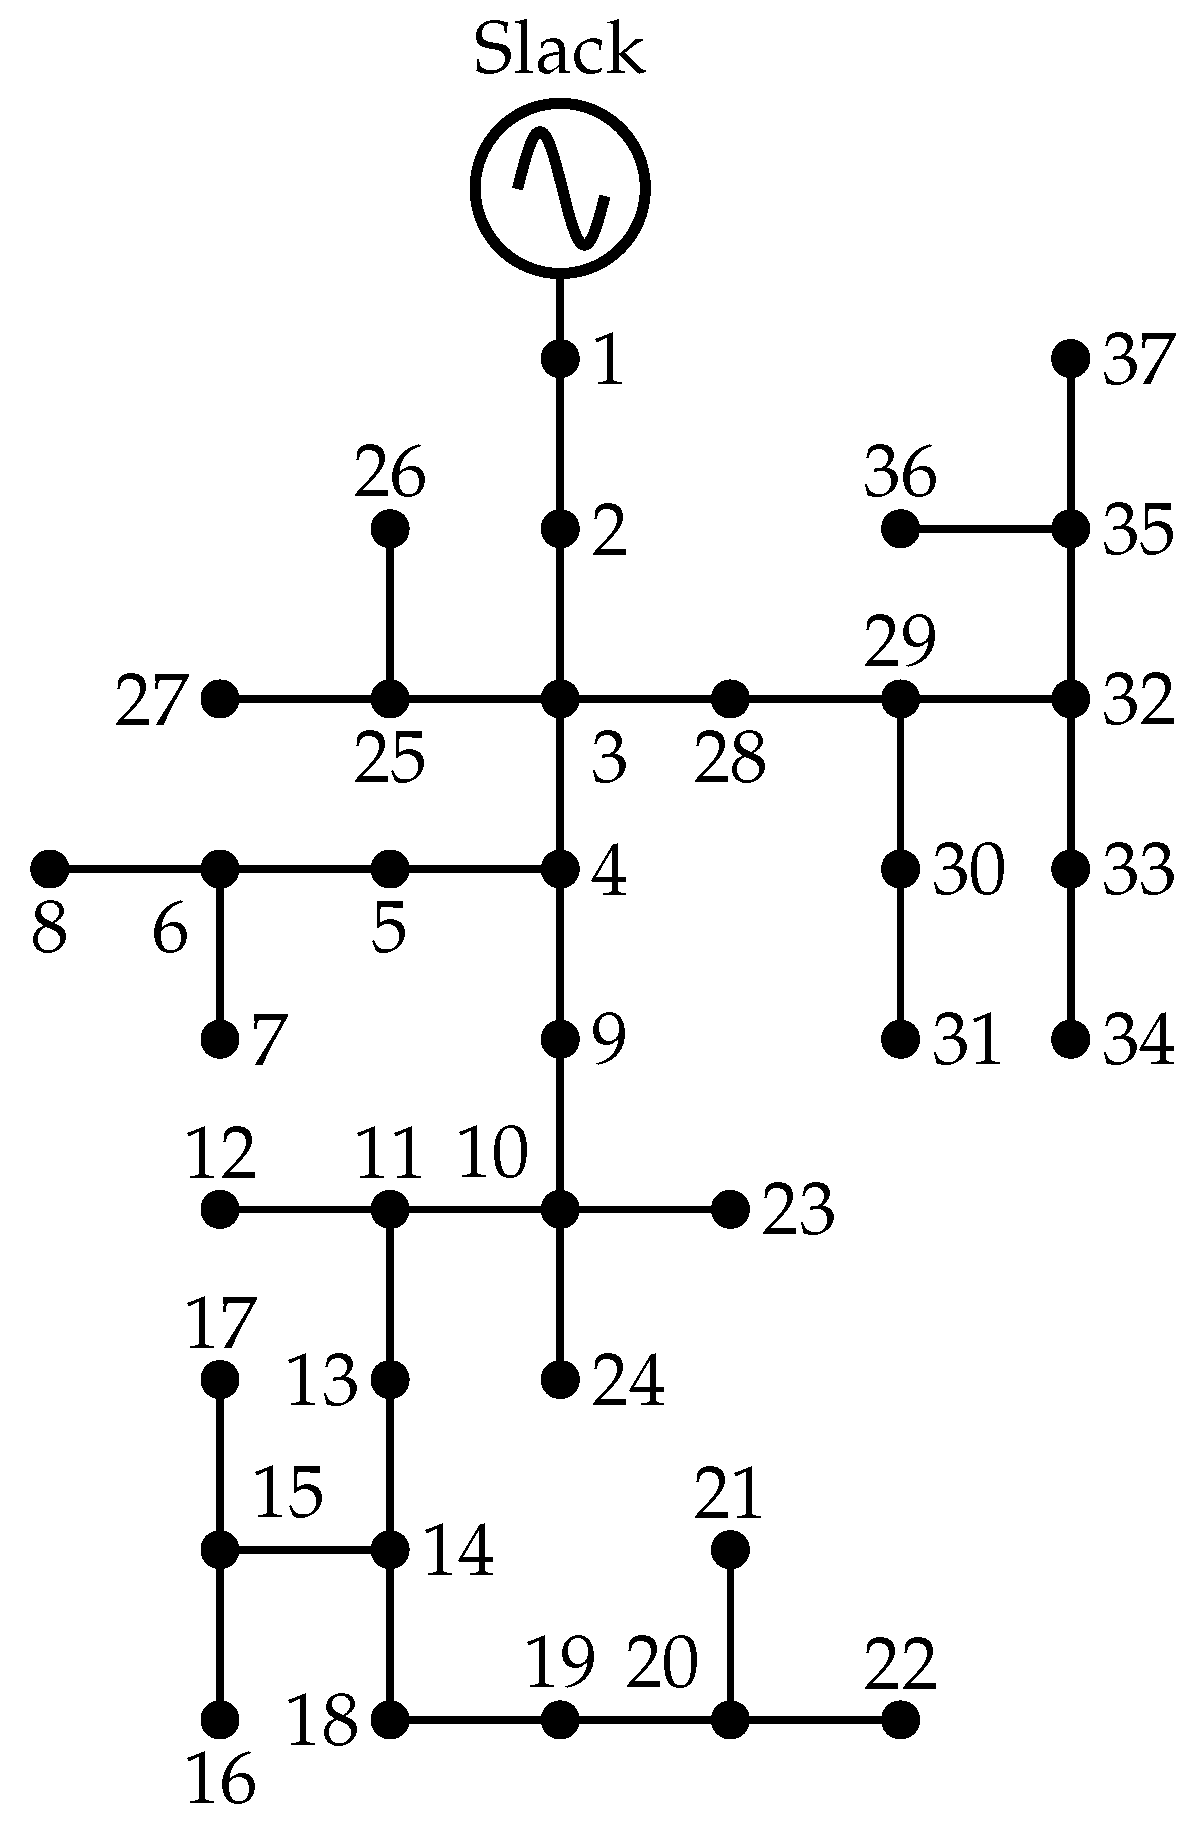
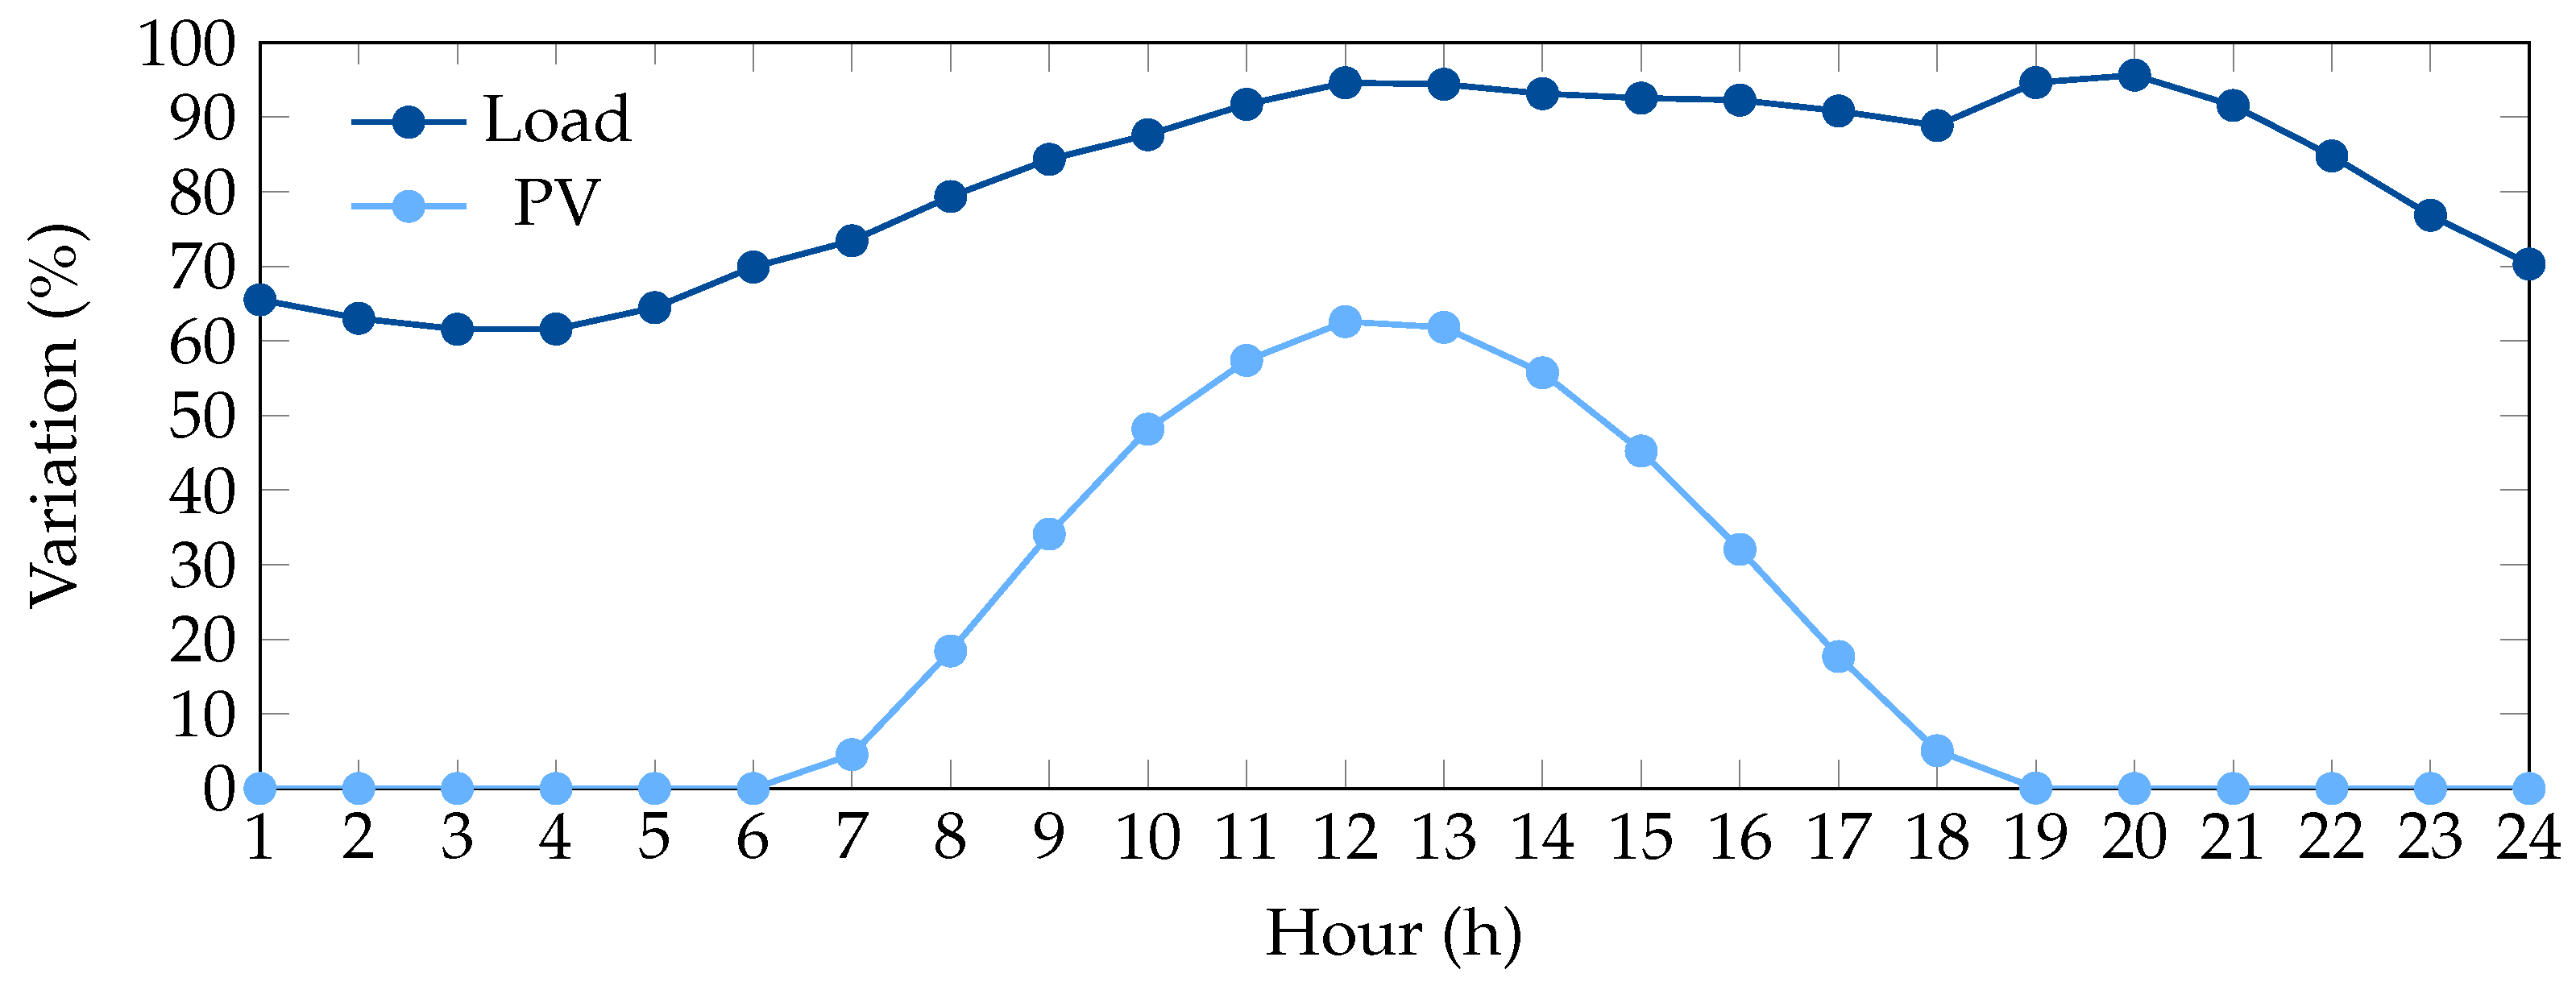
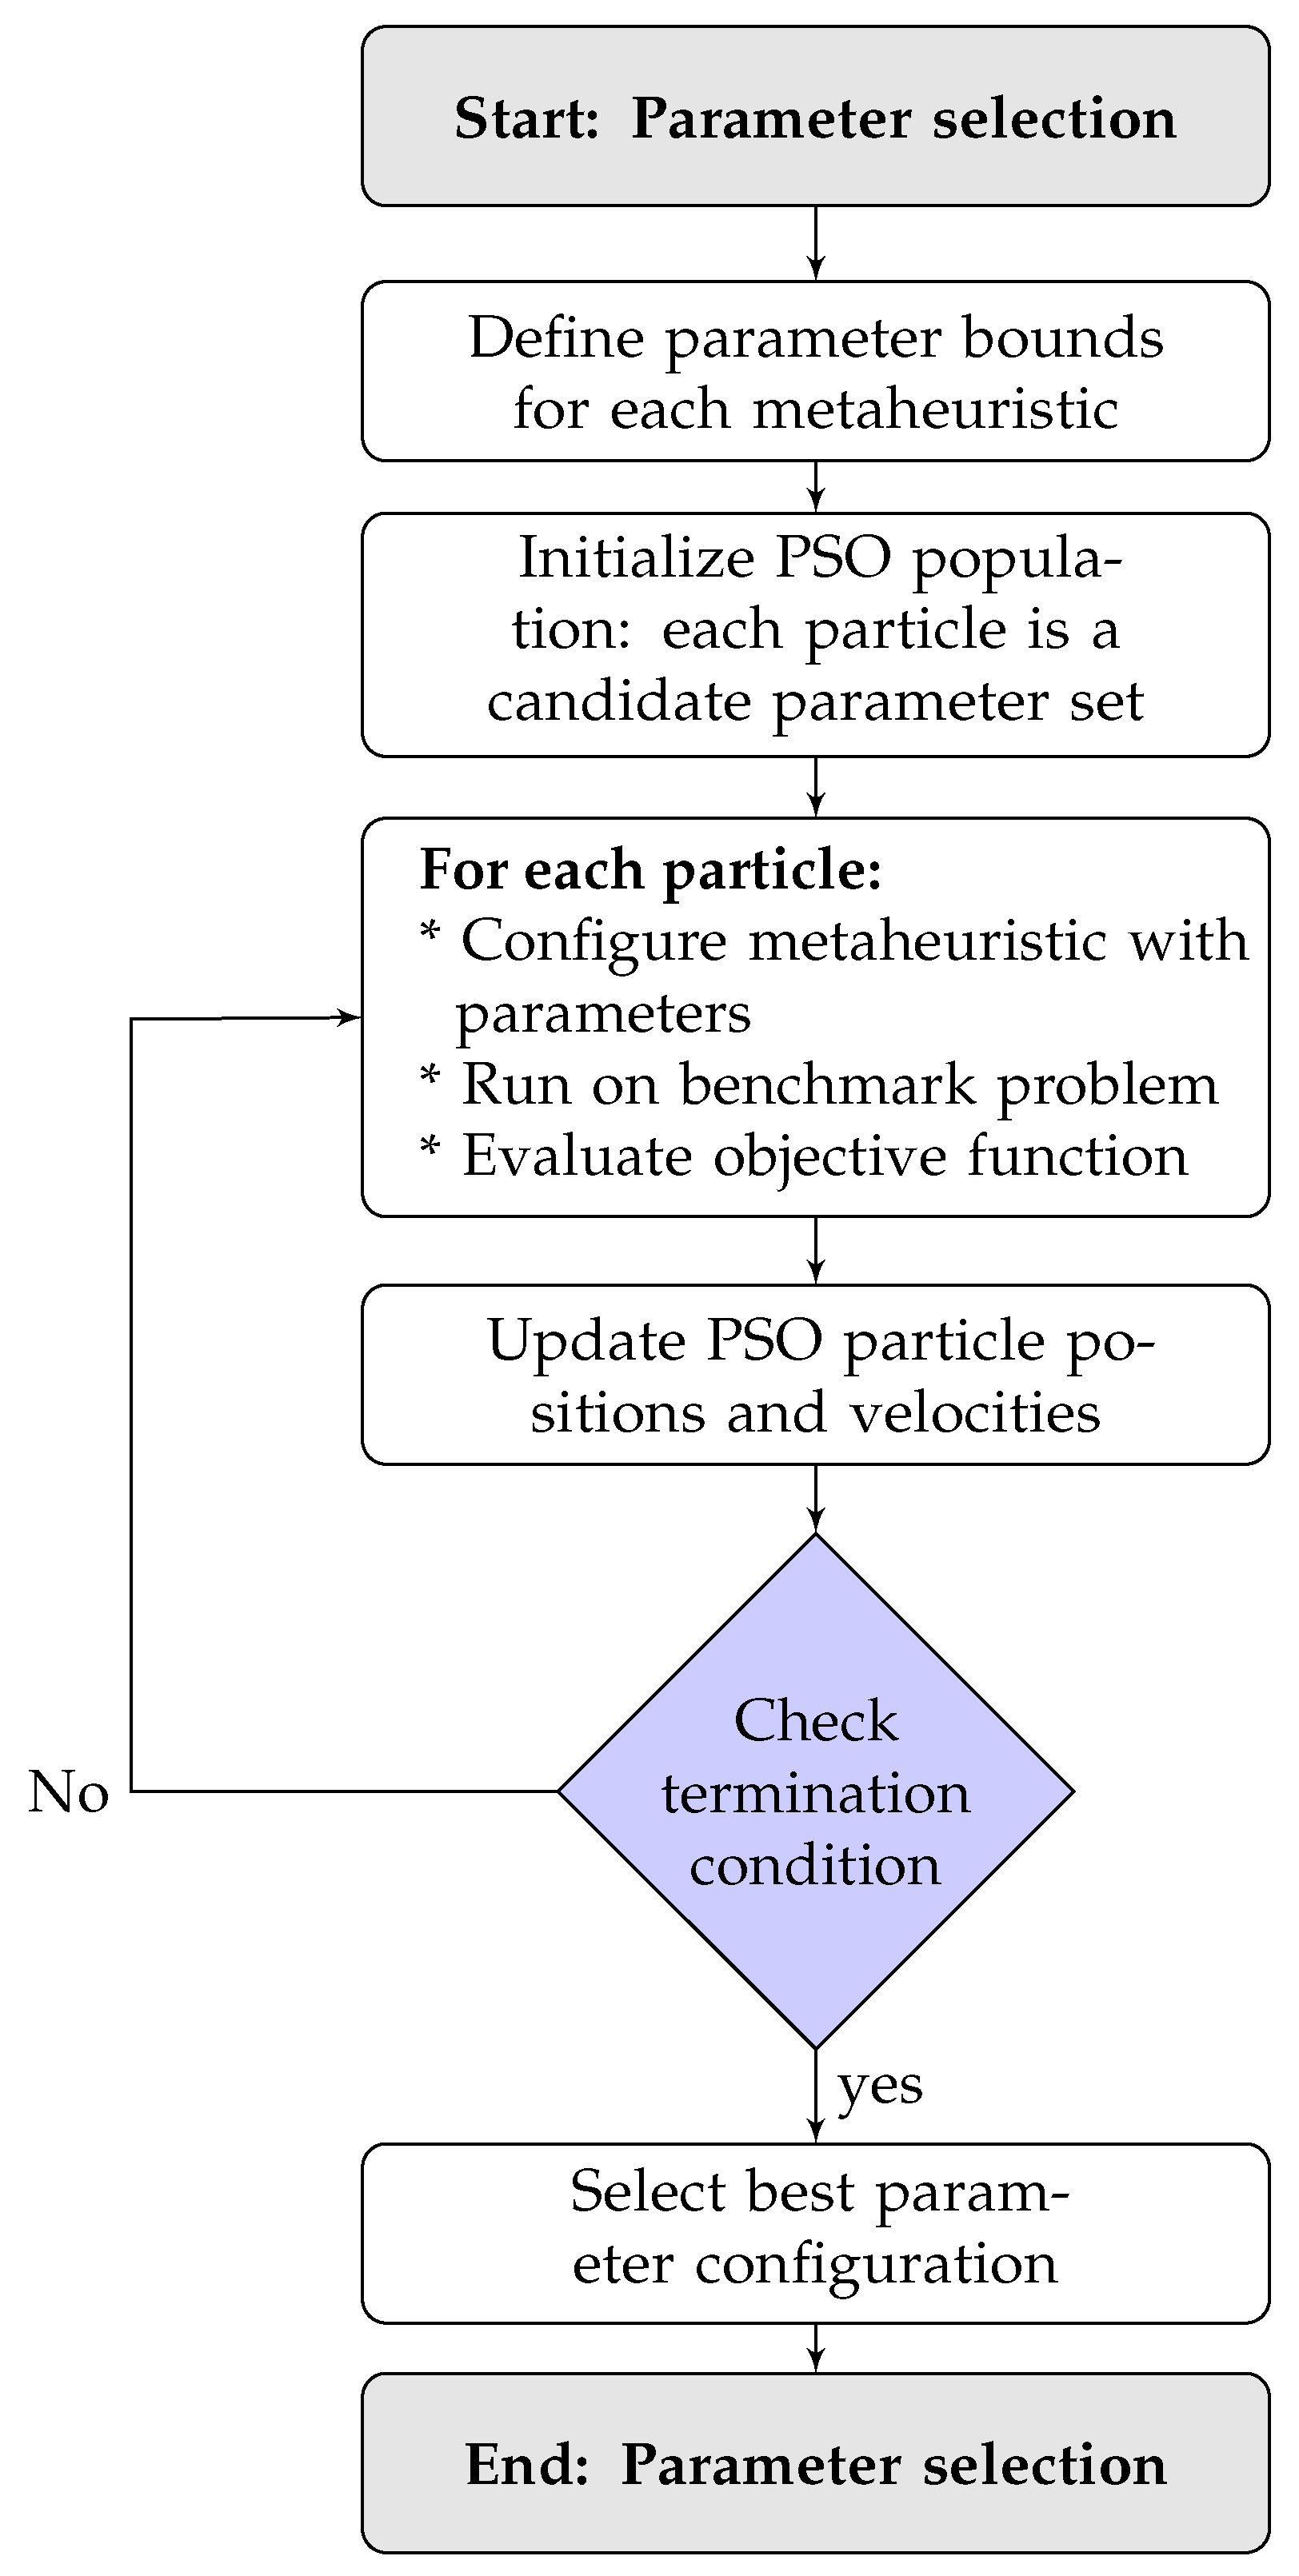
Disclaimer/Publisher’s Note: The statements, opinions and data contained in all publications are solely those of the individual author(s) and contributor(s) and not of MDPI and/or the editor(s). MDPI and/or the editor(s) disclaim responsibility for any injury to people or property resulting from any ideas, methods, instructions or products referred to in the content. |
© 2025 by the authors. Licensee MDPI, Basel, Switzerland. This article is an open access article distributed under the terms and conditions of the Creative Commons Attribution (CC BY) license (https://creativecommons.org/licenses/by/4.0/).