1. Introduction
Concrete is among the most widely utilized construction materials globally, valued for its versatility, durability, and cost-effectiveness [
1]. Its mechanical properties, including compressive strength, tensile strength, and elasticity, are essential for maintaining the structural integrity and longevity of buildings and infrastructure. The incorporation of crumb rubber, stainless steel fibers, and variations in temperature significantly influences the mechanical properties of concrete [
2,
3,
4,
5]. Using crumb rubber as a partial substitute for coarse aggregates leads to a reduction in the density and compressive strength due to its lower stiffness and weaker bonding with the cement matrix [
3]. However, it enhances flexibility. It also improves energy absorption and impact resistance. These properties make it advantageous for applications that require better ductility and resilience.
On the other hand, adding stainless steel fibers increases the tensile strength, the flexural strength, and the toughness of concrete [
3]. These fibers effectively bridge microcracks, slow down crack propagation, and improve post-crack performance, resulting in increased durability under dynamic and high-stress conditions [
4]. Temperature fluctuations can also have a significant impact on the mechanical properties of concrete. Elevated temperatures can diminish the compressive strength and stiffness due to the dehydration of cement hydrates and the thermal expansion of aggregates [
5]. Conversely, extremely low temperatures can increase brittleness. This reduces ductility and fracture resistance. Therefore, appropriate mix design and material selection are crucial. They help mitigate these effects. Overall, it is vital to carefully consider the combined impact of these factors to optimize concrete performance for specific applications.
Accurate forecasting of mechanical properties is vital for optimizing concrete mix designs and satisfying engineering specifications. Nonetheless, the diverse and heterogeneous composition of concrete, along with the numerous factors influencing its performance, complicates the prediction of these properties [
6,
7]. Optimization techniques have become essential tools for improving the predictive precision of mathematical and computational models in various domains, including materials science and construction engineering [
7]. Among these techniques, logarithmic transformations are crucial for enhancing predictive models by addressing the non-linear interactions between variables [
8]. By employing logarithmic functions, it becomes possible to linearize intricate data patterns, to enhance regression models, and to reduce prediction inaccuracies. Optimization strategies have been applied to explore the significant correlations between various factors and the mechanical characteristics of concrete through response surface methodology (RSM) and fuzzy logic [
9]. These strategies have enabled the identification of the optimal maximum strength for replacing coarse and fine recycled aggregates. This contributes to decreased material waste. It also leads to reduced energy consumption and lower production costs. An optimization strategy based on response surface methodology (RSM) was implemented to identify the ideal mix design for high-performance concrete incorporating steel slag as a substitute for coarse aggregate [
10]. The effective R² threshold of artificial neural networks (ANN) during training, testing, and validation indicates that the ANN model effectively captured the variability of the data. The experimental outcomes, which encompass compressive strength, splitting tensile strength, and flexural strength, were utilized to formulate these optimization models.
Employing three artificial intelligence approaches—artificial neural networks (ANN), adaptive neuro-fuzzy inference system (ANFIS), and gene expression programming (GEP)—this research aimed to enhance the predictive accuracy of the mechanical properties of geopolymer concrete based on experimental datasets [
11]. The study optimized mix designs by varying ratios of banana peel ash (BPA) and sugarcane bagasse ash (SCBA). It also adjusted alkaline activator molarity and aggregate-to-binder ratios. This approach helped identify combinations that substantially improve mechanical properties. This work holds significant global relevance as it contributes to sustainable construction practices by effectively utilizing industrial by-products. The key properties of ultra-high-performance concrete (UHPC), such as its compressive and flexural strengths, workability, and shrinkage behavior, were estimated through the application of machine learning techniques [
12]. The XGBoost algorithm demonstrated superior performance in predicting these properties, achieving a mean absolute percentage error (MAPE) of less than 5% and an R
2 value exceeding 0.9 across four output properties. Multi-objective optimization for the mechanical properties and workability of recycled self-consolidating mortar (RSCM) containing silica fume (SF) was conducted using the Taguchi design method (TDM). This approach examined four primary variables—cement content, water-cement ratio, SF content, and superplasticizer content—across three different levels [
13]. The findings indicated that TDM effectively predicts the workability and compressive strength of RSCM.
A comparative study of individual and ensemble learning algorithms (ELAs) was performed to predict the compressive strength (CS) and flexural strength (FS) of plastic concrete [
14]. Base learners included multilayer perceptron neural networks (MLPNN), support vector machines (SVM), random forests (RF), and decision trees (DT). These learners were subsequently enhanced using bagging and AdaBoost techniques.
Additionally, GEP was utilized to create computational equations for predicting the CS and FS of plastic concrete. To enhance the mechanical performance of composite concrete incorporating crumb rubber, response surface methodology (RSM) and a hybrid deep neural network-horse herd optimization (DNN-HHO) approach were employed [
15]. The RSM model exhibited strong regression capabilities and a significant fit. A comparison of actual versus predicted values showed that all points closely aligned with the fitted line, highlighting the superior predictive performance of the proposed DNN-HHO model in relation to RSM. Machine learning (ML) techniques, including one individual algorithm (decision tree) and two ensemble algorithms (AdaBoost regressor and bagging regressor), were applied to estimate the wear depth of fly-ash-based concrete [
7]. The efficiency of the models was evaluated using multiple statistical metrics. The bagging regressor (BR) model outperformed both the AdaBoost regressor and the decision tree. This article predicts the compressive strength (CS) of concrete. It also predicts the splitting tensile strength (STS) of concrete. Both predictions involve concrete incorporating recycled concrete aggregates (RCA). The article uses decision tree (DT) and AdaBoost machine learning (ML) techniques [
16]. Experimental data points with nine input variables (water, cement, fine aggregate, natural coarse aggregate, RCA, superplasticizers, RCA water absorption, maximum size of RCA, and RCA density) were utilized to execute the models. The data were validated through k-fold cross-validation along with metrics such as the coefficient of determination (R2), the mean square error (MSE), the mean absolute error (MAE), and the root mean square error (RMSE).
While both algorithms have their respective advantages and limitations, the Whale Optimization Algorithm (WOA) presents several clear benefits over the Genetic Algorithm (GA). A notable advantage of the WOA is its simplicity, as it requires minimal user-defined parameters. In contrast to the GA, which demands configuring multiple parameters like population size, mutation rate, and crossover probability, the WOA simplifies this process by needing only the initial population and the maximum iteration count. This streamlined approach enhances its usability, making it especially appealing to newcomers in the field [
17]. Another significant benefit of the WOA is its accelerated convergence speed. Compared to the GA, the WOA achieves optimal solutions in fewer iterations, thanks to its efficient search strategy that enhances the exploration of the search space. This improved efficiency results in quicker convergence and better performance. Consequently, the WOA provides a time-saving advantage by achieving optimal solutions more rapidly. Additionally, the WOA demonstrates a reduced likelihood of getting stuck in local optima—points in the search space where the algorithm halts without finding superior solutions. The WOA tackles this issue by integrating strategies that promote thorough exploration of the search space. This mechanism minimizes confinement to local optima, enabling the algorithm to discover global optima more effectively. As a result, the WOA delivers more reliable and efficient solutions [
17]. The aim of this study is to formulate a comprehensive equation that accurately describes the relationship between stress (σ) and strain (ε) in concrete under varying conditions. By integrating critical parameters identified in prior research, the study seeks to improve and optimize the predictive capabilities of stress–strain behavior in concrete materials, particularly those incorporating crumb rubber and stainless-steel fibers in varying temperature scenarios. The initial phase involved assessing three existing stress–strain formulas, which served as a foundational basis for optimization. By utilizing both the Genetic Algorithm (GA) and the Whale Optimization Algorithm (WOA), an optimal equation was derived that effectively simulates the stress–strain relationship while considering temperature variations and material inclusions.
3. Optimization Algorithms
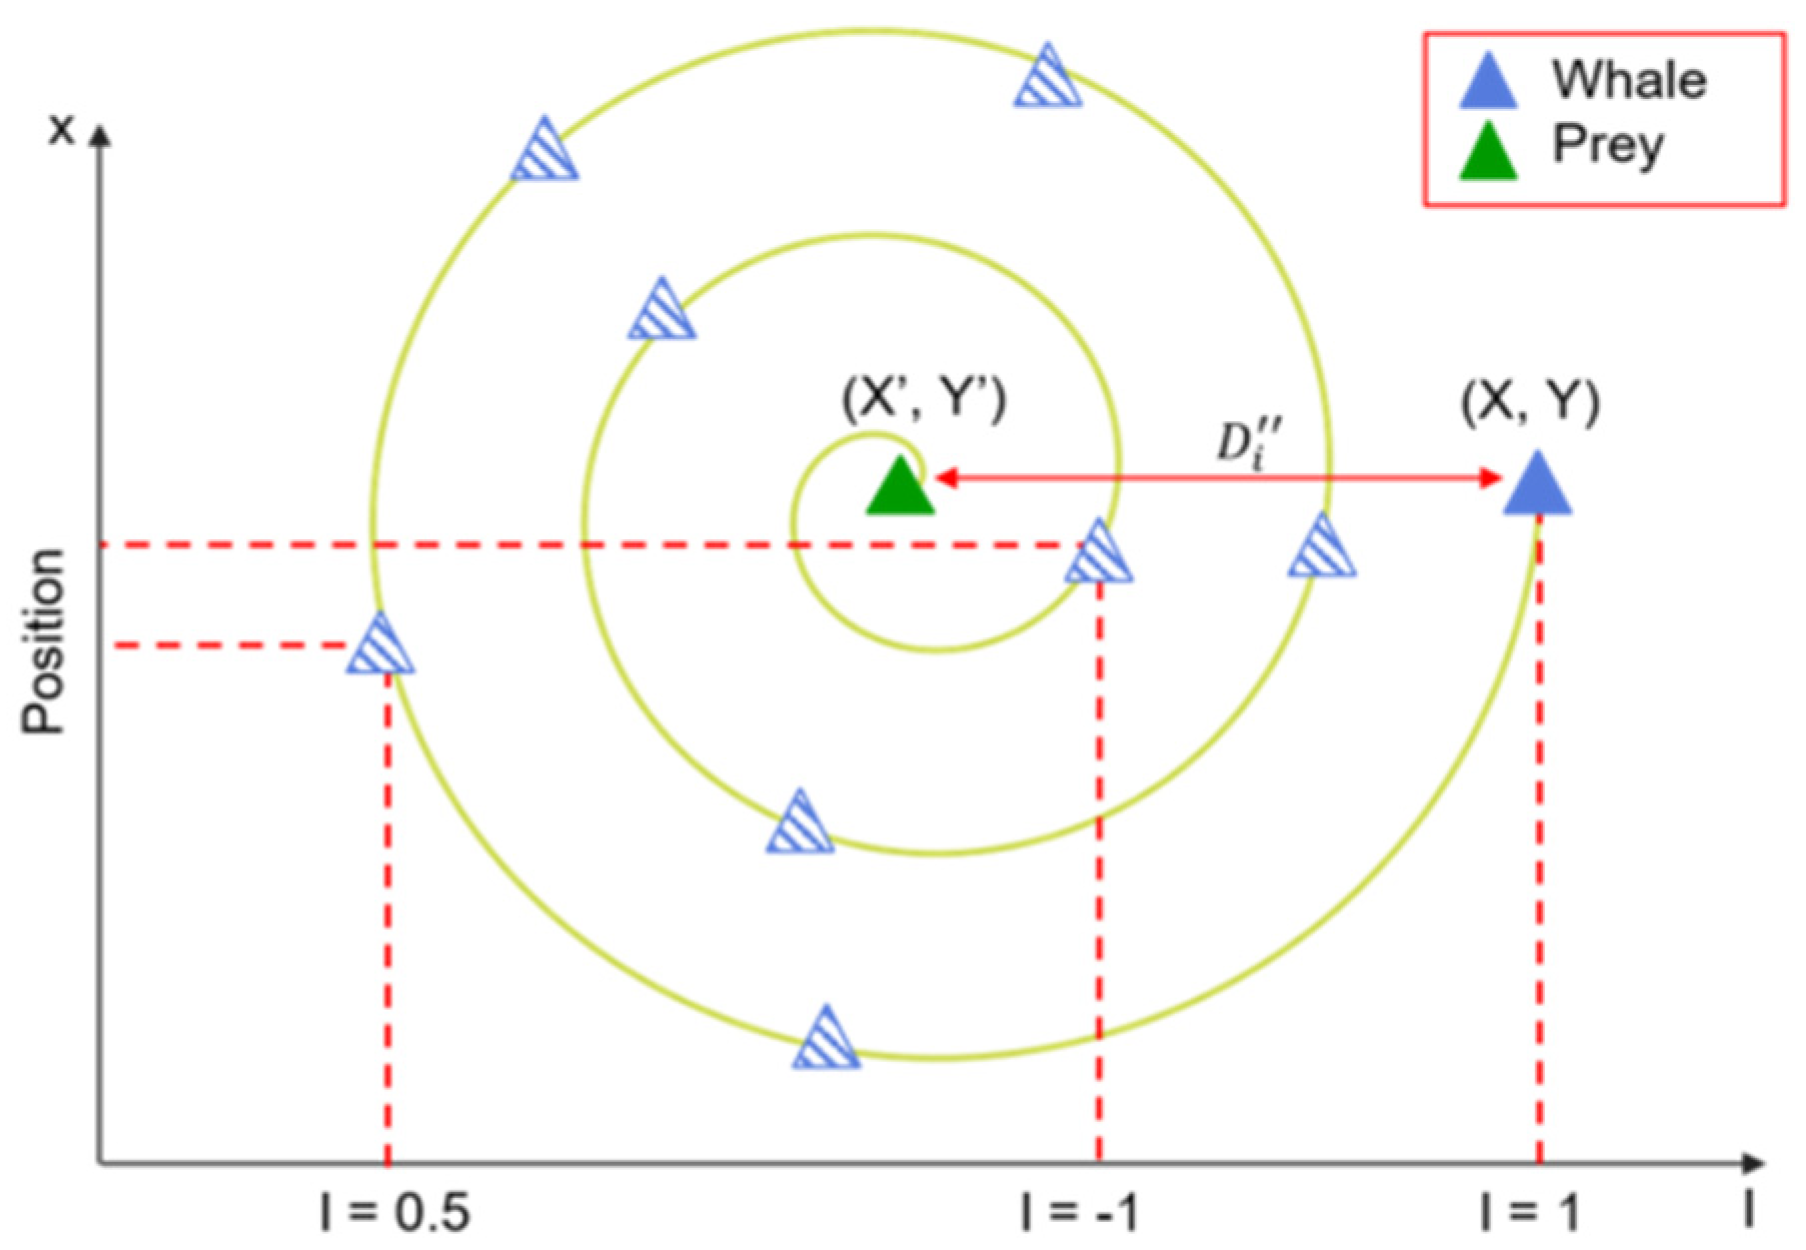
The WOA used in this study is derived from the remarkable bubble-net foraging behavior of humpback whales [
23]. These whales are recognized for their distinctive feeding strategy, which involves encircling and preying on schools of fish in the water environment. This unique technique involves whales swimming in a spiral pattern around their target fish, instantaneously generating a bubble net to encircle and trap them.
During this foraging process, humpback whales exhibit a captivating behavior by guiding the fish along a spiral trajectory toward the water’s surface. Subsequently, the whales slowly decrease the radius, effectively encircling the fish school. When the fish are driven near the water’s surface, the prey is finally captured by the final strike of the humpback whales. The WOA replicates the unique hunting strategy of humpback whales through three key phases: encircling the prey, executing bubble-net attacks, and looking for prey. These phases align with the behaviors exhibited by them throughout the bubble-net hunting process. By mimicking this spiral-based optimization process, the WOA efficiently captures the mechanical properties of concrete under study.
Within the WOA, whales traverse a number of variables under consideration (n). A potential solution composed of n variables is represented by each whale. The algorithm’s goal is to iteratively update the position of each solution to identify the global optimum within this search space using Equation (1).
where t denotes the iteration under consideration,
characterizes the optimum solution position vector of the prey identified thus far,
is the probable position vector of the prey, · denotes an element-wise multiplication, and ∣ ∣ signifies the absolute value. Furthermore,
and
are computed and adjusted for each dimension at every iteration to represent the coefficient vectors, as illustrated by Equations (2) and (3):
where
experiences a rectilinear reduction from 2 to 0 over the course of the iteration progression, resulting in different values between 0 and 1 for each
which denotes a random dimensioned vector.
Equation (1) guides the trend of iterations toward regions near the prey. By incorporating random values, the equation generates a trend outline resembling a hyper-rectangular trajectory around a school of fish, as shown in
Figure 1.
Equation (4) represents the mathematical spiral motion of the whales in the WOA:
where the variable
denotes the distance among the t-th whale and the prey, which can be understood as the best solution identified up to that point. The constant ‘b’ is utilized to determine the shape of the logarithmic spiral. The operator ‘.’ signifies element-by-element multiplication, and ‘l’ denotes a random number that falls within the range of −1 to 1.
Figure 2 illustrates how the spiral motion affects whale movement. This spiral pattern plays a significant role in determining both the trajectory and direction of the whales during the optimization process.
The WOA algorithm simulates the spiral movement and encirclement of prey using the subsequent equation:
where the symbol ‘p’ denotes a randomly generated value between zero and one. By integrating this equation, each value in every dimension and each iteration has a 50% chance of being updated in its position.
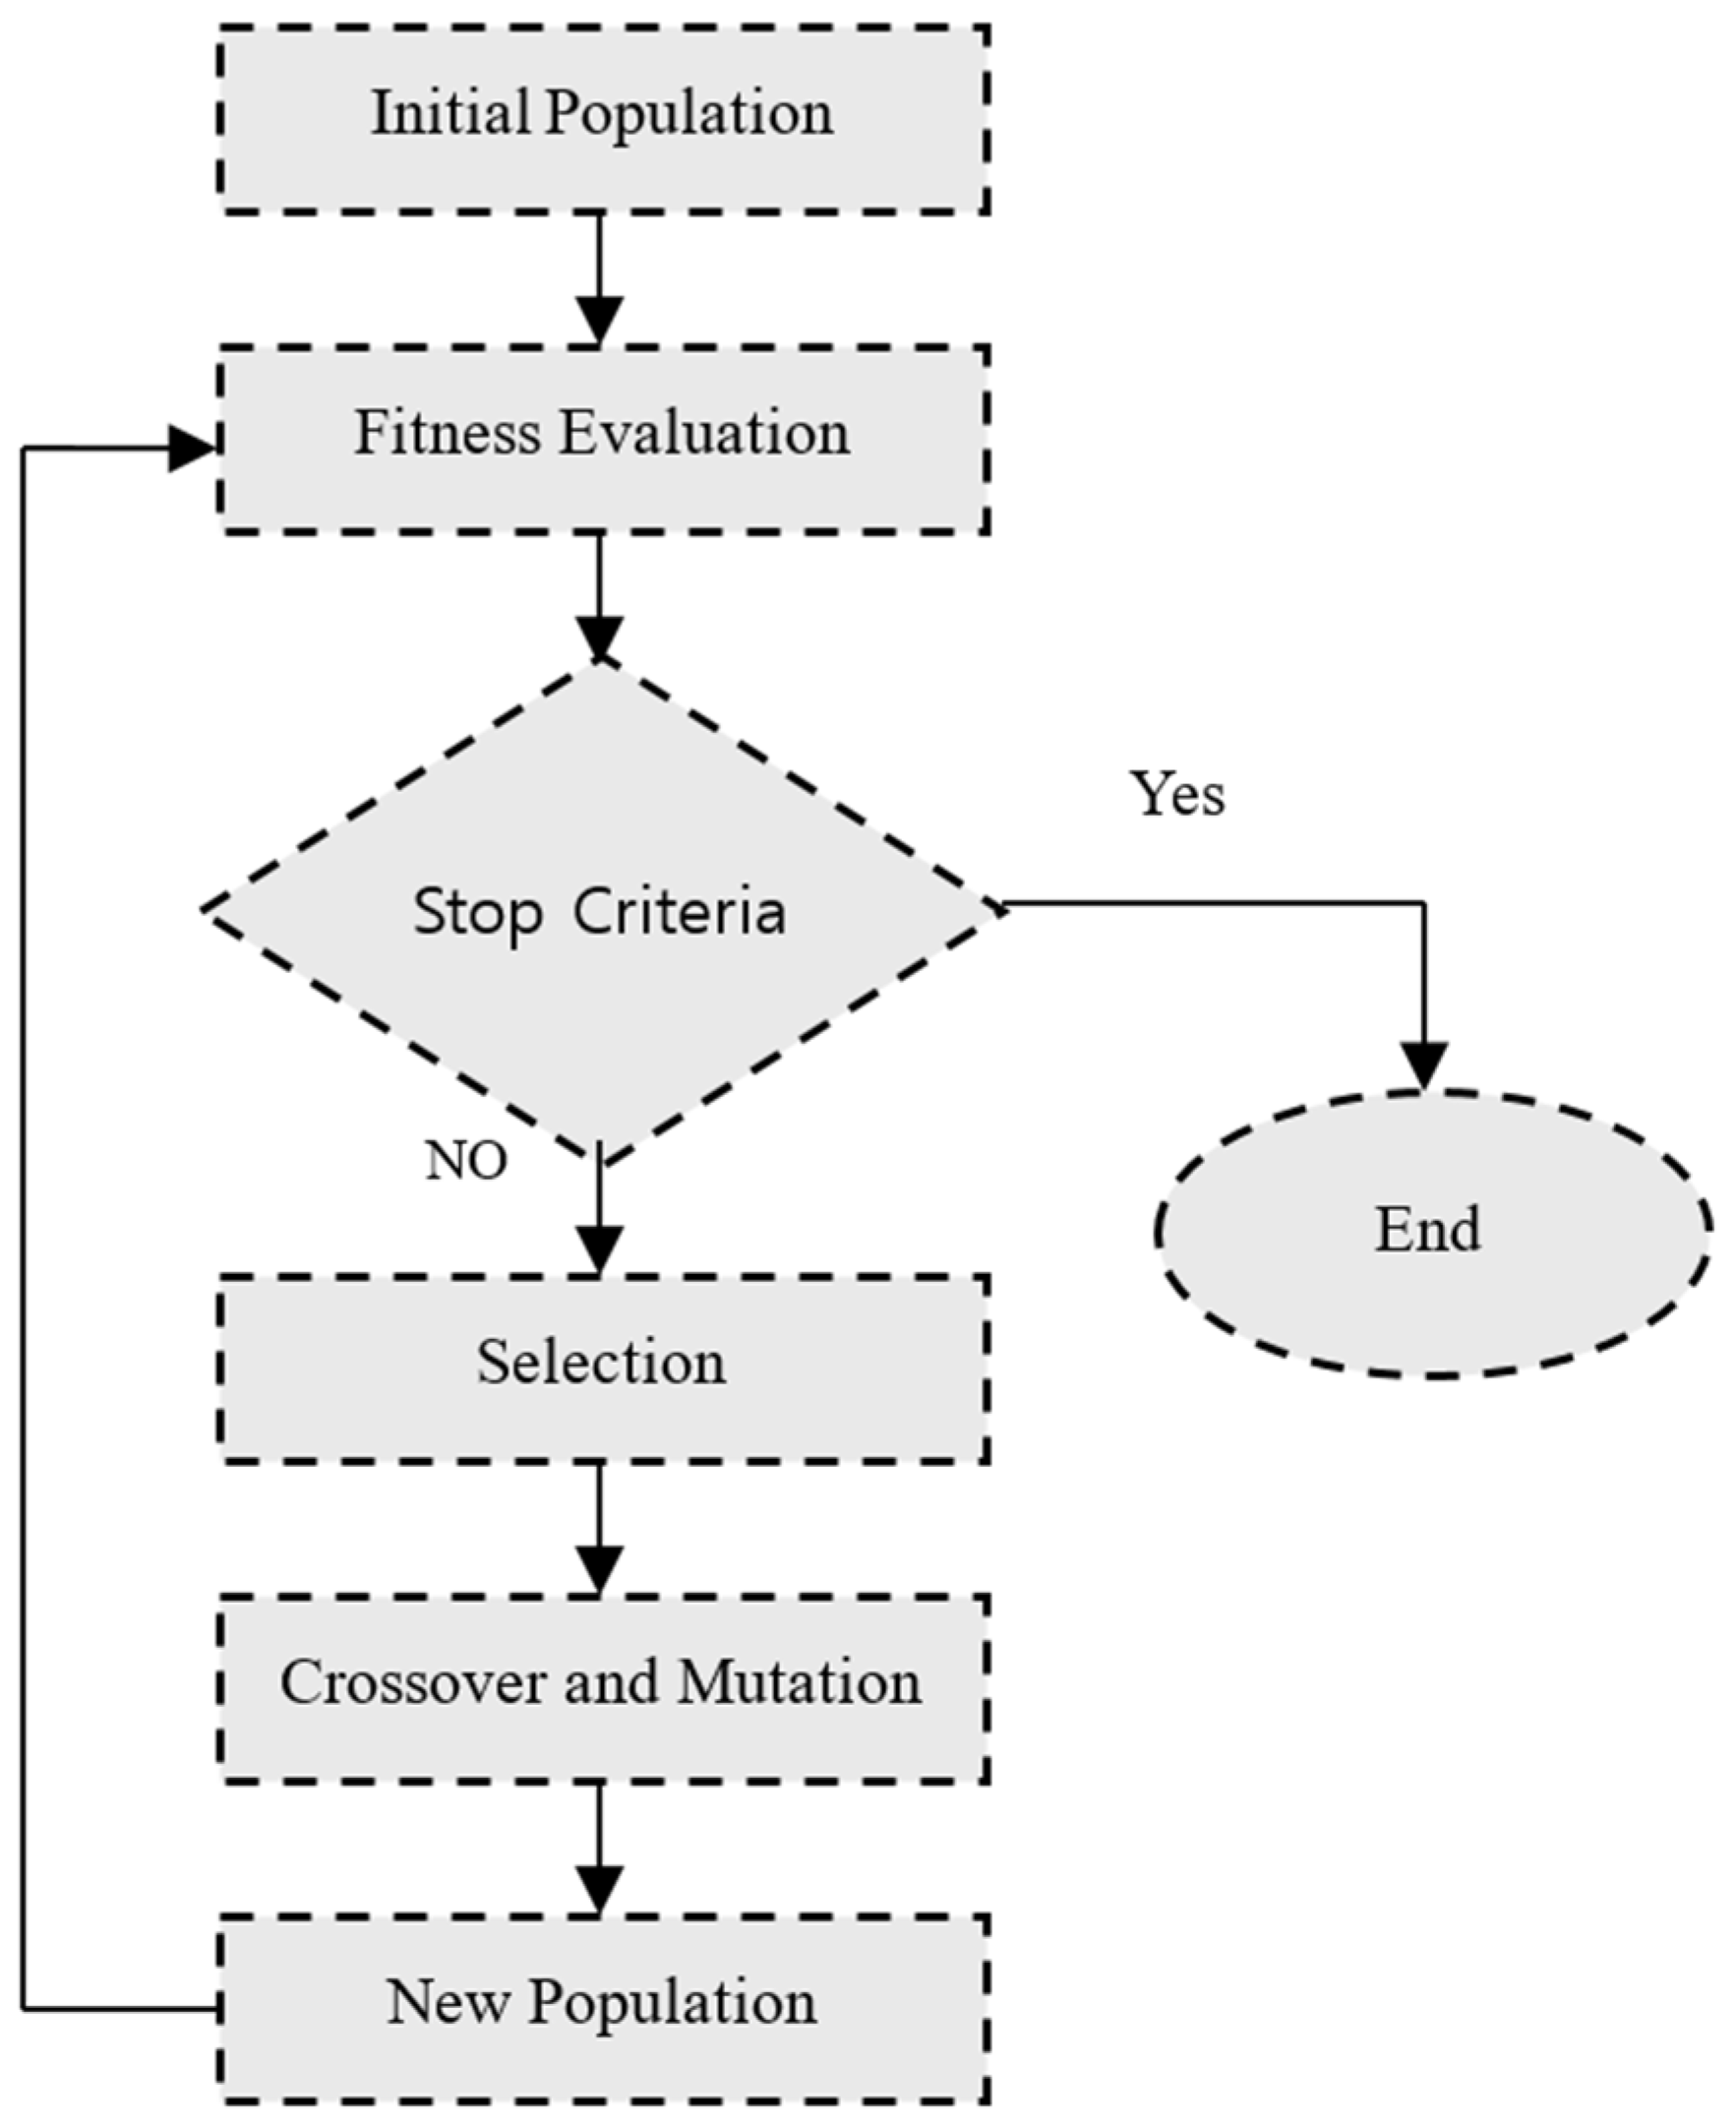
Figure 3 presents a summary of the classical GA, outlining its essential elements and the procedures involved in the GA technique, thereby highlighting its essential structure and functioning [
24]. To facilitate verification and evaluate the capabilities of both algorithms, a comparative analysis is performed, analyzing the results generated by each algorithm. This comparison seeks to offer further validation and understanding of the performance and efficiency of the WOA and the GA in addressing the specified problem or optimization task.
The WOA or GA have demonstrated their effectiveness in optimizing the mechanical properties of materials in the field of structural engineering in many previous studies [
25,
26,
27].
4. Deducting the Stress–Strain Curve Equation
This research aims to develop a comprehensive and detailed equation that characterizes the intricate relationship between concrete stress and concrete strain when subjected to loading conditions. In conducting this, the study will also incorporate additional relevant parameters that have been identified in the work of Ayman et al. [
3]. The main goal is to formulate a cohesive equation capable of accurately predicting and analyzing the stress–strain behavior of concrete materials, while thoroughly considering the influences of the incorporates crumb rubber and stainless-steel fibers under varying temperatures. By addressing these factors, the research seeks to enhance the understanding of concrete performance under various conditions, ultimately contributing to more accurate modeling and improved applications in engineering and construction practices.
In the initial phase of this study, three different formats of stress–strain formulas are considered. These formulas pertain to the behavior of concrete under stress and strain, but they do not account for the various factors that are the focus of this research. The formulas presented here serve as a foundational basis, proposed without specific parameter values. Instead, the parameters and variables within these formulas will be optimized using the GA. The objective is to derive an optimal equation that accurately simulates the stress–strain relationship while taking into consideration the aforementioned factors, such as temperature variance effects and the inclusion of crumb rubbers and stainless-steel fibers.
Utilizing the fitness function, the three formulas will be systematically compared to identify the most effective one. Once the best formula has been determined, it will undergo further optimization using the WOA. The fitness of this optimized formula will then be evaluated in comparison to results obtained from the GA. Ultimately, the most effective formula from these analyses will represent the optimal relationship for stress and strain, taking into account critical factors such as temperature variations, the incorporation of rubber, and the presence of stainless-steel fibers. This comprehensive approach aims to ensure that the resulting equation accurately reflects the complex interactions of these variables in the stress–strain behavior of concrete materials.
In the final phase of this research, the efficiency of the optimal formula will be thoroughly examined to determine its ability to predict the mechanical properties of concrete that incorporates crumb rubber and stainless-steel fibers under varying temperature conditions. To achieve this, a comparative analysis will be conducted between the mechanical properties derived from the optimal equation developed in this study and those reported by Ayman et al. [
3]. This comparison aims to evaluate the precision and dependability of the proposed formula, highlighting its effectiveness in capturing the complex interactions between the materials and the environmental factors considered.
Based on the analysis of the results obtained by Ayman et al. [
3], the behavior of specific factors and variables employed in the current study can be predicted, which, in turn, contributes to the development of the proposed formula formats.
The following equations present three distinct proposed formulas, incorporating both polynomial and exponential behaviors. These formulas are designed not only to identify the optimal approach for simulating the stress–strain curve but also to facilitate the optimization of the formulas themselves by selecting the most effective one from a range of options through variable optimization.
In this context, and represent the determined maximum stress and the corresponding strain for the studied case. In contrast, and denote the maximum stress and the corresponding strain observed at the optimal temperature of 21 °C, specifically for the case with no fiber or rubber, which are 42.33 MPa and 0.00355, respectively. and represent the temperature of the studied case and the optimal temperature, which is 21 °C. and denote the percentages of added crumb rubber and stainless-steel fibers, respectively. and represent the stress and strain modification factors. to represent the constants that need to be optimized to achieve their optimal values, thereby enhancing the effectiveness of the formulas to align closely with the experimental data, specifically the stress–strain curves for all studied cases.
In the quest to optimize formulas for simulating experimental results, the pivotal role of constants cannot be overstated. Constants to introduced in the previous Equations embody essential parameters that dictate the behavior and precision of the model. These values are not arbitrary as they encapsulate intrinsic properties of the system under scrutiny. Their meticulous calibration is imperative for ensuring the model’s fidelity to real-world data. Minute adjustments in these constants wield substantial influence over the simulated outcomes, underscoring the necessity for exacting parameterization. Understanding the nuanced interplay between these constants and the empirical data is paramount for refining the formula and enhancing the veracity of the simulation results. The algorithms employ these variables to determine their optimal values, ultimately resulting in the final optimal equation that describes the stress–strain relationship.
Each optimization algorithm operates by iteratively proposing various values for the variables within a specified range. These variable values are subsequently substituted into the previously defined stress–strain equation to generate the corresponding stress–strain curve. The algorithms assess the generated stress–strain curve against the one derived from the prior experimental study by Ayman et al. [
3]. This evaluation allows the algorithms to determine the fitness or precision of the proposed variable values based on their effectiveness in replicating the reference stress–strain relationship. The algorithms then move forward with their individual iterative processes. In the WOA, position vectors are updated, while in the GA, new candidate variable values are generated through crossover and mutation operations. This iterative cycle involves generating stress–strain curves, assessing fitness and adjusting variables. The process persists until the algorithms reach convergence on the optimal values for the variables that best match the reference stress–strain behavior.
The variables within the optimization algorithms are limited to a range of 0 to 10,000. The generated values will then be divided by 100 to introduce variability for the constants, ensuring that they can be above or below one.
The algorithms strive to identify the optimal values for these variables within the specified boundaries. By systematically exploring and evaluating different combinations of variable values within this range, they aim to achieve the configuration that either maximizes the desired objective or minimizes the defined cost function. The fitness function, which serves as the target for minimization by the optimization algorithms, is defined by the following equation:
where n indicates the number of cases examined, specifically 40 cases, i refers to the data point number for the stress–strain relationship in each case of the experimental study, and M represents the total amount of data for each case. Furthermore, the stress measured in the experimental study is denoted as
, while the proposed equation represents this stress as
. This implies that the fitness value represents the summation of the average variance between the curves generated by the algorithms and the corresponding curve derived from the experimental study for the 40 studied cases.
Within the framework of the algorithms, the population size—or the initial number of search agents—is set at 2000, with the maximum number of generations or iterations limited to 100. For the Genetic Algorithm (GA) specifically, a crossover rate of 0.9 and a mutation rate of 0.05 are applied. The primary objective is to minimize the fitness function, as this is crucial for identifying the optimal variables that produce the smallest discrepancy between the outcomes of the proposed formula and the experimental study.
The three formulas were optimized utilizing the GA, after which the formula that achieved the lowest fitness function value (Formula (1)) was further optimized using the WOA.
Table 3 presents the optimal variable values obtained from both the GA and the WOA, along with their corresponding fitness values. The best solution (Formula (1) derived from the WOA) can be presented in the following equations:
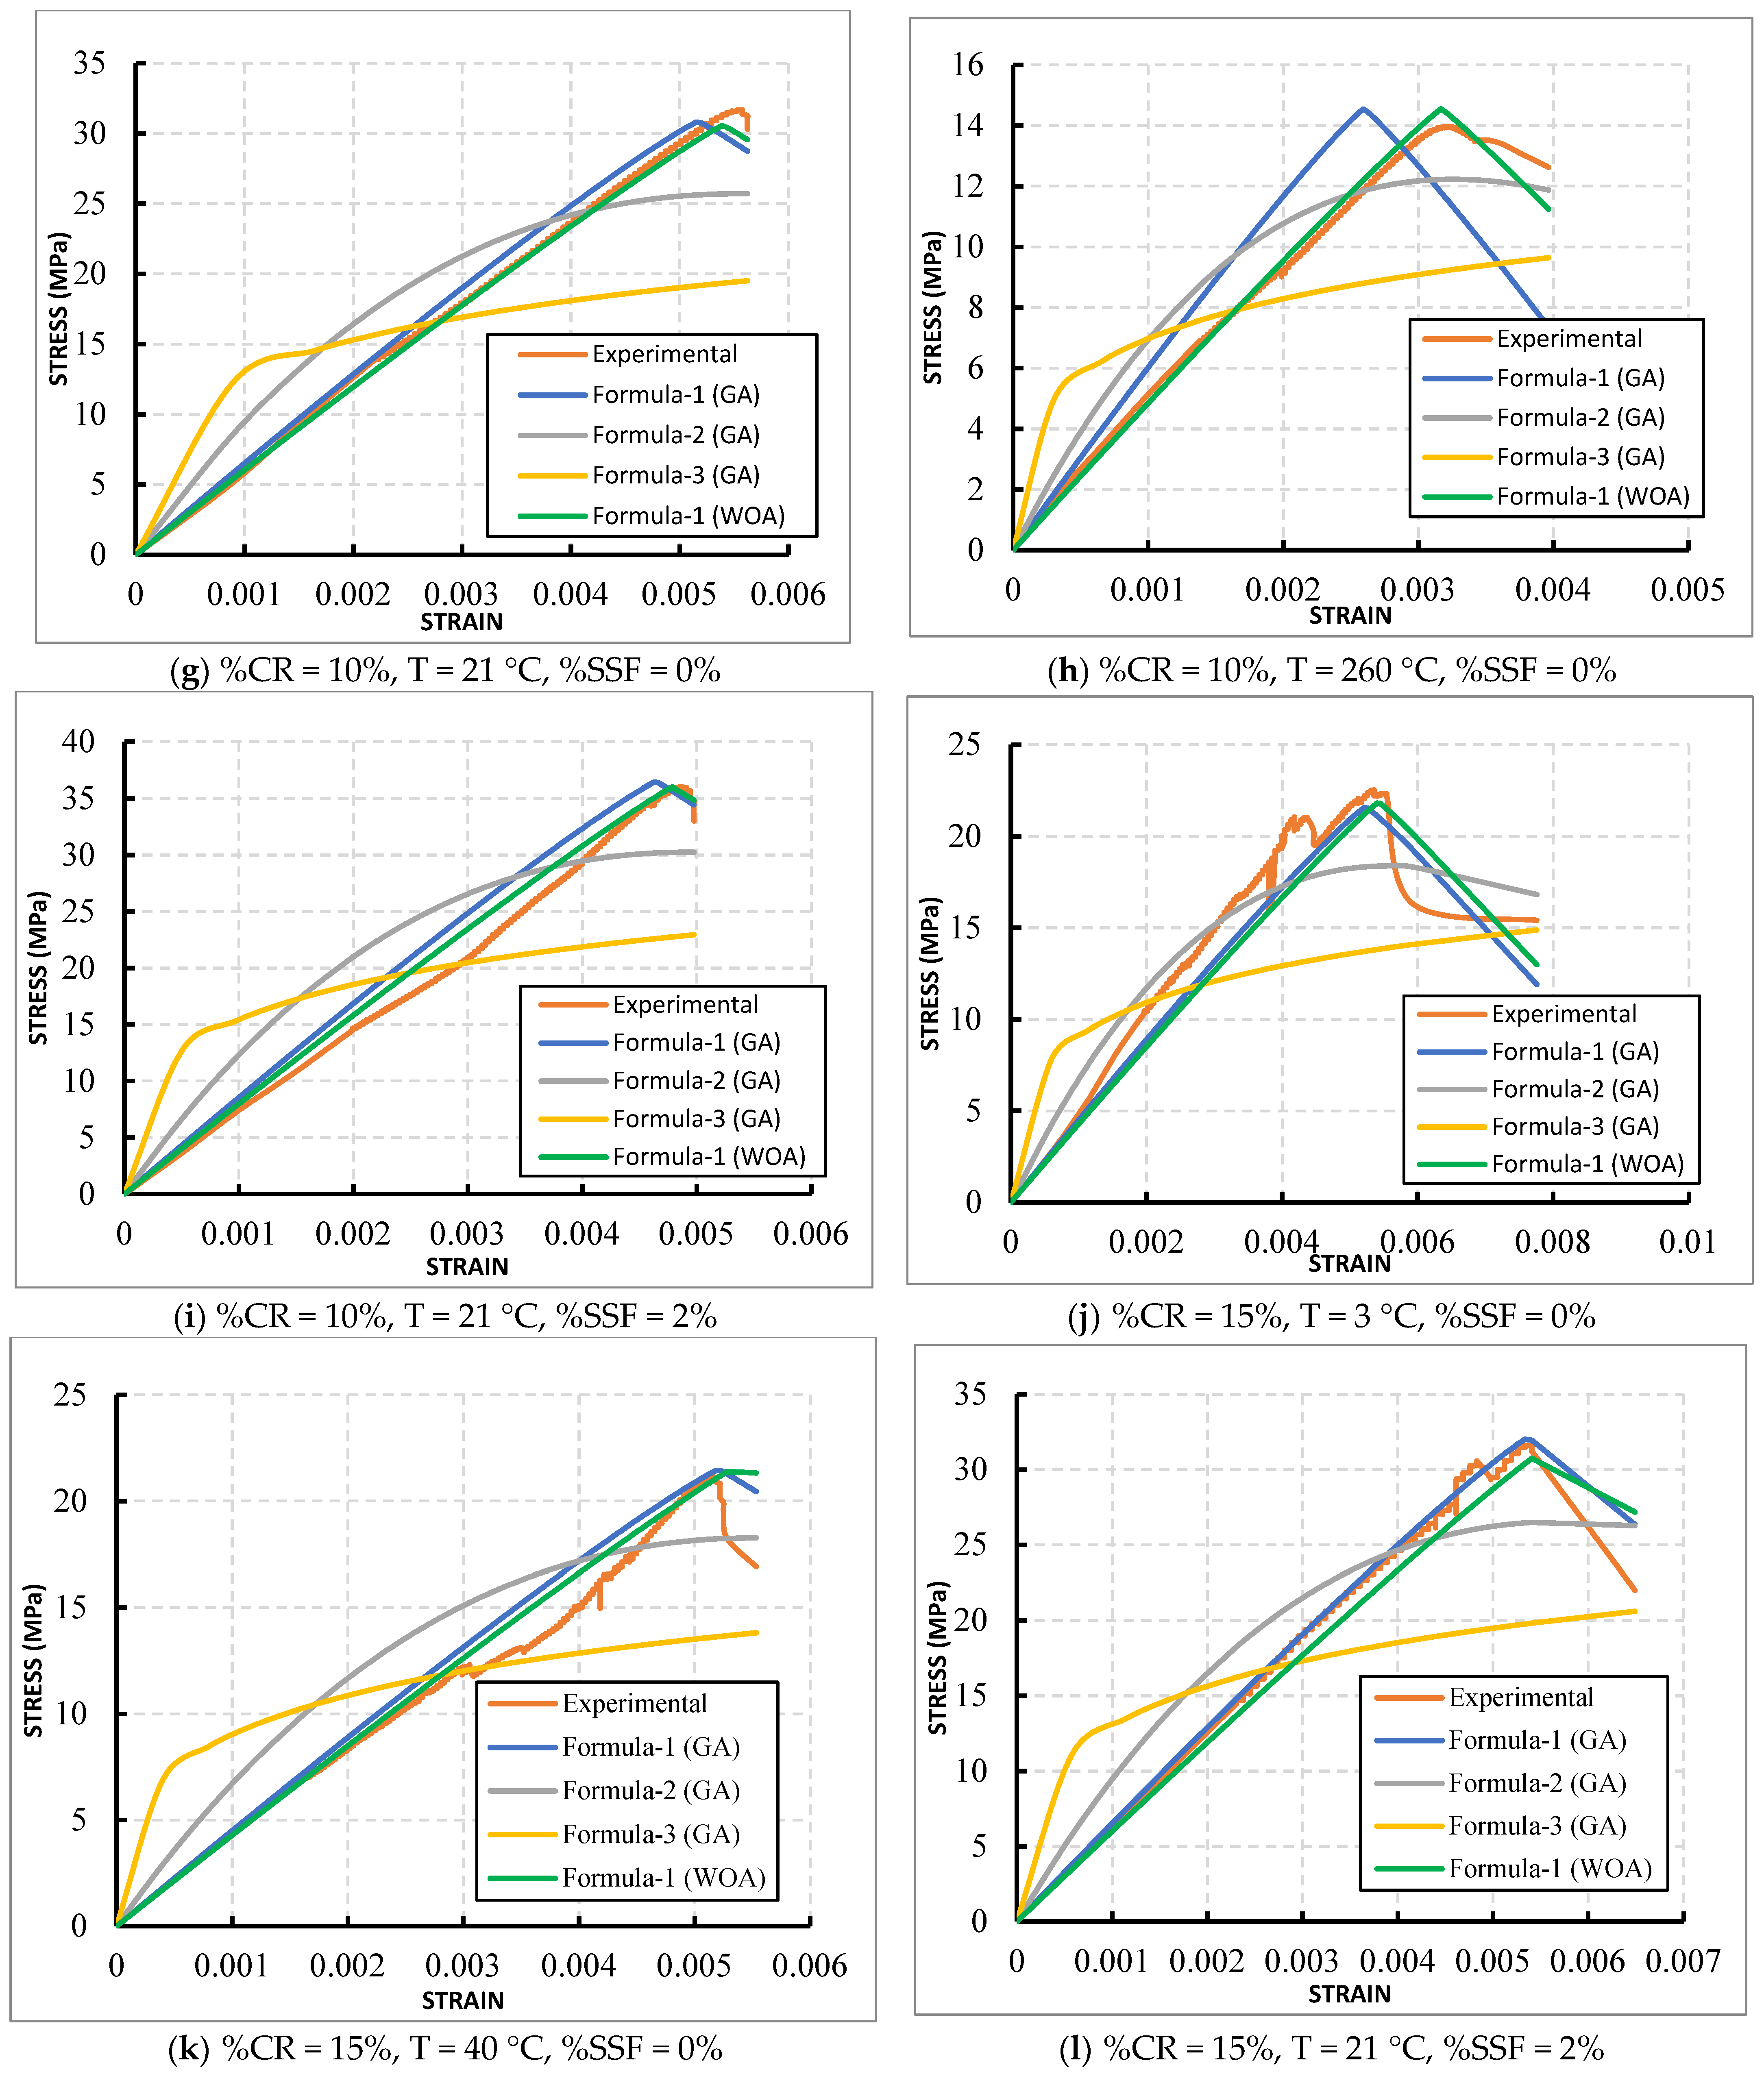
Figure 4 depicts the relationship between stress and strain for the specific cases selected from a total of 40 cases analyzed in the study. Each figure displays the temperature, the percentage of rubber, and the amount of fiber used.
To visualize the evaluation of efficiency, each figure presents the stress–strain curve obtained from the experimental study alongside the stress–strain curves derived from the three formulas analyzed in this research using the GA, as well as the best formula (Formula (1)) identified through the WOA.
These comparisons offer valuable insights into which algorithm most effectively represents the stress–strain curve. They can inform the selection of the most appropriate formula for precisely predicting the stress–strain behavior in practical scenarios that involve various factors, including the temperature, the percentage of rubber, and the percentage of fiber.
Figure 4 and
Table 3 illustrate the superiority of Formula (1) when compared to other polynomial and exponential formulas. This finding not only highlights the effectiveness of Formula (1) but also provides strong evidence that the WOA outperforms the traditional GA. This comparison emphasizes the advancements achieved through the WOA, demonstrating its capacity to improve the accuracy and reliability of the modeling process. The WOA outperforms the GA due to its efficient exploration inspired by whale hunting behavior, its dynamic balance between exploration and exploitation, its refined search space exploration through mathematical equations, its inherent parallelism enhancing computational efficiency, and its overall superior convergence behavior and robustness in the specific context studied, making it a more effective optimization method.
Moreover,
Figure 5 illustrates the fitness values for all 40 cases examined using both the GA and the WOA. This analysis facilitates an evaluation of the performance and effectiveness of both algorithms in determining the stress–strain relationship. Additionally, it aids in assessing the suitability of each case concerning the objectives set forth by the algorithms.
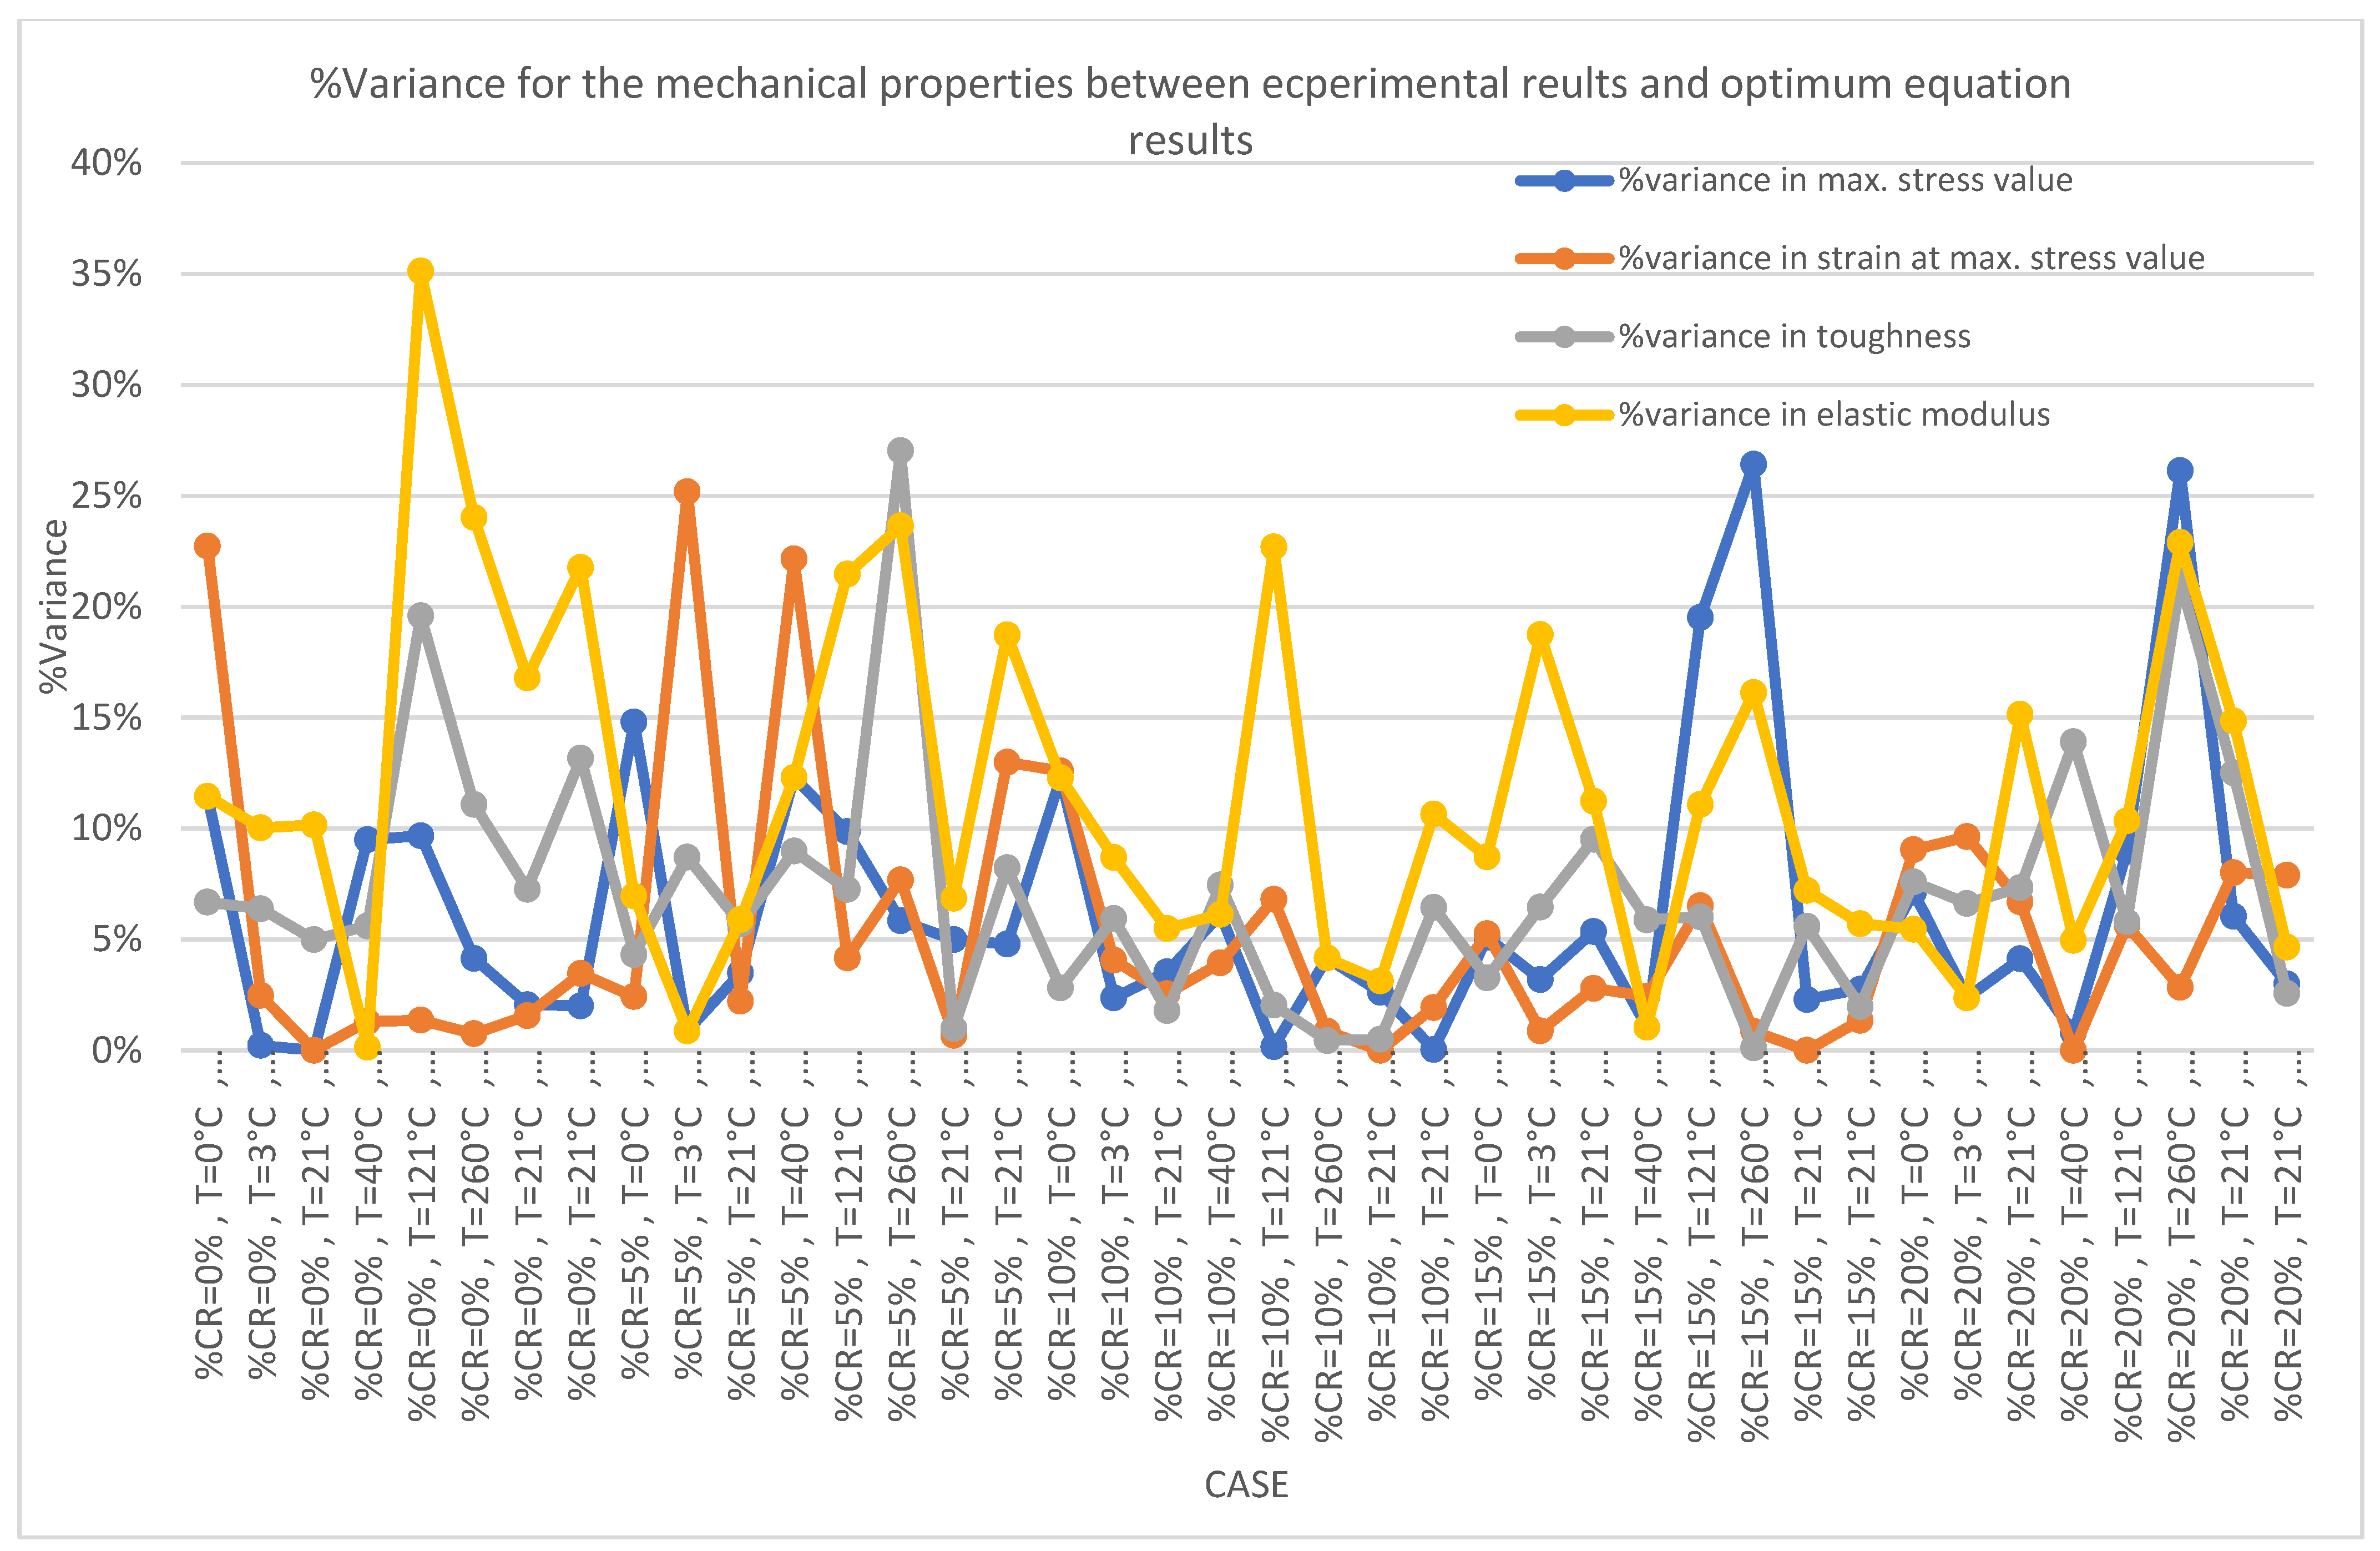
Furthermore,
Figure 6 presents the variance percentage between the mechanical properties derived from the experimental study and those obtained from the formulas evaluated in this research, specifically Formula (1) (WOA). The mechanical properties considered include the maximum stress, the strain at maximum stress, the modulus of elasticity calculated at 0.45 of the maximum stress, and the toughness values. The figure highlights the superiority of Formula (1) over the other formulas and demonstrates the effectiveness of the WOA compared to the GA. Additionally, it underscores the ability of the optimal results from this study—specifically Formula (1) (WOA)—to accurately characterize the mechanical properties of concrete that incorporates crumb rubber and stainless-steel fibers under varying temperature conditions.
Utilizing the optimal formula provided in this study, the stress–strain curves and, consequently, the mechanical properties can be assessed for any percentages of crumb rubber and stainless-steel fibers under different temperature conditions.
The equation was constructed based on specific experimental results with predetermined variable values. It is anticipated that the equation should remain valid even for values outside the experimental limits. While designed to accurately simulate the given experimental data, the equation is expected to provide reliable predictions for outcomes beyond the known experimental conditions, including scenarios where variables fall outside the tested range.
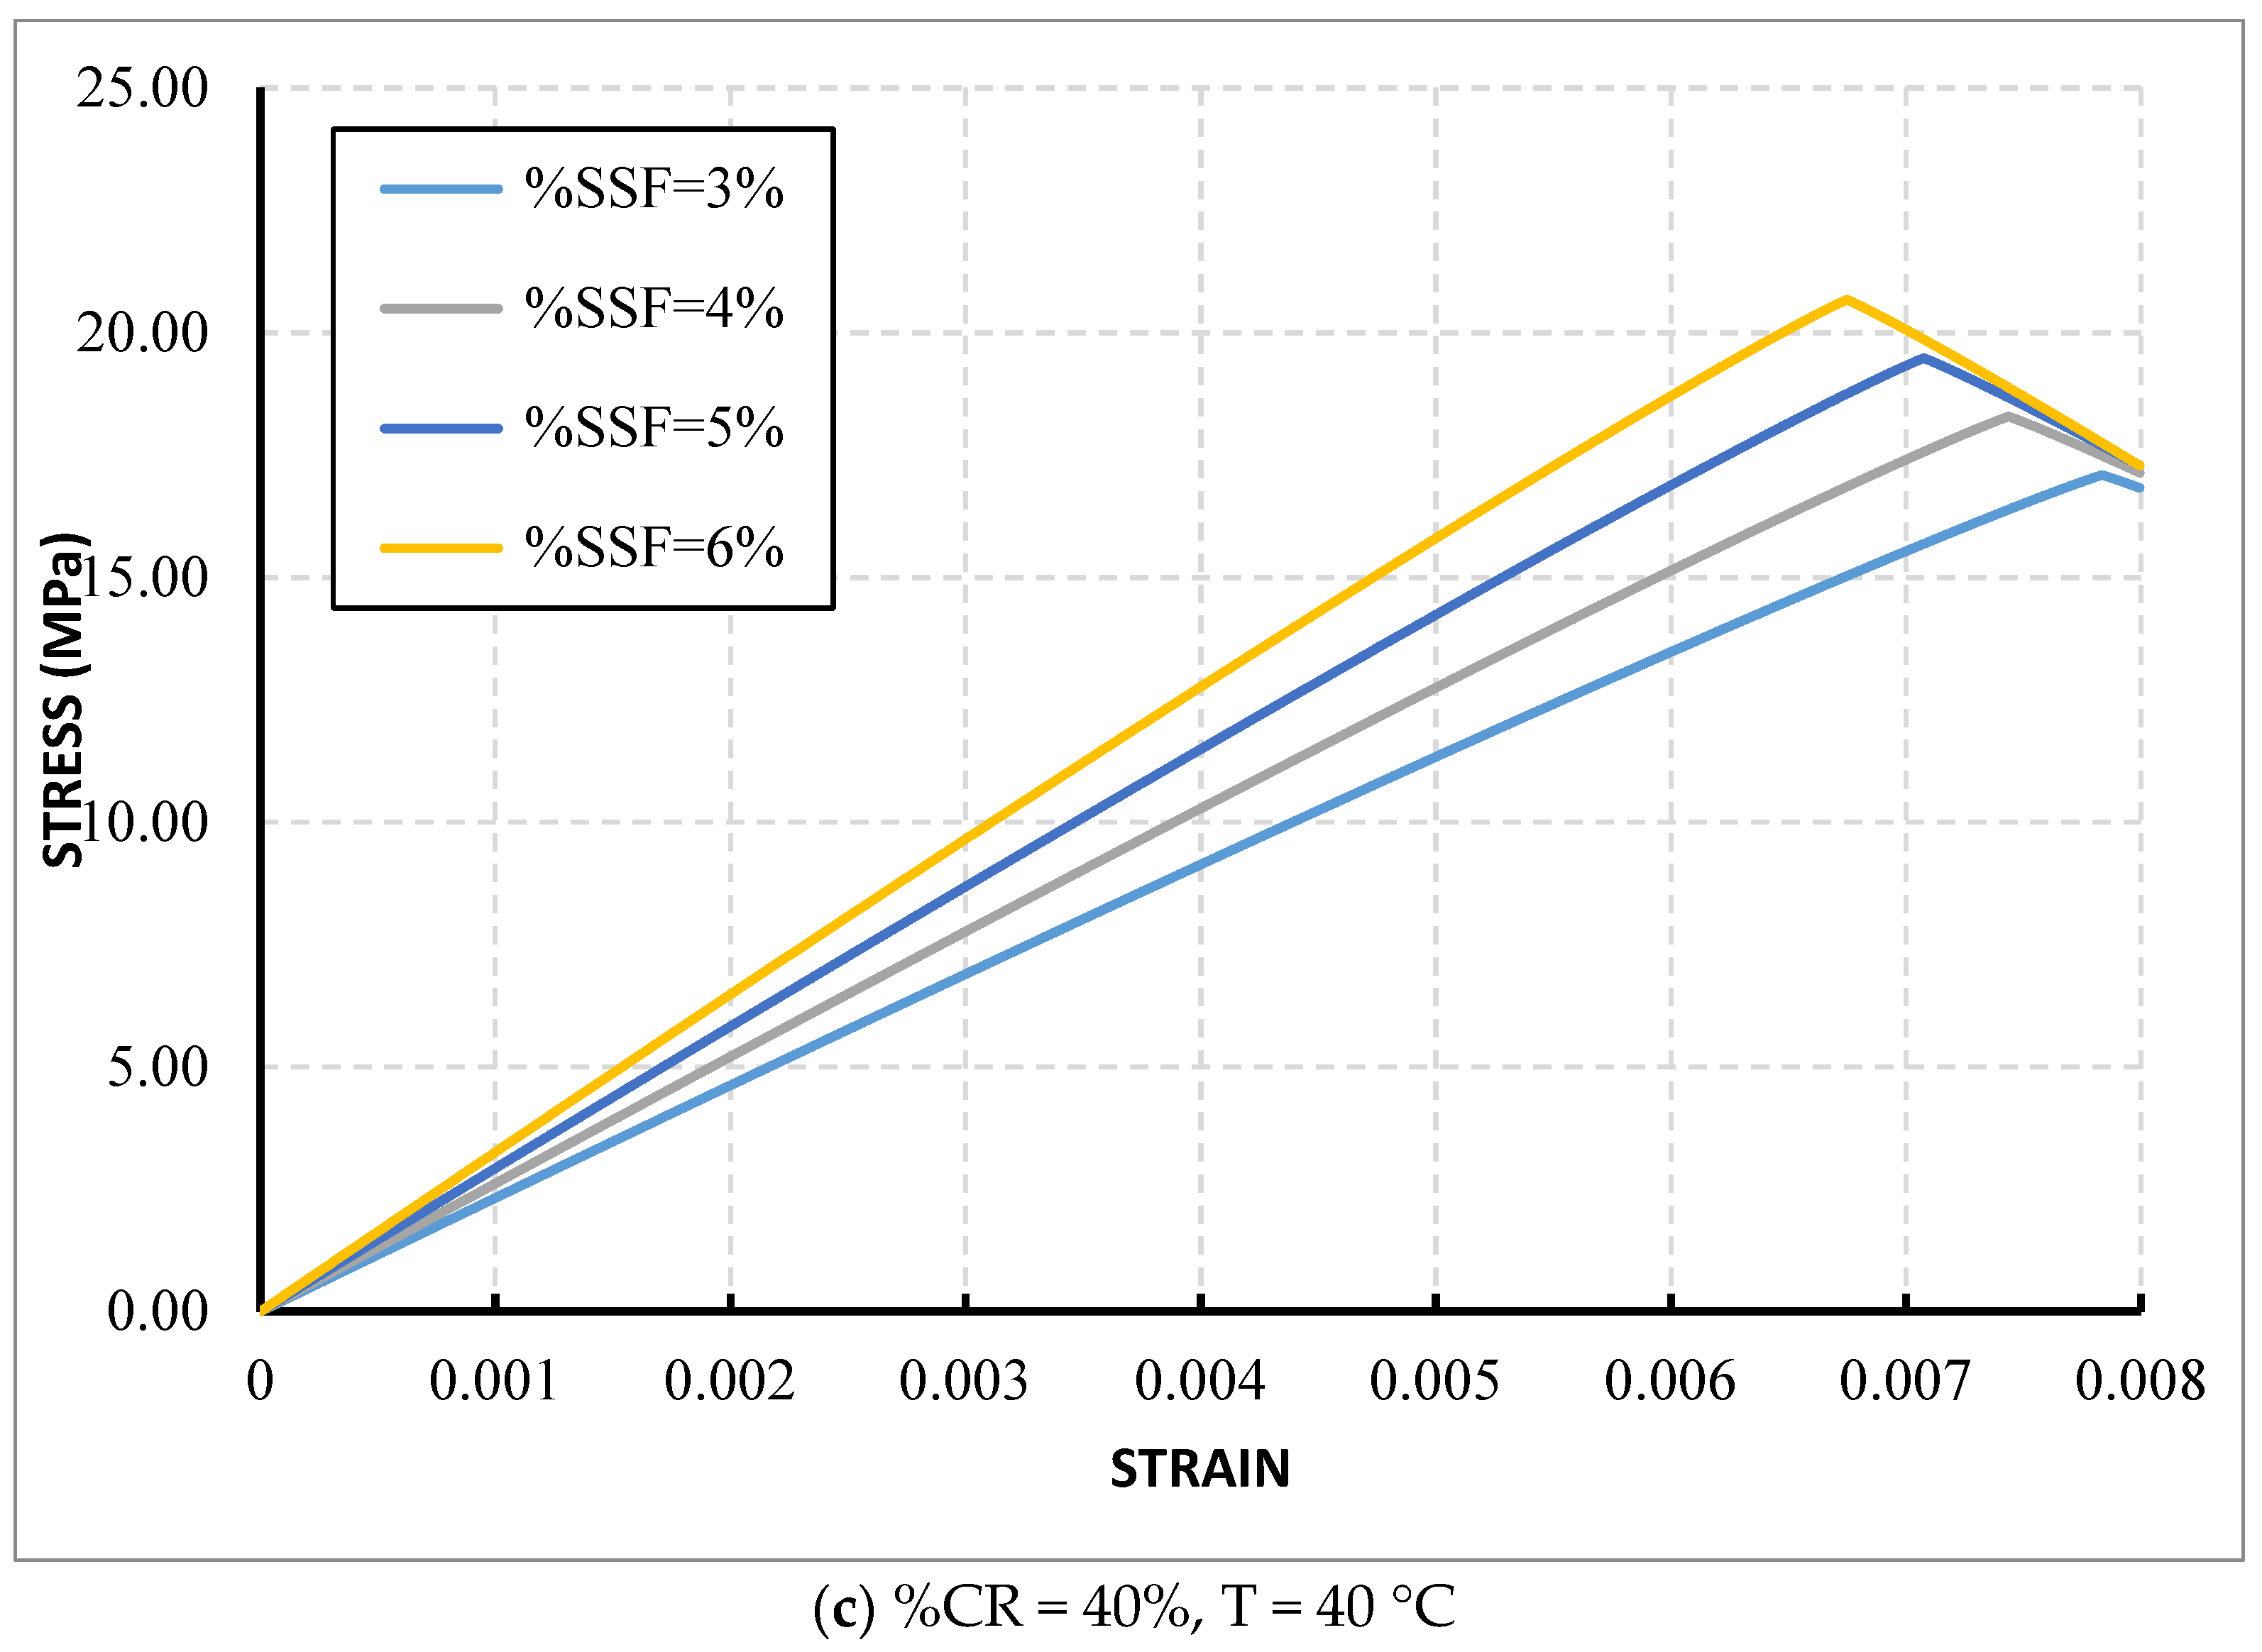
Figure 7 illustrates the stress–strain curves for various percentages of crumb rubber and stainless-steel fibers across different temperature conditions, which were not explored in the experimental investigation.
As illustrated in the previous curves (
Figure 7), the maximum stress and strain at peak stress behavior are significantly influenced by the percentages of rubber, fiber, and temperature. This behavior aligns with the findings of the earlier experimental study [
3], thereby providing evidence for the effectiveness of the optimal formula developed in the current research. The formula demonstrates its capability to accurately determine the stress–strain curves while taking into account various factors analyzed in this study, underscoring its efficiency and reliability in modeling these complex interactions.
Employing the provided equation to derive the stress–strain curve assists engineers in evaluating concrete properties such as modulus of elasticity, strength, toughness, etc. This analysis takes into account various parameters including percentages of crumb rubber and stainless-steel fibers, enabling the selection of appropriate parameter values that align with the specific design requirements of the construction projects.


