Abstract
Retrial queues are used extensively to model many practical problems in service systems, call centers, data centers, and computer network systems. The average waiting time is the main observable characteristic of the retrial queues. Long queues may cause negative impacts such as waste of manpower and unnecessary crowding leading to suffocation, and can even cause trouble for customers and institutions. Applying control chart technology can help managers analyze customers’ waiting times to improve the effective performance of service and attention. This paper pioneers the developing and detailed study of a waiting time control chart for a retrial queue with general service times. Two waiting time control charts, the Shewhart control chart, and a control chart using the weighted variance method are constructed in this paper. We present three cases for the Shewhart control chart in which the service time obeys special distributions, such as exponential, Erlang, and hyper-exponential distributions. The case of an exponentially distributed service time is also presented for the control chart using the weighted variance method. Based on the numerical simulations conducted herein, managers can better monitor and analyze the customers’ waiting times for their service systems and take preventive measures.
1. Introduction
The commonly observable performance features of any queue are the mean waiting time in the queue and the mean queue length. Among them, customer waiting time is one of the biggest concerns for any service organization. The wait experience is often considered for proper timing, and is crucial for most organizations. Besides, many industries utilize waiting time standards as a competitive means of explicit publicity. The company commits to ensuring the given waiting time by choosing an acceptable capacity level.
To provide waiting time guarantees, managers must understand not only the expected waiting times of customers, but also changes in the expected waiting time. For any organization striving to improve service, a key starting point is recognizing and understanding changes in waiting times, as understanding changes in waiting times is critical to understanding how queuing systems are performing. Decision making therefore requires predicting the range of changes in the system over time (not just the average). When designing a delivery time control chart, the expected value and standard deviation of the waiting time are required to be known to define both upper and lower control limits. Among the many possible applications of statistical process control, a common one is the need to monitor waiting time distributions. For example, in a hospital emergency department, if the distribution of waiting times changes, it may cause changes in available manpower levels [1].
A control chart, also known as a Shewhart chart, is a statistical process control tool. It is able to determine whether a manufacturing or business process is in control. It is also more appropriate to say that a control chart is a graphical device for statistical process monitoring. Many applications on how to use control charts to ensure manufacturing quality were proposed by [2].
By using a statistical control chart, Zhao and Gilbert [3] analyzed the customer waiting time for a general single-server queue without previous assumptions of service time or inter-arrival time distributions. Zhang et al. [4] investigated the effects of parameter estimation on the conforming run length control charts using the average number of observations to signal and the standard deviation of the average number of observations to signal with a Bayes estimator. In [5], a control chart for monitoring the service processes with time-varying arrival rates was studied. They used a bi-objective optimization model to minimize the quality control cost and maximize overall customer satisfaction. Ebadi and Ahmadi-Javid [6] obtained a socio-statistical design of each stage control chart by considering statistical constraints to examine the advantages of using total customer waiting time as a criterion for designing control charts for monitoring multi-stage service processes. Cruz et al. [7] used three original control charts to solve the traffic intensity control problem in Markov multi-server queues and conducted a comprehensive set of Monte Carlo simulations to determine the effectiveness and efficiency of the proposed approach. In [8], an appropriate control chart for the efficient detection of abnormal changes in the size of F-policy queue systems with a limited capacity and an exponential startup time was developed. A control chart approach that optimizes the sojourn times of customers in a dual-rate queuing model for serving a single queue with a K-policy was presented by [9]. Dhinesh Kumar et al. [10] constructed the waiting time control chart for a multiserver Markovian queue, which encouraged arrival with an infinite capacity model.
It can be seen from the literature that the researchers have mainly focused on the control charts of the general queueing model. However, the retrial phenomenon is also a very important feature for many practical applications, especially in computer and communication systems, network scenarios, mobile network scenarios, and even elsewhere. One feature of the retry queue is that arriving customers who find that the server is unavailable will enter a virtual blocked customer group and try their service request again after a random time. For the complete review of the main results, readers are referred to the detailed review papers [11,12,13]. A two-class retrial system with class-dependent service time was analyzed by Ref. [14]. In Ref. [15], a retrial queue with general service time, general retrial times, and Bernoulli working vacation interruption was considered. A retrial queue with general service time and a second optional service under two types of Bernoulli vacation schedule was investigated by Ref. [16]. Gao and Zhang [17] analyzed the performance of a hospital service system by modeling it as a queue with retrial customers due to server vacation. Lee et al. [18] analyzed the waiting time distribution in retrial queues with two-way communication.
From a practical viewpoint, many applications can be modeled by the retrial queue, especially in computer and communication systems, network service systems, and mobile network scenarios. Therefore, it is required to develop the waiting time control chart for these applications so that customers can have a prior idea about expected waiting time and other activities can be planned more efficiently to save time. This motivates us to develop a waiting time control chart for a single-server retrial queue with general service time distribution. In addition, from the theoretical viewpoint, there is no work on developing a waiting time control chart for the M/G/1 retrial queue. The main research work and contributions of this paper are threefold. (1) This paper is the first attempt to develop a waiting time control chart for the retrial queue with general service times. We construct two waiting time control charts, the Shewhart control chart and the control chart using the weighted variance method. (2) For the Shewhart control chart, we derive three cases in which the service time obeys special distributions such as exponential, Erlang, and hyper-exponential distributions. The case of exponentially distributed service time is also derived for the control chart using the weighted variance method. (3) Several numerical experiments are performed to study the effects of system parameters and different service time distributions on the control chart.
The rest of this paper is organized as follows. Section 2 introduces the main assumptions and some performance measures of the retrial queue considered in this paper. The following section develops Shewhart control charts for monitoring waiting times. Section 4 constructs a control chart using the method of weighted variance for waiting times. Section 5 presents an illustrative example. Section 6 presents a demonstration application for a data transmission mechanism using weightless transmission techniques. Our conclusions are given in Section 7.
2. M/G/1 Retrial Queue Description
Consider a single server retrial queue in which arrivals follow a Poisson process of rate λ and service times are independent and identically distributed. There is no waiting space. Hence, a customer finding the server busy upon arrival is blocked and temporarily leaves the service area. Such a customer will enter a group of unsatisfied customers, called orbit, under the first-come first-serve discipline, that is, only the customer at the head of the orbit is allowed to access the server. Each customer in orbit retries for service after an exponential time with rate γ until he finds the server available. The repeated attempts are assumed to follow the classical retrial policy, that is, assuming there are n customers in orbit at time t, the probability of a repeated attempt during the interval is . The service times are independent and identically distributed random variable with a distribution . Let denote the Laplace–Stieltjes transform of the service time distribution and be the kth moment of the service time. The arrival process, the retrial times, and the service times are mutually independent. Define the traffic load as , where represents the service rate. For the system’s stability, it is assumed that . The above model is proposed in the book [19]. The basic structure of the single-server retrial queue is illustrated in Figure 1.
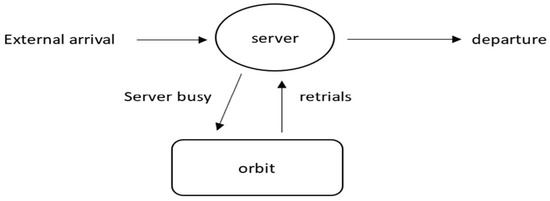
Figure 1.
The basic structure of a retrial queue.
This retrial queue can be described by a continuous-time Markov process , with state space , where C(t) represents the number of served customers at time t and N(t) denotes the number of customers in orbit at time t. Denote the limiting probabilities by . Thus, their corresponding partial generating function has explicit solutions [19]:
3. Shewhart-Type Waiting Time Control Chart
Let T denote the waiting time of an arbitrary customer who waits at the orbit until his service begins. The formulas for the first two moments of T, as in [20], are:
Then, the variance of T is derived as
In addition to finding the above results in the literature [20], one can also refer to Appendix A. When we approximate the statistic under consideration by using normal distribution, Shewhart type control charts are:
where UCL is the upper control limit and CL is the central limit.
For the M/G/1 retrial queue, the parameters of the control chart for the waiting time of the customers in orbit are obtained by using Equations (1) and (2) in Equation (3) as
Below, we present several simple examples to illustrate the above results, in which the service time obeys special distributions such as exponential, Erlang, and hyper-exponential distributions.
- Exponential service time distribution
We set the density function as . In this case, we have and . Then,
Hence, we have
- Erlang service time distribution
Recall that the density function of Erlang random variable of order k with parameter α > 0 is given by . In this case, we have and . Then,
Hence, we have
- Hyper-exponential service time distribution
The density function of Erlang random variable of order k with parameter α > 0 is given by , where . In this case, we have and . Then,
Hence, the control chart parameters are obtained by
4. Waiting Time Control Chart Using the Method of Weighted Variance
In this section, we consider the case of exponential service times, that is, . Shewhart-type control charts generally assume that the distribution of monitoring statistics is not highly skewed and is, therefore, an approximation of normality. But if this assumption is not met and the underlying population is biased, the probability of type I error increases with the bias. Hence, we need a method providing asymmetric control limits. In the control chart mentioned above, we did not consider the skewness of the underlying distribution of T. To improve this chart, we constructed a control chart using the weighted variance method developed by Bai and Choi [21]. This method calculates upper and lower control limits for the skewed population by using different variables to provide asymmetric control limits in accordance with the direction and degree of skew estimated from the sample data.
Let . Then, the control limits for T using the weighted variance method are
where LCL is the lower control limit.
Remark 1.
A symmetric population means , and the control chart will become the Shewhart chart. If , that is, the underlying population is skewed to the right, the distance between the UCL and the CL is greater than the distance between the LCL and the CL. On the contrary, if , the distance between LCL and the CL is larger than the distance between the UCL and the CL.
If we consider the case of exponentially distributed service time, the corresponding partial generating function becomes
where . If we use the classical binomial formula to expand and in power series, the limiting probabilities are obtained:
which can be found in Jonin and Sedol [22]. It is easy to obtain through Little’s formula, where denotes the expected number of customers in orbit. Hence, can be derived as follows.
5. Numerical Analysis
The waiting time of an arbitrary customer is evaluated via control charts and numerically illustrated for some selected values of λ, μ, and γ. Without loss of generality, the service times are assumed to follow the exponential distribution, Erlang distribution with k = 4, and hyper-exponential distribution with k = 2 and . To compare these three service time distributions, we set the retained parameter value to a value such that these three distributions had the same mean. First, we studied the impact of traffic load and different service time distributions on the distribution characteristics of the random variable T, such as mean and variance, as shown in Table 1. One can see from this table that the mean and variance increased rapidly with the value of traffic load, regardless of the service time distribution. However, for larger values of , the variability increased at a larger rate compared to the mean, so the expected value of T did not seem to be very relevant for larger values of . Although these quantities can be arbitrarily large to achieve sufficiently large , the system may take a correspondingly long time to reach steady-state equilibrium. It was observed that the coefficient of variation for the Erlang-4 distribution was always smaller than the exponential distribution and two-stage hyper-exponential distribution, while the two-stage hyper-exponential distribution was higher than the exponential distribution.

Table 1.
Mean and variance of random variable T using control chart .
To understand what happens when we try to fully utilize a server, Figure 2 plots latency as a function of traffic intensity (or utilization) over the entire range of allowed values of (). In order to limit the average waiting time to a fairly small range (e.g., 1.2), the utilization must be 0.85. That is, we must be prepared to tolerate 15% of the server being idle to avoid clients waiting for more than 1.2. Even if the wait time is 1.2, it can sometimes be quite long. Furthermore, the average waiting time is very sensitive to small changes in r within this range.
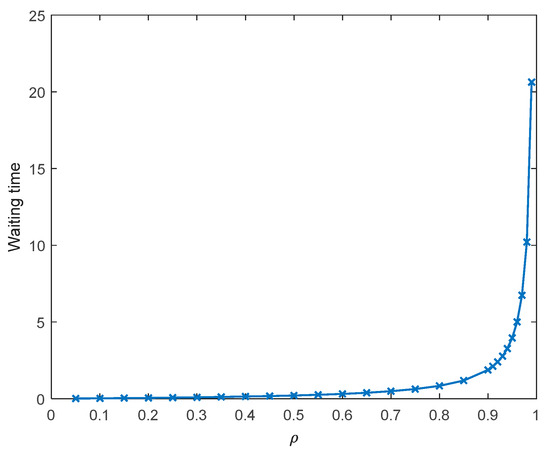
Figure 2.
The expected waiting time for different values of traffic density based on exponential service time.
Therefore, in this model, there is an inevitable conflict between the desire to fully utilize the server and the desire to maintain a low average wait time. The ideal ratio of arrival rate to service rate is less than one. Its exact value depends on the relative costs of idleness versus congestion.
Next, we studied the impact of system parameters and different service time distributions on the control chart by varying the values of λ, μ, and γ, respectively. The numerical results are shown in Figure 3, Figure 4 and Figure 5. These figures reveal the following features:
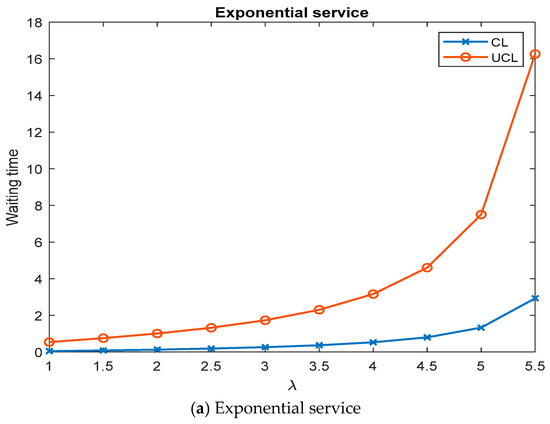
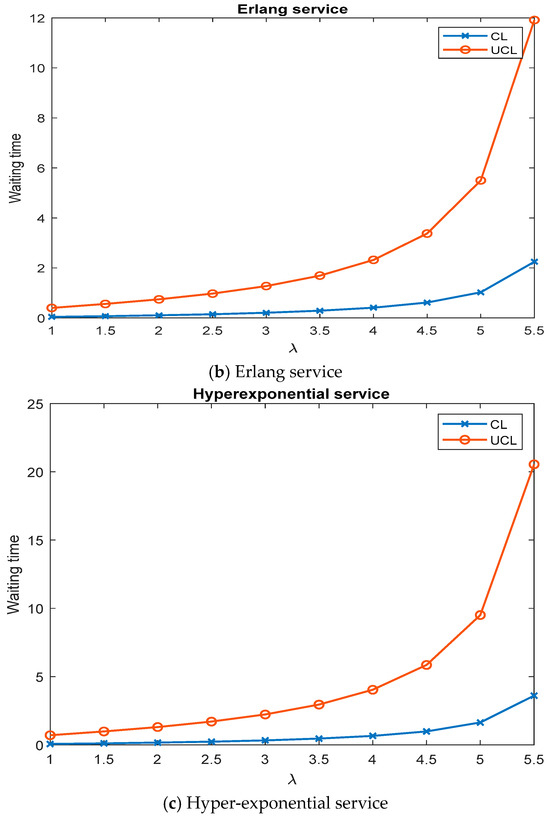
Figure 3.
The effect of arrival rate λ on control chart parameters using control chart .
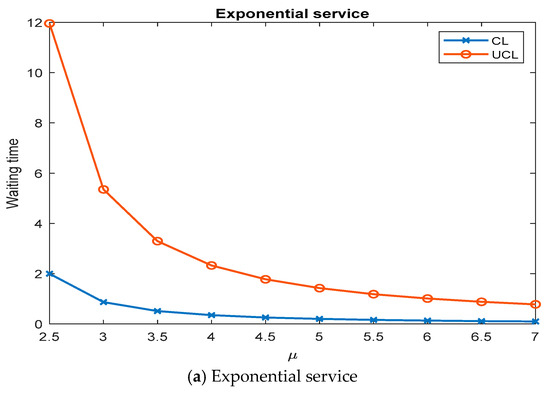
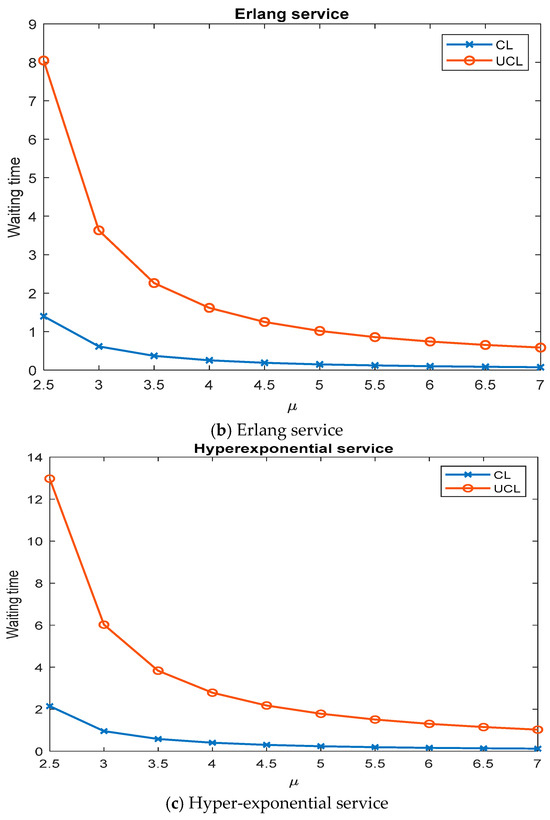
Figure 4.
The effect of service rate μ on control chart parameters using control chart .
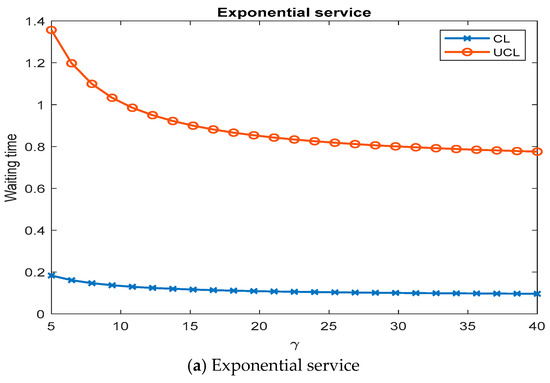
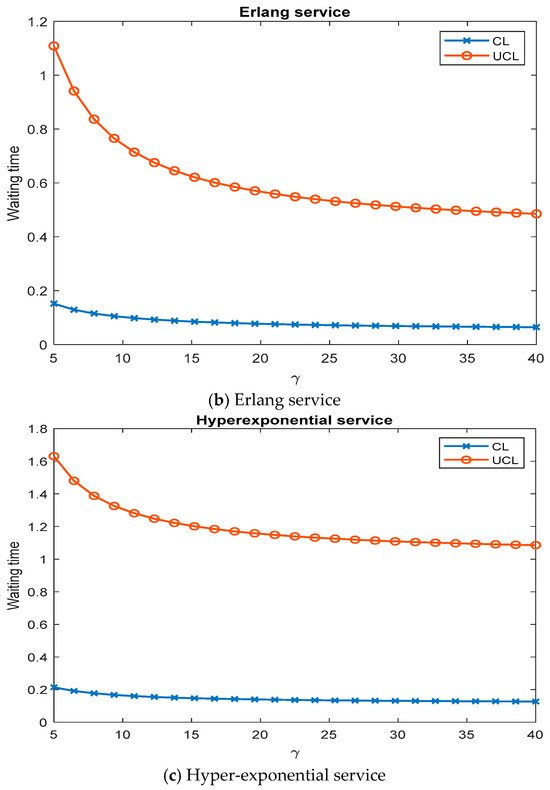
Figure 5.
The effect of retrial rate γ on control chart parameters using control chart .
- Increasing the value of the arrival rate causes the mean waiting time and maximum waiting time to increase.
- An increase in the service rate will reduce the mean waiting time and maximum waiting time.
- The mean waiting time and maximum waiting time decrease with an increase in retrial rate.
Finally, the same set of values as that of the control chart was selected, and then we calculated , CL, and UCL values for this set as shown in Table 2. The value of shows that for small , the distribution of T is skewed to the left; when is large, the distribution of T is skewed to the right. Furthermore, the increase in causes a decrease in . In a comparison of Table 1 and Table 2, one can find that the values of UCL using the method of weighted variance were higher than that of the control chart . This is because, with the weighted variance method, the skewness of the distribution of T is considered through the factor , which results in higher UCL values.

Table 2.
Values of control limits for different values of for the control chart using control chart .
6. Application Example
We consider a real-world application example related to weightless data transmission techniques: a high-performance LPWAN connectivity technology for the IoT transmission for renewable energy power plants. In this application, the meter signal is transmitted from the smart meter to the queuing system (gateway). If the gateway is idle, the gateway will immediately process the new meter signal and transmit the meter signal to the cloud management platform. Additionally, the system will block signal transmission if the gateway is busy. When a blocking signal is generated, no transmission action is performed. In these cases, the blocked instrument signal (called a retrial signal) will retry transmitting the signal after a random amount of time. Observed waiting times of 100 blocked instrument signals are given in Table 3. We constructed control charts using the theoretical formula and estimated the values of the observed data, respectively.

Table 3.
Observed waiting time of signals (min).
It can be seen from Table 3 that the average inter-arrival time was 4.4 min, the average inter-retrial time was 3 min, and the average service time was 2.96 min. Through (3), we obtained the parameters of the control chart as min and min. Based on sample observations, we could calculate the estimated parameters of the control chart as
Figure 6 provides the control charts using theoretical formulas and estimated values. As can be seen in Figure 6, almost all observations were below the expected waiting time, which indicates that the system’s performance exceeded the requirements. We may need to observe large amounts of data over a longer period to make an assessment.
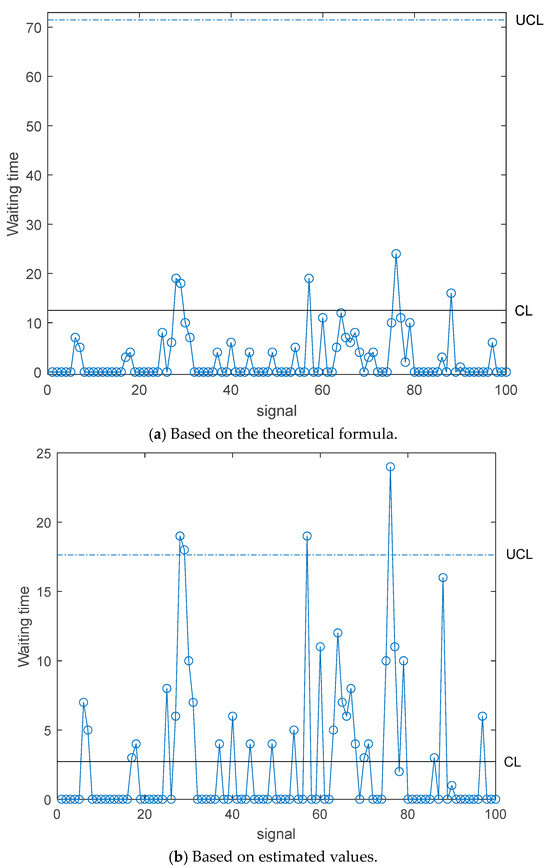
Figure 6.
Control charts using theoretical formulas and estimated values.
On the other hand, in the control charts based on sample observations, the observations moved above and below the central limit. However, four sample observations exceeded the upper control limit. This means that the system was not statistically controlled. This is because environmental factors such as Wi-Fi disconnection or power outage issues caused the data transfer system to disconnect. In other cases, the system was in statistical control.
7. Conclusions
The main objective of this paper is to develop a waiting time control chart for the retrial queue with general service times. We constructed two waiting time control charts, the Shewhart control chart and the control chart using the weighted variance method. For illustration, three different service time distribution cases (exponential, Erlang, and hyper-exponential) for the Shewhart control chart are provided. We also illustrated one exponential service time case for the control chart using the weighted variance method. It is noted that the developed waiting time control chart is mathematically tractable and easy to apply in a spreadsheet. Under various parameter settings, we performed several numerical experiments to study the effects of system parameters and different service time distributions on the developed control chart. Numerical results revealed that the average waiting time and maximum waiting time increased as the values of the arrival rate increased; the average waiting time and maximum waiting time decreased as the values of the service rate and retrial rate increased. These results can help the managers better monitor and analyze the customers’ waiting time for their service system and take preventive measures. The developed waiting time control chart also gives arrivals a basis for deciding whether to join the system and information about waiting times. However, a comparison of waiting times in the retrial queue using a theoretical model and a real model shows a large difference because the system was evaluated only for a short period. If the duration is extended, more accurate results may be obtained, which may confirm the theory. One limitation of this work is that the system manager knows the system parameters. However, the system parameters are generally unknown and must be estimated by the collected samples under practical situations. Since the effects of parameter estimation error on the control charts are critical, it is quite important to choose appropriate metrics for comparison among the surveillance schemes. In future work, we propose three research directions. First, we could consider multiple servers and variations in the arrival rate. Second, to estimate the unknown system parameters, other methods, such as empirical minimization, the sum of squared errors between estimated distributions, moments based on system size, or maximum likelihood estimation can be applied. Once the unknown system parameters are estimated, the control limits of the control charts can be calculated. Third, in addition to the estimation methods, control charts with customized parameters such as the cumulative sum and exponentially weighted moving average charts can be employed for monitoring waiting time.
Author Contributions
Conceptualization, Y.-B.L., T.-H.L., Y.-C.T. and F.-M.C.; methodology, Y.-C.T. and T.-H.L.; software, Y.-C.T. and T.-H.L.; validation, T.-H.L., Y.-B.L. and F.-M.C.; writing—original draft preparation, Y.-C.T. and T.-H.L.; writing—review and editing, Y.-B.L. and F.-M.C.; supervision, Y.-B.L. and F.-M.C. All authors have read and agreed to the published version of the manuscript.
Funding
This research was partially funded by the National Science of Technology Council under grants 112-2221-E-324-016-MY2.
Data Availability Statement
Data are available upon request from the corresponding author.
Conflicts of Interest
The authors declare no conflicts of interest.
Appendix A
In order to derive the formulas for the first two moments of T, we also need the generating function for the number of customers in orbit:
Thus, the first two moments of orbit length are:
Hence, the mean and the second moment of the waiting time are easily obtained with the help of Little’s formula:
Thus, the variance of T is derived as
References
- Shore, H. Control charts for the queue length in a G/G/S system. IIE Trans. 2006, 38, 1117–1130. [Google Scholar] [CrossRef]
- Montgomery, D.C. Introduction to Statistical Quality Control, 5th ed.; John Wiley and Sons, Inc: New York, NY, USA, 2005. [Google Scholar]
- Zhao, X.; Gilbert, K. A statistical control chart for monitoring customer waiting time. Int. J. Data Anal. Tech. Strateg. 2015, 7, 301–321. [Google Scholar] [CrossRef]
- Zhang, M.; Hou, X.; He, Z.; Xu, Y. Performance comparison for the CRL control charts with estimated parameters for high-quality processes. Qual. Technol. Quant. Manag. 2017, 14, 31–43. [Google Scholar] [CrossRef]
- Ebadi, M.; Ahmadi-Javid, A. Socio-economic design of control charts for monitoring service processes: A case study of a restaurant system. Qual. Technol. Quant. Manag. 2019, 16, 726–735. [Google Scholar] [CrossRef]
- Ebadi, M.; Ahmadi-Javid, A. Control charts for monitoring multi-stage service processes with optimal queue performance. Commun. Stat.—Simul. Comput. 2020, 49, 2472–2484. [Google Scholar] [CrossRef]
- Cruz, F.R.B.; Quinino, R.C.; Ho, L.L. Control charts for traffic intensity monitoring of Markovian multiserver queues. Qual. Reliab. Eng. Int. 2020, 36, 354–364. [Google Scholar] [CrossRef]
- Wu, C.H.; Yang, D.Y. Control charts for the expected system size of Markovian queues under F-policy. Qual. Technol. Quant. Manag. 2021, 18, 576–596. [Google Scholar] [CrossRef]
- Sivasamy, R.; Thupeng, W.M.; Kebotsamang, K. A control chart approach to optimize sojourn times of customers in K-policy queues. J. Basic Sci. 2022, 22, 580–588. [Google Scholar]
- Dhinesh Kumar, A.R.; Sandeepkumar, U.; Vignesh, S. Minimizing the waiting time control chart for the multi server Markovian queuing encouraged arrival with infinite capacity model. Eur. Chem. Bull. 2023, 12, 708–723. [Google Scholar]
- Artalejo, J.R. Accessible bibliography on retrial queues: Progress in 2000–2009. Math. Comput. Model. 2010, 51, 1071–1081. [Google Scholar] [CrossRef]
- Kim, J.; Kim, B. A survey of retrial queueing systems. Ann. Oper. Res. 2016, 247, 3–36. [Google Scholar] [CrossRef]
- Phung-Duc, T. Retrial Queueing Models: A Survey on Theory and Applications. arxiv 2017, arXiv:1906.09560. [Google Scholar]
- Dimitriou, I. A two-class queueing system with constant retrial policy and general class dependent service times. Eur. J. Oper. Res. 2018, 270, 1063–1073. [Google Scholar] [CrossRef]
- Li, T.; Zhang, L.; Gao, S. An M/G/1 retrial queue with balking customers and Bernoulli working vacation interruption. Qual. Technol. Quant. Manag. 2019, 16, 511–530. [Google Scholar] [CrossRef]
- Madheswari, S.P.; Kumar, B.K.; Suganthi, P. Analysis of M/G/1 retrial queues with second optional service and customer balking under two types of Bernoulli vacation schedule. RAIRO-Oper. Res. 2019, 53, 415–443. [Google Scholar] [CrossRef]
- Gao, S.; Zhang, D. Performance and sensitivity analysis of an M/G/1 queue with retrial customers due to server vacation. Ain Shams Eng. J. 2020, 11, 795–803. [Google Scholar] [CrossRef]
- Lee, S.W.; Kim, B.; Kim, J. Analysis of the waiting time distribution in M/G/1 retrial queues with two way communication. Ann. Oper. Res. 2022, 310, 505–518. [Google Scholar] [CrossRef]
- Falin, G.I.; Templeton, J.G.C. Retrial Queues; Chapman and Hall: London, UK, 1997. [Google Scholar]
- Falin, G.I.; Martin, M.; Artalejo, J.R. Information theoretic approximations for the M/G/1 retrial queue. Acta Inform. 1994, 31, 559–571. [Google Scholar] [CrossRef]
- Bai, D.S.; Choi, I.S. and R control charts for skewed populations. J. Qual. Technol. 1995, 27, 120–131. [Google Scholar] [CrossRef]
- Jonin, G.L.; Sedol, J.J. Investigation of telephone systems in the case of repeated calls. Latv. Math. Yearb. 1970, 7, 71–83. [Google Scholar]
Disclaimer/Publisher’s Note: The statements, opinions and data contained in all publications are solely those of the individual author(s) and contributor(s) and not of MDPI and/or the editor(s). MDPI and/or the editor(s) disclaim responsibility for any injury to people or property resulting from any ideas, methods, instructions or products referred to in the content. |
© 2024 by the authors. Licensee MDPI, Basel, Switzerland. This article is an open access article distributed under the terms and conditions of the Creative Commons Attribution (CC BY) license (https://creativecommons.org/licenses/by/4.0/).