Article

Investigation of the Misinformation about COVID-19 on YouTube Using Topic Modeling, Sentiment Analysis, and Language Analysis

1
Department of Computer Science, Emory University, Atlanta, GA 30322, USA
2
Program in Linguistics, Emory University, Atlanta, GA 30322, USA
*
Author to whom correspondence should be addressed.
Computation 2024, 12(2), 28; https://doi.org/10.3390/computation12020028
Submission received: 20 December 2023 / Revised: 22 January 2024 / Accepted: 27 January 2024 / Published: 6 February 2024

Abstract

:
The work presented in this paper makes multiple scientific contributions with a specific focus on the analysis of misinformation about COVID-19 on YouTube. First, the results of topic modeling performed on the video descriptions of YouTube videos containing misinformation about COVID-19 revealed four distinct themes or focus areas—Promotion and Outreach Efforts, Treatment for COVID-19, Conspiracy Theories Regarding COVID-19, and COVID-19 and Politics. Second, the results of topic-specific sentiment analysis revealed the sentiment associated with each of these themes. For the videos belonging to the theme of Promotion and Outreach Efforts, 45.8% were neutral, 39.8% were positive, and 14.4% were negative. For the videos belonging to the theme of Treatment for COVID-19, 38.113% were positive, 31.343% were neutral, and 30.544% were negative. For the videos belonging to the theme of Conspiracy Theories Regarding COVID-19, 46.9% were positive, 31.0% were neutral, and 22.1% were negative. For the videos belonging to the theme of COVID-19 and Politics, 35.70% were positive, 32.86% were negative, and 31.44% were neutral. Third, topic-specific language analysis was performed to detect the various languages in which the video descriptions for each topic were published on YouTube. This analysis revealed multiple novel insights. For instance, for all the themes, English and Spanish were the most widely used and second most widely used languages, respectively. Fourth, the patterns of sharing these videos on other social media channels, such as Facebook and Twitter, were also investigated. The results revealed that videos containing video descriptions in English were shared the highest number of times on Facebook and Twitter. Finally, correlation analysis was performed by taking into account multiple characteristics of these videos. The results revealed that the correlation between the length of the video title and the number of tweets and the correlation between the length of the video title and the number of Facebook posts were statistically significant.

1. Introduction

The COVID-19 pandemic constituted a significant threat to public health on a global scale. COVID-19 caused by the SARS-CoV-2 virus was first identified in people who had been infected at a seafood market in Wuhan City, located in the Hubei Province of China, in December 2019 [1]. While the fatality rate of COVID-19 is lower compared to SARS and MERS, the resulting pandemic caused by COVID-19 has been far more severe and catastrophic [2]. As of 6 December 2023, there have been 772,138,818 cases and 6,985,964 deaths worldwide on account of COVID-19 [3].
In the modern-day Internet of Everything living era [4], people increasingly depend on the internet and social media channels as primary sources of healthcare-related information [5,6]. The ubiquitousness of YouTube has made it a globally popular social media platform for seeking and sharing health-related information [7,8]. YouTube’s advantage over other social media platforms resides in its effective utilization of audio and visual interaction, which ensures accessibility for diverse users [9]. However, YouTube has come under scrutiny in the last few years [10] due to its recommendation algorithm that encourages users to continue watching videos by recommending similar content based on their viewing histories. YouTube generates filter bubbles, whereby users are subjected to repeated, uniform, and often biased material, hence reinforcing prejudices and misunderstandings and facilitating the spread of misinformation [11,12]. As a result, analysis of healthcare-related misinformation on YouTube has been widely investigated in the last few years [13,14,15,16,17]. In view of the COVID-19 pandemic and the associated widespread dissemination of misinformation about this pandemic on YouTube, the work presented in this paper aims to perform a comprehensive analysis and investigation of the same.

1.1. Overview of the SARS-CoV-2 Virus and Its Effect on Humans

COVID-19 belongs to the category of coronaviruses (CoVs). Coronaviruses (CoVs) are a specific category of RNA viruses that are composed of four distinct proteins: the spike (S) protein, membrane (M) protein, envelope (E) protein, and nucleocapsid (N) protein. The S protein facilitates the adhesion and identification of the host cell during infection. The M protein plays a role in structuring virions. The E protein is accountable for encapsulating and replication. The N protein is necessary for wrapping RNA into a nucleocapsid. The SARS-CoV-2 virus particle has a diameter ranging from 60 to 140 nanometers. It has a single-stranded RNA genome with a positive sense, consisting of 29,891 base pairs [18,19]. SARS-CoV-2 infection takes place when the S protein attaches to the surface receptor, angiotensin-converting enzyme 2 (ACE2), and penetrates type II pneumocytes, which are located in the human lungs. The S protein plays a crucial role in the transmission caused by SARS-CoV-2. It consists of two regions, namely S1 and S2. S1 is responsible for binding to ACE2, while S2 facilitates fusion with the host cell’s membrane. Equally significant is the splitting of the S protein. Due to the presence of two cleavage sites, the S protein requires cleavage by nuclear proteases in order to facilitate the viral entrance and subsequent infection of the host cell. Prior studies [20,21] have indicated that the S protein of SARS-CoV-2 has a greater affinity for attachment and may account for the increased spread of this disease. The increased spread may also be attributed to the presence of four unique amino acids, namely P681, R682, R683, and A684, which were not previously identified in other coronaviruses [20,21]. An analysis of the infections that occurred in Wuhan in December 2019 has shown that patients have a variety of symptoms in the early stages of becoming infected by this virus. The symptoms include fever, a dry cough, respiratory distress, headaches, dizziness, lethargy, nausea, and diarrhea. However, prior works in this field have indicated that the symptoms of COVID-19 differ across individuals in terms of both the kind and severity of one or more symptoms [22,23].

1.2. Concept of Misinformation Analysis

Misinformation, simply false or inaccurate information, is rampant in an increasingly interconnected world. It may be divided into two main categories: ignorance and true misinformation. Moreover, it is important to distinguish between misinformation and misperceptions. Misinformation deals specifically with information. It is often presented as true only to be proven false otherwise, but the effects of misinformation are typically permanent [24,25,26]. Misinformation can be spread with a purpose, like in anti-science campaigns, but this is not always the case. Due to the consequences of misinformation, its origins and dissemination have been widely studied. As interest in misinformation has renewed in recent times, it is important to explore it from a multidisciplinary lens, including but not limited to culture, society, and technology [25,27,28].
The field of agnotology studies and analyzes how misinformation is created and spread [29]. Misinformation can be spread by fictional media, rumors, myths, urban legends, social media, or even memes. It is important to interpret the contents of misinformation to properly understand how to combat it. A taxonomical approach can be used to categorize and analyze the different aspects of misinformation, typically differentiated between cognitive and motivational [25]. This approach can allow researchers to find the root cause and tackle the source of misinformation. One approach involves the separation of five distinct domains: fake experts, cherry picking, unrealistic expectations, logical fallacies, and conspiracy theories [25,30]. Research also shows that people will stand by misinformation more strongly after being corrected, which is displayed by the “familiarity backfire effect” and “overkill backfire effect” [25,31]. The misinformation on the internet can be tracked through social media platforms.

1.3. YouTube—A Globally Popular Social Media Platform and a Source of Misinformation

As of October 2023, YouTube had 2491 million monthly users [32]. Globally, YouTube is the second most visited website following google.com [33]. It is available in 100 countries and 80 languages, with users collectively watching about 5 billion videos daily [34]. In terms of global traffic, the United States leads with 11.67 billion visits, followed by South Korea (8.25 billion), India (4.2 billion), Brazil (3.59 billion), and Germany (3.49 billion) [35]. More than 122 million people access YouTube on a daily basis, accounting for approximately 25% of the global internet traffic [36]. The average daily time spent on YouTube is 19 minutes [37]. South Korean users spend the highest time on YouTube per month, with 40 hours, followed by India (29.2 hours), Indonesia (26.8 hours), Russia (26.3 hours), and Brazil (22 hours) [38]. The United States leads in monthly YouTube views with 916 billion, followed by India (503 billion), the UK (391 billion), Brazil (274 billion), and Thailand (207 billion) [39]. The platform’s user demographics indicate a female user percentage of 45.6% and a male user percentage of 54.4% [40]. The age group with the highest YouTube user percentage is 25–34 [41]. The platform’s penetration is highest in the United Arab Emirates at 98.7%, followed by Israel (93.1%), Saudi Arabia (91.5%), the Netherlands (91.3%), and the United Kingdom (91.1%) [42]. Despite its widespread usage and influence, it is crucial to note that YouTube is a major conduit for misinformation globally. During the United States Capitol attack on 6 January 2021, YouTube videos played a significant role in fueling extremist emotions. The platform has been criticized for allowing video creators to amplify far-right individuals to boost their profiles [43]. A letter signed by more than 80 groups, including Full Fact in the UK and the Washington Post’s Fact Checker, highlighted the presence of misinformation about COVID-19 and false narratives regarding the United States presidential election on the platform [44]. The letter urges YouTube to commit to funding independent research into misinformation campaigns on the platform, provide links to rebuttals inside videos distributing misinformation, cease promoting repeat offenders through its algorithm, and increase efforts to tackle falsehoods in non-English-language videos [44].
Prior works in this field have revealed that YouTube has served as a source of misinformation during public health emergencies, such as the H1N1, Ebola, and Zika outbreaks. The investigations revealed that about 23% to 26.3% of YouTube videos related to these outbreaks contained misinformation [45,46,47]. Since the outbreak of COVID-19, YouTube has played a major role in the dissemination of information as well as misinformation [48,49]. While some prior works in this field have focused on the analysis of misinformation on YouTube, those works have multiple limitations (as discussed in detail in Section 2), and a comprehensive investigation of misinformation in the context of COVID-19 as disseminated via YouTube is yet to be conducted. This study aims to address this research gap by presenting the findings of a comprehensive investigation and analysis of the data of 8122 YouTube videos that contained misinformation in the context of COVID-19. The rest of this paper is organized as follows. A review of recent works in this field is outlined in Section 2. Section 3 discusses the step-by-step methodology that was followed. The results are presented and discussed in Section 4, which is followed by the conclusion and scope for future work in Section 5.

2. Literature Review

2.1. Review of Misinformation Analysis on YouTube

Misinformation analysis on YouTube has attracted the attention of researchers from different disciplines in the last decade and a half [50]. An analysis of videos regarding the 2020 election showed that videos with correct information were common, but it was easy to find videos containing misinformation, and it was even easier for them to be recommended. YouTube’s recommendations may be the most vital part of the misinformation, as many studies found that videos containing misinformation were easily recommended and that 70% of the viewership came from recommendations [51]. Yoon et al. [52] reviewed videos with a 9-day crowd-sourced audit that suggested fenbendazole could cure cancer, and they found that the information was spread via both human and algorithm recommendations.
In another study, where the network analysis of videos regarding the Zika virus in Brazil was performed, the researchers found that though the top videos on that topic were typically trustworthy, the misinformation was easily accessible [53]. A similar analysis was performed by Tang et al. [54] on anti-vaccine videos. They found that the YouTube algorithm recommended videos containing misinformation. The work of Betschart et al. [55] reported that many videos on YouTube that may contain misinformation were promoted to increase viewership, which directly led to an increased dissemination of misinformation.
Qi et al. [56] analyzed YouTube videos found through a search using the keyword “psoriasis”. The videos were ranked on information quality on a quality scale of 1 to 5. They found that 17% of videos were helpful, 21% contained misinformation, and 62% were from patients regarding their experiences with psoriasis. The work of Loeb et al. [57] reported that many of the most popular videos about prostate cancer on YouTube contained misinformation. Goobie et al. [58] analyzed videos on idiopathic pulmonary fibrosis using HONCode and DISCERN. After analyzing the first 200 videos that were found using the keyword search “idiopathic pulmonary fibrosis”, they found that content scores were higher in videos published by organizations or medical professionals, and they were not high for videos published by industry or for-profit organizations and independent users. Chidambaram et al. [59] performed a cross-sectional study regarding YouTube videos about the human gut microbiome, also using DISCERN. The findings showed that there was no correlation between viewership and DISCERN scores.
An analysis of videos about urological conditions on YouTube was performed by Selvi et al. [60]. The results showed that the percentage of reputable videos was only 77.2% and people still viewed a considerable number of videos containing misinformation. In the context of misinformation analysis, the “Momo Challenge” garnered a significant amount of attention from the global audience. It is an internet hoax that claimed a user named Momo would harass children online into performing dangerous acts. Though the challenge was debunked as a hoax, concerned parents still viewed videos about this topic on YouTube as reported in prior works in this field [61,62]. In an analysis of YouTube videos about polycystic ovarian syndrome (PCOS), Malhotra et al. [63] analyzed comments using the Benjamini–Hochberg Procedure and sentiments with SentiStrength. The analysis revealed that men and women had different feelings about PCOS with men being more heavily associated with misinformation about home remedies or a cure. Tam et al. [64] analyzed videos on both YouTube and TikTok. They found that TikTok was more prevalent for misinformation.
In ref. [65], the authors analyzed misinformation about urological health on YouTube and commented that the clinical impact of misinformation is yet to be fully studied and understood. In a study of misleading claims about tobacco use, Albarracin et al. [66] found that young adults mostly watched videos that contained misinformation. They also found that people were more inclined to view tobacco products more positively after watching the videos even if their overall view of tobacco did not change. Regardless, the true nature of misinformation across social media remains an understudied field, especially as misinformation and access to it on the internet increase every day. Furthermore, the generation and dissemination of misinformation about COVID-19 since the beginning of the pandemic has been widely investigated by researchers from different domains. A review of recent studies in this area of research is presented in Section 2.2.

2.2. Review of Misinformation Analysis on YouTube in the Context of COVID-19

The literature on COVID-19 misinformation on YouTube reveals a concerning trend in the spread of false information, particularly regarding vaccines and related health topics. Previous studies have highlighted the surge of conspiracy theory-related videos on the platform, emphasizing that a significant portion of highly viewed YouTube content on COVID-19 contains misleading information [8,9,10,11,12]. As YouTube continues to grow as a prominent source of health information, the dissemination of such misinformation has reached unprecedented levels compared to past public health crises.
Addressing the challenge of combating misinformation on YouTube is a complex challenge. The work by Li et al. [67] showed that videos providing reputable information about COVID-19 vaccines faced a higher ratio of dislikes to likes compared to entertainment videos containing nonfactual information related to vaccines. The work of Calvo et al. [68] involved a comprehensive examination of the spread of misinformation about COVID-19 vaccines on YouTube. The work reported that YouTube was responsible for propagating misinformation and revealed close connections between misinformation and hoaxes in this context. The work of Dutta et al. [69] involved performing assessments of content reliability on YouTube. The findings revealed low mean DISERN and mean MICI scores. Donzelli et al. [70] found that the tone of YouTube videos significantly influenced vaccine hesitancy, with negative-toned videos garnering more views, likes, and shares, perpetuating the spread of misinformation.
Prior works in this field have indicated that the profit-driven motivations of content creators on YouTube contribute to the dissemination of COVID-19 misinformation. Tactics employed to evade content moderation include keyword substitution, on-screen text, hand gestures, and utilizing other services to ensure widespread circulation, ultimately promoting products and spreading misinformation [71]. A study conducted between July 2020 and December 2020 by Basch et al. [72] revealed a drastic increase in videos focusing on fear, concerns about effectiveness, and adverse reactions to COVID-19 vaccines, negatively impacting the population’s vaccination uptake. The work by Quinn et al. [73] reported that misinformation extended to medical professionals who, in some cases, spread false information about vitamin D and its purported effects on COVID-19. Despite the challenges of detecting misinformation, researchers have proposed various methods, including the use of comments as a feature for detection and textual analysis of video scripts to enhance the accuracy of the underlining models [74,75]. A prior work in this field highlighted that video description, negative content, and channel credibility as key features driving the viral transmission of misinformation [76]. Despite the fact that there have been multiple works related to misinformation analysis on YouTube in the context of COVID-19, these works have multiple limitations. To add to this, none of the prior works in this field related to misinformation analysis about COVID-19 on YouTube have focused on topic modeling. In a generic manner, topic modeling is a methodology that comprises different algorithms that identify, comprehend, and annotate the thematic structure in a collection of documents [77]. Topic modeling of the information on the web has had multiple applications related to the investigation of the perception, preparedness, response, views, and opinions of the general public during different virus outbreaks in the recent past, such as MPox [78], human papillomavirus [79], Zika virus [80], Middle East respiratory syndrome [81], dengue [82], and the flu [83]. In summary, the following research gaps exist in relation to misinformation analysis about COVID-19 on YouTube:
(a)
A lack of focus on topic modeling: Several works in this field [67,68,69,70,71,72,73,74,75,76] have focused on content analysis of YouTube videos. However, none of the prior works in this field have analyzed the video descriptions associated with YouTube videos to interpret the underlying topics and associated themes of misinformation.
(b)
A lack of focus on sentiment analysis related to specific themes or focus areas of misinformation dissemination on YouTube: A prior work in this field [70] performed sentiment analysis in the context of misinformation about COVID-19 on YouTube. However, that work evaluated the sentiment by considering all the videos in a collective manner and did not take into account the sentiment related to different topics or themes of misinformation that those videos or the video descriptions focused on.
(c)
A lack of focus on the detection and analysis of the language used in video descriptions of YouTube videos: YouTube allows the usage of multiple languages in video descriptions at the time of publication of videos. As a result, this social media platform has attracted content creators from different parts of the world who use different languages in their video descriptions. None of the prior works in this field have focused on the detection of languages used in the descriptions of videos containing misinformation or identifying trends of the same.
(d)
The lack of a study that takes into account a considerably high number of YouTube videos: The prior works in this field, for instance, the works of Quinn et al. [73], Basch et al. [72], Li et al. [9,67], Dutta et al. [69], Donzelli et al. [70], Christodoulou et al. [75], Serrano et al. [74], Calvo et al. [68], Machado et al. [71], and Xie et al. [76], analyzed 77, 100, 150, 150, 240, 560, 1000, 1672, 1890, 3318, and 4445 YouTube videos, respectively. The number of YouTube videos investigated in these studies does not represent a considerable percentage of the total number of videos containing misinformation about COVID-19 that have been published on YouTube since the beginning of this pandemic.
The work presented in this paper aims to address these limitations by performing topic modeling, topic-specific sentiment analysis, topic-specific language analysis, and correlation analysis using the data of 8122 YouTube videos that contained misinformation in the context of COVID-19. The step-by-step methodology that was followed for this work is presented in Section 3, and the results are discussed in Section 4.

3. Methodology

For performing the research work presented in this paper, the dataset developed by Knuutila et al. [84] was used. This dataset contains the metadata of 8122 YouTube videos that contained misinformation related to COVID-19. Furthermore, these videos were shared on different social media platforms between November 2019 and June 2020. The dataset includes the title and description of these videos. To add to this, the dataset also comprises information related to the sharing patterns of these videos on social media platforms such as Facebook and Twitter. For developing the master dataset for the tasks described in this research paper, the creation of four new attributes was necessary. These attributes represented the language of the video title, the language of the video description, the translated version (in English) of the video title, and the translated version (in English) of the video description. To generate these four attributes, Google Translate API V3 was used [85]. Figure 1 shows the step-by-step process that was followed in this regard for the development of the master dataset.
Thereafter, topic modeling using the Latent Dirichlet Allocation (LDA) approach was applied to the translated versions of the video descriptions. LDA [86,87] is a probabilistic model extensively used in natural language processing and machine learning for topic modeling, that aims to identify topics within a document collection. In the LDA framework, topics are generated through a uniform Dirichlet prior shared across all documents. The procedural steps [88] for constructing a corpus for an LDA are outlined as follows:
  • Select a multinomial distribution ϕ z for each topic z from a Dirichlet distribution with parameter β .
  • For every document d, select a multinomial distribution θ d from a Dirichlet distribution with parameter α .
  • In document d, for each word w, select a topic z, such that z 1 K   from the multinomial distribution θ d .
  • Select w from the multinomial distribution θ z .
This procedure, outlined in Equation (1), forms the basis for representing the likelihood of generating a corpus using LDA.
P D o c 1 , . , D o c N α , β = z = 1 K P ϕ z β d = 1 N P θ d α i = 1 N d z i = 1 K P z i θ P w i z , ϕ d θ d ϕ
In LDA, a k-parameter hidden random variable is employed for topic distribution instead of a large set of features, to address overfitting and document generation issues encountered in pLSI [87]. For information retrieval in LDA, the query likelihood model is utilized, scoring each document based on the likelihood of its model generating a query Q, as expressed in Equations (2) and (3). In Equation (2), D represents a model for documents, Q is the query, and q denotes an individual term in the query Q. P Q | D signifies the probability of the document model generating query terms under the assumption of a “bag-of-words”, treating terms as independent. P q i D is determined by the document model with Dirichlet smoothing. Equation (3) calculates P w D , the maximum likelihood estimates of word w in document D, with P w c o l l   representing the same word w in the entire collection and μ indicating the Dirichlet prior.
Notably, each topic in an LDA model signifies a specific word combination, but this approach may not consistently match the accuracy of non-topic models like unigram or bigram analysis. Consequently, directly implementing the LDA model may impact the overall information retrieval performance. A prior work in this field combined the original document model (Equation (3)) with the LDA model to construct a new LDA-based document model, as shown in Equation (4). Following the acquisition of posterior estimates for θ and φ , the word probability within a document is computed using Equation (5), where θ ^ and ϕ ^ represent the posterior estimates of θ and , respectively [88].
P Q D = q Q   P q D
P w D = N d N d + μ P M L w D + 1 N d N d + μ P M L w c o l l
P w D = λ N d N d + μ P M L w D + 1 N d N d + μ P M L w c o l l + 1 λ P l d a w D
P l d a w d , θ ^ , ϕ ^ = z = 1 K P w z , ϕ ^ P z θ ^ , d
Direct inference cannot solve LDA, so Gibbs sampling is utilized to approximate θ ^ and ϕ ^ , with α and β serving as hyperparameters determining the smoothness of the empirical distribution. Gibbs sampling involves iterating over variables z1, z2, z3, …, z n , where z i is sampled from P z i z \ i , w   in each iteration, collectively known as a Gibbs sweep. After numerous iterations, the Gibbs sampling produces samples from P z w , achieved by jointly resampling all topics. In this approach, a Gibbs sweep encompasses hidden topic variables, considering both original and new documents. Initially, topic variable sampling for the training set occurs, ensuring convergence without new documents. Subsequently, topic variables are randomly initialized, and sampling occurs again, leading to model convergence while considering all documents. At this stage, the topic distribution, θ d , can be estimated using a single Markov chain state, as illustrated in Equation (6), where n . | d represents the length of the document.
θ ^ t | d = α t + n t | d t α t + n . | d
The pseudocode of the program that was written in Python 3.11.5 to implement LDA and to determine the optimal number of topics is shown in Algorithm 1.
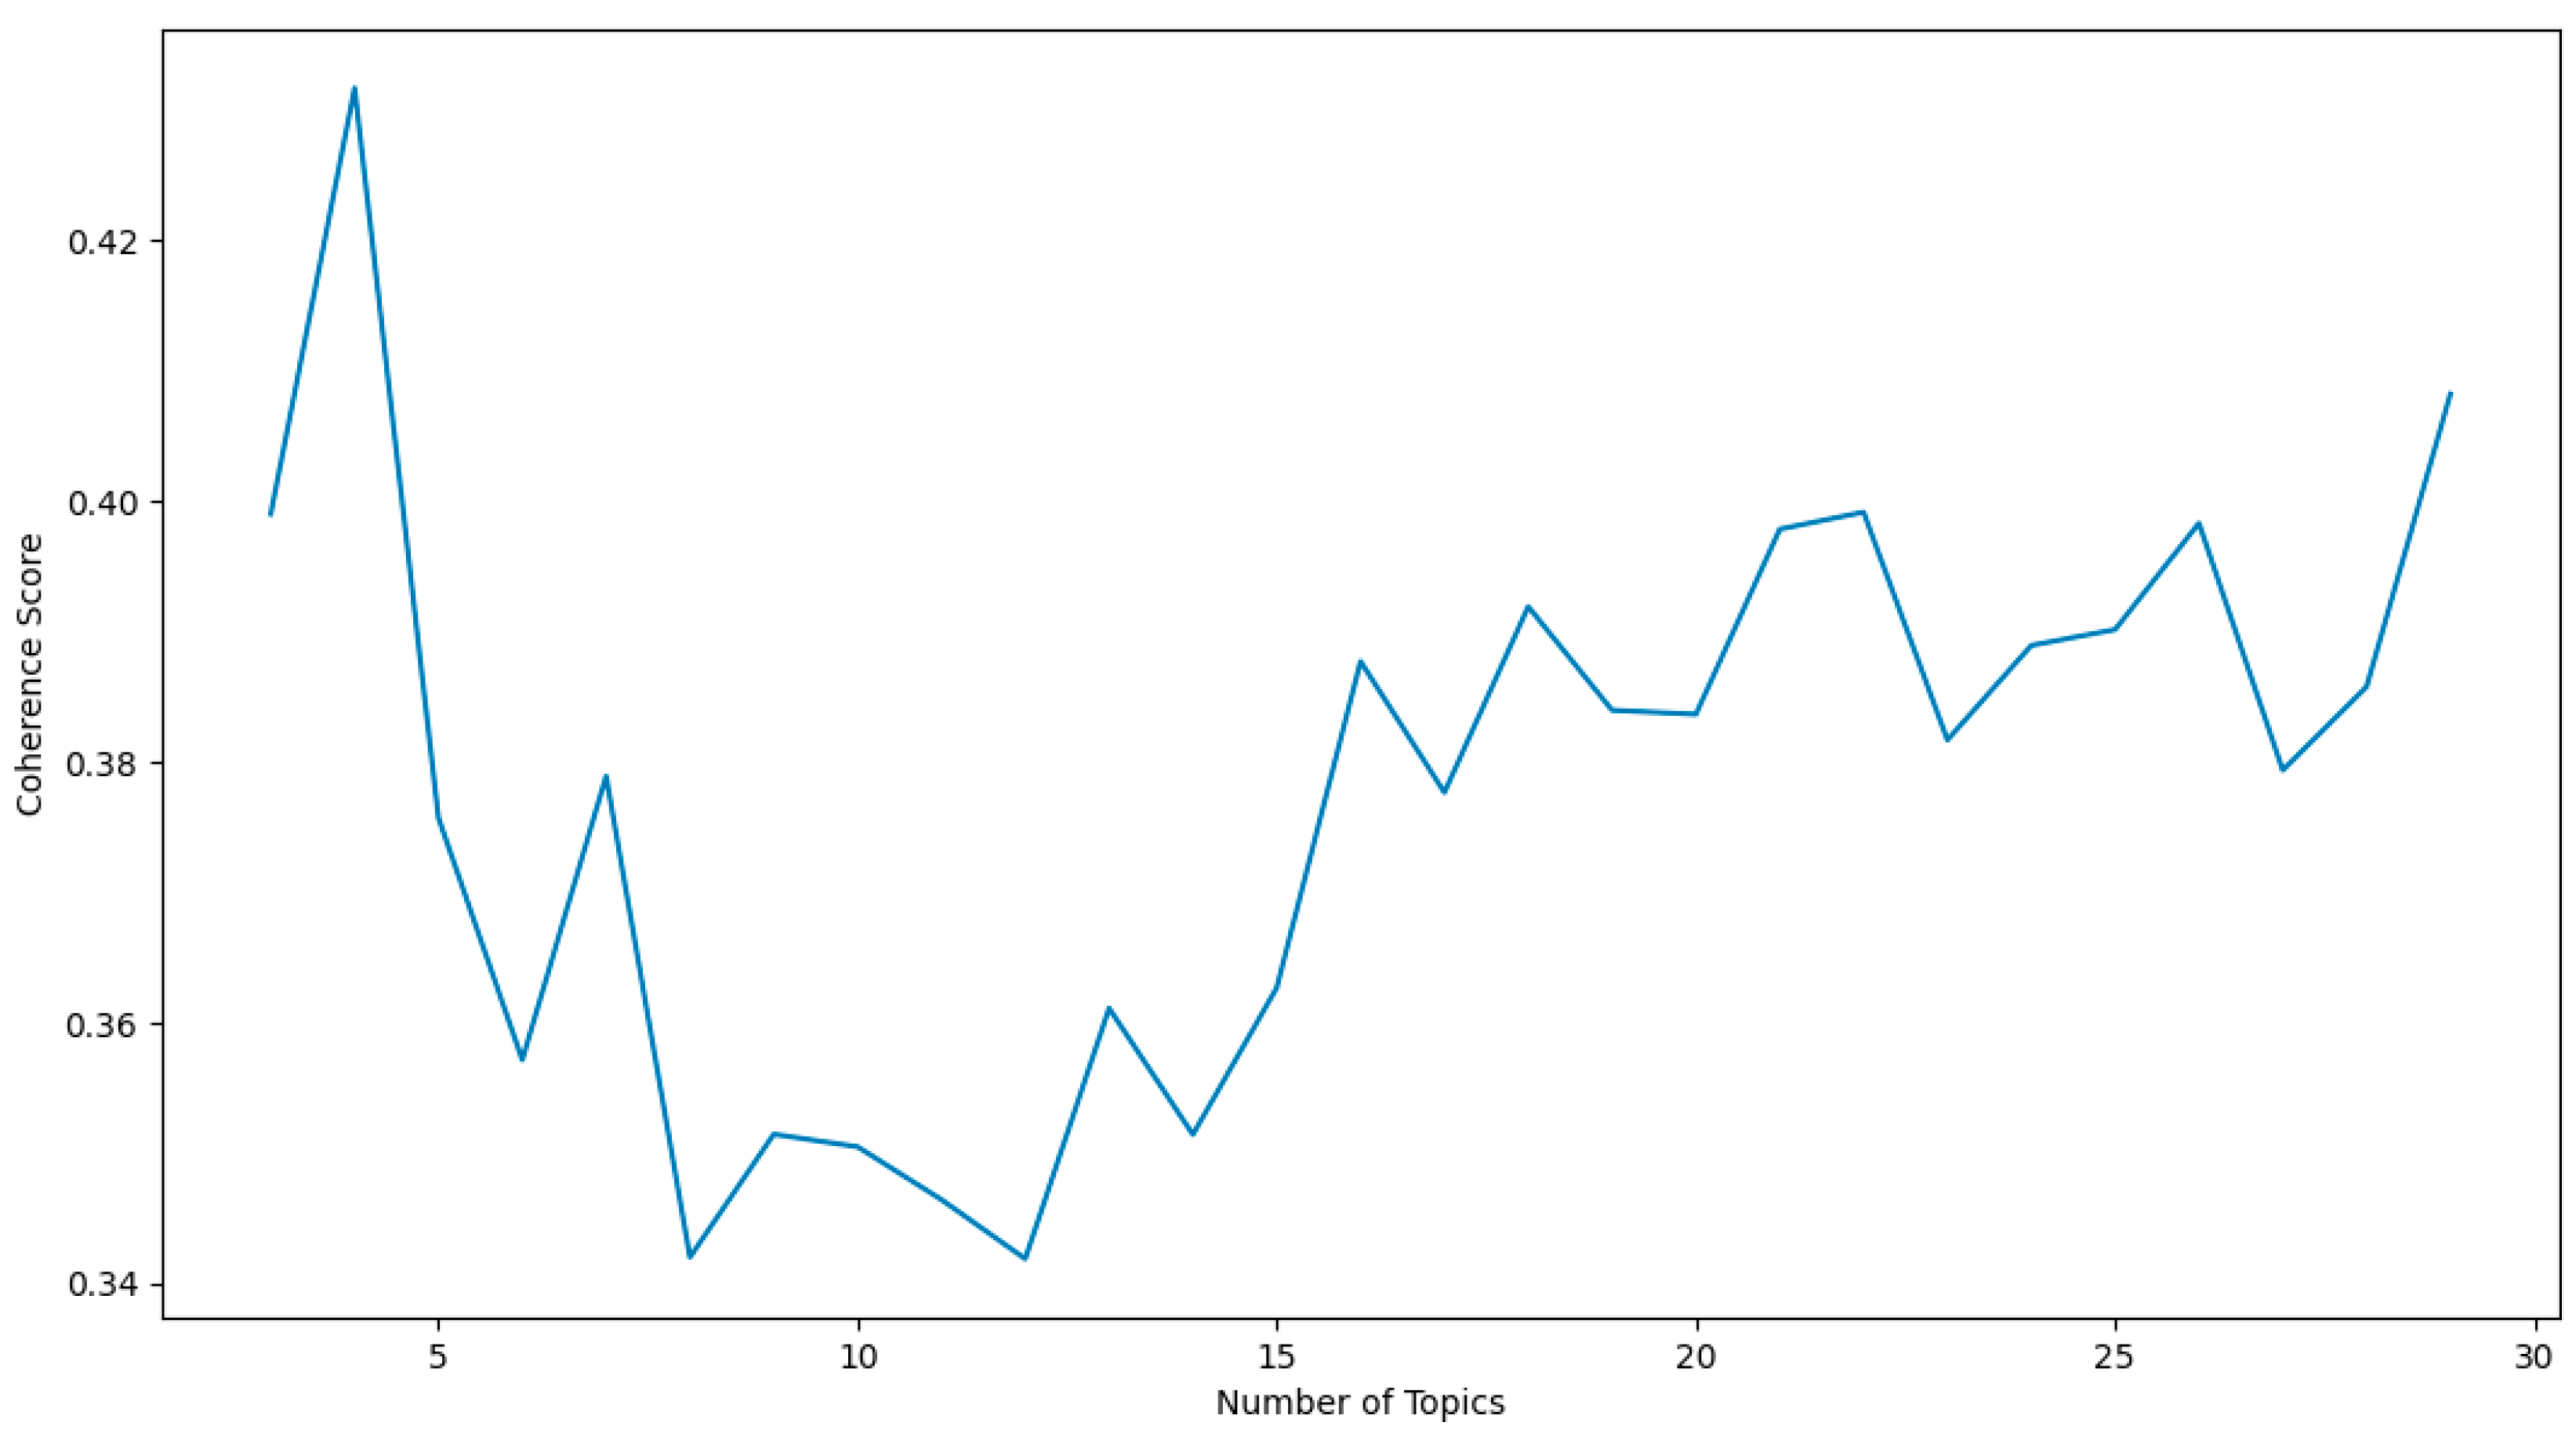
Algorithm 1: Determine the optimal number of topics
Input: Misinformation CSV Dataset
Output: LDA model topics, coherence scores, perplexity, and a plot of coherence scores
nltk, re, numpy, pandas, gensim, spacy, matplotlib := Import libraries
df := Read Input CSV into DataFrame
data := Convert ‘final_description’ column to list
  
for each item in data do:
  item ← clean (text)
  address missing values
end of for loop
  
def sent_to_words(sentences):
  for each item in sentence do:
    yield(gensim.utils.simple_preprocess(str(sentence), deacc=True))
end of function
  
data_words := tokenize the cleaned data
bigram_mod = gensim.models.phrases.Phraser(bigram)
trigram_mod = gensim.models.phrases.Phraser(trigram)
data_words_nostops ← stopwords from data_words
data_words_bigrams ← Apply bigram model to data_words_nostops
nlp := Load Spacy English model for lemmatization
  
def lemmatization(texts, allowed=[‘noun’, ‘adj’, ‘verb’, ‘adv’]):
  texts_out = []
  for each item in data do:
    data_lemmatized ← lemmatize token
    return texts
  end of for loop
end of function
  
id2word := Create dictionary from data_lemmatized
corpus := Create corpus from data_lemmatized
lda_model := Build LDA model with corpus and id2word
for each number of topics from 3 to 30 do:
  lda_model_temp := build LDA model with current number of topics
  coherence_score ← coherence score of lda_model_temp
  perplexity ← model’s perplexity
end of for loop
plot coherence scores against the number of topics
  
opt_lda_model := Build an LDA model with 4 topics
coherence_lda ← coherence score of opt_lda_model
df_topic_sents_keywords := Extract dominant topics, percentage contributions, and keywords for each document
df_dominant_topic := Convert df_topic_sents_keywords to DataFrame and reset index
data := Initialize empty list for CSV data
for each document in df_dominant_topic do:
  temp := Extract document number, dominant topic, topic percentage contribution, keywords, and text
  append temp to data
write data to CSV file
As can be seen in Algorithm 1, the data preprocessing was performed prior to topic modeling. The data preprocessing involved the removal of nonalphabetic characters, URLs, hashtags, user mentions, stop words, and numbers. It also involved the identification of English words using tokenization as well as the application of stemming and lemmatization. After performing data preprocessing, the missing values were addressed. There were multiple rows that presented missing values in the dataset either due to the video description being missing in the original data file or the video description in the original data file comprising only characters that were removed during data preprocessing resulting in a missing value. Such rows (a total of 1722) were removed from the dataset prior to performing topic modeling and related analysis to ensure that missing values for the video description were not considered as a separate topic by the topic modeling algorithm. This program computed the coherence score by varying the number of topics from 3 to 30. Thereafter, the variation of coherence scores for the number of topics was analyzed to compute the optimal number of topics in the available data. Upon determination of the same, the dominant topic for the video description was computed. The pseudocode of the program that was written in Python 3.11.5 to determine the dominant topic for the video description is shown in Algorithm 2.
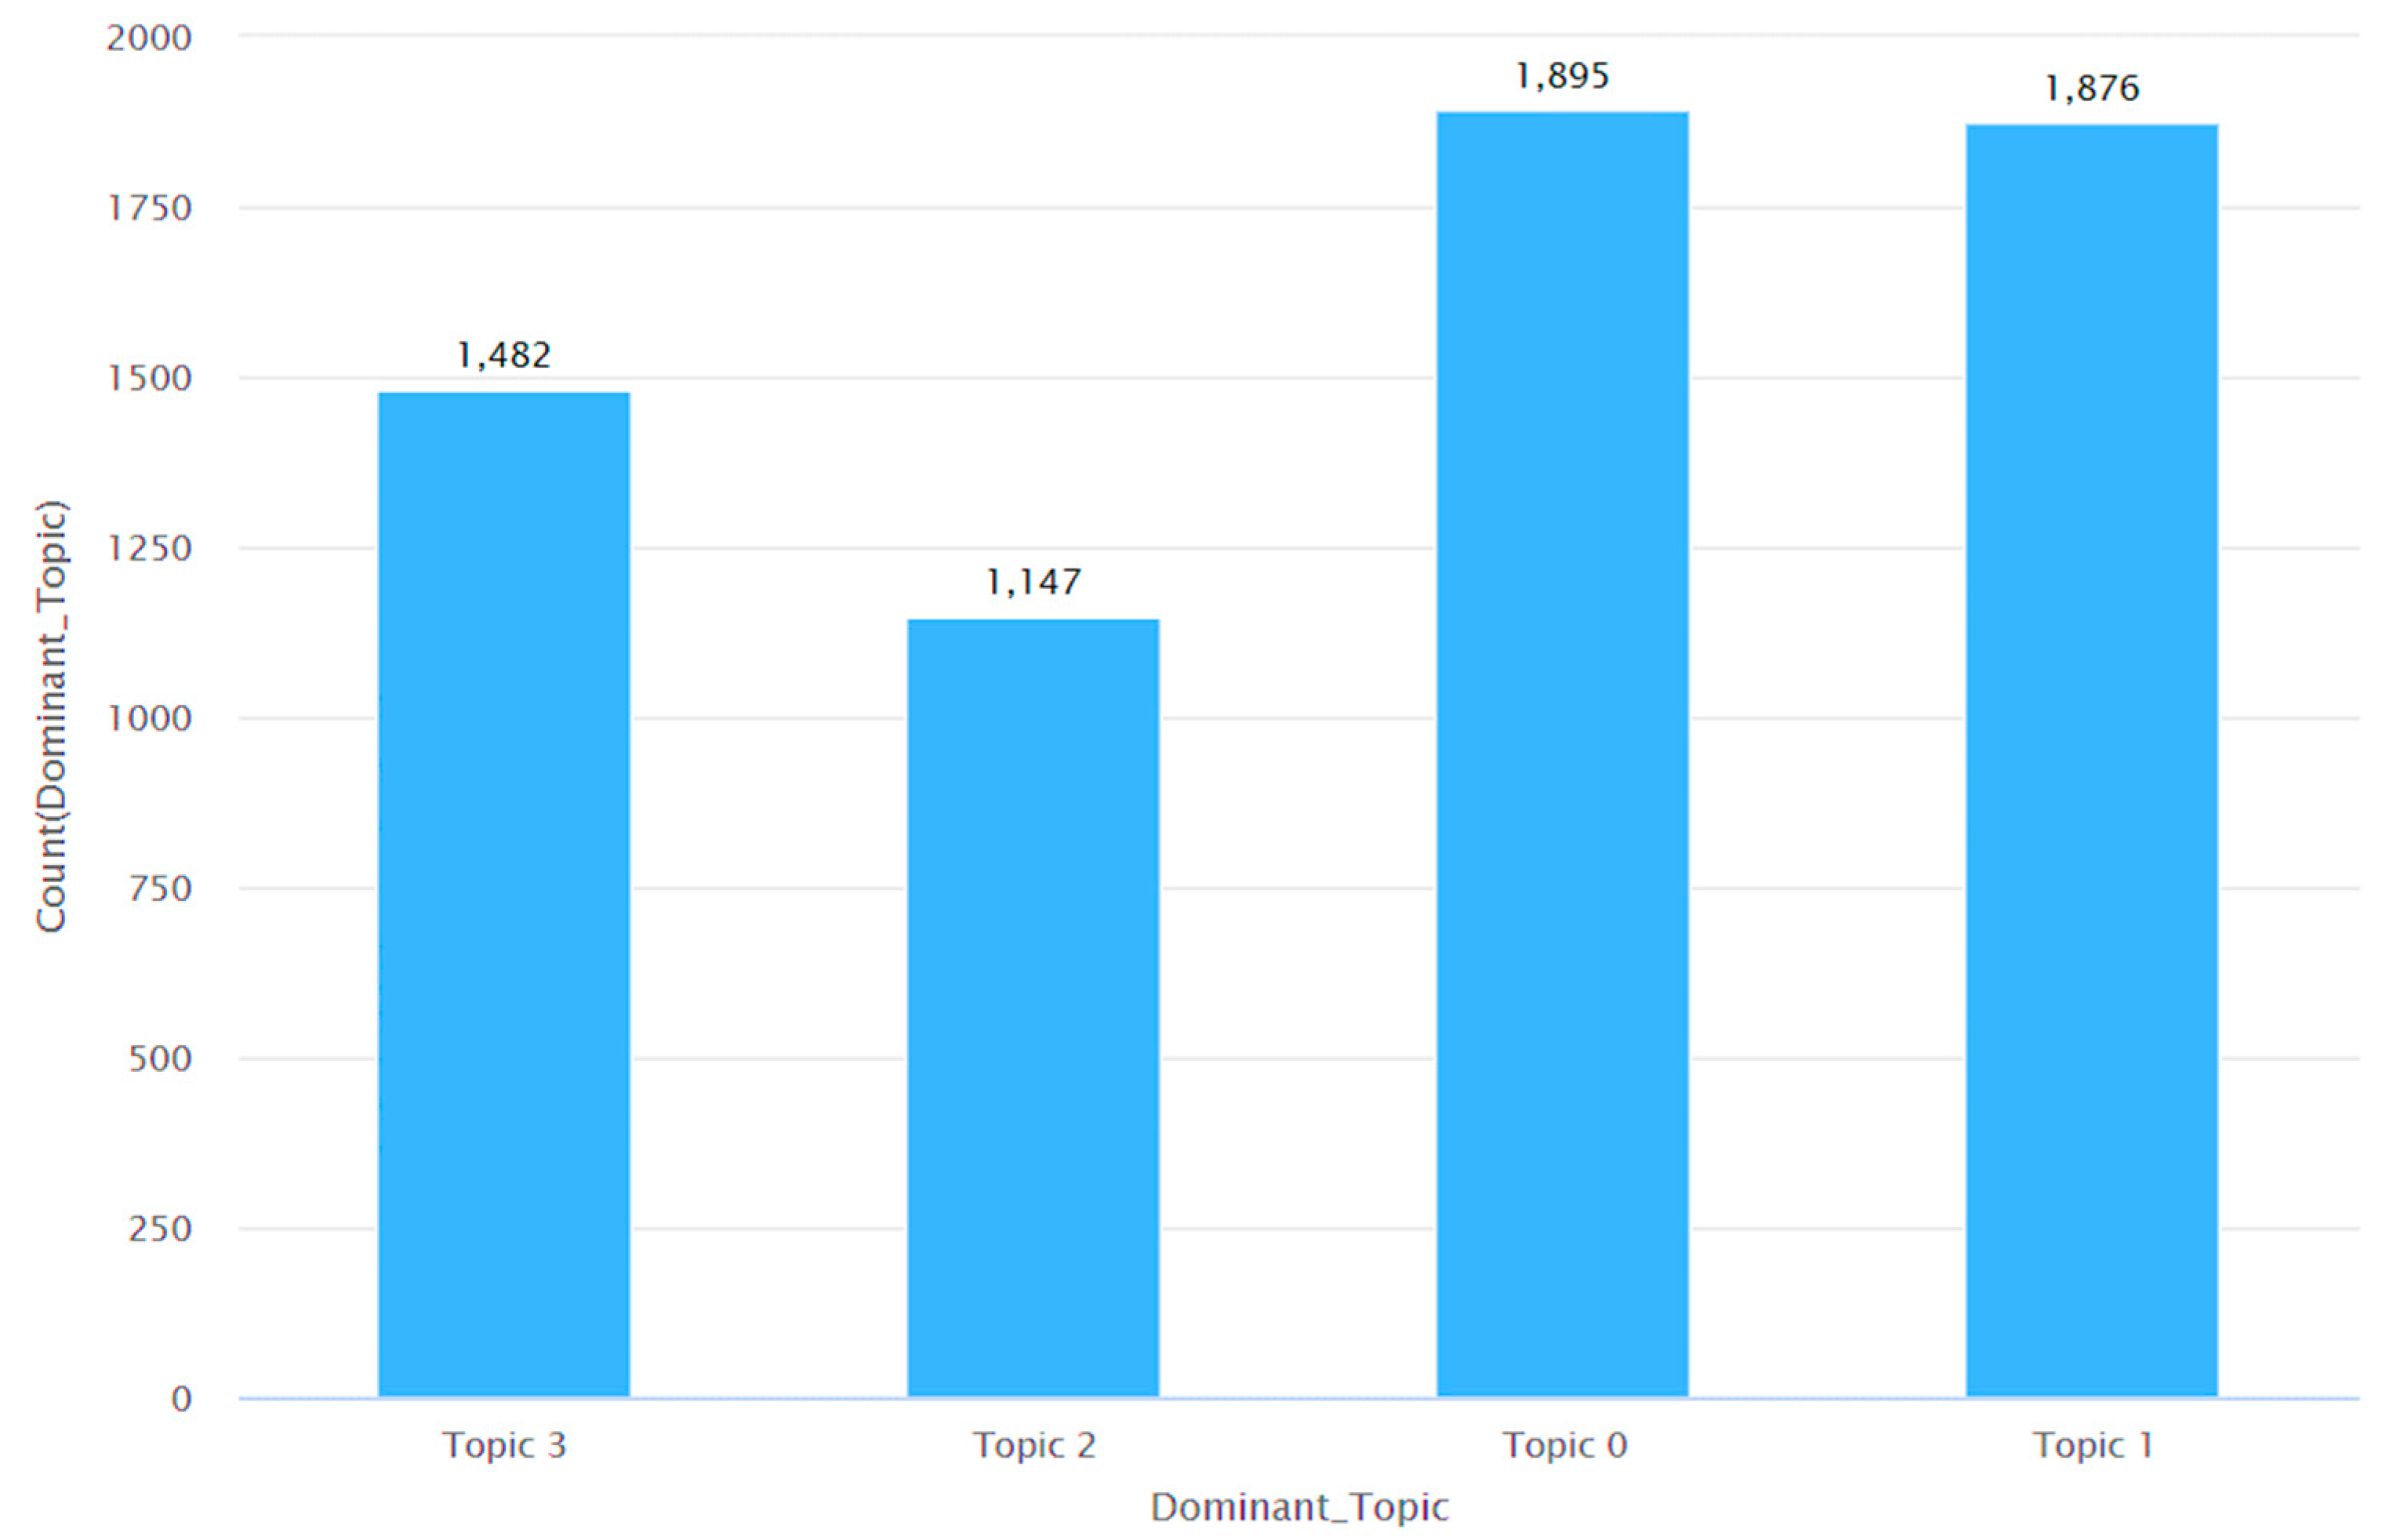
Algorithm 2: Determine the dominant topic per video description
Input: Misinformation CSV Dataset
Output: LDA model topics, coherence scores, perplexity, and a plot of coherence scores
nltk, re, numpy, pandas, gensim, spacy, matplotlib := Import libraries
df := Read Input CSV into DataFrame
data := Convert ‘final_description’ column to list
  
def sent_to_words(sentences):
  for each item in sentence do:
    yield(gensim.utils.simple_preprocess(str(sentence), deacc=True))
end of function
  
data_words := tokenize the cleaned data
bigram_mod = gensim.models.phrases.Phraser(bigram)
trigram_mod = gensim.models.phrases.Phraser(trigram)
data_words_nostops ← stopwords from data_words
data_words_bigrams ← Apply bigram model to data_words_nostops
nlp := Load Spacy English model for lemmatization
  
def lemmatization(texts, allowed=[‘noun’, ‘adj’, ‘verb’, ‘adv’]):
  texts_out = []
  for each item in data do:
    data_lemmatized ← lemmatize token
    return texts
  end of for loop
end of function
  
def determine_dominant_topic():
    for each row_list in enumerate(ldamodel[corpus]) do:
      row = row_list[0] if ldamodel.per_word_topics else row_list
      sort (row)
      for each prop_topic in enumerate(row):
        if loop var is 0:
          wp = ldamodel.show_topic(topic_num)
          lists1 = int(topic_num), round(prop_topic, 4), topic_keywords
          final.append(lists1)
        else:
          break
      end of for loop
    topics_df = df(cols=[Dominant_Topic, Perc_Contribution, Topic_Keywords])
    concatenate cols
    end of for loop
end of function
  
for each document in df_dominant_topic do:
  tmp.append(Document_No)
  tmp.append(Dominant_Topic)
  tmp.append(Topic_Perc_Contrib)
  tmp.append(Keywords)
  tmp.append(Text)
  append temp to data
end of for loop
write data to CSV file
Thereafter, the visualization of the topic clusters in a 2D space was performed using the t-SNE (t-distributed stochastic neighbor embedding) algorithm [89]. t-SNE is a methodology that relies on the principles of stochastic neighbor embedding. t-SNE is used to reduce the dimensionality of high-dimensional data in order to visualize it in a lower-dimensional environment of two or three dimensions. This approach is nonlinear in nature. The algorithm assigns a specific position on a two- or three-dimensional map to each data point. More precisely, it represents each object in a high-dimensional space as a point in a two- or three-dimensional space. This representation ensures that related objects are represented by points that are close to each other, while different objects are represented by points that are far apart with a high likelihood. The t-SNE method consists of two primary steps. t-SNE first creates a probability distribution for pairs of high-dimensional objects, where objects that are similar are given a greater probability and objects that are different are given a lower likelihood. Thereafter, t-SNE establishes a comparable probability distribution across the data points in the lower-dimensional map. It does this by minimizing the Kullback–Leibler divergence (KL divergence) between the two distributions, taking into account the positions of the points on the map [90].
Then, sentiment analysis was performed for each topic. Sentiment analysis, also known as opinion mining, is the process of using algorithms to analyze and understand the attitudes, perspectives, and emotional expressions of people towards a certain subject. This subject may include a wide range of items, such as people, incidents, or concepts [91]. The phrases sentiment analysis (SA) and opinion mining (OM) are sometimes used interchangeably, indicating the same underlying meaning. However, multiple scholars have proposed nuanced differences between OM and SA [92,93]. Opinion mining is the process of extracting and analyzing people’s views on a certain subject. In contrast, sentiment analysis aims to detect and analyze the underlying sentiment expressed in something. Therefore, SA aims to discover viewpoints, analyze the emotions they express, and categorize these emotions according to their intensity. The classification process may be visualized as a hierarchical structure consisting of three tiers: document-level, sentence-level, and aspect-level sentiment analysis. The main goal at the document level is to classify a complete opinion document as either conveying a positive or negative viewpoint. In this context, the document serves as the main piece of data, usually centered on one broad topic or issue. The objective of sentence-level sentiment analysis is to categorize the emotion expressed in each sentence. The first stage is differentiating between subjective and objective phrases. For subjective statements, sentence-level sentiment analysis determines if they express positive or negative views [94]. Wilson et al. [95] emphasized that emotional articulation may not necessarily be subjective. Nevertheless, the difference between document- and sentence-level categories is not inherently substantial since sentences may be seen as succinct texts [96].
Although document- and sentence-level classifications provide helpful knowledge, they sometimes lack the detailed information required to evaluate perspectives on different aspects of the item. In order to obtain a thorough insight, aspect-level sentiment analysis is used. This level of analysis aims to classify emotions based on certain characteristics or qualities linked to entities. The first phase is identifying these entities and their corresponding features. Crucially, individuals with opinions may express various feelings about different features of the same thing. SA and OM are complex processes that involve analyzing many levels of information, ranging from overall texts to distinct lines. It also involves evaluating particular elements associated with entities in a detailed and sophisticated manner. Sentiment analysis is beneficial in revealing the network of views and emotions conveyed in textual data, which can have many potential applications [97].
The analysis of sentiment can involve various methodologies, including human annotation, Linguistic Inquiry and Word Count (LIWC), Affective Norms for English Words (ANEW), the General Inquirer (GI), SentiWordNet, and machine learning algorithms, such as Naïve Bayes, maximum entropy, and the support vector machine (SVM). The approach used in this research involved using VADER, which stands for Valence Aware Dictionary for Sentiment Reasoning [98]. This decision to choose VADER as the approach for sentiment analysis was due to several factors. To begin with, VADER exhibits exceptional efficiency, exceeding manual annotation in terms of both accuracy and effectiveness. Moreover, prior studies [99,100] have shown that VADER proficiently overcomes the constraints faced by other methods of sentiment analysis.
The VADER approach is distinguished by its use of a concise rule-based framework, which allows for the development of a customized sentiment analysis engine designed specifically for the language often used on social media platforms. The approach demonstrates exceptional flexibility by seamlessly adapting to many situations without the need for domain-specific learning data. Instead, it employs a flexible sentiment vocabulary based on valence, which has been thoroughly evaluated by human experts to ensure its reliability. The VADER technique is well recognized for its extraordinary effectiveness since it can evaluate data in real time. Additionally, it is worth noting that VADER is readily available without any requirements for subscription or purchase. VADER also has the capability to assess the degree of sentiment conveyed in texts [99,100]. The pseudocode of the program that was written in Python 3.11.5 to determine the distribution of positive, negative, and neutral sentiment per topic using VADER is shown in Algorithm 3. Thereafter, the distribution of languages per topic was computed. The pseudocode of the program that was written in Python 3.11.5 to perform this analysis is shown in Algorithm 4. The flowchart shown in Figure 2 summarizes the workings of Algorithms 1–4 on the master dataset.
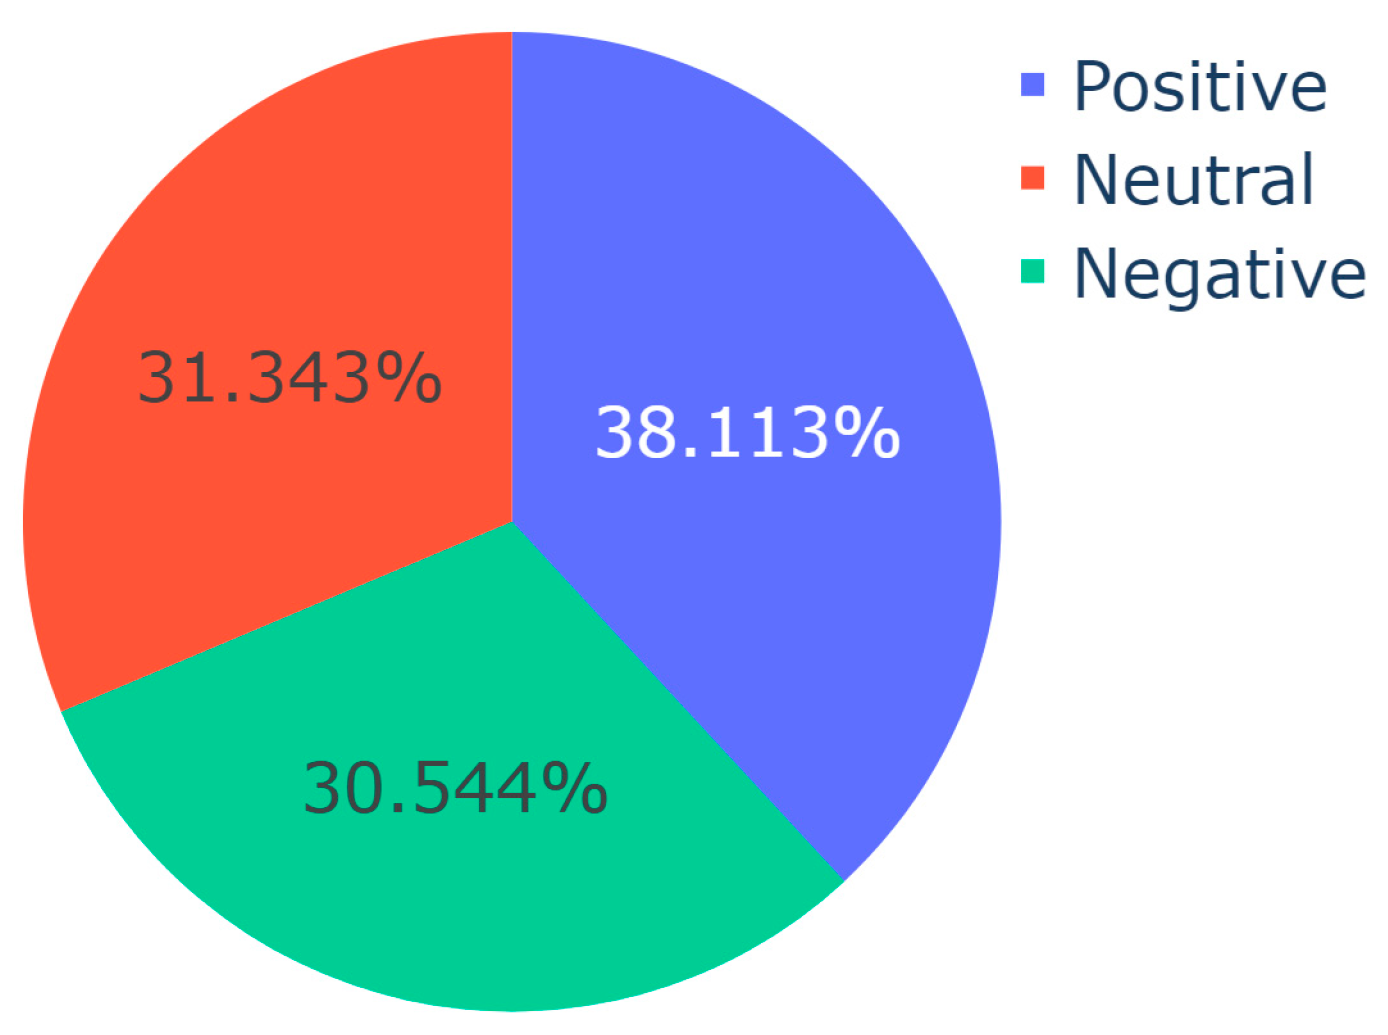
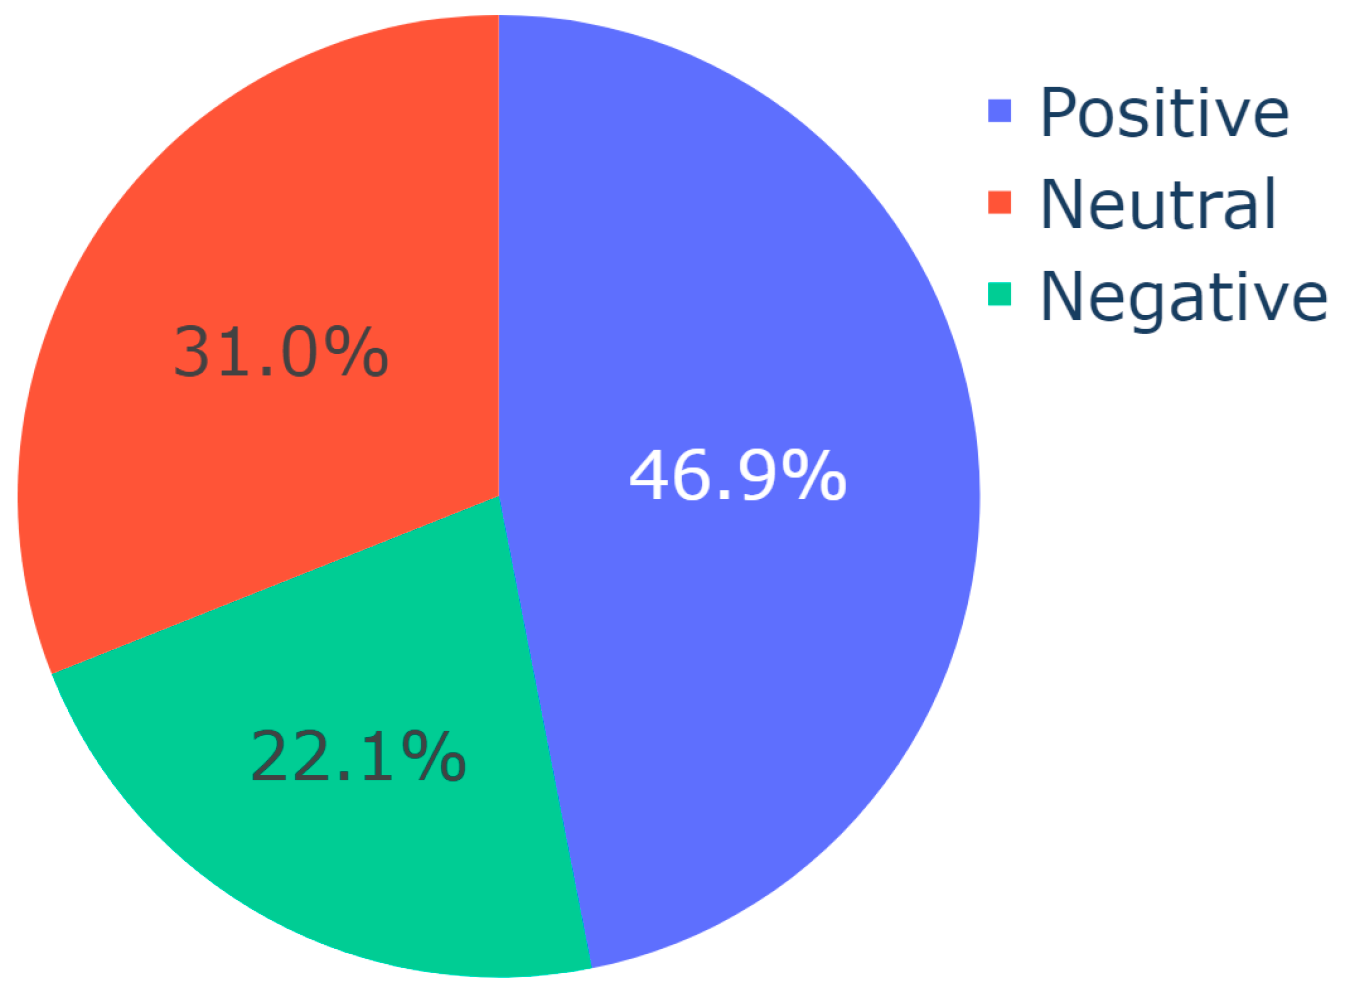
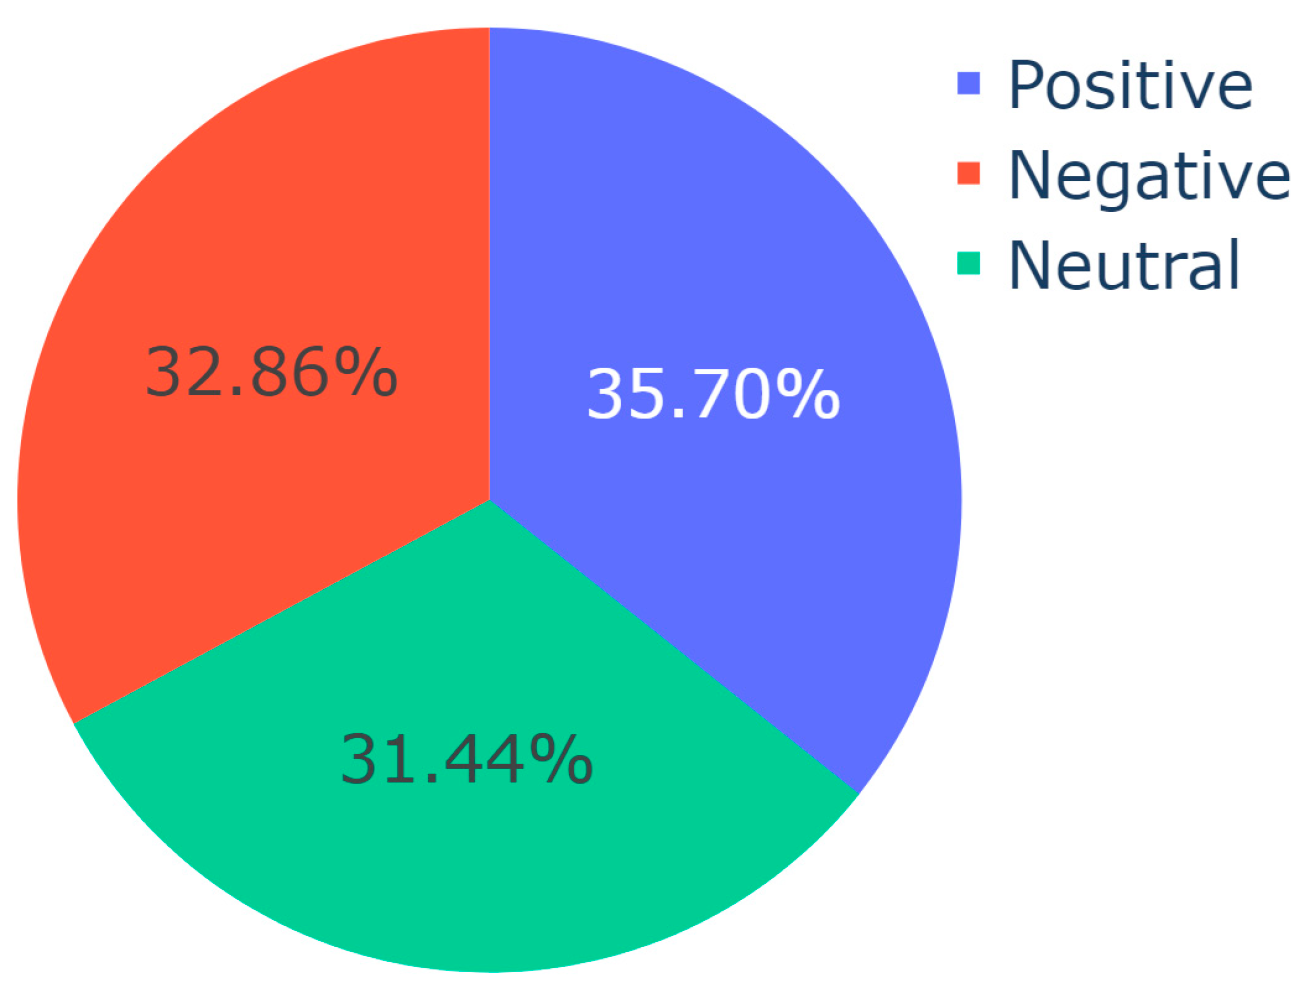
Algorithm 3: Sentiment Analysis (using VADER) per Topic
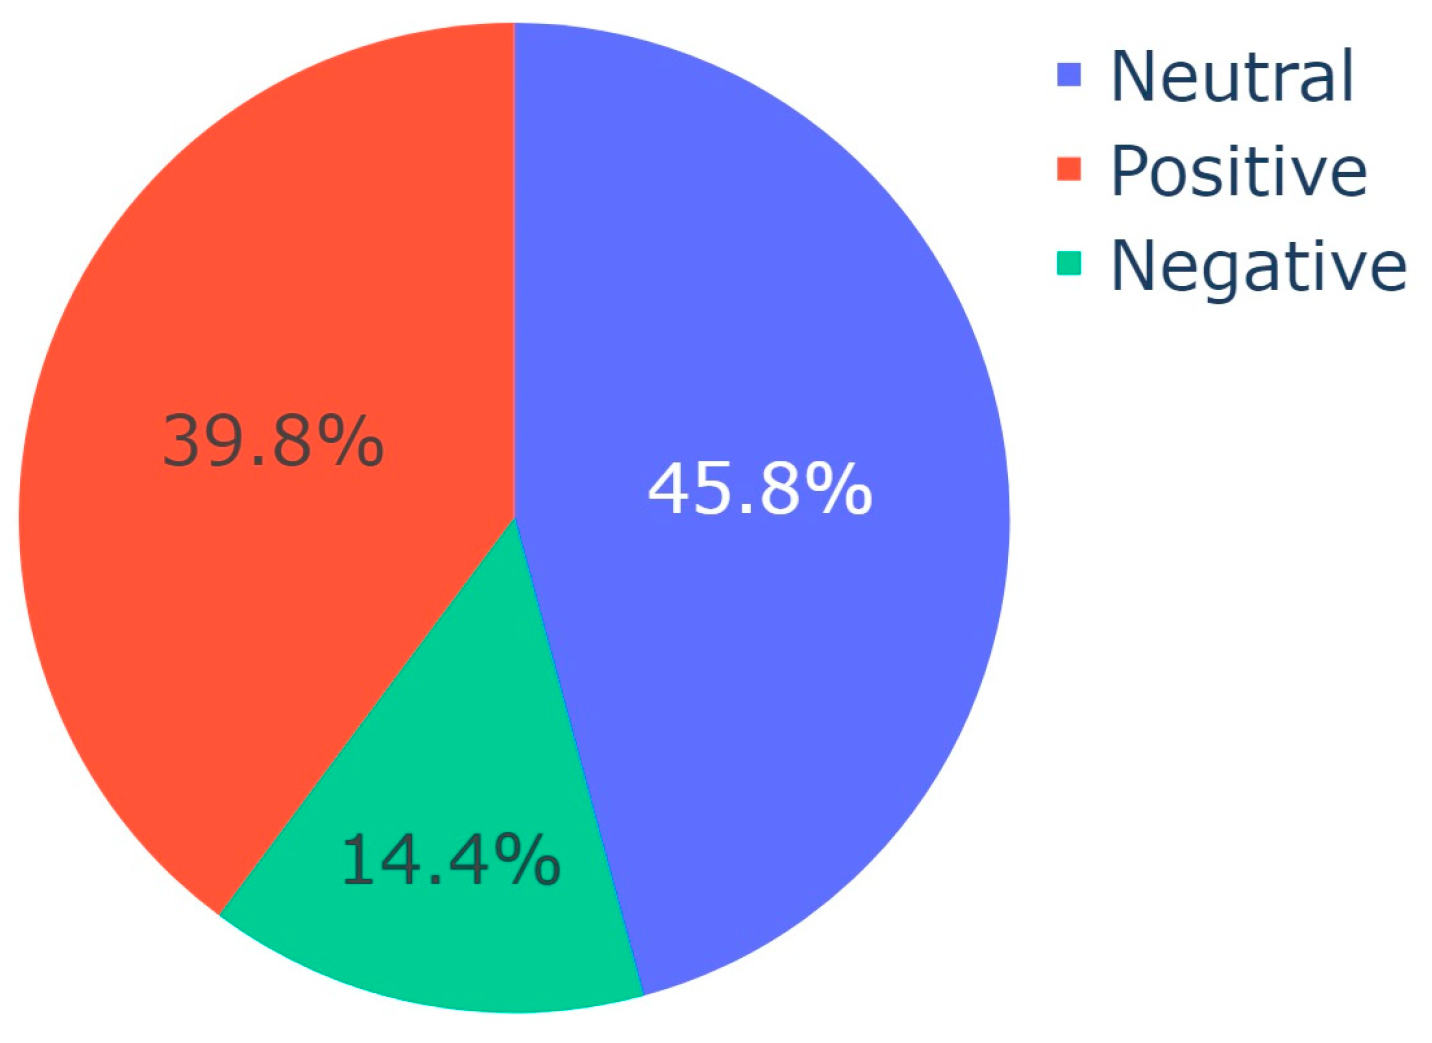
Input: CSV with Translated Video Descriptions
Output: Pie charts of sentiment distribution per topic
Import SentimentIntensityAnalyzer from vaderSentiment.vaderSentiment
Import pandas, plotly.express
sid_obj := Initialize SentimentIntensityAnalyzer
ex := Read input CSV into DataFrame
sentences := Convert ‘final_description’ column of ex to list
topics := Convert ‘Dominant_Topic’ column of ex to list
  
for each unique topic in topics do:
  sentiment := initialize list
  for each index i in the range of sentences do:
    if current topic equals topics at index i then:
      sentiment_dict := get polarity scores from sid_obj
      if sentiment_dict[‘compound’] ≥ 0.05 then:
        append "Positive" to sentiment
      else if sentiment_dict[‘compound’] ≤ −0.05 then:
        append "Negative" to sentiment
      else:
        append "Neutral" to sentiment
  end of for loop
  value := create list for sentiment
  fig := Initialize pie chart with value as values and sentiment as names
  save fig
end of for loop
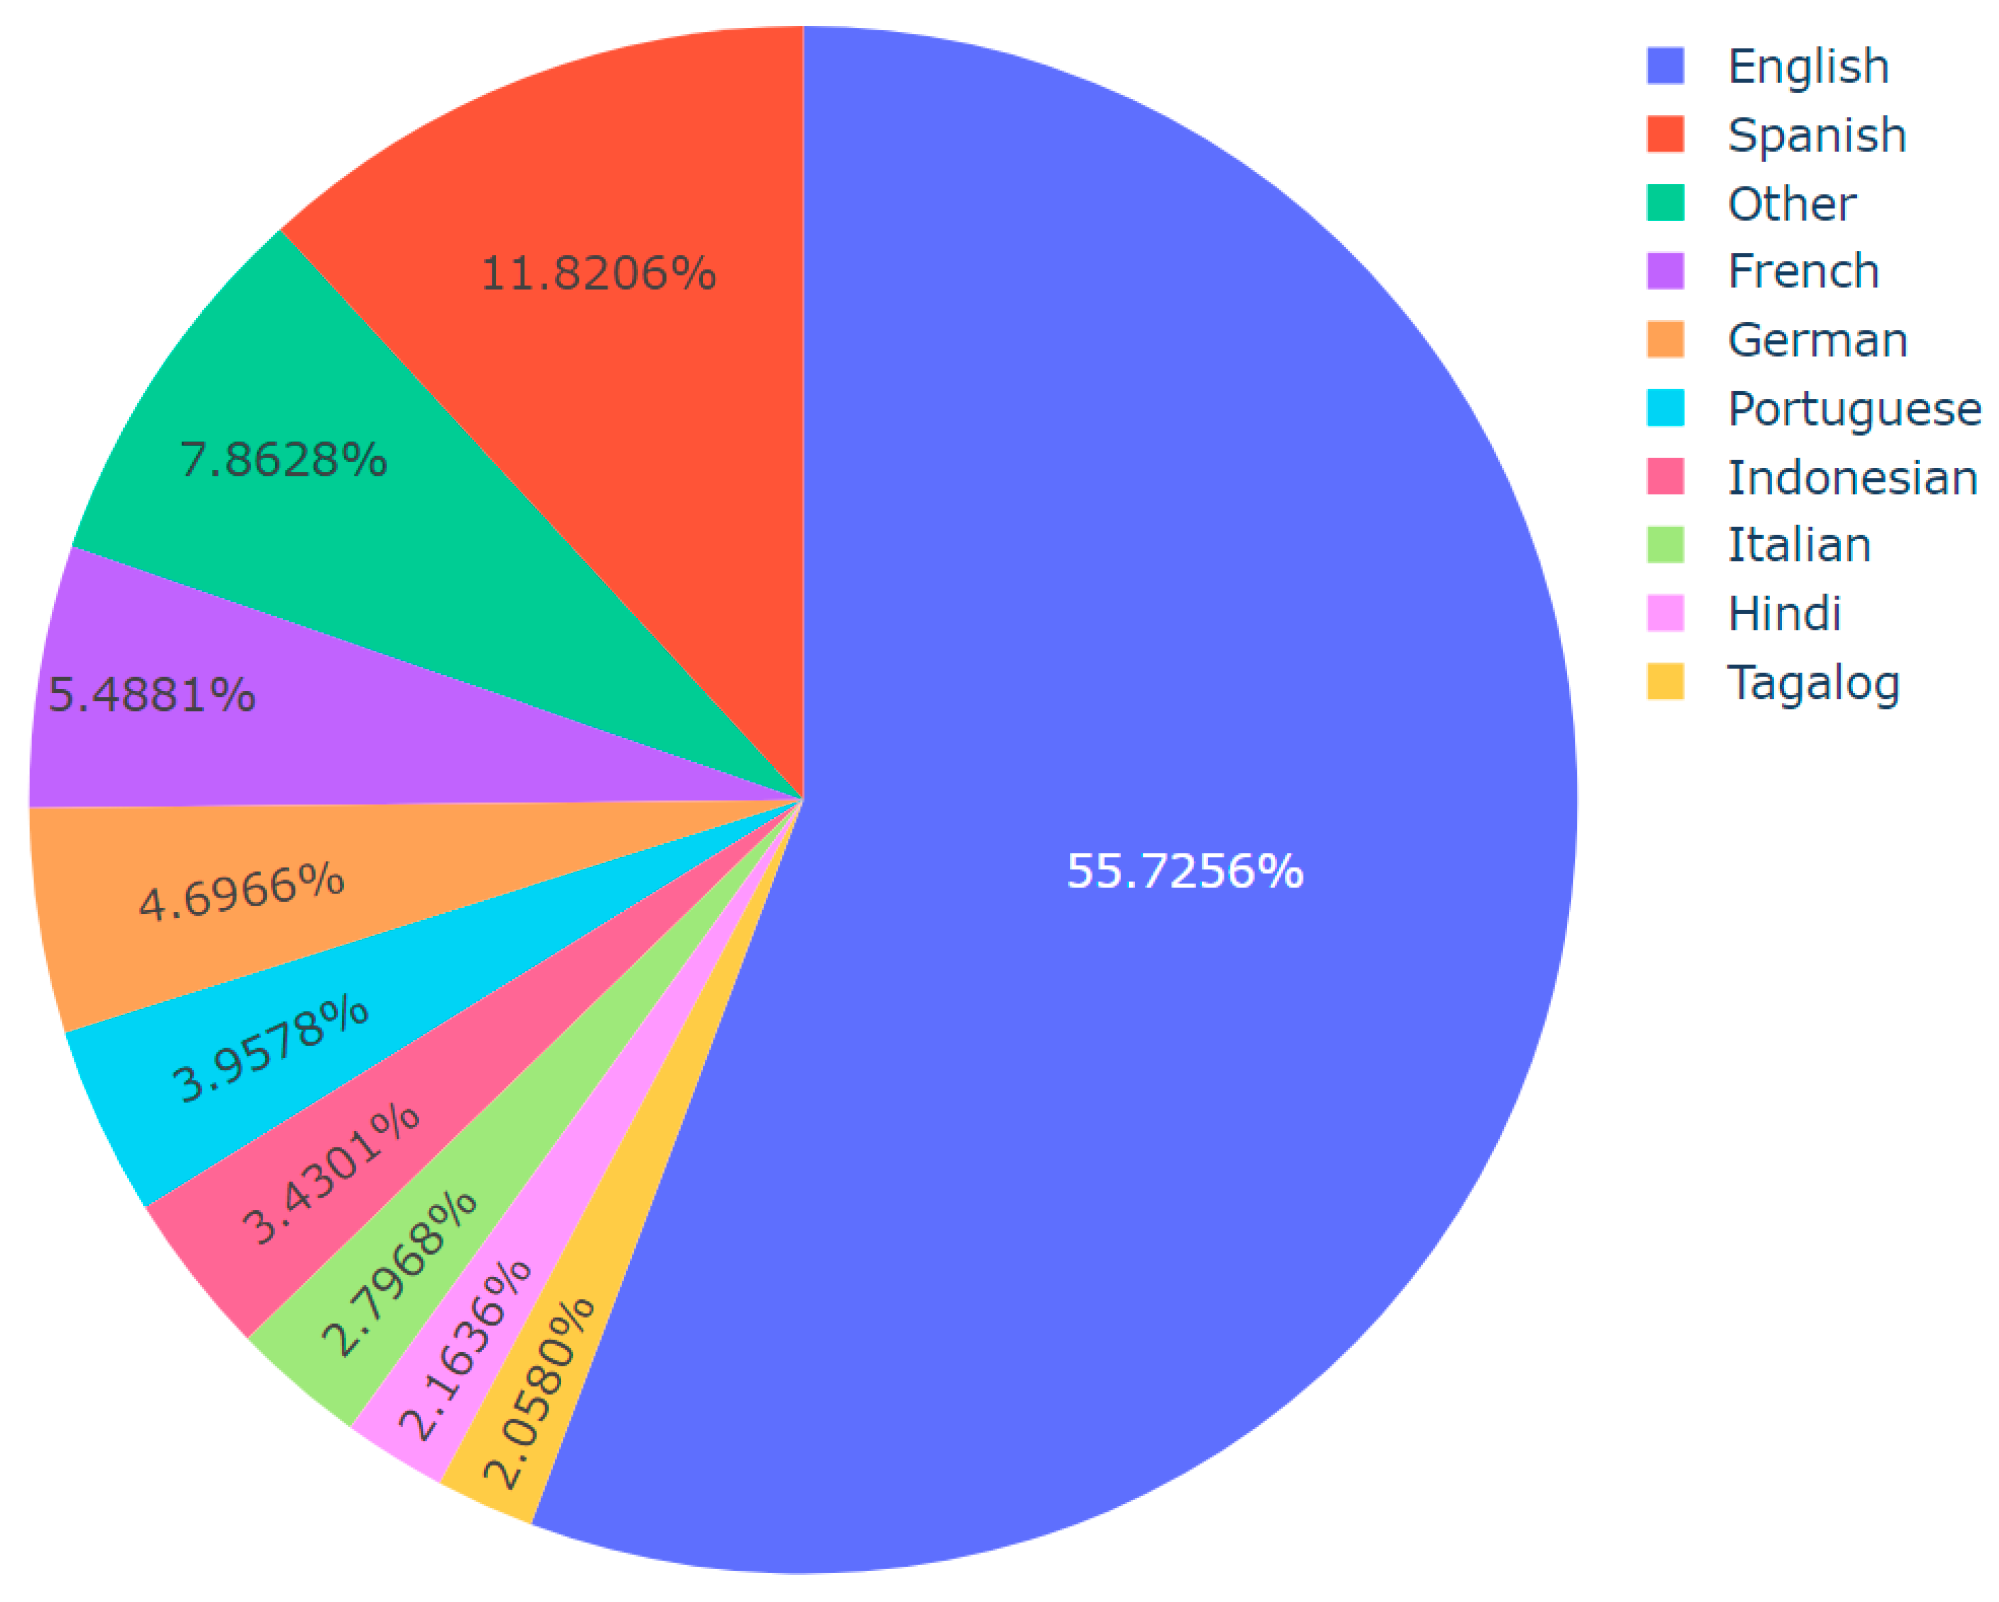
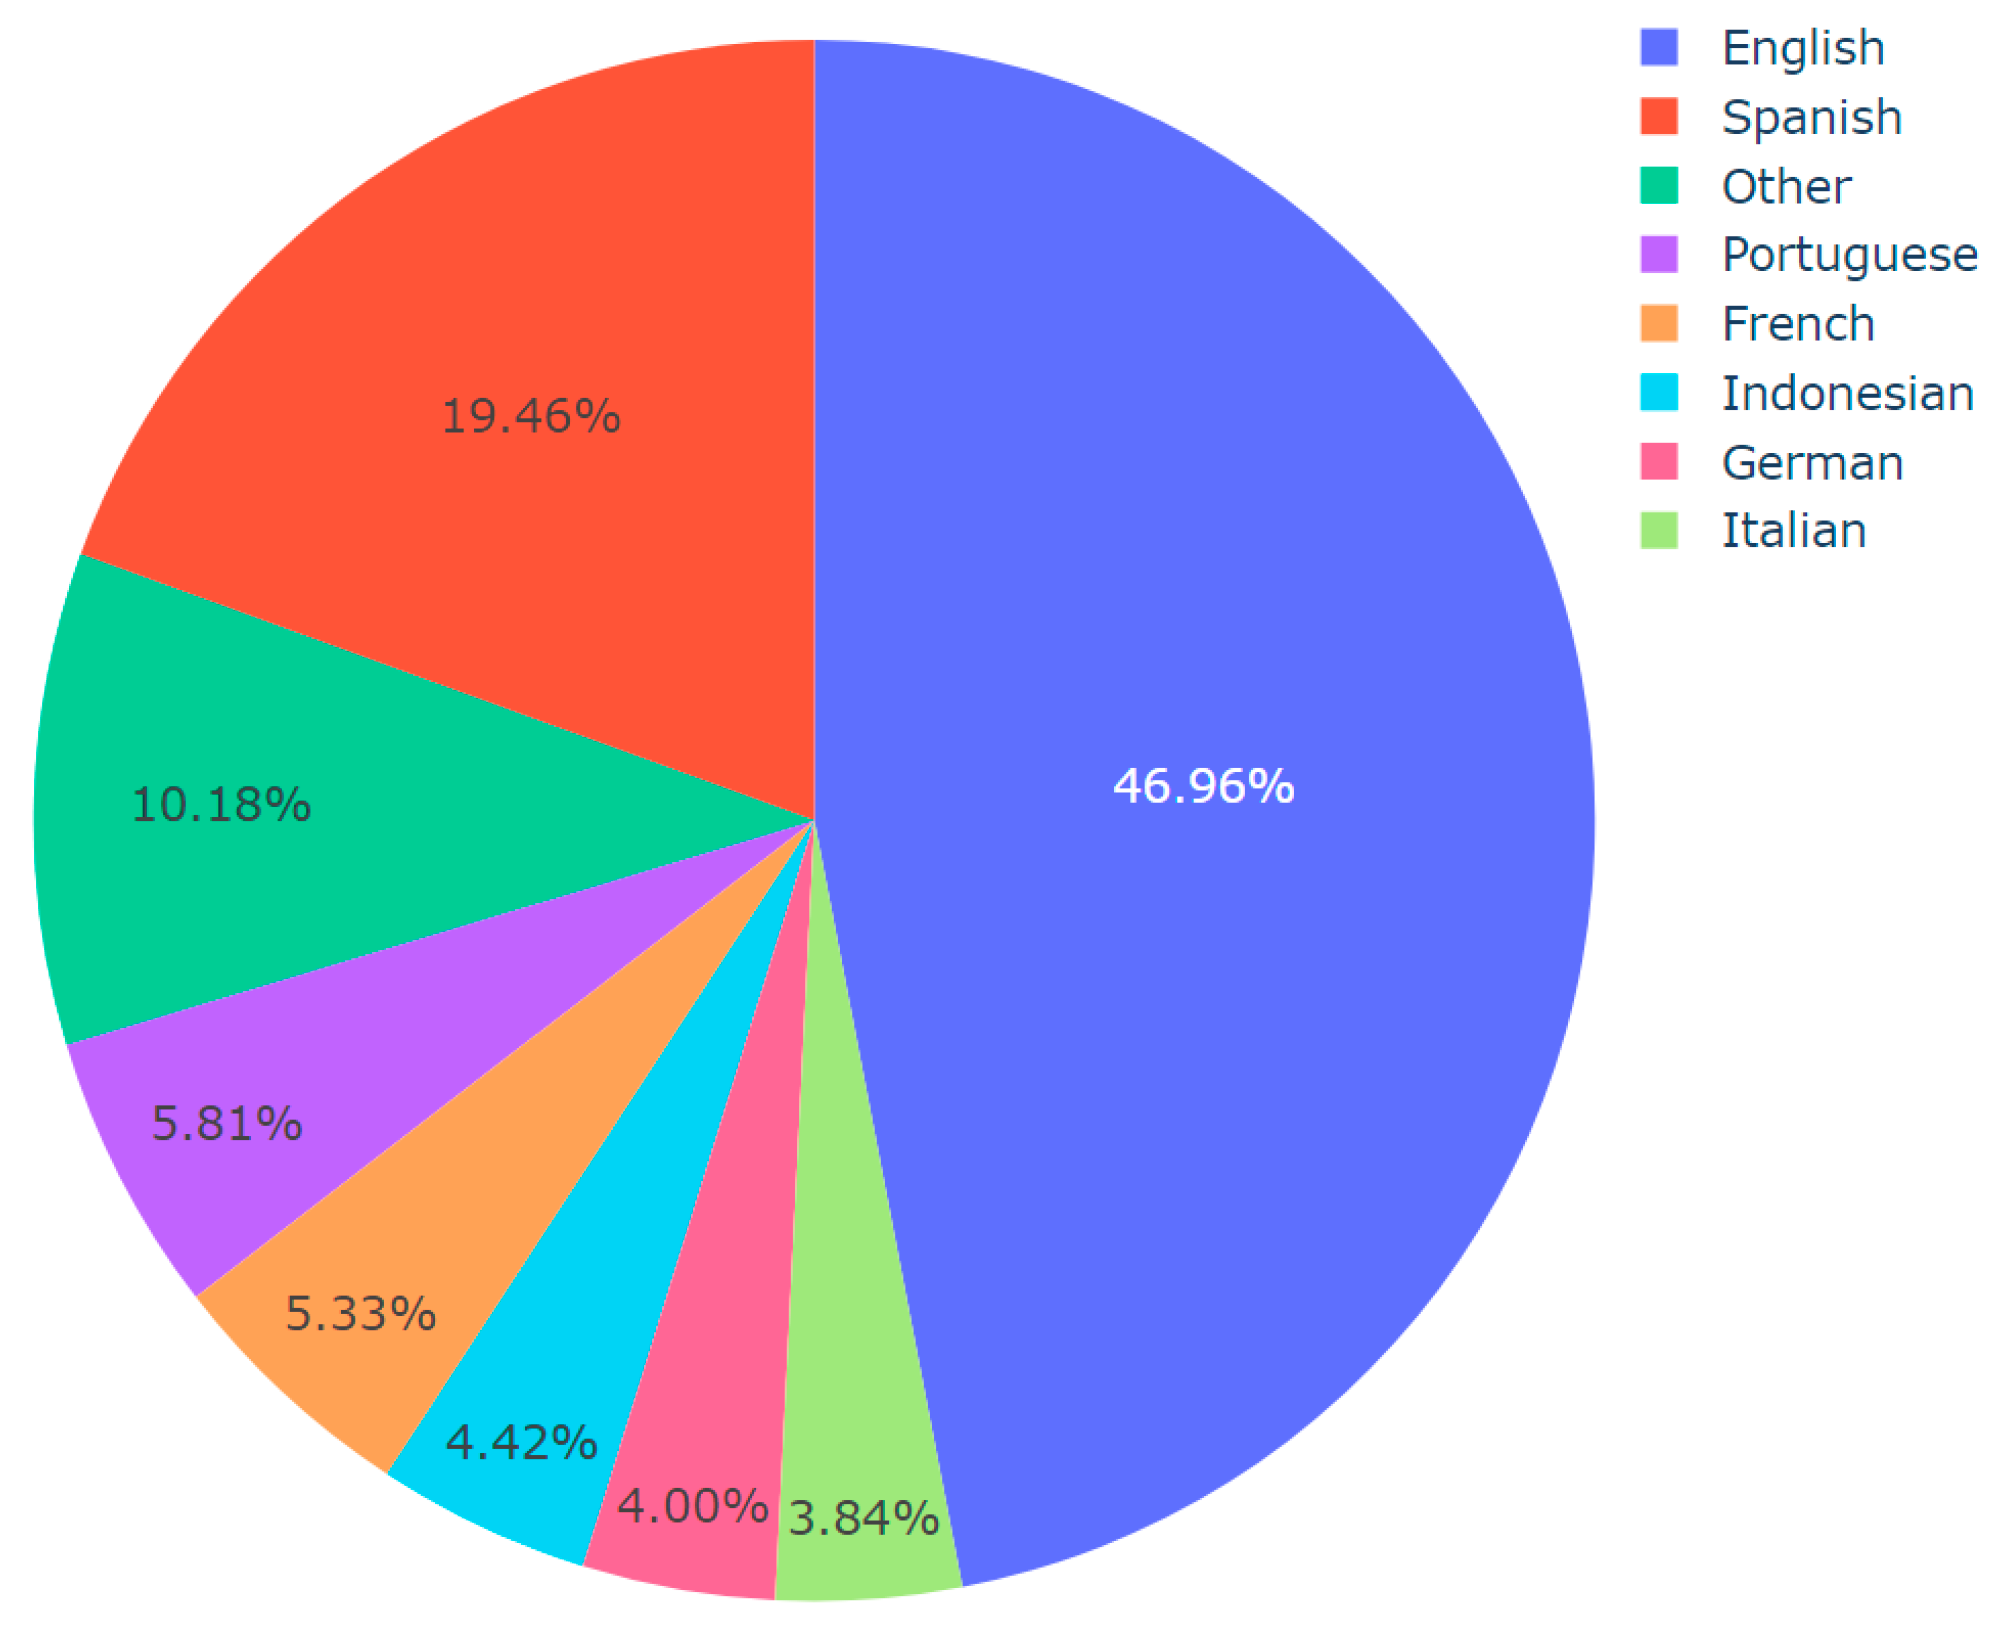
Algorithm 4: Language Distribution Analysis per Topic
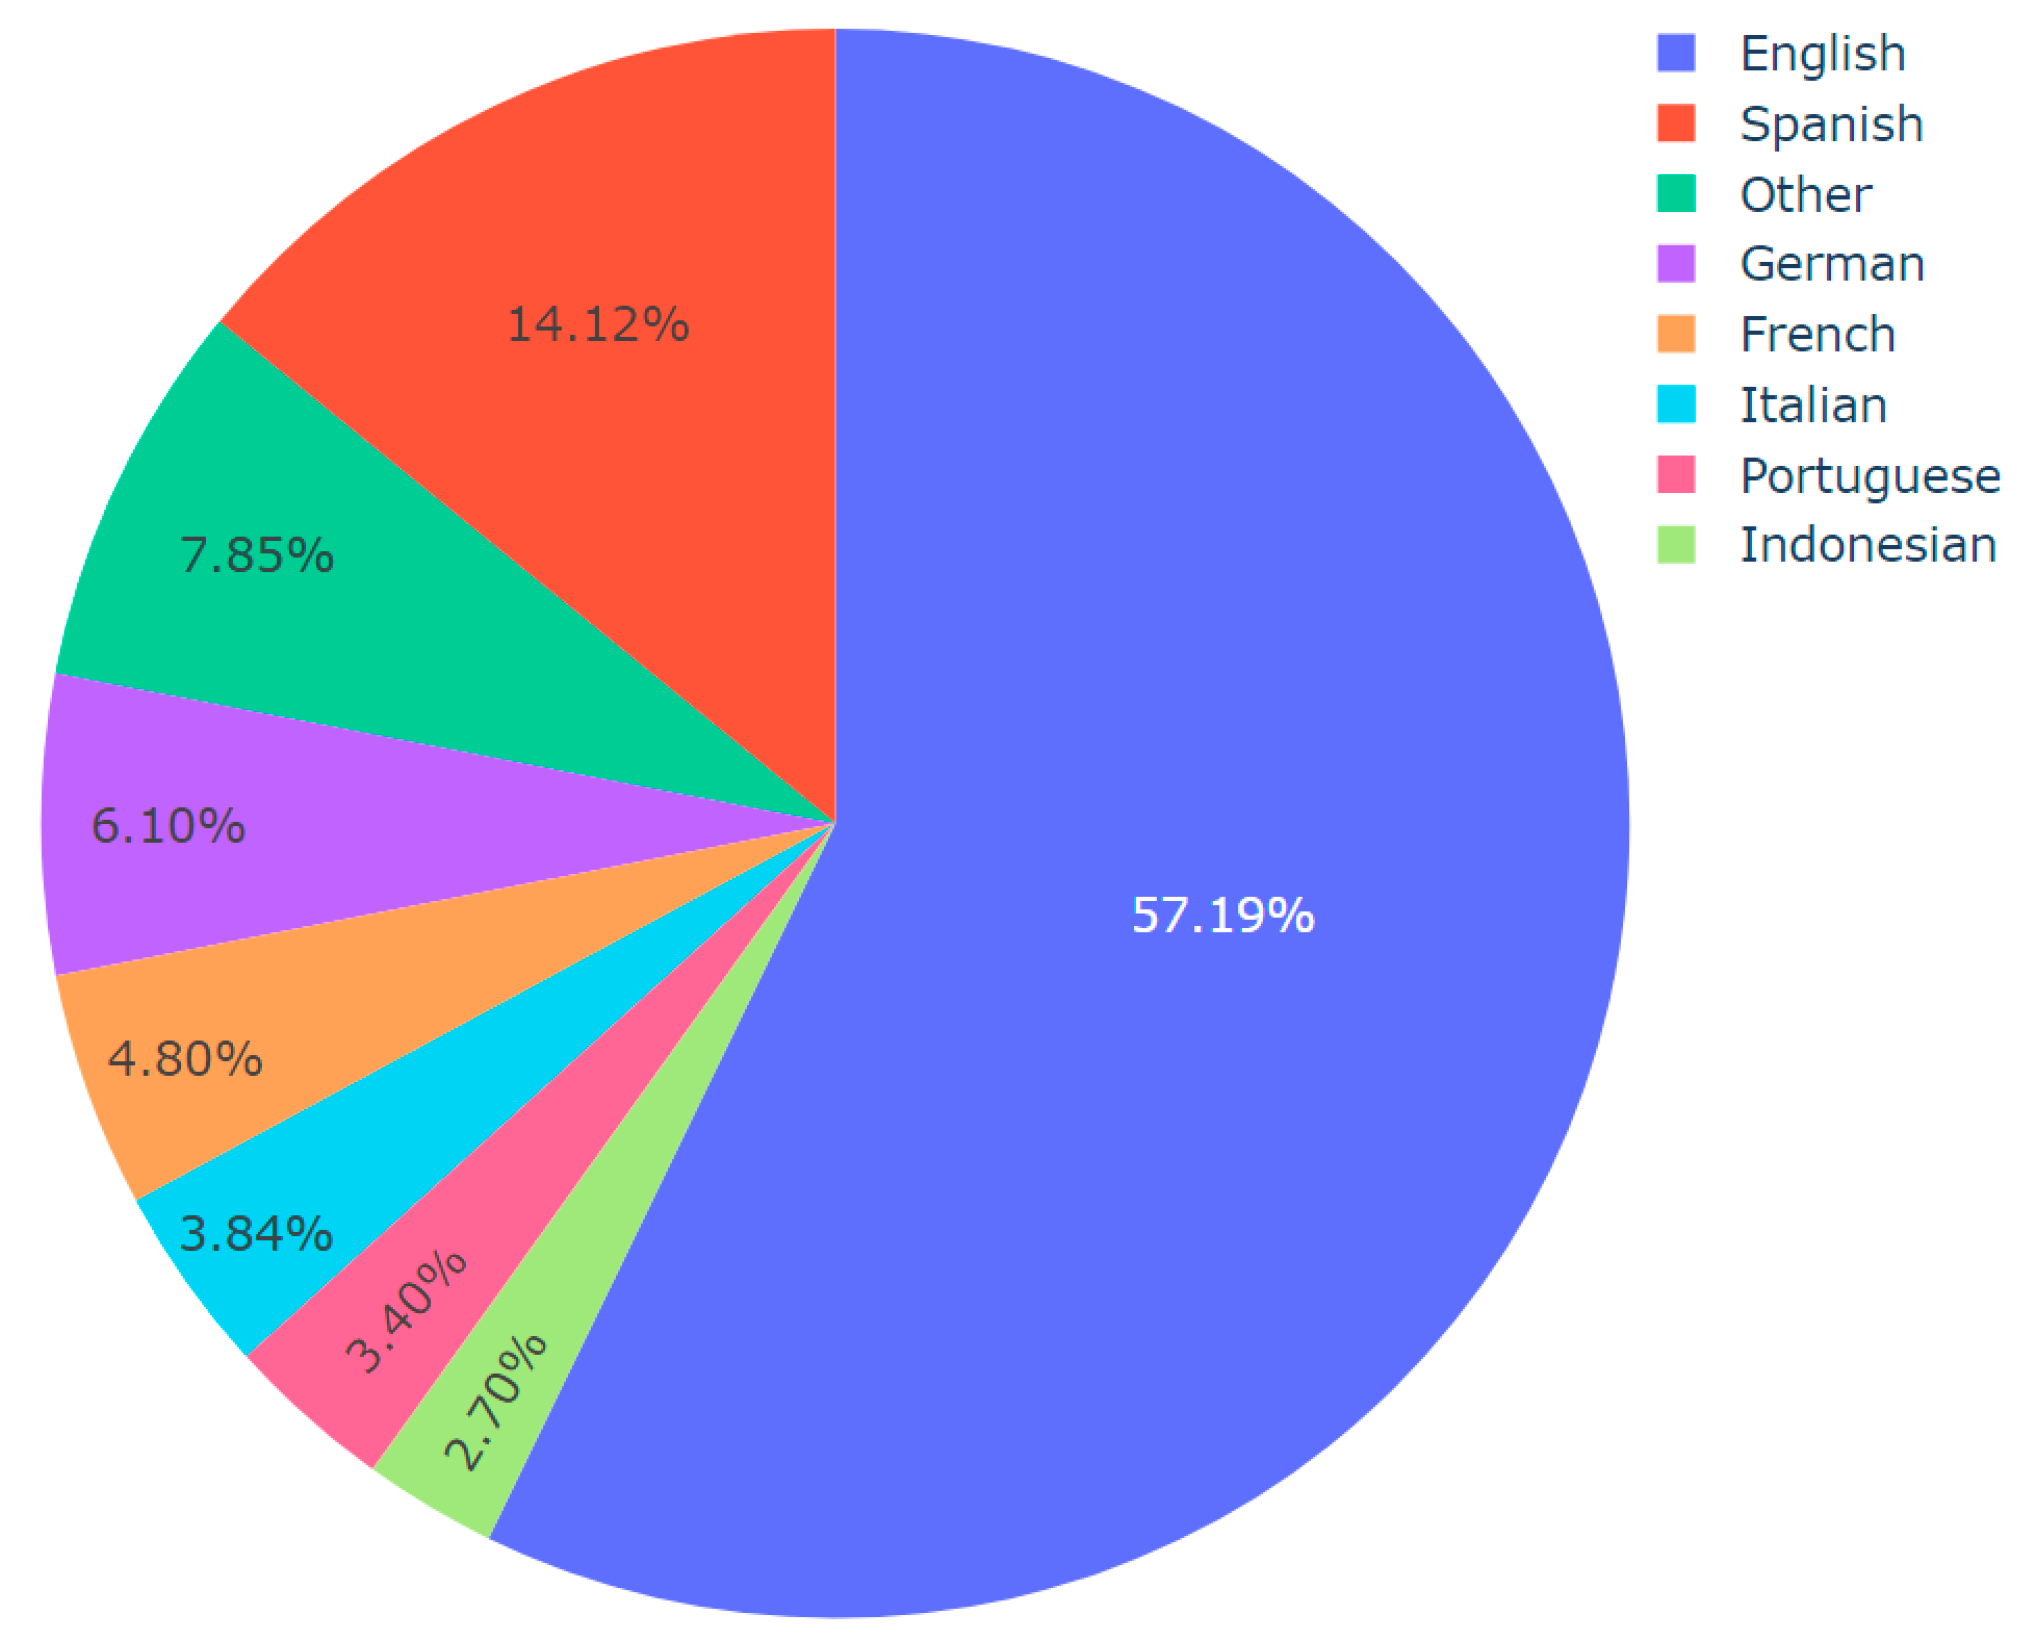
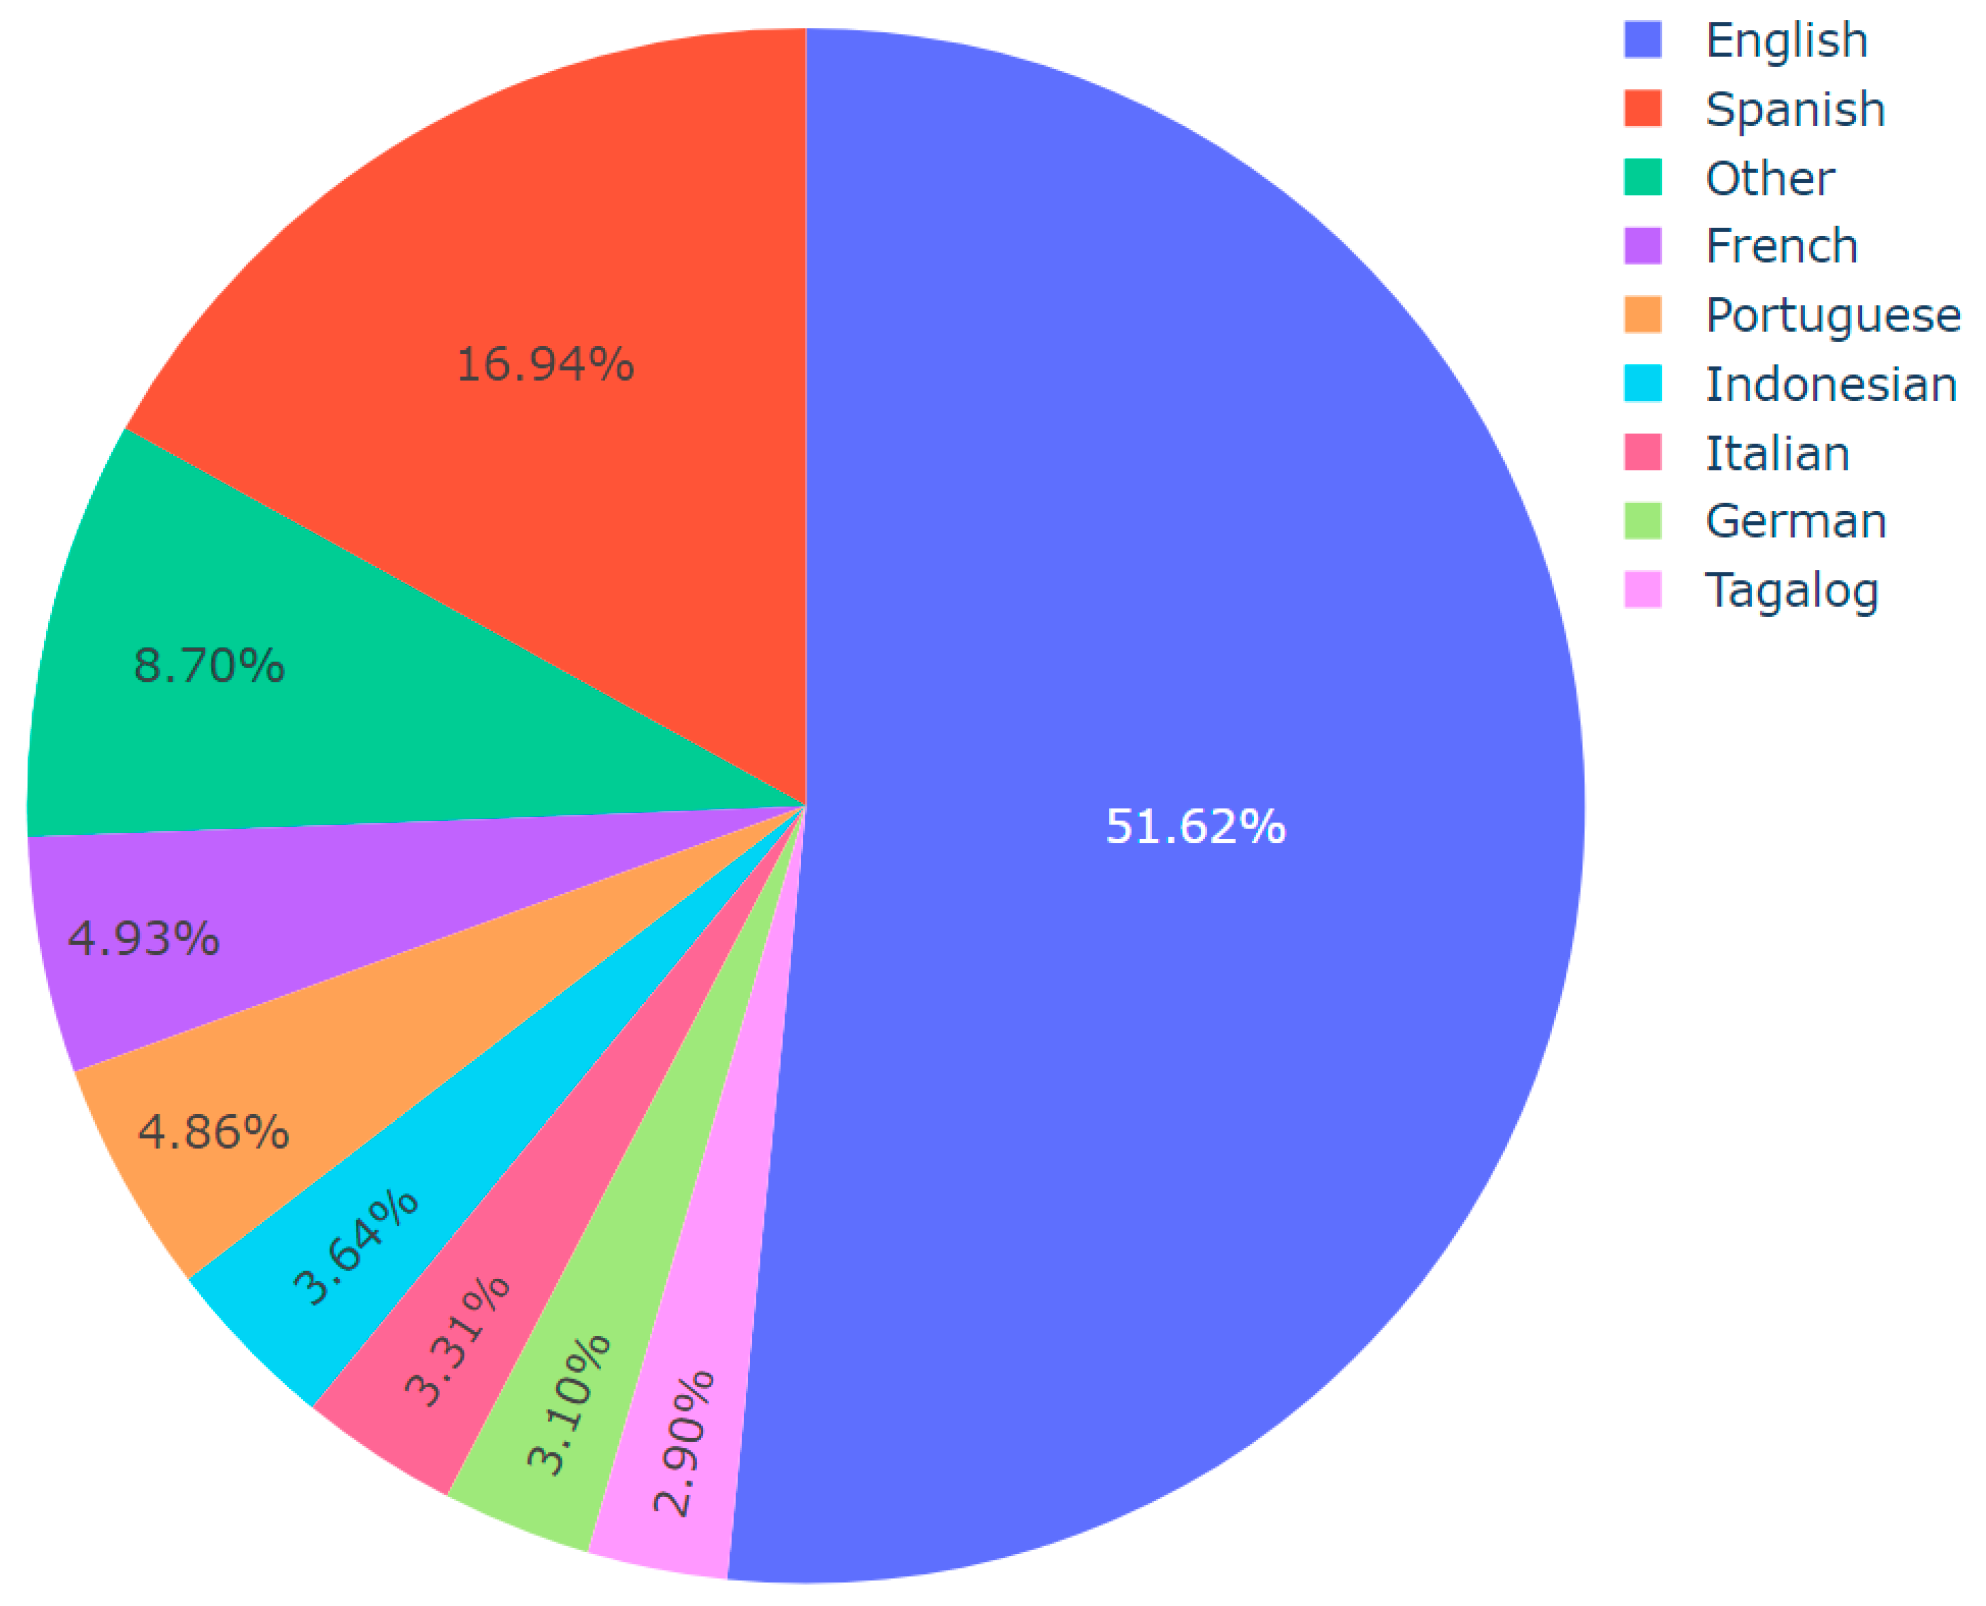
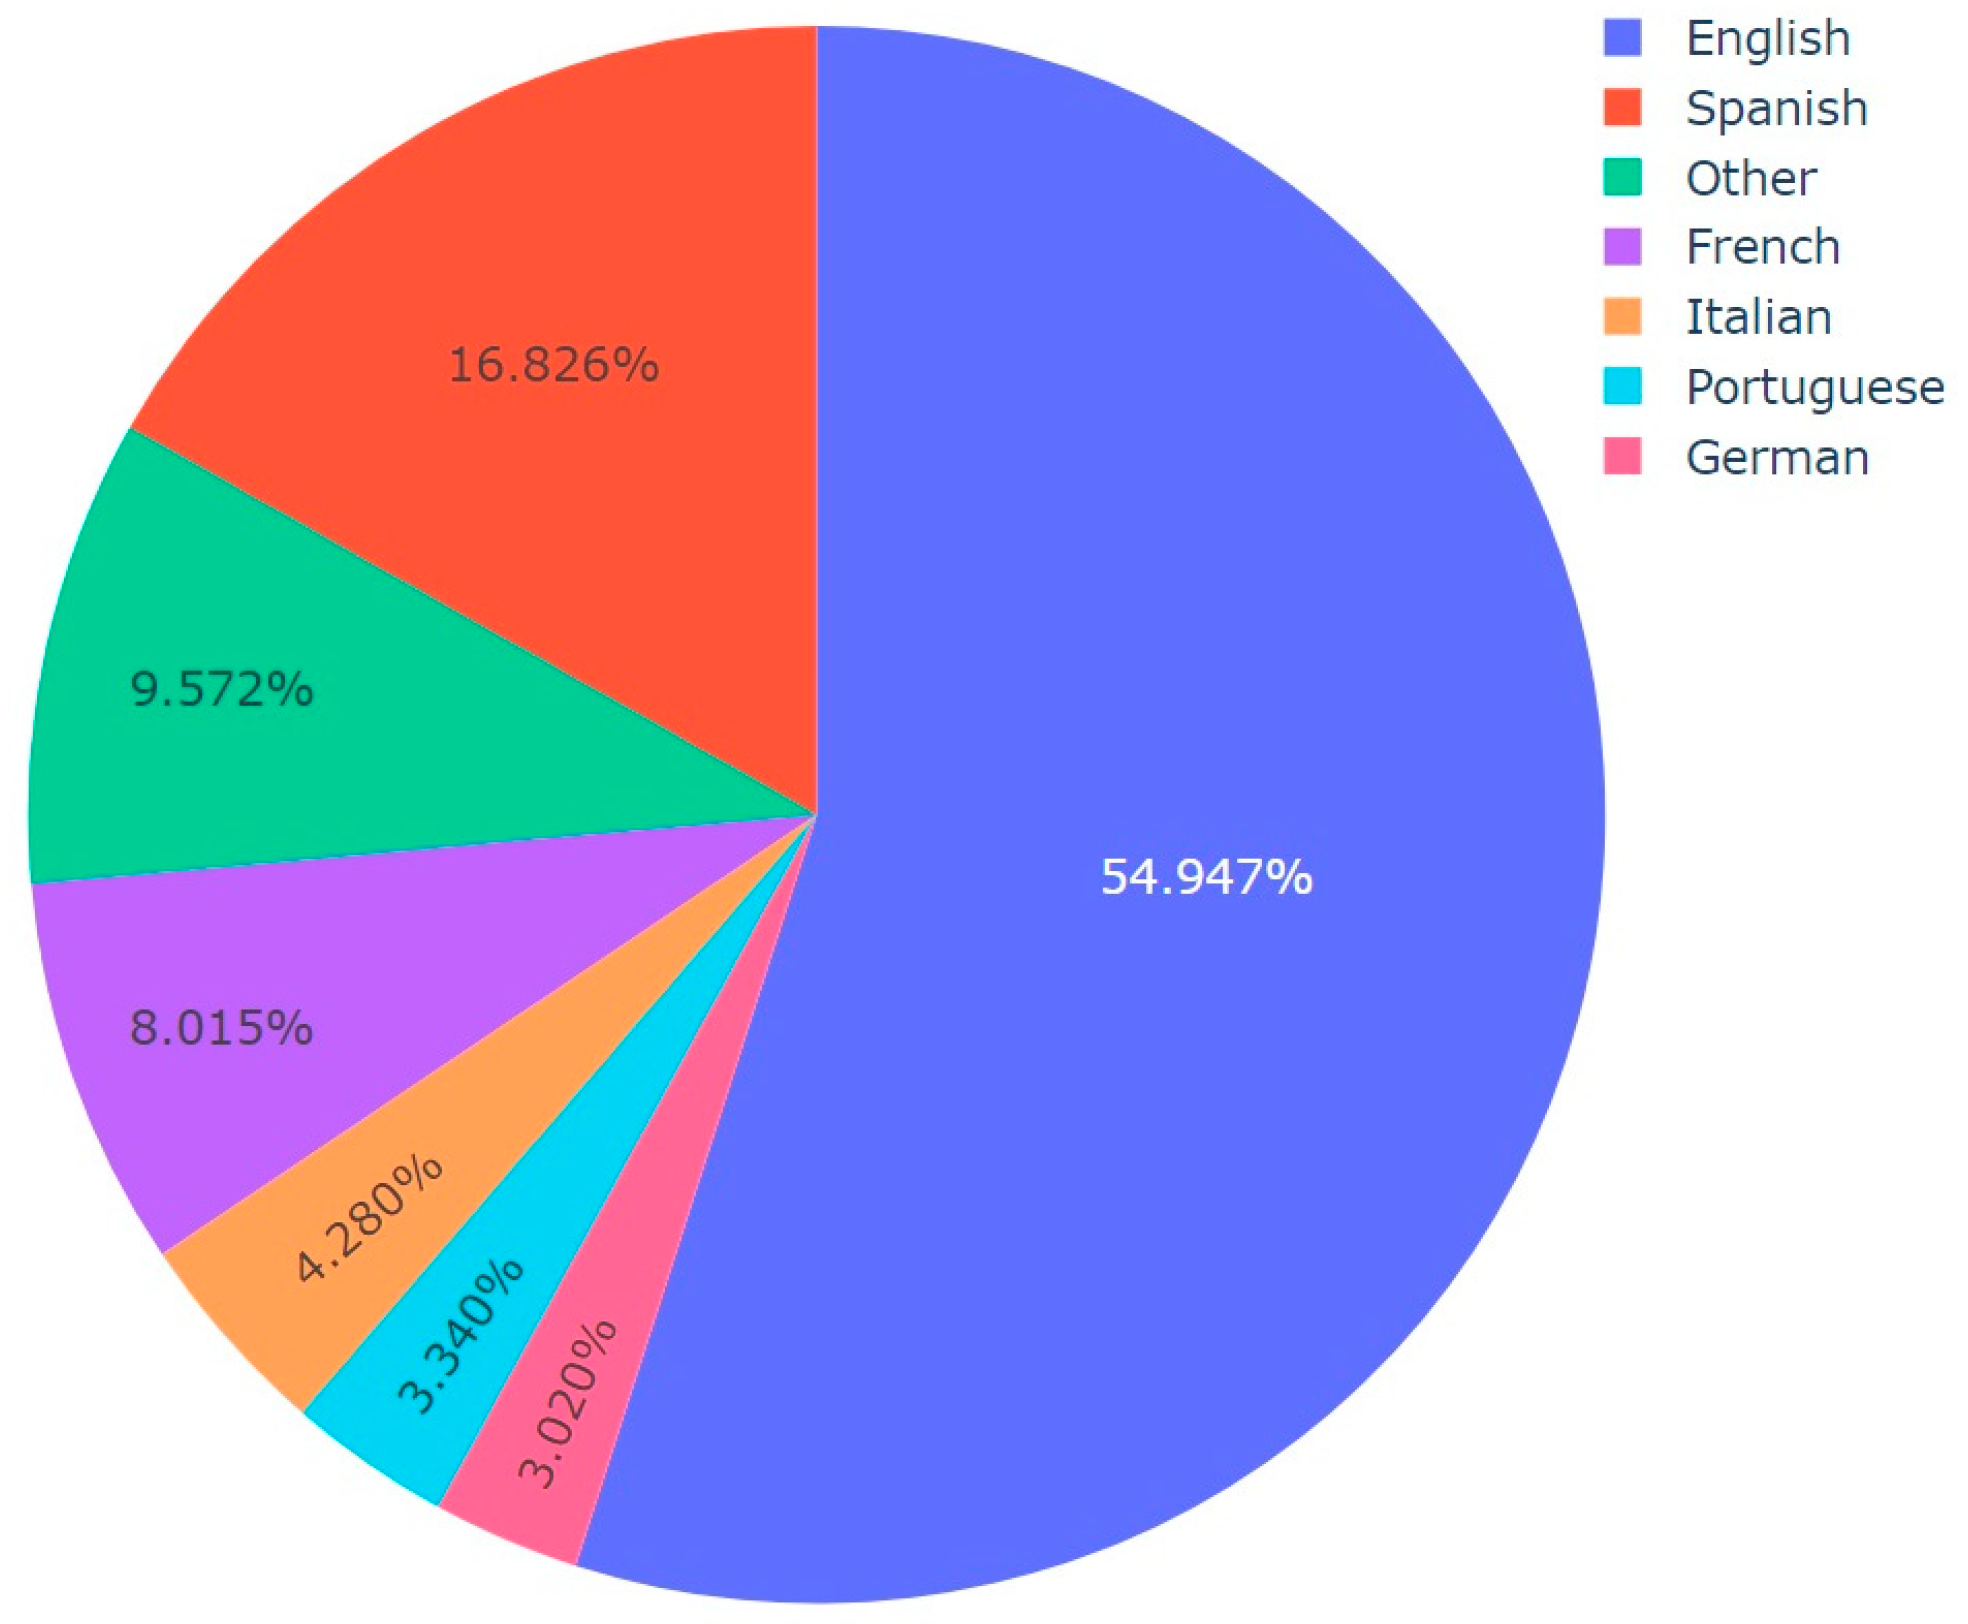
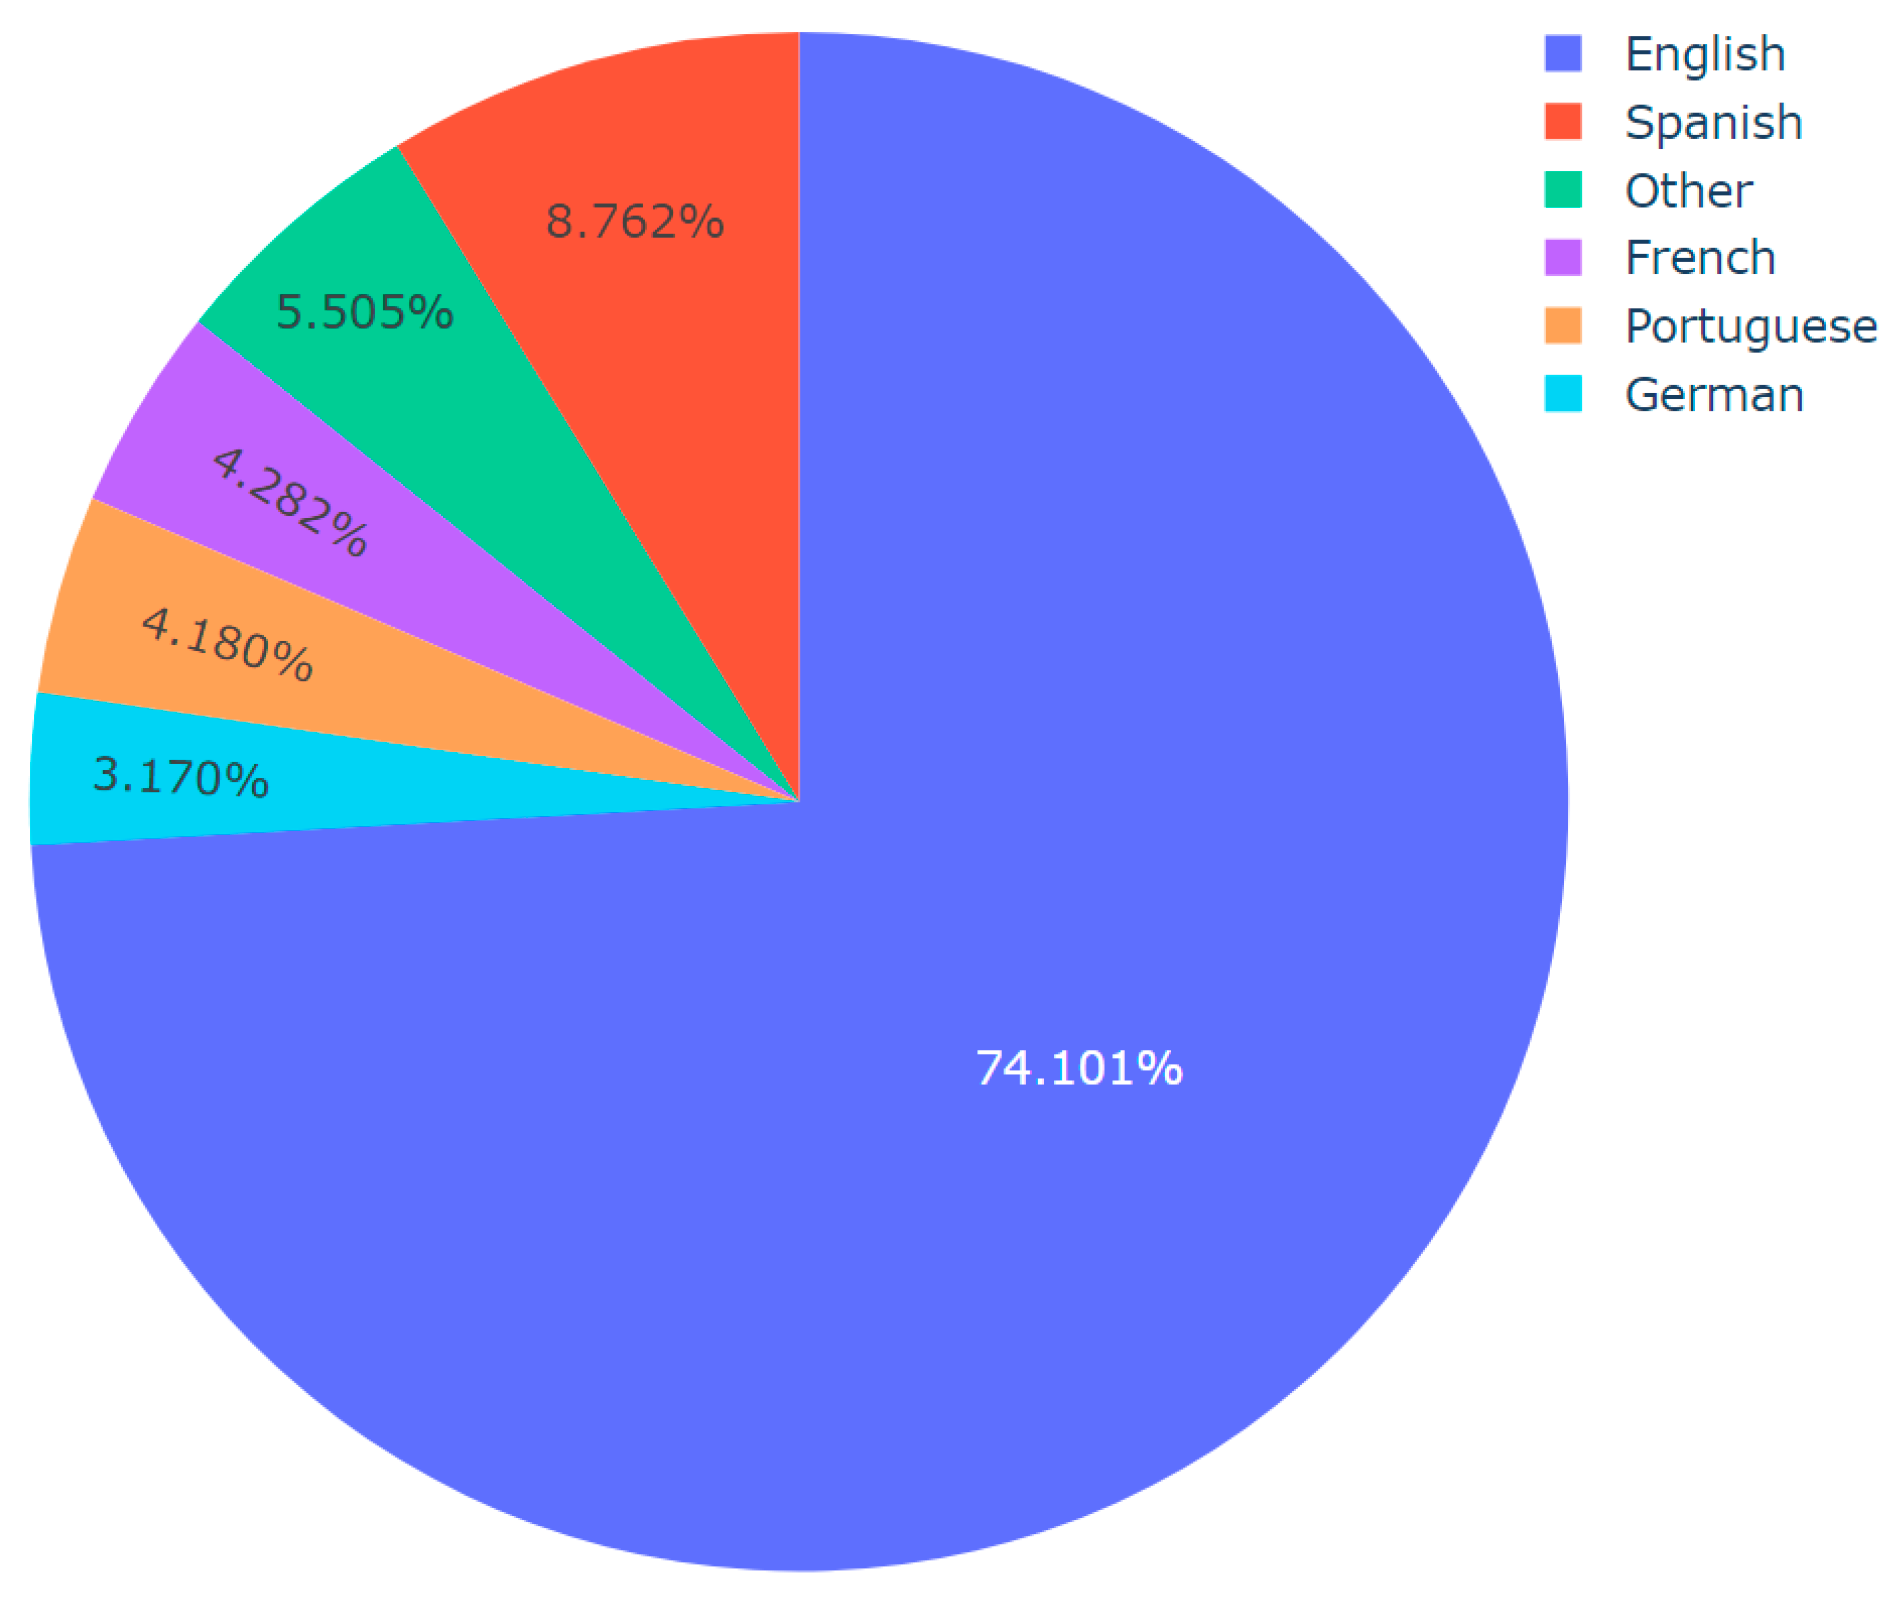
Input: Dataset CSV including predicted topics and languages
Output: Pie chart visualizations of language distribution for each topic, saved as images
import pandas
df := Read dataset CSV
topics := Convert ‘Predicted_Topic’ column of df to list
languages := Convert ‘Final_Language’ column of df to list
for each unique topic in topics do:
  language_count := dictionary for language counts in current topic
  filtered_languages := Filter languages (topic = current topic)
  for each language in filtered_languages do:
    increment count of language in language_count dictionary
    end of for loop
  threshold := define threshold
  other_count := initialize to 0
  for each language, count in language_count do:
    if count/total number of languages < threshold then:
      increment other_count by count
      remove language from language_count
  if other_count > 0 then:
    language_count[‘Other’] := other_count
  values := extract counts from language_count
  names := extract languages from language_count
  fig := Initialize pie chart with values as counts and names as languages
  save fig as image with a filename indicating the topic
end of for loop
Finally, correlation analysis was used to analyze the characteristics of these videos. These characteristics included the length of the video title, the length of the video description, the number of Facebook posts, and the number of tweets. In a generic manner, a correlation coefficient is a quantitative measure of the degree of correlation, which refers to a statistical association between two variables. The variables may either refer to two attributes of a dataset of observations, often referred to as a sample, or two components of a multivariate random variable having a known distribution [101]. The methodology for the investigation of the correlation among these characteristics of the videos involved the computation of the Pearson correlation coefficient (PCC). The PCC is a statistical metric that quantifies the linear correlation between two sets of data. The PCC is calculated as the covariance divided by the product of their standard deviations. It provides a normalized value between −1 and 1, indicating the strength and nature of the relationship [102]. The pseudocode of the program that was written in Python 3.11.5 to determine the correlations between these characteristics is shown in Algorithm 5. The step-by-step working of this Algorithm is outlined in Figure 3.
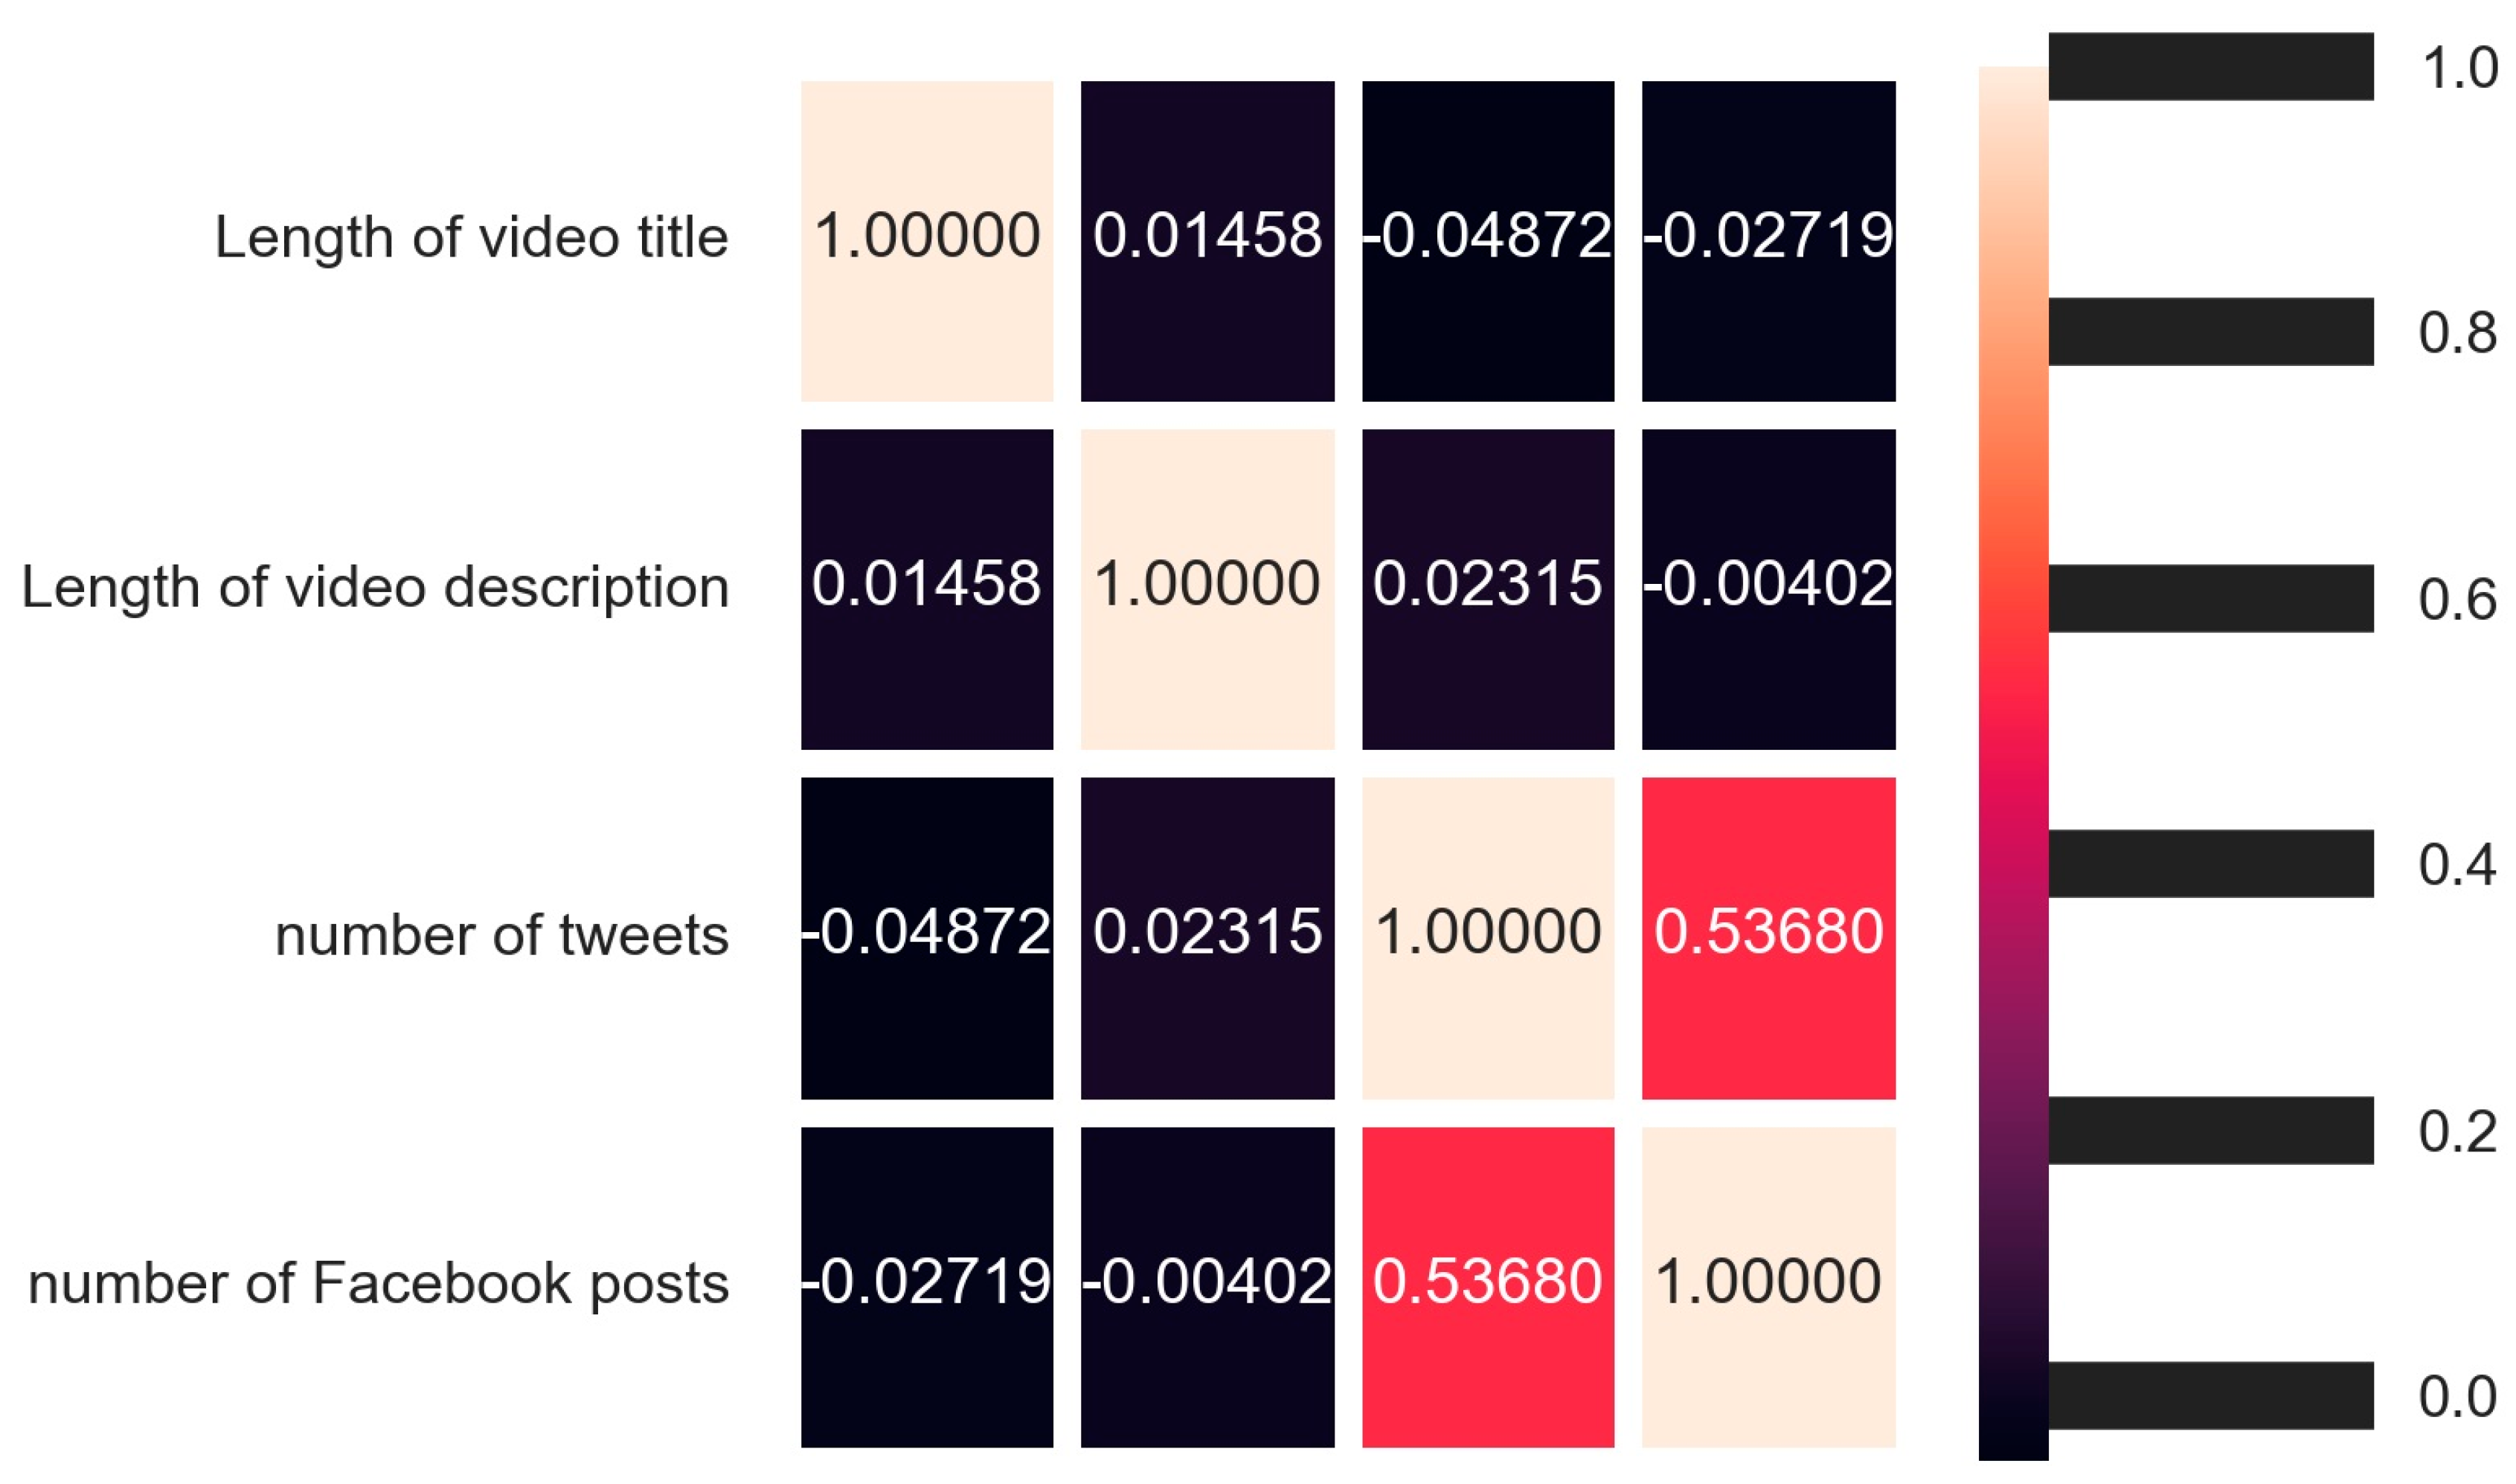
Algorithm 5: Correlation Analysis for Video Characteristics
Input: Correlation DB CSV
Output: correlation matrix, heatmap, and statements of statistical significance
Import numpy, pandas, matplotlib.pyplot, csv
Import scipy.stats, seaborn
dataset := Read Correlation DB CSV into DataFrame
corr := Calculate Pearson correlation matrix from the dataset
print(corr)
def check_correlation(col1, col2):
  stat := Calculate Pearson correlation between column_1 and column_2
  p_value := Get the p-value from the stat
  If (p_value < 0.05) then:
    print (correlation between <col1> and <col2> is statistically significant)
end of function
check_correlation (‘Length of video title’, ‘Length of video description’)
check_correlation (‘Length of video title’, ‘number of tweets’)
check_correlation (‘Length of video title’, ‘number of Facebook posts’)
check_correlation (‘Length of video description’, ‘number of tweets’)
check_correlation (‘Length of video description’, ‘number of Facebook posts’)
check_correlation (‘number of tweets’, ‘number of Facebook posts’)
initialize figure size and dpi for the plot
plot := draw heatmap with correlation matrix, annotation, and line width
display plot

4. Results and Discussion

This section presents the results of this work. As discussed in Section 3, Algorithm 1 computed the optimal number of topics by analyzing the translated versions of the video descriptions and varying the number of topics from 3 to 30. For each of these topics, Algorithm 1 computed the coherence score upon performing topic modeling. Thereafter, it generated a plot to represent the variation of coherence scores and the number of topics. This result is shown in Figure 4. From Figure 4, the optimal number of topics was deduced to be four, as the LDA model produced the highest coherence score for the same.
Thereafter, Algorithm 2 was run on the same data to determine the dominant topic for each video description. As a result of running Algorithm 2 on the data, each video description was classified as either Topic 0, Topic 1, Topic 2, or Topic 3. Figure 5 shows the number of video descriptions that were classified to each of these topics.
Thereafter, the visualization of the topic clusters in a 2D space was performed using the t-SNE (t-distributed stochastic neighbor embedding) algorithm. The result is shown in Figure 6.
Then, to understand the specific themes each of these topics represented, word frequency analysis of the video descriptions that were categorized in each of these topics was performed and the underlining topics were studied to identify the specific themes in the context of misinformation about COVID-19 that these topics represented. A collection of five randomly selected video descriptions per topic is shown in Table 1.
After obtaining this result, Algorithm 3 was run on the video descriptions for each topic to compute and analyze the distributions of sentiment for each topic using VADER. The results of this analysis are shown in Figure 7, Figure 8, Figure 9 and Figure 10. The results of topic-specific sentiment analysis revealed the sentiment associated with each of these themes. For the video descriptions belonging to the theme of Promotion and Outreach Efforts, 45.8% were neutral, 39.8% were positive, and 14.4% were negative. For the video descriptions belonging to the theme of Treatment for COVID-19, 38.113% were positive, 31.343% were neutral, and 30.544% were negative. For the video descriptions belonging to the theme of Conspiracy Theories Regarding COVID-19, 46.9% were positive, 31.0% were neutral, and 22.1% were negative. For the video descriptions belonging to the theme of COVID-19 and Politics, 35.70% were positive, 32.86% were negative, and 31.44% were neutral.
Then, topic-specific language analysis was performed by applying Algorithm 4 to the master dataset. The results of this analysis, shown in Figure 11, Figure 12, Figure 13 and Figure 14 revealed multiple novel insights regarding the usage of different languages for video descriptions in the context of videos containing misinformation about COVID-19. For instance, for all the topics, English and Spanish were the most widely used and second most widely used languages, respectively. It is worth mentioning that the video descriptions were available in a wide range of languages. So, for the generation of these results for each topic, those languages that were present in 2% or a lesser number of video descriptions were grouped together as the “other” category for clarity in visualization. Thereafter, minor updates were made to Algorithm 4 to compute the number of posts per language on social media platforms such as Facebook and Twitter. The data related to the number of posts on Facebook and Twitter were already available in the dataset. This information, along with the results of language analysis, was used to compute these results, which are presented in Figure 15 and Figure 16. For this analysis, once again, 2% was set as the threshold for the computation of the “other” category. In other words, all those languages that were represented in less than 2% of the total number of posts were grouped in the “other” category for the generation of these pie charts. The results from Figure 15 and Figure 16 reveal multiple novel insights. For instance, videos containing video descriptions in English were shared the highest number of times on Facebook and Twitter.
The results obtained from Algorithm 5 are presented next. As stated in Section 3, Algorithm 5 compared multiple characteristics of these videos to determine if any correlations existed between those characteristics using Pearson’s correlation coefficients. The results of the same are shown in Figure 17. As can be seen from Figure 17, the correlation between the length of the video title and the number of tweets was statistically significant. To add to this, the correlation between the length of the video title and the number of Facebook posts was also statistically significant.
Finally, two comparative studies were conducted to compare this work with prior works in this field. The results of these comparative studies are presented in Table 2 and Table 3.
As can be seen from Table 2, this is the first work in this area of research where the focus area of the study involved content analysis, correlation analysis, topic modeling, topic-specific sentiment analysis, and topic-specific language analysis. Table 3 highlights the fact that this is the first work in this area of research where the number of videos analyzed is considerably higher than the number of videos analyzed in prior works in this field. The work presented in this paper has a couple of limitations. First, Google Translate API version 3 was used for detecting the language in the video descriptions. After obtaining the results of language detection from this API, it was observed that a very small percentage of the language detections were inaccurate as the algorithm used by the Google Translate API for performing language detections is not 100% accurate. So, manual labeling was performed to correct the inaccurate language detections. However, as stated in prior works where manual labeling was used [103,104], manual labeling may be associated with minor human errors. Second, the dataset analyzed in this study contains the metadata of 8122 YouTube videos that contained misinformation related to COVID-19. These videos were shared on different social media platforms between November 2019 and June 2020. So, the results presented in this paper reflect the findings of topic modeling, sentiment analysis, and language analysis from this dataset. As YouTube is a globally popular social media platform where several videos related to different topics, containing different sentiments and languages, are uploaded every day, it is possible that if a similar data collection (as presented in [84]) followed by a similar analysis (as presented in this paper) is performed, the results of topic modeling, sentiment analysis, and language analysis could vary as compared to the results presented in this paper.

5. Conclusions

Since the outbreak of COVID-19 in December 2019, social media platforms such as YouTube have been serving as a rich resource for sharing and exchanging information regarding this pandemic. YouTube, a globally popular social media platform, is also considered a source of misinformation. During virus outbreaks prior to the outbreak of COVID-19, misinformation analysis on YouTube attracted the attention of researchers from a wide range of disciplines, such as healthcare, data mining, data analysis, big data, and natural language processing. Since the outbreak of COVID-19, there have been multiple works that have focused on misinformation analysis on YouTube. However, those works have multiple limitations. First, none of those works focused on topic modeling or topic-specific sentiment analysis of the YouTube videos conveying misinformation regarding COVID-19. Second, none of those works analyzed the languages used to publish the video descriptions of the underlying videos. Third, the sample size of YouTube videos used in those works was not very high.
The work presented in this research paper addresses these limitations and makes multiple scientific contributions to this field. First, the results of topic modeling revealed four distinct topics represented in a dataset of videos conveying misinformation related to COVID-19. These four topics represented four distinct themes—Promotion and Outreach Efforts, Treatment for COVID-19, Conspiracy Theories Regarding COVID-19, and COVID-19 and Politics. Second, the results of topic modeling also showed that the highest number of videos were related to the theme of Promotion and Outreach Efforts. It was followed by Treatment for COVID-19, COVID-19 and Politics, and Conspiracy Theories Regarding COVID-19. Third, the results of topic-specific sentiment analysis revealed the sentiment associated with each of these themes. For the video descriptions belonging to the theme of Promotion and Outreach Efforts, 45.8% were neutral, 39.8% were positive, and 14.4% were negative. For the video descriptions belonging to the theme of Treatment for COVID-19, 38.113% were positive, 31.343% were neutral, and 30.544% were negative. For the video descriptions belonging to the theme of Conspiracy Theories Regarding COVID-19, 46.9% were positive, 31.0% were neutral, and 22.1% were negative. For the video descriptions belonging to the theme of COVID-19 and Politics, 35.70% were positive, 32.86% were negative, and 31.44% were neutral. Fourth, topic-specific language analysis was performed to detect the various languages in which the video descriptions for each topic were published on YouTube. This analysis revealed multiple novel insights. For instance, for all the themes, English and Spanish were the most widely used and second most widely used languages, respectively. Fifth, the patterns of sharing these videos on other social media channels such as Facebook and Twitter were also investigated. The results revealed that videos containing video descriptions in English were shared the highest number of times on Facebook and Twitter. Sixth, correlation analysis was performed by taking into account multiple characteristics of these videos. The results revealed that the correlation between the length of the video title and the number of tweets was statistically significant. To add to this, the correlation between the length of the video title and the number of Facebook posts was also statistically significant. As per the best knowledge of the authors, no similar work has been performed in this field thus far. Future work in this area would involve performing a similar analysis of videos containing misinformation related to COVID-19 from other social media platforms, for example, Facebook and TikTok, and comparing the findings to understand and interpret any variations in the underlining trends of misinformation generation and dissemination across different social media platforms.

Author Contributions

Conceptualization, N.T.; methodology, N.T., S.C., K.K., V.K. and M.S.; software, N.T. and S.C.; validation, N.T. and S.C.; formal analysis, S.C. and N.T.; investigation, N.T. and S.C.; resources, N.T. and S.C.; data curation, N.T. and S.C.; writing—original draft preparation, N.T., V.K., K.K. and M.S.; writing—review and editing, N.T.; visualization, N.T., S.C., M.S. and V.K.; supervision, N.T.; project administration, N.T. All authors have read and agreed to the published version of the manuscript.

Funding

This research received no external funding.

Data Availability Statement

A publicly available dataset was analyzed in this study. These data can be found at https://zenodo.org/record/4557828, accessed on 27 October 2023.

Conflicts of Interest

The authors declare no conflicts of interest.

References

  1. Zhu, N.; Zhang, D.; Wang, W.; Li, X.; Yang, B.; Song, J.; Zhao, X.; Huang, B.; Shi, W.; Lu, R.; et al. A Novel Coronavirus from Patients with Pneumonia in China, 2019. N. Engl. J. Med. 2020, 382, 727–733. [Google Scholar] [CrossRef] [PubMed]
  2. Zhou, P.; Yang, X.-L.; Wang, X.-G.; Hu, B.; Zhang, L.; Zhang, W.; Si, H.-R.; Zhu, Y.; Li, B.; Huang, C.-L.; et al. A Pneumonia Outbreak Associated with a New Coronavirus of Probable Bat Origin. Nature 2020, 579, 270–273. [Google Scholar] [CrossRef] [PubMed]
  3. WHO Coronavirus (COVID-19) Dashboard. Available online: https://covid19.who.int/ (accessed on 9 December 2023).
  4. Miraz, M.H.; Ali, M.; Excell, P.S.; Picking, R. A Review on Internet of Things (IoT), Internet of Everything (IoE) and Internet of Nano Things (IoNT). In Proceedings of the 2015 Internet Technologies and Applications (ITA), Wrexham, UK, 8–11 September 2015. [Google Scholar]
  5. Bujnowska-Fedak, M.M.; Waligóra, J.; Mastalerz-Migas, A. The Internet as a Source of Health Information and Services. In Advances in Experimental Medicine and Biology; Springer: Cham, Switzerland, 2019; pp. 1–16. ISBN 9783030327873. [Google Scholar]
  6. Zhao, Y.C.; Zhao, M.; Song, S. Online Health Information Seeking Behaviors among Older Adults: Systematic Scoping Review. J. Med. Internet Res. 2022, 24, e34790. [Google Scholar] [CrossRef]
  7. Madathil, K.C.; Rivera-Rodriguez, A.J.; Greenstein, J.S.; Gramopadhye, A.K. Healthcare Information on YouTube: A Systematic Review. Health Inform. J. 2015, 21, 173–194. [Google Scholar] [CrossRef]
  8. Gabarron, E.; Fernandez-Luque, L.; Armayones, M.; Lau, A.Y.S. Identifying Measures Used for Assessing Quality of YouTube Videos with Patient Health Information: A Review of Current Literature. Interact. J. Med. Res. 2013, 2, e6. [Google Scholar] [CrossRef] [PubMed]
  9. Li, H.O.-Y.; Bailey, A.; Huynh, D.; Chan, J. YouTube as a Source of Information on COVID-19: A Pandemic of Misinformation? BMJ Glob. Health 2020, 5, e002604. [Google Scholar] [CrossRef]
  10. Tomlein, M.; Pecher, B.; Simko, J.; Srba, I.; Moro, R.; Stefancova, E.; Kompan, M.; Hrckova, A.; Podrouzek, J.; Bielikova, M. An Audit of Misinformation Filter Bubbles on YouTube: Bubble Bursting and Recent Behavior Changes. In Proceedings of the Fifteenth ACM Conference on Recommender Systems; ACM: New York, NY, USA, 2021. [Google Scholar]
  11. Srba, I.; Moro, R.; Tomlein, M.; Pecher, B.; Simko, J.; Stefancova, E.; Kompan, M.; Hrckova, A.; Podrouzek, J.; Gavornik, A.; et al. Auditing YouTube’s Recommendation Algorithm for Misinformation Filter Bubbles. ACM Trans. Recomm. Syst. 2023, 1, 1–33. [Google Scholar] [CrossRef]
  12. Kirdemir, B.; Agarwal, N. Exploring Bias and Information Bubbles in YouTube’s Video Recommendation Networks. In Complex Networks & Their Applications X; Springer: Cham, Switzerland, 2022; pp. 166–177. ISBN 9783030934125. [Google Scholar]
  13. Osman, W.; Mohamed, F.; Elhassan, M.; Shoufan, A. Is YouTube a Reliable Source of Health-Related Information? A Systematic Review. BMC Med. Educ. 2022, 22, 382. [Google Scholar] [CrossRef]
  14. Chawla, S.; Ding, J.; Mazhar, L.; Khosa, F. Entering the Misinformation Age: Quality and Reliability of YouTube for Patient Information on Liposuction. Plast. Surg. (Oakv.) 2023, 31, 371–376. [Google Scholar] [CrossRef]
  15. Brachtenbach, T.; Cardenas, R.; Pate, H.; Solis, L.; Chinnery, L.; Bowers, A.; Vassar, M. YouTube: Searching for Answers about Breast Cancer. Breast Dis. 2020, 39, 85–90. [Google Scholar] [CrossRef]
  16. Hou, R.; Perez-Rosas, V.; Loeb, S.; Mihalcea, R. Towards Automatic Detection of Misinformation in Online Medical Videos. In Proceedings of the 2019 International Conference on Multimodal Interaction; ACM: New York, NY, USA, 2019. [Google Scholar]
  17. Onder, M.E.; Zengin, O. YouTube as a Source of Information on Gout: A Quality Analysis. Rheumatol. Int. 2021, 41, 1321–1328. [Google Scholar] [CrossRef]
  18. Yesudhas, D.; Srivastava, A.; Gromiha, M.M. COVID-19 Outbreak: History, Mechanism, Transmission, Structural Studies and Therapeutics. Infection 2021, 49, 199–213. [Google Scholar] [CrossRef] [PubMed]
  19. Gao, Y.; Yan, L.; Huang, Y.; Liu, F.; Zhao, Y.; Cao, L.; Wang, T.; Sun, Q.; Ming, Z.; Zhang, L.; et al. Structure of the RNA-Dependent RNA Polymerase from COVID-19 Virus. Science 2020, 368, 779–782. [Google Scholar] [CrossRef] [PubMed]
  20. Shereen, M.A.; Khan, S.; Kazmi, A.; Bashir, N.; Siddique, R. COVID-19 Infection: Emergence, Transmission, and Characteristics of Human Coronaviruses. J. Adv. Res. 2020, 24, 91–98. [Google Scholar] [CrossRef] [PubMed]
  21. Tian, S.; Hu, N.; Lou, J.; Chen, K.; Kang, X.; Xiang, Z.; Chen, H.; Wang, D.; Liu, N.; Liu, D.; et al. Characteristics of COVID-19 Infection in Beijing. J. Infect. 2020, 80, 401–406. [Google Scholar] [CrossRef]
  22. Alimohamadi, Y.; Sepandi, M.; Taghdir, M.; Hosamirudsari, H. Determine the Most Common Clinical Symptoms in COVID-19 Patients: A Systematic Review and Meta-Analysis. J. Prev. Med. Hyg. 2020, 61, E304. [Google Scholar] [CrossRef]
  23. Larsen, J.R.; Martin, M.R.; Martin, J.D.; Kuhn, P.; Hicks, J.B. Modeling the Onset of Symptoms of COVID-19. Front. Public Health 2020, 8, 473. [Google Scholar] [CrossRef]
  24. Vraga, E.K.; Bode, L. Defining Misinformation and Understanding Its Bounded Nature: Using Expertise and Evidence for Describing Misinformation. Polit. Commun. 2020, 37, 136–144. [Google Scholar] [CrossRef]
  25. Cook, J.; Ecker, U.; Lewandowsky, S. Misinformation and How to Correct It. In Emerging Trends in the Social and Behavioral Sciences; John Wiley & Sons, Inc.: Hoboken, NJ, USA, 2015; pp. 1–17. [Google Scholar]
  26. van der Linden, S. Misinformation: Susceptibility, Spread, and Interventions to Immunize the Public. Nat. Med. 2022, 28, 460–467. [Google Scholar] [CrossRef]
  27. Almaliki, M. Online Misinformation Spread: A Systematic Literature Map. In Proceedings of the 2019 3rd International Conference on Information System and Data Mining; ACM: New York, NY, USA, 2019. [Google Scholar]
  28. Del Vicario, M.; Bessi, A.; Zollo, F.; Petroni, F.; Scala, A.; Caldarelli, G.; Stanley, H.E.; Quattrociocchi, W. The Spreading of Misinformation Online. Proc. Natl. Acad. Sci. USA 2016, 113, 554–559. [Google Scholar] [CrossRef]
  29. Proctor, R.; Schiebinger, L.L. (Eds.) Agnotology: The Making and Unmaking of Ignorance; Stanford University Press: Palo Alto, CA, USA, 2008. [Google Scholar]
  30. Diethelm, P.; McKee, M. Denialism: What Is It and How Should Scientists Respond? Eur. J. Public Health 2008, 19, 2–4. [Google Scholar] [CrossRef]
  31. Altay, S.; Berriche, M.; Acerbi, A. Misinformation on Misinformation: Conceptual and Methodological Challenges. Soc. Media Soc. 2023, 9, 205630512211504. [Google Scholar] [CrossRef]
  32. Biggest Social Media Platforms. 2023. Available online: https://www.statista.com/statistics/272014/global-social-networks-ranked-by-number-of-users/ (accessed on 10 December 2023).
  33. Top Websites in the World—Top Rankings October 2023. Available online: https://www.semrush.com/website/top/ (accessed on 10 December 2023).
  34. Mohsin, M. 10 YouTube Statistics That You Need to Know in 2023. Available online: https://www.oberlo.com/blog/youtube-statistics (accessed on 10 December 2023).
  35. Countries with the Highest Monthly Traffic Volume to Youtube.com. 2022. Available online: https://www.statista.com/statistics/1357163/youtube-global-monthly-visits-by-country/ (accessed on 10 December 2023).
  36. Blogger, G.M.I. YouTube Statistics 2023 [Users by Country + Demographics]. Available online: https://www.globalmediainsight.com/blog/youtube-users-statistics/ (accessed on 10 December 2023).
  37. Average Daily Time Spent on Social Media (Latest 2023 Data). Available online: https://www.broadbandsearch.net/blog/average-daily-time-on-social-media (accessed on 10 December 2023).
  38. YouTube App User Engagement in Selected Markets. 2022. Available online: https://www.statista.com/statistics/1287283/time-spent-youtube-app-selected-countries/ (accessed on 10 December 2023).
  39. ChannelMeter YouTube’s Top Countries. Available online: https://medium.com/@ChannelMeter/youtubes-top-countries-47b0d26dded (accessed on 10 December 2023).
  40. Global YouTube User Distribution by Gender. 2023. Available online: https://www.statista.com/statistics/1287032/distribution-youtube-users-gender (accessed on 10 December 2023).
  41. Global YouTube User Age & Gender Distribution. 2023. Available online: https://www.statista.com/statistics/1287137/youtube-global-users-age-gender-distribution/ (accessed on 10 December 2023).
  42. YouTube Penetration in Selected Countries and Territories. 2023. Available online: https://www.statista.com/statistics/1219589/youtube-penetration-worldwide-by-country/ (accessed on 10 December 2023).
  43. Posner, M. YouTube Amplifies Misinformation and Hatred, but Here’s What We Can Do about It. Available online: https://www.forbes.com/sites/michaelposner/2022/06/17/youtube-amplifies-misinformation-and-hatred-but-heres-what-we-can-do-about-it/?sh=496312b51592 (accessed on 10 December 2023).
  44. Milmo, D. YouTube Is Major Conduit of Fake News, Factcheckers Say. Available online: https://www.theguardian.com/technology/2022/jan/12/youtube-is-major-conduit-of-fake-news-factcheckers-say (accessed on 10 December 2023).
  45. Pandey, A.; Patni, N.; Singh, M.; Sood, A.; Singh, G. YouTube as a Source of Information on the H1N1 Influenza Pandemic. Am. J. Prev. Med. 2010, 38, e1–e3. [Google Scholar] [CrossRef] [PubMed]
  46. Pathak, R.; Poudel, D.; Karmacharya, P.; Pathak, A.; Mahmood, M.; Aryal, M.; Donato, A. Youtube as a Source of Information on Ebola Virus Disease. N. Am. J. Med. Sci. 2015, 7, 306. [Google Scholar] [CrossRef] [PubMed]
  47. Bora, K.; Das, D.; Barman, B.; Borah, P. Are Internet Videos Useful Sources of Information during Global Public Health Emergencies? A Case Study of YouTube Videos during the 2015–16 Zika Virus Pandemic. Pathog. Glob. Health 2018, 112, 320–328. [Google Scholar] [CrossRef]
  48. D’Souza, R.S.; D’Souza, S.; Strand, N.; Anderson, A.; Vogt, M.N.P.; Olatoye, O. YouTube as a Source of Medical Information on the Novel Coronavirus 2019 Disease (COVID-19) Pandemic. Glob. Public Health 2020, 15, 935–942. [Google Scholar] [CrossRef] [PubMed]
  49. Chan, C.; Sounderajah, V.; Daniels, E.; Acharya, A.; Clarke, J.; Yalamanchili, S.; Normahani, P.; Markar, S.; Ashrafian, H.; Darzi, A. The Reliability and Quality of YouTube Videos as a Source of Public Health Information Regarding COVID-19 Vaccination: Cross-Sectional Study. JMIR Public Health Surveill. 2021, 7, e29942. [Google Scholar] [CrossRef] [PubMed]
  50. Hussein, E.; Juneja, P.; Mitra, T. Measuring Misinformation in Video Search Platforms: An Audit Study on YouTube. Proc. ACM Hum. Comput. Interact. 2020, 4, 1–27. [Google Scholar] [CrossRef]
  51. Juneja, P.; Bhuiyan, M.M.; Mitra, T. Assessing Enactment of Content Regulation Policies: A Post Hoc Crowd-Sourced Audit of Election Misinformation on YouTube. In Proceedings of the 2023 CHI Conference on Human Factors in Computing Systems; ACM: New York, NY, USA, 2023. [Google Scholar]
  52. Yoon, H.Y.; You, K.H.; Kwon, J.H.; Kim, J.S.; Rha, S.Y.; Chang, Y.J.; Lee, S.-C. Understanding the Social Mechanism of Cancer Misinformation Spread on YouTube and Lessons Learned: Infodemiological Study. J. Med. Internet Res. 2022, 24, e39571. [Google Scholar] [CrossRef]
  53. Kaiser, J.; Rauchfleisch, A.; Córdova, Y. Comparative Approaches to Mis/Disinformation| Fighting Zika with Honey: An Analysis of YouTube’s Video Recommendations on Brazilian YouTube. Int. J. Commun. 2021, 15, 19. [Google Scholar]
  54. Tang, L.; Fujimoto, K.; Amith, M.; Cunningham, R.; Costantini, R.A.; York, F.; Xiong, G.; Boom, J.A.; Tao, C. “Down the Rabbit Hole” of Vaccine Misinformation on YouTube: Network Exposure Study. J. Med. Internet Res. 2021, 23, e23262. [Google Scholar] [CrossRef]
  55. Betschart, P.; Pratsinis, M.; Müllhaupt, G.; Rechner, R.; Herrmann, T.R.W.; Gratzke, C.; Schmid, H.-P.; Zumstein, V.; Abt, D. Information on Surgical Treatment of Benign Prostatic Hyperplasia on YouTube Is Highly Biased and Misleading. BJU Int. 2020, 125, 595–601. [Google Scholar] [CrossRef]
  56. Qi, J.; Trang, T.; Doong, J.; Kang, S.; Chien, A.L. Misinformation Is Prevalent in Psoriasis-Related YouTube Videos. Dermatol. Online J. 2016, 22. [Google Scholar] [CrossRef]
  57. Loeb, S.; Sengupta, S.; Butaney, M.; Macaluso, J.N., Jr.; Czarniecki, S.W.; Robbins, R.; Braithwaite, R.S.; Gao, L.; Byrne, N.; Walter, D.; et al. Dissemination of Misinformative and Biased Information about Prostate Cancer on YouTube. Eur. Urol. 2019, 75, 564–567. [Google Scholar] [CrossRef] [PubMed]
  58. Goobie, G.C.; Guler, S.A.; Johannson, K.A.; Fisher, J.H.; Ryerson, C.J. YouTube Videos as a Source of Misinformation on Idiopathic Pulmonary Fibrosis. Ann. Am. Thorac. Soc. 2019, 16, 572–579. [Google Scholar] [CrossRef] [PubMed]
  59. Chidambaram, S.; Maheswaran, Y.; Chan, C.; Hanna, L.; Ashrafian, H.; Markar, S.R.; Sounderajah, V.; Alverdy, J.C.; Darzi, A. Misinformation about the Human Gut Microbiome in YouTube Videos: Cross-Sectional Study. JMIR Form. Res. 2022, 6, e37546. [Google Scholar] [CrossRef] [PubMed]
  60. Selvi, I.; Baydilli, N. An Analysis of Misleading YouTube Videos on Urological Conditions: What to Do about the Danger of Spreading Misinformation of the YouTube Videos? World J. Urol. 2022, 40, 885–886. [Google Scholar] [CrossRef] [PubMed]
  61. Kobilke, L.; Markiewitz, A. The Momo Challenge: Measuring the Extent to Which YouTube Portrays Harmful and Helpful Depictions of a Suicide Game. SN Soc. Sci. 2021, 1, 86. [Google Scholar] [CrossRef]
  62. Inwood, O.; Zappavigna, M. Ambient Affiliation, Misinformation and Moral Panic: Negotiating Social Bonds in a YouTube Internet Hoax. Discourse Commun. 2021, 15, 281–307. [Google Scholar] [CrossRef]
  63. Malhotra, K.; Kempegowda, P. Appraising Unmet Needs and Misinformation Spread about Polycystic Ovary Syndrome in 85,872 YouTube Comments over 12 Years: Big Data Infodemiology Study. J. Med. Internet Res. 2023, 25, e49220. [Google Scholar] [CrossRef]
  64. Tam, J.; Porter, E.K.; Lee, U.J. Examination of Information and Misinformation about Urinary Tract Infections on TikTok and YouTube. Urology 2022, 168, 35–40. [Google Scholar] [CrossRef] [PubMed]
  65. Loeb, S.; Taylor, J.; Borin, J.F.; Mihalcea, R.; Perez-Rosas, V.; Byrne, N.; Chiang, A.L.; Langford, A. Fake News: Spread of Misinformation about Urological Conditions on Social Media. Eur. Urol. Focus 2020, 6, 437–439. [Google Scholar] [CrossRef] [PubMed]
  66. Albarracin, D.; Romer, D.; Jones, C.; Hall Jamieson, K.; Jamieson, P. Misleading Claims about Tobacco Products in YouTube Videos: Experimental Effects of Misinformation on Unhealthy Attitudes. J. Med. Internet Res. 2018, 20, e229. [Google Scholar] [CrossRef] [PubMed]
  67. Li, H.O.-Y.; Pastukhova, E.; Brandts-Longtin, O.; Tan, M.G.; Kirchhof, M.G. YouTube as a Source of Misinformation on COVID-19 Vaccination: A Systematic Analysis. BMJ Glob. Health 2022, 7, e008334. [Google Scholar] [CrossRef]
  68. Calvo, D.; Cano-Orón, L.; Llorca-Abad, G. COVID-19 Vaccine Disinformation on YouTube: Analysis of a Viewing Network. Commun. Soc. 2022, 35, 223–238. [Google Scholar] [CrossRef]
  69. Dutta, A.; Beriwal, N.; Van Breugel, L.M.; Sachdeva, S.; Barman, B.; Saikia, H.; Nelson, U.-A.; Mahdy, A.; Paul, S. YouTube as a Source of Medical and Epidemiological Information during COVID-19 Pandemic: A Cross-Sectional Study of Content across Six Languages around the Globe. Cureus 2020, 12, e8622. [Google Scholar] [CrossRef]
  70. Donzelli, G.; Palomba, G.; Federigi, I.; Aquino, F.; Cioni, L.; Verani, M.; Carducci, A.; Lopalco, P. Misinformation on Vaccination: A Quantitative Analysis of YouTube Videos. Hum. Vaccin. Immunother. 2018, 14, 1654–1659. [Google Scholar] [CrossRef]
  71. Tokojima Machado, D.F.; Fioravante de Siqueira, A.; Rallo Shimizu, N.; Gitahy, L. It-Which-Must-Not-Be-Named: COVID-19 Misinformation, Tactics to Profit from It and to Evade Content Moderation on YouTube. Front. Commun. 2022, 7. [Google Scholar] [CrossRef]
  72. Basch, C.E.; Basch, C.H.; Hillyer, G.C.; Meleo-Erwin, Z.C.; Zagnit, E.A. YouTube Videos and Informed Decision-Making about COVID-19 Vaccination: Successive Sampling Study. JMIR Public Health Surveill. 2021, 7, e28352. [Google Scholar] [CrossRef] [PubMed]
  73. Quinn, E.K.; Fenton, S.; Ford-Sahibzada, C.A.; Harper, A.; Marcon, A.R.; Caulfield, T.; Fazel, S.S.; Peters, C.E. COVID-19 and Vitamin D Misinformation on YouTube: Content Analysis. JMIR Infodemiol. 2022, 2, e32452. [Google Scholar] [CrossRef] [PubMed]
  74. Medina Serrano, J.C.; Papakyriakopoulos, O.; Hegelich, S. NLP-Based Feature Extraction for the Detection of COVID-19 Misinformation Videos on YOuTUbe. In Proceedings of the 1st Workshop on NLP for COVID-19 at ACL 2020; Verspoor, K., Cohen, K.B., Dredze, M., Ferrara, E., May, J., Munro, R., Paris, C., Wallace, B., Eds.; Association for Computational Linguistics: Kerrville, TX, USA, 2020. [Google Scholar]
  75. Christodoulou, C.; Salamanos, N.; Leonidou, P.; Papadakis, M.; Sirivianos, M. Identifying Misinformation on YouTube through Transcript Contextual Analysis with Transformer Models. arXiv 2023, arXiv:2307.12155. [Google Scholar]
  76. Xie, J.; Chai, Y.; Liu, X. An Interpretable Deep Learning Approach to Understand Health Misinformation Transmission on YouTube. In Proceedings of the 55th Annual Hawaii International Conference on System Sciences, HICSS 2022; IEEE Computer Society: Los Alamitos, CA, USA, 2022; pp. 1470–1479. [Google Scholar]
  77. Vayansky, I.; Kumar, S.A.P. A Review of Topic Modeling Methods. Inf. Syst. 2020, 94, 101582. [Google Scholar] [CrossRef]
  78. Movahedi Nia, Z.; Bragazzi, N.; Asgary, A.; Orbinski, J.; Wu, J.; Kong, J. Mpox Panic, Infodemic, and Stigmatization of the Two-Spirit, Lesbian, Gay, Bisexual, Transgender, Queer or Questioning, Intersex, Asexual Community: Geospatial Analysis, Topic Modeling, and Sentiment Analysis of a Large, Multilingual Social Media Database. J. Med. Internet Res. 2023, 25, e45108. [Google Scholar] [CrossRef] [PubMed]
  79. Zhang, H.; Wheldon, C.; Dunn, A.G.; Tao, C.; Huo, J.; Zhang, R.; Prosperi, M.; Guo, Y.; Bian, J. Mining Twitter to Assess the Determinants of Health Behavior toward Human Papillomavirus Vaccination in the United States. J. Am. Med. Inform. Assoc. 2020, 27, 225–235. [Google Scholar] [CrossRef] [PubMed]
  80. Pruss, D.; Fujinuma, Y.; Daughton, A.R.; Paul, M.J.; Arnot, B.; Albers Szafir, D.; Boyd-Graber, J. Zika Discourse in the Americas: A Multilingual Topic Analysis of Twitter. PLoS ONE 2019, 14, e0216922. [Google Scholar] [CrossRef] [PubMed]
  81. Odlum, M.; Lee, H.; Broadwell, P.; Kuang, D.; Yoon, S. What Can We Learn about the Middle East Respiratory Syndrome (MERS) Outbreak from Tweets? Big Data Inf. Anal. 2017, 2, 7. [Google Scholar] [CrossRef]
  82. Missier, P.; Romanovsky, A.; Miu, T.; Pal, A.; Daniilakis, M.; Garcia, A.; Cedrim, D.; da Silva Sousa, L. Tracking Dengue Epidemics Using Twitter Content Classification and Topic Modelling. In Current Trends in Web Engineering; Springer: Cham, Switzerland, 2016; pp. 80–92. ISBN 9783319469621. [Google Scholar]
  83. Chen, L.; Hossain, K.S.M.T.; Butler, P.; Ramakrishnan, N.; Prakash, B.A. Flu Gone Viral: Syndromic Surveillance of Flu on Twitter Using Temporal Topic Models. In Proceedings of the 2014 IEEE International Conference on Data Mining, Shenzhen, China, 14–17 December 2014. [Google Scholar]
  84. Knuutila, A. A Dataset of Covid-Related Misinformation Videos and Their Spread on Social Media. Available online: https://zenodo.org/records/4557828 (accessed on 11 December 2023).
  85. Package Google.Cloud.Translation.V3. Available online: https://cloud.google.com/translate/docs/reference/rpc/google.cloud.translation.v3 (accessed on 18 December 2023).
  86. Blei, D.M.; Ng, A.Y.; Jordan, M.I. Latent Dirichlet Allocation. J. Mach. Learn. Res. 2003, 3, 993–1022. [Google Scholar]
  87. Jelodar, H.; Wang, Y.; Yuan, C.; Feng, X.; Jiang, X.; Li, Y.; Zhao, L. Latent Dirichlet Allocation (LDA) and Topic Modeling: Models, Applications, a Survey. Multimed. Tools Appl. 2019, 78, 15169–15211. [Google Scholar] [CrossRef]
  88. Wei, X.; Croft, W.B. LDA-Based Document Models for Ad-Hoc Retrieval. In Proceedings of the 29th Annual International ACM SIGIR Conference on Research and Development in Information Retrieval; ACM: New York, NY, USA, 2006. [Google Scholar]
  89. Hinton, G. Stochastic neighbor embedding. Adv. Neural Inf. Process. Syst. 2003, 15, 857–864. [Google Scholar]
  90. Maaten, V.D. Visualizing data using t-SNE. J. Mach. Learn. Res. 2008, 9, 2579. [Google Scholar]
  91. Tsytsarau, M.; Palpanas, T. Survey on Mining Subjective Data on the Web. Data Min. Knowl. Discov. 2012, 24, 478–514. [Google Scholar] [CrossRef]
  92. Saberi, B.; Saad, S. Sentiment Analysis or Opinion Mining: A Review. Available online: https://core.ac.uk/download/pdf/296919524.pdf (accessed on 11 December 2023).
  93. Liu, B. Sentiment Analysis and Opinion Mining; Springer: Cham, Switzerland, 2022; ISBN 9783031021459. [Google Scholar]
  94. Medhat, W.; Hassan, A.; Korashy, H. Sentiment Analysis Algorithms and Applications: A Survey. Ain Shams Eng. J. 2014, 5, 1093–1113. [Google Scholar] [CrossRef]
  95. Wilson, T. Recognizing Contextual Polarity in Phrase-Level Sentiment Analysis. In Proceedings of the HLT/EMNLP’05, Vancouver, BC, Canada, 6–8 October 2005; Association for Computational Linguistics: Pittsburgh, PA, USA, 2005; pp. 347–354. [Google Scholar]
  96. Do, H.H.; Prasad, P.W.C.; Maag, A.; Alsadoon, A. Deep Learning for Aspect-Based Sentiment Analysis: A Comparative Review. Expert Syst. Appl. 2019, 118, 272–299. [Google Scholar] [CrossRef]
  97. Nazir, A.; Rao, Y.; Wu, L.; Sun, L. Issues and Challenges of Aspect-Based Sentiment Analysis: A Comprehensive Survey. IEEE Trans. Affect. Comput. 2022, 13, 845–863. [Google Scholar] [CrossRef]
  98. Hutto, C.; Gilbert, E. VADER: A Parsimonious Rule-Based Model for Sentiment Analysis of Social Media Text. Proc. Int. AAAI Conf. Web Soc. Media 2014, 8, 216–225. [Google Scholar] [CrossRef]
  99. Veena, G.; Vinayak, A.; Nair, A.J. Sentiment Analysis Using Improved Vader and Dependency Parsing. In Proceedings of the 2021 2nd Global Conference for Advancement in Technology (GCAT), Bangalore, India, 1–3 October 2021. [Google Scholar]
  100. Nguyen, H.; Veluchamy, A.; Diop, M.; Iqbal, R. Comparative Study of Sentiment Analysis with Product Reviews Using Machine Learning and Lexicon-Based Approaches. SMU Data Sci. Rev. 2018, 1, 7. [Google Scholar]
  101. Franzese, M.; Iuliano, A. Correlation Analysis. In Encyclopedia of Bioinformatics and Computational Biology; Elsevier: Amsterdam, The Netherlands, 2019; Volume 1–3, pp. 706–721. ISBN 9780128114322. [Google Scholar]
  102. Sedgwick, P. Pearson’s Correlation Coefficient. BMJ 2012, 345, e4483. [Google Scholar] [CrossRef]
  103. Zhang, L.; Tong, Y.; Ji, Q. Active Image Labeling and Its Application to Facial Action Labeling. In Lecture Notes in Computer Science; Springer: Berlin/Heidelberg, Germany, 2008; pp. 706–719. ISBN 9783540886853. [Google Scholar]
  104. Woods, D.D.; Dekker, S.; Cook, R.; Johannesen, L.; Sarter, N. Behind Human Error, 2nd ed.; CRC Press: Boca Raton, FL, USA, 2017; ISBN 9781315568935. [Google Scholar]
Figure 1. A flowchart to represent the development of the master dataset for analysis.
Computation 12 00028 g001
Figure 2. A flowchart to represent the workings of Algorithms 1–4 on the master dataset.
Computation 12 00028 g002
Figure 3. A flowchart to represent the working of Algorithm 5 on the master dataset.
Computation 12 00028 g003
Figure 4. Representation of the variation of coherence scores for topics (number of topics varied from 3 to 30).
Computation 12 00028 g004
Figure 5. Representation of the number of video descriptions per topic.
Computation 12 00028 g005
Figure 6. Visualization of the topic clusters in a 2D space using t-SNE.
Computation 12 00028 g006
Figure 7. Distribution of sentiment (as per VADER) in Topic 0 or the theme of Promotion and Outreach Efforts.
Computation 12 00028 g007
Figure 8. Distribution of sentiment (as per VADER) in Topic 1 or the theme of Treatment for COVID-19.
Computation 12 00028 g008
Figure 9. Distribution of sentiment (as per VADER) in Topic 2 or the theme of Conspiracy Theories Regarding COVID-19.
Computation 12 00028 g009
Figure 10. Distribution of sentiment (as per VADER) in Topic 3 or the theme of COVID-19 and Politics.
Computation 12 00028 g010
Figure 11. Distribution of different languages in Topic 0 or the theme of Promotion and Outreach Efforts.
Computation 12 00028 g011
Figure 12. Distribution of different languages in Topic 1 or the theme of Treatment for COVID-19.
Computation 12 00028 g012
Figure 13. Distribution of different languages in Topic 2 or the theme of Conspiracy Theories Regarding COVID-19.
Computation 12 00028 g013
Figure 14. Distribution of different languages in Topic 3 or the theme of COVID-19 and Politics.
Computation 12 00028 g014
Figure 15. Representation of the variation in Facebook posts per language where the underlying Facebook posts shared a video(s) from this dataset.
Computation 12 00028 g015
Figure 16. Representation of the variation in Tweets per language where the underlying Tweets shared a video(s) from this dataset.
Computation 12 00028 g016
Figure 17. Representation of the correlations between different characteristics of the videos.
Computation 12 00028 g017
Table 1. Presentation of different themes that the specific identified topics (Algorithms 1 and 2) represented.
Video NumberVideo Description
Topic 0, Theme: Promotion and Outreach Efforts
Video #1Subscribe and ring the bell to be notified of a new video La chl
Video #2Please share the video with your friends and acquaintances so that this current information spreads like an avalanche. Follow us on our Teleg
Video #3Please like share and Subscribe the Channel friends
Video #4If you like this video, subscribe and a little click on the little hand at the bottom of the video would make me very happy Thank you
Video #5Be aware from Corona Virus but Don t Panic Share as much as you can Subscribe our channel
Topic 1, Theme: Treatment for COVID-19
Video #1Coronavirus has a cure, the light is born at the end of the tunnel Sucesso Brasil COVID has a cure
Video #2Allama Zameer Akhtar Naqvi talks about coronavirus treatment
Video #3CHLOROQUINE THE CURE FOR COVID Today the announced a possible cure for You heard it on The HighWire first
Video #4According to Patanjali the new Ayurvedic medicine Coronil From Patanjali developed by the team can cure a COVID patient in five to days Ref news o
Video #5Message from Doctor Merci Blanco to the mayor of Bogotá on how to eliminate CORONAVIRUS with Chlorine Dioxide
Topic 2, Theme: Conspiracy Theories Regarding COVID-19
Video #1The Corona Virus was produced intentionally to close the Borders to produce the World Crisis Famine and War Everything Depends on Us if We Return to D
Video #2In this diabolical plan, you will best see how all the NOM actors from the press, the medical system, the international system of those days, experts and
Video #3Everything that has been handled with the pandemic has been a well-forged lie coordinated from the highest sphere of power in the world, a great manipulation.
Video #4This coronavirus has been created for a long time but it has only now spread around the world
Video #5False Pandemic increasingly evident HY MICROCHIP will be the next thing to fuck up human life with suffocating hypercontrol, you want it because it will be time
Topic 3, Theme: COVID-19 and Politics
Video #1Infection models that garunteed MILLIONS DEAD in usa alone That all politicians used got our economy destroyed now we must open up msm is lying to us to push
Video #2They are African Leaders selling us into Slavery Agian Lockdown Ban Lifted in Ghana Good or Bad
Video #3Why governors are denying treatment for COVID
Video #4Approved by the Ministry of Health of Bolivia, more and more people use it
Video #5The president of Madagascar Andry Rajoelina has officially launched a local herbal remedy claimed to prevent and cure the novel coronavirus Tests have been
Note: These video descriptions are presented directly from the dataset. These video descriptions do not represent or reflect the views, opinions, beliefs, or political stance of the authors of this paper.
Table 2. Comparison of the focus area of this work with the focus areas of prior works in this field.
WorkContent
Analysis
Correlation AnalysisSentiment AnalysisTopic ModelingTopic-Specific
Sentiment Analysis
Topic-Specific
Language Analysis
Quinn et al. [73]
Basch et al. [72]
Li et al. [9]
Li et al. [67]
Dutta et al. [69]
Donzelli et al. [70]
Christodoulou et al. [75]
Serrano et al. [74]
Calvo et al. [68]
Machado et al. [71]
Xie et al. [76]
Thakur et al. (this work)
Table 3. Comparison of the number of videos analyzed in this work with the number of videos analyzed in prior works in this field.
WorkNumber of Videos Analyzed
Quinn et al. [73]77
Basch et al. [72]100
Li et al. [9]150
Li et al. [67] 150
Dutta et al. [69] 240
Donzelli et al. [70] 560
Christodoulou et al. [75] 1000
Serrano et al. [74] 1672
Calvo et al. [68]1890
Machado et al. [71] 3318
Xie et al. [76] 4445
Thakur et al. (this work)8122
Disclaimer/Publisher’s Note: The statements, opinions and data contained in all publications are solely those of the individual author(s) and contributor(s) and not of MDPI and/or the editor(s). MDPI and/or the editor(s) disclaim responsibility for any injury to people or property resulting from any ideas, methods, instructions or products referred to in the content.

