Article

Explainable Boosting Machine Learning for Predicting Bond Strength of FRP Rebars in Ultra High-Performance Concrete

1
Department of Civil Engineering, Shahid Rajaee Teacher Training University, Tehran P.O. Box 16788-15811, Iran
2
Department of Civil Engineering, Semnan University, Semnan 1581613711, Iran
3
Department of Built Environment, OsloMet—Oslo Metropolitan University, 0166 Oslo, Norway
*
Author to whom correspondence should be addressed.
Computation 2024, 12(10), 202; https://doi.org/10.3390/computation12100202
Submission received: 30 August 2024 / Revised: 29 September 2024 / Accepted: 1 October 2024 / Published: 9 October 2024
(This article belongs to the Special Issue Computational Methods in Structural Engineering)

Abstract

:
Aiming at evaluating the bond strength of fiber-reinforced polymer (FRP) rebars in ultra-high-performance concrete (UHPC), boosting machine learning (ML) models have been developed using datasets collected from previous experiments. The considered variables in this study are rebar type and diameter, elastic modulus and tensile strength of rebars, concrete compressive strength and cover, embedment length, and test method. The dataset contains two test methods: pullout tests and beam tests. Four types of rebar, including carbon fiber-reinforced polymer (CFRP), glass fiber-reinforced polymer (GFRP), basalt, and steel rebars, were considered. The boosting ML models applied in this study include AdaBoost, CatBoost, Gradient Boosting, XGBoost, and Hist Gradient Boosting. After hyperparameter tuning, these models demonstrated significant improvements in predictive accuracy, with XGBoost achieving the highest R2 score of 0.95 and the lowest Root Mean Square Error (RMSE) of 2.21. Shapley values analysis revealed that tensile strength, elastic modulus, and embedment length are the most critical factors influencing bond strength. The findings offer valuable insights for applying ML models in predicting bond strength in FRP-reinforced UHPC, providing a practical tool for structural engineering.

1. Introduction

Fiber-reinforced polymer (FRP) rebars have been introduced as an alternative to address the corrosion challenges associated with traditional steel reinforcements [1]. FRP rebars offer corrosion resistance and a high strength-to-weight ratio, making them an attractive choice for concrete structures [2]. Compared to conventional steel rebars, FRP rebars exhibit distinct characteristics, such as high tensile strength and lightweight properties. However, unlike steel rebars, FRP rebars demonstrate no plastic behavior (yielding) before rupture, highlighting their unique tensile behavior [3].
Various types of FRP rebars, including glass FRP (GFRP) [4,5,6,7], carbon FRP (CFRP) [8], basalt FRP (BFRP) [9,10,11], and aramid FRP (AFRP) [12], have emerged as promising alternatives to traditional steel reinforcements. Each type of FRP rebar possesses unique characteristics with advantages and limitations. Generally, FRP rebars are brittle polymers with a lower modulus of elasticity compared to steel, particularly in the case of GFRP and BFRP bars [13].
GFRP rebars are particularly popular among the different FRP types due to their cost-effectiveness. The ratio of FRP reinforcement significantly influences the flexural capacity and failure mode of concrete beams. Increasing the GFRP reinforcement ratio has proven more effective in enhancing beam flexural capacity than adding steel fibers or optimizing fiber orientations [14]. Despite their appeal, GFRP rebars face challenges such as limited toughness, weaker bonding with concrete compared to steel rebars, and low fire resistance [15].
Although current FRP design standards and specifications do not extensively incorporate BFRP bars due to limited studies on their durability, basalt fiber offers promising attributes, including the ability to withstand high temperatures. Basalt fiber is an environmentally friendly material classified as sustainable due to its natural composition and the absence of chemical additives during production. It is considered a “green” material derived from rock [16].
One of the significant concerns with using CFRP in reinforced concrete (RC) members is the low bonding property of CFRP rods embedded in concrete, mortar, and epoxy resin. To address this issue, research has investigated using CFRP rods with attached GFRP ribs to improve bond strength. The study demonstrated excellent load-carrying capacity and fatigue durability of RC members strengthened by CFRP rods with ultra-high modulus [17].
Recently, ultra-high-performance fiber-reinforced concrete (UHPFRC) has gained significant research attention [18,19,20]. UHPFRC is a cement-based material characterized by high compressive strength, tensile and flexural strengths, ductility, and remarkable durability [21]. Ultra-high-performance concrete (UHPC) beams reinforced with FRP bars have exhibited high flexural stiffness and minimal crack width at the serviceability limit state [22].
Research on the bond performance of CFRP bars in UHPFRC, including tests on pullout specimens, revealed that bond strength increases with larger CFRP bar diameters. A theoretical model was developed to predict bond strength [23]. Additional studies have shown that the bond performance between CFRP bars and UHPC is predominantly affected by pullout damage, with CFRP bar surfaces peeling off from the internal core while UHPC remains undamaged. Enhancing the cover and steel fiber volume fraction improves bonding performance, whereas increasing the bar diameter reduces it. Equations for calculating ultimate bond strength and development length have been proposed, integrating factors such as CFRP bar diameter, bonded length, and cover thickness [24]. Additionally, the combined use of CFRP and UHPC has demonstrated strong performance as a retrofitting method for pre-damaged concrete [25].
The performance of concrete elements reinforced with FRP bars is fundamentally influenced by the bond properties between the reinforcement and the surrounding concrete. Achieving a sufficient level of bonding is critical for ensuring effective force transmission between these two materials. The substitution of steel with FRP significantly alters the load transfer mechanism between the concrete and reinforcement. The tensile behavior of FRP bars, which are composed of a single type of fiber material, is characterized by a linear elastic stress-strain response up to the point of failure [3].
While several practical formulas for calculating the ultimate bond strength of FRP bars in concrete exist in standards such as ACI 440.1R-06 [3] and CSA S806-12 [26], these codes primarily target ordinary concrete. They may not directly apply to evaluate the bond performance between FRP bars and UHPC with high compressive strength [27].
Recent advancements in machine learning (ML), particularly in boosting algorithms, have shown great promise in predicting complex material behavior in structural engineering. Boosting techniques such as AdaBoost, Gradient Boosting Machine, and XGBoost have been successfully applied to predict properties such as the compressive strength of ordinary concrete and high-performance concrete (HPC) [28,29,30,31,32]. The effectiveness of AdaBoost in predicting concrete compressive strength with high accuracy has been proven, outperforming the other ML methods, such as artificial neural networks [30]. Similarly, the Gradient Boosting Machine method was employed to model the nonlinear relationships in high-performance concrete [31], and XGBoost was used to predict CNT-modified concrete’s compressive strength [32]. These studies highlight the ability of boosting algorithms to handle complex datasets and deliver accurate predictions, making them suitable for analyzing material properties in structural engineering contexts.
Numerous studies have investigated the bond strength of various FRP rebars in UHPFRC using different testing methods, such as pullout and beam tests [33,34,35,36,37,38]. This study developed boosting ML-based models to predict the bond strength of UHPFRC containing various FRP bar types and test methods. Due to the limited dataset size typical in civil engineering research, non-parametric ML models are more suitable as they can effectively handle smaller datasets without overfitting. These models were chosen for their robustness, interpretability, and superior performance in capturing complex interactions within small datasets. The research also examined the significance of multiple features on the bond strength of UHPFRC. Variables considered in this study include rebar type and diameter, elastic modulus and tensile strength of rebars, concrete compressive strength, embedment length, and test method. The dataset includes two test methods—pullout and beam tests—and four types of rebars, including CFRP, GFRP, basalt, and steel rebars. Figure 1 illustrates the overall process of the study, starting with data collection from experimental studies on the bond strength of FRP rebars in UHPC. The data collection process includes various features related to concrete and rebars. These variables were then used as input features for the ML models, including AdaBoost, CatBoost, Gradient Boosting, XGBoost, and Hist Gradient Boosting. The figure highlights how these models were trained and tuned, with the final step showcasing model evaluation using R2, RMSE, and MAE metrics. Additionally, feature importance analysis was conducted to identify the most influential variables impacting bond strength predictions.

2. Previous Experimental Works on Bond Strength Assessment of Various FRP Bars in UHPFRC

Figure 2 depicts the condition of an FRP bar embedded in concrete. An average bond stress resists the stress in the bar, u. The equilibrium of forces can be calculated according to Equation (1).
l e π d b u = A f b a r f f
where l e , d b , and A f b a r represent the embedment length, diameter, and cross-sectional area of the bar, respectively, while f f denotes the stress developed in the bar at the end of the embedment length. Unlike steel bars, it is not always necessary to fully develop the strength of an FRP bar, particularly in cases where the flexural capacity is controlled by concrete crushing. In such scenarios, the required stress in the FRP bar at the point of failure may be lower than its guaranteed ultimate strength.
Table 1 summarizes previous studies investigating the bond strength of different FRP bars embedded in UHPFRC. Some studies focus on the behavior of individual FRP bar types, such as GFRP, CFRP, and BFRP, alongside conventional steel rebar used as a control specimen. One study, in particular, examined three types of FRP rebar—ribbed CFRP, sand-coated CFRP, and ribbed GFRP—along with steel rebar as a comparative benchmark [39]. The most frequently studied variables in the reviewed literature include rebar type and diameter, embedment length, and concrete cover.
Several findings from these studies were consistent across different FRP rebar types. The results generally indicated that the bond strength between FRP rebars, irrespective of the FRP type, was lower than that of steel rebars [40,41]. However, UHPC beams reinforced with GFRP bars showed a significant increase in flexural capacity compared to steel ones [27]. Furthermore, these findings suggest that using bars with smaller diameters enhances bond capacity [42].
Moreover, it was observed that increasing the embedment length could lead to a reduction in bond strength between FRP bars and UHPC [39,40,42]. However, one study reported an inverse relationship, where the bond strength of helically ribbed CFRP bars in UHPC decreased with a reduction in embedment length [8].
The results also confirmed the positive impact of concrete cover on bond strength, with a continuous increase in bond strength observed as the concrete cover thickness increased [8,40]. A comparison of maximum bond strength revealed the following order: ribbed CFRP bars, ribbed GFRP bars, steel bars, and sand-coated CFRP bars [39].
Additionally, a comparison of test methods indicated that the bond strength measured using the hinged beam test was lower than that obtained from the direct pullout test [33]. Specifically, the bond strength of GFRP rebars was higher in the beam test compared to the pullout test [40].
Several studies proposed formulas based on their results and compared them with existing design codes. Bond strength was predicted using two proposed equations with modified bond parameters and an artificial neural network (ANN) method, where the ANN demonstrated superior accuracy over the proposed formulas. A modified bond equation for helically ribbed and sand-coated FRP bars also improved prediction accuracy with the ANN approach [8]. Another study found that the ACI 440 equation provided reasonable predictions for under-reinforced beams but was unconservative for over-reinforced beams, overestimating flexural capacity. The CSA code offered better deflection predictions than ACI 440 equations. However, at ultimate capacity, both ACI 440 and CSA specifications were unconservative, particularly for over-reinforced beams, as neither code accounted for the additional ductility gained by the beams [27]. Lastly, the ACI 440.1R-15 and CSA S806-12 equations were conservative in predicting embedment length for BFRP bars, while the CSA-S6-14 equation was more accurate for BFRP with larger diameters. However, it was not conservative for smaller diameters [42].
Table 1. Summary of previous studies investigating the bond strength of various FRP bars in UHPFRC.
ResearchTest TypeFiber TypeVariablesFindings
Hu et al. (2024) [40]Pullout, beamGFRPEmbedment length
Concrete cover
Rebar type
Two distinct bond stress-slip relationships were identified based on the embedment length of GFRP rebars.
The bond strength of GFRP rebars was higher in the beam test compared to the pullout test, with the modified pullout test showing only a slight difference.
GFRP bars exhibited lower bond strength with UHPC than steel bars, regardless of the testing method.
Increasing the embedment length and decreasing the cover led to a linear reduction in bond strength between GFRP bars and UHPC.
It is recommended that the development length for sand-coated or deformed GFRP rebars with smaller diameters in UHPC should be at least 13 times the bar diameter, with a cover thickness not less than twice the bar diameter.
Yoo et al. (2023) [8]Pullout CFRPRebar profile
Embedment length
Rebar diameter
The critical concrete cover thickness for helically ribbed CFRP bars to prevent splitting failure is greater in high-strength concrete than in normal-strength concrete.
Bond strength in UHPC increases consistently with greater concrete cover thickness.
As the compressive strength of concrete increases, both the bond strength and bond stiffness of ribbed CFRP bars also improve.
Helically, ribbed CFRP bars in UHPC with longer embedment lengths exhibit higher bond strength than shorter lengths.
The bond strength of helically ribbed CFRP bars is more than double that of sand-coated CFRP bars.
Helically, ribbed CFRP bars demonstrate greater initial and post-toughness than sand-coated bars, although the post-toughness difference narrows due to the friction in sand-coated bars.
Existing bond design codes and proposed formulas inadequately predict the bond strength of CFRP bars in UHPC, particularly due to variations in CFRP bar profiles.
Bond strength predictions using modified equations and an artificial neural network (ANN) method proved more accurate, with the ANN demonstrating superior predictive capability.
A modified bond equation for helically ribbed and sand-coated CFRP bars enhanced prediction accuracy using the ANN approach.
Mahaini et al. (2023) [27]Four-point loadingGFRPReinforcement ratio
Number of rebars
Surface texture bars
GFRP-UHPC beams exhibited a typical bilinear response in both deflections and strains.
All GFRP beams showed similar stiffness during pre-cracking, independent of the reinforcement ratio.
Post-cracking stiffness increased with higher GFRP reinforcement ratios.
Higher reinforcement ratios improved the energy absorption capacity of the beams, reducing post-cracking strains in the GFRP bars.
Increasing the reinforcement ratio also enhanced the flexural capacity of the GFRP-UHPC beams.
When maintaining the same axial stiffness, the number of bars had minimal impact on the flexural behavior of UHPC beams.
Shifting the failure mode from GFRP rupture to concrete crushing improved the ductility of the UHPC beams.
GFRP-reinforced UHPC beams demonstrated significantly higher flexural capacity than steel-reinforced beams due to the higher tensile strength of GFRP. However, steel-reinforced beams had greater stiffness and lower midspan deflection.
The ACI equation provided reasonable predictions for under-reinforced beams but was unconservative for over-reinforced beams, overestimating flexural capacity.
The CSA code produced better deflection predictions than the ACI440 equations. However, at ultimate capacity, both ACI440 and CSA specifications were unconservative, particularly for over-reinforced beams, as they failed to account for the increased ductility.
Yoo et al. (2024) [39]PulloutCFRP
Ribbed CFRP
Sand coated CFRP
Ribbed GFRP
Steel rebar
Rebar type
Embedment length
Fibers (with and without fibers in UHPC)
Presence of shear reinforcement
Initially, stiffness was highest for steel bars, followed by sand-coated CFRP, ribbed CFRP, and ribbed GFRP bars. However, after the steel bars yielded, the order shifted to sand-coated CFRP, ribbed CFRP, ribbed GFRP, and steel.
Rupture occurred in ribbed CFRP, ribbed GFRP, and steel bars at certain bond lengths, while sand-coated CFRP bars did not rupture even at longer bond lengths.
The bond strength of FRP bars decreased as the bonded length increased.
The maximum bond strength followed the order: ribbed CFRP bars, ribbed GFRP bars, steel bars, and sand-coated CFRP bars.
Combining fiber mixing with a reinforcement cage will significantly enhance bond strength and ductility.
Due to different stress transfer mechanisms, bond strength measured in the hinged beam test was lower than in the direct pullout test.
Eltantawi et al. (2022) [42]Four-point loadingBFRPRebar diameter
Embedment length
Rebar surface texture (sand coated (SC) and helically wrapped (HW))
The load-carrying capacities of beams reinforced with SC-BFRP and HW-BFRP bars were nearly identical for the same embedment length.
The surface texture of BFRP bars had a minimal effect on the bond with concrete.
SC-BFRP bars exhibited slightly higher bond strength compared to HW-BFRP bars.
The bond strength of spliced BFRP bars decreased as splice length increased, with longer splice lengths reducing bond strength.
Larger diameter bars require longer splice lengths to reach maximum capacity, suggesting that smaller diameter bars enhance splice bond capacity.
The ACI 440.1R-15 and CSA S806-12 equations are conservative in predicting splice lengths for BFRP bars, while the CSA-S6-14 equation is more accurate for larger diameters but less so for smaller diameters.
Qasem et al. (2020) [41]PulloutCFRP
Steel rebars
Rebar type
Rebar diameter
Steel rebars exhibit superior bond strength compared to CFRP rebars across various types of concrete.
Control specimens without carbon nanotubes (CNTs) showed that steel rebars required higher bond stress for pullout than CFRP rebars due to stronger concrete-steel bonding.
Due to their high reactivity, the inclusion of CNT nanoparticles enhances the bond strength between rebars and UHPC.
Increasing CNT content in UHPC mix design raises the force needed to pull out steel rebars compared to control specimens.
However, excessive CNT content leads to increased porosity due to agglomeration, reducing the bond strength of CFRP rebars in UHPC.

3. Dataset Collection

To evaluate the bond strength of various FRP bars in UHPFRC using ML models, a dataset of 249 specimens from existing experimental studies was compiled. The specifics of this dataset are outlined in Table 2. The features analyzed in this study encompass both concrete and rebar characteristics. Table 2 details that the specimens underwent both pullout and beam tests. These test methods are further depicted in Figure 3. ACI 440.3R-12 [43] provides information about these test methods. In the pullout test, the displacement between the free end of the rebar and the UHPC is measured, whereas in the beam test, the displacement is measured at the beam supports [40]. The dataset includes four types of rebar: GFRP, CFRP, basalt, and steel. Rebar diameters range from 7.5 to 20 mm, with embedment lengths varying between 25 and 276 mm. The data reveal that fiber-reinforced rebars exhibit a low modulus of elasticity, ranging from 47 to 158, while all UHPFRC specimens have a high compressive strength (fc), between 71 and 181.

4. Dataset Construction

Figure 4 presents the results of the correlation analysis and distribution of key input variables concerning bond strength. Each hexagon represents a data point, and the color gradient in the hexagons indicates the density of the data points in specific regions of the plot. Darker hexagon colors represent regions of higher density, where more data points exhibit similar parameter values, thus signifying stronger correlations between these values and bond strength. Lighter colors indicate areas with fewer data points and weaker correlations. The color intensity helps visualize the concentration of the data and highlights where certain parameter values have more influence on bond strength. In Figure 4, the variables “Test method” and “Rebar type” are represented numerically for visualization purposes. The numeric equivalents for the test methods are as follows: 0 corresponds to the pullout test, while 1 represents the beam test. For the rebar types, the numeric representation is as follows: 0 denotes CFRP, 1 indicates GFRP, 2 stands for BFRP, and 3 signifies steel.
Figure 5 presents a correlation heatmap that visualizes the relationships between input variables and bond strength. The numbers within each heatmap cell represent the correlation coefficient values, which quantify the strength and direction of the relationship between the variables. A correlation coefficient value close to 1 indicates a strong positive correlation, meaning that as one variable increases, the other also increases. A value close to −1 indicates a strong negative correlation, where an increase in one variable corresponds to a decrease in the other. Values near 0 suggest no significant correlation between the variables. These numbers are important for understanding the influence of each input parameter on bond strength, providing insight into which variables are most critical for accurate predictions.
Figure 6 features histograms and violin plots for both the output and input variables, explicitly focusing on the most impactful features: concrete compressive strength, the tensile strength of rebars, and bond length. The histograms show the distribution of these variables, while the violin plots provide a deeper insight into their distribution characteristics, including density and variability. These visualizations highlight how these key variables are distributed within the dataset and their influence on the bond strength.

5. Boosting

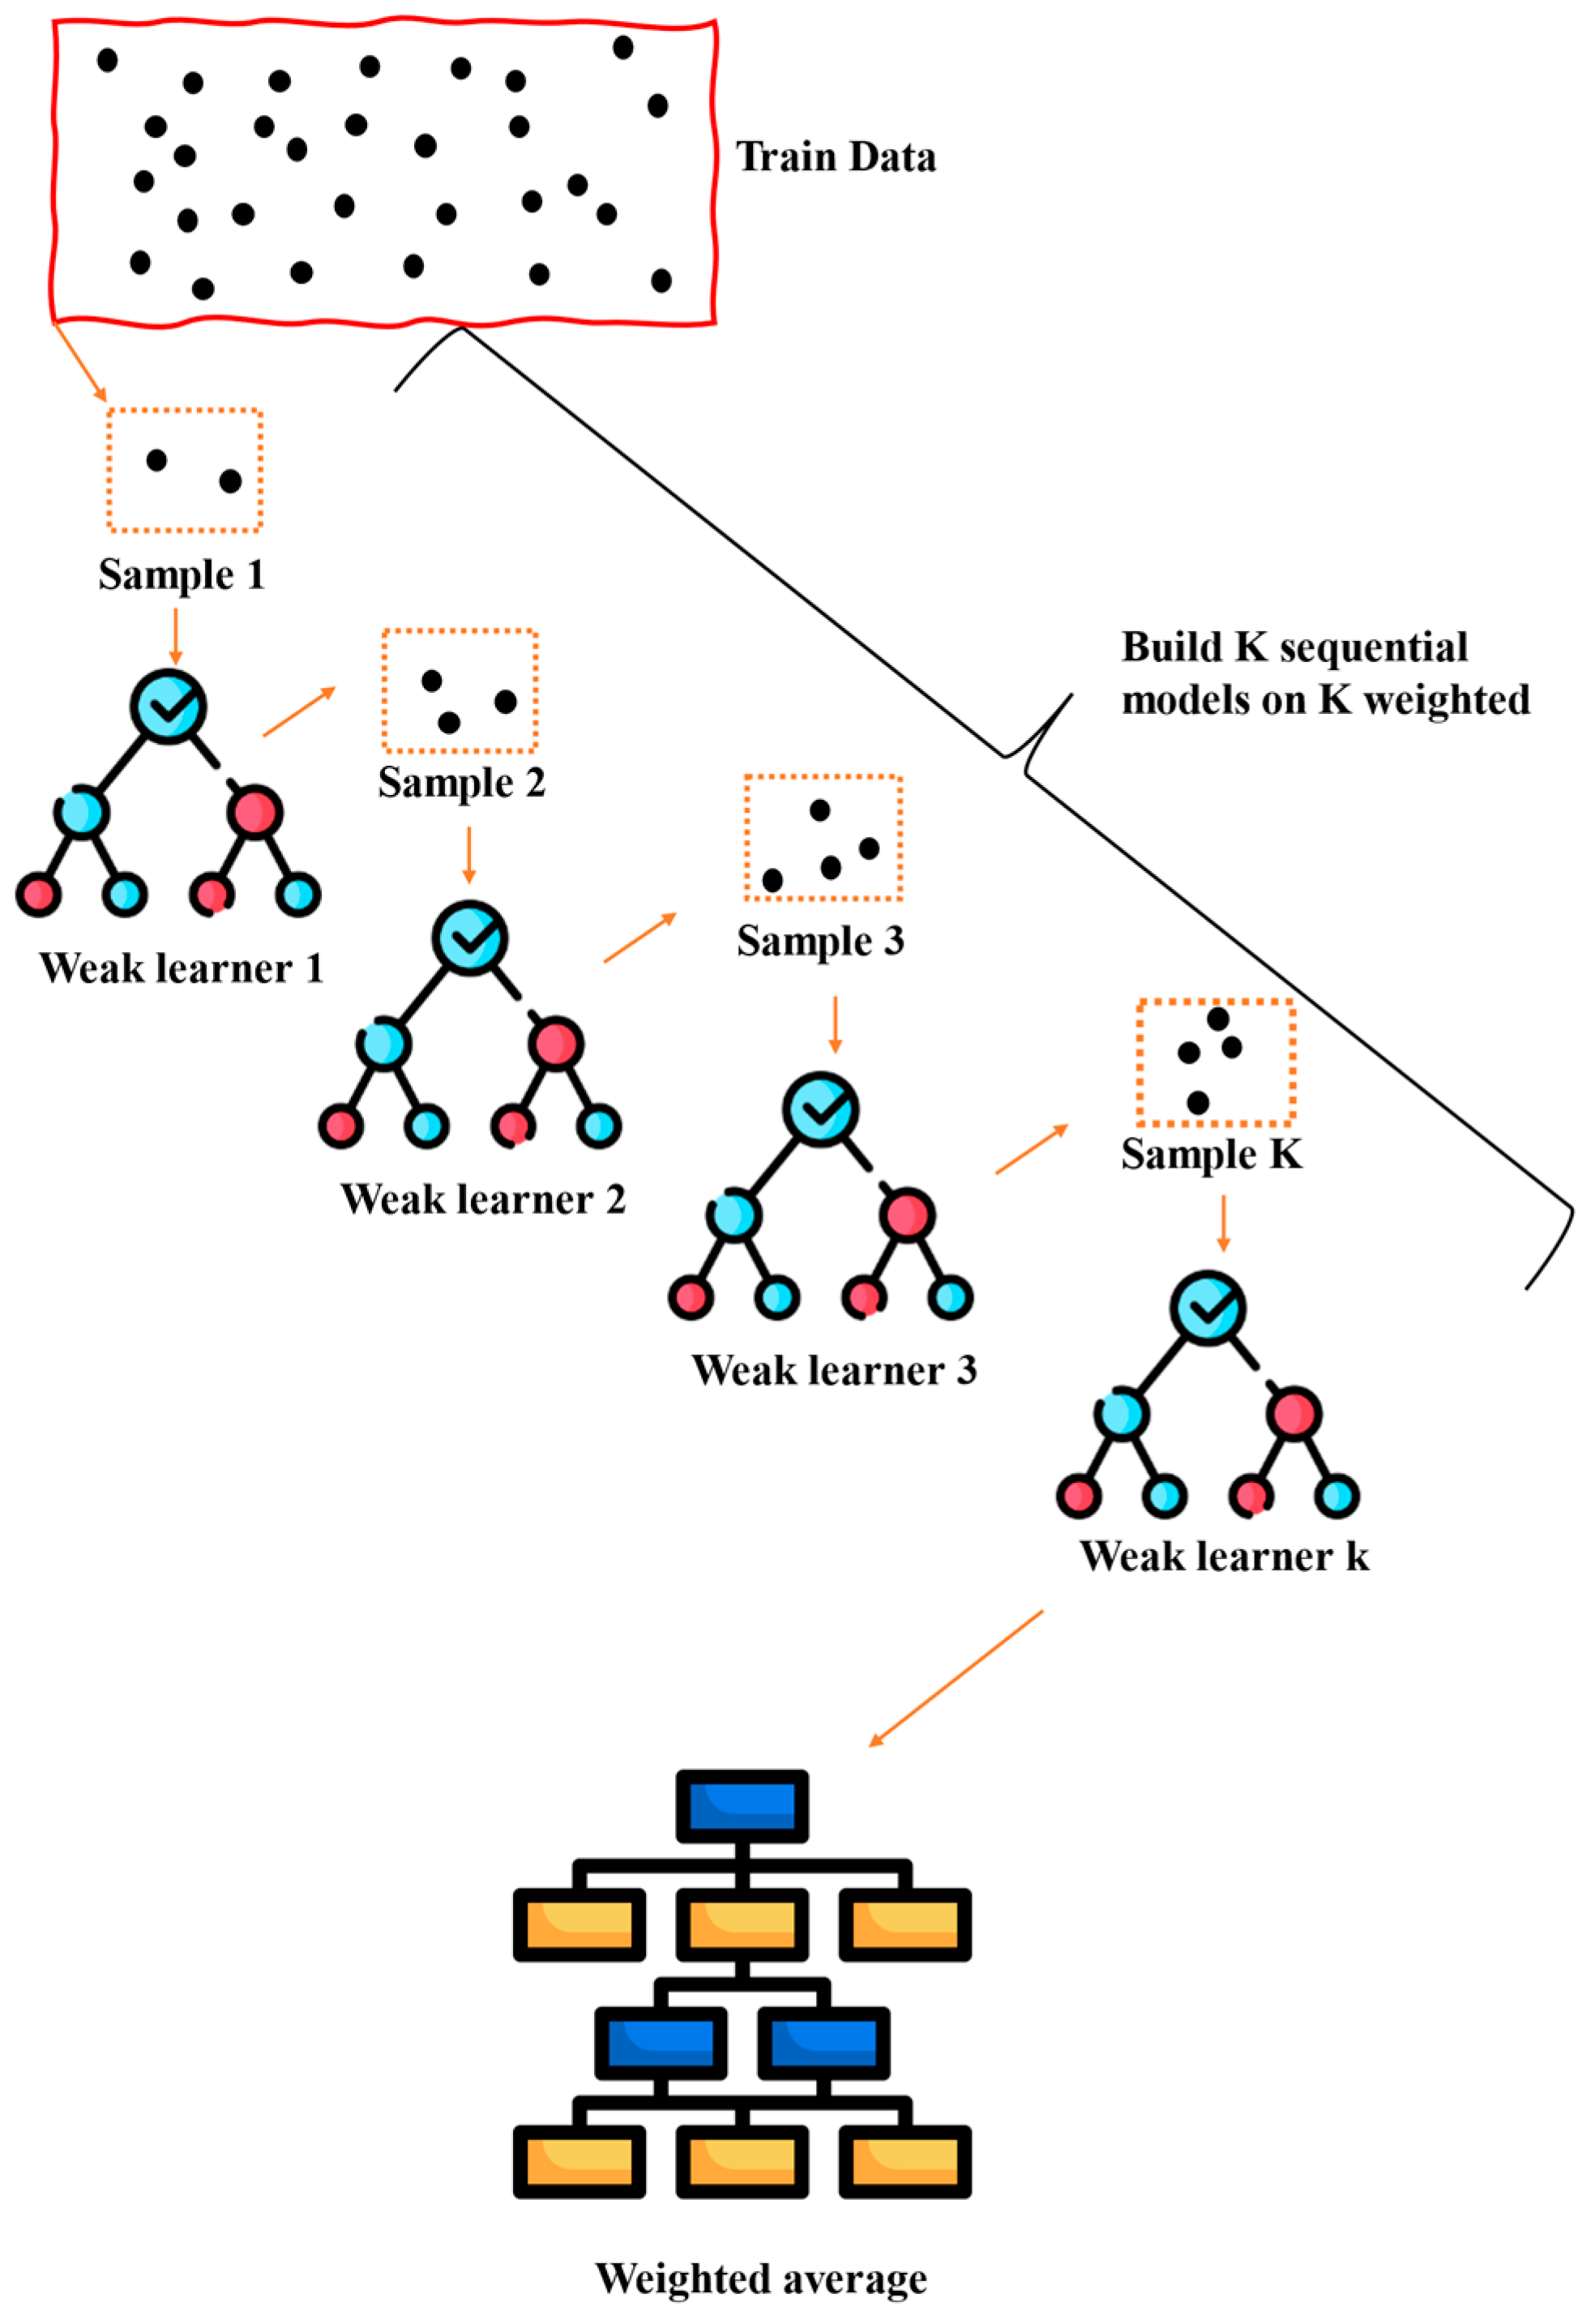
Boosting is an influential ensemble technique in ML that aims to create a strong predictive model by combining the outputs of multiple weak learners, typically decision trees [46]. As shown in Figure 7, the fundamental concept behind boosting is to sequentially train these weak learners so that each new learner focuses on the mistakes made by the previous ones. This iterative process allows the model to gradually improve its accuracy, effectively “boosting” its performance with each step [47]. At the core of boosting lies a simple yet powerful idea: instead of a single, complex model being built, a series of simpler models is constructed, where each successive model is designed to correct the errors of its predecessor. The process begins with a base model often a shallow decision tree, being trained on the entire dataset. The residuals, or errors, from this initial model, are then used to guide the training of the next model in the sequence. Specifically, the subsequent model is trained to predict these residuals, directly addressing the areas where the previous model fell short. This cycle is continued, with each model incrementally refining the predictions made by the ensemble.
AdaBoost is one of the earliest and most popular boosting algorithms. The key idea in AdaBoost is to focus on the instances in which the previous models were misclassified. The Algorithm 1 increases the weights of the misclassified cases so that the subsequent model pays more attention to them [47].
Algorithm 1. Algorithm of AdaBoost regressor
STEP 1: Initialize the weight distribution w i = 1 N   f o r   i = 1 , ,   N , where N is the number of training samples.
STEP 2: For each iteration m:
(A) Train a weak learner h m x using the weighted data.
(B) Compute the error rate. m as:
   m = i = 1 N w i . I ( y i h m x i ) i = 1 N w i
         (C) Compute the model weight α m :
   α m = l o g   1 m m
(D) Update the weights:
   w i w i . e x p ( α m I y i h m x i
(E) Normalize the weights
STEP 3: The final prediction is a weighted majority vote of the weak learners.
AdaBoost and Gradient Boosting build models sequentially, with each model focusing on correcting the errors of the previous one. However, AdaBoost focuses on misclassification errors, while Gradient Boosting minimizes a specified loss function using gradient descent.
XGBoost and Hist Gradient Boosting are both advanced implementations of Gradient Boosting that focus on improving computational efficiency and accuracy [48]. They incorporate optimizations such as regularization, parallel processing, and efficient data handling, making them faster and more scalable than traditional Gradient Boosting.
CatBoost is specifically designed to handle categorical data more effectively. It introduces ordered boosting, which builds models on subsets of data to prevent overfitting and uses advanced techniques to process categorical features without extensive preprocessing [49]. CatBoost is highly efficient when working with datasets that have a large number of categorical variables. CatBoost is unique among the five models due to its specialized focus on categorical data and unique ordered boosting approach. While it shares the boosting concept with the other models, its techniques and optimizations for categorical features set it apart.
When evaluating the performance of machine learning models, several key metrics are commonly used to assess the accuracy and reliability of predictions. The coefficient of determination, known as R2, is a statistical measure that represents the proportion of variance in the dependent variable that is predictable from the independent variables, as shown in Equation (2). A higher R2 value indicates a better fit of the model to the data, with a value of 1 indicating perfect prediction. However, R2 alone may not always provide a complete picture of model performance, especially in outliers or nonlinear relationships. To complement R2, as defined in Equation (3), Root Mean Squared Error (RMSE) is often used, providing an absolute measure of the difference between observed and predicted values. RMSE penalizes larger errors more significantly, making it sensitive to outliers. Additionally, Mean Absolute Error (MAE), shown in Equation (4), serves as a robust metric by calculating the average magnitude of prediction errors, regardless of direction, offering a straightforward interpretation of model accuracy. Together, these metrics—R2, RMSE, and MAE—provide a comprehensive evaluation of model performance, each highlighting different aspects of prediction quality, and are essential for comparing and selecting the most appropriate model for a given task. In these equations, y is the actual value, y ^ is the predicted value, and y ¯ is the mean of the actual values.
R 2 = 1 i = 1 N y ^ t e s t , i y t e s t , i 2 i = 1 N y ^ t e s t , i y ¯ t e s t 2
R M S E = y ^ t e s t , i y t e s t , i 2 N
M A E = 1 n i = 1 n y i y ^ i

6. Hyperparameter Tuning

Hyperparameter tuning is critical in building effective machine-learning models, especially when dealing with complex algorithms such as those used in boosting techniques [50]. The performance of machine learning models heavily depends on the appropriate selection of hyperparameters, which control the behavior of the learning process. Unlike model parameters, which are learned directly from the training data, hyperparameters must be set before the training begins and require careful tuning to optimize model performance.
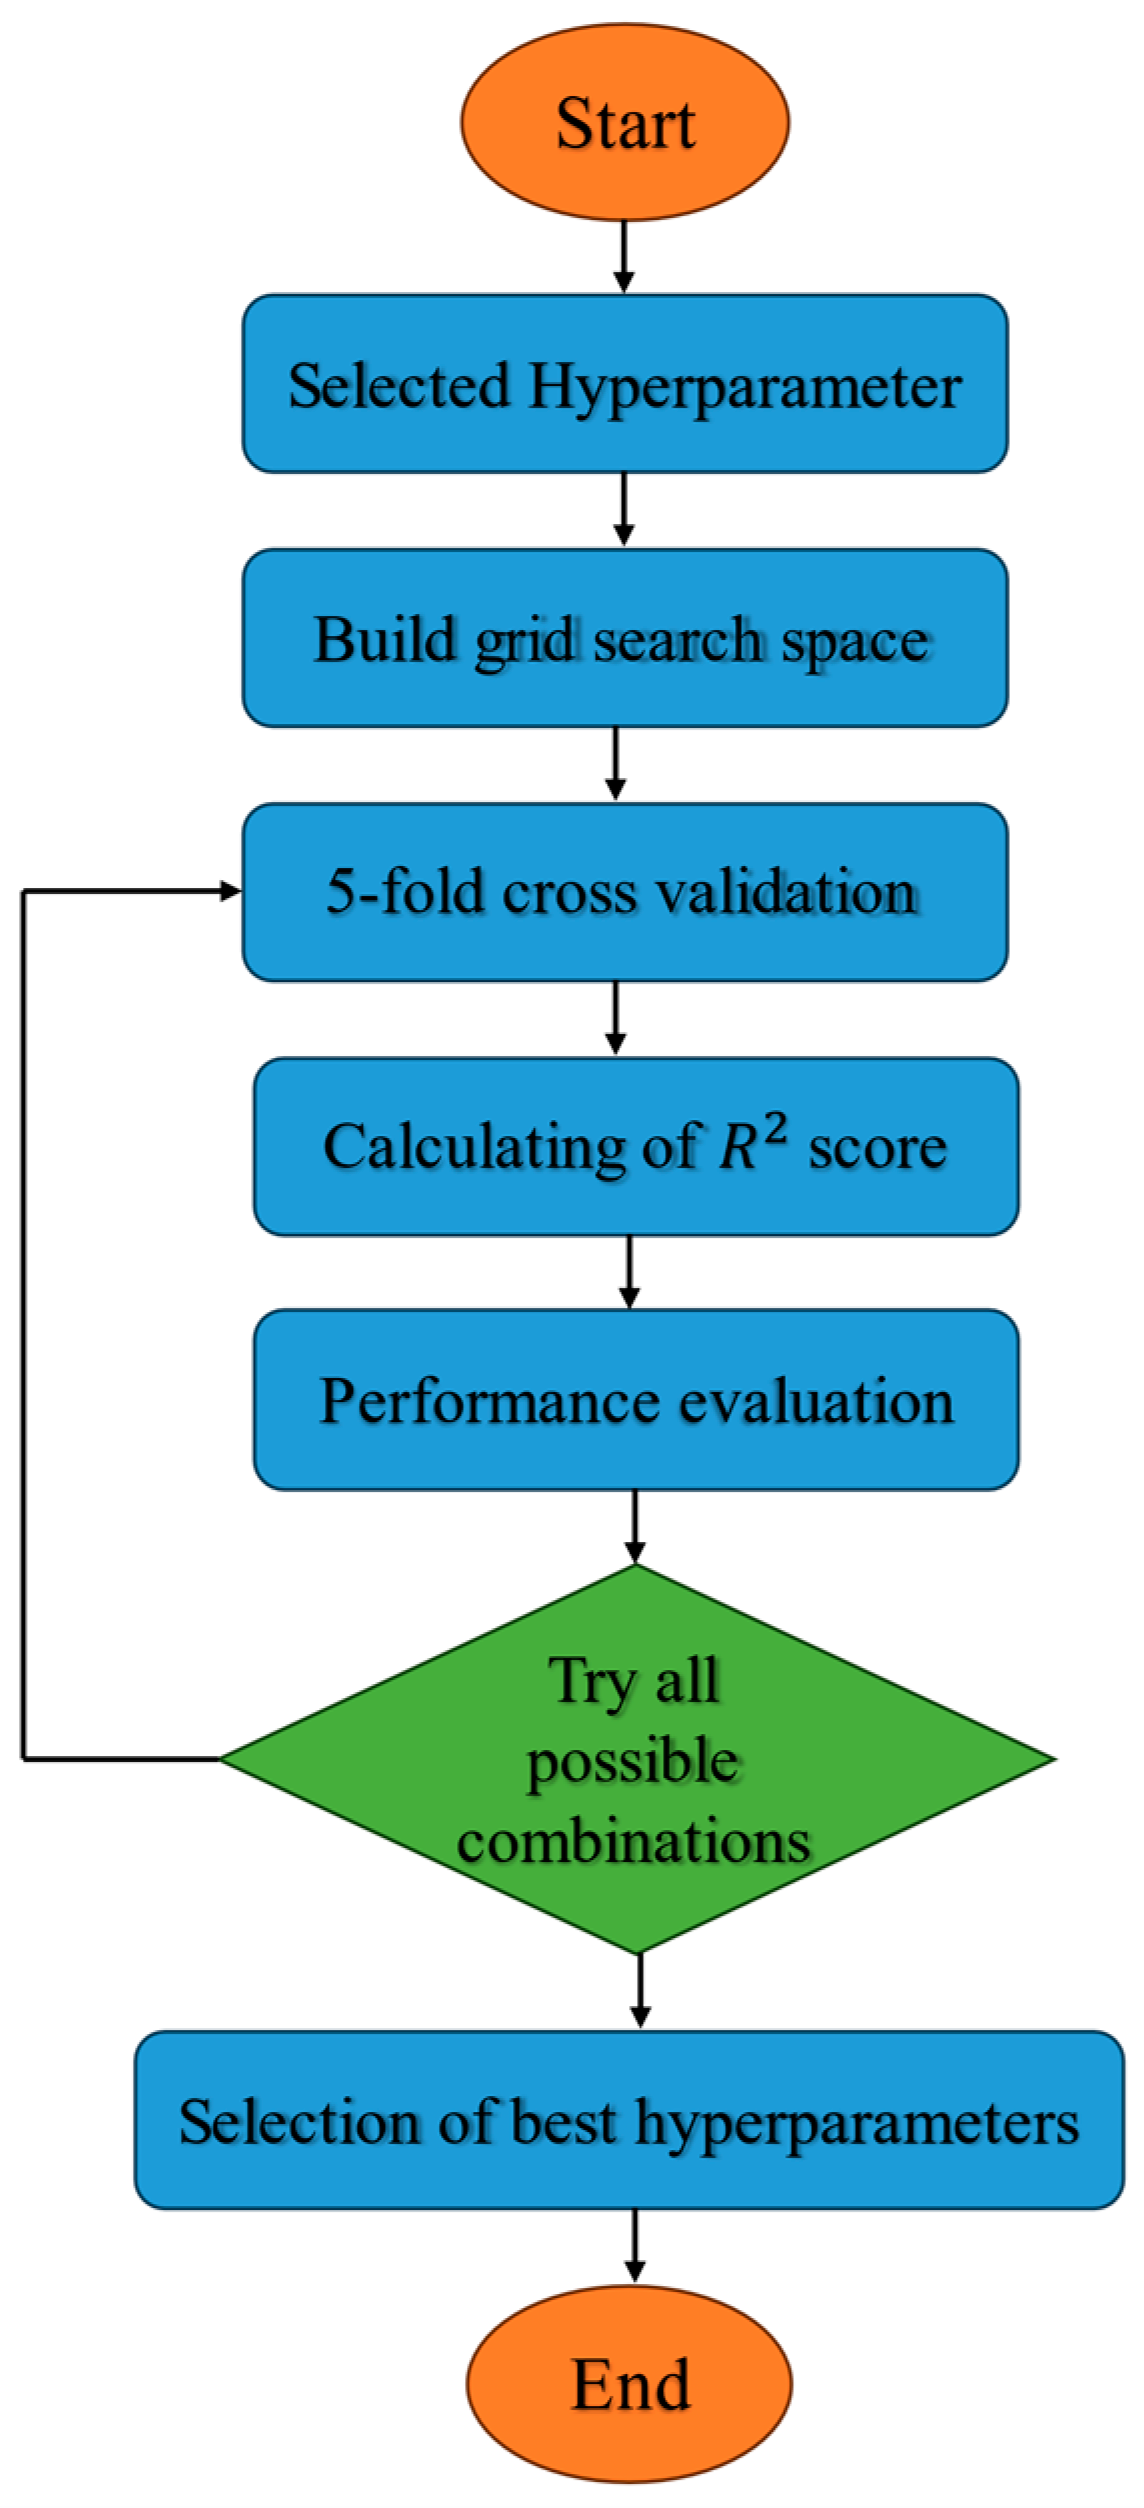
This study performed hyperparameter tuning using a grid search approach combined with 5-fold cross-validation. The goal was to systematically explore a range of possible hyperparameter values to identify the combination that yields the best performance on the training data while ensuring that the model generalizes well to unseen data.
The flowchart and k-fold cross-validation diagram depict the overall process, as shown in Figure 8 and Figure 9. Initially, the dataset was split into training and testing subsets, with the training set used for model training and hyperparameter tuning and the test set reserved for final model evaluation. For each hyperparameter combination, a model was trained and evaluated using 5-fold cross-validation, where the training data was split into five equally sized folds. Four subsets were used to train the model in each fold, and the remaining subset was used for validation. This process was repeated five times, with each subset serving as the validation set once, and the average performance metric (R2 score) across the folds was computed.
Upon completion of the grid search, the best combination of hyperparameters was identified based on the highest mean R2 score obtained during cross-validation. This optimal set of hyperparameters was then used to train the final model on the entire training set. The model’s performance was evaluated before and after tuning to assess the impact of hyperparameter optimization. The selected hyperparameters and their space for hyperparameter tuning are shown in Table 3, Table 4, Table 5 and Table 6.

7. Results

7.1. Machine Learning Results

The performance evaluation of the ML models was conducted using three key metrics: R2 score, RMSE, and MAE. These metrics were calculated both before and after hyperparameter tuning to assess the impact of the tuning process on model accuracy.
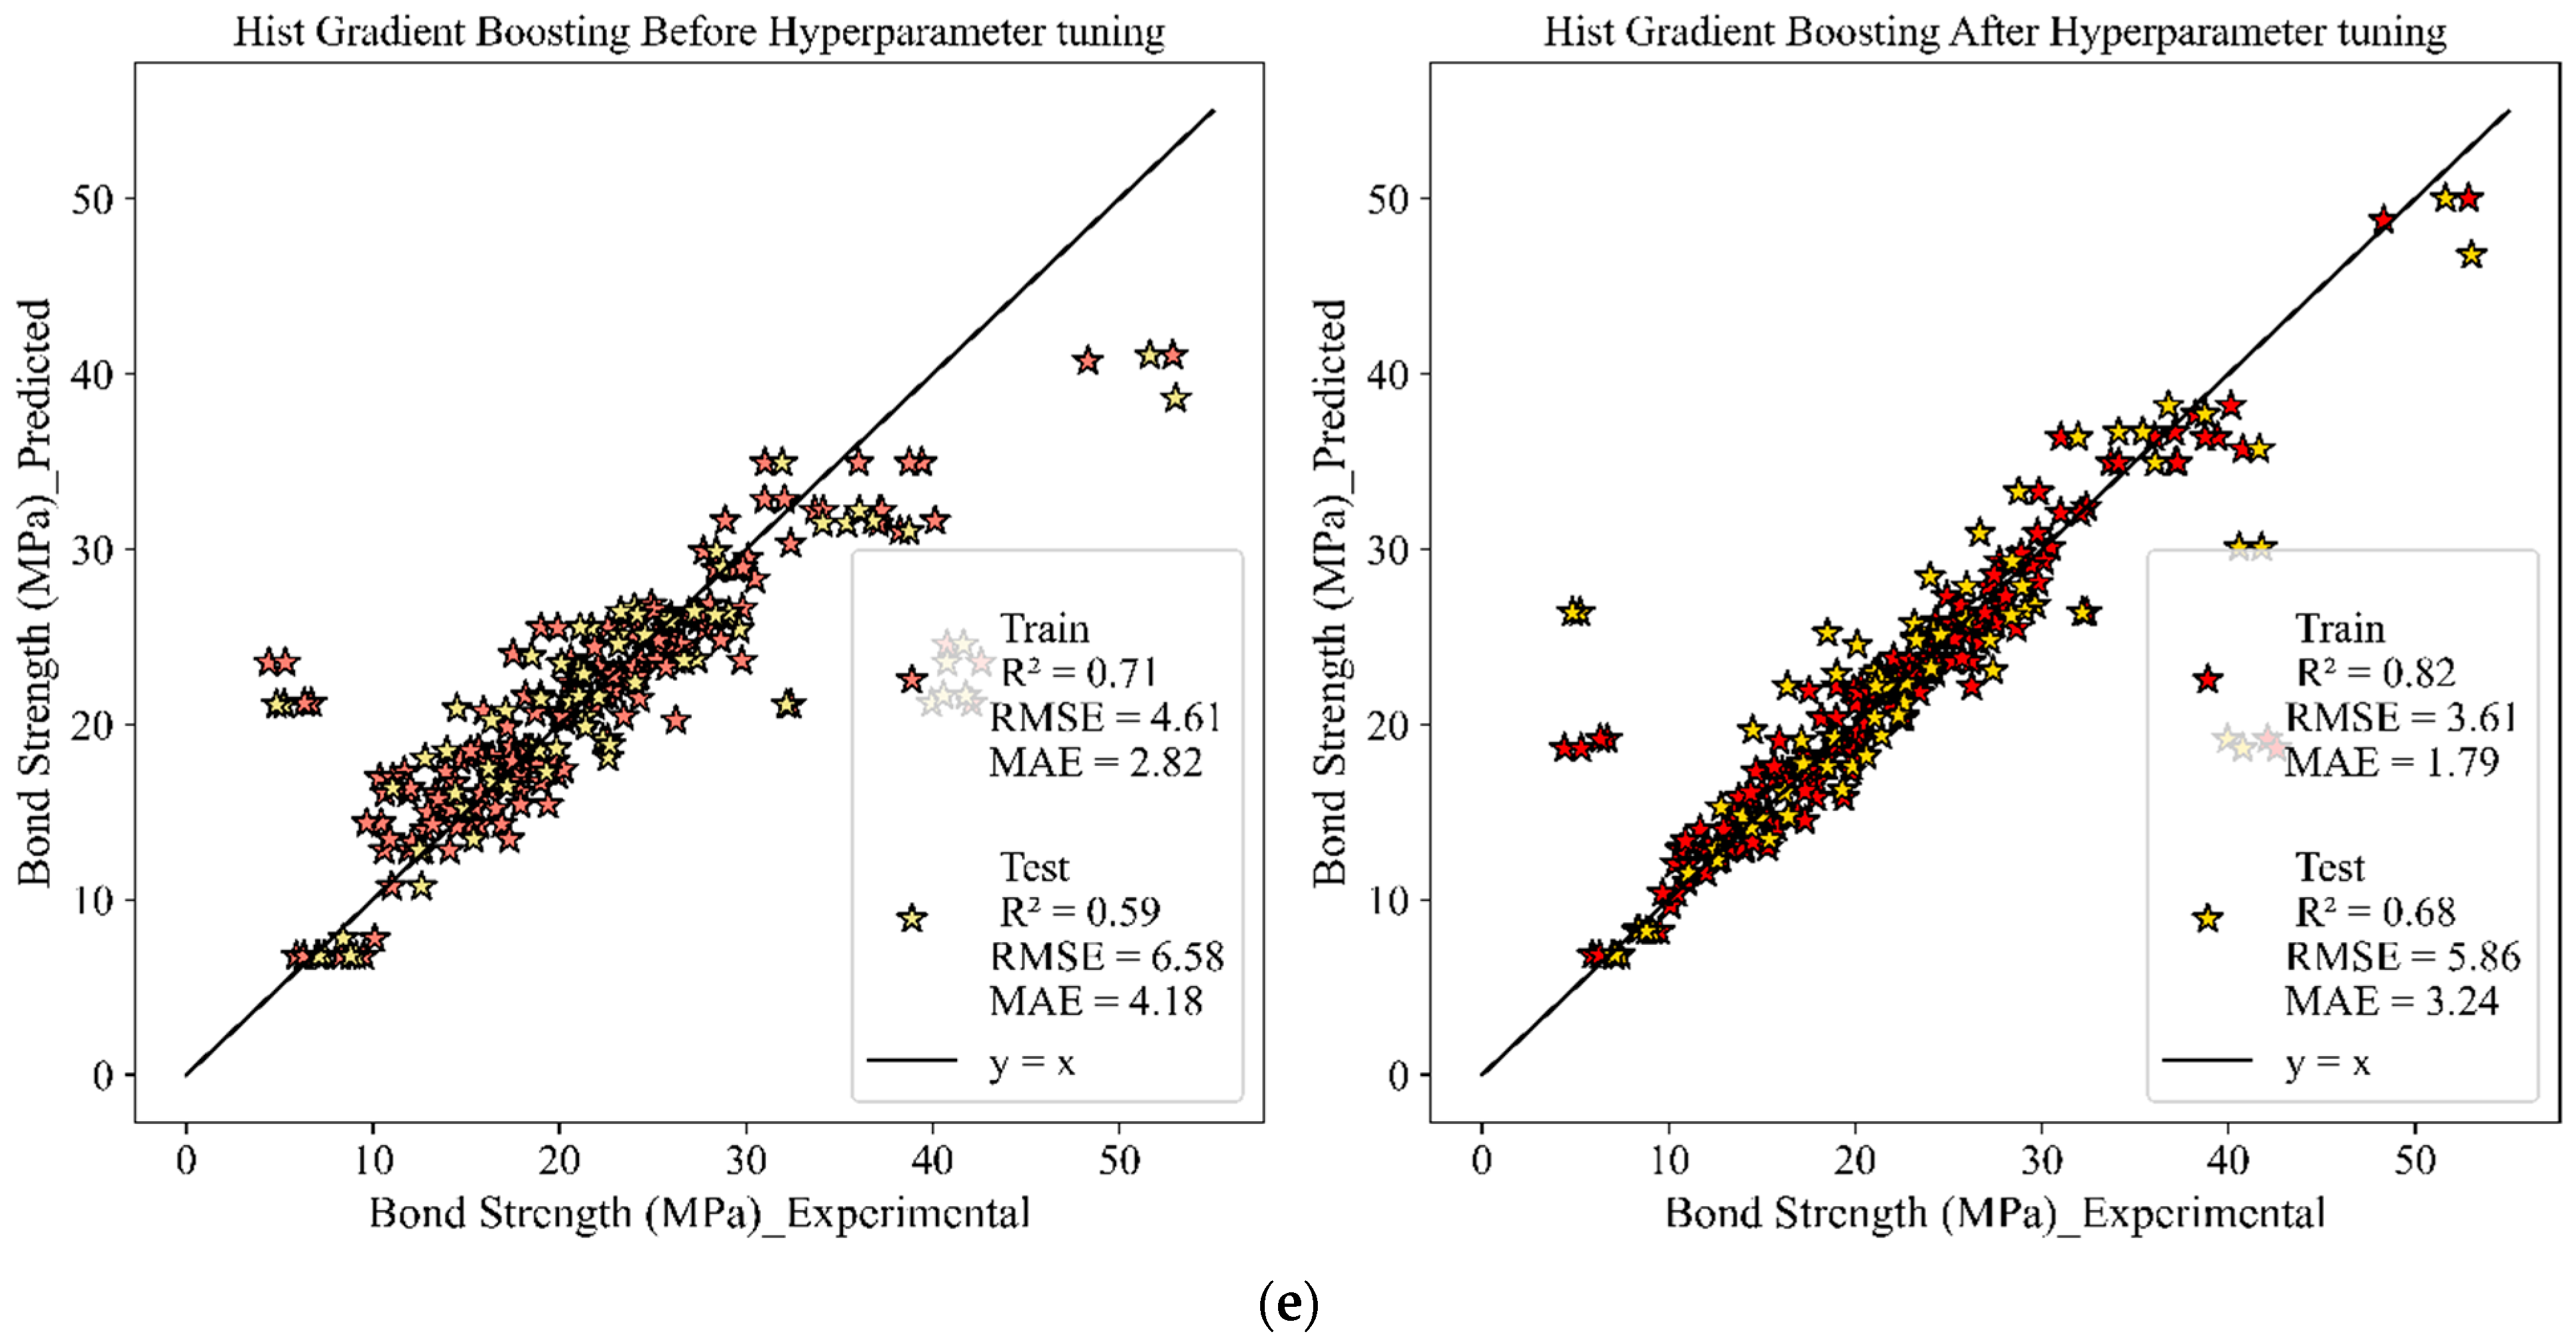
As presented in Table 7 and Figure 10, the results reveal that hyperparameter tuning significantly enhanced the performance of all models, particularly those that initially exhibited lower accuracy.
After tuning, the AdaBoost model’s R2 score improved from 0.61 to 0.7, indicating a better fit between the predicted and actual values. This improvement was accompanied by a reduction in RMSE from 6.46 to 5.63 and a decrease in MAE from 5.03 to 2.67, demonstrating that tuning effectively reduced the model’s prediction errors.
CatBoost, which already performed well with default parameters, saw its R2 score increase slightly from 0.94 to 0.95 after tuning. The RMSE decreased from 2.56 to 2.34, and the MAE was reduced from 1.9 to 1.74. Although the improvements were marginal, they indicate that even highly effective models can benefit from careful tuning.
Similarly, after tuning, the Gradient Boosting model slightly increased its R2 score from 0.94 to 0.95. The RMSE improved from 2.58 to 2.26, and the MAE decreased from 1.95 to 1.73. These results suggest that while the model was already robust, hyperparameter tuning contributed to further refining its predictions.
XGBoost, known for its high performance, also showed a modest improvement in accuracy after tuning, with the R2 score increasing from 0.94 to 0.95. The RMSE dropped from 2.33 to 2.21 and the MAE from 1.78 to 1.68, indicating a slight enhancement in the model’s predictive capabilities.
The Hist Gradient Boosting model observed the most notable improvement, where the R2 score significantly increased from 0.59 to 0.68 after tuning. Although the final R2 score of 0.68 does not reach the same level as the other models, the improvement is still substantial, indicating that hyperparameter tuning was crucial in enhancing the performance of this model. The tuning process also reduced RMSE from 6.58 to 5.86 and the MAE from 4.18 to 3.24, further demonstrating the positive impact of optimization on the model’s predictive accuracy.
The impact of hyperparameter tuning is shown in Figure 11, which clearly demonstrates that hyperparameter tuning plays a crucial role in enhancing model performance. The improvements were especially pronounced for models such as AdaBoost and Hist Gradient Boosting, which initially had lower R2 scores. After tuning, these models achieved higher R2 scores and exhibited lower RMSE and MAE values, significantly reducing prediction errors. Even models that performed well with default parameters, such as CatBoost and XGBoost, benefited from tuning, achieving slight but meaningful improvements in accuracy. Also, the best hyperparameter values resulting from hyperparameter tuning are shown in Table 8.
These findings underscore the necessity of hyperparameter optimization in developing reliable and accurate machine learning models, particularly in complex applications such as structural engineering. The consistent performance gains across all models suggest that thorough hyperparameter tuning is essential for fully leveraging the potential of machine learning algorithms and achieving optimal results.
The Taylor diagrams in Figure 12 visually compare the ML models’ performance on the training, test, and combined datasets. Across all datasets, CatBoost, Gradient Boosting, and XGBoost consistently demonstrate high correlation coefficients and standard deviations that closely match the reference, indicating their robustness and accuracy in capturing the underlying patterns of the data. AdaBoost shows moderate performance, with slightly lower correlations and greater deviations from the reference, while Hist Gradient Boosting, despite improvements after hyperparameter tuning, still exhibits lower correlation and a higher standard deviation compared to the other models. These diagrams highlight the effectiveness of CatBoost, Gradient Boosting, and XGBoost in delivering reliable predictions while also pointing to areas where models such as AdaBoost and Hist Gradient Boosting could benefit from further refinement.
To further enhance the model performance, two approaches were explored using a Voting Regressor, which combines predictions from multiple models to leverage the strengths of each.
In the first approach, the Voting Regressor was constructed by combining all the models: AdaBoost, CatBoost, Gradient Boosting, XGBoost, and Hist Gradient Boosting. The result of this ensemble was comparable to the performance of the best individual models (CatBoost, Gradient Boosting, and XGBoost), with no significant improvement in the key metrics (see Figure 13a). This suggests that while combining all models can help in averaging out errors, it does not necessarily lead to better performance if some of the models are less accurate.
The Voting Regressor was formed in the second approach using only the best-performing models: CatBoost, Gradient Boosting, and XGBoost. This targeted ensemble approach resulted in a slight performance improvement, with the R2 score increasing from 0.95 (achieved by the best individual models) to 0.96 (see Figure 13b). This modest improvement indicates that focusing the ensemble on the top-performing models allows the Voting Regressor to deliver more accurate and consistent predictions by capitalizing on the strengths of these models without the dilution effect that might come from including weaker models.
Overall, the selective combination of the best models in the Voting Regressor proved to be a more effective strategy, providing a small but valuable boost in predictive accuracy further enhancing the model’s reliability in predicting bond strength in structural engineering applications.
Additionally, the performance of all models across all metrics, including R2, RMSE, and MAE, is shown in Figure 14.
The developed user interface (UI) in this study provides a comprehensive and interactive platform for implementing machine learning models tailored explicitly for bond strength prediction in FRP-reinforced UHPC. As shown in Figure 15, this UI allows users to select from six different machine learning models, which are discussed, each with its own specific set of hyperparameters. The interface enables users to input various features related to the structural properties of the FRP-UHPC system and customize the model parameters. After model training, users can evaluate the model’s performance using key metrics such as R2, RMSE, and MAE, displayed for both the training and test datasets. Furthermore, the UI facilitates the prediction of bond strength by allowing users to input new data based on the trained model, thus offering an accessible and powerful tool for practical applications and research in structural engineering. The Python code for this UI can be found on GitHub.
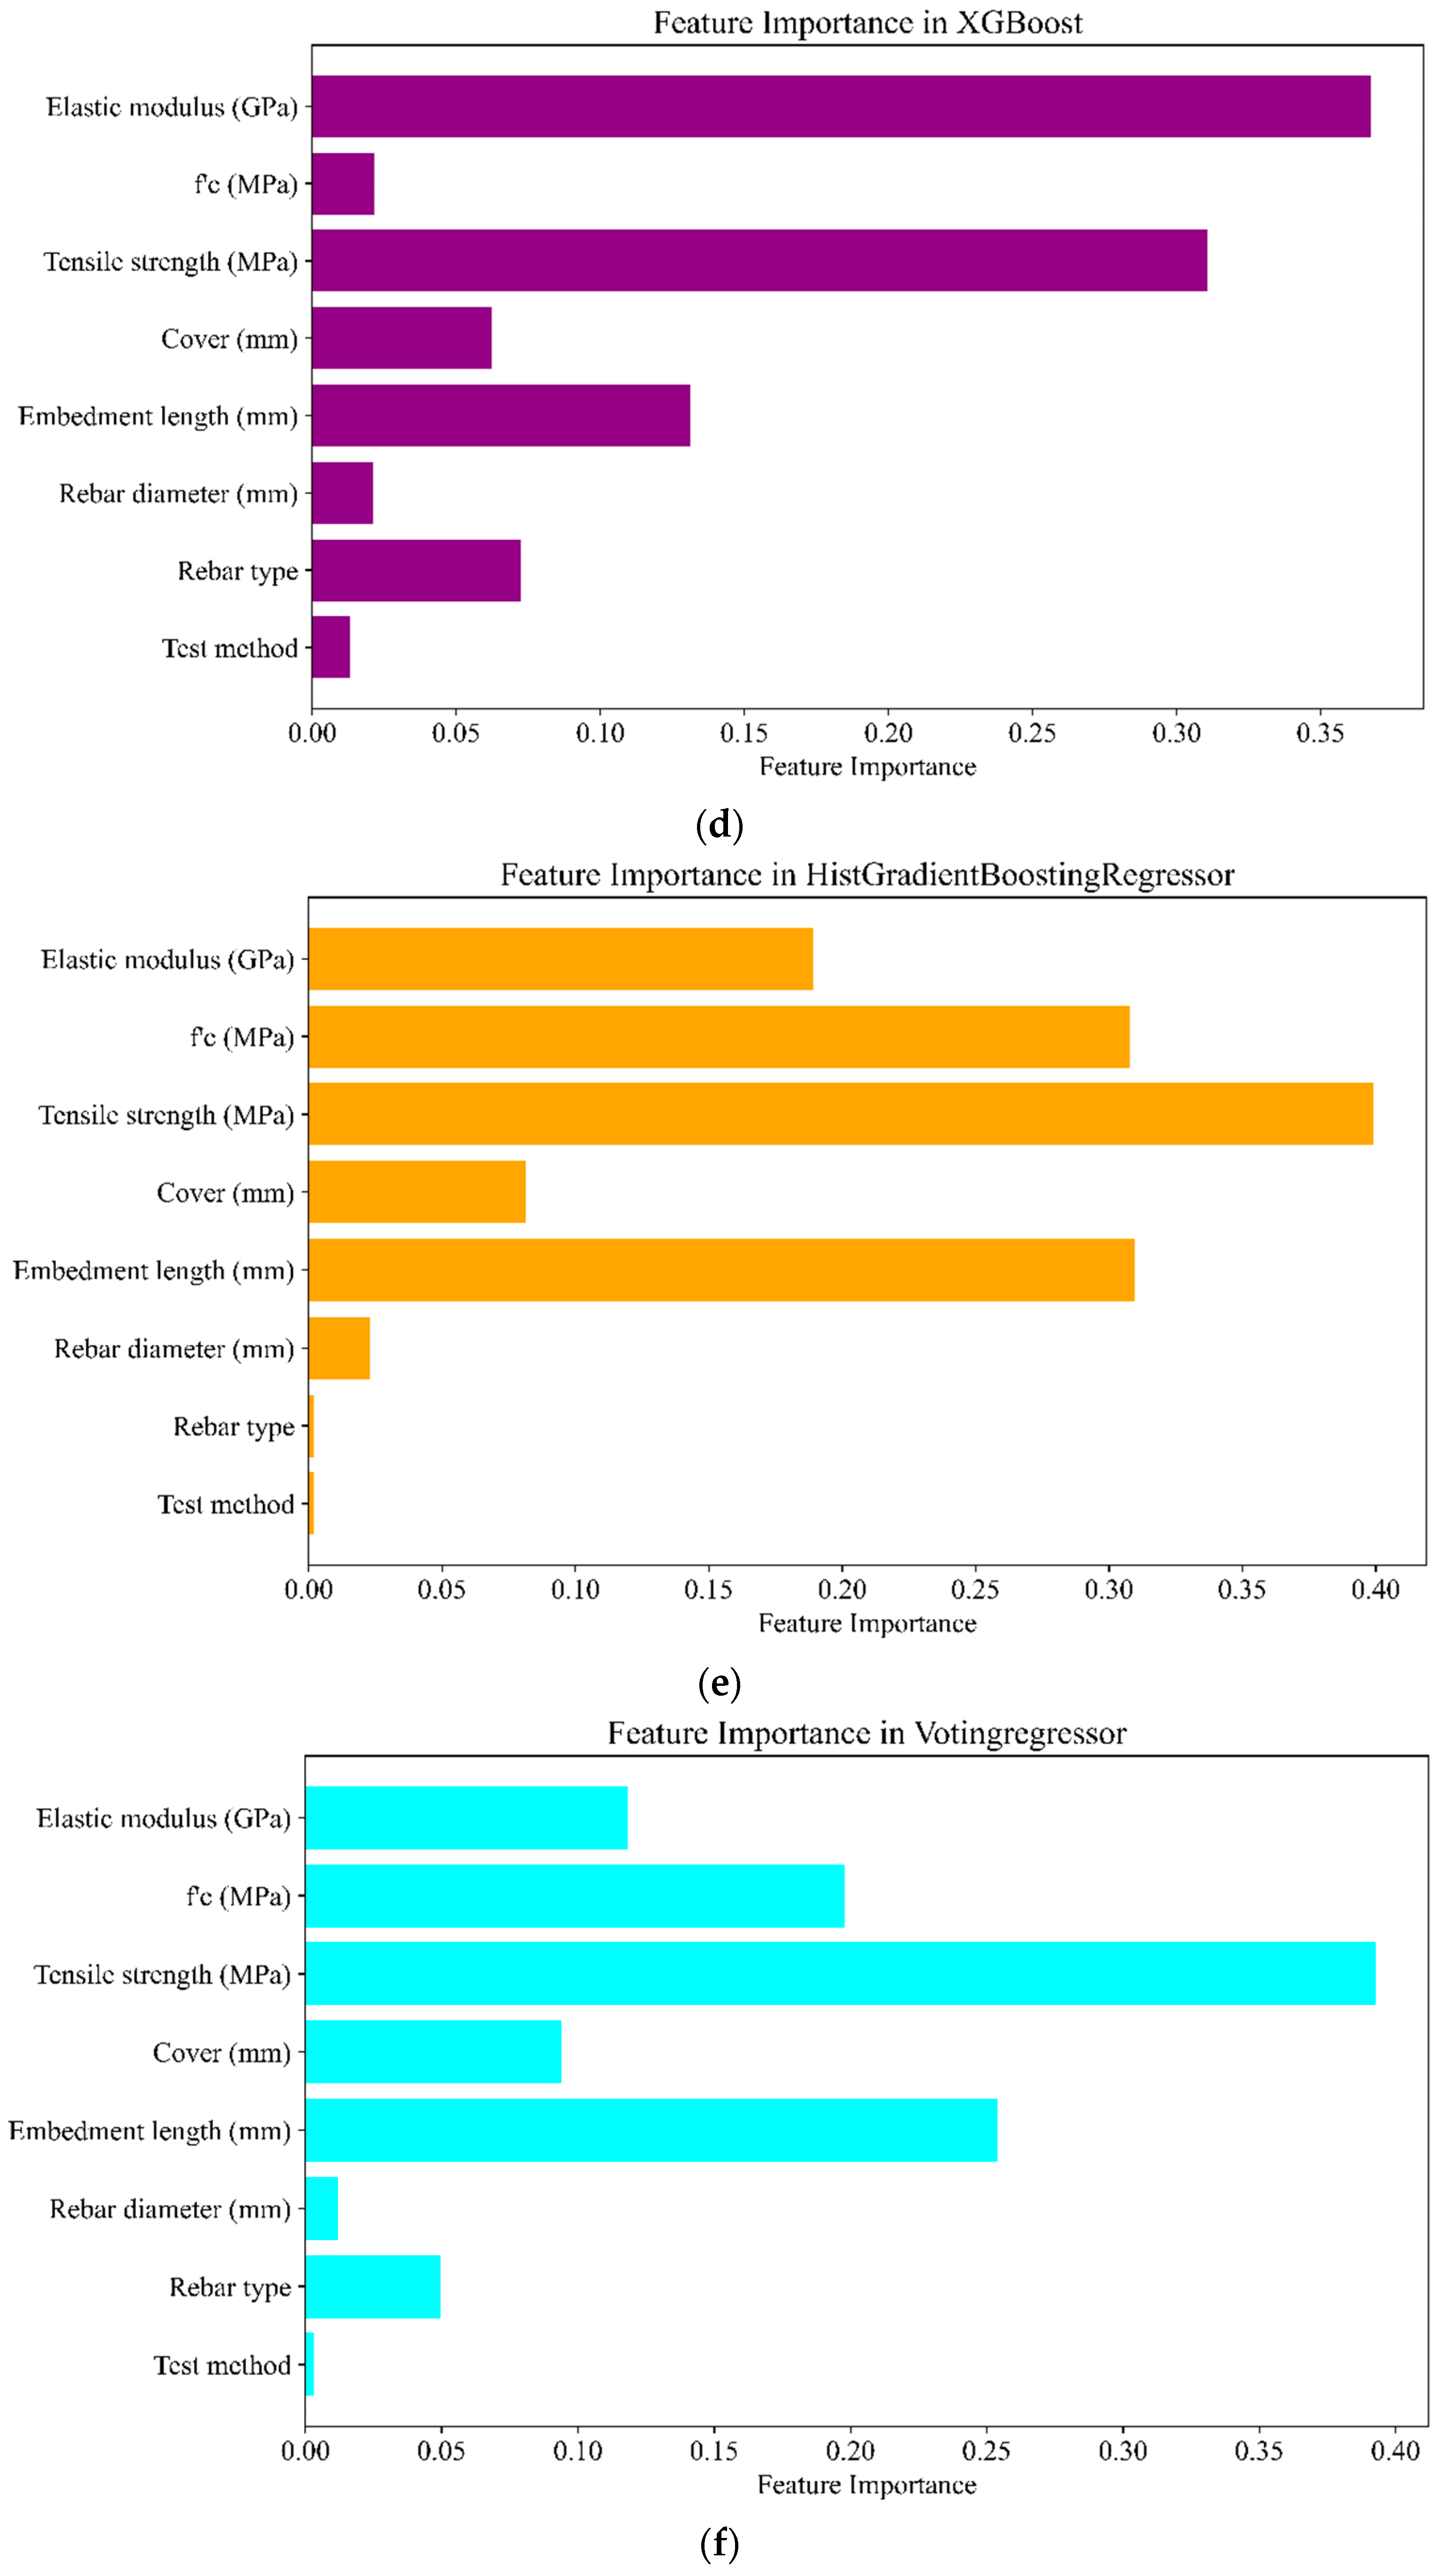
The feature importance analysis across various ML models provides critical insights into the factors that most significantly influence the prediction of bond strength. As shown in Figure 16, each model highlights different aspects of the input features, allowing for a deeper understanding of the variables that drive the predictions.
In the AdaBoost model, tensile strength (MPa), elastic modulus (GPa), and embedment length (mm) are identified as the most influential features. These variables dominate the model’s decision-making process, emphasizing their critical role in predicting bond strength. Other features such as cover and compressive strength (fc) also contribute, but their impact is less pronounced.
The CatBoost model recognizes tensile strength (MPa) and embedment length (mm) as key predictors. Features such as cover (mm) and elastic modulus (GPa) also show significant importance, reflecting the model’s sensitivity to these parameters. CatBoost’s advanced handling of categorical variables may account for the subtle differences in feature importance distribution compared to other models.
Gradient Boosting highlights embedment length (mm) as the most critical feature, followed closely by tensile strength (MPa) and elastic modulus (GPa). This emphasis on embedment length aligns with established engineering principles, reinforcing its importance in determining bond strength.
XGBoost places the highest importance on elastic modulus (GPa) and tensile strength (MPa), with embedment length (mm) also playing a significant role. The distribution of feature importance in XGBoost reflects its unique optimization techniques, influencing how the model prioritizes variables.
In Hist Gradient Boosting, embedment length (mm) and tensile strength (MPa) emerge as the top features, with elastic modulus (GPa) also being crucial. The model’s use of histogram-based binning may contribute to how it evaluates and prioritizes features, leading to a slightly different emphasis than other boosting models.
The Voting Regressor, which combines the predictions from multiple models, consistently identifies tensile strength (MPa) and embedment length (mm) as the most important features. This consistency across different models underscores the critical influence of these parameters in predicting bond strength. By balancing the feature importance from all its constituent models, the Voting Regressor offers a more comprehensive understanding of the factors driving bond strength predictions.
As a result, tensile strength (MPa), elastic modulus (GPa), and embedment length (mm) are consistently recognized as the key predictors of bond strength across all models. This consistency highlights the robustness of these features in both modeling and practical engineering applications. The variations in feature importance among the models also demonstrate the value of using an ensemble approach such as the Voting Regressor, which captures a more nuanced and balanced understanding of feature contributions, ultimately leading to more accurate and reliable predictions.

7.2. Shapley Values

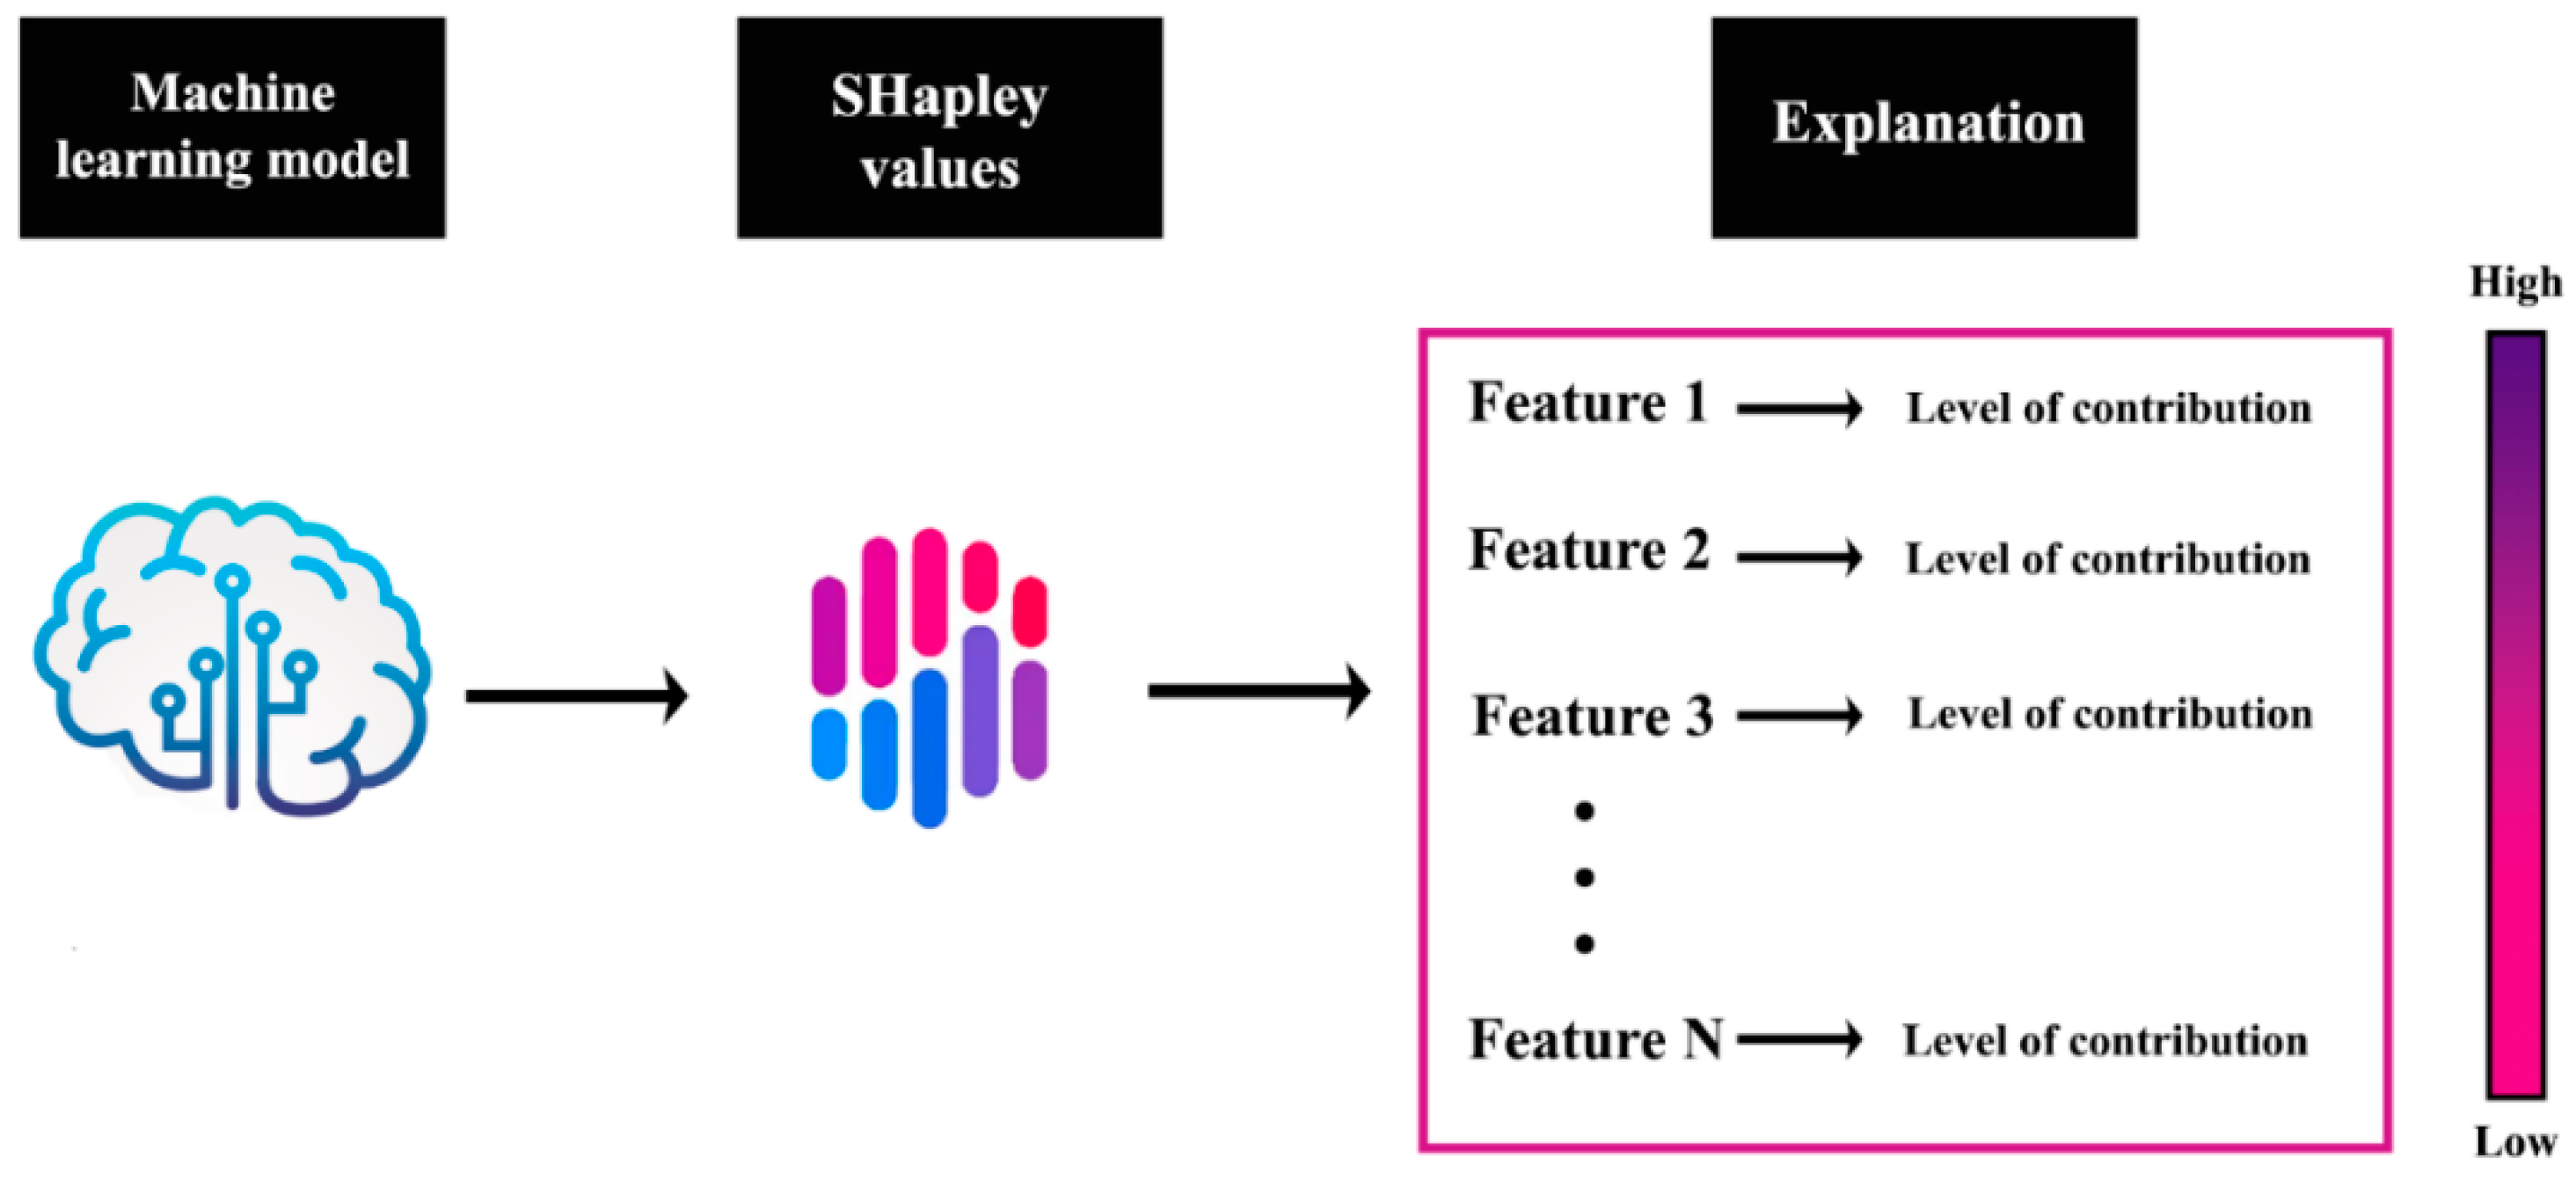
In addition to traditional feature importance analysis, SHAP values were employed to gain a more nuanced understanding of the impact of each feature on the model’s predictions. As shown in Figure 17, SHAP values offer a method to explain the output of a machine-learning model by attributing the contribution of each feature to the final prediction. This approach is rooted in cooperative game theory, where the goal is to fairly distribute the “payout” (in this case, the model’s prediction) among all features based on their individual contributions.
ϕ i = S N i s ! N S 1 ! N ! v S i v S
As shown in Equation (5), the Shapley value ϕ i for feature i is determined by averaging the marginal contributions of that feature across all possible permutations of features. Here, N represents the set of all features, S denotes a subset of features excluding feature i , S indicates the number of elements in subset S , v S is the model’s prediction based solely on the features in S , and v S i is the model’s prediction when feature i is included in S .
Figure 18 and Figure 19 illustrate the SHAP value analysis for the XGBoost model, which was identified as one of the best-performing models in this study. In Figure 18, the SHAP summary plot shows the distribution of SHAP values for each feature across all predictions. Each point on the plot represents a SHAP value for a particular feature and instance. The color represents the feature value, and the position on the x-axis shows the SHAP value, indicating whether the feature increases or decreases the predicted bond strength. This plot provides a detailed view of how each feature affects individual predictions, highlighting the variability in the impact of features such as embedment length and tensile strength.
Figure 19 presents the importance of global SHAP features, where features are ranked by their average absolute SHAP values. This gives an overview of which features have the most significant overall impact on the model’s predictions. Interestingly, embedment length (mm) is ranked as the most important feature in the SHAP analysis, while in the traditional feature importance analysis, it is ranked third. This discrepancy arises because traditional feature importance measures the average contribution of each feature to the model’s overall accuracy, whereas SHAP values take into account the impact of each feature on every single prediction.
The higher ranking of embedment length in the SHAP analysis suggests that while its average contribution might be lower compared to features such as elastic modulus and tensile strength, its impact is more significant and variable in certain contexts. This variability could mean that, in specific cases, changes in embedment length have a more substantial effect on the model’s output, thereby increasing its overall importance when assessed through SHAP values. Essentially, SHAP values capture the feature’s influence more granularly, reflecting its critical role in specific instances rather than just its average contribution.
The primary difference between SHAP values and traditional feature importance lies in the interpretation and granularity of the analysis. Traditional feature importance measures how much each feature contributes to the model’s predictions on average, but it does not account for the direction or variability of these contributions. In contrast, SHAP values provide a more detailed explanation by showing the magnitude of a feature’s impact and the direction (positive or negative) and how this impact varies across different instances. This makes SHAP values particularly useful for understanding complex models such as XGBoost, where interactions between features can lead to varying impacts on predictions.
To summarize, embedment length ranks as the most important feature in SHAP analysis on the test data because it has a significant and context-specific impact on individual predictions, even if its overall contribution across the entire training dataset (as measured by traditional feature importance) is somewhat lower. This highlights the value of using SHAP values to understand feature importance better, especially when analyzing how the model performs on new, unseen data.
Figure 20 provides a detailed visualization of the SHAP values for individual features in the XGBoost model, highlighting how each feature impacts the model’s predictions on the test data. Each subplot corresponds to a specific feature, with the SHAP values plotted on the y-axis and the feature values on the x-axis, while the color gradient, from blue to red, represents the range of feature values. For categorical features such as Test Method and rebar type, distinct clusters of SHAP values are observed, indicating how specific categories within these features consistently influence the predicted bond strength, either positively or negatively. Rebar diameter (mm) shows that higher diameters generally result in higher SHAP values, suggesting a positive correlation with bond strength. However, the effect varies depending on the interaction with other features. Embedment length (mm) significantly impacts predictions, where shorter lengths tend to decrease predicted bond strength and longer lengths have a positive effect, illustrating this feature’s critical role in the model’s output. The feature Cover (mm) demonstrates a more complex, nonlinear relationship, where increases in cover can either positively or negatively affect the predictions, reflecting the nuanced role of this feature. Lastly, tensile strength shows a clear trend where higher tensile strength leads to higher predicted bond strength, further reinforcing its importance in the model. Figure 21 presents SHAP waterfall plots for three specific instances from the test dataset (numbers 14, 25, and 69) to illustrate how individual features contribute to the final model prediction in the XGBoost model. Each plot shows the breakdown of the model’s prediction and the contributions from each feature, offering a clear visualization of how the features interact to influence the predicted bond strength.

7.3. Predictive Formulas for Bond Strength of FRP Rebars in UHPC

There have been numerous attempts to predict the bond strength of FRP rebars in UHPC, with each study incorporating specific FRP rebars and concrete characteristics. Table 9 summarizes some of these predictive formulas derived from various research efforts.
Figure 22 presents the results of applying these predictive formulas to the compiled dataset, with comparisons to the corresponding experimental values. These formulas are overfitted to the specific conditions of their original research papers and do not generalize well to the broader dataset. This overfitting limits their applicability when predicting bond strength in more diverse scenarios.
In contrast, the ML models employed in this study have demonstrated superior predictive performance. Unlike traditional formulas, these ML models are not constrained by predefined equations and can adapt to the complexities and non-linearities within the dataset. The models were trained and tuned using diverse features to capture a broader range of interactions between variables. Consequently, the ML models provided more accurate and generalized predictions across the entire dataset, outperforming the traditional formulas in most cases. The success of these models in this study suggests that they could serve as valuable tools for structural engineers seeking to predict bond strength with greater accuracy and reliability across diverse practical applications.

8. Conclusions

This study demonstrated the application of various ML models, including AdaBoost, CatBoost, Gradient Boosting, XGBoost, and Hist Gradient Boosting, in predicting the bond strength of reinforced concrete structures. Unlike traditional methods, ML models do not rely on explicit mathematical equations to predict rebar bond strength. Instead, these models are trained on experimental data, allowing them to capture complex patterns and relationships between input variables and bond strength. By learning from the data, ML models can provide accurate predictions without predefined equations. The employed models were thoroughly evaluated before and after hyperparameter tuning to assess their predictive capabilities.
  • The results indicated that hyperparameter tuning significantly improved the performance of all models, particularly those that initially exhibited lower accuracy, such as AdaBoost and Hist Gradient Boosting.
  • The analysis revealed that CatBoost, Gradient Boosting, and XGBoost consistently outperformed the other models, with XGBoost achieving the highest predictive accuracy after tuning. This was further corroborated by the Taylor diagrams, which illustrated the robustness of these models across training, testing, and combined datasets.
  • The study also explored using a Voting Regressor to combine the strengths of multiple models. The findings showed that a Voting Regressor combining only the best-performing models (CatBoost, Gradient Boosting, and XGBoost) slightly improved predictive accuracy, demonstrating the value of model voting in enhancing prediction reliability.
  • In addition to traditional feature importance analysis, SHAP values were employed to gain deeper insights into the impact of individual features on the model’s predictions. The SHAP analysis highlighted that embedment length had a significant impact on predictions.
  • The insights gained from this study underscore the importance of hyperparameter optimization and advanced interpretability techniques such as SHAP values in developing and evaluating machine learning models for structural engineering applications. The consistent identification of key features such as tensile strength, elastic modulus, and embedment length across different models and analyses reinforces their critical role in predicting bond strength, providing valuable guidance for future research and practical applications in this field.
  • The findings demonstrate that while traditional predictive formulas can provide insights within specific experimental contexts, their limited generalizability highlights the need for more adaptable approaches, such as ML models, which have proven to deliver more accurate and reliable bond strength predictions across diverse scenarios.
  • The user interface developed in this study enhances accessibility and practical application by allowing engineers to seamlessly implement and evaluate ML models for bond strength prediction in FRP-reinforced UHPC. By providing an interactive platform that supports customization of model parameters and real-time evaluation of model performance, the user interface bridges the gap between advanced ML techniques and their practical application in structural engineering. This tool empowers users to leverage state-of-the-art predictive models, thereby contributing to more accurate and efficient design and analysis processes in the field.

Author Contributions

Writing—review and editing, A.M. and M.B.; Conceptualization, A.M., M.B., and M.K.; Methodology, AM., M.B., and M.K.; Software, A.M.; Data curation, A.M., M.B.; Writing—review and editing, A.M., M.B., and M.K.; Investigation, A.M., M.B., and M.K.; Visualization, A.M. and M.B.; Supervision, M.K. All authors have read and agreed to the published version of the manuscript.

Funding

This research received no external funding.

Data Availability Statement

The research’s complete dataset has been uploaded on GitHub, accessed on 5 October 2024 (https://github.com/AlirezaMahmoudian/GFRP_UHPC-Boosting-ML-models).

Conflicts of Interest

The authors declare no conflicts of interest.

References

  1. El-Nemr, A.; Ahmed, E.A.; Barris, C.; Benmokrane, B. Bond-dependent coefficient of glass-and carbon-FRP bars in normal-and high-strength concretes. Constr. Build. Mater. 2016, 113, 77–89. [Google Scholar] [CrossRef]
  2. Ahmed, E.A.; El-Sayed, A.K.; El-Salakawy, E.; Benmokrane, B. Bend strength of FRP stirrups: Comparison and evaluation of testing methods. J. Compos. Constr. 2010, 14, 3–10. [Google Scholar] [CrossRef]
  3. ACI Committee 440. 440.1R-06: Guide for the Design and Construction of Concrete Reinforced with FRP Bars; ACI: Farmington Hills, MI, USA, 2006. [Google Scholar]
  4. Chin, W.J.; Park, Y.H.; Cho, J.-R.; Lee, J.-Y.; Yoon, Y.-S. Flexural behavior of a precast concrete deck connected with headed GFRP rebars and UHPC. Materials 2020, 13, 604. [Google Scholar] [CrossRef]
  5. Kim, B.; Doh, J.-H.; Yi, C.-K.; Lee, J.-Y. Effects of structural fibers on bonding mechanism changes in interface between GFRP bar and concrete. Compos. Part B Eng. 2013, 45, 768–779. [Google Scholar] [CrossRef]
  6. Yoo, D.-Y.; Banthia, N.; Yoon, Y.-S. Flexural behavior of ultra-high-performance fiber-reinforced concrete beams reinforced with GFRP and steel rebars. Eng. Struct. 2016, 111, 246–262. [Google Scholar] [CrossRef]
  7. Saleh, N.; Ashour, A.; Lam, D.; Sheehan, T. Experimental investigation of bond behaviour of two common GFRP bar types in high–Strength concrete. Constr. Build. Mater. 2019, 201, 610–622. [Google Scholar] [CrossRef]
  8. Yoo, S.-J.; Hong, S.-H.; Yoon, Y.-S. Bonding behavior and prediction of helically ribbed CFRP bar embedded in ultra high-performance concrete (UHPC). Case Stud. Constr. Mater. 2023, 19, e02253. [Google Scholar] [CrossRef]
  9. Taha, A.; Alnahhal, W. Bond durability and service life prediction of BFRP bars to steel FRC under aggressive environmental conditions. Compos. Struct. 2021, 269, 114034. [Google Scholar] [CrossRef]
  10. Hassan, M.; Benmokrane, B.; ElSafty, A.; Fam, A. Bond durability of basalt-fiber-reinforced-polymer (BFRP) bars embedded in concrete in aggressive environments. Compos. Part B Eng. 2016, 106, 262–272. [Google Scholar] [CrossRef]
  11. Michaud, D.; Fam, A. Development length of small-diameter basalt FRP bars in normal-and high-strength concrete. J. Compos. Constr. 2021, 25, 04020086. [Google Scholar] [CrossRef]
  12. Jeddian, S.; Ghazi, M.; Sarafraz, M.E. Experimental study on the seismic performance of GFRP reinforced concrete columns actively confined by AFRP strips. Structures. 2024, 62, 106248. [Google Scholar] [CrossRef]
  13. Liang, K.; Chen, L.; Shan, Z.; Su, R. Experimental and theoretical study on bond behavior of helically wound FRP bars with different rib geometry embedded in ultra-high-performance concrete. Eng. Struct. 2023, 281, 115769. [Google Scholar] [CrossRef]
  14. Yang, K.; Wu, Z.; Zheng, K.; Shi, J. Design and flexural behavior of steel fiber-reinforced concrete beams with regular oriented fibers and GFRP bars. Eng. Struct. 2024, 309, 118073. [Google Scholar] [CrossRef]
  15. Ding, Y.; Ning, X.; Zhang, Y.; Pacheco-Torgal, F.; Aguiar, J. Fibres for enhancing of the bond capacity between GFRP rebar and concrete. Constr. Build. Mater. 2014, 51, 303–312. [Google Scholar] [CrossRef]
  16. Jamshaid, H.; Mishra, R. A green material from rock: Basalt fiber–a review. J. Text. Inst. 2016, 107, 923–937. [Google Scholar] [CrossRef]
  17. Yoshitake, I.; Hasegawa, H.; Shimose, K. Monotonic and cyclic loading tests of reinforced concrete beam strengthened with bond-improved carbon fiber reinforced polymer (CFRP) rods of ultra-high modulus. Eng. Struct. 2020, 206, 110175. [Google Scholar] [CrossRef]
  18. Jia, L.; Fang, Z.; Hu, R.; Pilakoutas, K.; Huang, Z. Fatigue behavior of UHPC beams prestressed with external CFRP tendons. J. Compos. Constr. 2022, 26, 04022066. [Google Scholar] [CrossRef]
  19. Fang, Y.; Fang, Z.; Feng, L.; Xiang, Y.; Zhou, X. Bond behavior of an ultra-high performance concrete-filled anchorage for carbon fiber-reinforced polymer tendons under static and impact loads. Eng. Struct. 2023, 274, 115128. [Google Scholar] [CrossRef]
  20. Pan, R.; Zou, J.; Liao, P.; Dong, S.; Deng, J. Effects of fiber content and concrete cover on the local bond behavior of helically ribbed GFRP bar and UHPC. J. Build. Eng. 2023, 80, 107939. [Google Scholar] [CrossRef]
  21. Shaikh, F.U.A.; Luhar, S.; Arel, H.Ş.; Luhar, I. Performance evaluation of Ultrahigh performance fibre reinforced concrete–A review. Constr. Build. Mater. 2019, 232, 117152. [Google Scholar] [CrossRef]
  22. Tan, H.; Hou, Z.; Li, Y.; Xu, X. A flexural ductility model for UHPC beams reinforced with FRP bars. Structures. 2022, 45, 773–786. [Google Scholar] [CrossRef]
  23. Ke, L.; Liang, L.; Feng, Z.; Li, C.; Zhou, J.; Li, Y. Bond performance of CFRP bars embedded in UHPFRC incorporating orientation and content of steel fibers. J. Build. Eng. 2023, 73, 106827. [Google Scholar] [CrossRef]
  24. Zhu, H.; He, Y.; Cai, G.; Cheng, S.; Zhang, Y.; Larbi, A.S. Bond performance of carbon fiber reinforced polymer rebars in ultra-high-performance concrete. Constr. Build. Mater. 2023, 387, 131646. [Google Scholar] [CrossRef]
  25. Wu, C.; Ma, G.; Hwang, H.-J. Bond performance of spliced GFRP bars in pre-damaged concrete beams retrofitted with CFRP and UHPC. Eng. Struct. 2023, 292, 116523. [Google Scholar] [CrossRef]
  26. CSA S806-2012; Design and Construction of Building Structures with Fibre Reinforced Polymers. Canadian Standard Association: Mississauga, ON, Canada, 2012.
  27. Mahaini, Z.; Abed, F.; Alhoubi, Y.; Elnassar, Z. Experimental and numerical study of the flexural response of Ultra High Performance Concrete (UHPC) beams reinforced with GFRP. Compos. Struct. 2023, 315, 117017. [Google Scholar] [CrossRef]
  28. Mahmoudian, A.; Bypour, M.; Kontoni, D.-P.N. Tree-based machine learning models for predicting the bond strength in reinforced recycled aggregate concrete. Asian J. Civ. Eng. 2024, 1–26. [Google Scholar] [CrossRef]
  29. Bypour, M.; Mahmoudian, A.; Tajik, N.; Taleshi, M.M.; Mirghaderi, S.R.; Yekrangnia, M. Shear capacity assessment of perforated steel plate shear wall based on the combination of verified finite element analysis, machine learning, and gene expression programming. Asian J. Civ. Eng. 2024, 25, 5317–5333. [Google Scholar] [CrossRef]
  30. Feng, D.-C.; Liu, Z.-T.; Wang, X.-D.; Chen, Y.; Chang, J.-Q.; Wei, D.-F.; Jiang, Z.-M. Machine learning-based compressive strength prediction for concrete: An adaptive boosting approach. Constr. Build. Mater. 2020, 230, 117000. [Google Scholar] [CrossRef]
  31. Kaloop, M.R.; Kumar, D.; Samui, P.; Hu, J.W.; Kim, D. Compressive strength prediction of high-performance concrete using gradient tree boosting machine. Constr. Build. Mater. 2020, 264, 120198. [Google Scholar] [CrossRef]
  32. Zhu, F.; Wu, X.; Lu, Y.; Huang, J. Strength estimation and feature interaction of carbon nanotubes-modified concrete using artificial intelligence-based boosting ensembles. Buildings 2024, 14, 134. [Google Scholar] [CrossRef]
  33. Hossain, K.; Ametrano, D.; Lachemi, M. Bond strength of GFRP bars in ultra-high strength concrete using RILEM beam tests. J. Build. Eng. 2017, 10, 69–79. [Google Scholar] [CrossRef]
  34. Ahmad, F.S.; Foret, G.; Le Roy, R. Bond between carbon fibre-reinforced polymer (CFRP) bars and ultra high performance fibre reinforced concrete (UHPFRC): Experimental study. Constr. Build. Mater. 2011, 25, 479–485. [Google Scholar] [CrossRef]
  35. Sayed-Ahmed, M.; Sennah, K. Str-894: Bond strength of ribbed-surface high-modulus glass FRP bars embedded into unconfined UHPFRC. In Proceedings of the Canadian Society for Civil Engineering Annual Conference 2016, Resilient Infrastructure, London, UK, 1–4 June 2016. [Google Scholar]
  36. Michaud, D.; Fam, A.; Dagenais, M.-A. Development length of sand-coated GFRP bars embedded in Ultra-High performance concrete with very small cover. Constr. Build. Mater. 2021, 270, 121384. [Google Scholar] [CrossRef]
  37. Yoo, D.-Y.; Yoon, Y.-S. Bond behavior of GFRP and steel bars in ultra-high-performance fiber-reinforced concrete. Adv. Compos. Mater. 2017, 26, 493–510. [Google Scholar] [CrossRef]
  38. Yoo, D.-Y.; Kwon, K.-Y.; Park, J.-J.; Yoon, Y.-S. Local bond-slip response of GFRP rebar in ultra-high-performance fiber-reinforced concrete. Compos. Struct. 2015, 120, 53–64. [Google Scholar] [CrossRef]
  39. Yoo, S.-J.; Hong, S.-H.; Yoo, D.-Y.; Yoon, Y.-S. Flexural bond behavior and development length of ribbed CFRP bars in UHPFRC. Cem. Concr. Compos. 2024, 146, 105403. [Google Scholar] [CrossRef]
  40. Hu, X.; Xue, W.; Xue, W. Bond properties of GFRP rebars in UHPC under different types of test. Eng. Struct. 2024, 314, 118319. [Google Scholar] [CrossRef]
  41. Qasem, A.; Sallam, Y.S.; Eldien, H.H.; Ahangarn, B.H. Bond-slip behavior between ultra-high-performance concrete and carbon fiber reinforced polymer bars using a pull-out test and numerical modelling. Constr. Build. Mater. 2020, 260, 119857. [Google Scholar] [CrossRef]
  42. Eltantawi, I.; Alnahhal, W.; El Refai, A.; Younis, A.; Alnuaimi, N.; Kahraman, R. Bond performance of tensile lap-spliced basalt-FRP reinforcement in high-strength concrete beams. Compos. Struct. 2022, 281, 114987. [Google Scholar] [CrossRef]
  43. ACI Committee 440. Guide Test Methods for FiberReinforced Polymer (FRP) Composites for Reinforcing or Strengthening Concrete and Masonry Structures; ACI: Farmington Hills, MI, USA, 2012. [Google Scholar]
  44. Tong, D.; Chi, Y.; Huang, L.; Zeng, Y.; Yu, M.; Xu, L. Bond performance and physically explicable mathematical model of helically wound GFRP bar embedded in UHPC. J. Build. Eng. 2023, 69, 106322. [Google Scholar] [CrossRef]
  45. Ahmed, M.S.; Sennah, K. Pullout strength of sand-coated GFRP bars embedded in ultra-high performance fiber reinforced concrete. In Proceedings of the CSCE 2014 4th International Structural Speciality, Halifax, NS, Canada, 28–31 May 2014. [Google Scholar]
  46. Esteghamati, M.Z.; Gernay, T.; Banerji, S. Evaluating fire resistance of timber columns using explainable machine learning models. Eng. Struct. 2023, 296, 116910. [Google Scholar] [CrossRef]
  47. Mahmoudian, A.; Tajik, N.; Taleshi, M.M.; Shakiba, M.; Yekrangnia, M. Ensemble machine learning-based approach with genetic algorithm optimization for predicting bond strength and failure mode in concrete-GFRP mat anchorage interface. Structures 2023, 57, 105173. [Google Scholar] [CrossRef]
  48. Tajik, N.; Mahmoudian, A.; Taleshi, M.M.; Yekrangnia, M. Explainable XGBoost machine learning model for prediction of ultimate load and free end slip of GFRP rod glued-in timber joints through a pull-out test under various harsh environmental conditions. Asian J. Civ. Eng. 2024, 25, 141–157. [Google Scholar] [CrossRef]
  49. Shams, M.Y.; Tarek, Z.; Elshewey, A.M.; Hany, M.; Darwish, A.; Hassanien, A.E. A machine learning-based model for predicting temperature under the effects of climate change. In The Power of Data: Driving Climate Change with Data Science and Artificial Intelligence Innovations; Studies in Big Data; Springer: Berlin/Heidelberg, Germany, 2023; pp. 61–81. [Google Scholar]
  50. Alhakeem, Z.M.; Jebur, Y.M.; Henedy, S.N.; Imran, H.; Bernardo, L.F.A.; Hussein, H.M. Prediction of ecofriendly concrete compressive strength using gradient boosting regression tree combined with GridSearchCV hyperparameter-optimization techniques. Materials 2022, 15, 7432. [Google Scholar] [CrossRef]
  51. Lee, J.-Y.; Kim, T.-Y.; Kim, T.-J.; Yi, C.-K.; Park, J.-S.; You, Y.-C.; Park, Y.-H. Interfacial bond strength of glass fiber reinforced polymer bars in high-strength concrete. Compos. Part B Eng. 2008, 39, 258–270. [Google Scholar] [CrossRef]
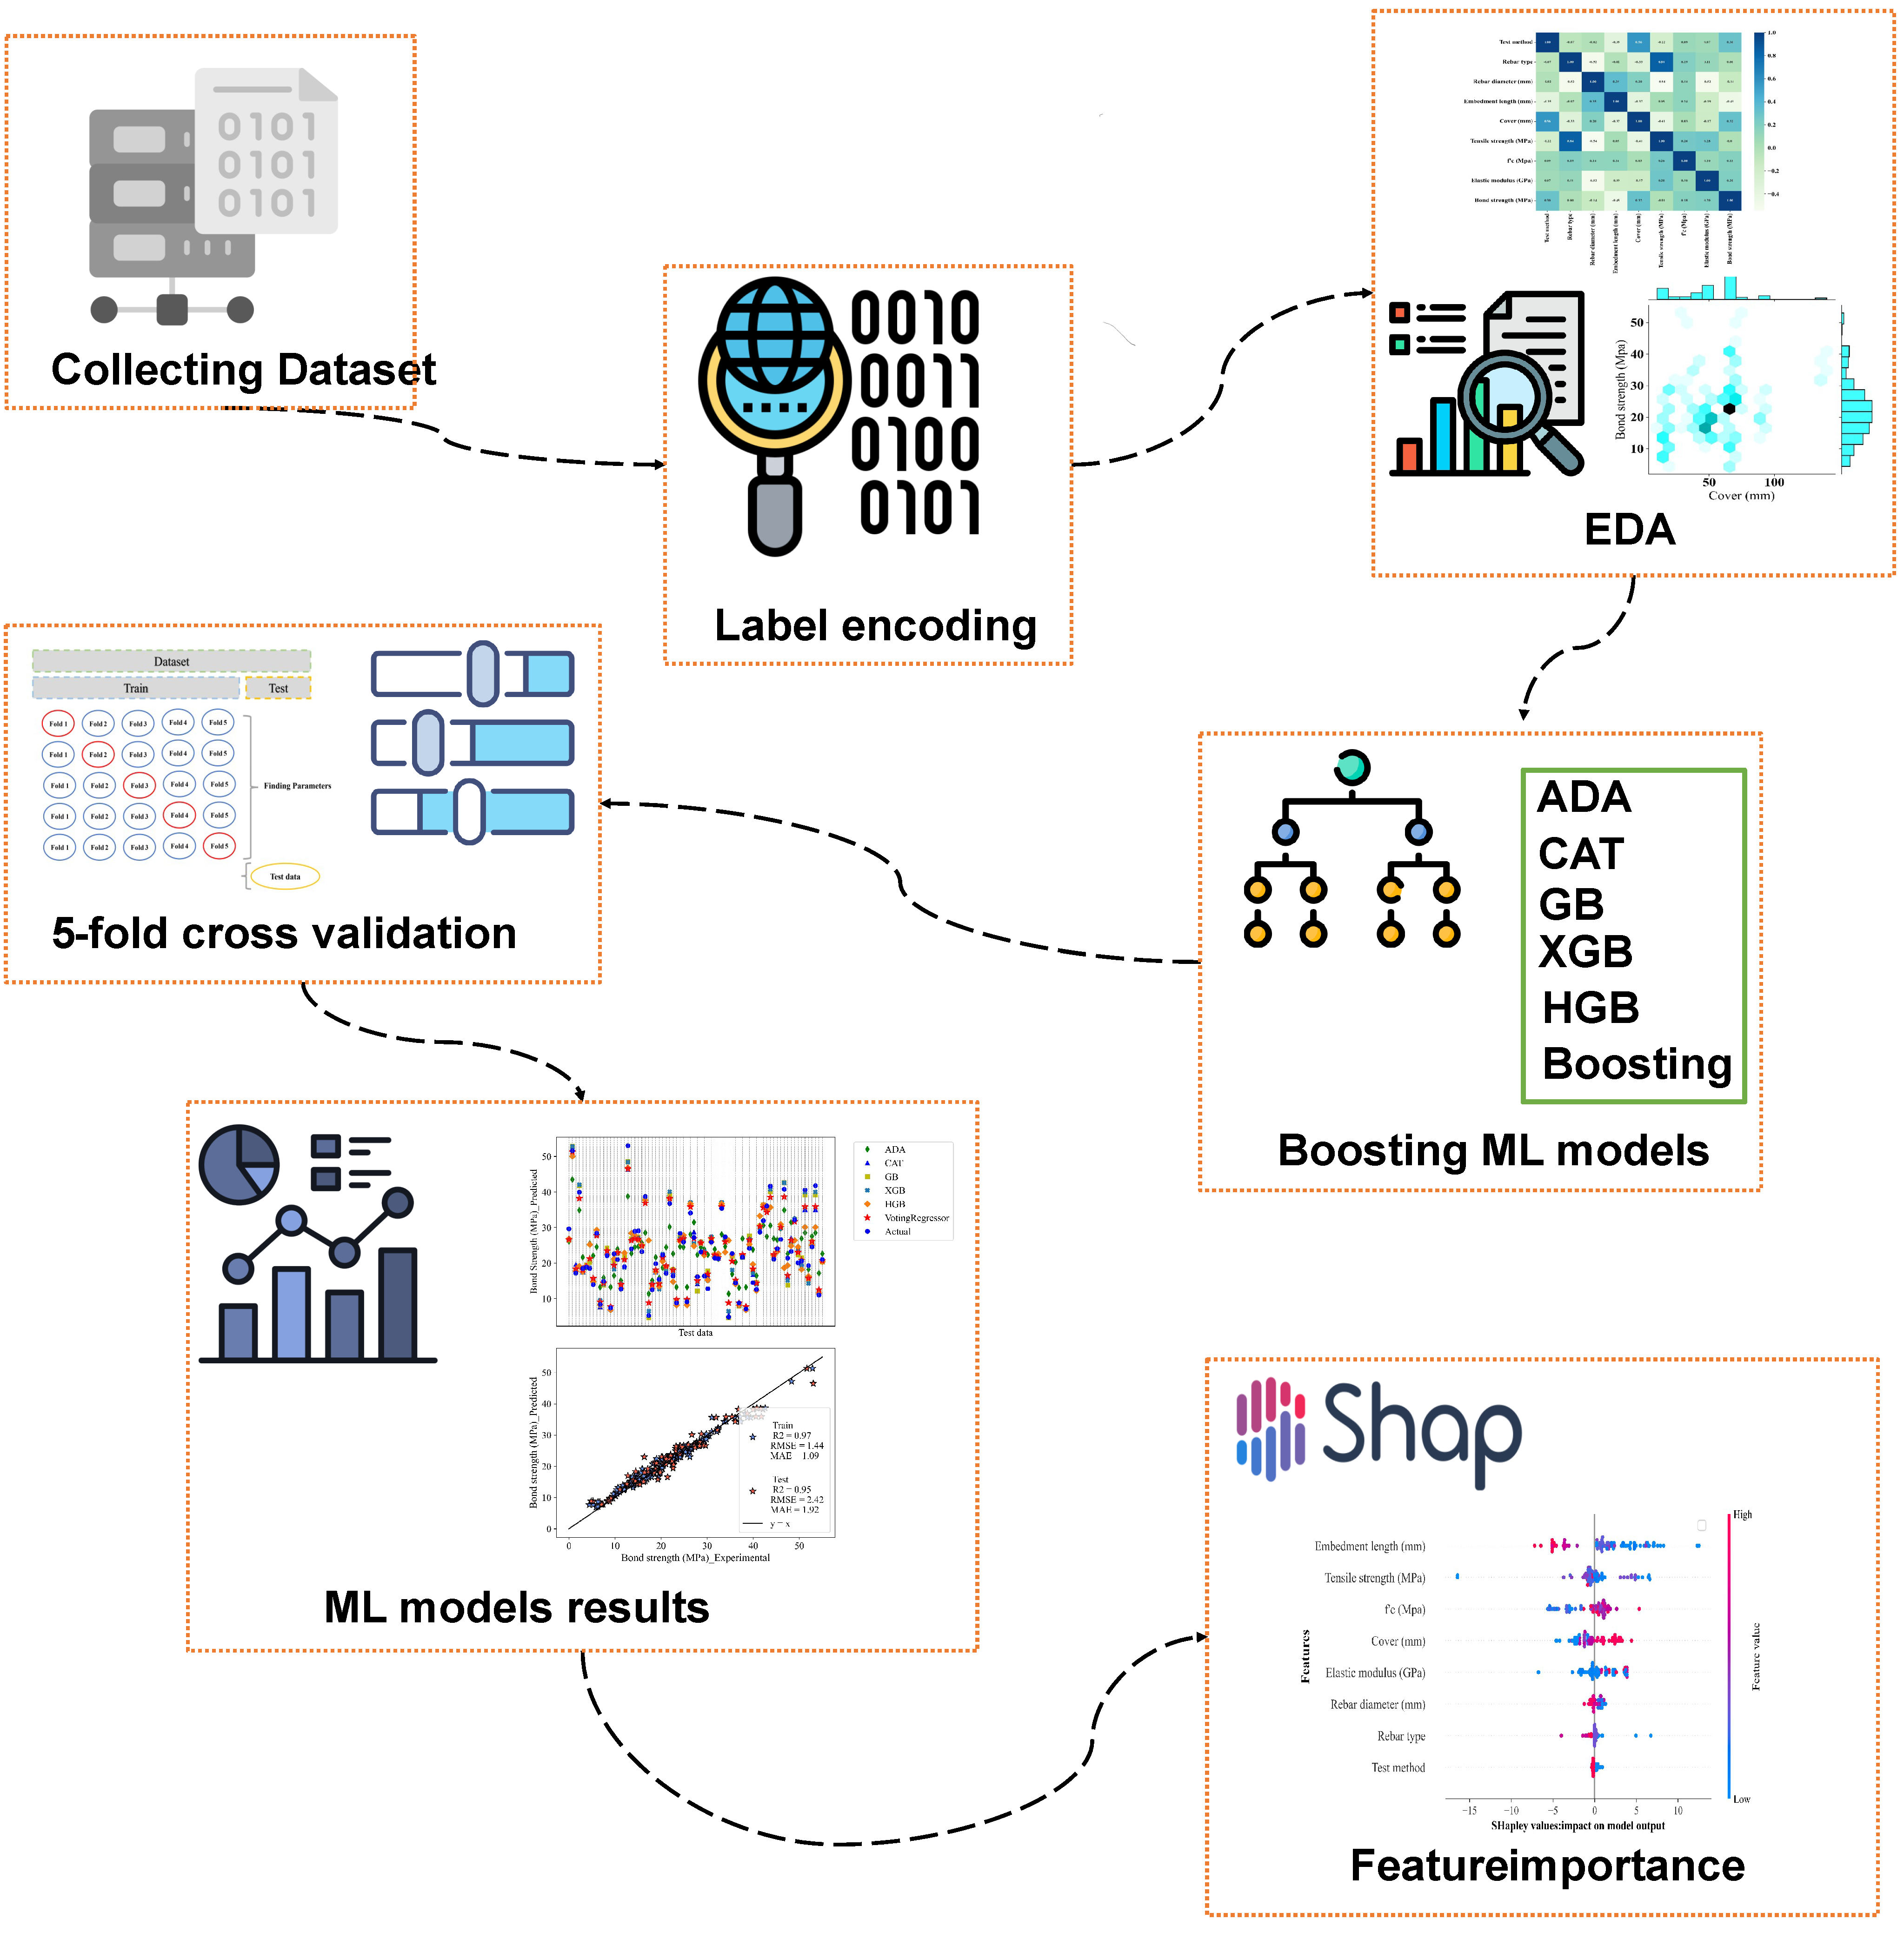
Figure 1. Overview of the study.
Computation 12 00202 g001
Figure 2. Schematic of FRP bar under uniaxial loading.
Computation 12 00202 g002
Figure 3. Setup of investigated test methods: (a) pullout test, and (b) beam test.
Computation 12 00202 g003
Figure 4. Joint plot output and input variables.
Computation 12 00202 g004
Figure 5. Correlation heatmap between output and input variables.
Computation 12 00202 g005
Figure 6. Histograms and violin plot of output and input variables.
Computation 12 00202 g006
Figure 7. Schematic of boosting algorithm.
Computation 12 00202 g007
Figure 8. Schematic of 5-fold cross validation (Blue folds are training data and red folds are validation data).
Computation 12 00202 g008
Figure 9. Flowchart of grid search.
Computation 12 00202 g009
Figure 10. ML model results: (a) ADAboost, (b) CatBoost, (c) Gradient Boosting, (d) XGBoost, and (e) Hist Gradient Boosting.
Computation 12 00202 g010aComputation 12 00202 g010bComputation 12 00202 g010c
Figure 11. Impact of hyperparameter tuning on ML models results: (a) R2, (b) RMSE, and (c) MAE.
Computation 12 00202 g011
Figure 12. Taylor diagram for ML models results: (a) train data, (b) test data, and (c) total data.
Computation 12 00202 g012
Figure 13. Voting regressor results: (a) first approach and (b) second approach.
Computation 12 00202 g013
Figure 14. Comparison of the results of all ML models.
Computation 12 00202 g014
Figure 15. ML models UI: (a) before running and (b) after running.
Computation 12 00202 g015
Figure 16. Feature importance of ML models: (a) Adaboost, (b) CatBoost, (c) Gradient Boosting, (d) XGBoost, (e) Hist Gradient Boosting, and (f) Voting Regressor.
Computation 12 00202 g016aComputation 12 00202 g016b
Figure 17. Workflow of the Shapley values method.
Computation 12 00202 g017
Figure 18. SHAP values for the XGB model.
Computation 12 00202 g018
Figure 19. Mean SHAP values for the XGB model.
Computation 12 00202 g019
Figure 20. SHAP values for each feature.
Computation 12 00202 g020aComputation 12 00202 g020b
Figure 21. SHAP values for three random points in test data: (a) test data number 19, (b) test data number 27, and (c) test data number 54 (In the visualization, blue color indicates that the feature reduces the prediction value, while red color shows that the feature increases the prediction value).
Computation 12 00202 g021aComputation 12 00202 g021b
Figure 22. Previous predictive formulas compare to experimental values: (a) CFRP and (b) GFRP and steel [8,24,51].
Computation 12 00202 g022
Table 2. Experimental dataset collected from existing literature.
ResearchTest MethodRebar TypeRebar Diameter (mm)Embedment Length (mm)Tensile Strength (MPa) f c (MPa)Elastic Modulus (GPa)Number of Specimens
Hu et al. (2024) [40]Pullout and BeamGFRP
and Steel
1640–160609 and 894133.254 and 19816
Zhu et al. (2023) [24]BeamCFRP8, 10, and 1225–1202030 and 2702131–143-11
Liang et al. (2023) [13]PulloutGFRP, BFRP,
and Steel
1242355–132193–12248–200.448
Tong et al. (2023) [44] PulloutGFRP12, 16, and 2060–100702–78290–13254–5854
Decebal et al. (2021) [36]BeamGFRP17.269–276110087–1326028
Hossain et al. (2017) [33]BeamGFRP15.9 and 19.147–133751–143971–17447–6448
Ahmed and Sennah (2014) [45]PulloutGFRP2080–1601105166–18164.735
Ahmad et al. (2011) [34]PulloutCFRP7.5, 8, 10, and 1240–1602300 and 2400170130 and 1589
CFRP: carbon fiber-reinforced polymer; GFRP: glass fiber-reinforced polymer; BFRP: basalt fiber-reinforced polymer.
Table 3. Adaboost selected hyperparameters and their space.
N_EstimatorsLearning_RateLoss
500.01Linear
1000.1Square
2000.2Exponential
3000.3-
4000.5-
Table 4. Catboost selected hyperparameters and their space.
IterationsLearning_RateDepthL2_Leaf_RegBagging_Temperature
1000.01430.8
1500.05651
2000.187-
3000.2-9-
400----
Table 5. Gradient booting and XGBoost selected hyperparameters and their space.
N_EstimatorsLearning_RateMax_DepthMax_Features
500.01Nonesqrt
1000.14log2
2000.25-
3000.38-
4000.510-
Table 6. Hist Gradient Boosting Regressor selected hyperparameters and their space.
L2_RegularizationLearning_RateMax_DepthMax_Iter
00.01None100
0.10.14200
0.50.25300
10.38-
-0.510-
Table 7. ML models’ results.
ModelR2 (Default)RMSE (Default)MAE (Default)R2 (Tuned)RMSE (Tuned)MAE (Tuned)
ADAboost0.616.465.030.75.632.67
Catboost0.942.561.90.952.341.74
Gradient Boosting0.942.581.950.952.261.73
XGBoost0.942.331.780.952.211.68
Hist Gradient Boosting0.596.584.180.685.863.24
Table 8. Best hyperparameters resulting from hyperparameter tuning.
ModelN_EstimatorsMax_DepthMax_FeaturesLearning_RateLoss
AdaBoost100--0.5exponential
Gradient Boosting2004sqrt0.1-
XGBoost15010-0.1-
Table 9. Proposed formulations in previous studies.
Research FormulaNote
Yoo et al. 2023 [8](a): τ m a x f c 0.36 = 1.46 + 0.043 d b × ( 0.68 + 0.195 c d b + 2.449 d b l e ) for sand-coated CFRP
(b): τ m a x f c 0.5 = 7.775 + 1.184 d b × 0.918 0.061 d b l e + c d b 0.03 for helically ribbed CFRP
Separate equation according to CFRP type.
Lee et al. 2008 [51] τ m a x = 3.3 f c 0.3      for GFRP bars (a)
τ m a x = 4.1 f c 0.5      for steel bars (b)
Only considers f c .
Zhu et al. [24] τ m a x = 0.5 + 0.03 c d b + 4.5 d b l e + 21.6 d b f c      CFRP rebars in UHPC based on both pullout test data and beam testDoes not consider rebar type.
Disclaimer/Publisher’s Note: The statements, opinions and data contained in all publications are solely those of the individual author(s) and contributor(s) and not of MDPI and/or the editor(s). MDPI and/or the editor(s) disclaim responsibility for any injury to people or property resulting from any ideas, methods, instructions or products referred to in the content.