
Feet Segmentation for Regional Analgesia Monitoring Using Convolutional RFF and Layer-Wise Weighted CAM Interpretability

Abstract
1. Introduction
2. Material and Methods
2.1. Deep Learning for Semantic Segmentation
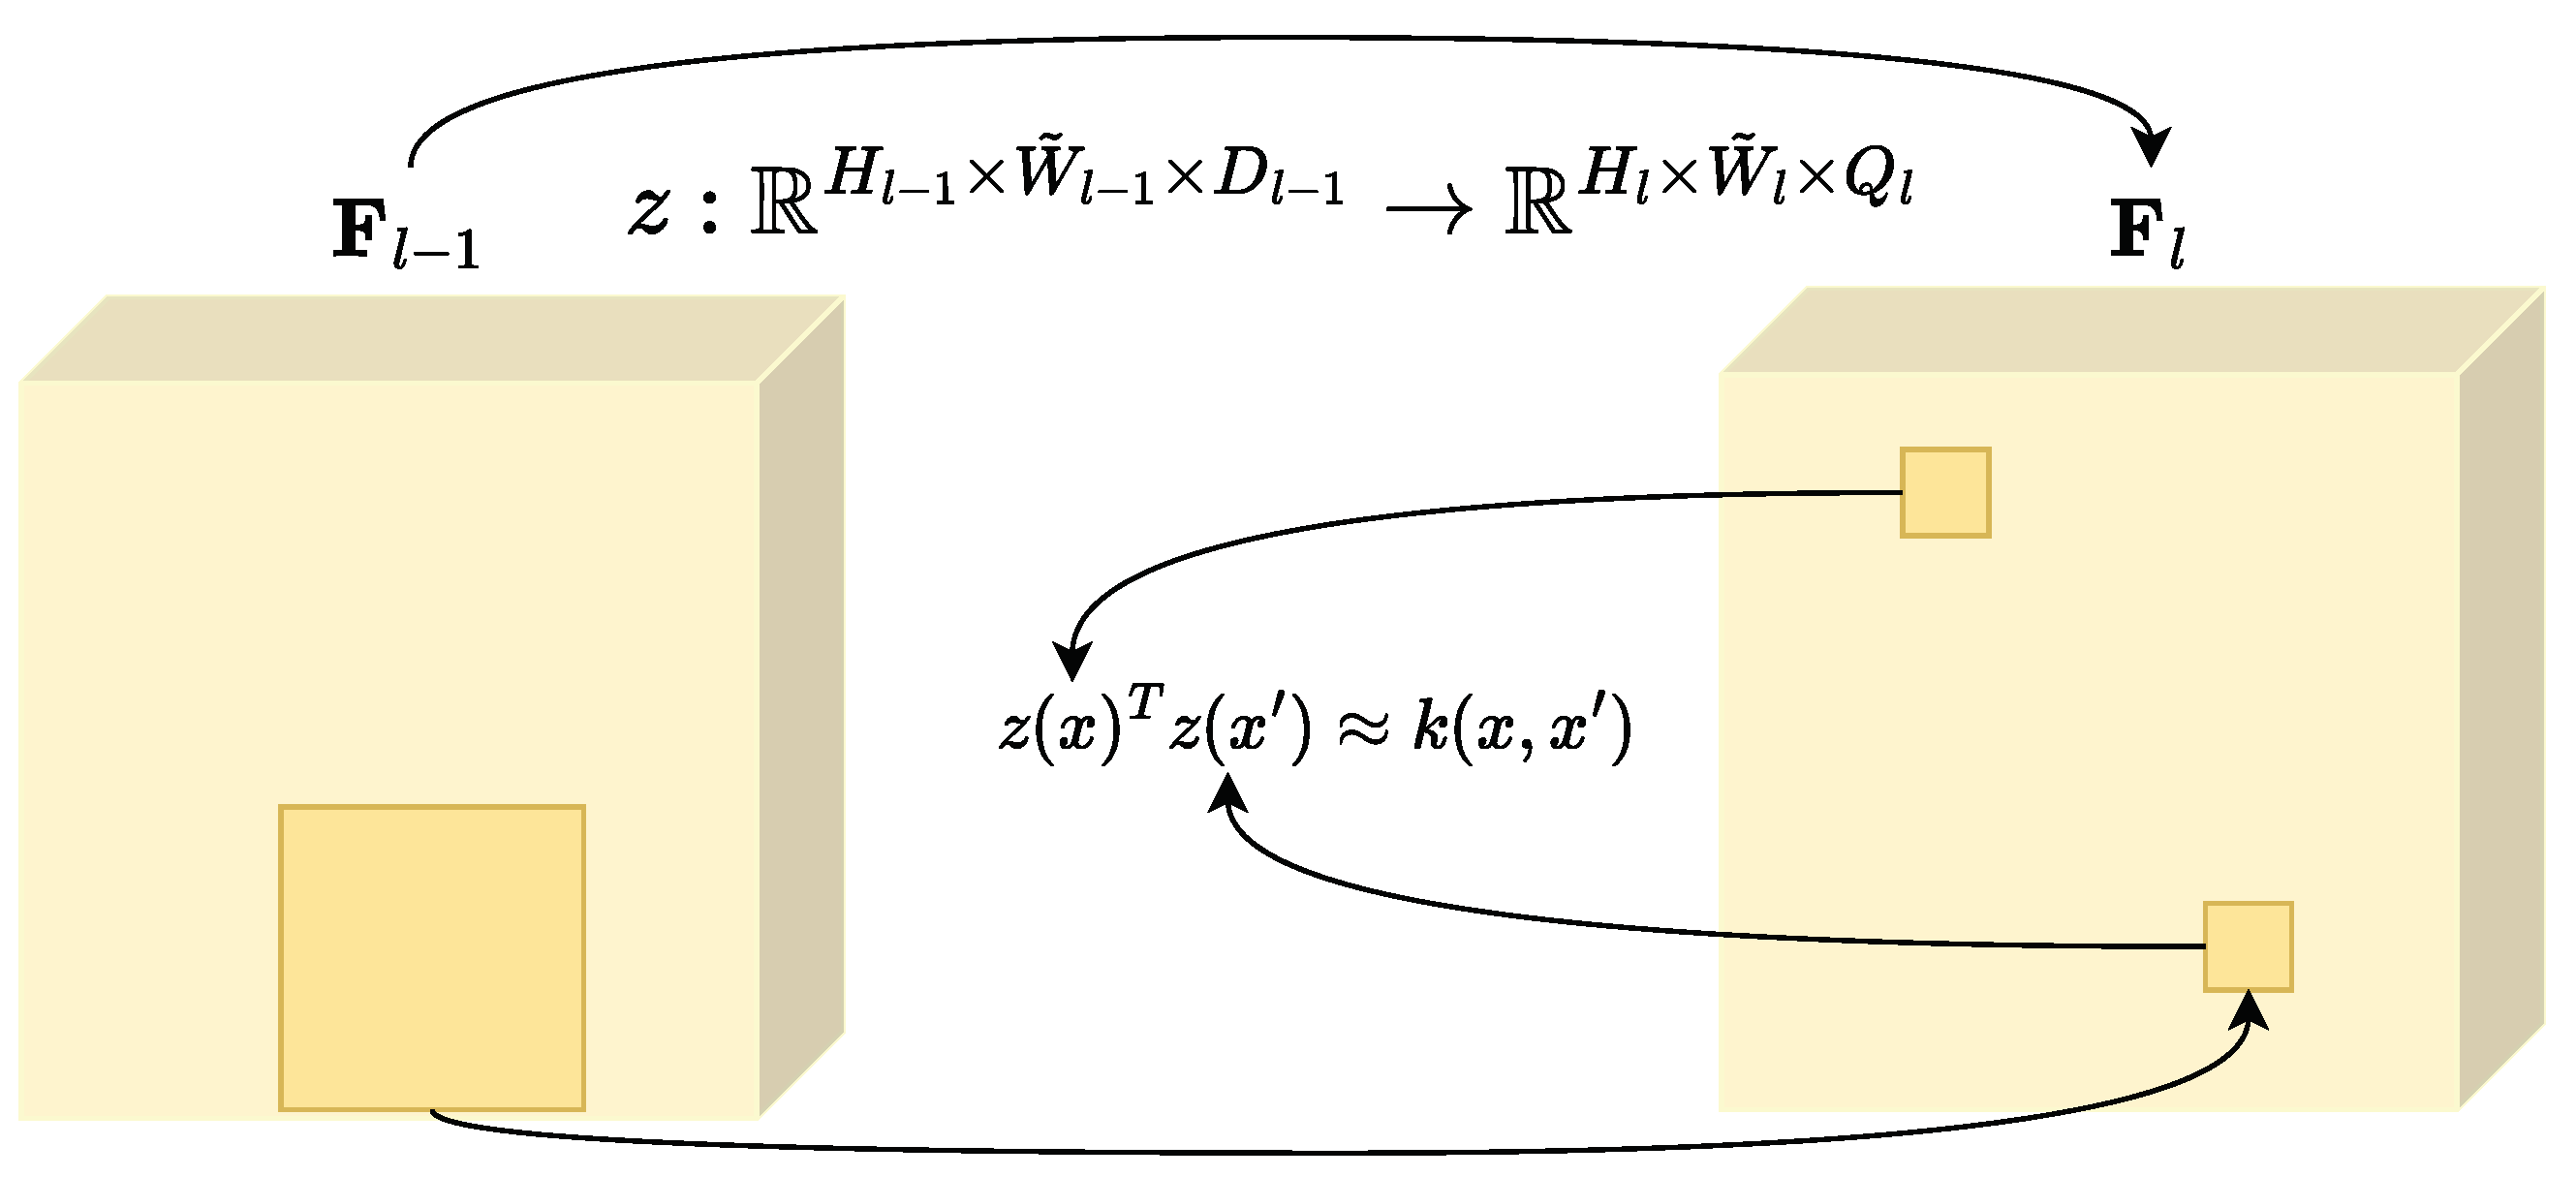
2.2. Convolutional Random Fourier Features Gradient—CRFFg
2.3. Layer-Wise Weighted Class Activation Maps for Semantic Segmentation
- –
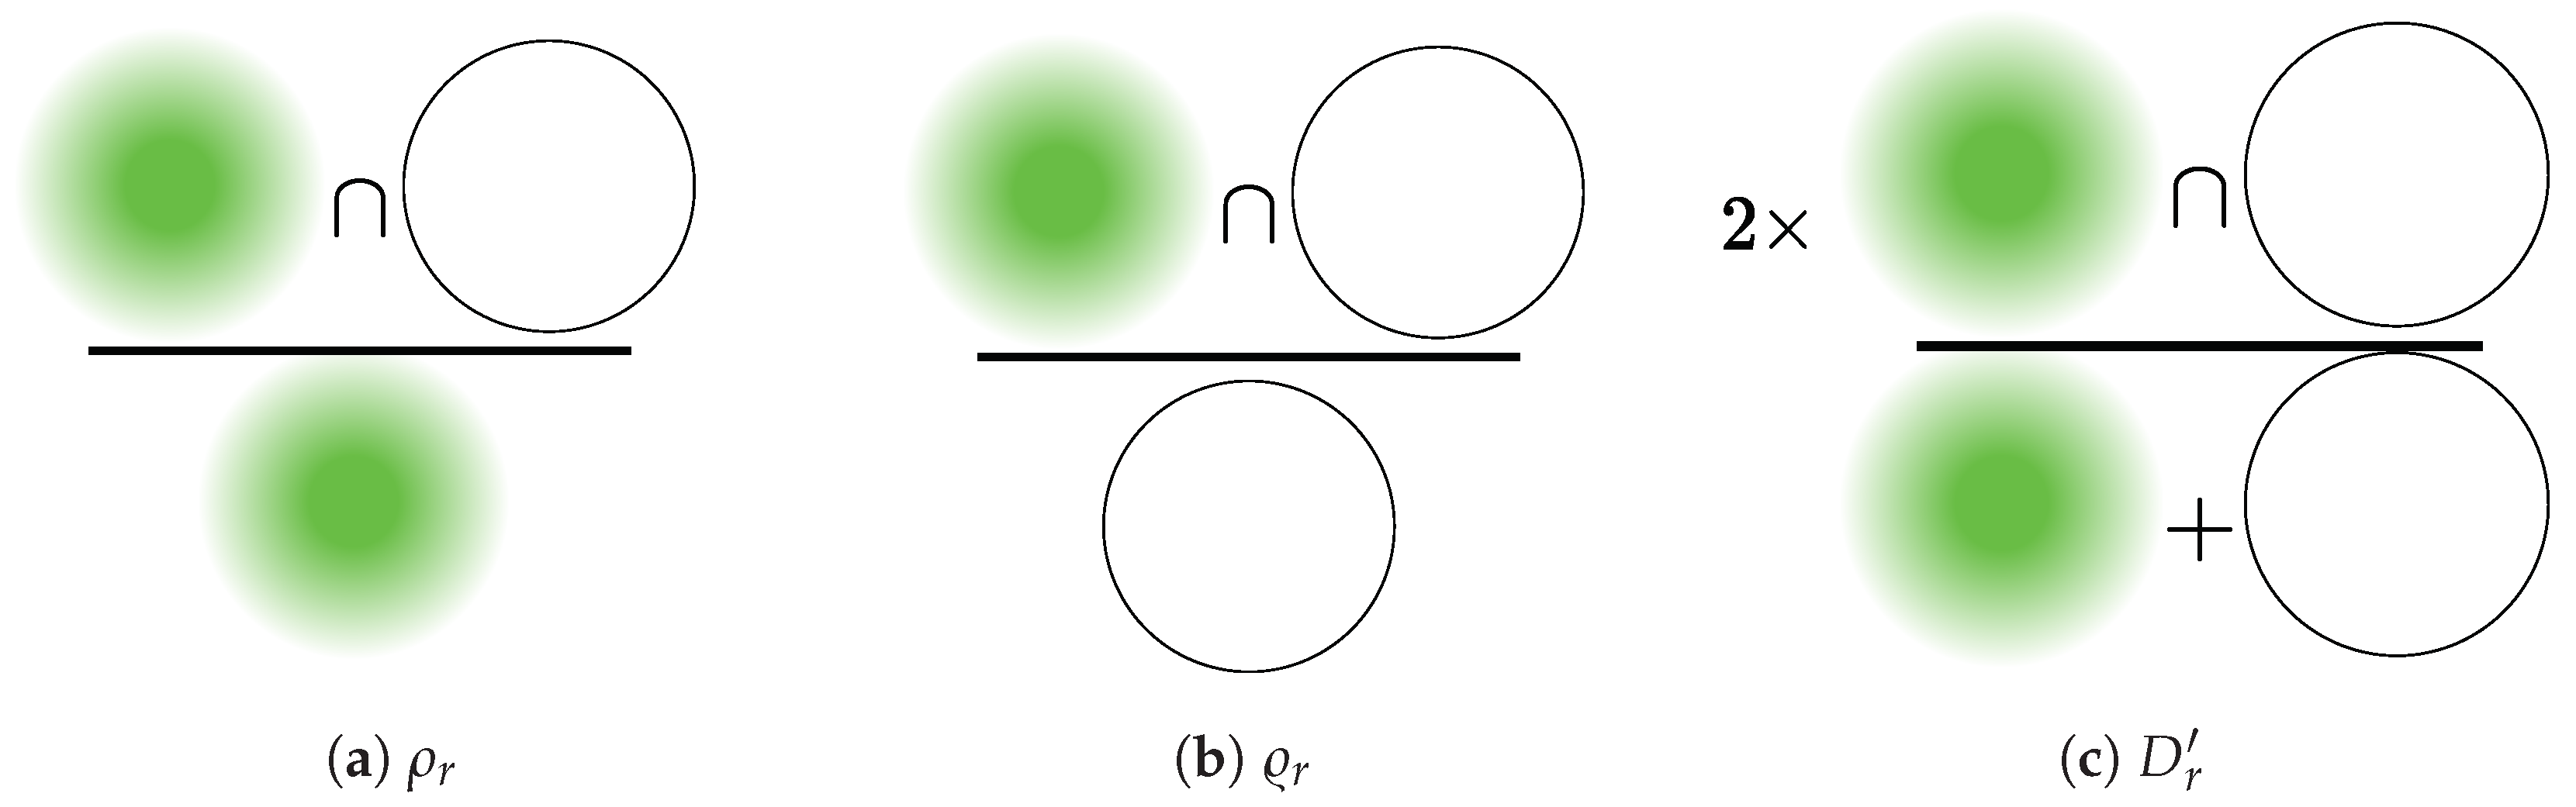
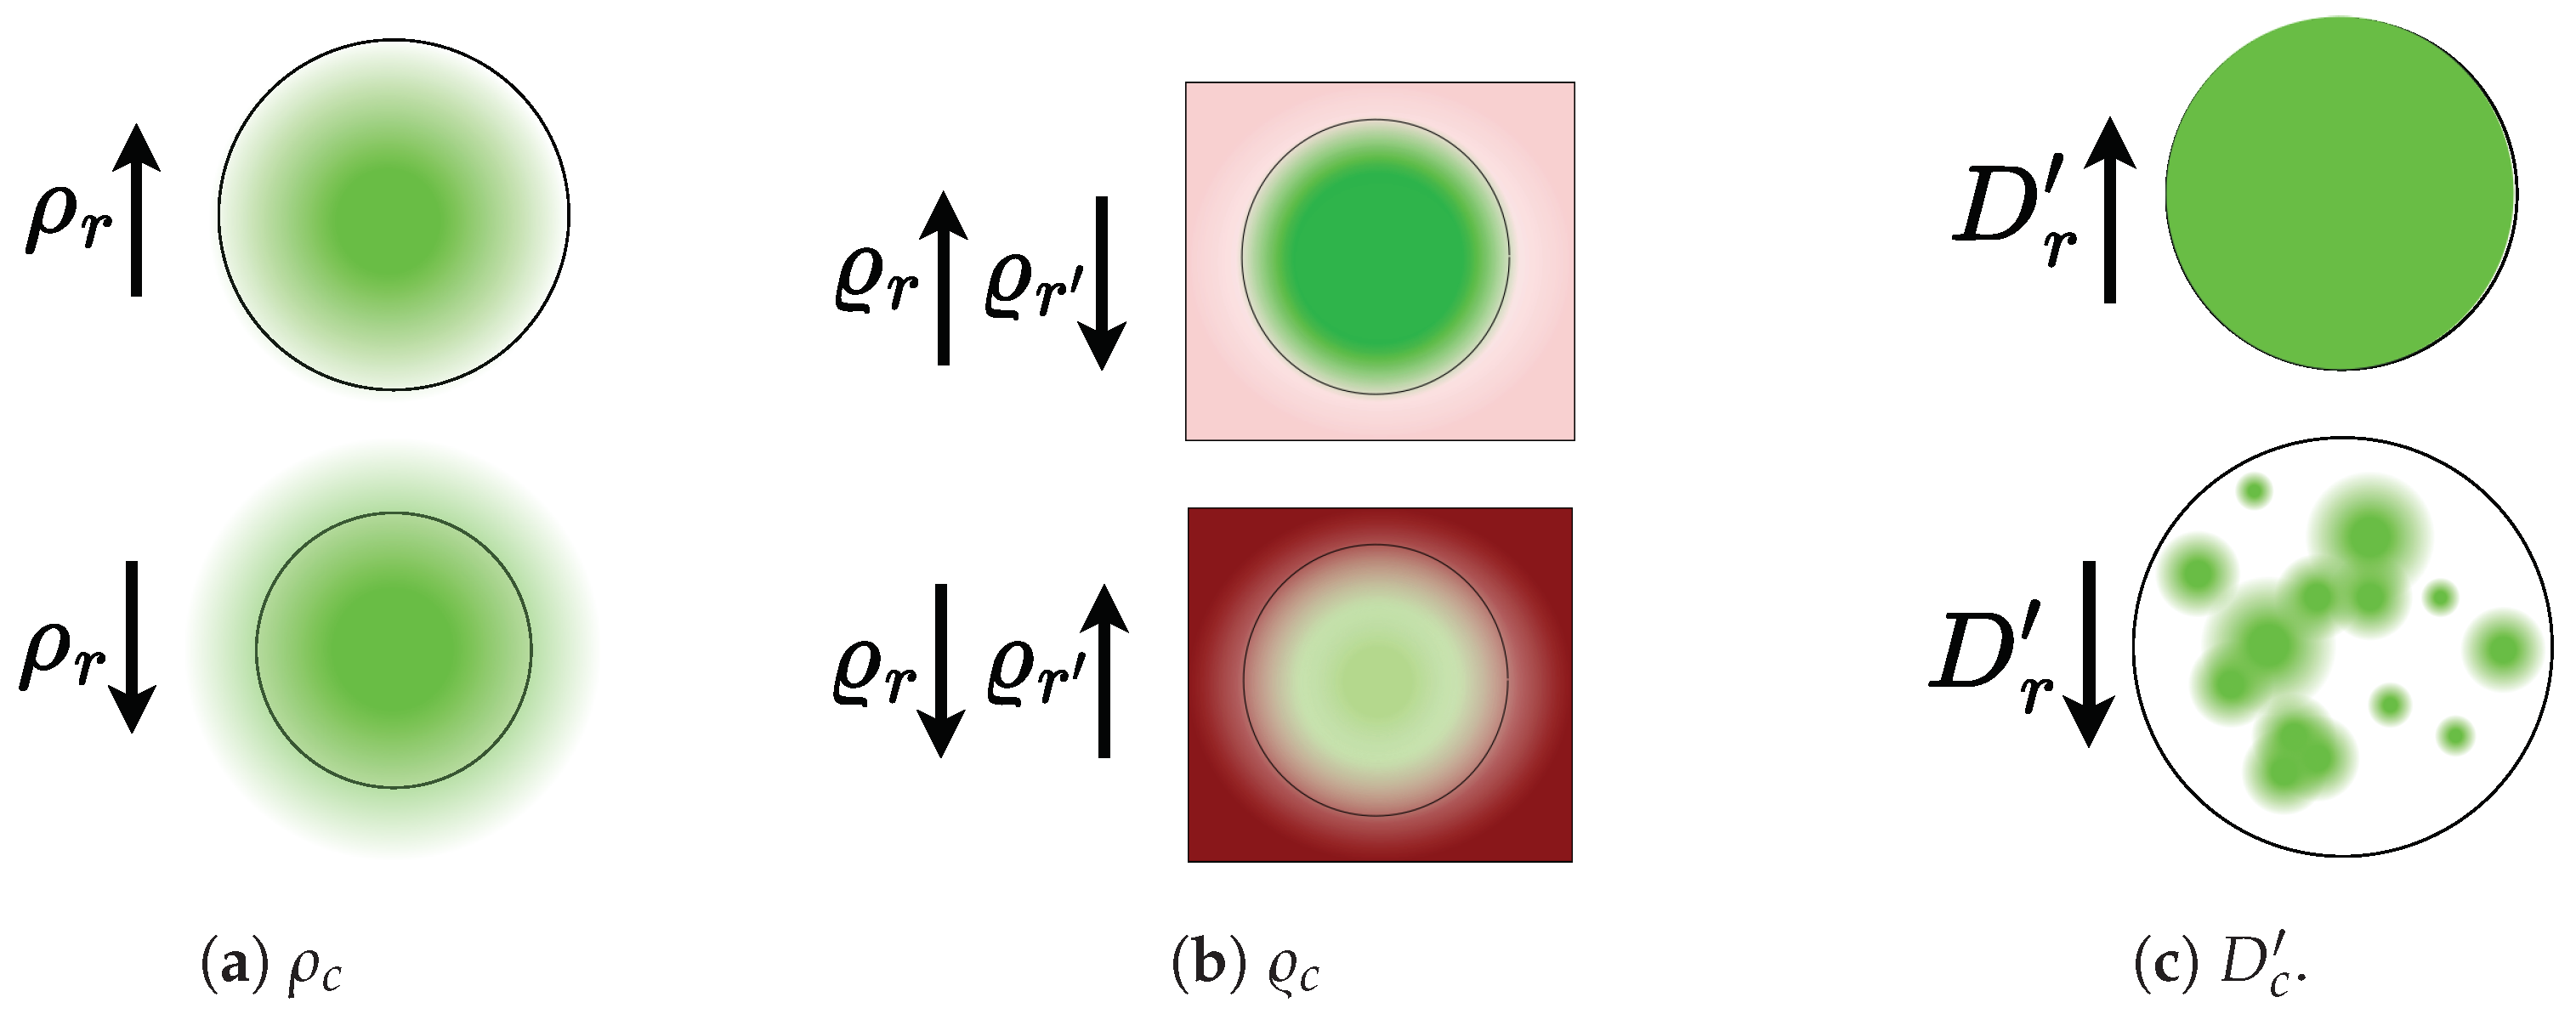
- CAM-based Cumulative Relevance () : It involves computing the cumulative contribution from each CAM representation to detect class r within the segmented region of interest. This can be expressed as follows:where collects a binary mask that identifies the pixel locations associated with the class r, and holds the Layer-CAM for image n with respect to layer l (see Equation (7)).
- –
- Mask-based Cumulative Relevance (): It assesses the relevance averaged across the class pixel set related to the target mask of interest. Then, each class-based cumulative relevance is computed as follows:The normalized Mask-based Cumulative Relevance can be computed as:
- –
- CAM-Dice (): A version of the Dice measure that quantifies mask thickness and how the extracted CAM is densely filled:
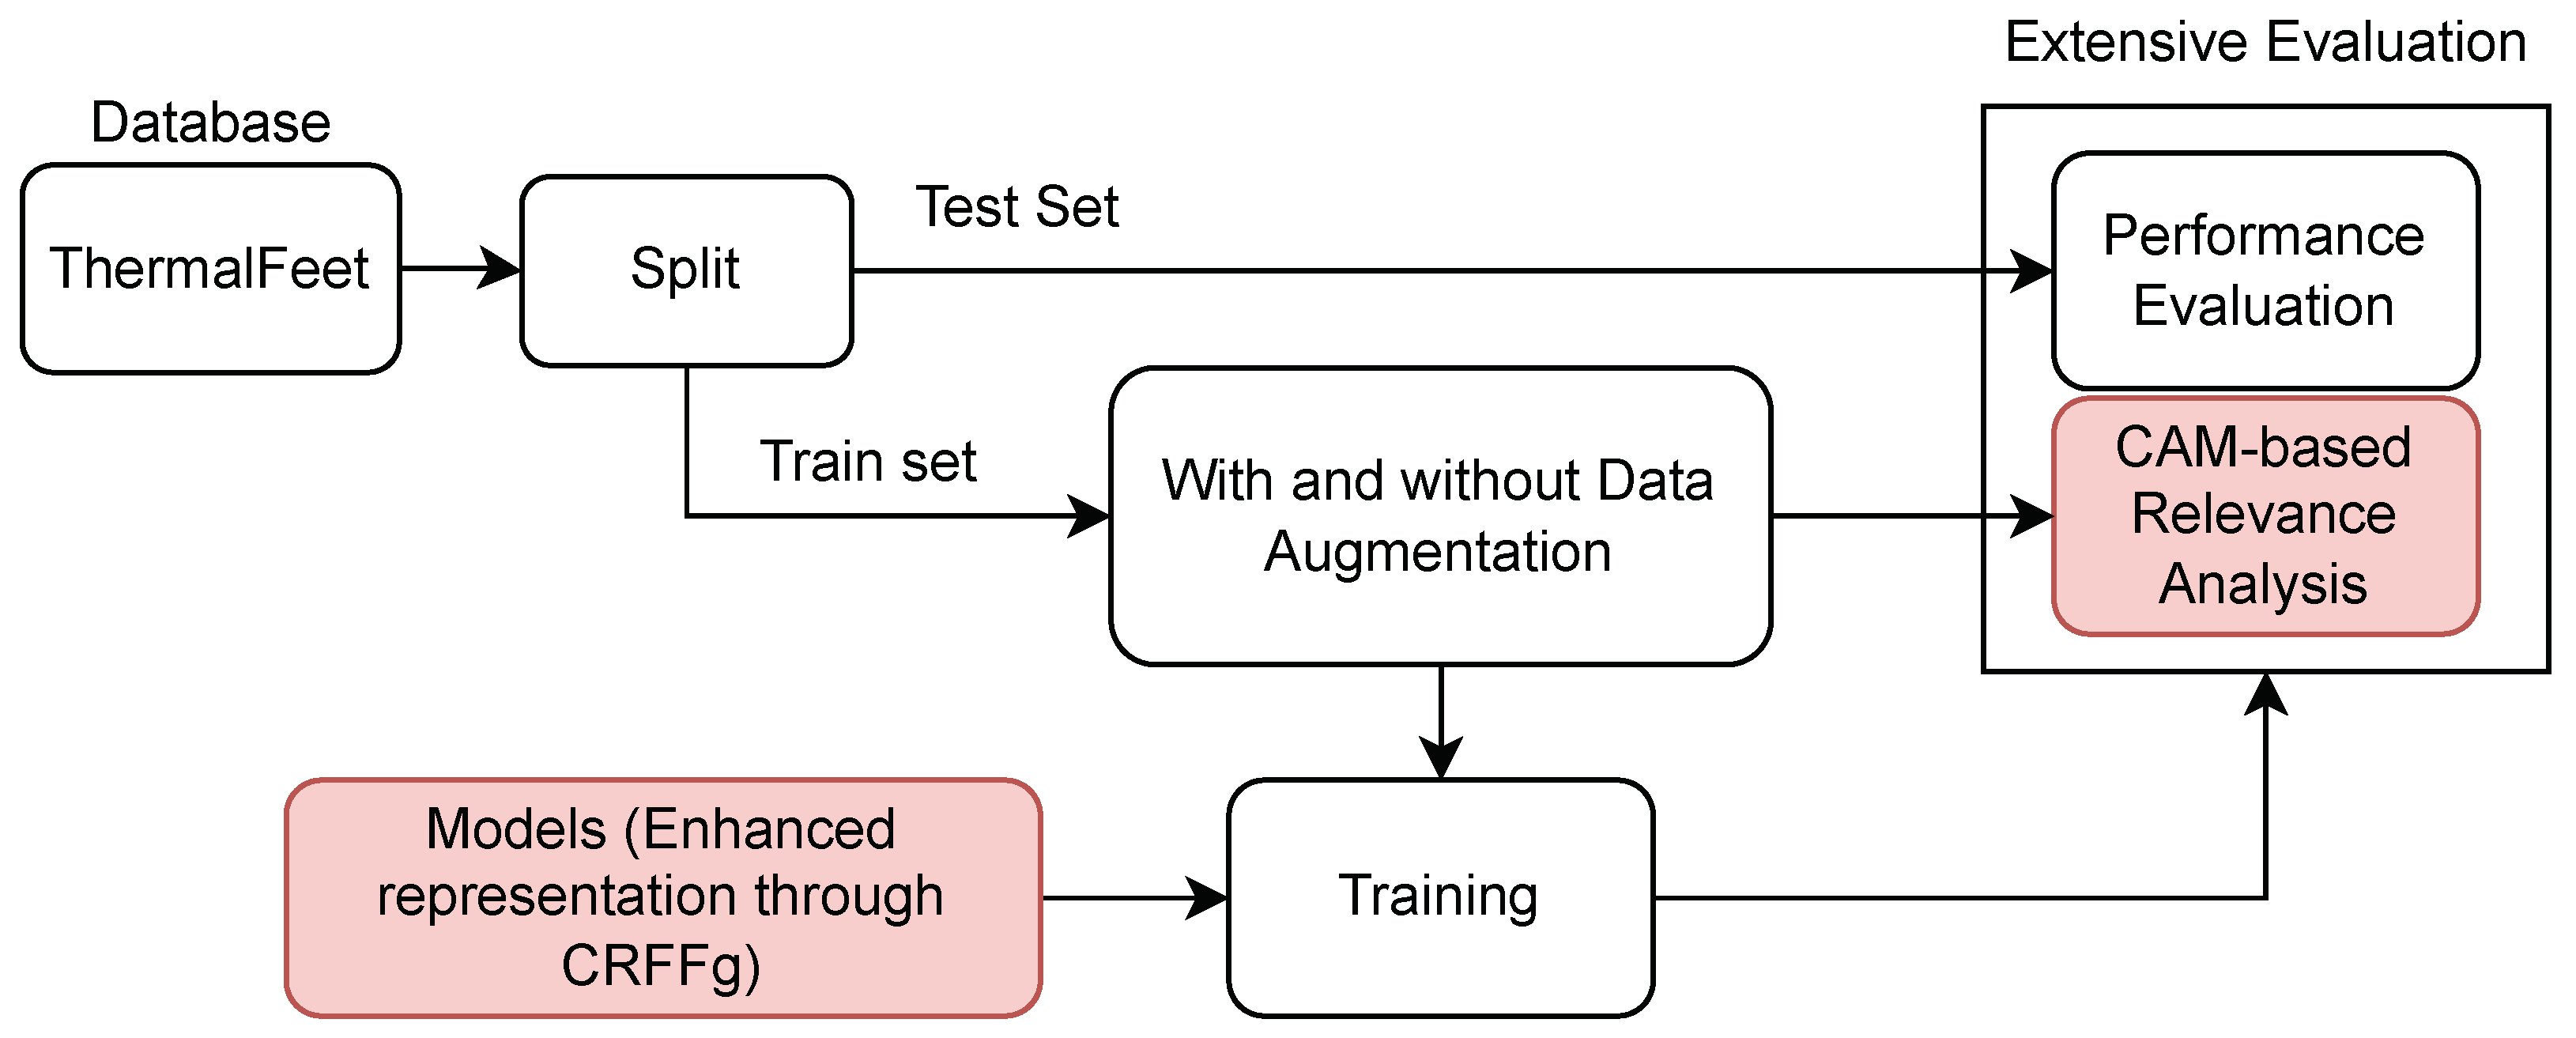
2.4. Feet Segmentation Pipeline from Thermal Images
- (i)
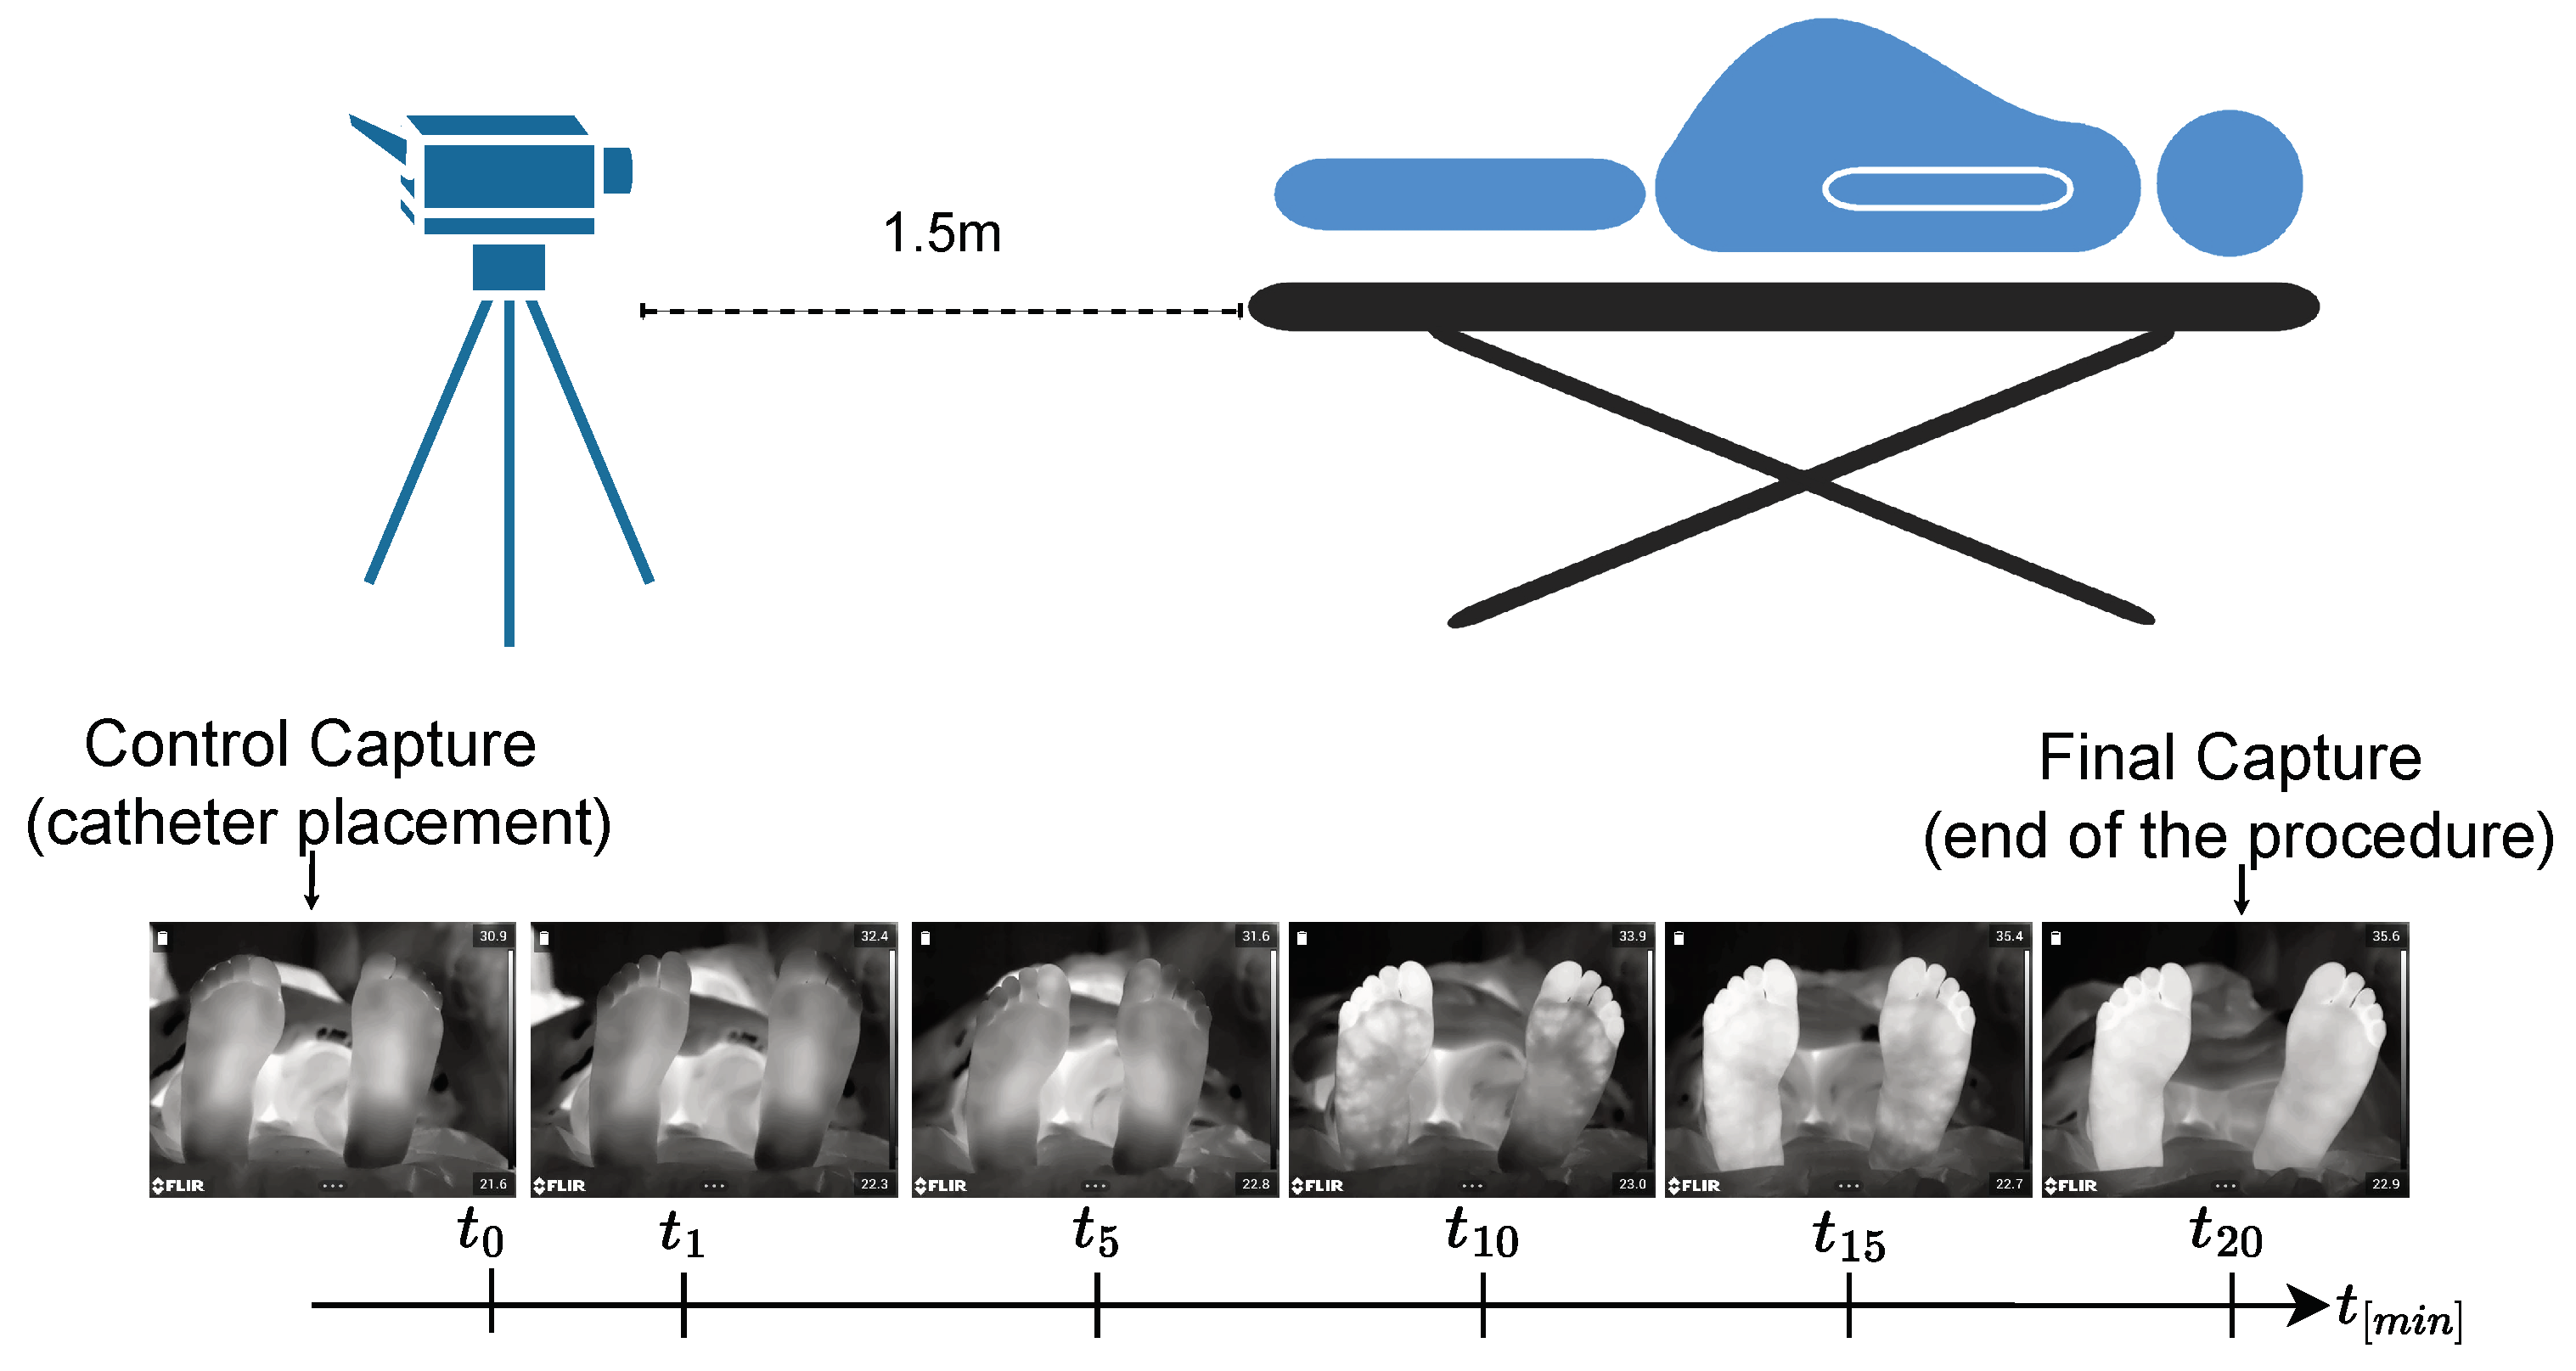
- Foot Infrared Thermal Data Acquisition and Preprocessing.
- (ii)
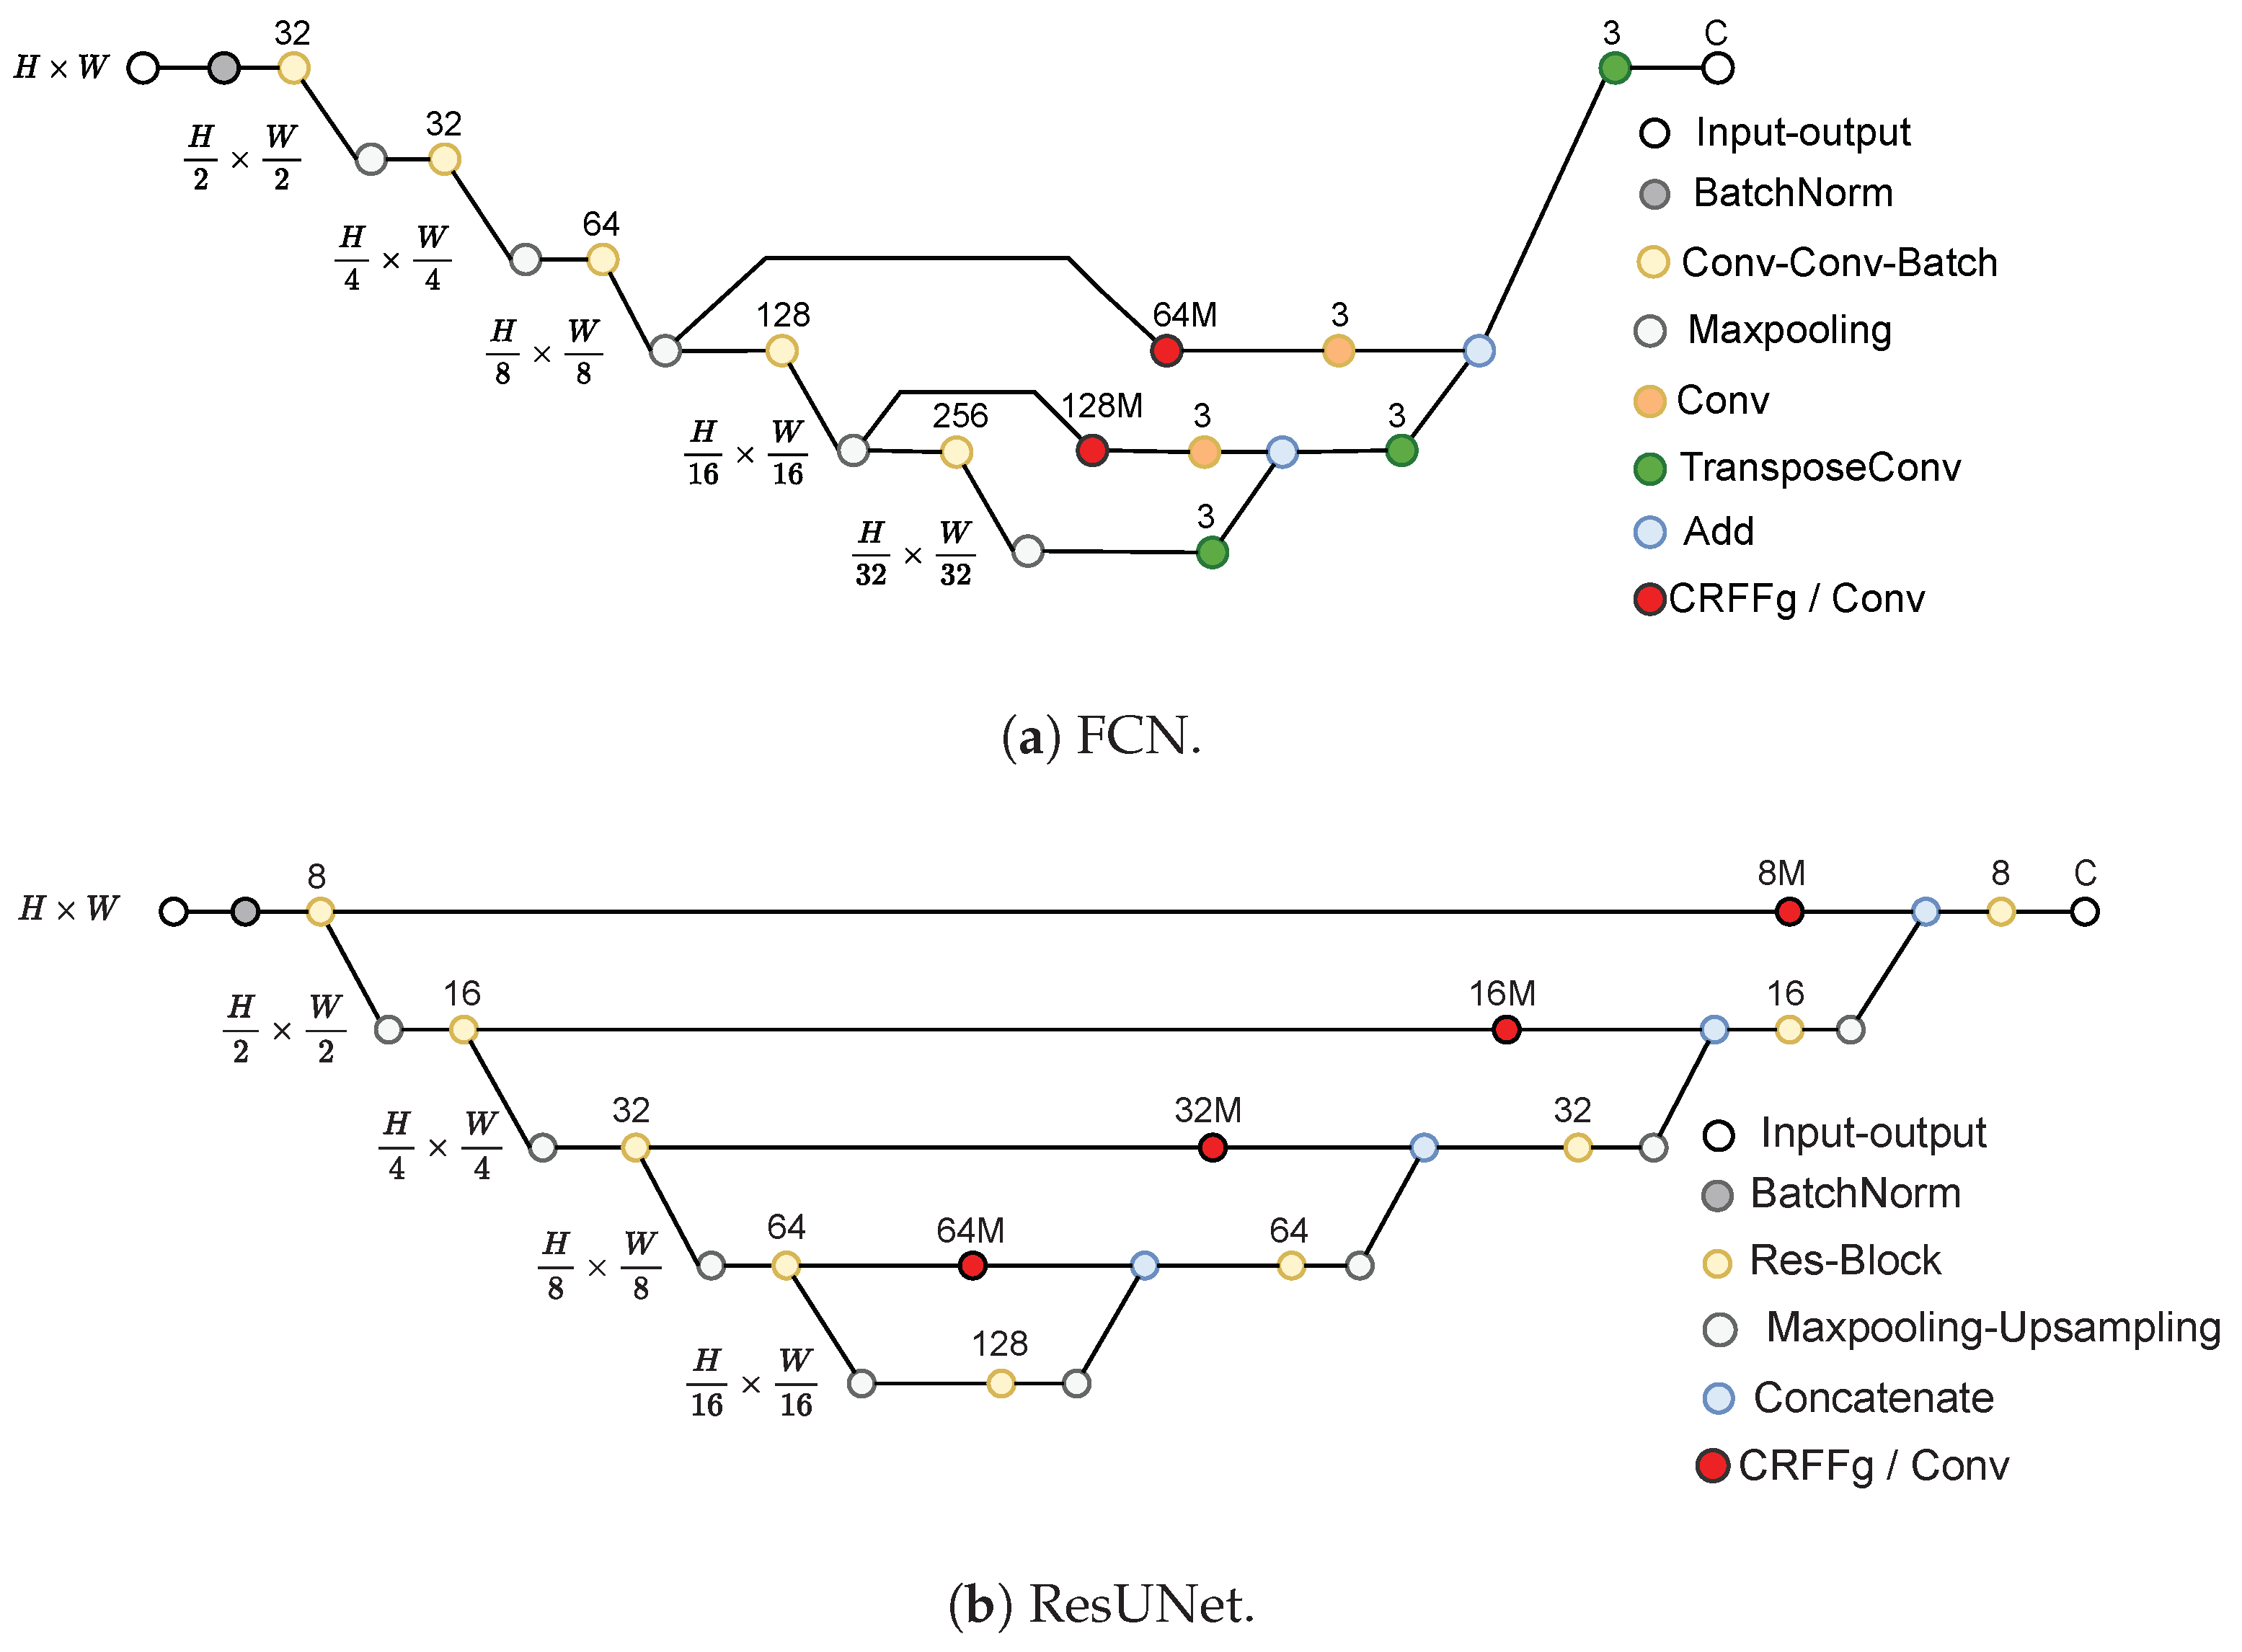
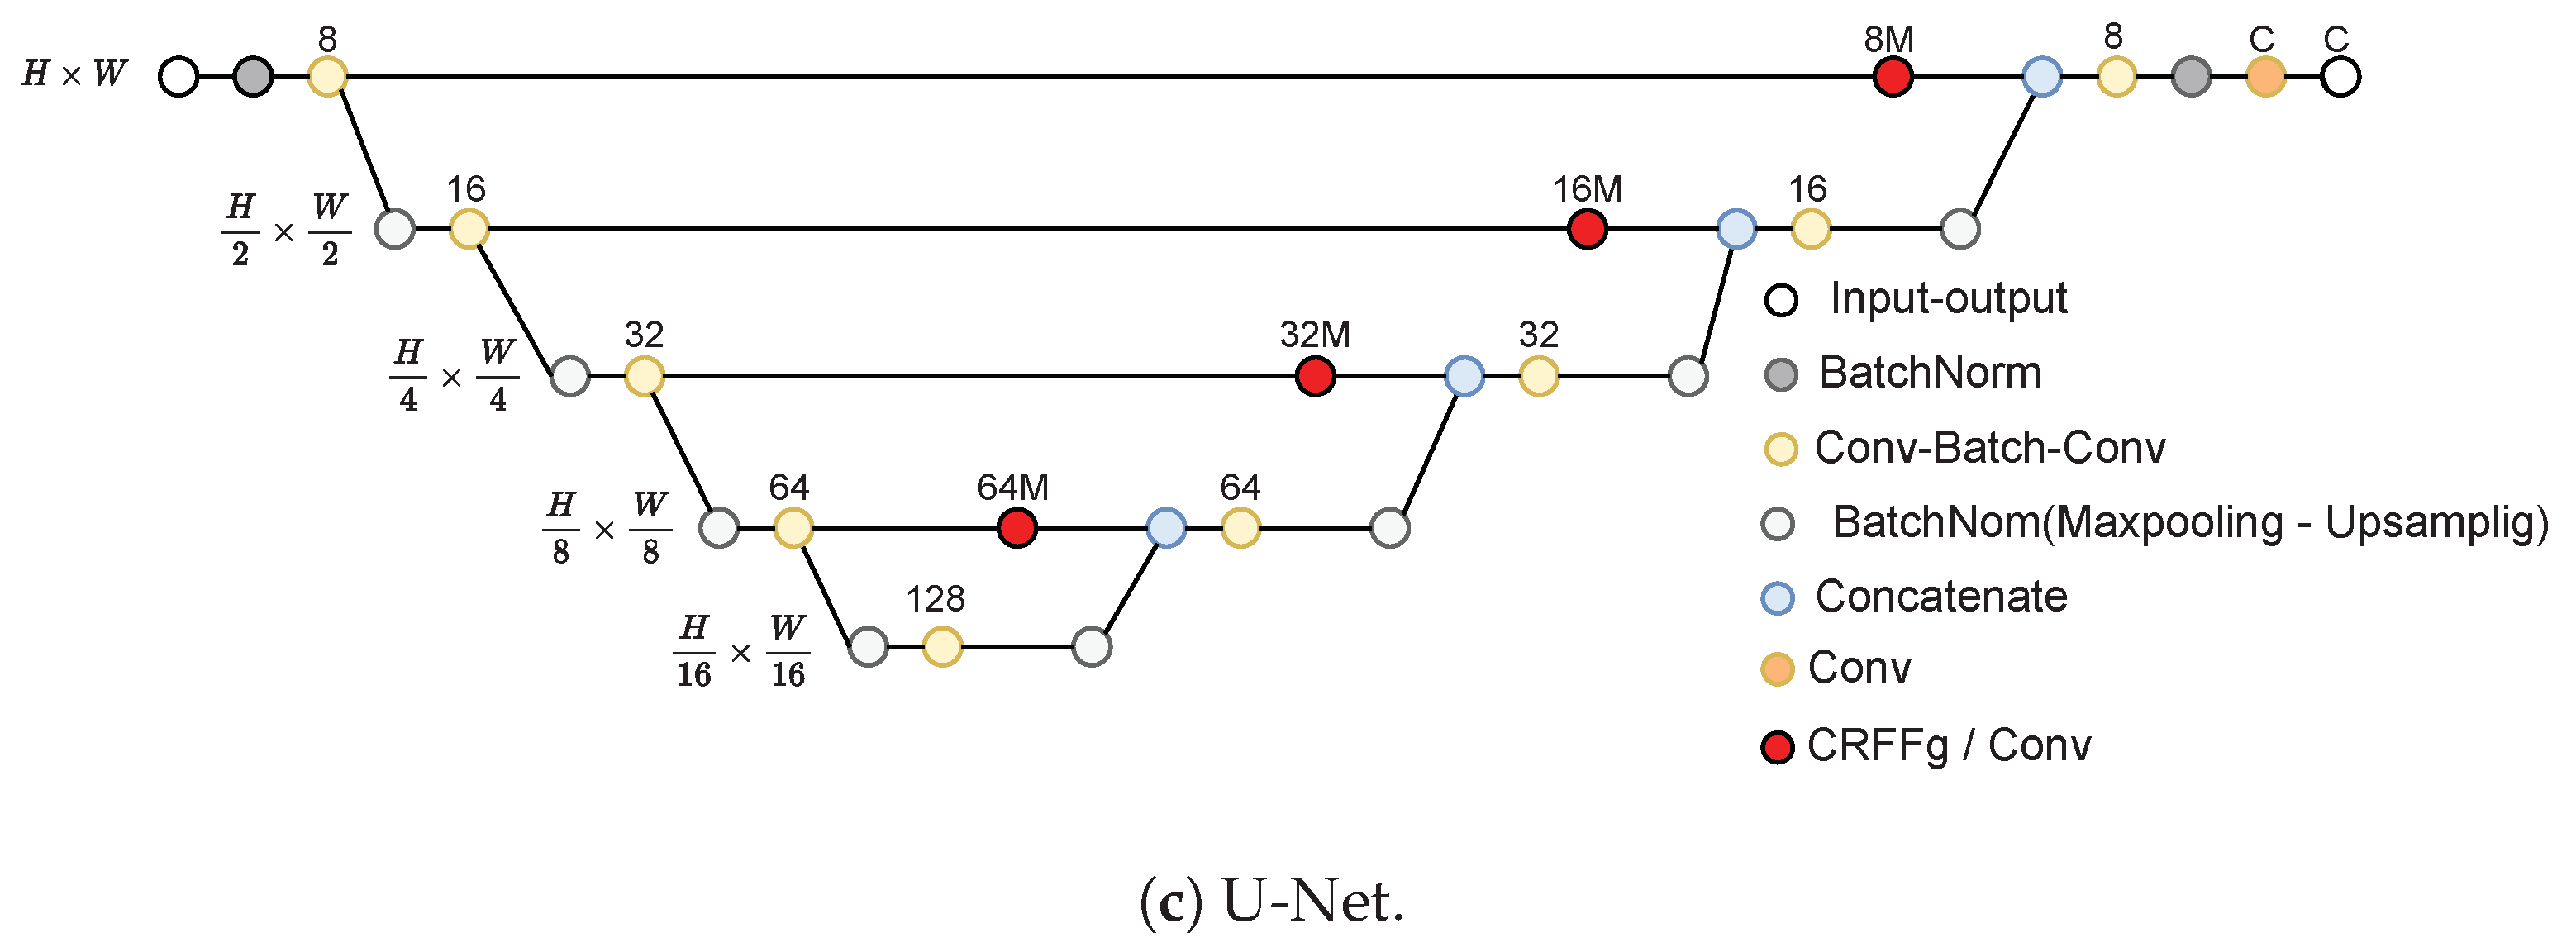
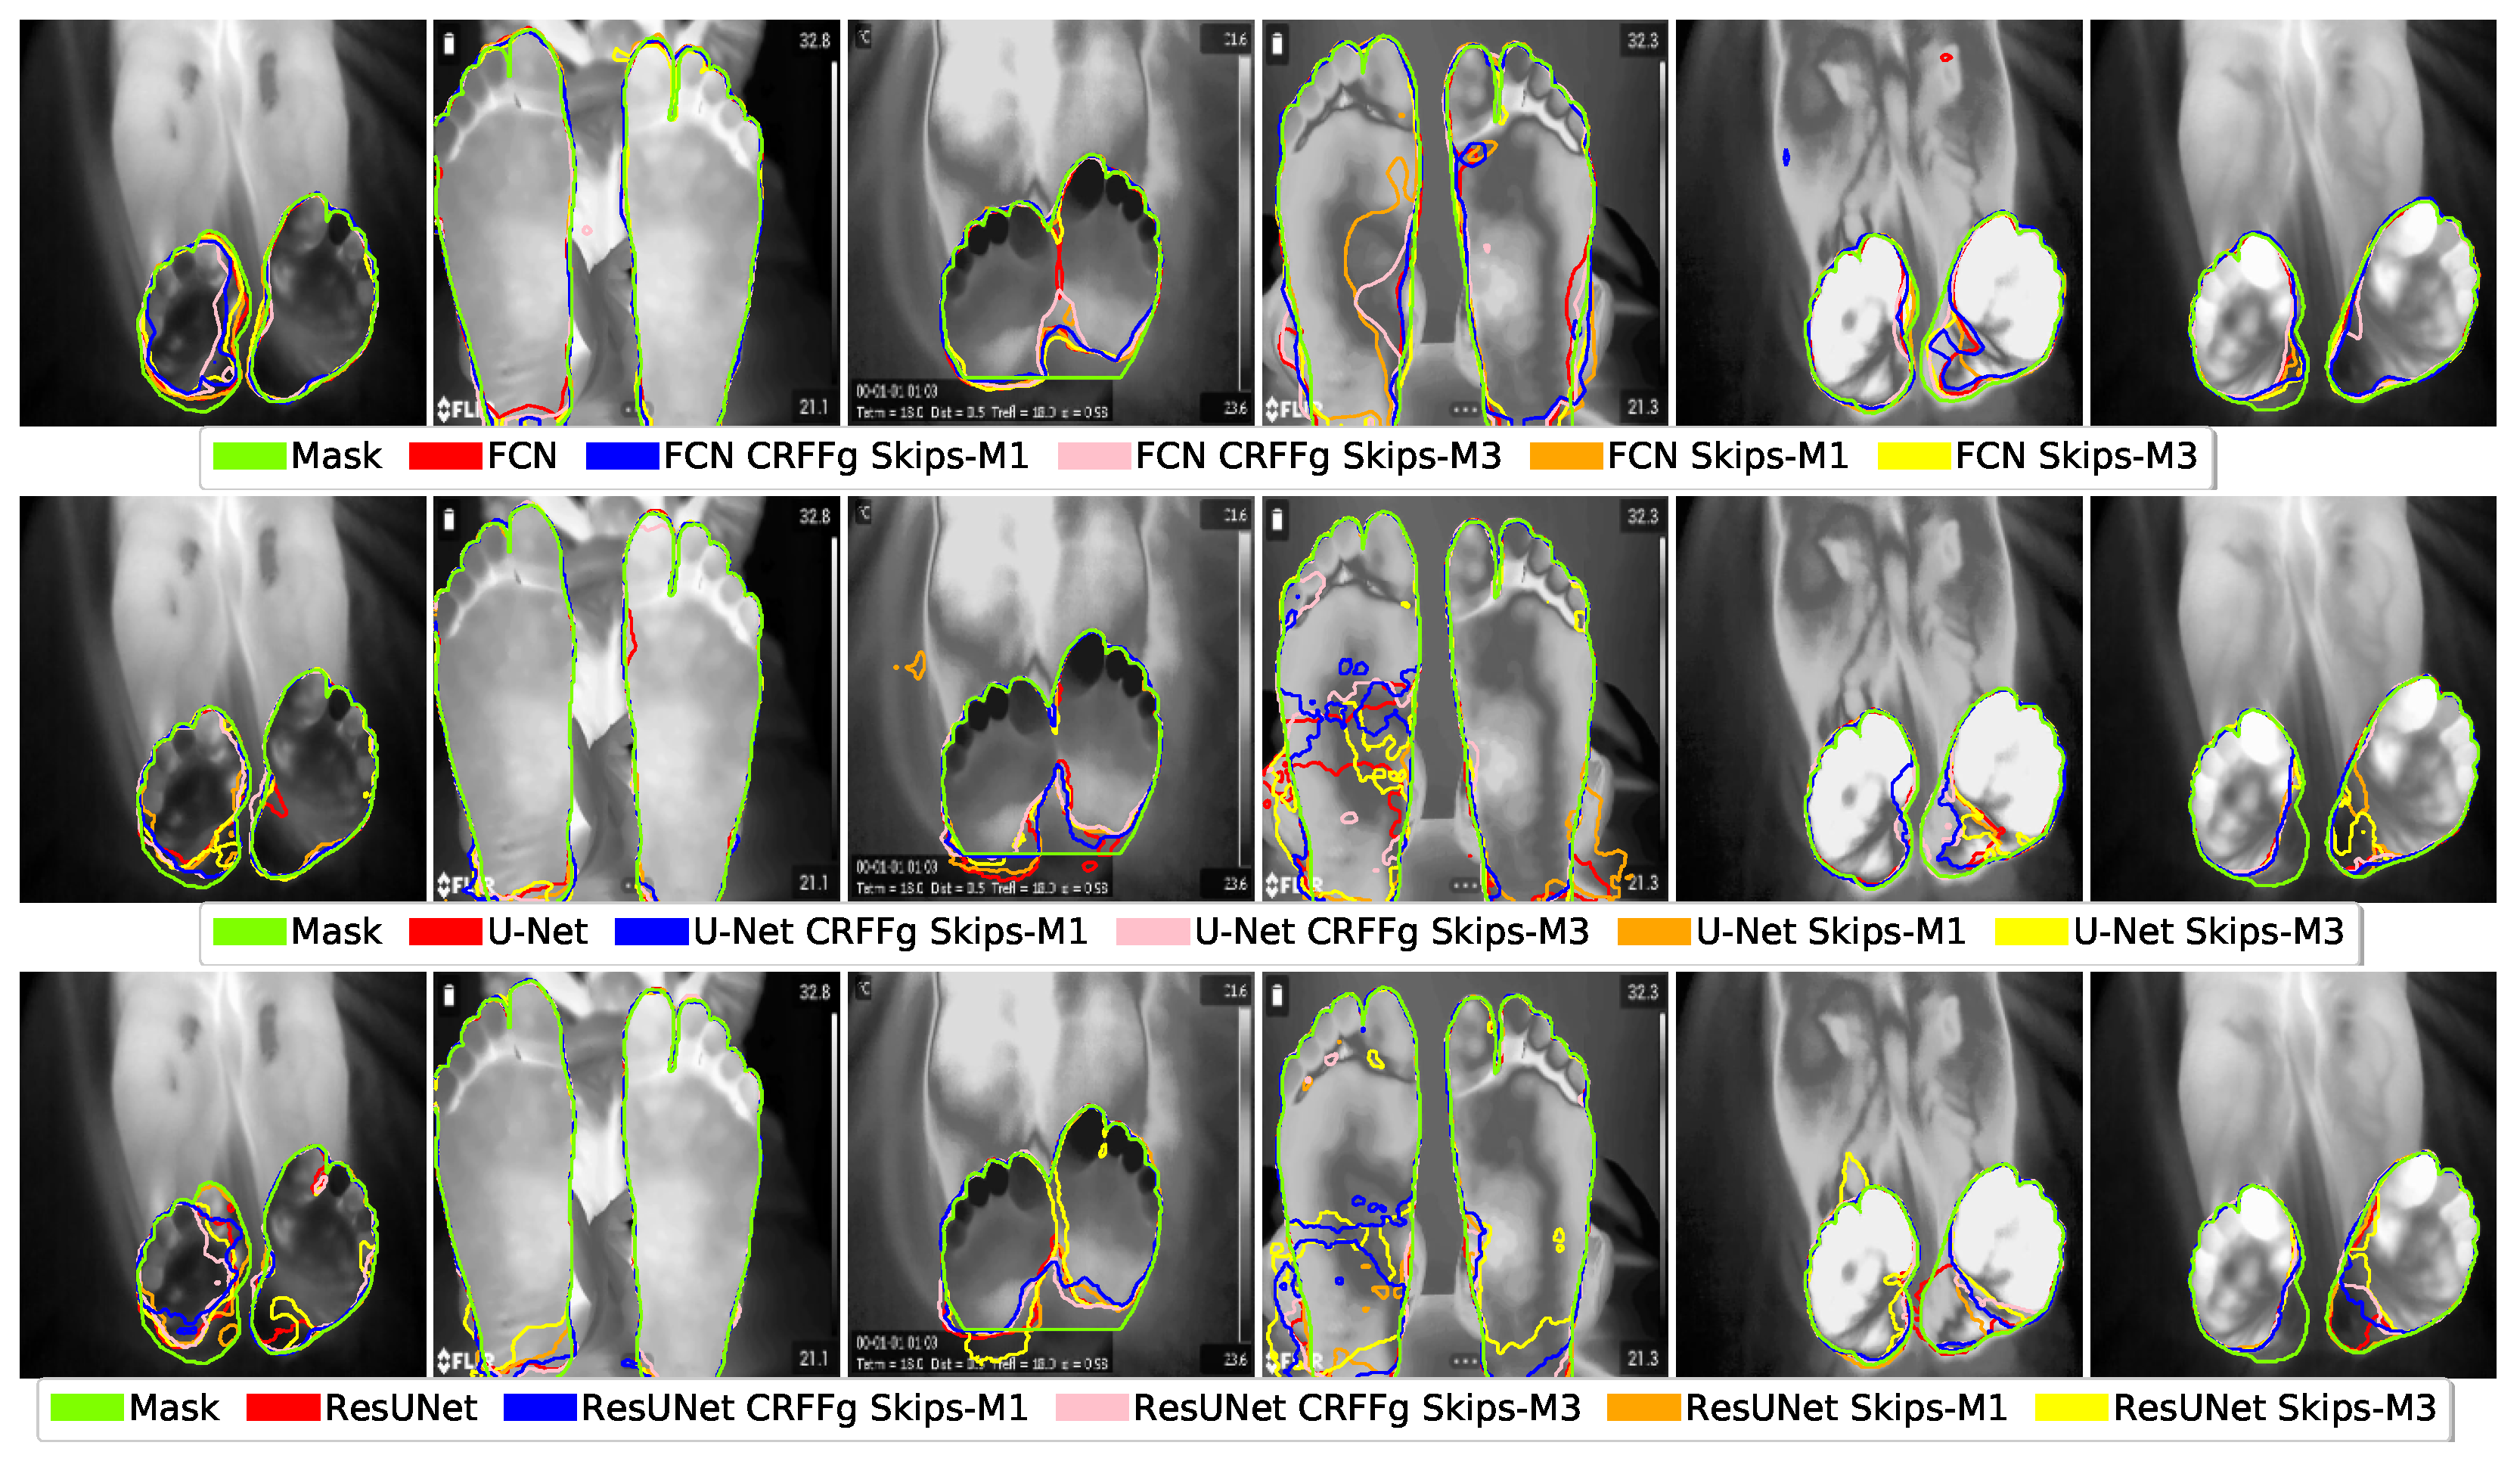
- Architecture Set-Up of tested Deep models for foot segmentation. Three DL architectures are contrasted using our CRFFg: U-Net, Fully Convolutional Network (FCN), and ResUNet.
- (iii)
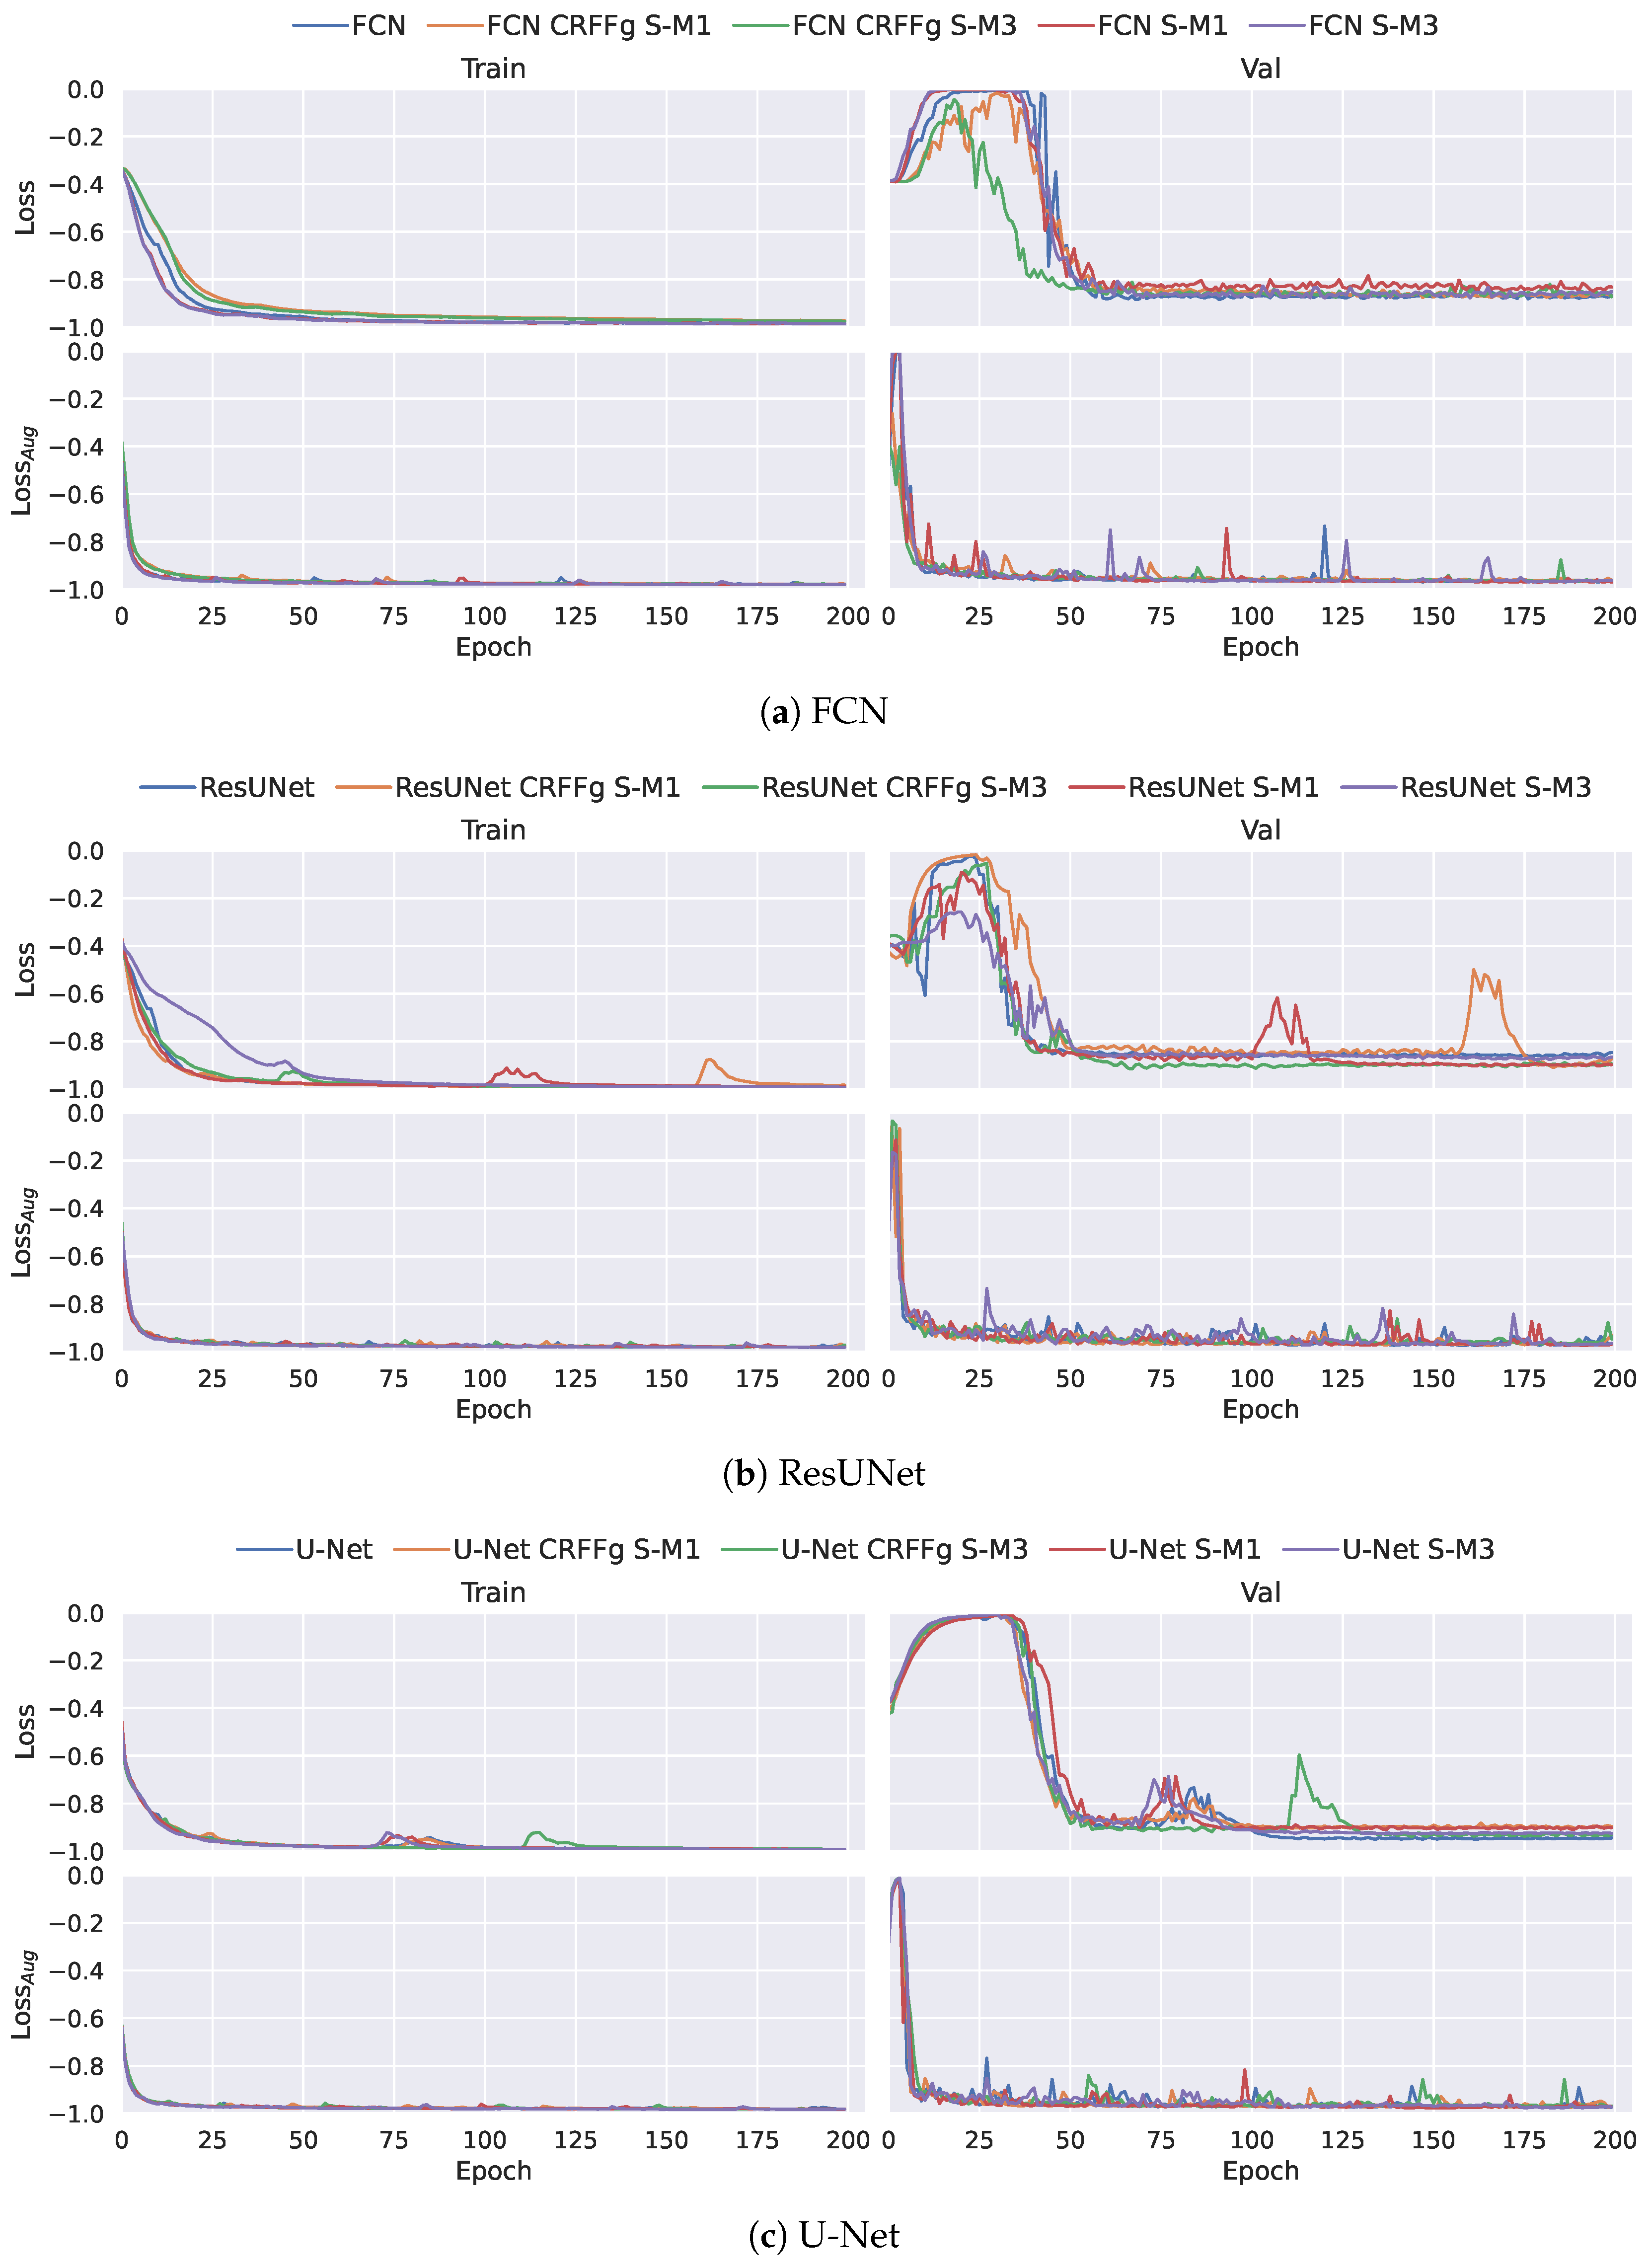
- Assessment of semantic segmentation accuracy. In this study, we examine how data augmentation affects the performance of tested deep learning algorithms.
- (iv)
- Relevance-maps extraction from our Layer-Wise weighted CAMs to provide interpretability.
3. Experimental Set-Up
3.1. Protocol for Infrared Thermal Data Acquisition: ThermalFeet Dataset
3.2. Set-Up of Compared Deep Learning Architectures
- –
- Fully Convolutional Network (FCN) [11]: This architecture is based on the VGG (Very Deep Convolutional Network) [49] model to recognize large-scale images. By using only convolutional layers, FCN models can deliver a segmentation map with pixel-level accuracy while reducing the computational burden.
- –
- U-Net [13]: This architecture unfolds into two parts: The encoder consists of convolutional layers to reduce the spatial image dimensions. The decoder holds layers to upsample the encoded features back to the original image size.
- –
- ResUNet [36]: This model extends the U-Net architecture by incorporating residual connections to improve performance. Deep learning training is improved by residual connections, which allow gradients to flow directly through the network.
3.3. Training Details and Quantitative Assessment
4. Results and Discussion
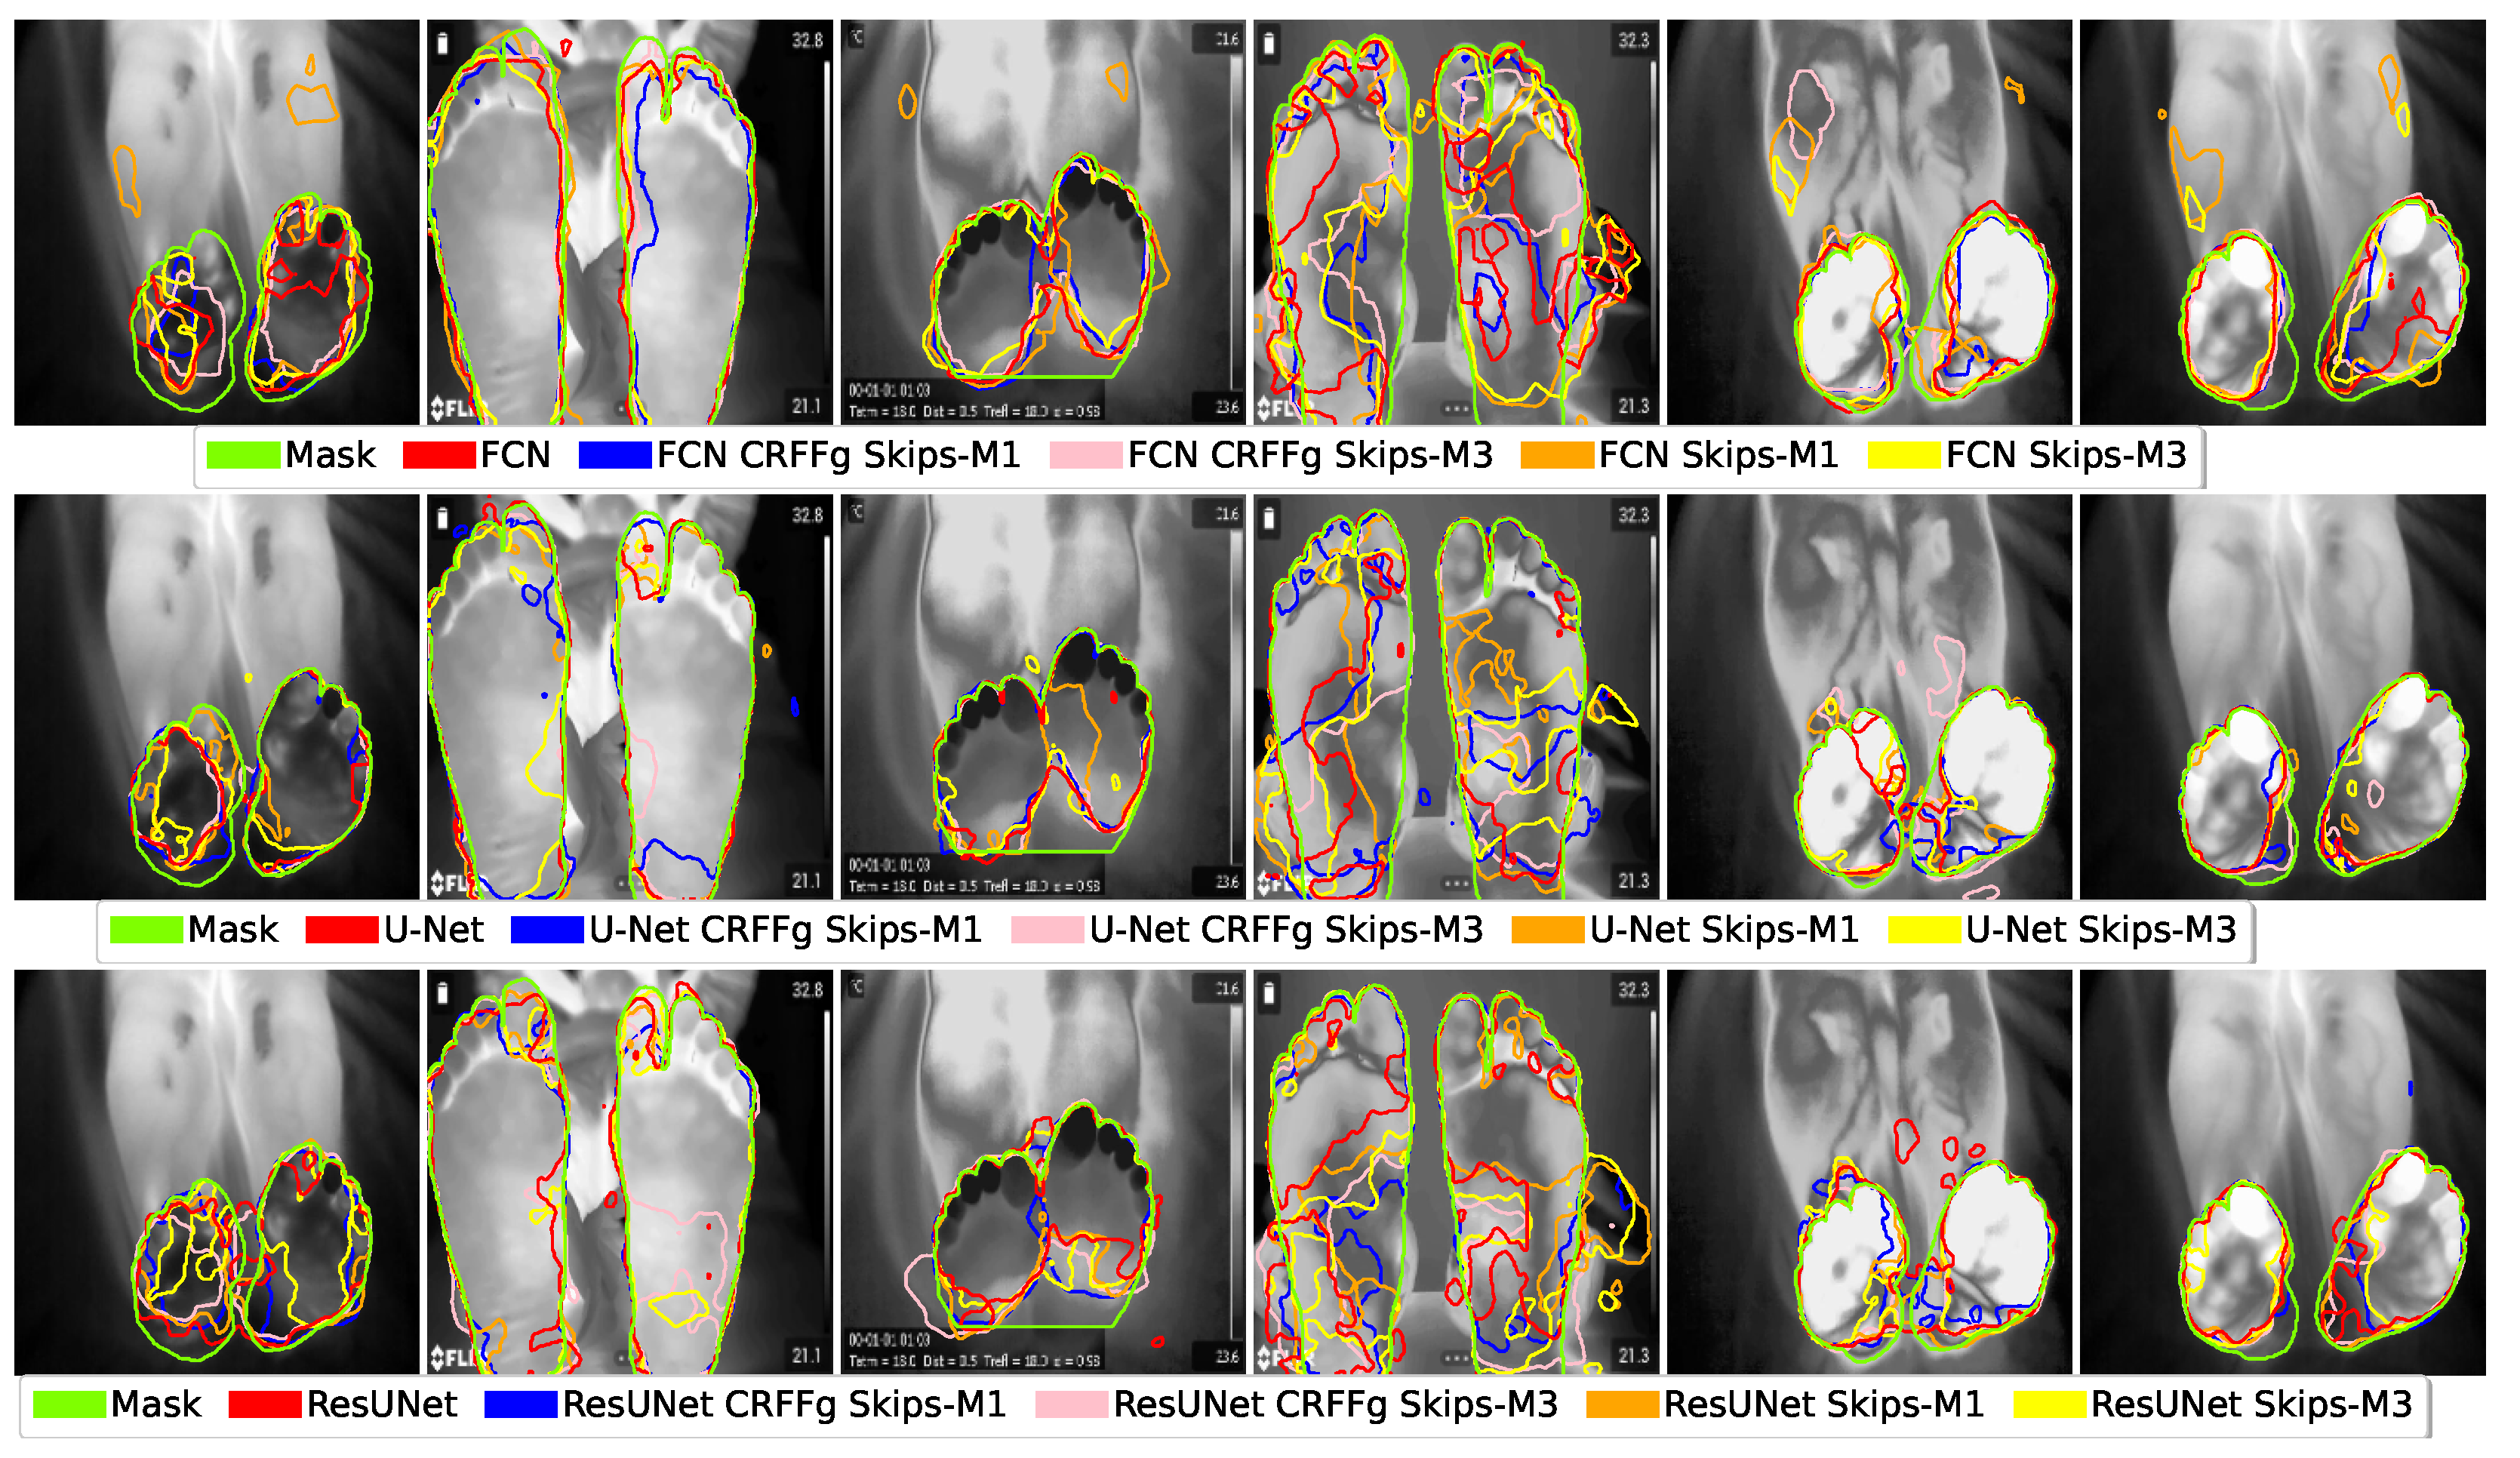
4.1. Visual Inspection Results
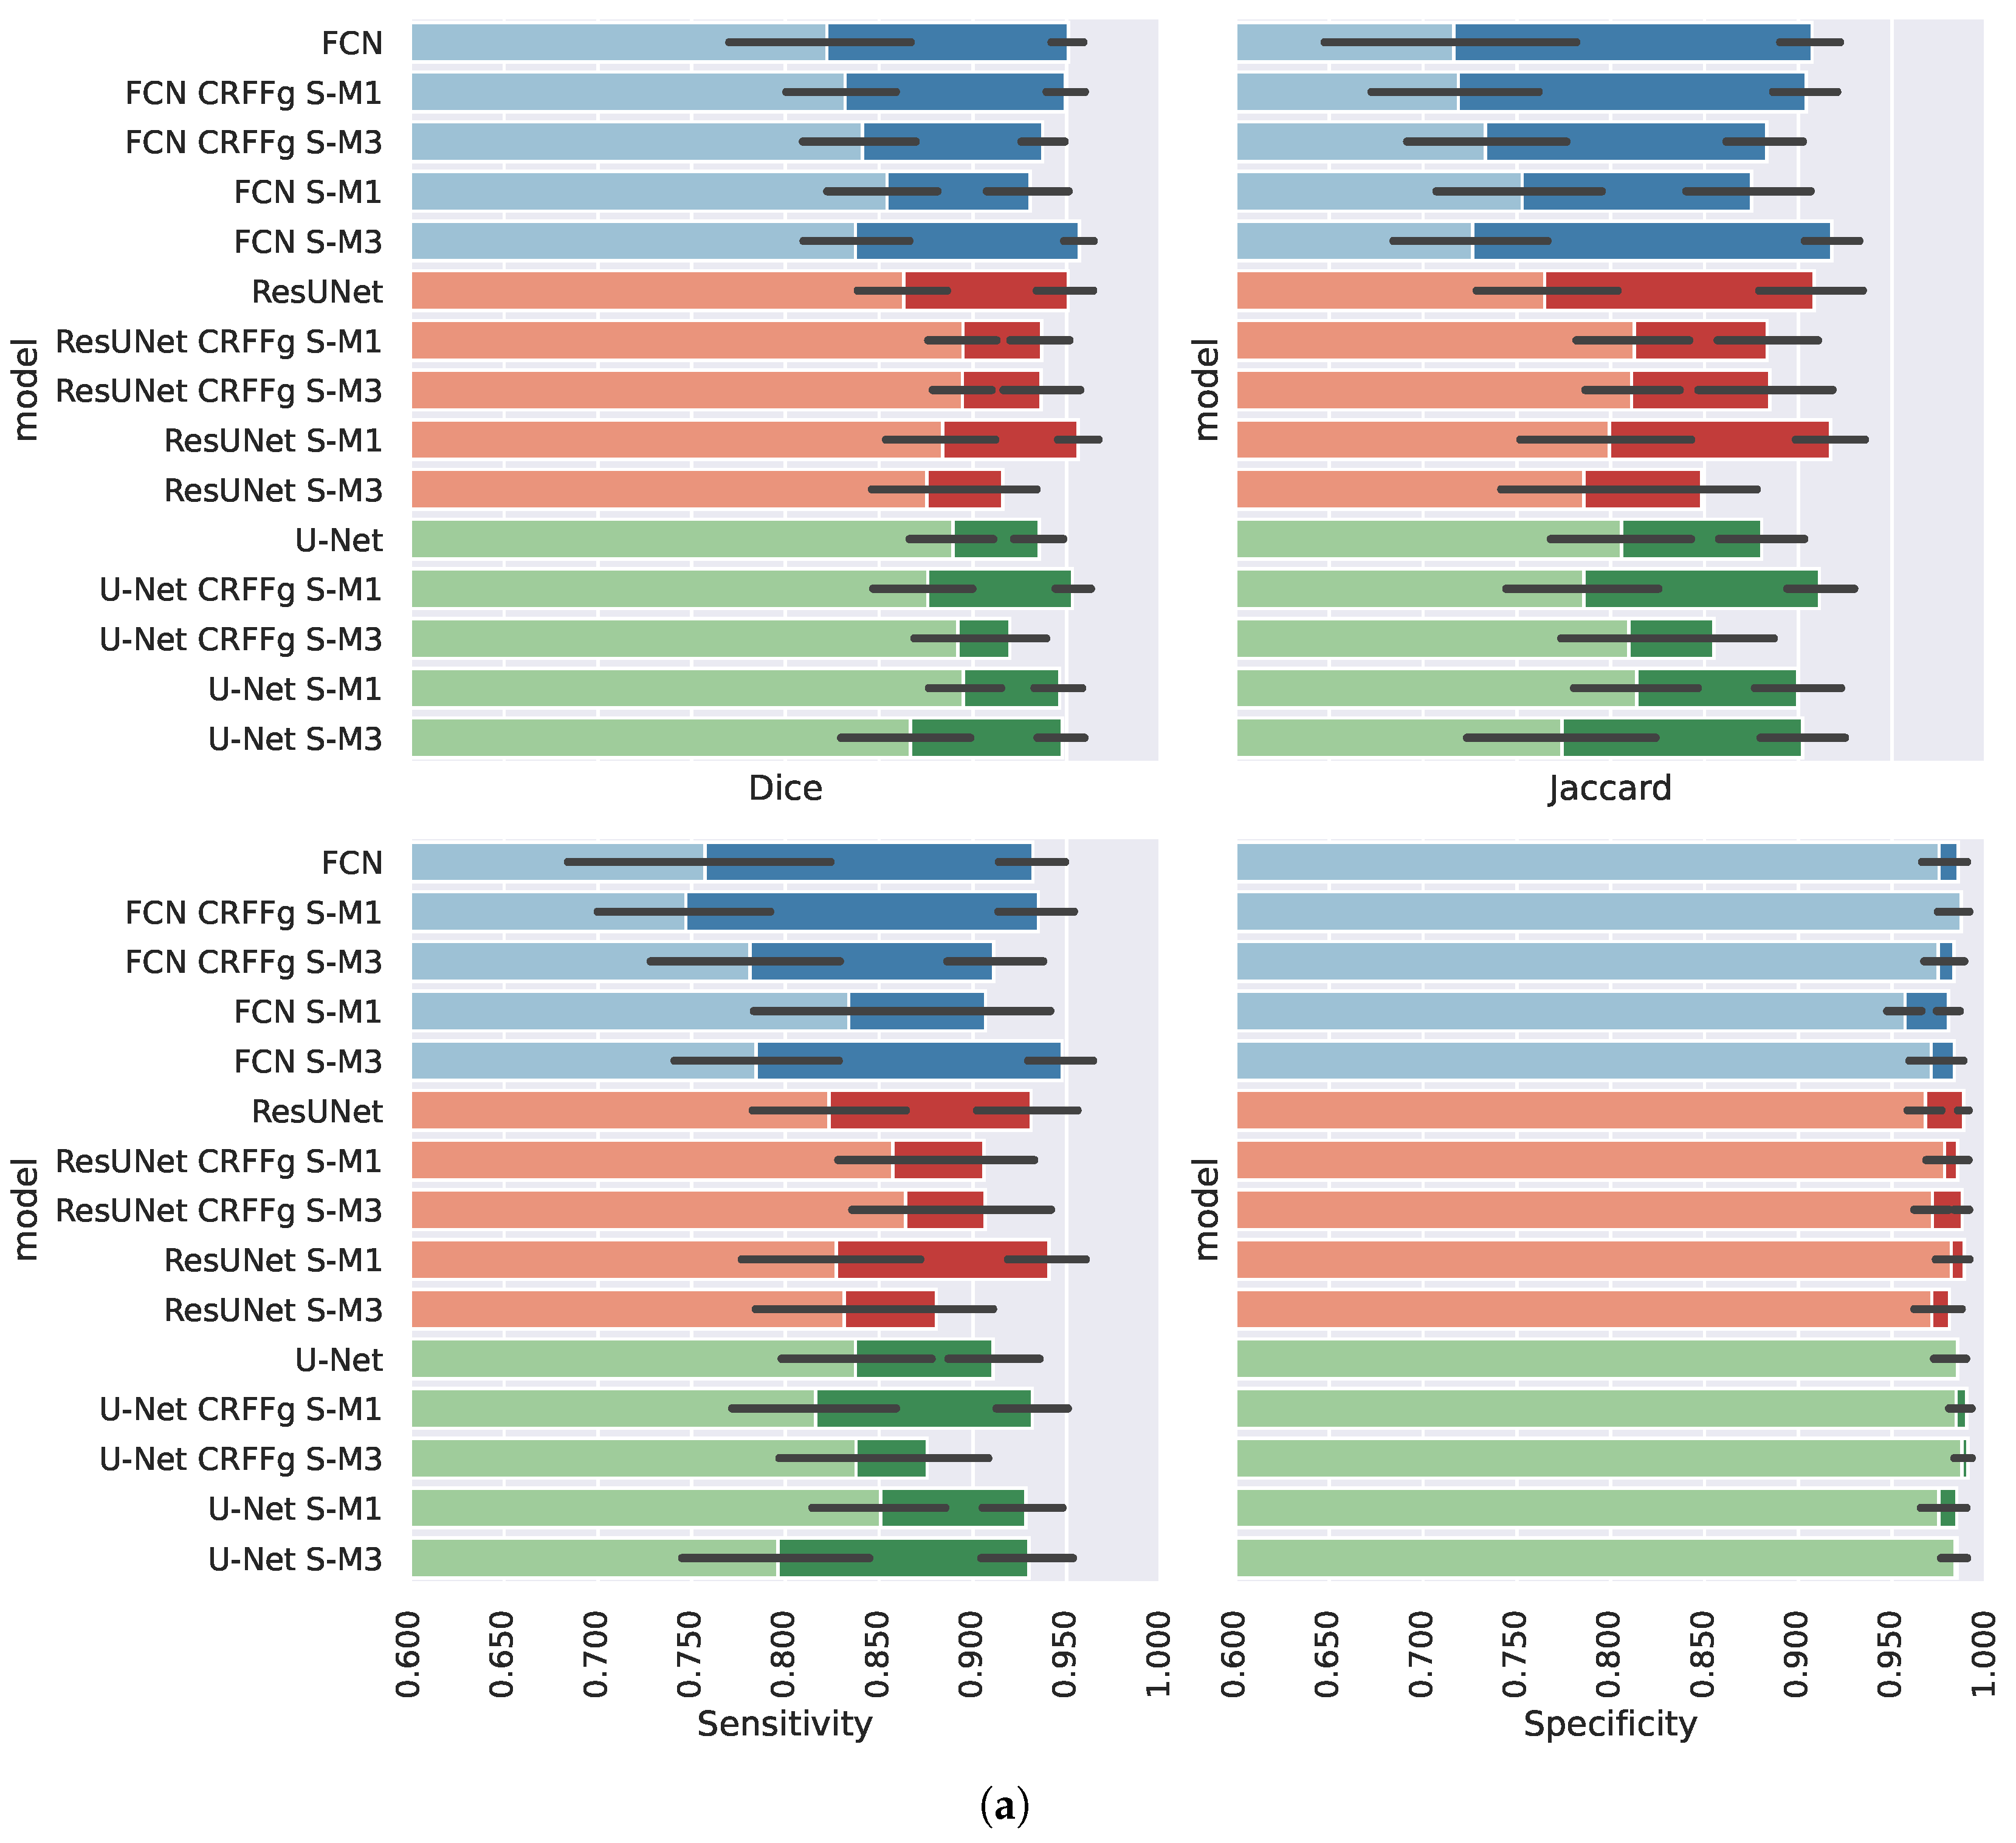
4.2. Method Comparison Results of Semantic Segmentation Performance
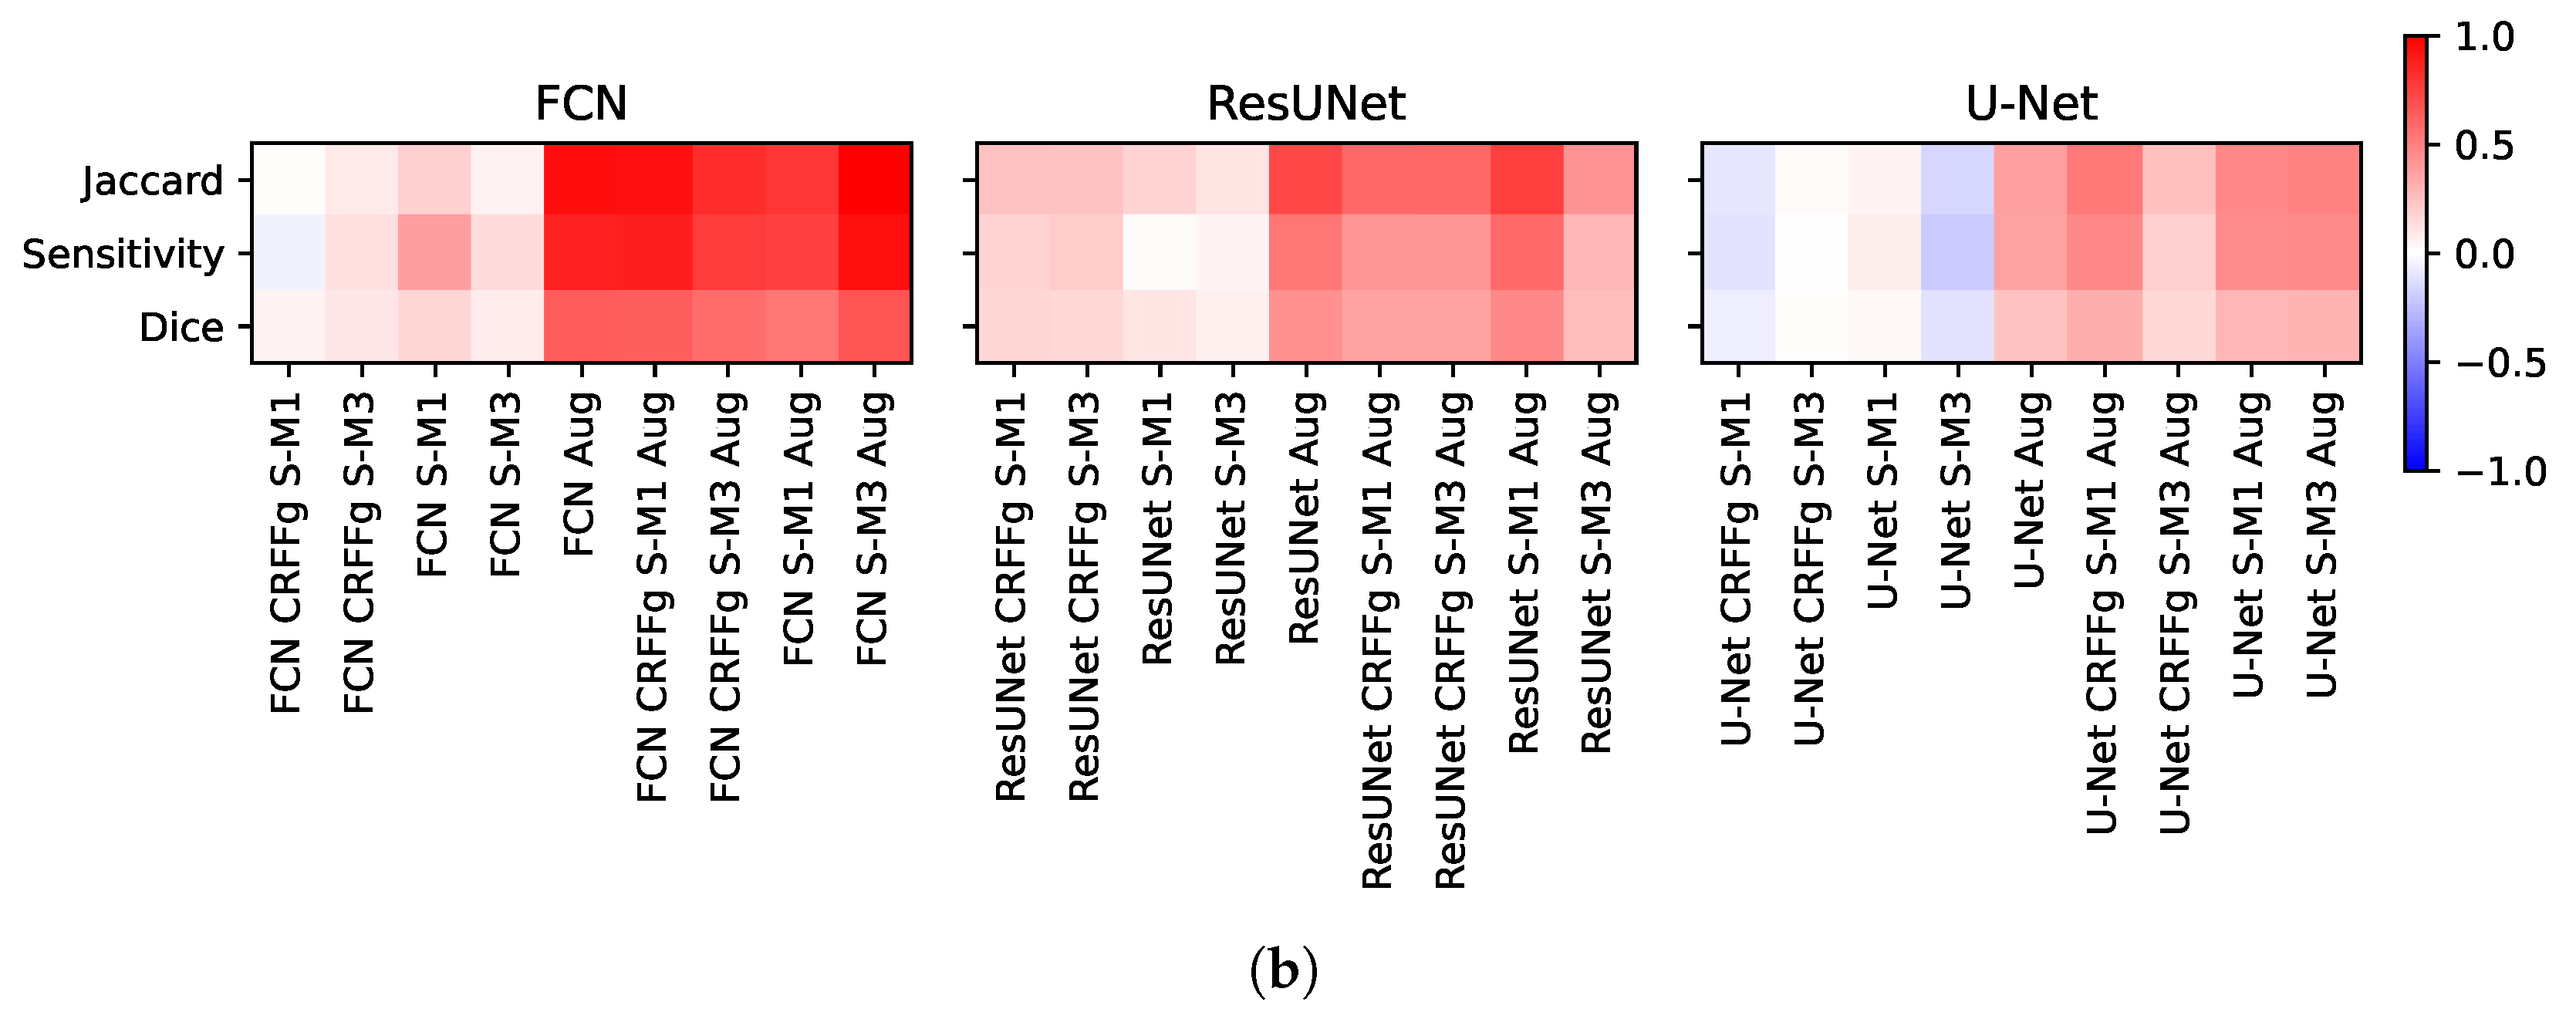
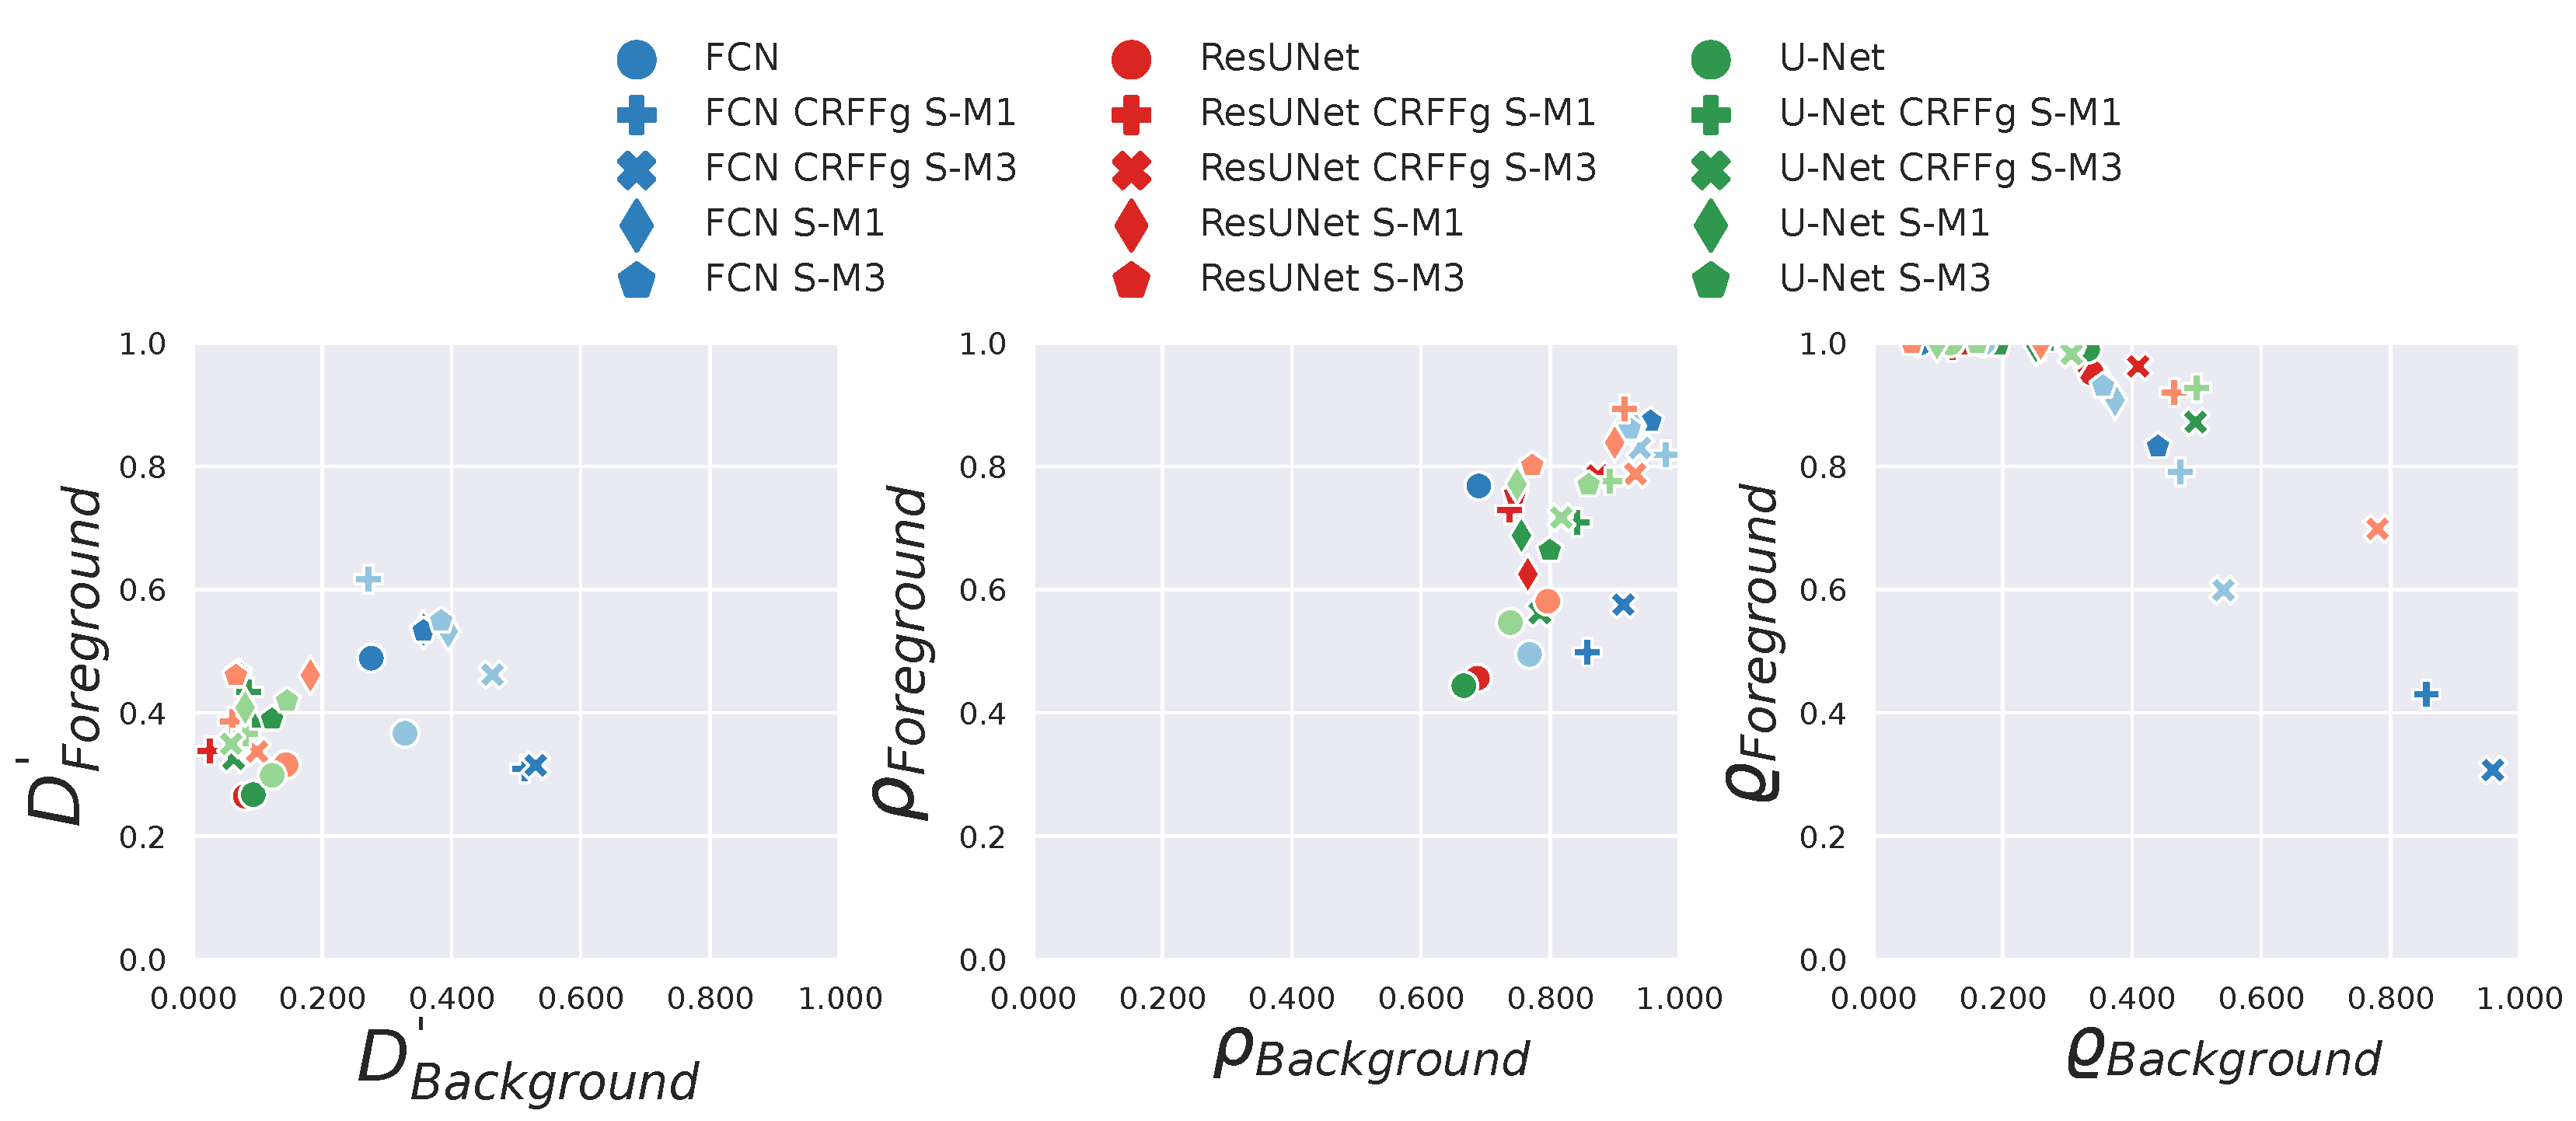
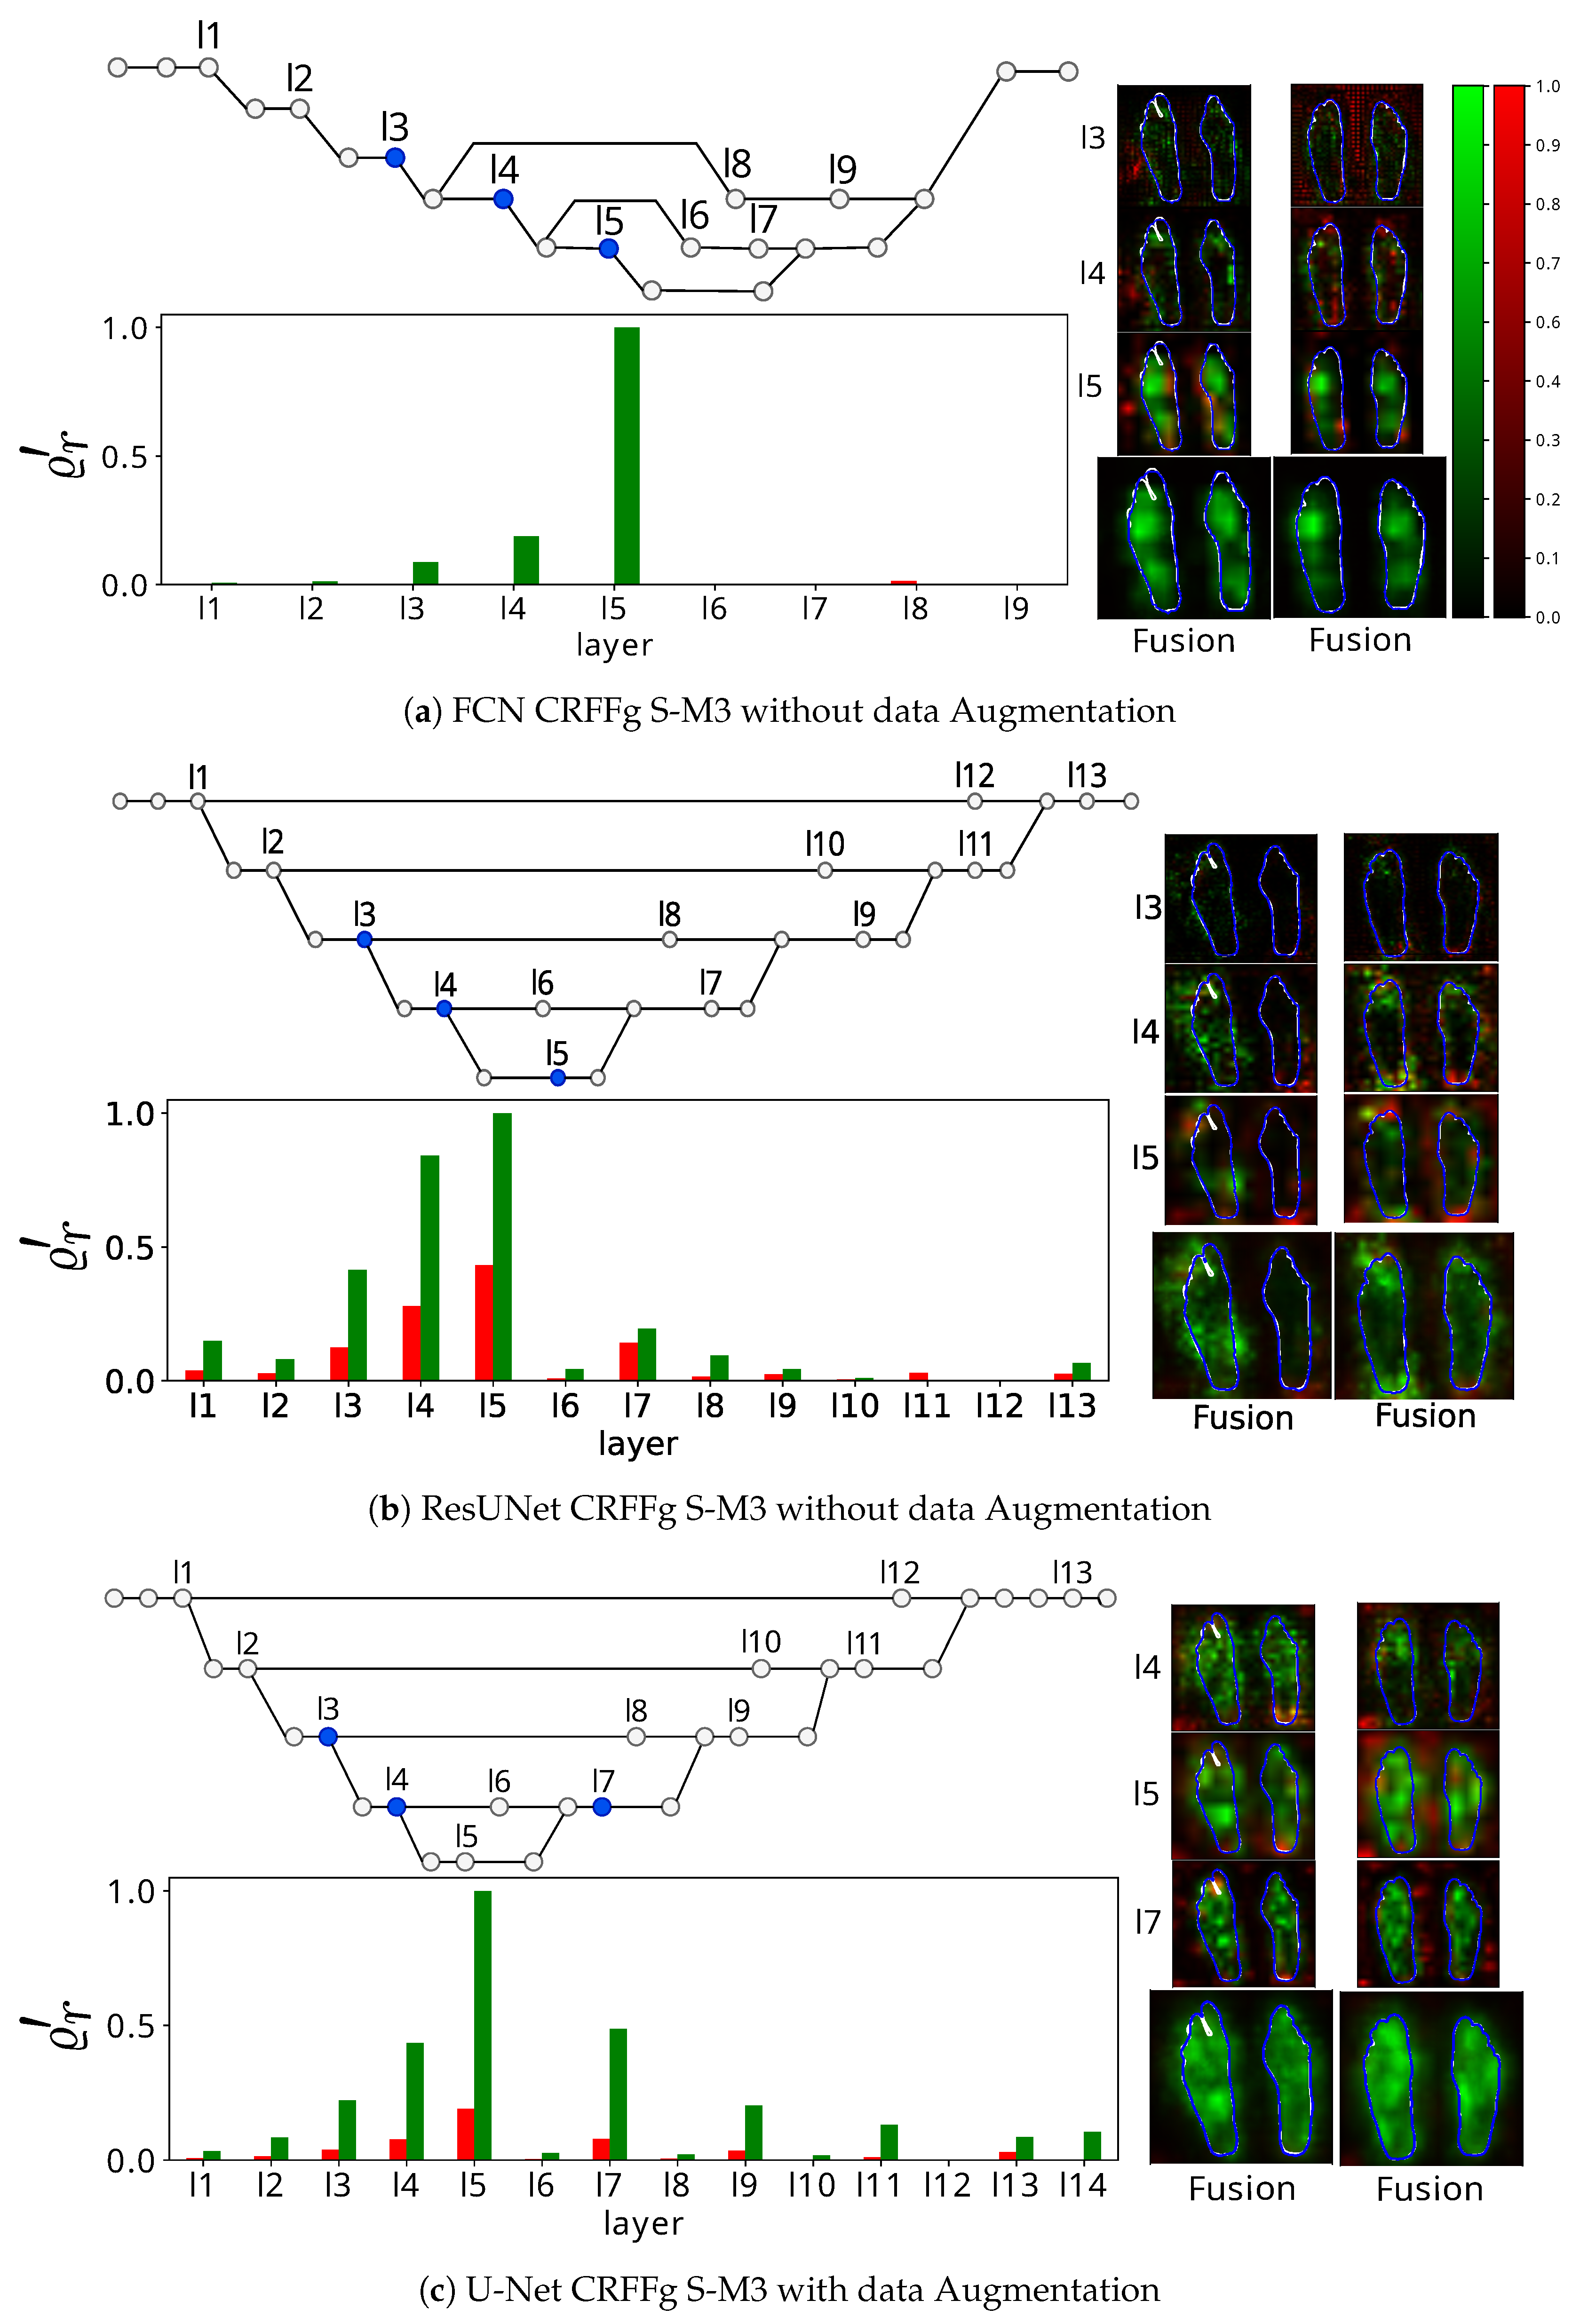
4.3. Results of Assessing the Proposed CAM-Based Relevance Analysis Measures
5. Concluding Remarks
Author Contributions
Funding
Institutional Review Board Statement
Informed Consent Statement
Data Availability Statement
Conflicts of Interest
Appendix A. Method Comparison from Absolute Semantic Segmentation Performances

| Approach | Measure | WODA | Rank | WDA | Rank |
|---|---|---|---|---|---|
| FCN | Dice | 0.9527 ± 0.0238 | 3.0 | 0.8646 ± 0.0624 | 10.0 |
| Jaccard | 0.9106 ± 0.0424 | 3.0 | 0.7668 ± 0.0969 | 10.0 | |
| Sensitivity | 0.9352 ± 0.0482 | 4.0 | 0.8260 ± 0.1098 | 6.0 | |
| Specificity | 0.9857 ± 0.0105 | 7.0 | 0.9697 ± 0.0186 | 13.0 | |
| FCN CRFFg S-M1 | Dice | 0.9530 ± 0.0257 | 2.0 | 0.8510 ± 0.0623 | 12.0 |
| Jaccard | 0.9113 ± 0.0456 | 2.0 | 0.7456 ± 0.0913 | 12.0 | |
| Sensitivity | 0.9424 ± 0.0526 | 3.0 | 0.8016 ± 0.0999 | 13.0 | |
| Specificity | 0.9810 ± 0.0158 | 12.0 | 0.9697 ± 0.0233 | 14.0 | |
| FCN CRFFg S-M3 | Dice | 0.9480 ± 0.0224 | 5.0 | 0.8346 ± 0.0916 | 15.0 |
| Jaccard | 0.9021 ± 0.0403 | 5.0 | 0.7262 ± 0.1284 | 15.0 | |
| Sensitivity | 0.9340 ± 0.0423 | 6.0 | 0.7771 ± 0.1325 | 15.0 | |
| Specificity | 0.9804 ± 0.0168 | 13.0 | 0.9714 ± 0.0246 | 10.0 | |
| FCN S-M1 | Dice | 0.9469 ± 0.0273 | 6.0 | 0.8421 ± 0.0870 | 14.0 |
| Jaccard | 0.9003 ± 0.0486 | 6.0 | 0.7367 ± 0.1254 | 14.0 | |
| Sensitivity | 0.9286 ± 0.0518 | 7.0 | 0.7867 ± 0.1422 | 14.0 | |
| Specificity | 0.9843 ± 0.0109 | 9.0 | 0.9714 ± 0.0207 | 9.0 | |
| FCN S-M3 | Dice | 0.9519 ± 0.0281 | 4.0 | 0.8470 ± 0.0737 | 13.0 |
| Jaccard | 0.9096 ± 0.0499 | 4.0 | 0.7414 ± 0.1070 | 13.0 | |
| Sensitivity | 0.9341 ± 0.0543 | 5.0 | 0.8160 ± 0.1152 | 9.0 | |
| Specificity | 0.9865 ± 0.0107 | 6.0 | 0.9604 ± 0.0300 | 15.0 | |
| ResUNet | Dice | 0.9348 ± 0.0502 | 11.0 | 0.8569 ± 0.0779 | 11.0 |
| Jaccard | 0.8816 ± 0.0868 | 11.0 | 0.7575 ± 0.1152 | 11.0 | |
| Sensitivity | 0.9029 ± 0.0825 | 12.0 | 0.8152 ± 0.1316 | 11.0 | |
| Specificity | 0.9896 ± 0.0067 | 2.0 | 0.9712 ± 0.0180 | 12.0 | |
| ResUNet CRFFg S-M1 | Dice | 0.9456 ± 0.0317 | 7.0 | 0.8851 ± 0.0449 | 4.0 |
| Jaccard | 0.8984 ± 0.0560 | 7.0 | 0.7968 ± 0.0709 | 4.0 | |
| Sensitivity | 0.9472 ± 0.0540 | 1.0 | 0.8283 ± 0.0853 | 5.0 | |
| Specificity | 0.9725 ± 0.0230 | 14.0 | 0.9841 ± 0.0123 | 3.0 | |
| ResUNet CRFFg S-M3 | Dice | 0.9111 ± 0.0602 | 15.0 | 0.8969 ± 0.0444 | 1.0 |
| Jaccard | 0.8420 ± 0.0951 | 15.0 | 0.8160 ± 0.0737 | 1.0 | |
| Sensitivity | 0.9075 ± 0.0607 | 11.0 | 0.8675 ± 0.0803 | 1.0 | |
| Specificity | 0.9663 ± 0.0346 | 15.0 | 0.9712 ± 0.0244 | 11.0 | |
| ResUNet S-M1 | Dice | 0.9558 ± 0.0279 | 1.0 | 0.8865 ± 0.0676 | 3.0 |
| Jaccard | 0.9167 ± 0.0498 | 1.0 | 0.8026 ± 0.1061 | 3.0 | |
| Sensitivity | 0.9459 ± 0.0482 | 2.0 | 0.8403 ± 0.1123 | 2.0 | |
| Specificity | 0.9831 ± 0.0152 | 10.0 | 0.9750 ± 0.0287 | 8.0 | |
| ResUNet S-M3 | Dice | 0.9237 ± 0.0411 | 14.0 | 0.8677 ± 0.0894 | 9.0 |
| Jaccard | 0.8610 ± 0.0713 | 14.0 | 0.7763 ± 0.1281 | 9.0 | |
| Sensitivity | 0.8875 ± 0.0756 | 14.0 | 0.8179 ± 0.1333 | 8.0 | |
| Specificity | 0.9846 ± 0.0128 | 8.0 | 0.9755 ± 0.0217 | 7.0 | |
| U-Net | Dice | 0.9371 ± 0.0312 | 10.0 | 0.8713 ± 0.0756 | 8.0 |
| Jaccard | 0.8832 ± 0.0551 | 10.0 | 0.7796 ± 0.1145 | 8.0 | |
| Sensitivity | 0.9120 ± 0.0571 | 10.0 | 0.8107 ± 0.1248 | 12.0 | |
| Specificity | 0.9811 ± 0.0199 | 11.0 | 0.9847 ± 0.0130 | 2.0 | |
| U-Net CRFFg S-M1 | Dice | 0.9448 ± 0.0297 | 8.0 | 0.8827 ± 0.0617 | 5.0 |
| Jaccard | 0.8969 ± 0.0528 | 8.0 | 0.7954 ± 0.0965 | 5.0 | |
| Sensitivity | 0.9160 ± 0.0561 | 9.0 | 0.8383 ± 0.1062 | 4.0 | |
| Specificity | 0.9902 ± 0.0057 | 1.0 | 0.9780 ± 0.0124 | 5.0 | |
| U-Net CRFFg S-M3 | Dice | 0.9252 ± 0.0404 | 13.0 | 0.8821 ± 0.0645 | 6.0 |
| Jaccard | 0.8634 ± 0.0694 | 13.0 | 0.7948 ± 0.1004 | 6.0 | |
| Sensitivity | 0.8831 ± 0.0730 | 15.0 | 0.8231 ± 0.1110 | 7.0 | |
| Specificity | 0.9893 ± 0.0066 | 3.0 | 0.9873 ± 0.0088 | 1.0 | |
| U-Net S-M1 | Dice | 0.9400 ± 0.0364 | 9.0 | 0.8898 ± 0.0536 | 2.0 |
| Jaccard | 0.8890 ± 0.0635 | 9.0 | 0.8056 ± 0.0861 | 2.0 | |
| Sensitivity | 0.9162 ± 0.0619 | 8.0 | 0.8384 ± 0.0904 | 3.0 | |
| Specificity | 0.9866 ± 0.0086 | 5.0 | 0.9777 ± 0.0208 | 6.0 | |
| U-Net S-M3 | Dice | 0.9293 ± 0.0419 | 12.0 | 0.8767 ± 0.0772 | 7.0 |
| Jaccard | 0.8707 ± 0.0728 | 12.0 | 0.7883 ± 0.1152 | 7.0 | |
| Sensitivity | 0.8934 ± 0.0792 | 13.0 | 0.8152 ± 0.1181 | 10.0 | |
| Specificity | 0.9878 ± 0.0098 | 4.0 | 0.9805 ± 0.0189 | 4.0 |
References
- Brown, D.T.; Wildsmith, J.A.W.; Covino, B.G.; Scott, D.B. Effect of Baricity on Spinal Anaesthesia with Amethocaine. BJA Br. J. Anaesth. 1980, 52, 589–596. [Google Scholar] [CrossRef] [PubMed]
- McCombe, K.; Bogod, D. Regional anaesthesia: Risk, consent and complications. Anaesthesia 2021, 76, 18–26. [Google Scholar] [CrossRef] [PubMed]
- Chae, Y.; Park, H.J.; Lee, I.S. Pain modalities in the body and brain: Current knowledge and future perspectives. Neurosci. Biobehav. Rev. 2022, 139, 104744. [Google Scholar] [CrossRef] [PubMed]
- Curatolo, M.; Petersen-Felix, S.; Arendt-Nielsen, L. Assessment of regional analgesia in clinical practice and research. Br. Med Bull. 2005, 71, 61–76. [Google Scholar] [CrossRef]
- Bruins, A.; Kistemaker, K.; Boom, A.; Klaessens, J.; Verdaasdonk, R.; Boer, C. Thermographic skin temperature measurement compared with cold sensation in predicting the efficacy and distribution of epidural anesthesia. J. Clin. Monit. Comput. 2018, 32, 335–341. [Google Scholar] [CrossRef] [PubMed]
- Haren, F.; Kadic, L.; Driessen, J. Skin temperature measured by infrared thermography after ultrasound-guided blockade of the sciatic nerve. Acta Anaesthesiol. Scand. 2013, 57. [Google Scholar] [CrossRef]
- Stevens, M.F.; Werdehausen, R.; Hermanns, H.; Lipfert, P. Skin temperature during regional anesthesia of the lower extremity. Anesth. Analg. 2006, 102, 1247–1251. [Google Scholar] [CrossRef]
- Werdehausen, R.; Braun, S.; Hermanns, H.; Freynhagen, R.; Lipfert, P.; Stevens, M.F. Uniform Distribution of Skin-Temperature Increase After Different Regional-Anesthesia Techniques of the Lower Extremity. Reg. Anesth. Pain Med. 2007, 32, 73–78. [Google Scholar] [CrossRef]
- Zhang, L.; Nan, Q.; Bian, S.; Liu, T.; Xu, Z. Real-time segmentation method of billet infrared image based on multi-scale feature fusion. Sci. Rep. 2022, 12, 6879. [Google Scholar] [CrossRef]
- Kütük, Z.; Algan, G. Semantic Segmentation for Thermal Images: A Comparative Survey. In Proceedings of the IEEE/CVF Conference on Computer Vision and Pattern Recognition (CVPR) Workshops, New Orleans, LA, USA, 19–20 June 2022. [Google Scholar] [CrossRef]
- Long, J.; Shelhamer, E.; Darrell, T. Fully Convolutional Networks for Semantic Segmentation. arXiv 2014, arXiv:1411.4038. [Google Scholar] [CrossRef]
- Bi, L.; Kim, J.; Kumar, A.; Fulham, M.J.; Feng, D. Stacked fully convolutional networks with multi-channel learning: Application to medical image segmentation. Vis. Comput. 2017, 33, 1061–1071. [Google Scholar] [CrossRef]
- Ronneberger, O.; Fischer, P.; Brox, T. U-Net: Convolutional Networks for Biomedical Image Segmentation. arXiv 2015, arXiv:1505.04597. [Google Scholar] [CrossRef]
- Kumar, V.; Webb, J.M.; Gregory, A.; Denis, M.; Meixner, D.D.; Bayat, M.; Whaley, D.H.; Fatemi, M.; Alizad, A. Automated and real-time segmentation of suspicious breast masses using convolutional neural network. PLoS ONE 2018, 13, e0195816. [Google Scholar] [CrossRef] [PubMed]
- Zhou, Z.; Siddiquee, M.M.R.; Tajbakhsh, N.; Liang, J. UNet++: A Nested U-Net Architecture for Medical Image Segmentation. arXiv 2018, arXiv:1807.10165. [Google Scholar] [CrossRef]
- Badrinarayanan, V.; Kendall, A.; Cipolla, R. SegNet: A Deep Convolutional Encoder–decoder Architecture for Image Segmentation. arXiv 2016, arXiv:1511.00561. [Google Scholar] [CrossRef]
- He, K.; Gkioxari, G.; Dollár, P.; Girshick, R. Mask R-CNN. arXiv 2018, arXiv:1703.06870. [Google Scholar] [CrossRef]
- Ren, S.; He, K.; Girshick, R.; Sun, J. Faster R-CNN: Towards Real-Time Object Detection with Region Proposal Networks. arXiv 2016, arXiv:1506.01497. [Google Scholar] [CrossRef]
- Zhao, H.; Shi, J.; Qi, X.; Wang, X.; Jia, J. Pyramid Scene Parsing Network. arXiv 2017, arXiv:1612.01105. [Google Scholar] [CrossRef]
- Arteaga-Marrero, N.; Hernández, A.; Villa, E.; González-Pérez, S.; Luque, C.; Ruiz-Alzola, J. Segmentation Approaches for Diabetic Foot Disorders. Sensors 2021, 21, 934. [Google Scholar] [CrossRef]
- Fischler, M.A.; Bolles, R.C. Random Sample Consensus: A Paradigm for Model Fitting with Applications to Image Analysis and Automated Cartography. Commun. ACM 1981, 24, 381–395. [Google Scholar] [CrossRef]
- Bouallal, D.; Bougrine, A.; Douzi, H.; Harba, R.; Canals, R.; Vilcahuaman, L.; Arbanil, H. Segmentation of plantar foot thermal images: Application to diabetic foot diagnosis. In Proceedings of the 2020 International Conference on Systems, Signals and Image Processing (IWSSIP), Niteroi, Brazil, 1–3 July 2020; pp. 116–121. [Google Scholar] [CrossRef]
- Bougrine, A.; Harba, R.; Canals, R.; Ledee, R.; Jabloun, M. On the segmentation of plantar foot thermal images with deep learning. In Proceedings of the 2019 27th European Signal Processing Conference (EUSIPCO), A Coruna, Spain, 2–6 September 2019. [Google Scholar] [CrossRef]
- Mejia-Zuluaga, R.; Aguirre-Arango, J.C.; Collazos-Huertas, D.; Daza-Castillo, J.; Valencia-Marulanda, N.; Calderón-Marulanda, M.; Aguirre-Ospina, Ó.; Alvarez-Meza, A.; Castellanos-Dominguez, G. Deep Learning Semantic Segmentation of Feet Using Infrared Thermal Images. In Proceedings of the Advances in Artificial Intelligence—IBERAMIA, Cartagena de Indias, Colombia, 23–25 November 2022; Bicharra Garcia, A.C., Ferro, M., Rodríguez Ribón, J.C., Eds.; Springer International Publishing: Cham, Switzerland, 2022; pp. 342–352. [Google Scholar]
- Dosovitskiy, A.; Beyer, L.; Kolesnikov, A.; Weissenborn, D.; Zhai, X.; Unterthiner, T.; Dehghani, M.; Minderer, M.; Heigold, G.; Gelly, S.; et al. An Image is Worth 16x16 Words: Transformers for Image Recognition at Scale. arXiv 2020, arXiv:2010.11929. [Google Scholar] [CrossRef]
- Chen, J.; Lu, Y.; Yu, Q.; Luo, X.; Adeli, E.; Wang, Y.; Lu, L.; Yuille, A.L.; Zhou, Y. TransUNet: Transformers Make Strong Encoders for Medical Image Segmentation. arXiv 2021, arXiv:2102.04306. [Google Scholar] [CrossRef]
- Cao, H.; Wang, Y.; Chen, J.; Jiang, D.; Zhang, X.; Tian, Q.; Wang, M. Swin-Unet: Unet-like Pure Transformer for Medical Image Segmentation. In Computer Vision—ECCV 2022 Workshops; Springer: Cham, Switzerland, 2021; pp. 205–218. [Google Scholar] [CrossRef]
- Zhang, Y.; Liu, H.; Hu, Q. TransFuse: Fusing Transformers and CNNs for Medical Image Segmentation. In Medical Image Computing and Computer Assisted Intervention—MICCAI 2021; Lecture Notes in Computer Science; Springer: Cham, Switzerland, 2021; pp. 14–24. [Google Scholar] [CrossRef]
- Li, S.; Sui, X.; Luo, X.; Xu, X.; Liu, Y.; Goh, R. Medical Image Segmentation Using Squeeze-and-Expansion Transformers. Ijcai Int. Jt. Conf. Artif. Intell. 2021, 807–815. [Google Scholar] [CrossRef]
- Luo, X.; Hu, M.; Song, T.; Wang, G.; Zhang, S. Semi-Supervised Medical Image Segmentation via Cross Teaching between CNN and Transformer. In Proceedings of the International Conference on Medical Imaging with Deep Learning, Zurich, Germany, 6–8 July 2022; pp. 820–833. [Google Scholar]
- Kirillov, A.; Mintun, E.; Ravi, N.; Mao, H.; Rolland, C.; Gustafson, L.; Xiao, T.; Whitehead, S.; Berg, A.C.; Lo, W.Y.; et al. Segment Anything. arXiv 2023, arXiv:2304.02643. [Google Scholar] [CrossRef]
- Ruan, B.K.; Shuai, H.H.; Cheng, W.H. Vision Transformers: State of the Art and Research Challenges. arXiv 2022, arXiv:2207.03041. [Google Scholar] [CrossRef]
- Karimi, D.; Warfield, S.K.; Gholipour, A. Critical Assessment of Transfer Learning for Medical Image Segmentation with Fully Convolutional Neural Networks. arXiv 2022, arXiv:2006.00356. [Google Scholar] [CrossRef]
- Alzubaidi, L.; Fadhel, M.A.; Al-Shamma, O.; Zhang, J.; Santamaría, J.; Duan, Y.; R. Oleiwi, S. Towards a better understanding of transfer learning for medical imaging: A case study. Appl. Sci. 2020, 10, 4523. [Google Scholar] [CrossRef]
- Guan, H.; Liu, M. Domain Adaptation for Medical Image Analysis: A Survey. IEEE Trans. Biomed. Eng. 2022, 69, 1173–1185. [Google Scholar] [CrossRef]
- Anas, E.M.A.; Nouranian, S.; Mahdavi, S.S.; Spadinger, I.; Morris, W.J.; Salcudean, S.E.; Mousavi, P.; Abolmaesumi, P. Clinical Target-Volume Delineation in Prostate Brachytherapy Using Residual Neural Networks. In Proceedings of the Medical Image Computing and Computer Assisted Intervention—MICCAI 2017, Quebec City, QC, Canada, 11–13 September 2017; Descoteaux, M., Maier-Hein, L., Franz, A., Jannin, P., Collins, D.L., Duchesne, S., Eds.; Springer International Publishing: Cham, Switzerland, 2017; pp. 365–373. [Google Scholar]
- Zhou, B.; Khosla, A.; Lapedriza, A.; Oliva, A.; Torralba, A. Learning Deep Features for Discriminative Localization. arXiv 2015, arXiv:1512.04150. [Google Scholar] [CrossRef]
- Zhang, A.; Lipton, Z.C.; Li, M.; Smola, A.J. Dive into deep learning. arXiv Prepr. 2021, arXiv:2106.11342. [Google Scholar]
- Rahimi, A.; Recht, B. Random features for large-scale kernel machines. Adv. Neural Inf. Process. Syst. 2007, 20, 1–8. [Google Scholar]
- Rudin, W.; Bers, L.; Courant, R.; Stoker, J.J.; Henney, D.R. Fourier Analysis on Groups; Interscience Tracts in Pure and Applied Mathematics; Interscience: New York, NY, USA, 1976; p. 19. [Google Scholar]
- Álvarez-Meza, A.M.; Cárdenas-Pe na, D.; Castellanos-Dominguez, G. Unsupervised Kernel Function Building Using Maximization of Information Potential Variability. In Proceedings of the Progress in Pattern Recognition, Image Analysis, Computer Vision, and Applications, Puerto Vallarta, Mexico, 2–5 November 2014; Bayro-Corrochano, E., Hancock, E., Eds.; Springer International Publishing: Cham, Switzerland, 2014; pp. 335–342. [Google Scholar]
- Bronstein, M.M.; Bruna, J.; Cohen, T.; Velickovic, P. Geometric Deep Learning: Grids, Groups, Graphs, Geodesics, and Gauges. arXiv 2021, arXiv:2104.13478. [Google Scholar] [CrossRef]
- Jiang, P.T.; Zhang, C.B.; Hou, Q.; Cheng, M.M.; Wei, Y. LayerCAM: Exploring hierarchical class activation maps for localization. IEEE Trans. Image Process. 2021, 30, 5875–5888. [Google Scholar] [CrossRef] [PubMed]
- Jimenez-Casta no, C.A.; Álvarez-Meza, A.M.; Aguirre-Ospina, O.D.; Cárdenas-Pe na, D.A.; Orozco-Gutiérrez, Á.A. Random fourier features-based deep learning improvement with class activation interpretability for nerve structure segmentation. Sensors 2021, 21, 7741. [Google Scholar] [CrossRef]
- Galvin, E.M.; Niehof, S.; Medina, H.J.; Zijlstra, F.J.; van Bommel, J.; Klein, J.; Verbrugge, S.J.C. Thermographic temperature measurement compared with pinprick and cold sensation in predicting the effectiveness of regional blocks. Anesth. Analg. 2006, 102, 598–604. [Google Scholar] [CrossRef] [PubMed]
- Chestnut, D.H.; Wong, C.A.; Tsen, L.C.; Kee, W.M.D.N.; Beilin, Y.; Mhyre, J. Chestnut’s Obstetric Anesthesia: Principles and Practice E-Book: Expert Consult-Online and Print; Saunders: Philadelphia, PA, USA, 2014. [Google Scholar]
- Asghar, S.; Lundstrøm, L.H.; Bjerregaard, L.S.; Lange, K.H.W. Ultrasound-guided lateral infraclavicular block evaluated by infrared thermography and distal skin temperature. Acta Anaesthesiol. Scand. 2014, 58, 867–874. [Google Scholar] [CrossRef]
- Lange, K.H.; Jansen, T.; Asghar, S.; Kristensen, P.; Skjønnemand, M.; Nørgaard, P. Skin temperature measured by infrared thermography after specific ultrasound-guided blocking of the musculocutaneous, radial, ulnar, and median nerves in the upper extremity. Br. J. Anaesth. 2011, 106, 887–895. [Google Scholar] [CrossRef]
- Simonyan, K.; Zisserman, A. Very Deep Convolutional Networks for Large-Scale Image Recognition. arXiv 2014, arXiv:1409.1556. [Google Scholar] [CrossRef]
- Ibtehaz, N.; Rahman, M.S. MultiResUNet: Rethinking the U-Net architecture for multimodal biomedical image segmentation. Neural Netw. 2020, 121, 74–87. [Google Scholar] [CrossRef]
- Zhou, Z.; Siddiquee, M.M.R.; Tajbakhsh, N.; Liang, J. UNet++: A Nested U-Net Architecture for Medical Image Segmentation. In DLMIA 2018, ML-CDS 2018: Deep Learning in Medical Image Analysis and Multimodal Learning for Clinical Decision Support; Lecture Notes in Computer Science; Springer International Publishing: Cham, Switzerland, 2018; pp. 3–11. [Google Scholar] [CrossRef]
- Wang, X.; Wang, L.; Zhong, X.; Bai, C.; Huang, X.; Zhao, R.; Xia, M. PaI-Net: A modified U-Net of reducing semantic gap for surgical instrument segmentation. IET Image Process. 2021, 15, 2959–2969. [Google Scholar] [CrossRef]
- Haji, S.H.; Abdulazeez, A.M. Comparison of optimization techniques based on gradient descent algorithm: A review. PalArch J. Archaeol. Egypt/Egyptol. 2021, 18, 2715–2743. [Google Scholar]
- Van der Walt, S.; Schönberger, J.L.; Nunez-Iglesias, J.; Boulogne, F.; Warner, J.D.; Yager, N.; Gouillart, E.; Yu, T. scikit-image: Image processing in Python. PeerJ 2014, 2, e453. [Google Scholar] [CrossRef]
- Nakkiran, P.; Kaplun, G.; Bansal, Y.; Yang, T.; Barak, B.; Sutskever, I. Deep Double Descent: Where Bigger Models and More Data Hurt. arXiv 2019, arXiv:1912.02292. [Google Scholar] [CrossRef]
- Heckel, R.; Yilmaz, F.F. Early Stopping in Deep Networks: Double Descent and How to Eliminate it. arXiv 2020, arXiv:2007.10099. [Google Scholar] [CrossRef]
- Zhou, Z.; Siddiquee, M.M.R.; Tajbakhsh, N.; Liang, J. UNet++: Redesigning Skip Connections to Exploit Multiscale Features in Image Segmentation. IEEE Trans. Med. Imaging 2020, 39, 1856–1867. [Google Scholar] [CrossRef] [PubMed]
- Peng, H.; Pappas, N.; Yogatama, D.; Schwartz, R.; Smith, N.A.; Kong, L. Random feature attention. arXiv 2021, arXiv:2103.02143. [Google Scholar]
- Nguyen, T.P.; Pham, T.T.; Nguyen, T.; Le, H.; Nguyen, D.; Lam, H.; Nguyen, P.; Fowler, J.; Tran, M.T.; Le, N. EmbryosFormer: Deformable Transformer and Collaborative Encoding-Decoding for Embryos Stage Development Classification. In Proceedings of the IEEE/CVF Winter Conference on Applications of Computer Vision, Waikola, HI, USA, 2–7 January 2023; pp. 1981–1990. [Google Scholar]


Disclaimer/Publisher’s Note: The statements, opinions and data contained in all publications are solely those of the individual author(s) and contributor(s) and not of MDPI and/or the editor(s). MDPI and/or the editor(s) disclaim responsibility for any injury to people or property resulting from any ideas, methods, instructions or products referred to in the content. |
© 2023 by the authors. Licensee MDPI, Basel, Switzerland. This article is an open access article distributed under the terms and conditions of the Creative Commons Attribution (CC BY) license (https://creativecommons.org/licenses/by/4.0/).
Share and Cite
Aguirre-Arango, J.C.; Álvarez-Meza, A.M.; Castellanos-Dominguez, G. Feet Segmentation for Regional Analgesia Monitoring Using Convolutional RFF and Layer-Wise Weighted CAM Interpretability. Computation 2023, 11, 113. https://doi.org/10.3390/computation11060113
Aguirre-Arango JC, Álvarez-Meza AM, Castellanos-Dominguez G. Feet Segmentation for Regional Analgesia Monitoring Using Convolutional RFF and Layer-Wise Weighted CAM Interpretability. Computation. 2023; 11(6):113. https://doi.org/10.3390/computation11060113
Chicago/Turabian StyleAguirre-Arango, Juan Carlos, Andrés Marino Álvarez-Meza, and German Castellanos-Dominguez. 2023. "Feet Segmentation for Regional Analgesia Monitoring Using Convolutional RFF and Layer-Wise Weighted CAM Interpretability" Computation 11, no. 6: 113. https://doi.org/10.3390/computation11060113
APA StyleAguirre-Arango, J. C., Álvarez-Meza, A. M., & Castellanos-Dominguez, G. (2023). Feet Segmentation for Regional Analgesia Monitoring Using Convolutional RFF and Layer-Wise Weighted CAM Interpretability. Computation, 11(6), 113. https://doi.org/10.3390/computation11060113