Author Contributions
Conceptualization, F.Y., M.M.H. and S.Z.; methodology, F.Y., M.M.H., S.T.A. and S.Z.; software, M.M.H.; validation, A.K., S.A. and S.T.A.; formal analysis, F.Y. and M.M.H.; investigation, S.Z.; resources, M.M.H.; data curation, M.M.H.; writing—original draft preparation, F.Y. and S.T.A.; writing—review and editing, A.K. and S.A.; visualization, M.M.H. and S.Z.; supervision, A.K. and S.A.; project administration, A.K. All authors have read and agreed to the published version of the manuscript.
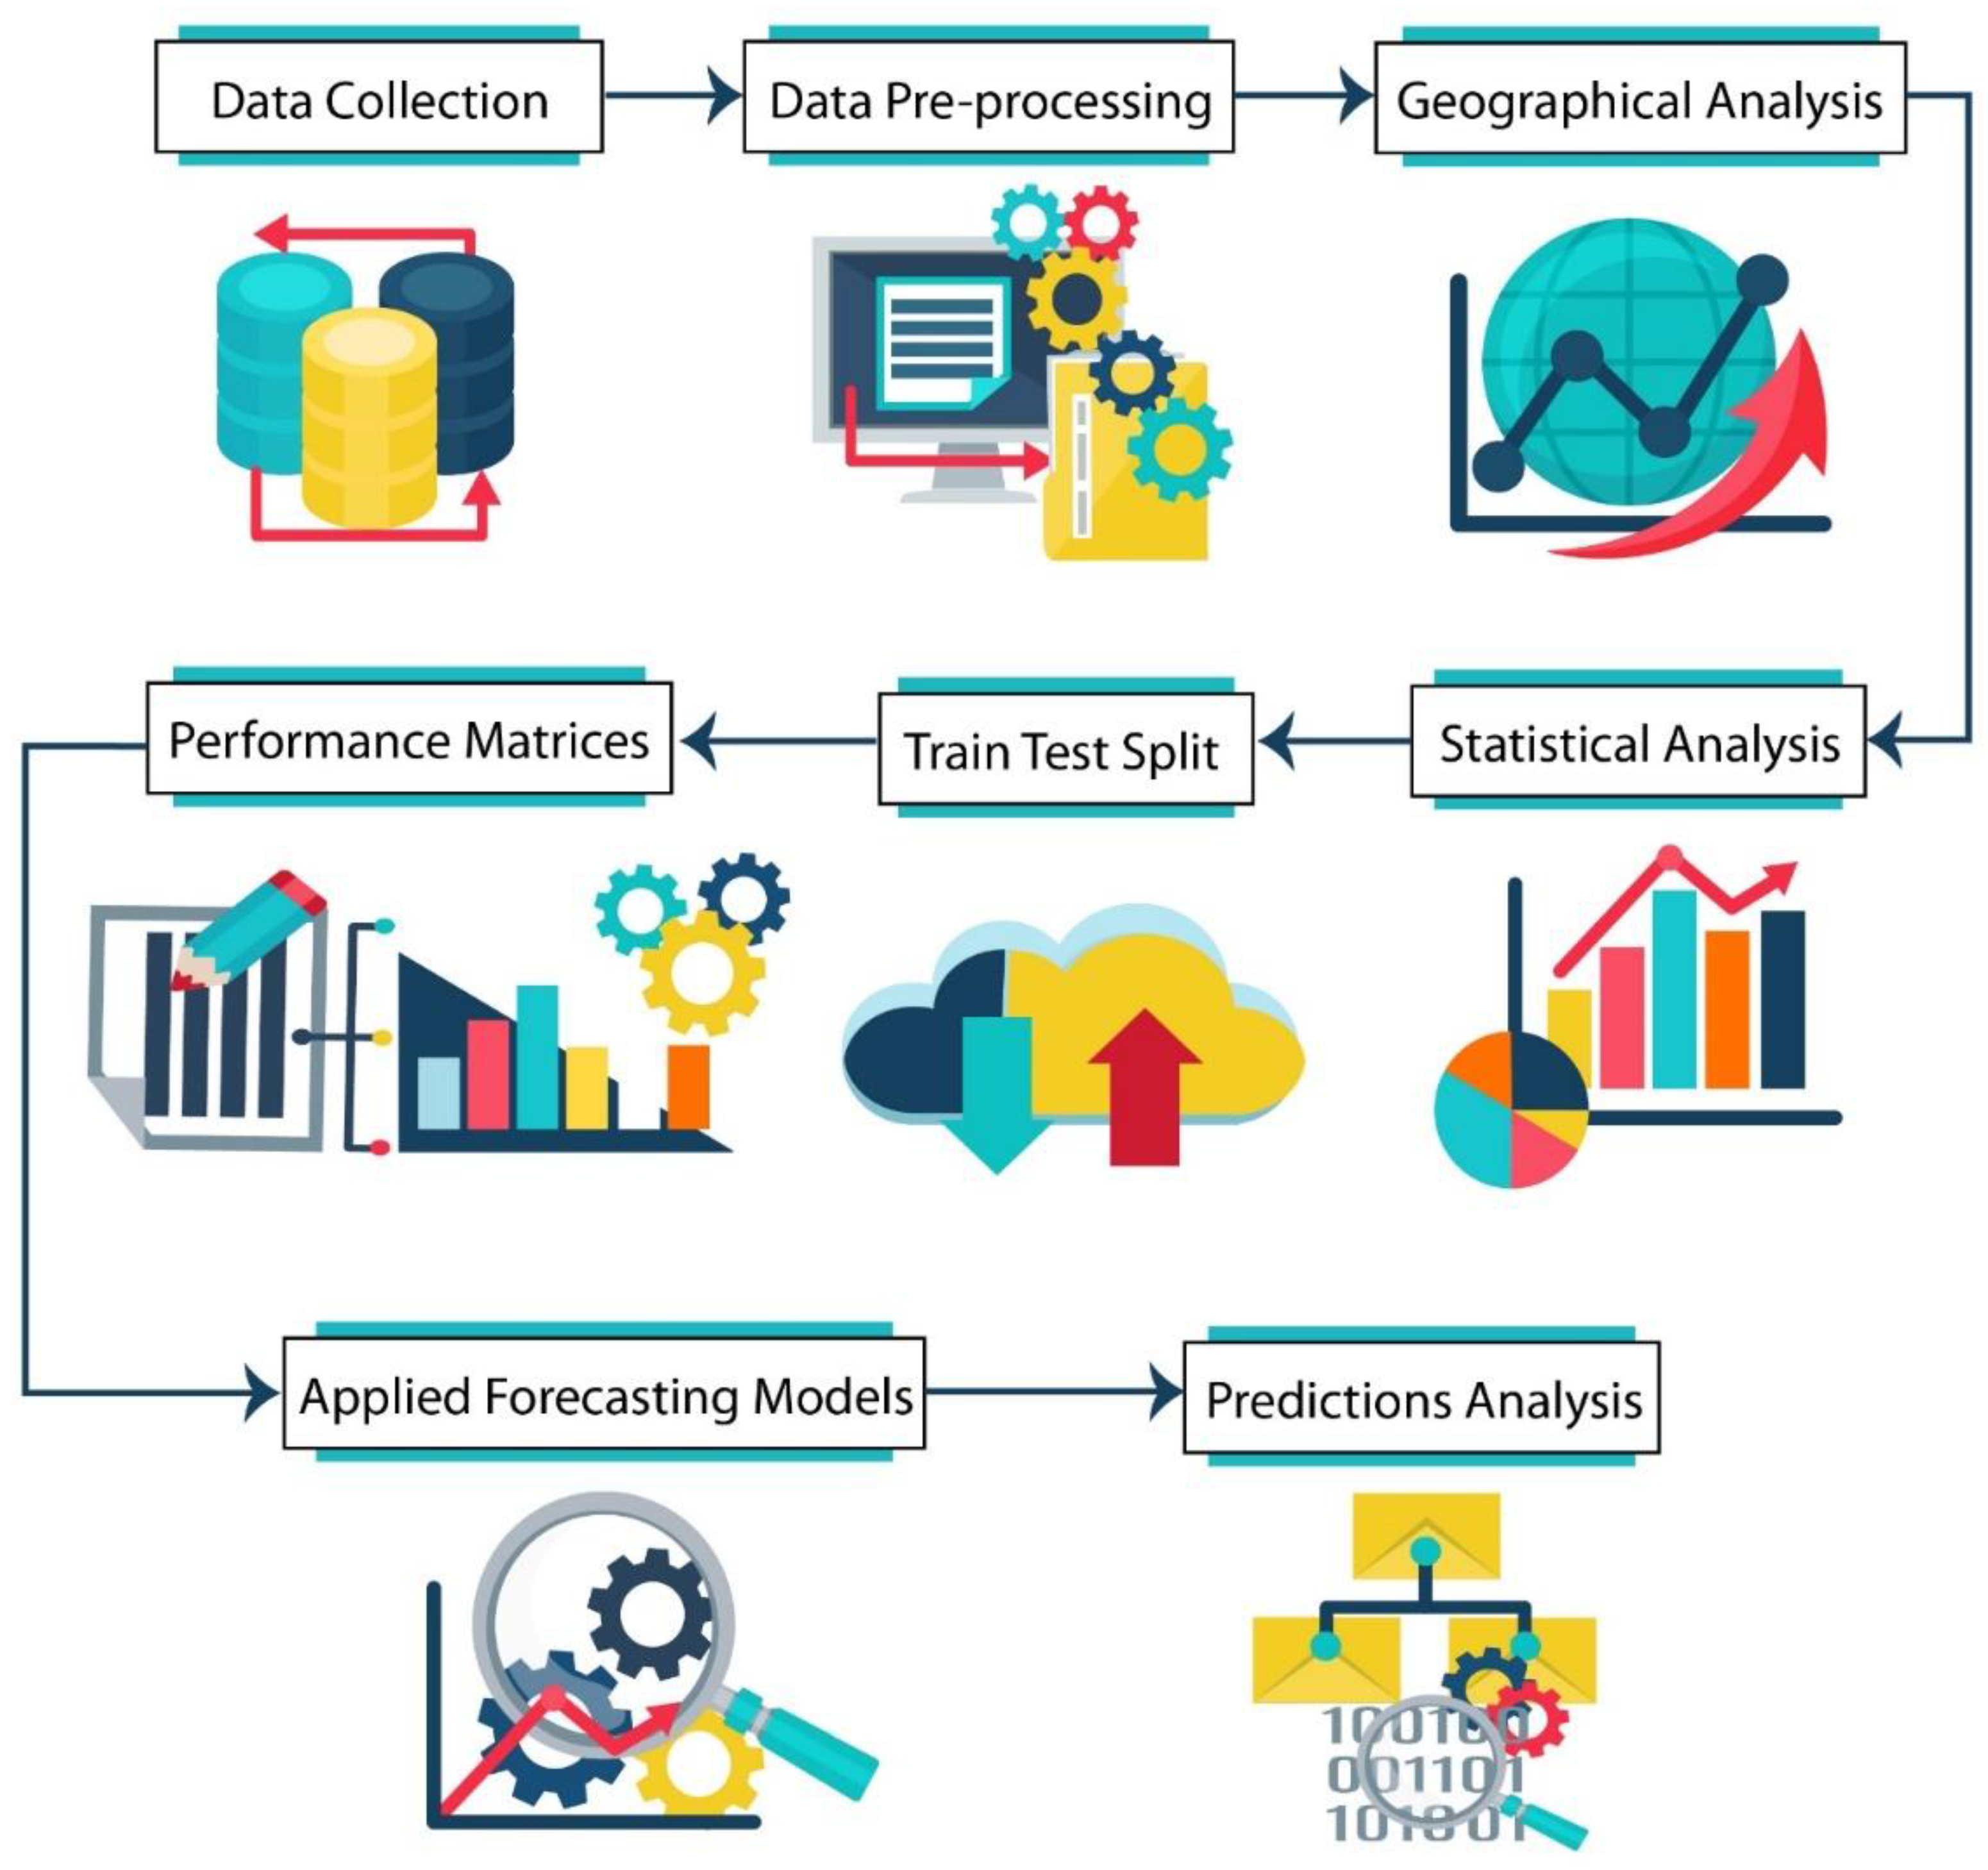
Figure 1.
The complete working flow chart of this study.
Figure 1.
The complete working flow chart of this study.
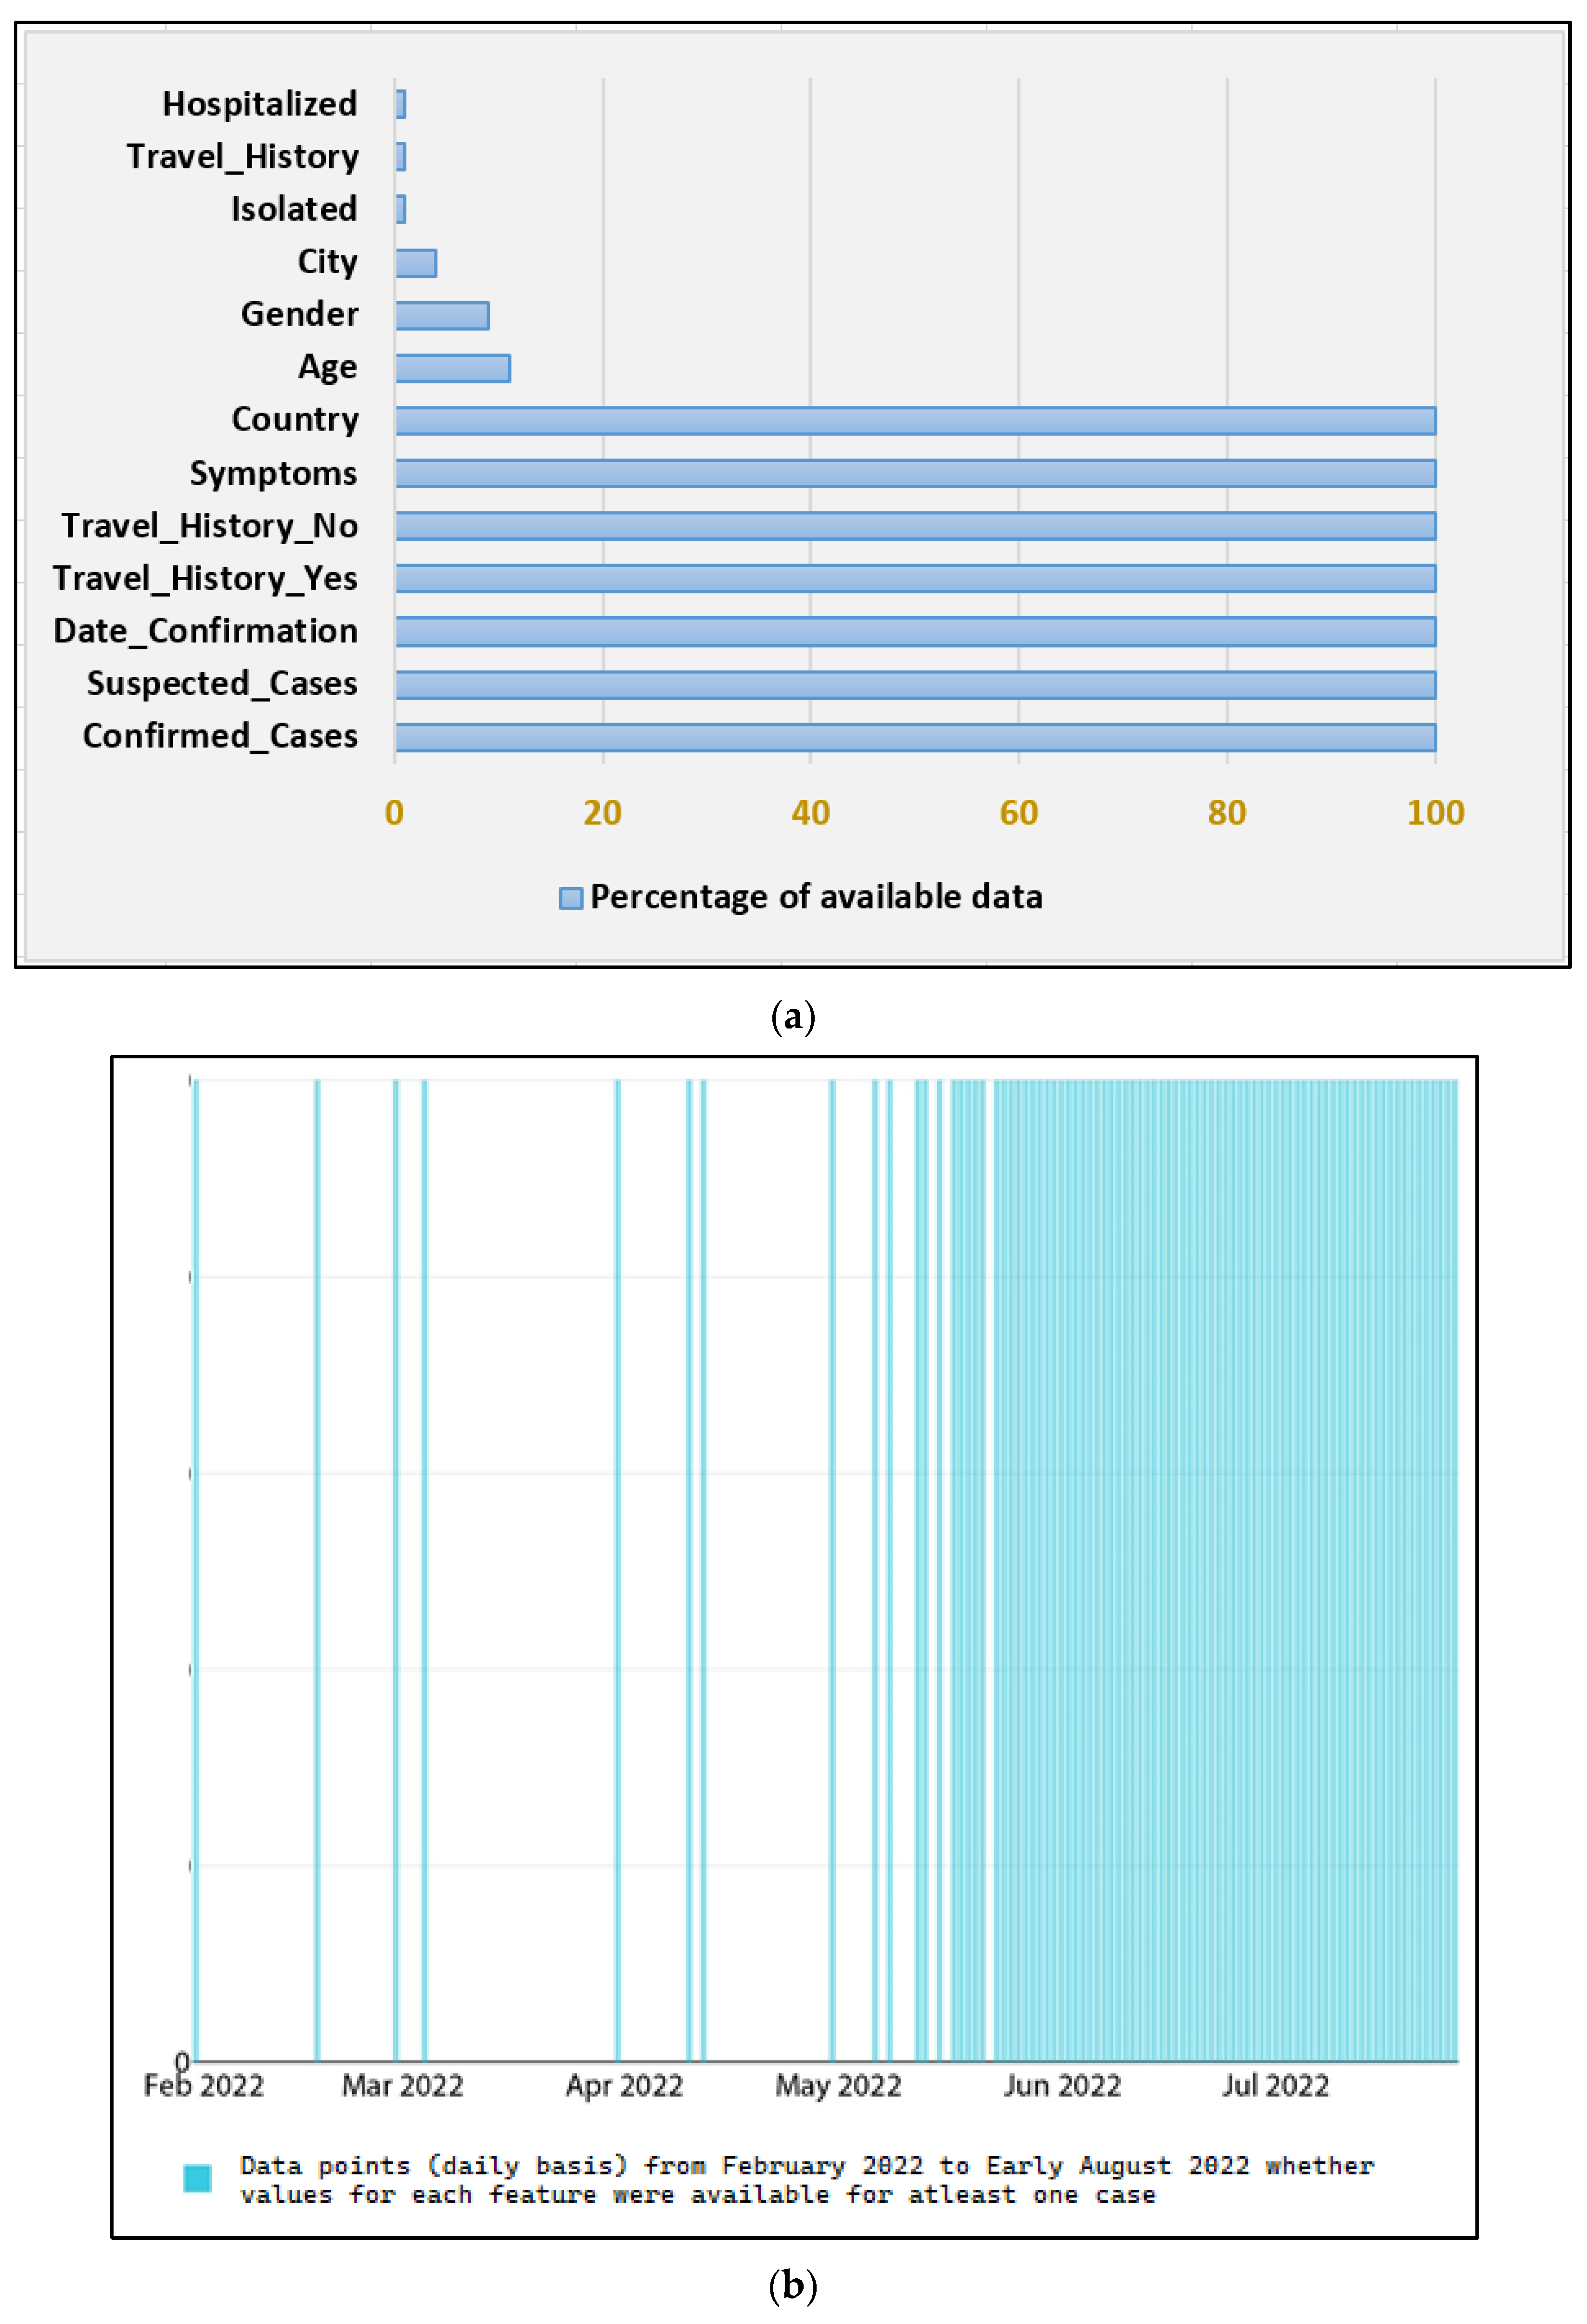
Figure 2.
Few key Dataset statistics (a) the percentage of Null values for each of the thirteen features, (b) Feature completeness for cases on a daily basis from February 2022 to early August 2022.
Figure 2.
Few key Dataset statistics (a) the percentage of Null values for each of the thirteen features, (b) Feature completeness for cases on a daily basis from February 2022 to early August 2022.
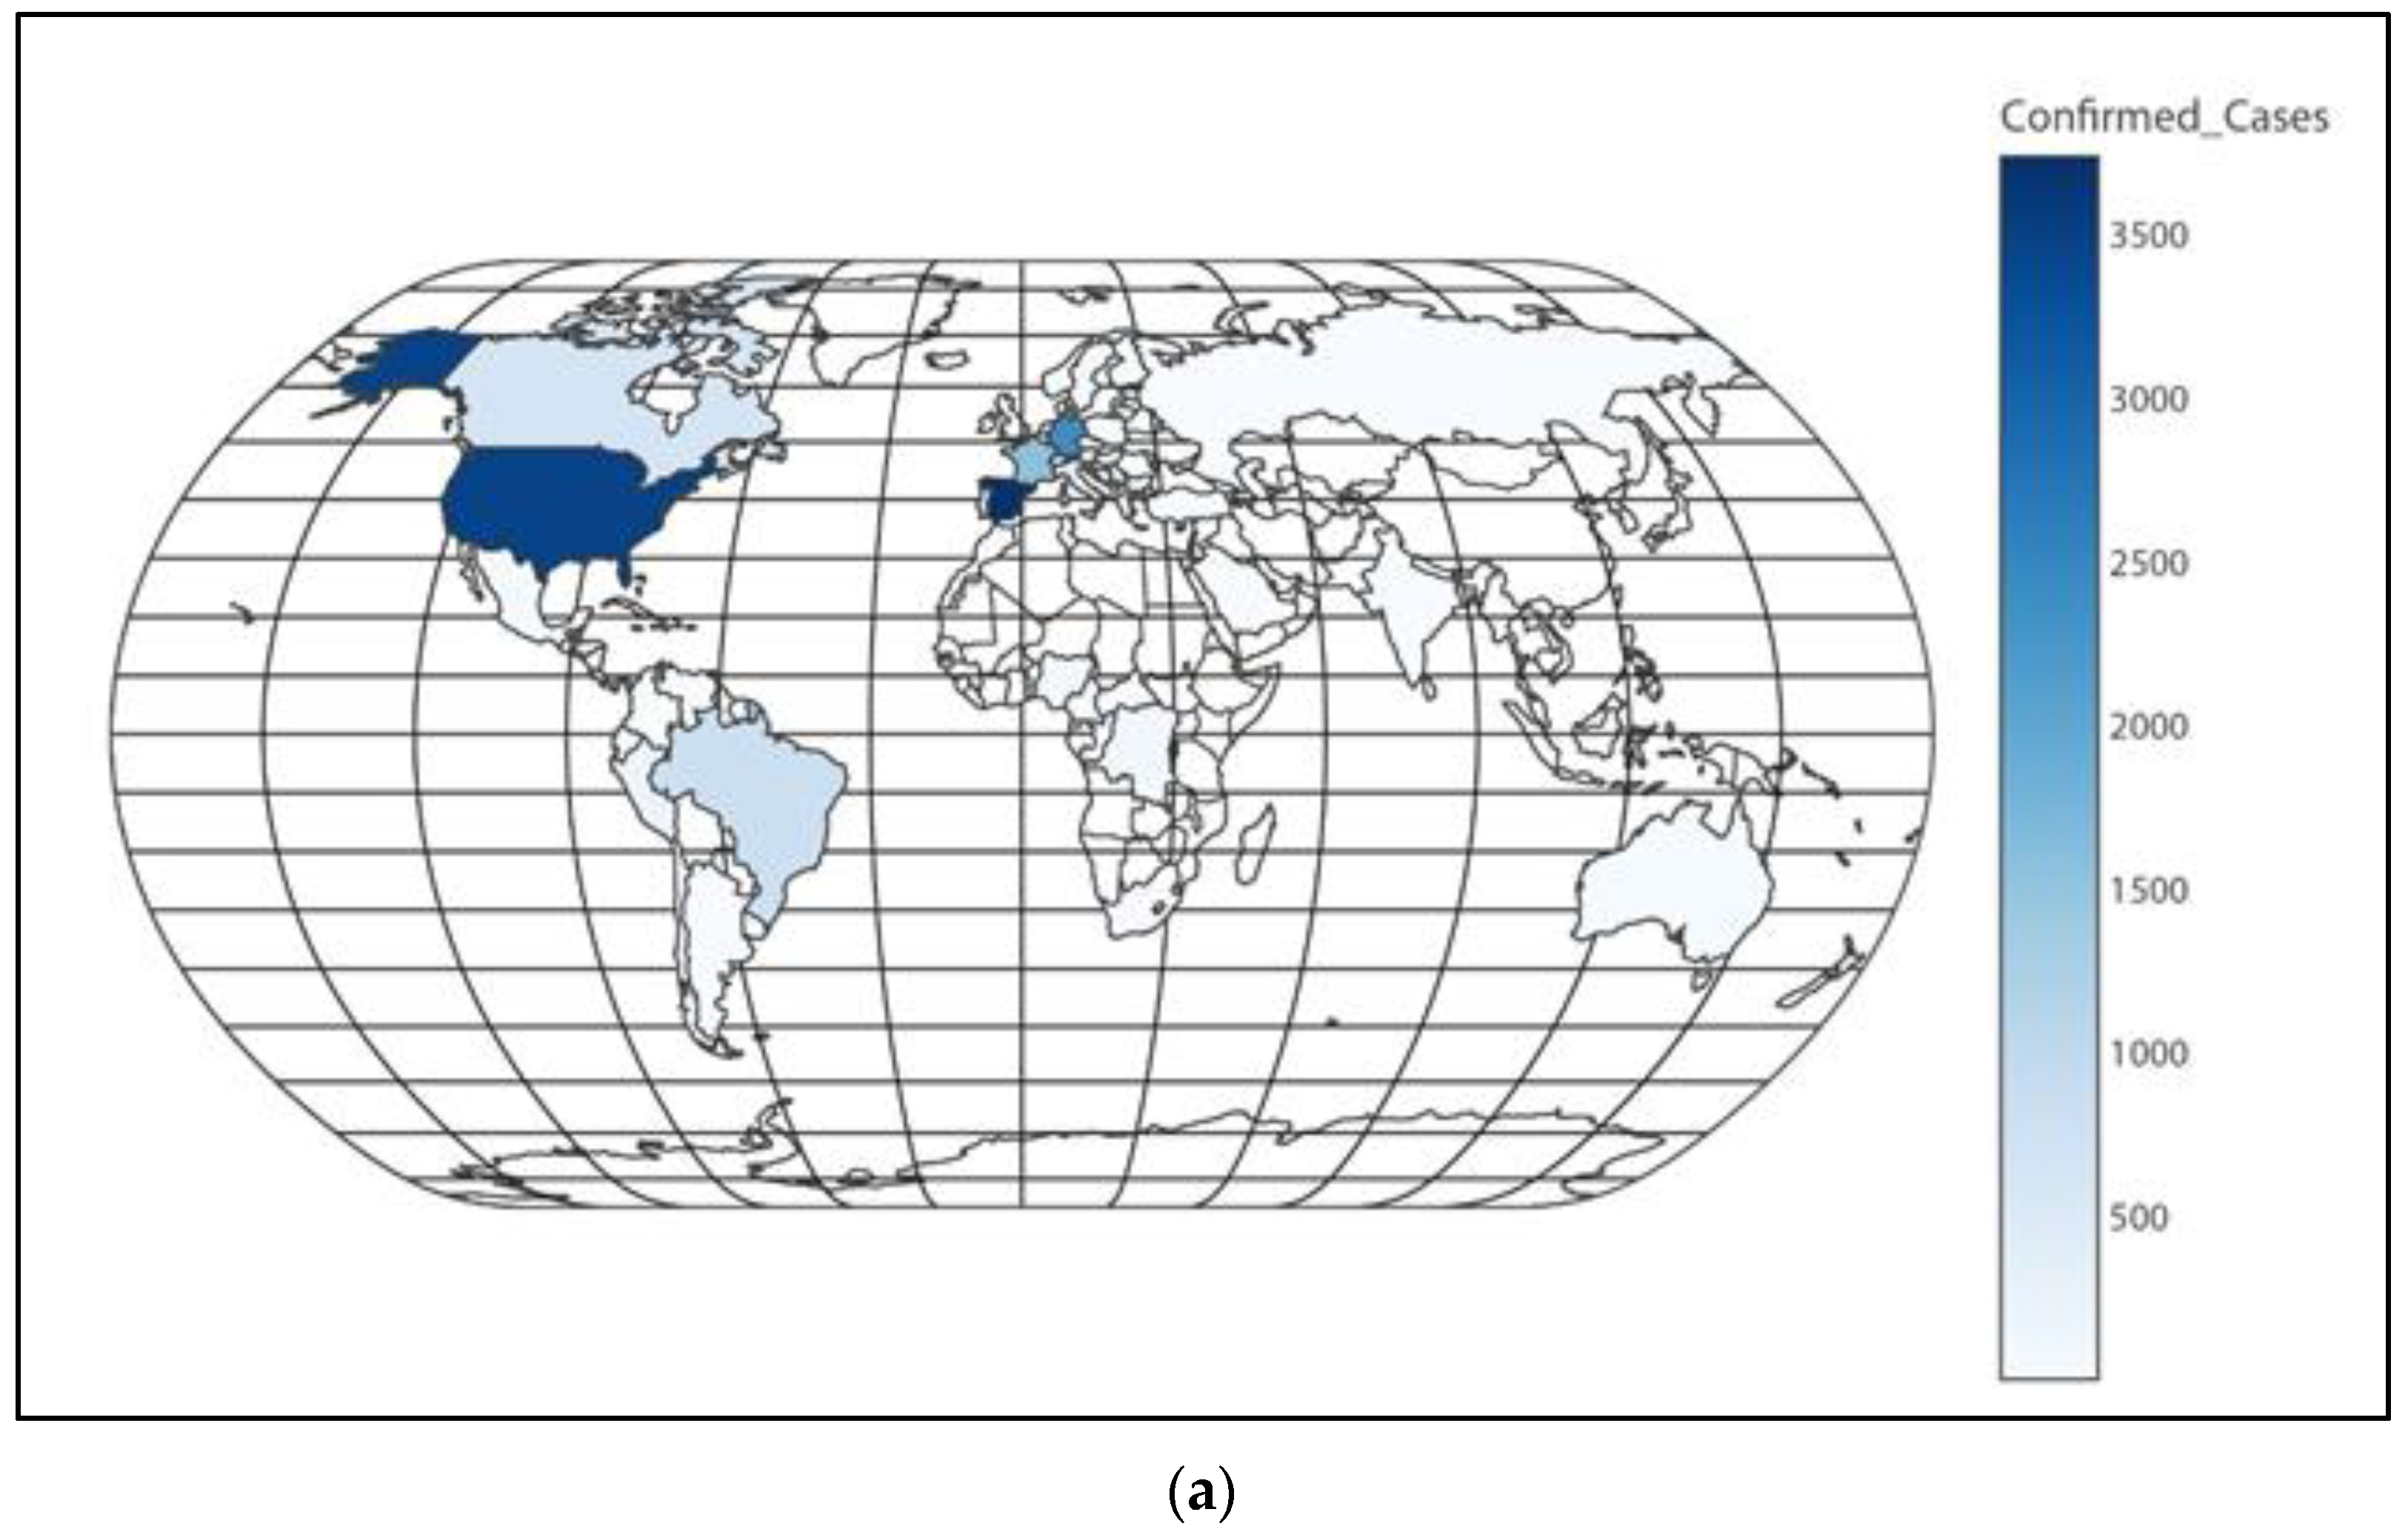
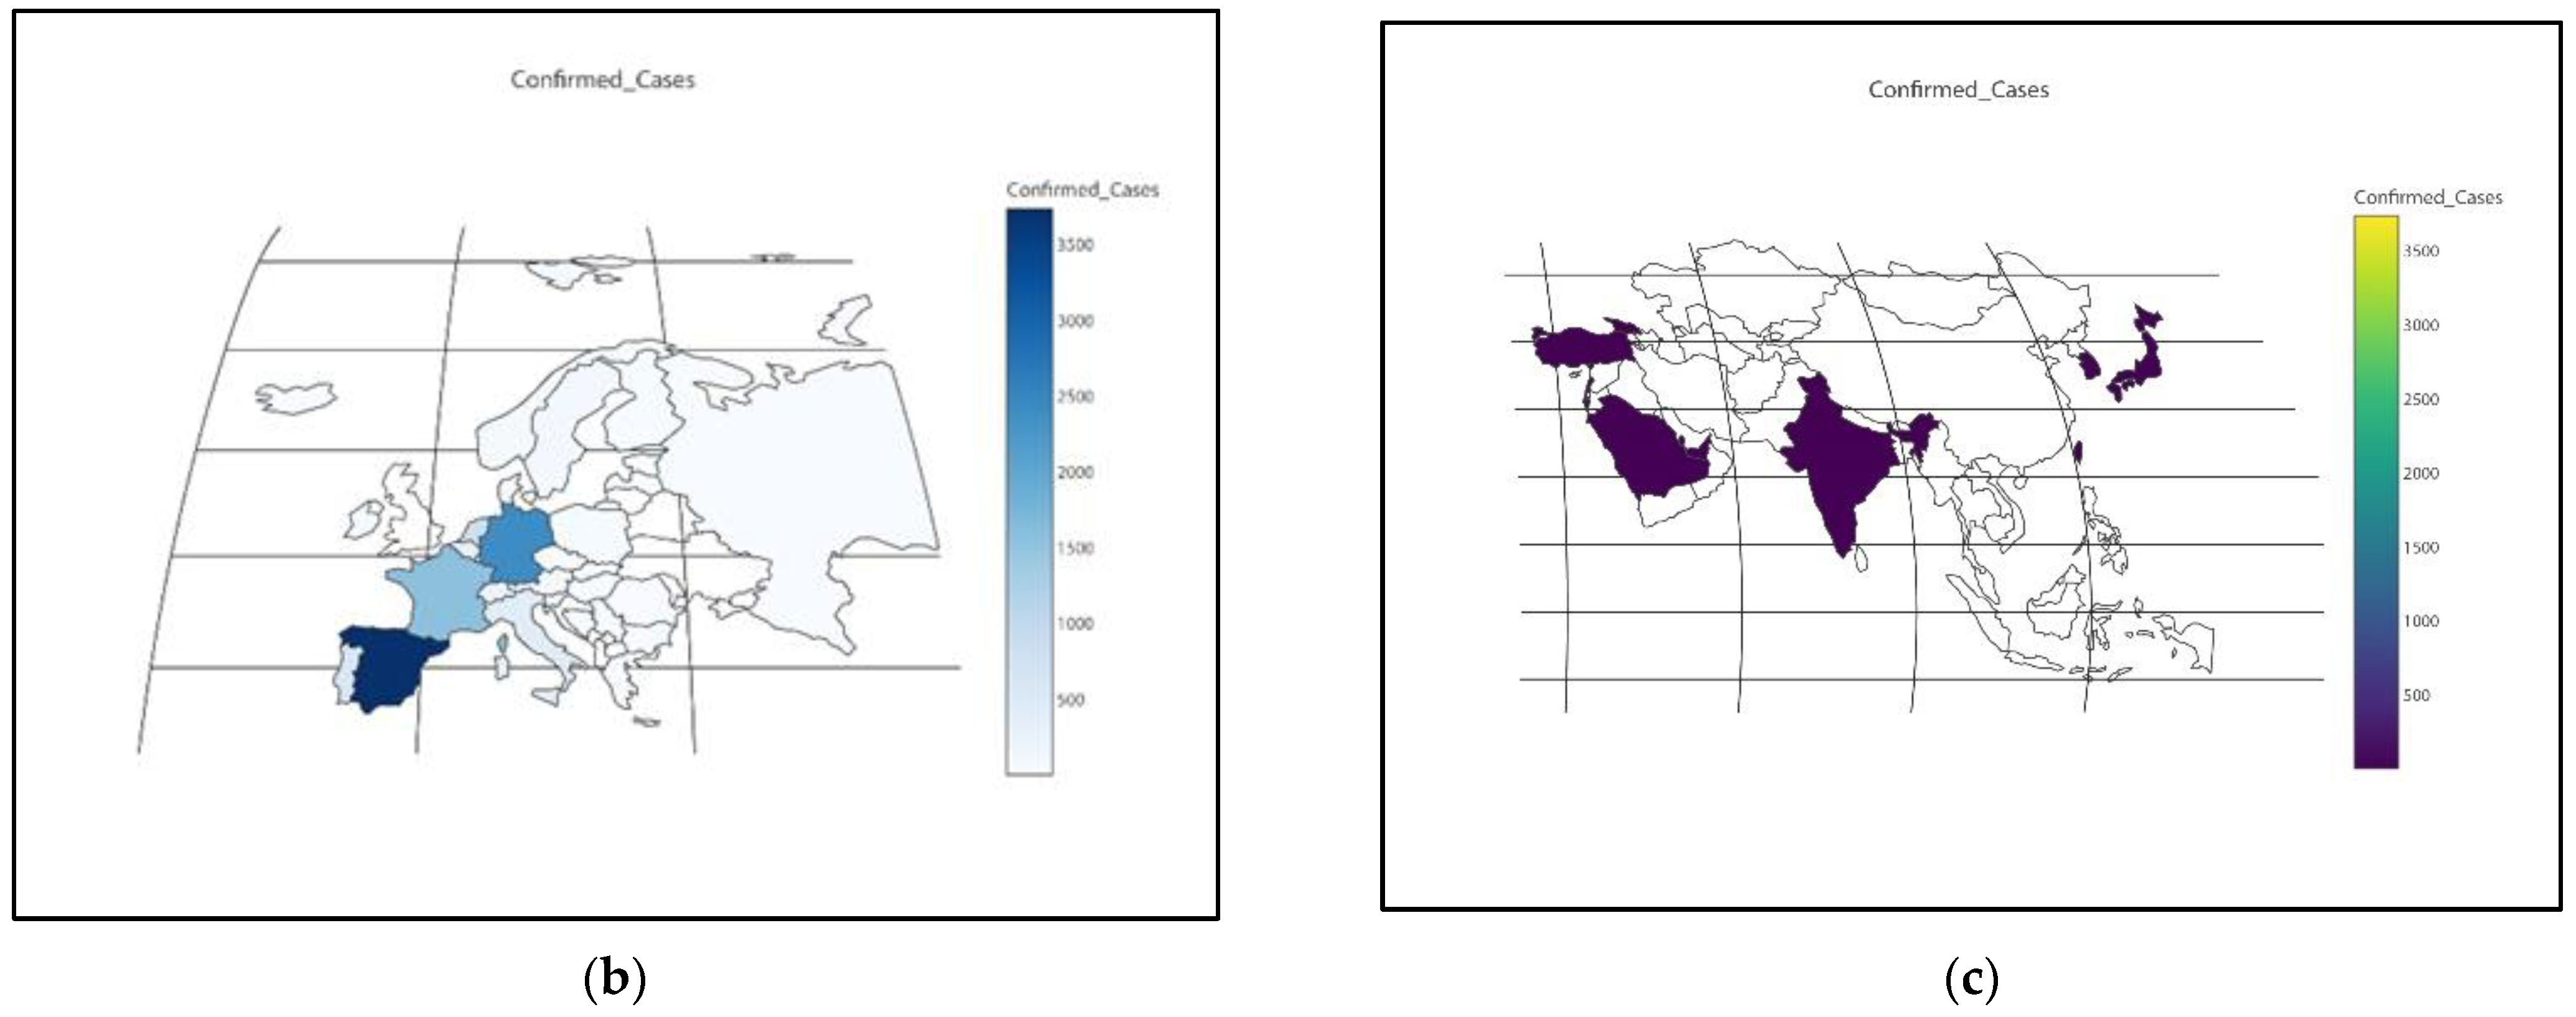
Figure 3.
(a) Worldwide distribution of confirmed cases; (b) European distribution of confirmed cases; (c) Asian distribution of confirmed cases.
Figure 3.
(a) Worldwide distribution of confirmed cases; (b) European distribution of confirmed cases; (c) Asian distribution of confirmed cases.
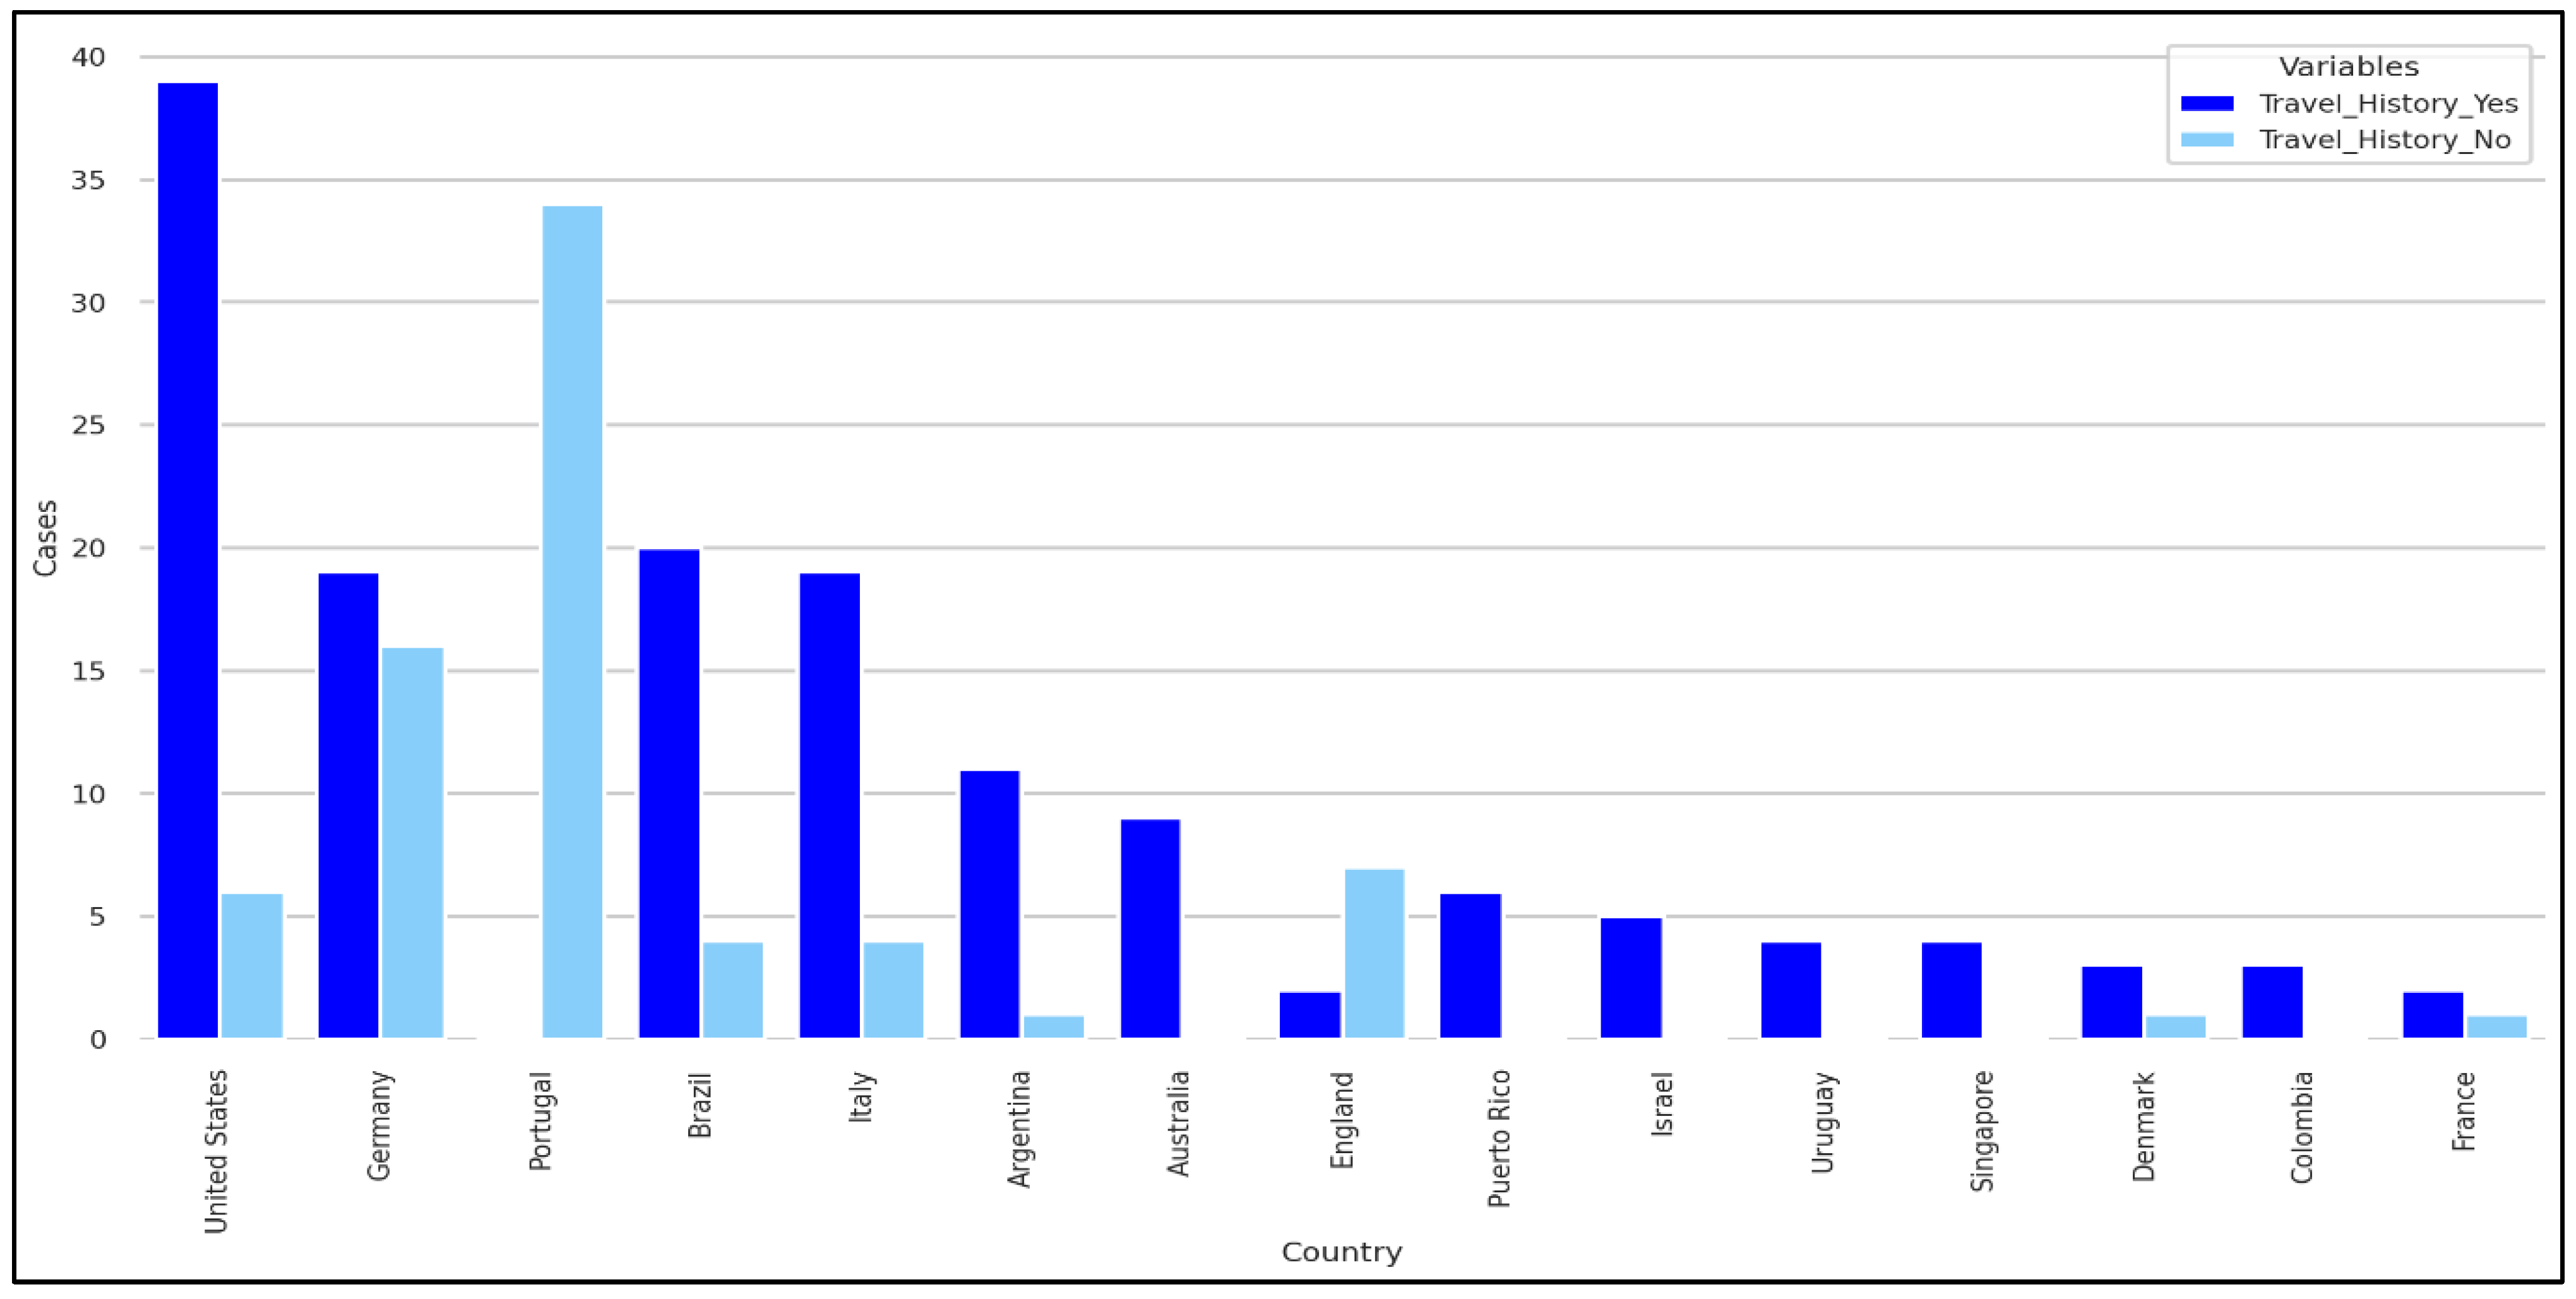
Figure 4.
Travel history based on Nationality.
Figure 4.
Travel history based on Nationality.
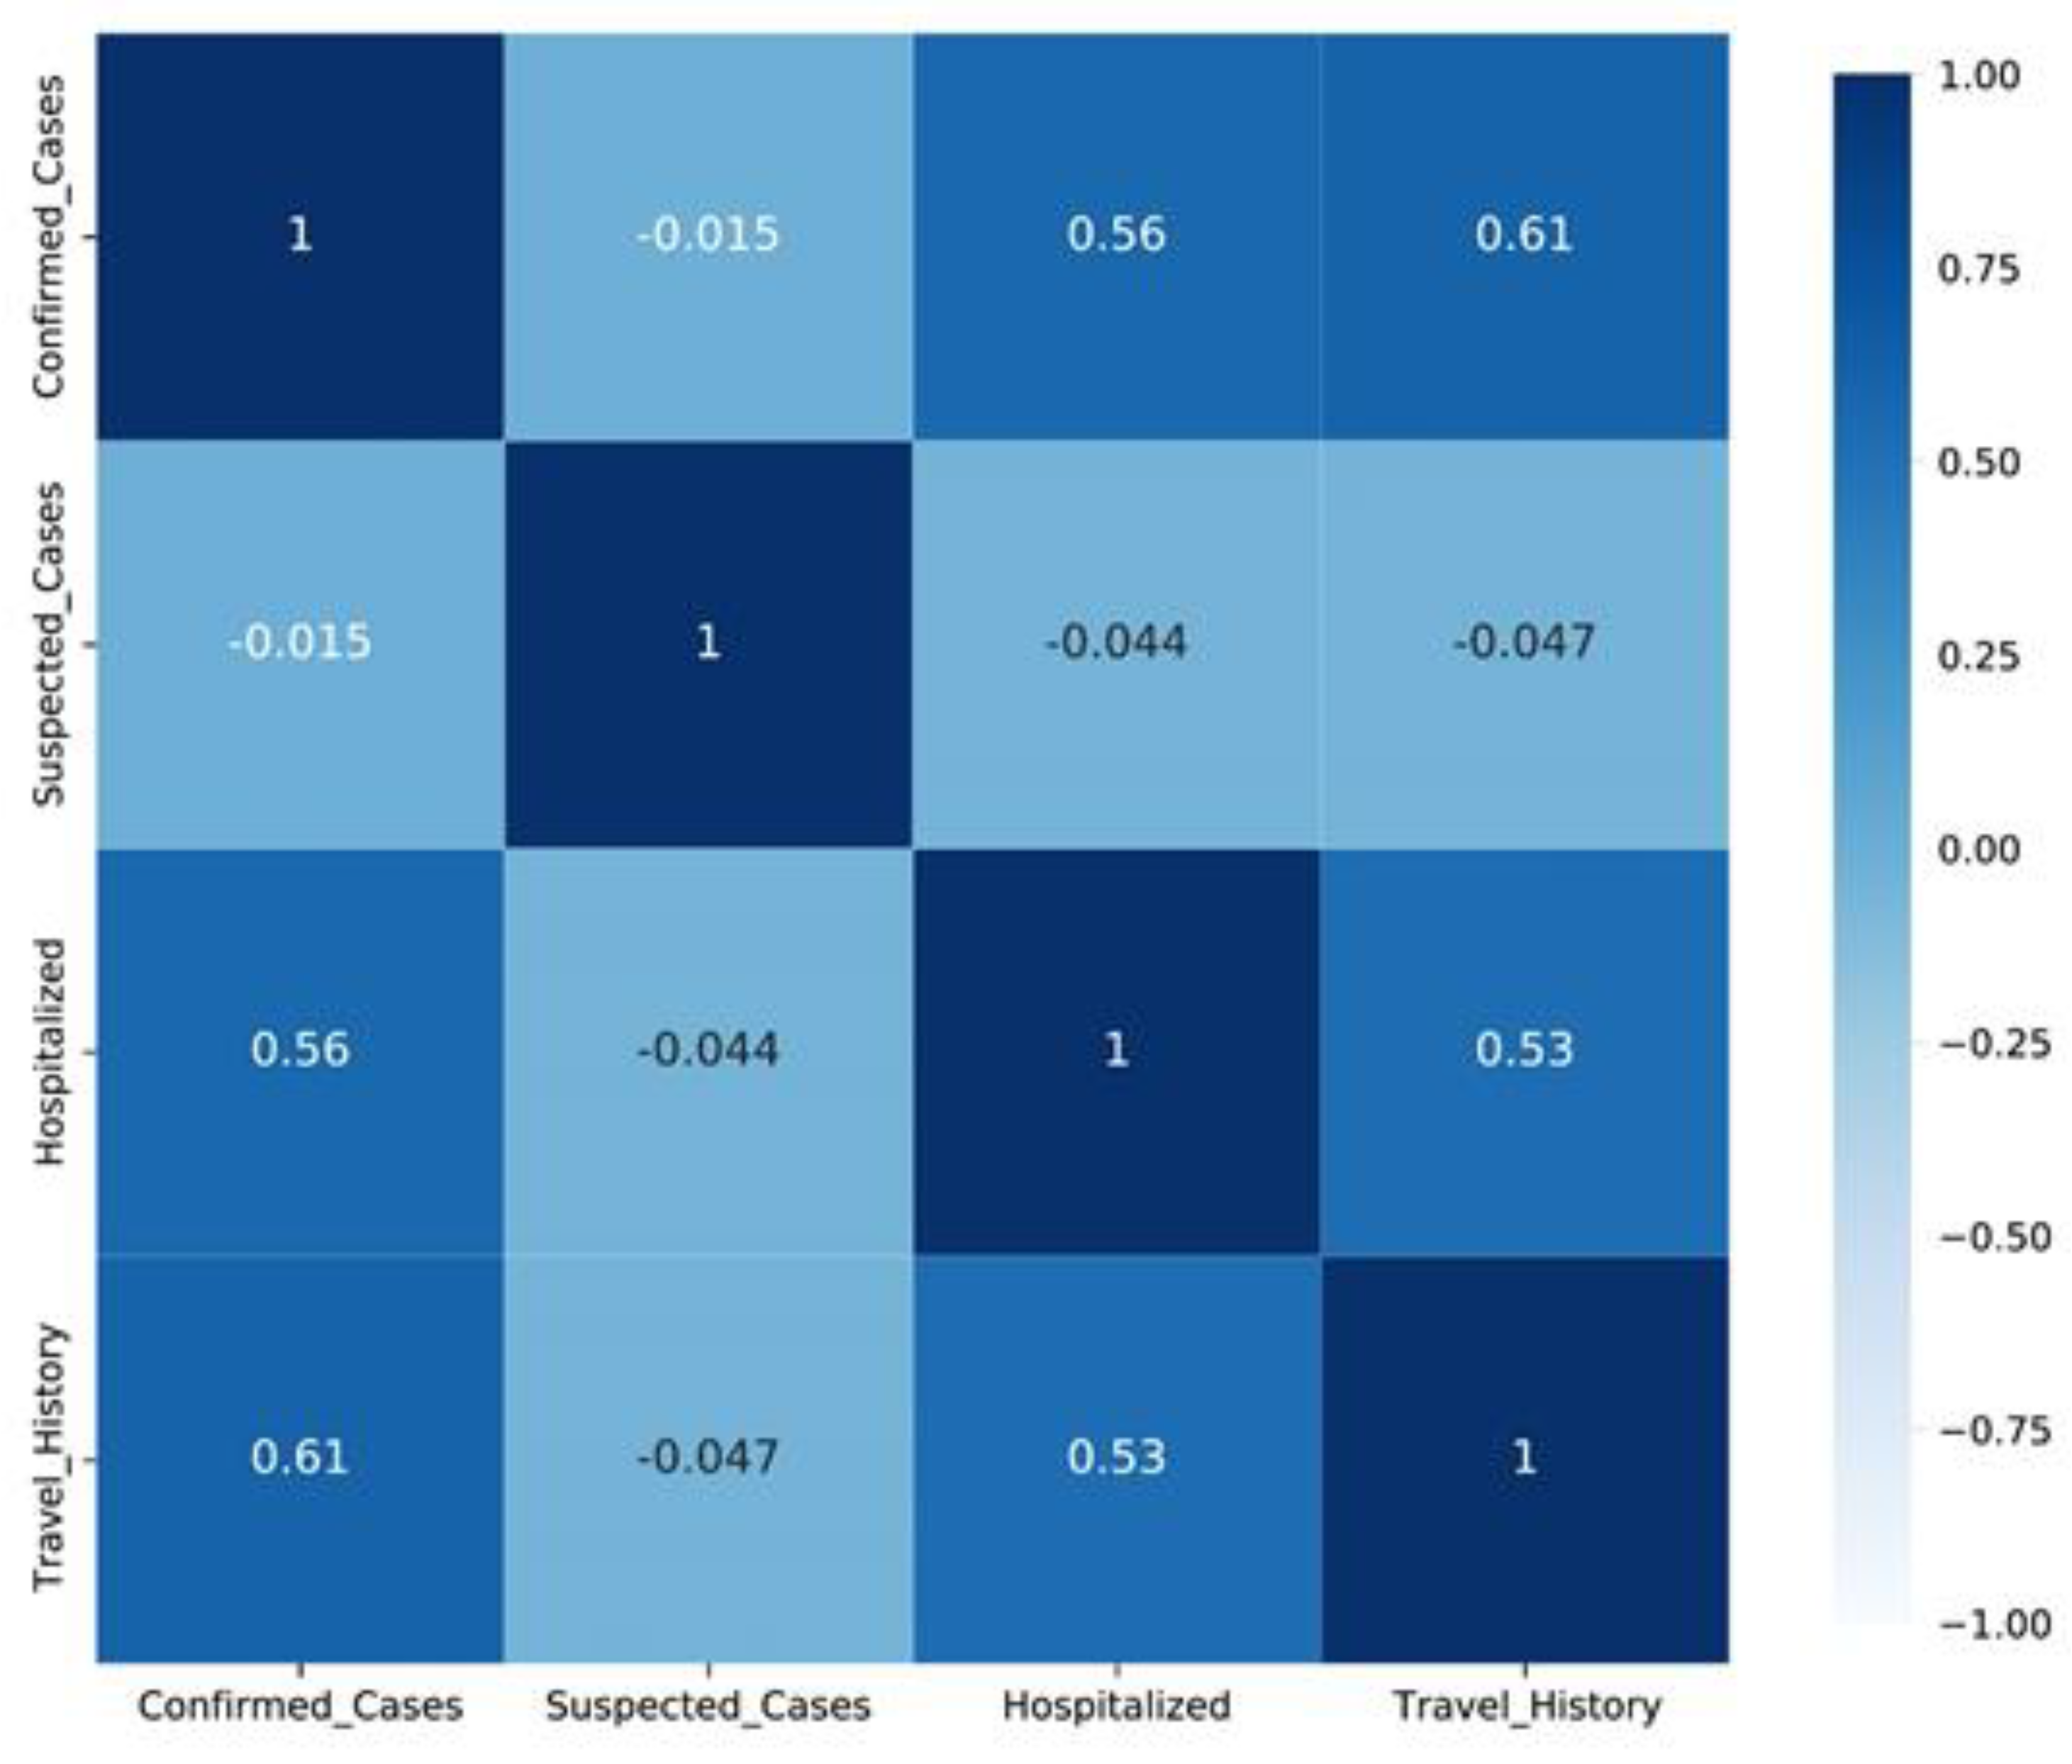
Figure 5.
Correlation among confirmed, suspected, and hospitalized cases.
Figure 5.
Correlation among confirmed, suspected, and hospitalized cases.
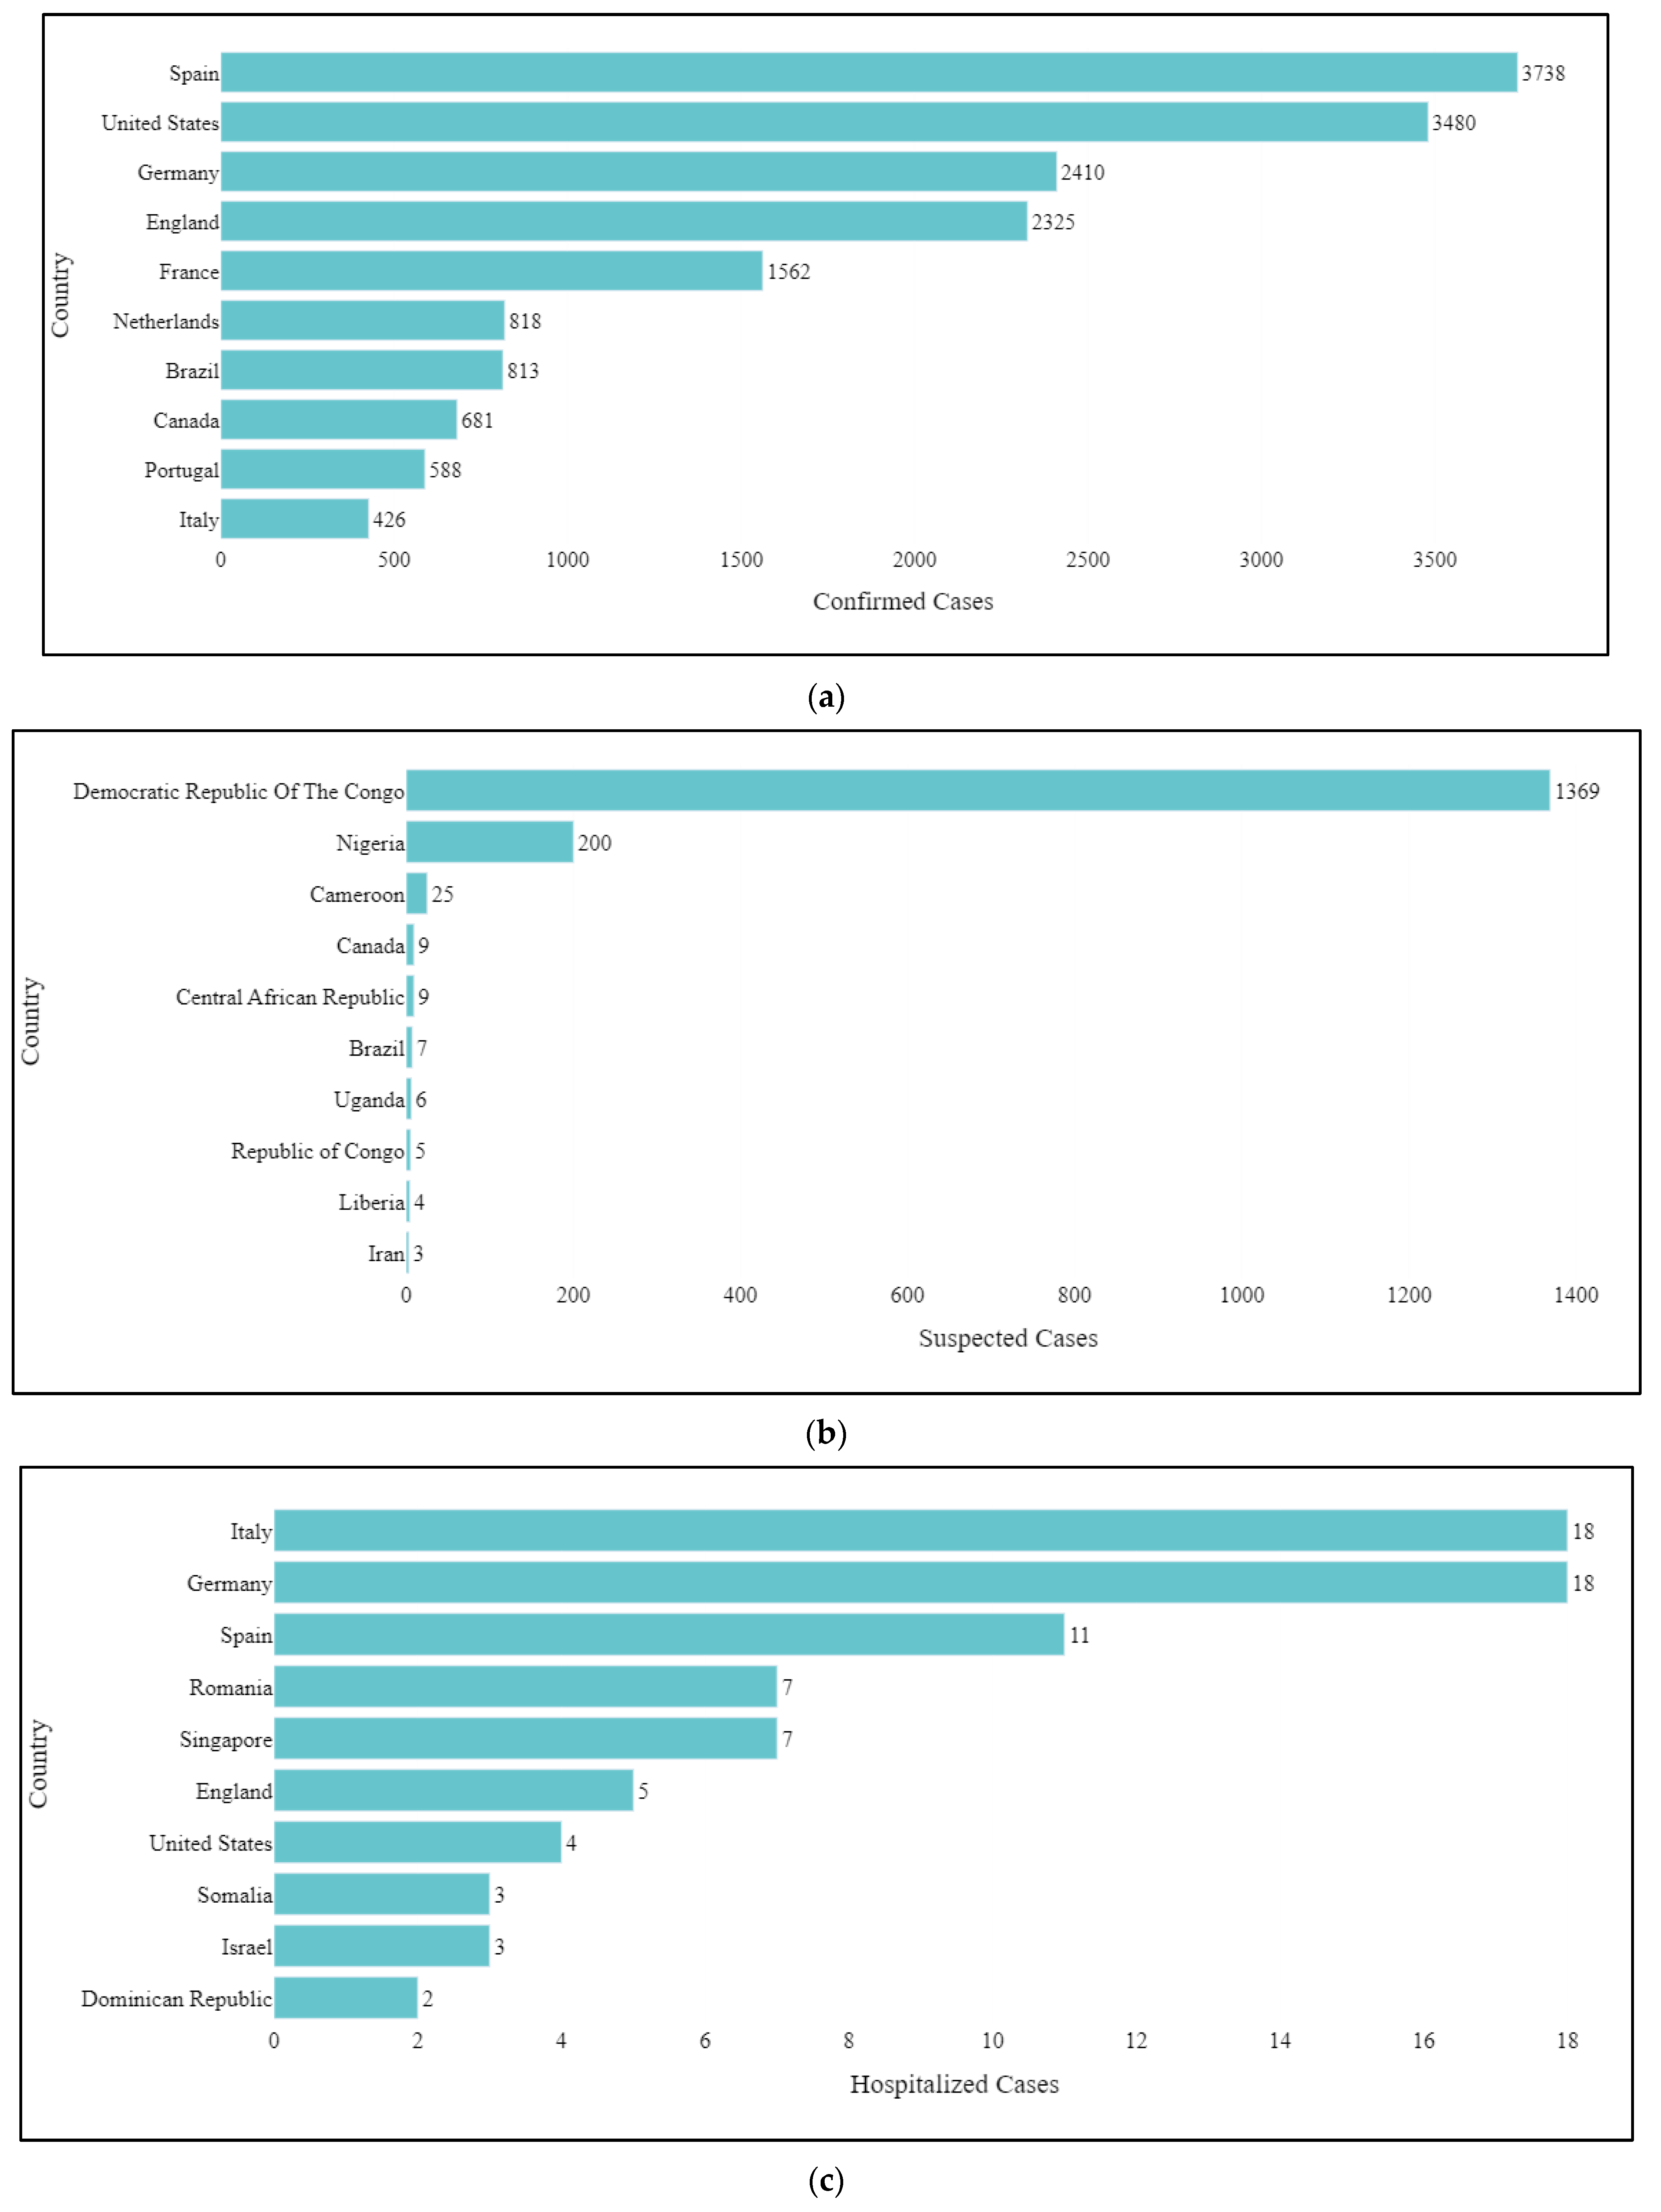
Figure 6.
Top 10 countries according to the (a) confirmed cases, (b) suspected cases, and (c) hospitalized cases.
Figure 6.
Top 10 countries according to the (a) confirmed cases, (b) suspected cases, and (c) hospitalized cases.
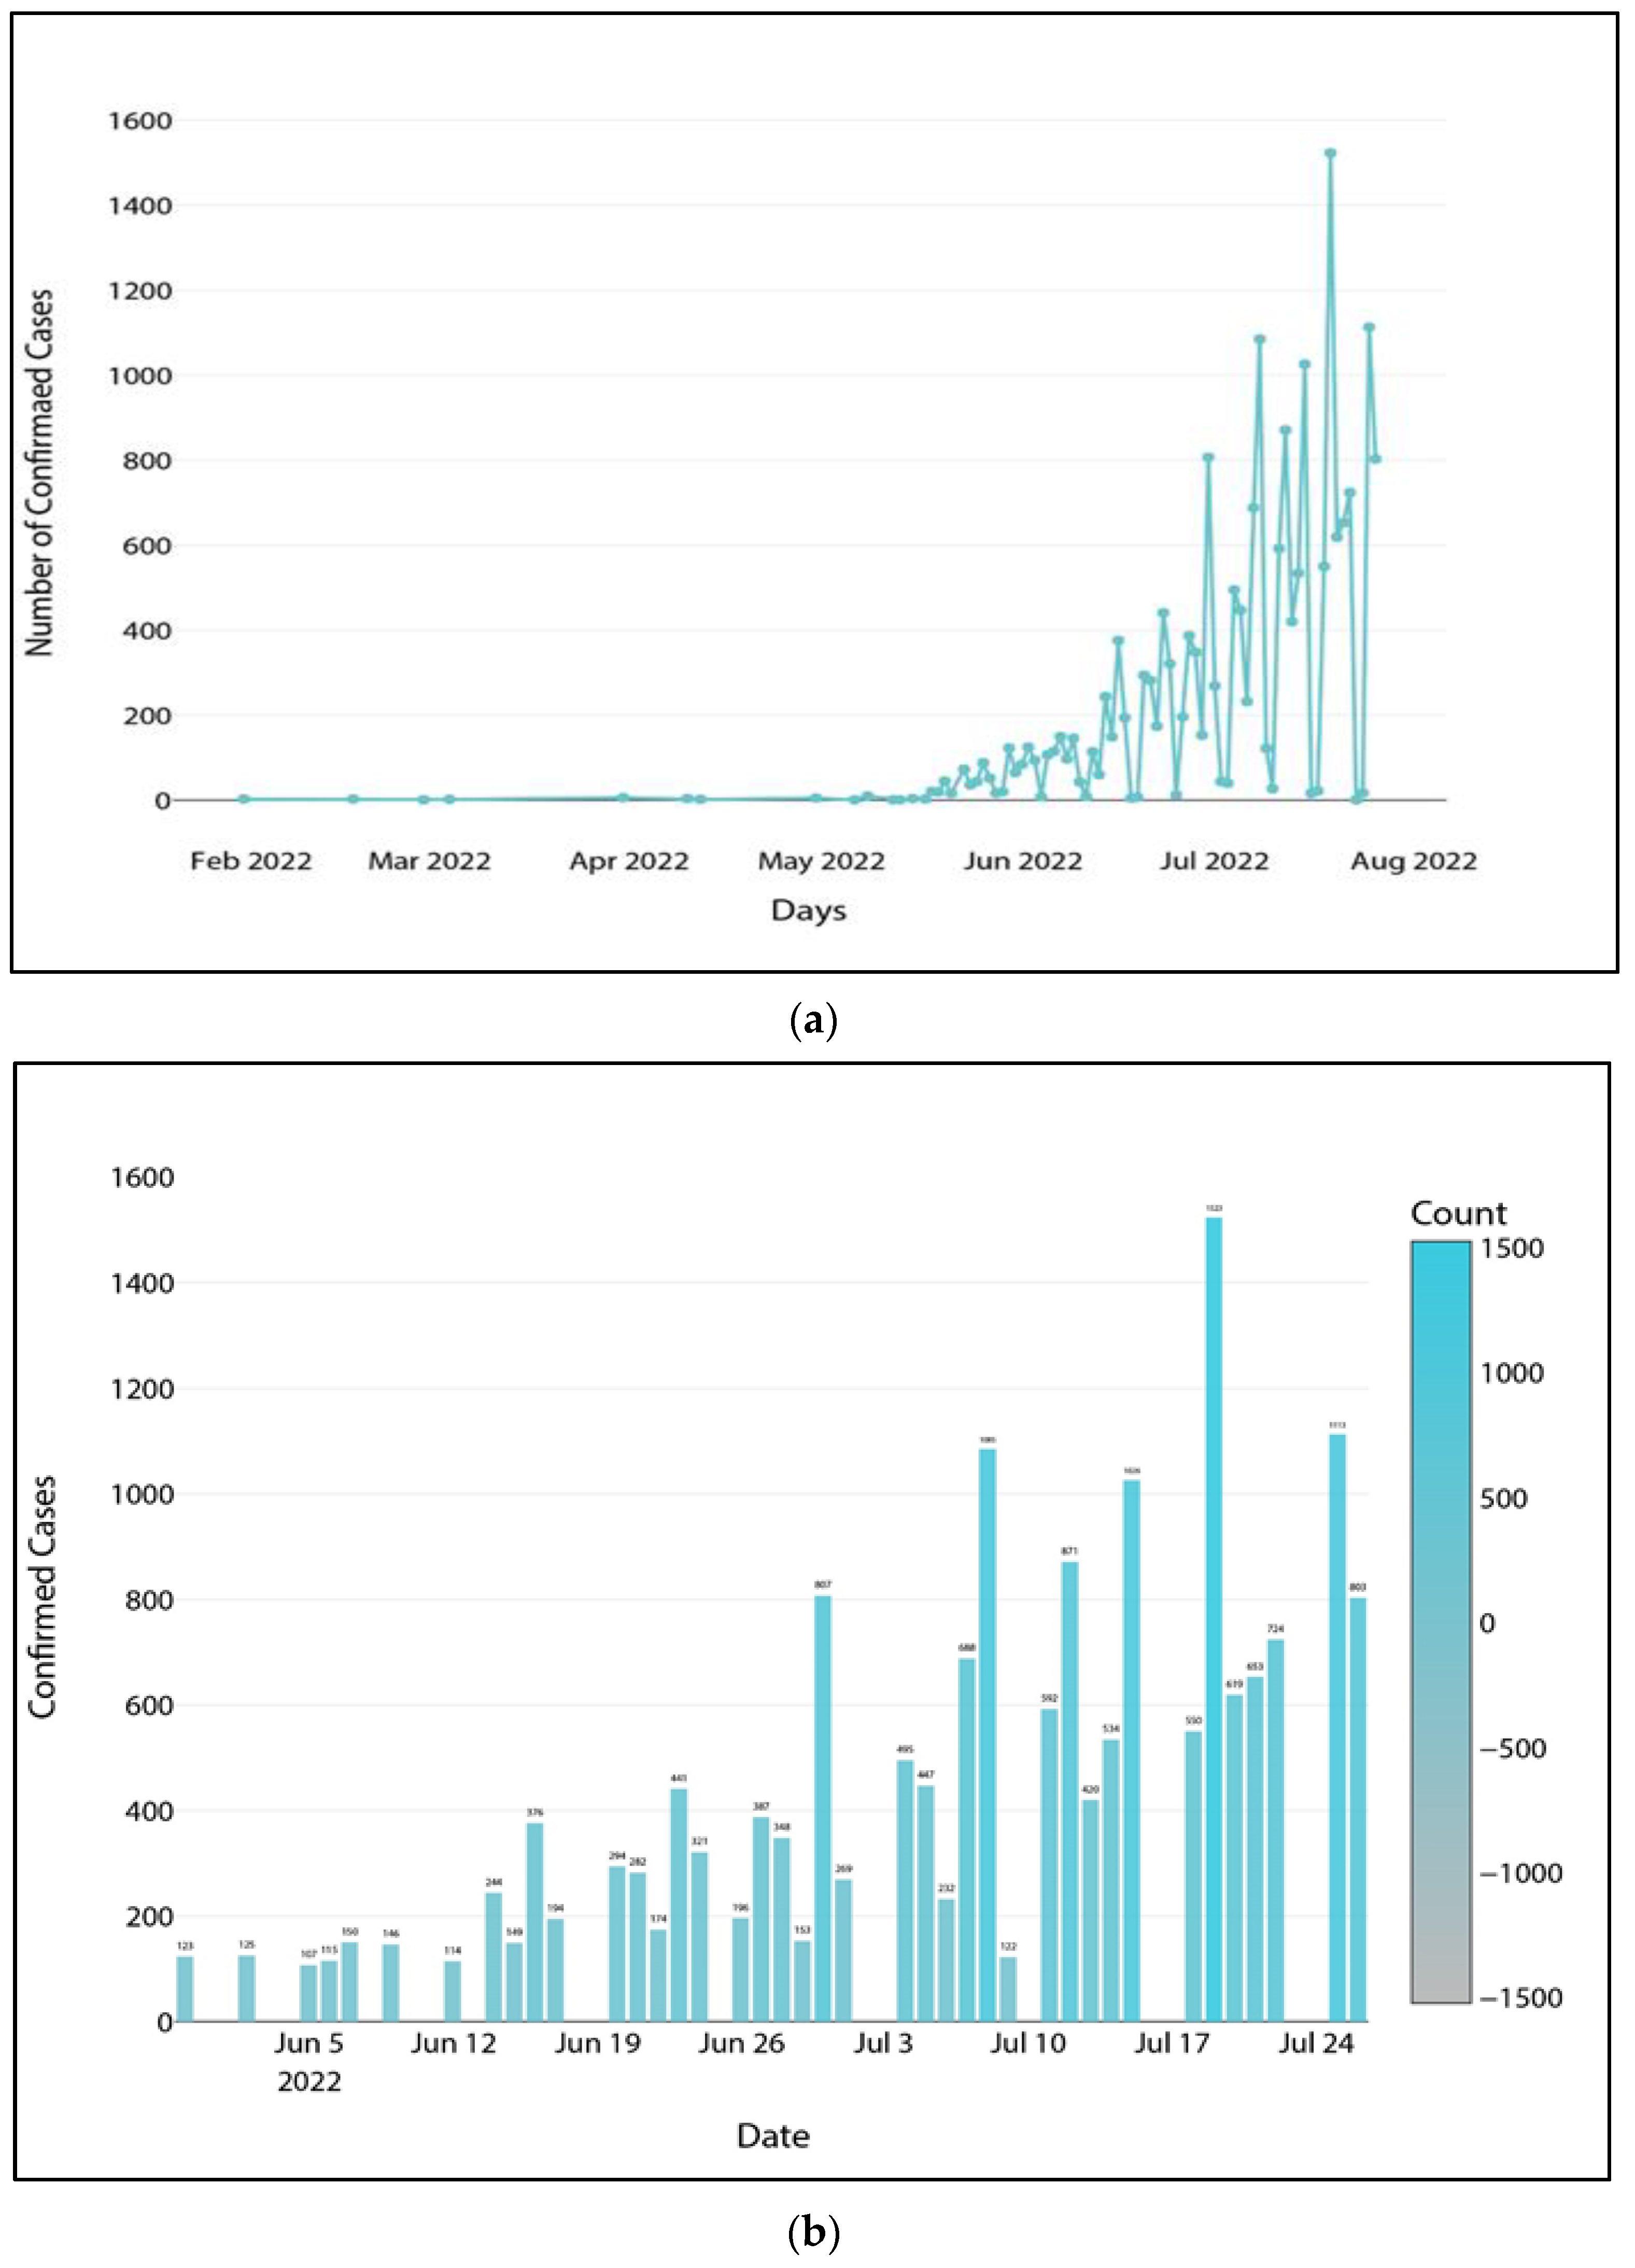
Figure 7.
(a) Global confirmed cases ordered by date and (b) global confirmed cases numbering more than 100 on any given day.
Figure 7.
(a) Global confirmed cases ordered by date and (b) global confirmed cases numbering more than 100 on any given day.
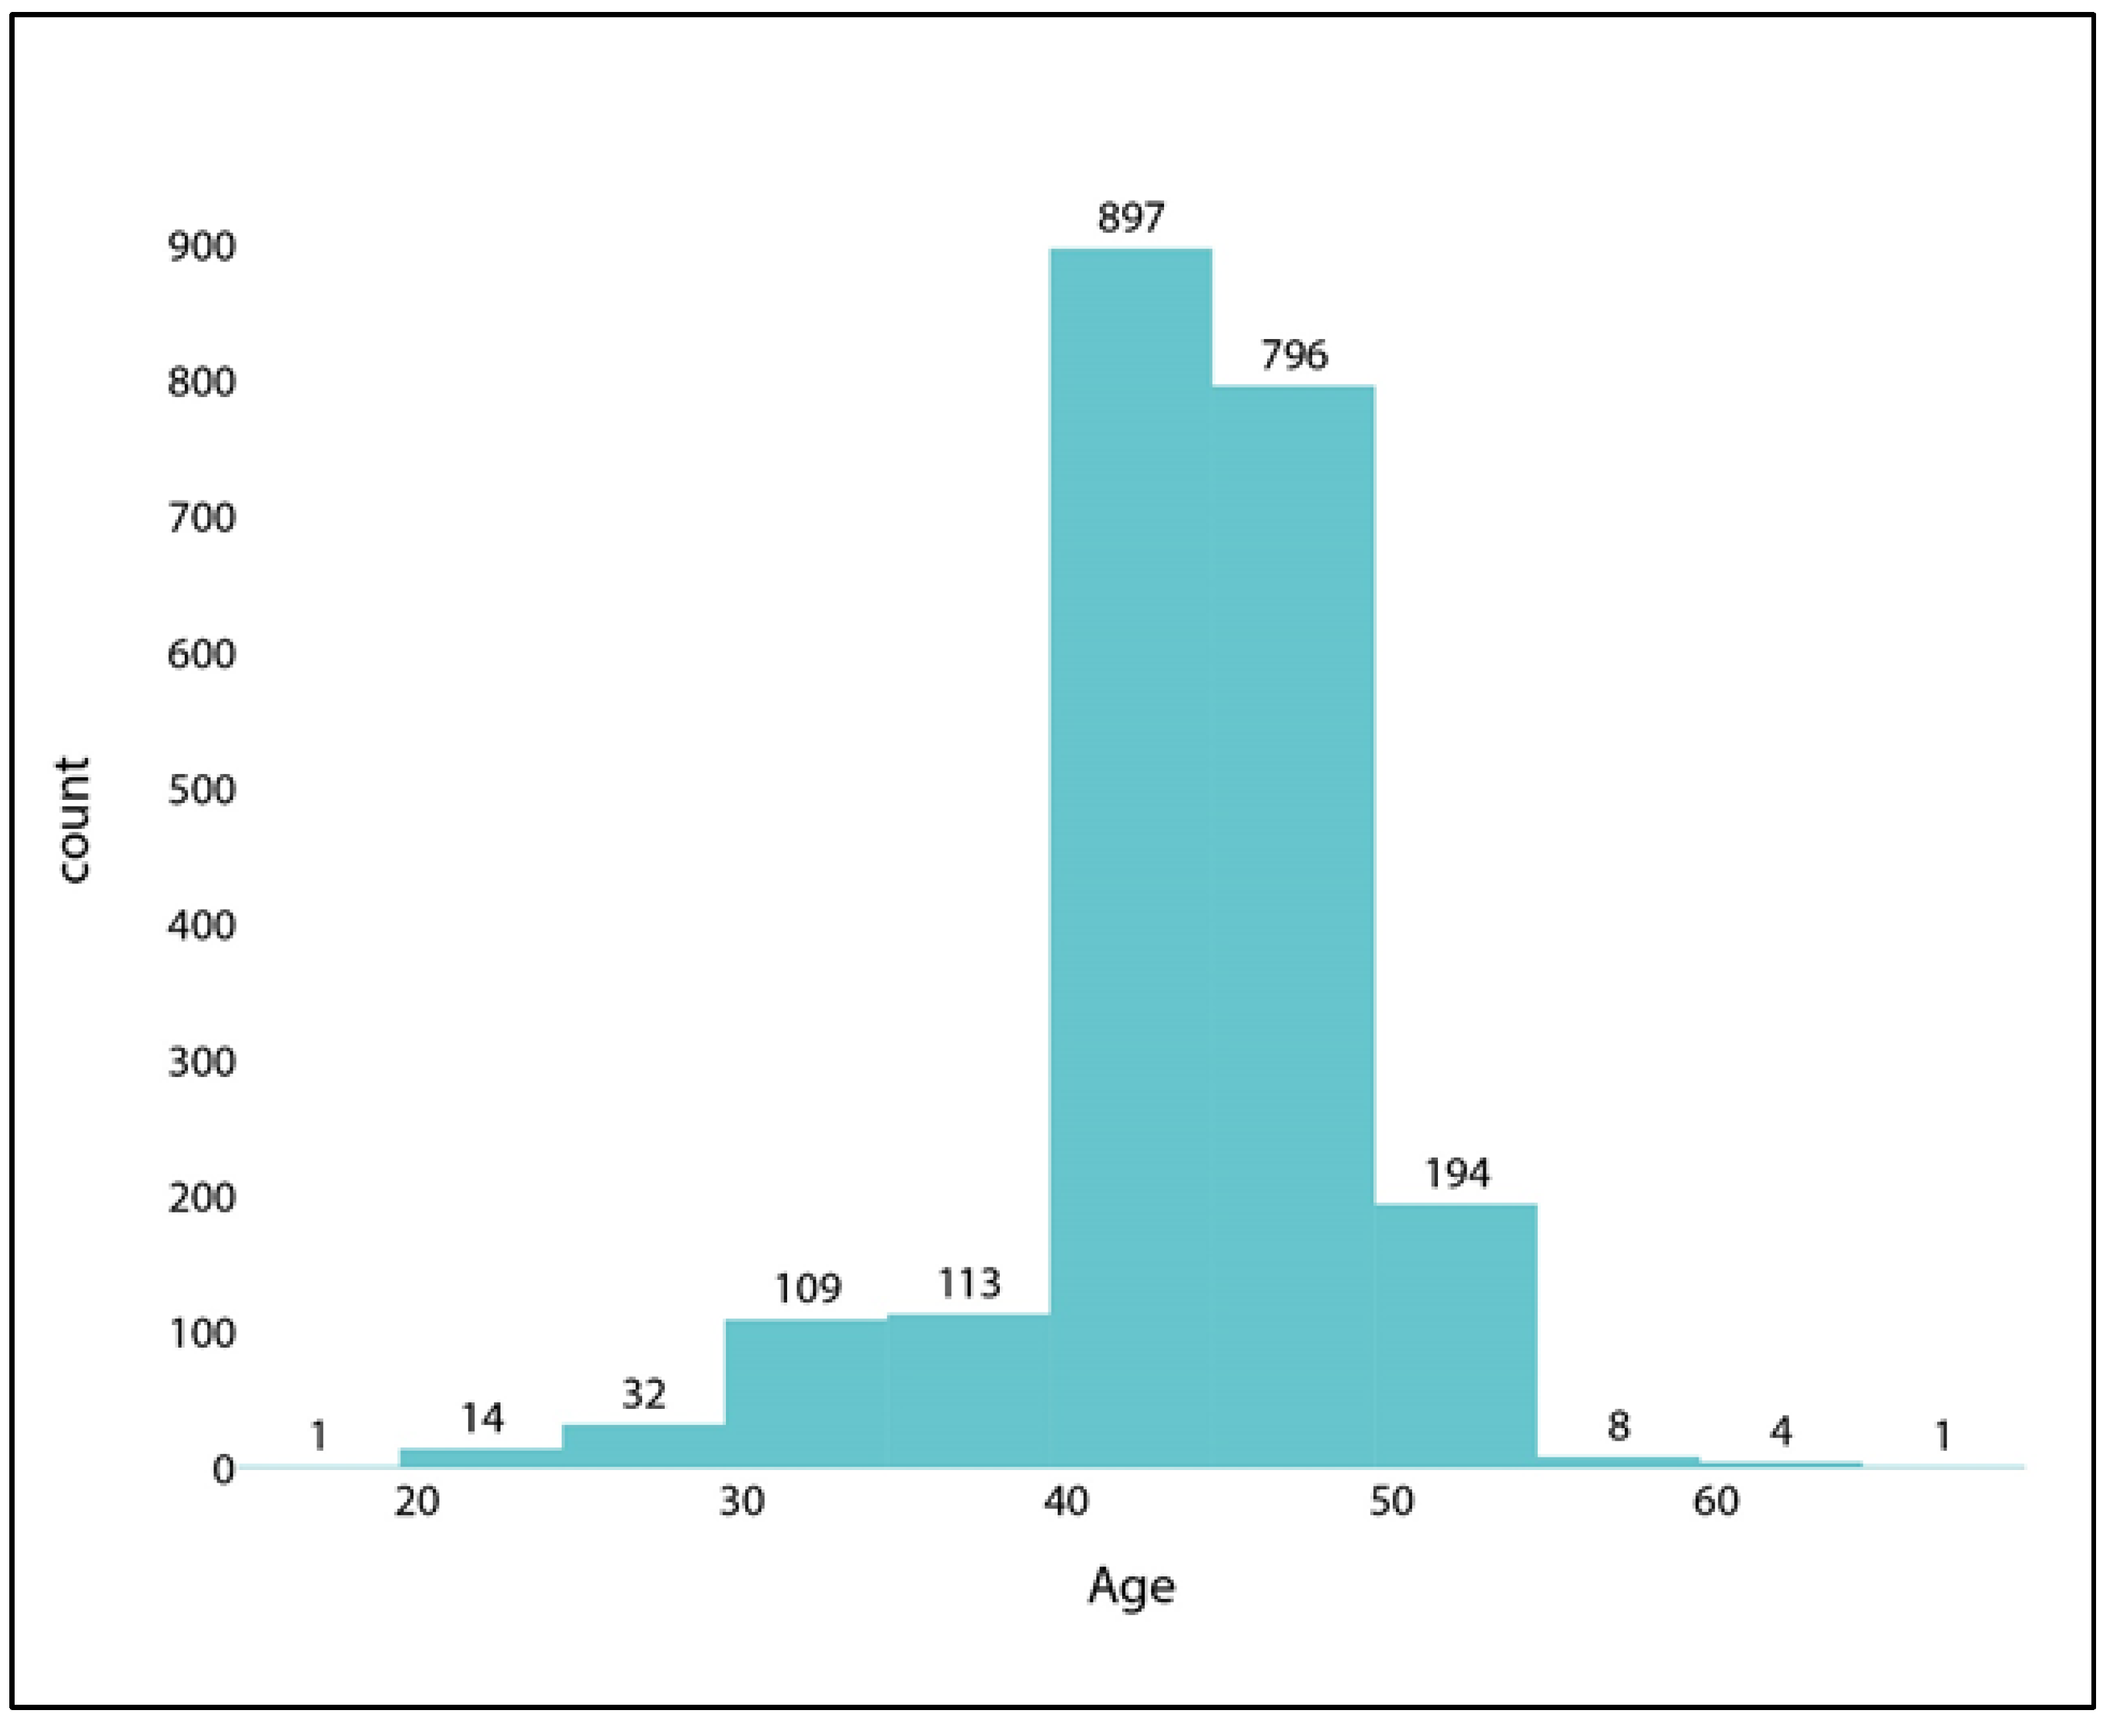
Figure 8.
Distribution of confirmed cases where the Age is over 15.
Figure 8.
Distribution of confirmed cases where the Age is over 15.
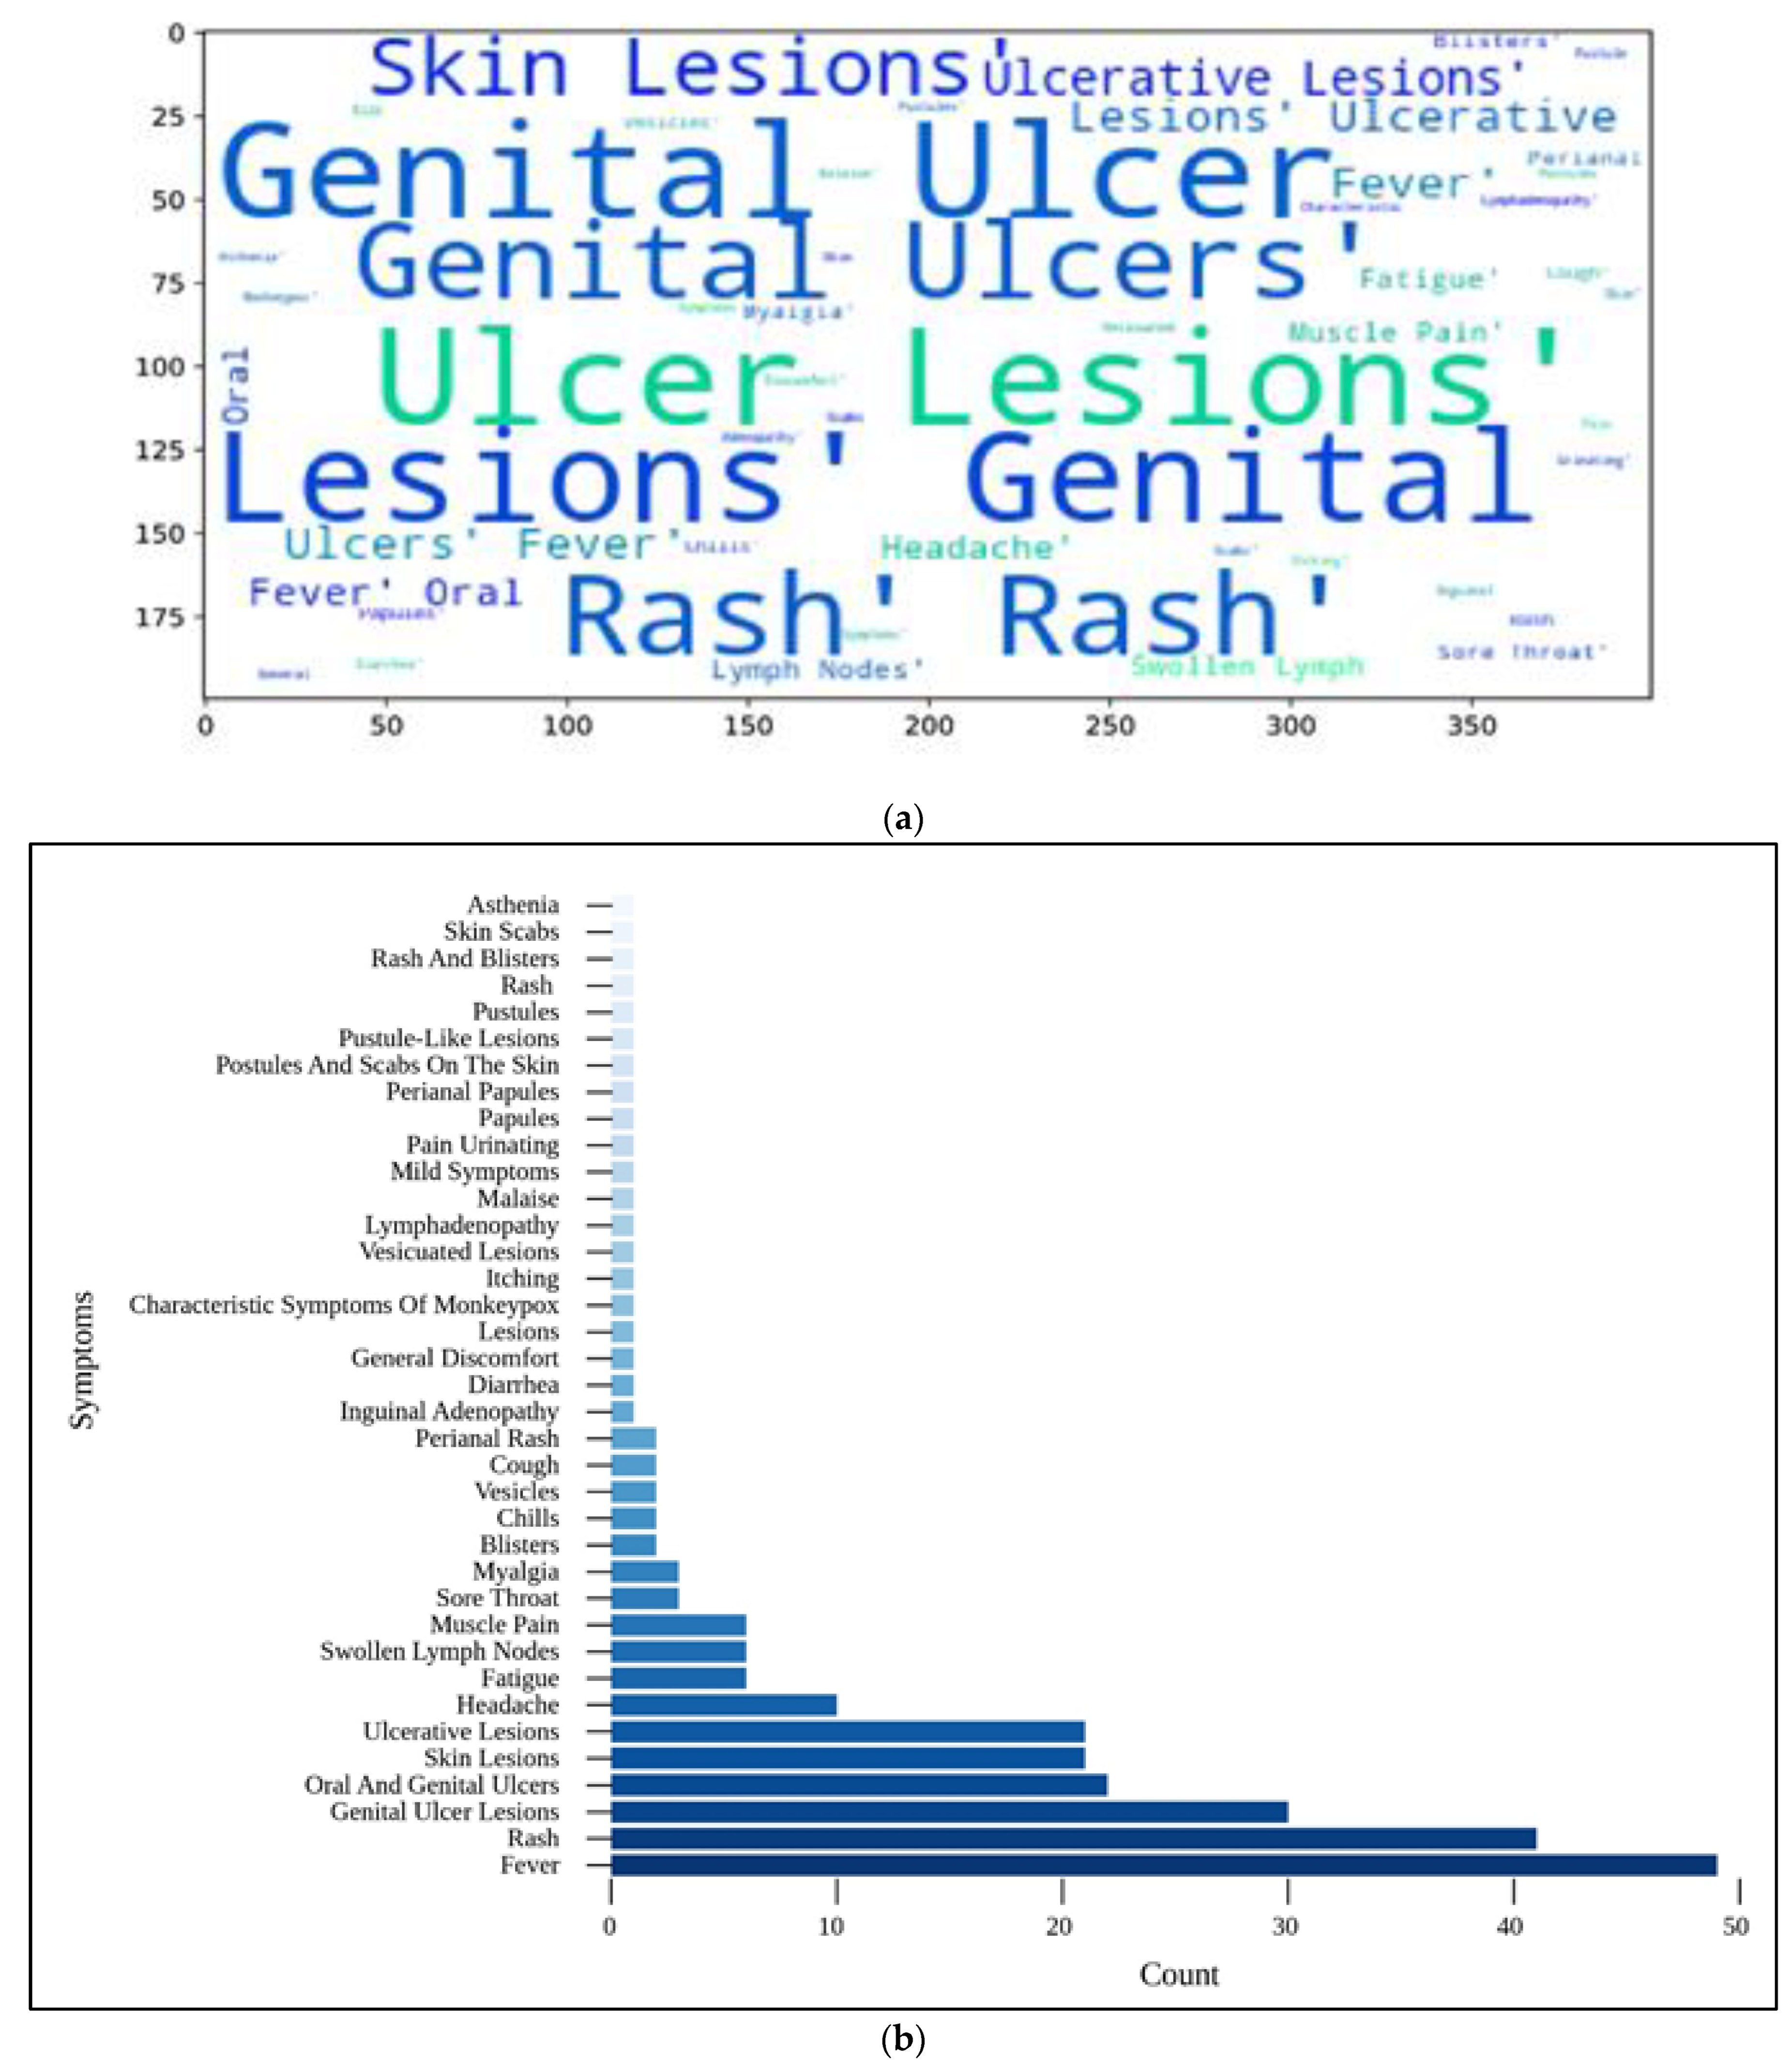
Figure 9.
(a) Individual symptoms word cloud; (b) categorization of confirmed cases according to their respective symptoms.
Figure 9.
(a) Individual symptoms word cloud; (b) categorization of confirmed cases according to their respective symptoms.
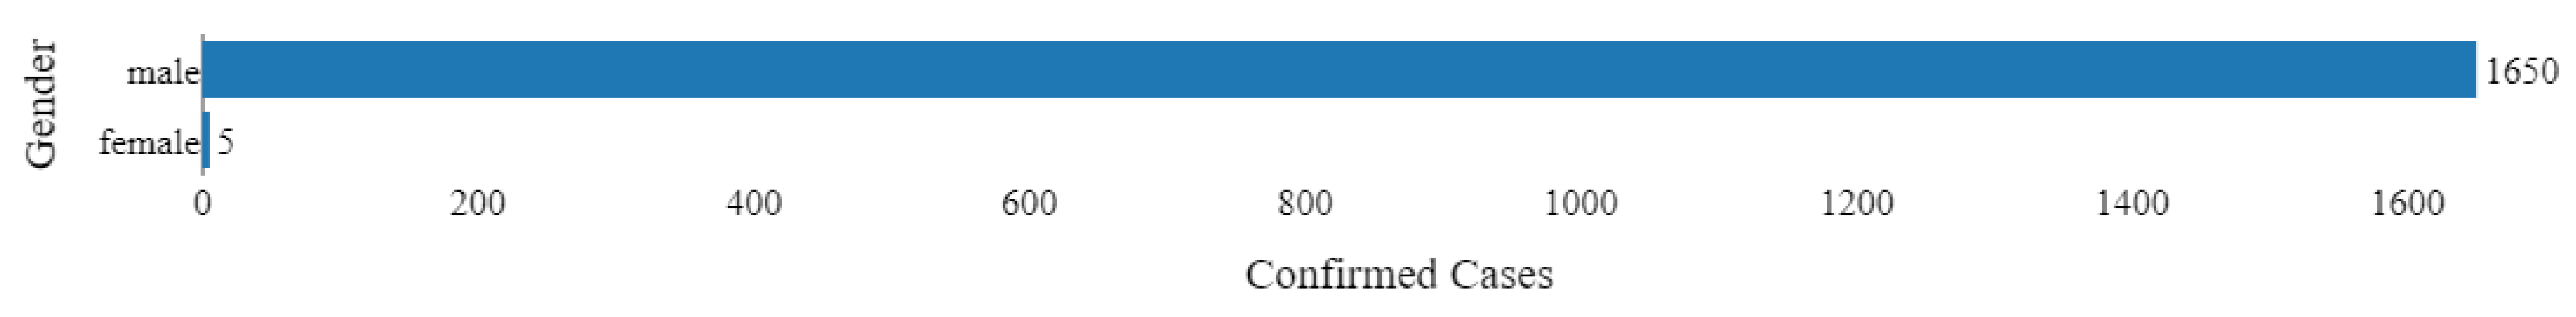
Figure 10.
Summary of total confirmed cases according to gender.
Figure 10.
Summary of total confirmed cases according to gender.
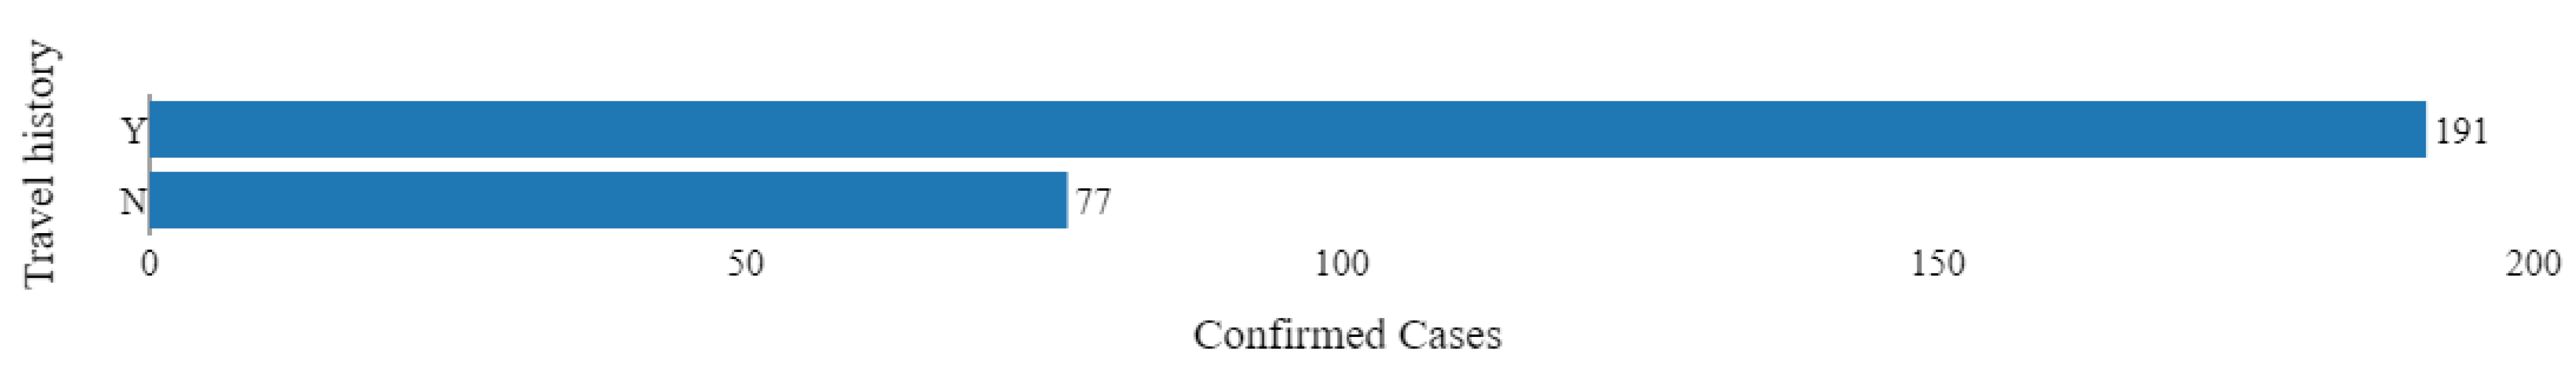
Figure 11.
Distribution of confirmed cases with travel history.
Figure 11.
Distribution of confirmed cases with travel history.
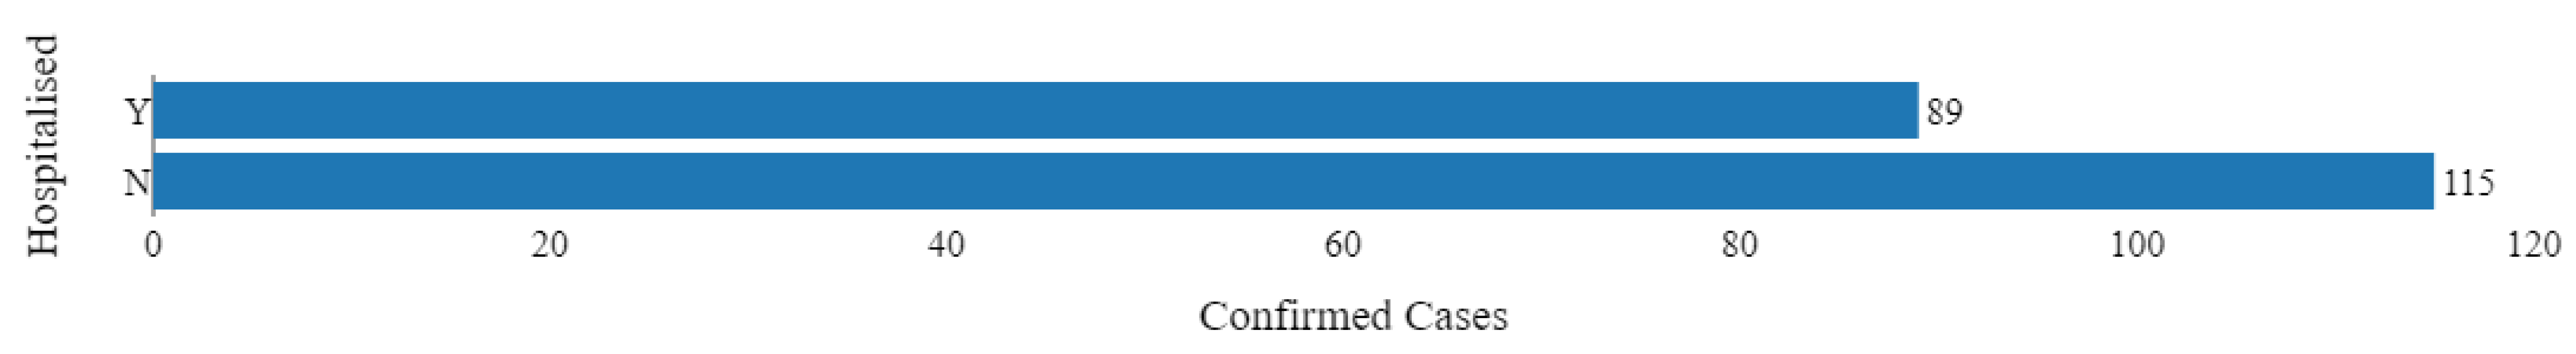
Figure 12.
Statistics of the hospitalized percentage of confirmed cases.
Figure 12.
Statistics of the hospitalized percentage of confirmed cases.
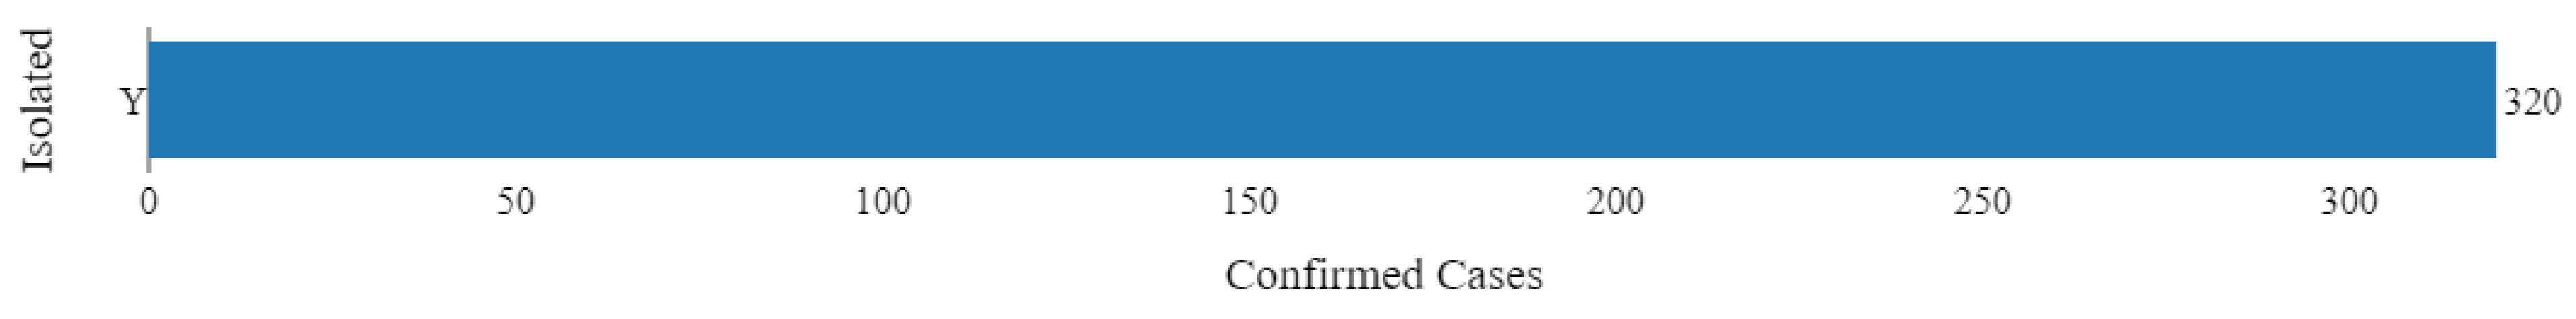
Figure 13.
Number of confirmed cases with isolation record.
Figure 13.
Number of confirmed cases with isolation record.
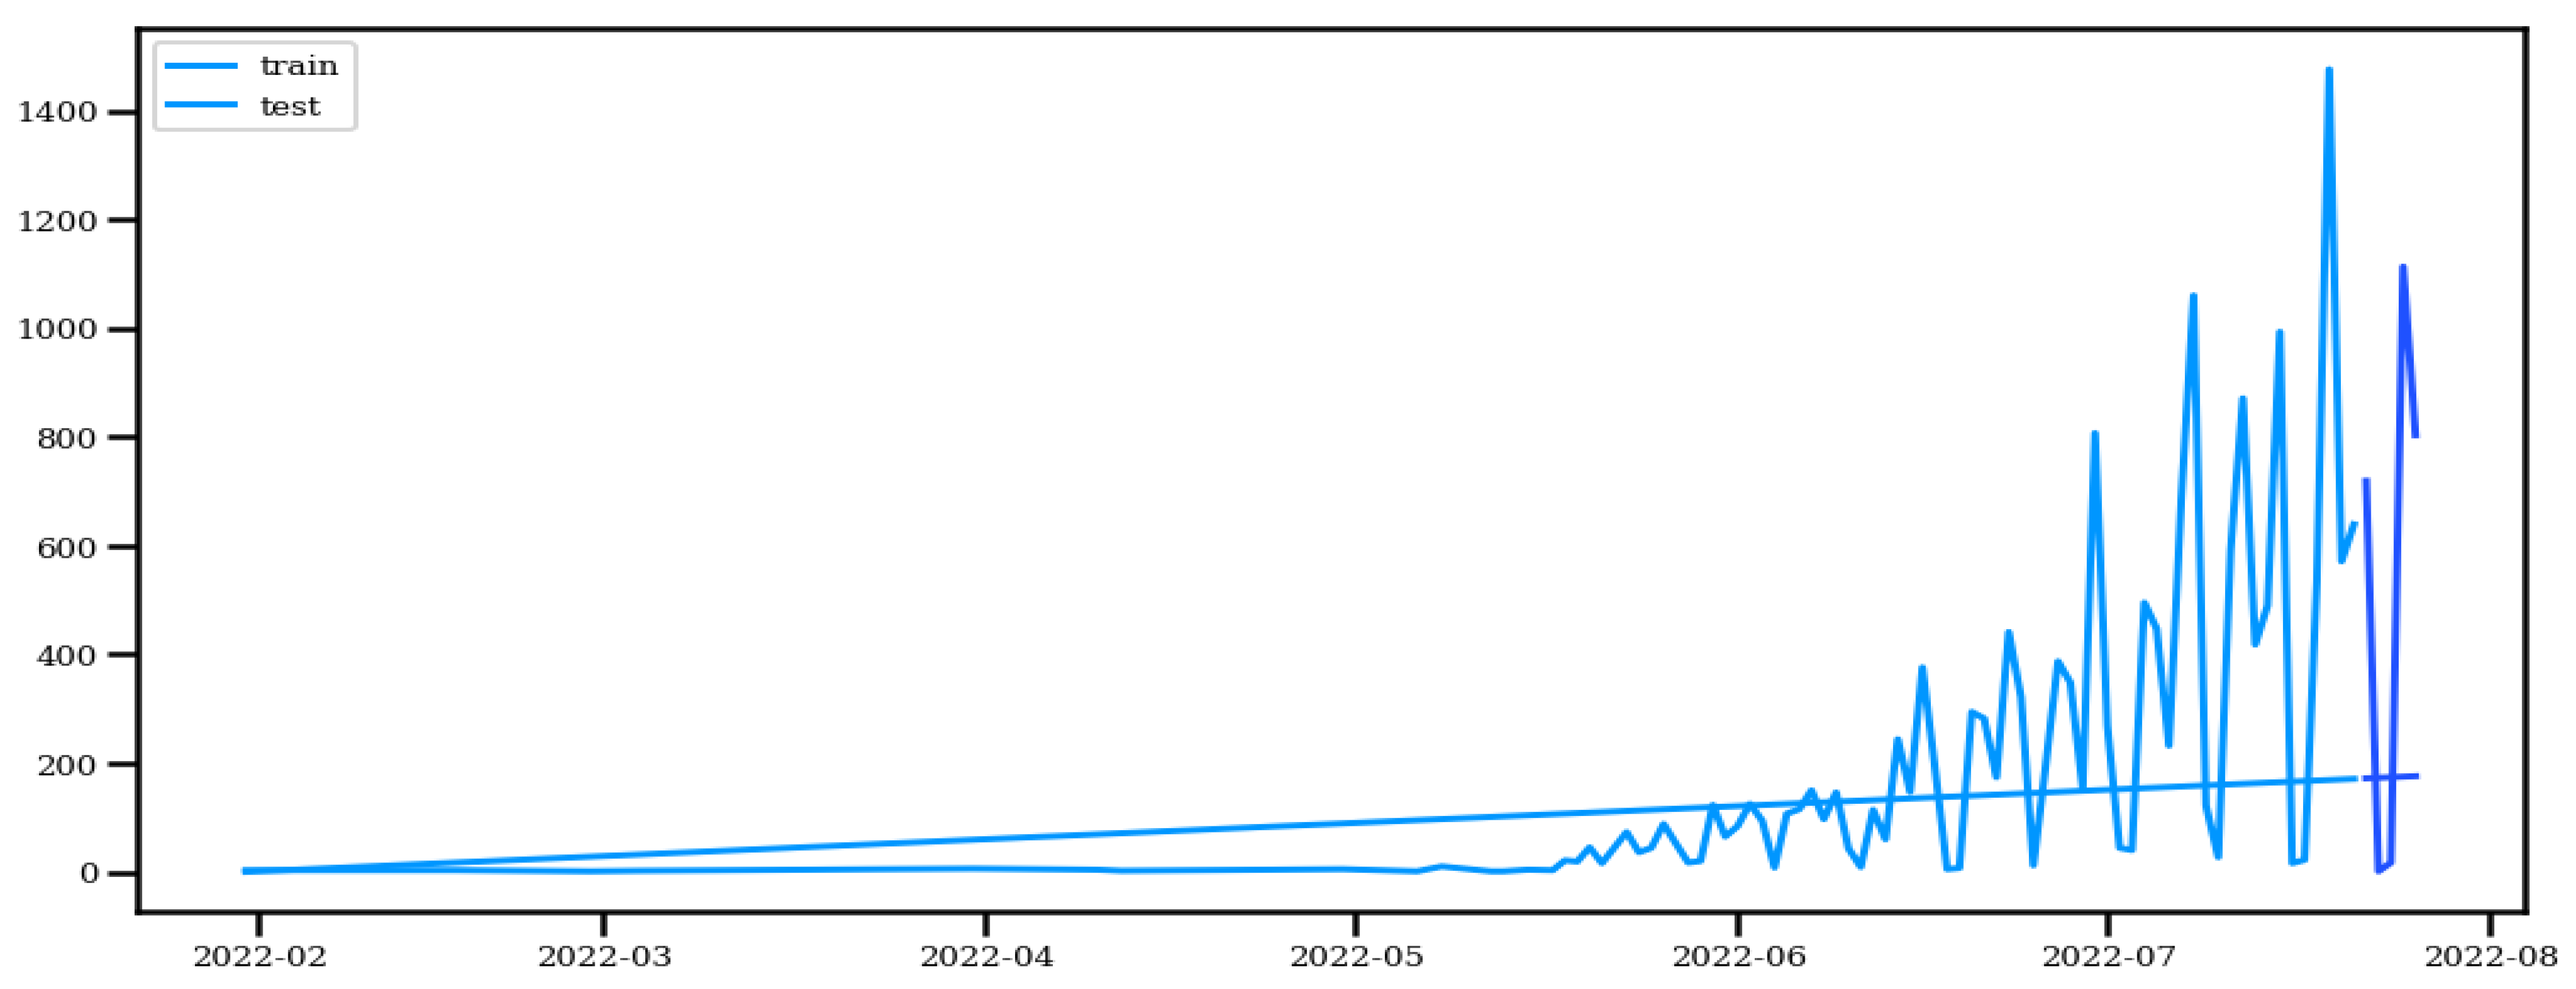
Figure 14.
Train Test Split.
Figure 14.
Train Test Split.
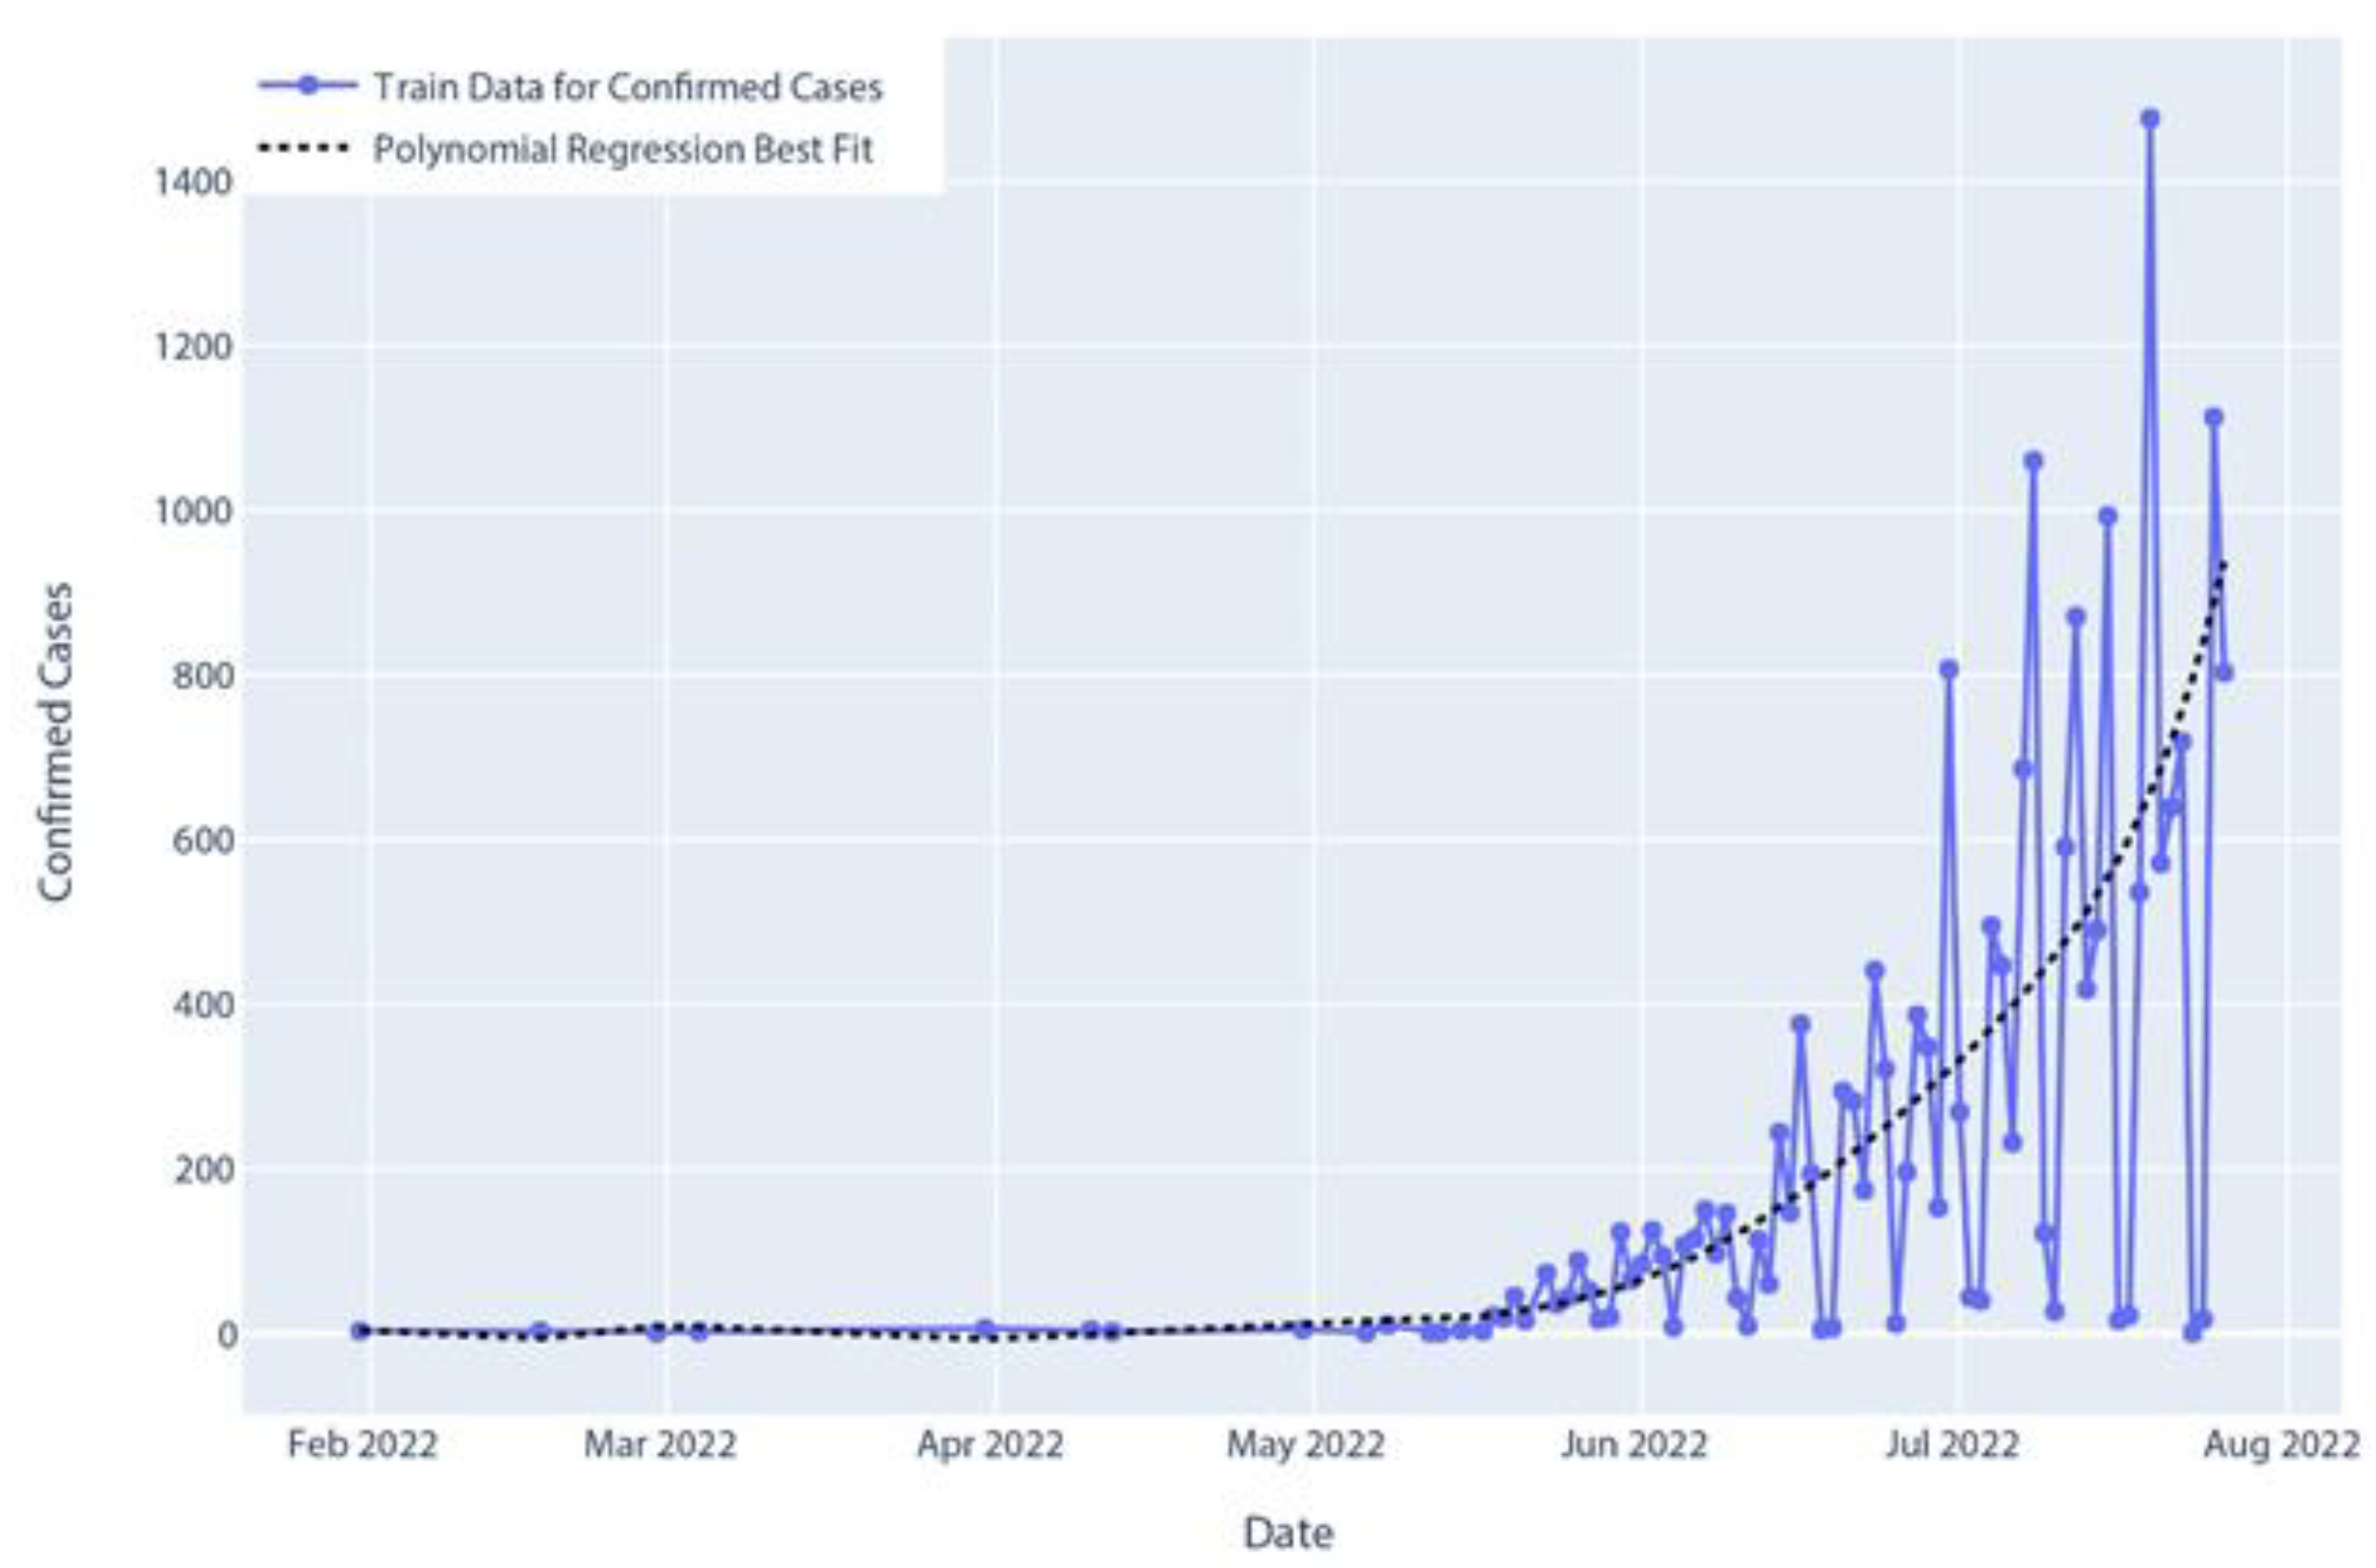
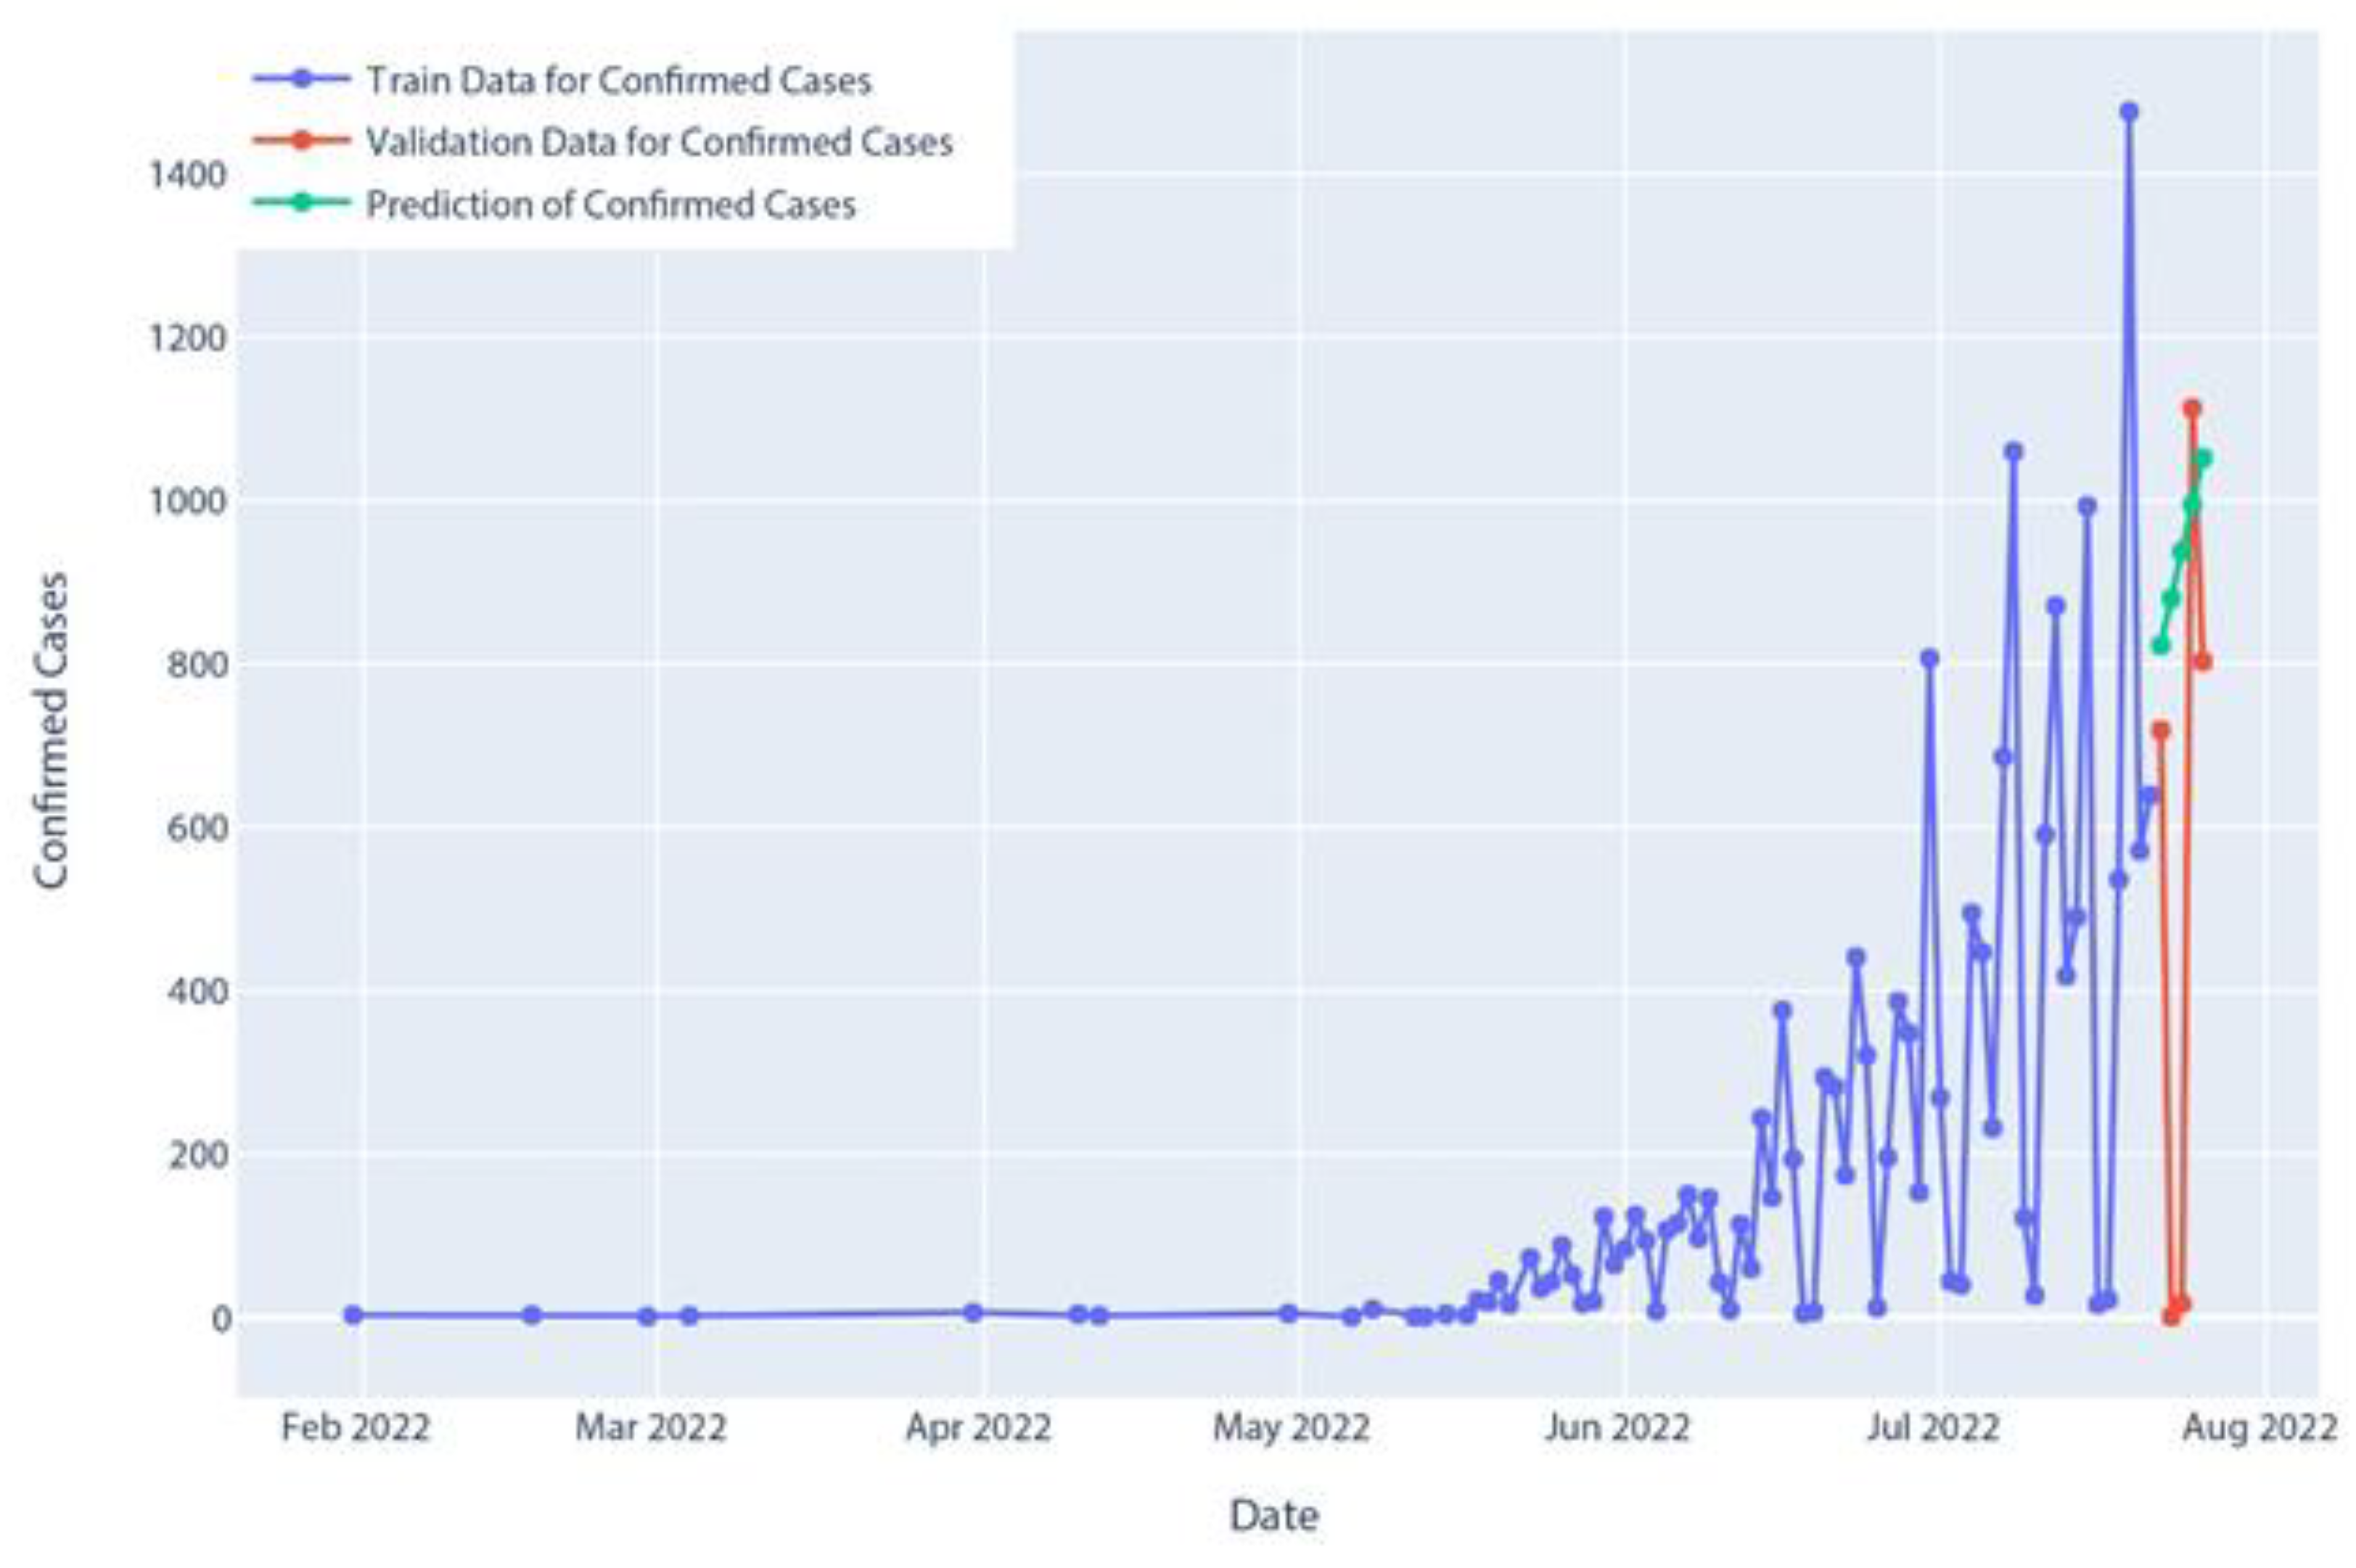
Figure 15.
Confirmed cases of polynomial regression model prediction.
Figure 15.
Confirmed cases of polynomial regression model prediction.
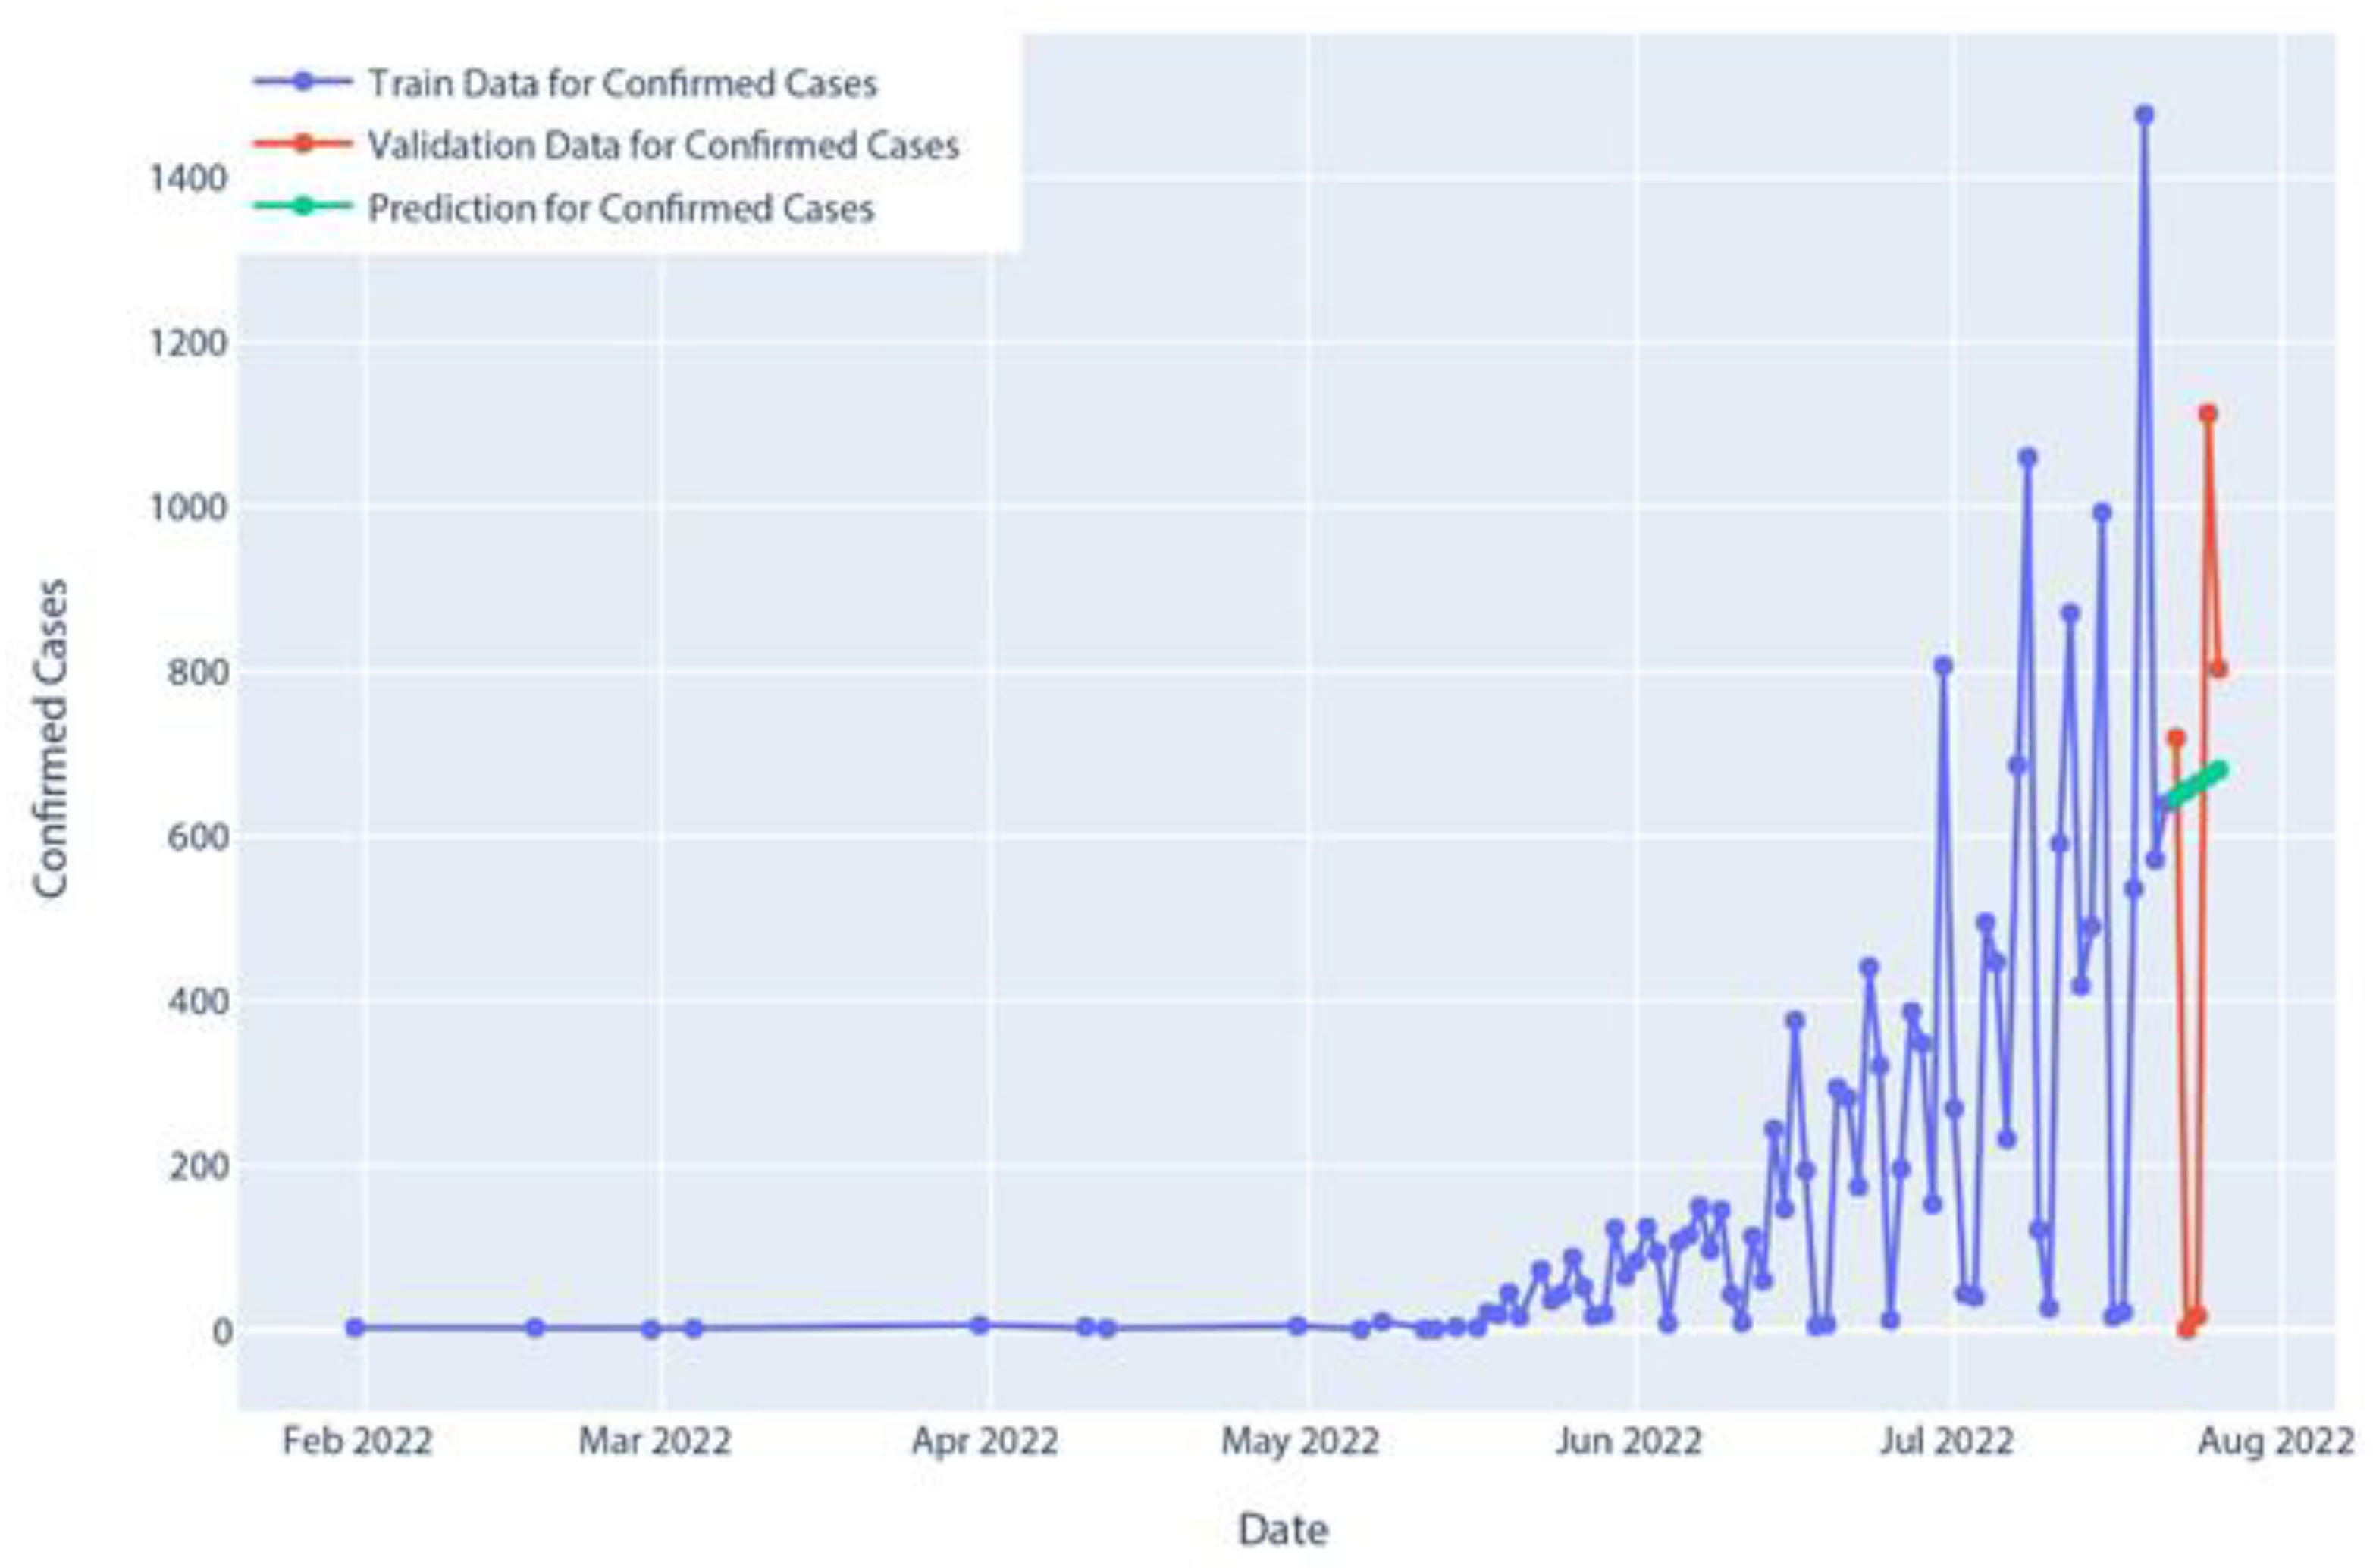
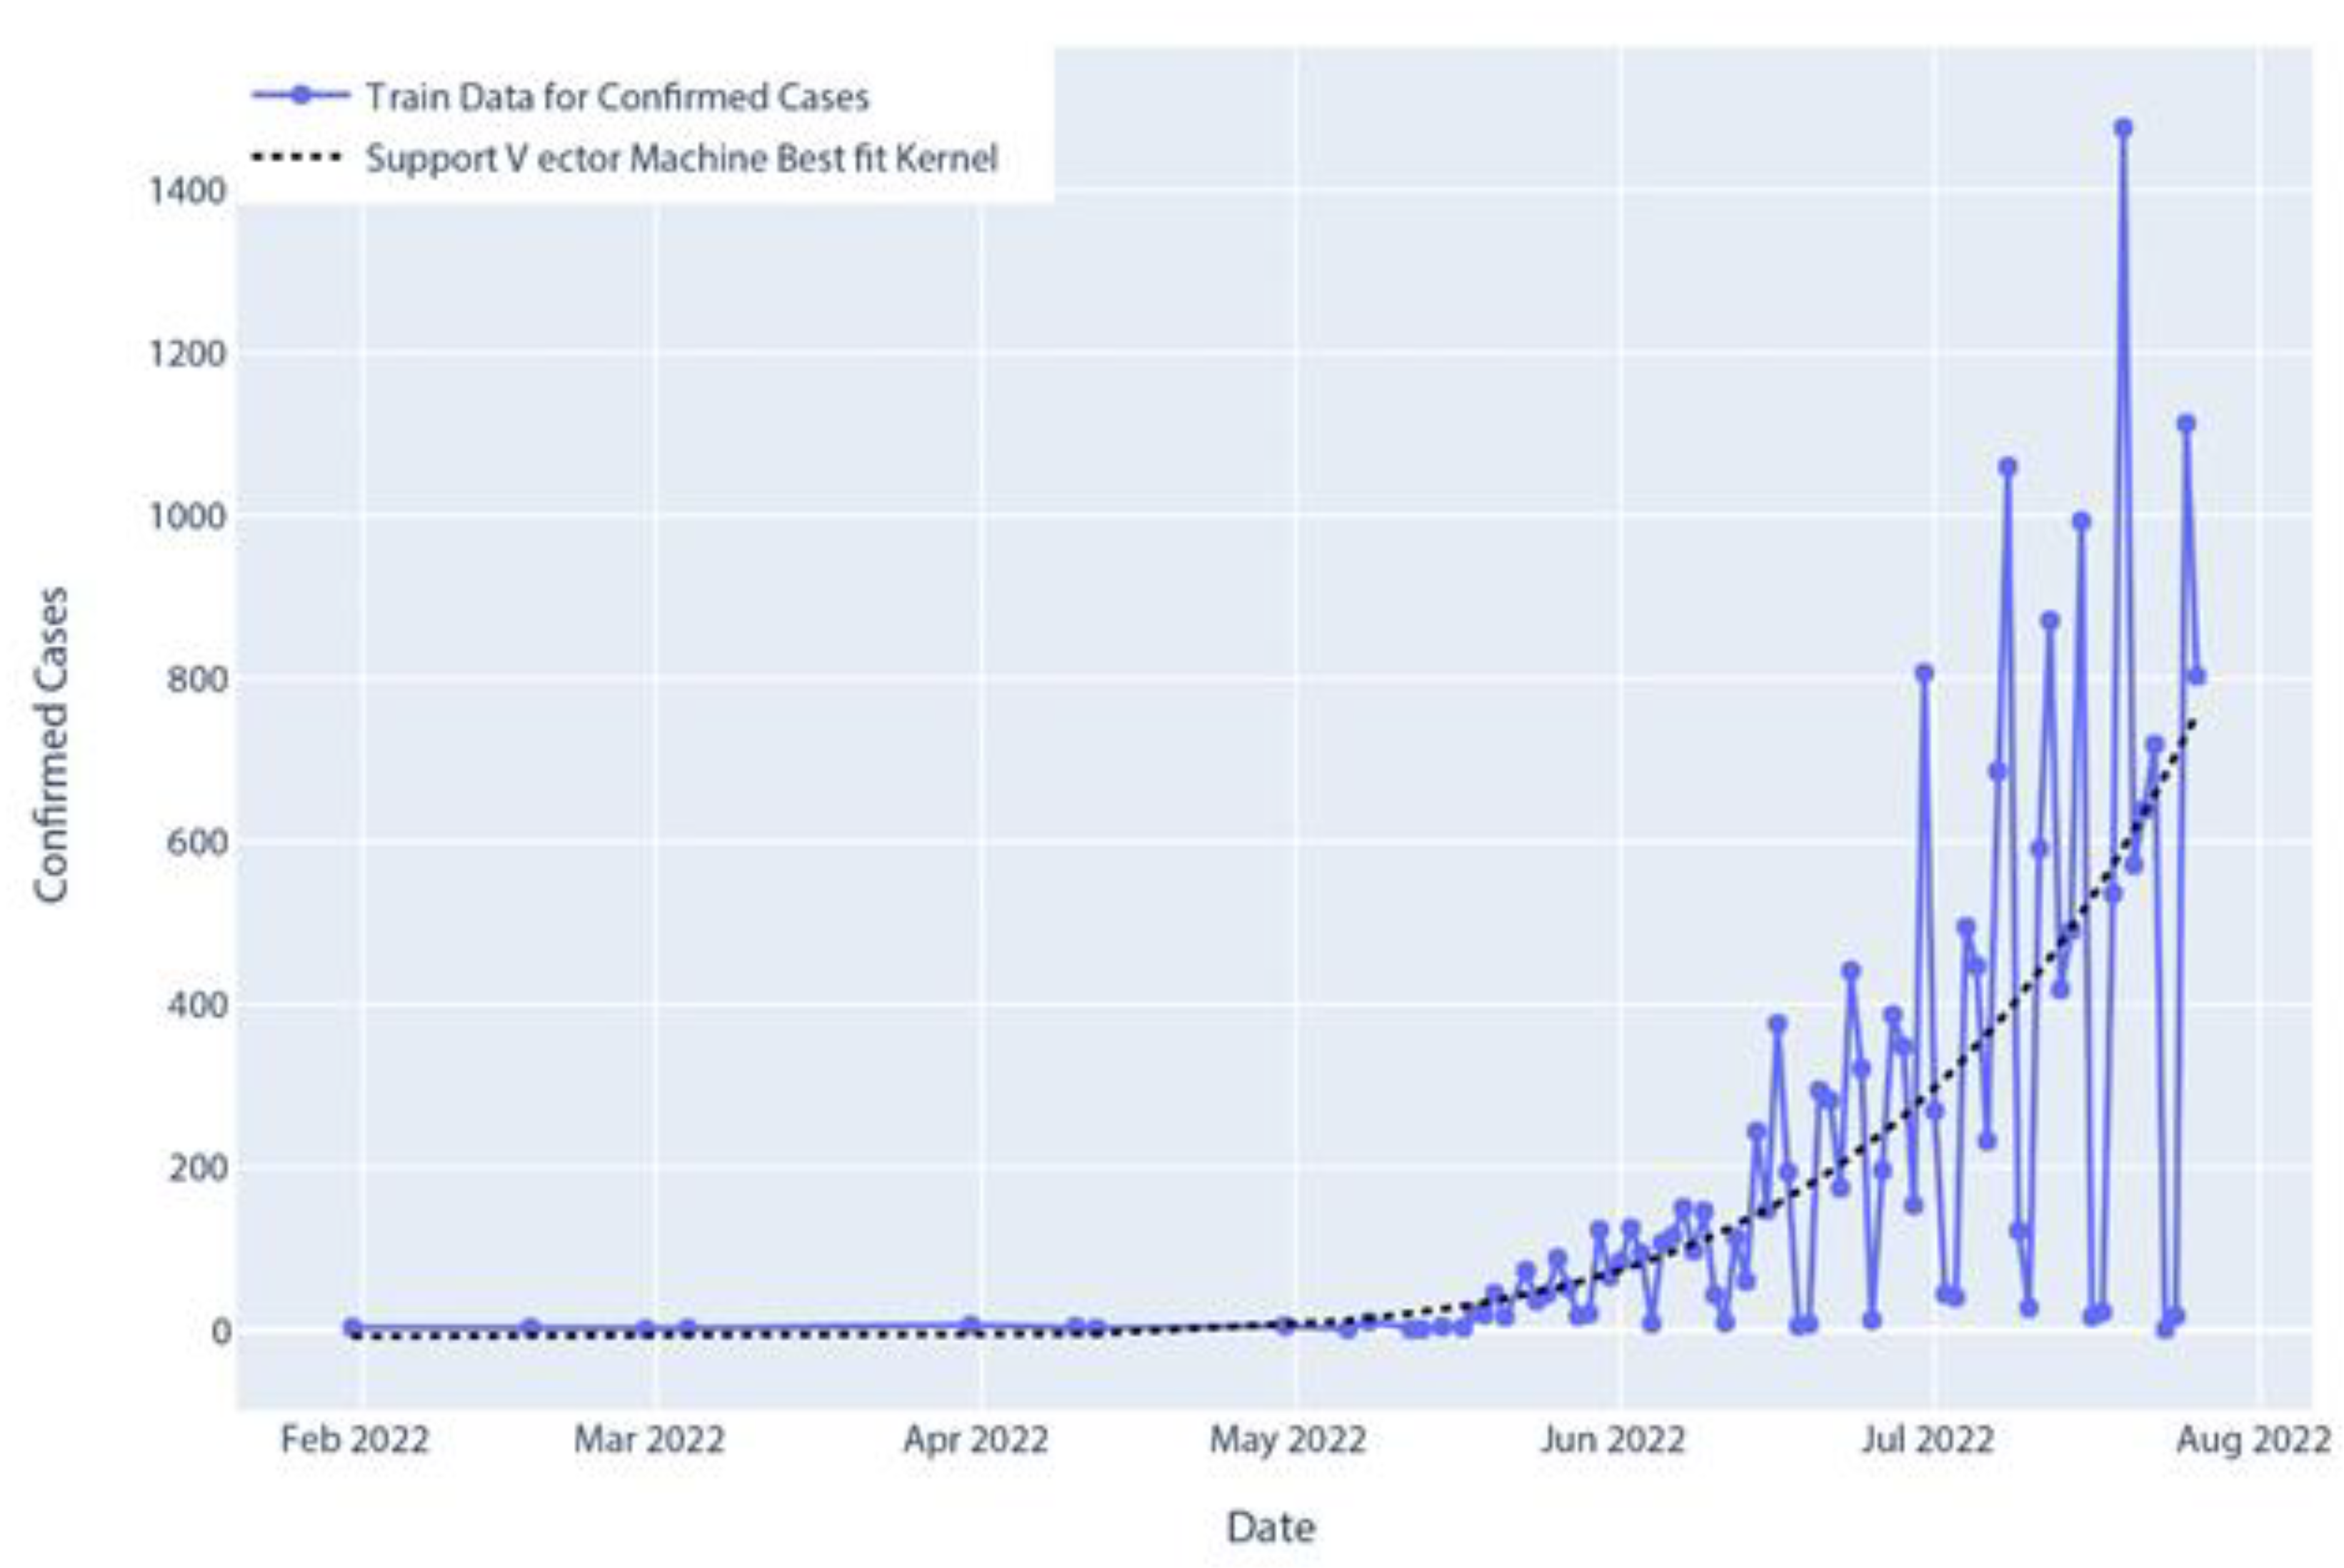
Figure 16.
Confirmed cases of SVR (support vector regression) prediction.
Figure 16.
Confirmed cases of SVR (support vector regression) prediction.
Figure 17.
Confirmed cases in Holt’s linear model prediction.
Figure 17.
Confirmed cases in Holt’s linear model prediction.
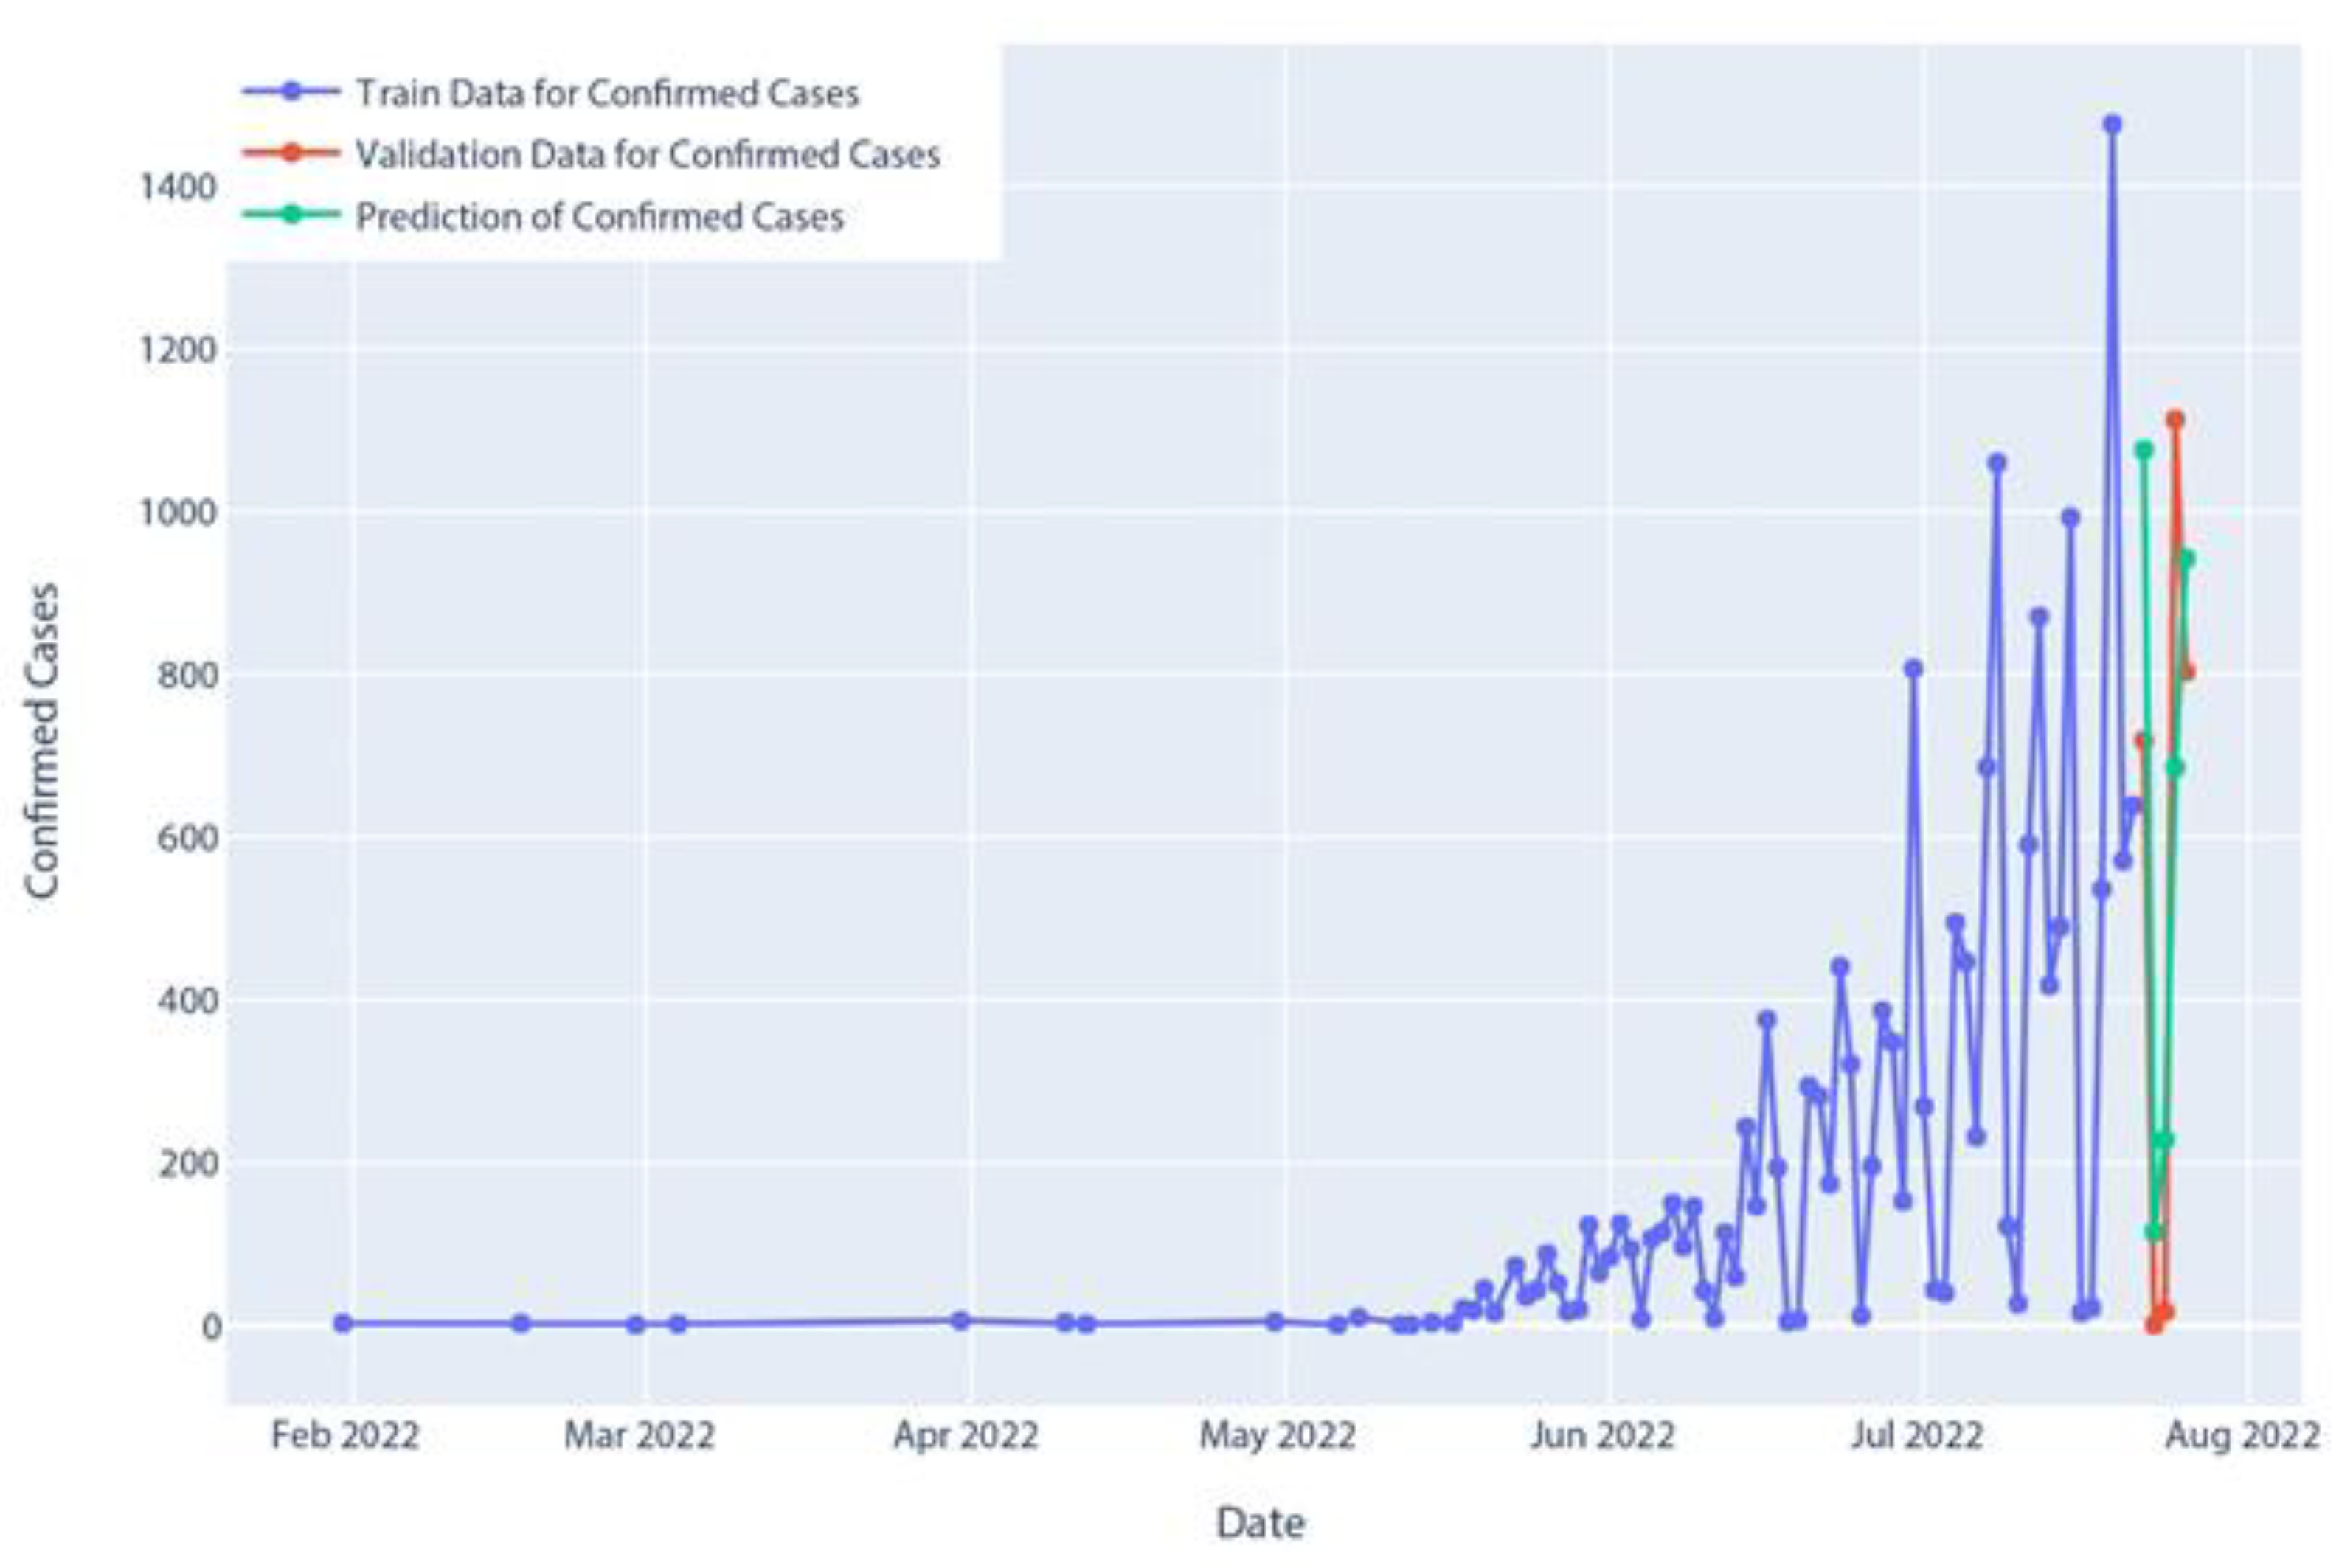
Figure 18.
Confirmed cases in Holt–Winter’s model prediction.
Figure 18.
Confirmed cases in Holt–Winter’s model prediction.
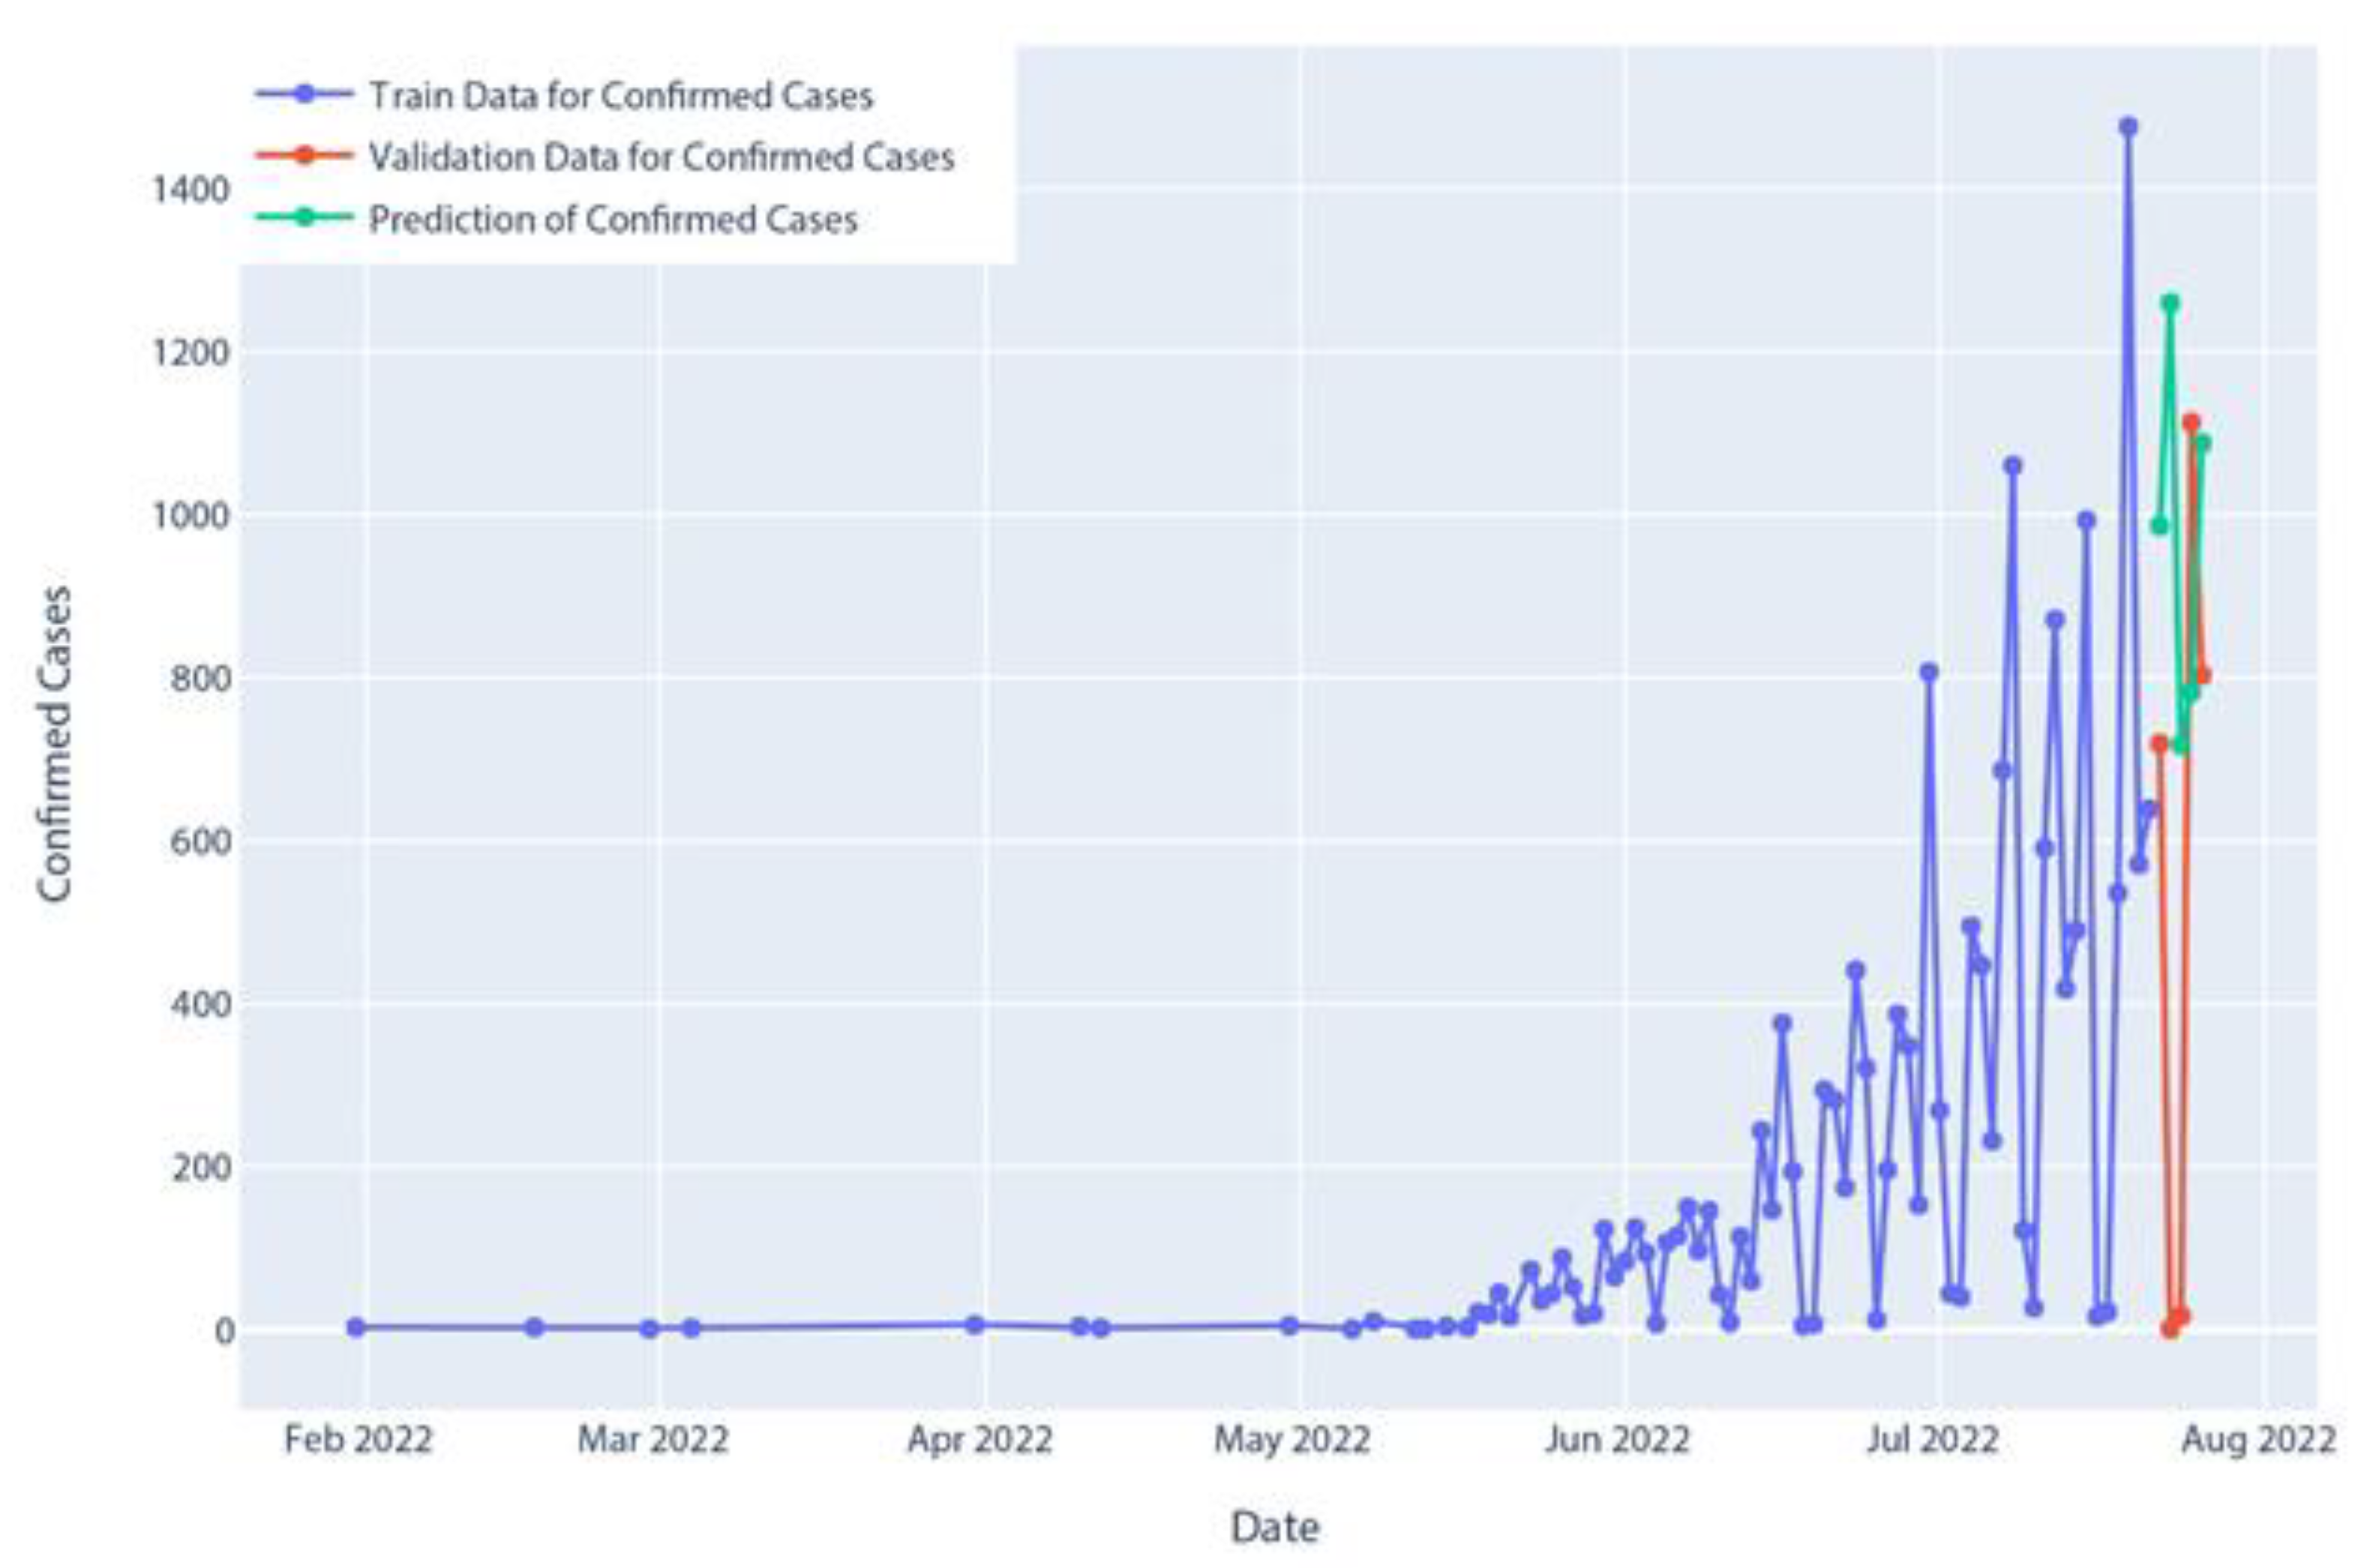
Figure 19.
Confirmed cases of AR model prediction.
Figure 19.
Confirmed cases of AR model prediction.
Figure 20.
Confirmed cases of MA model prediction.
Figure 20.
Confirmed cases of MA model prediction.
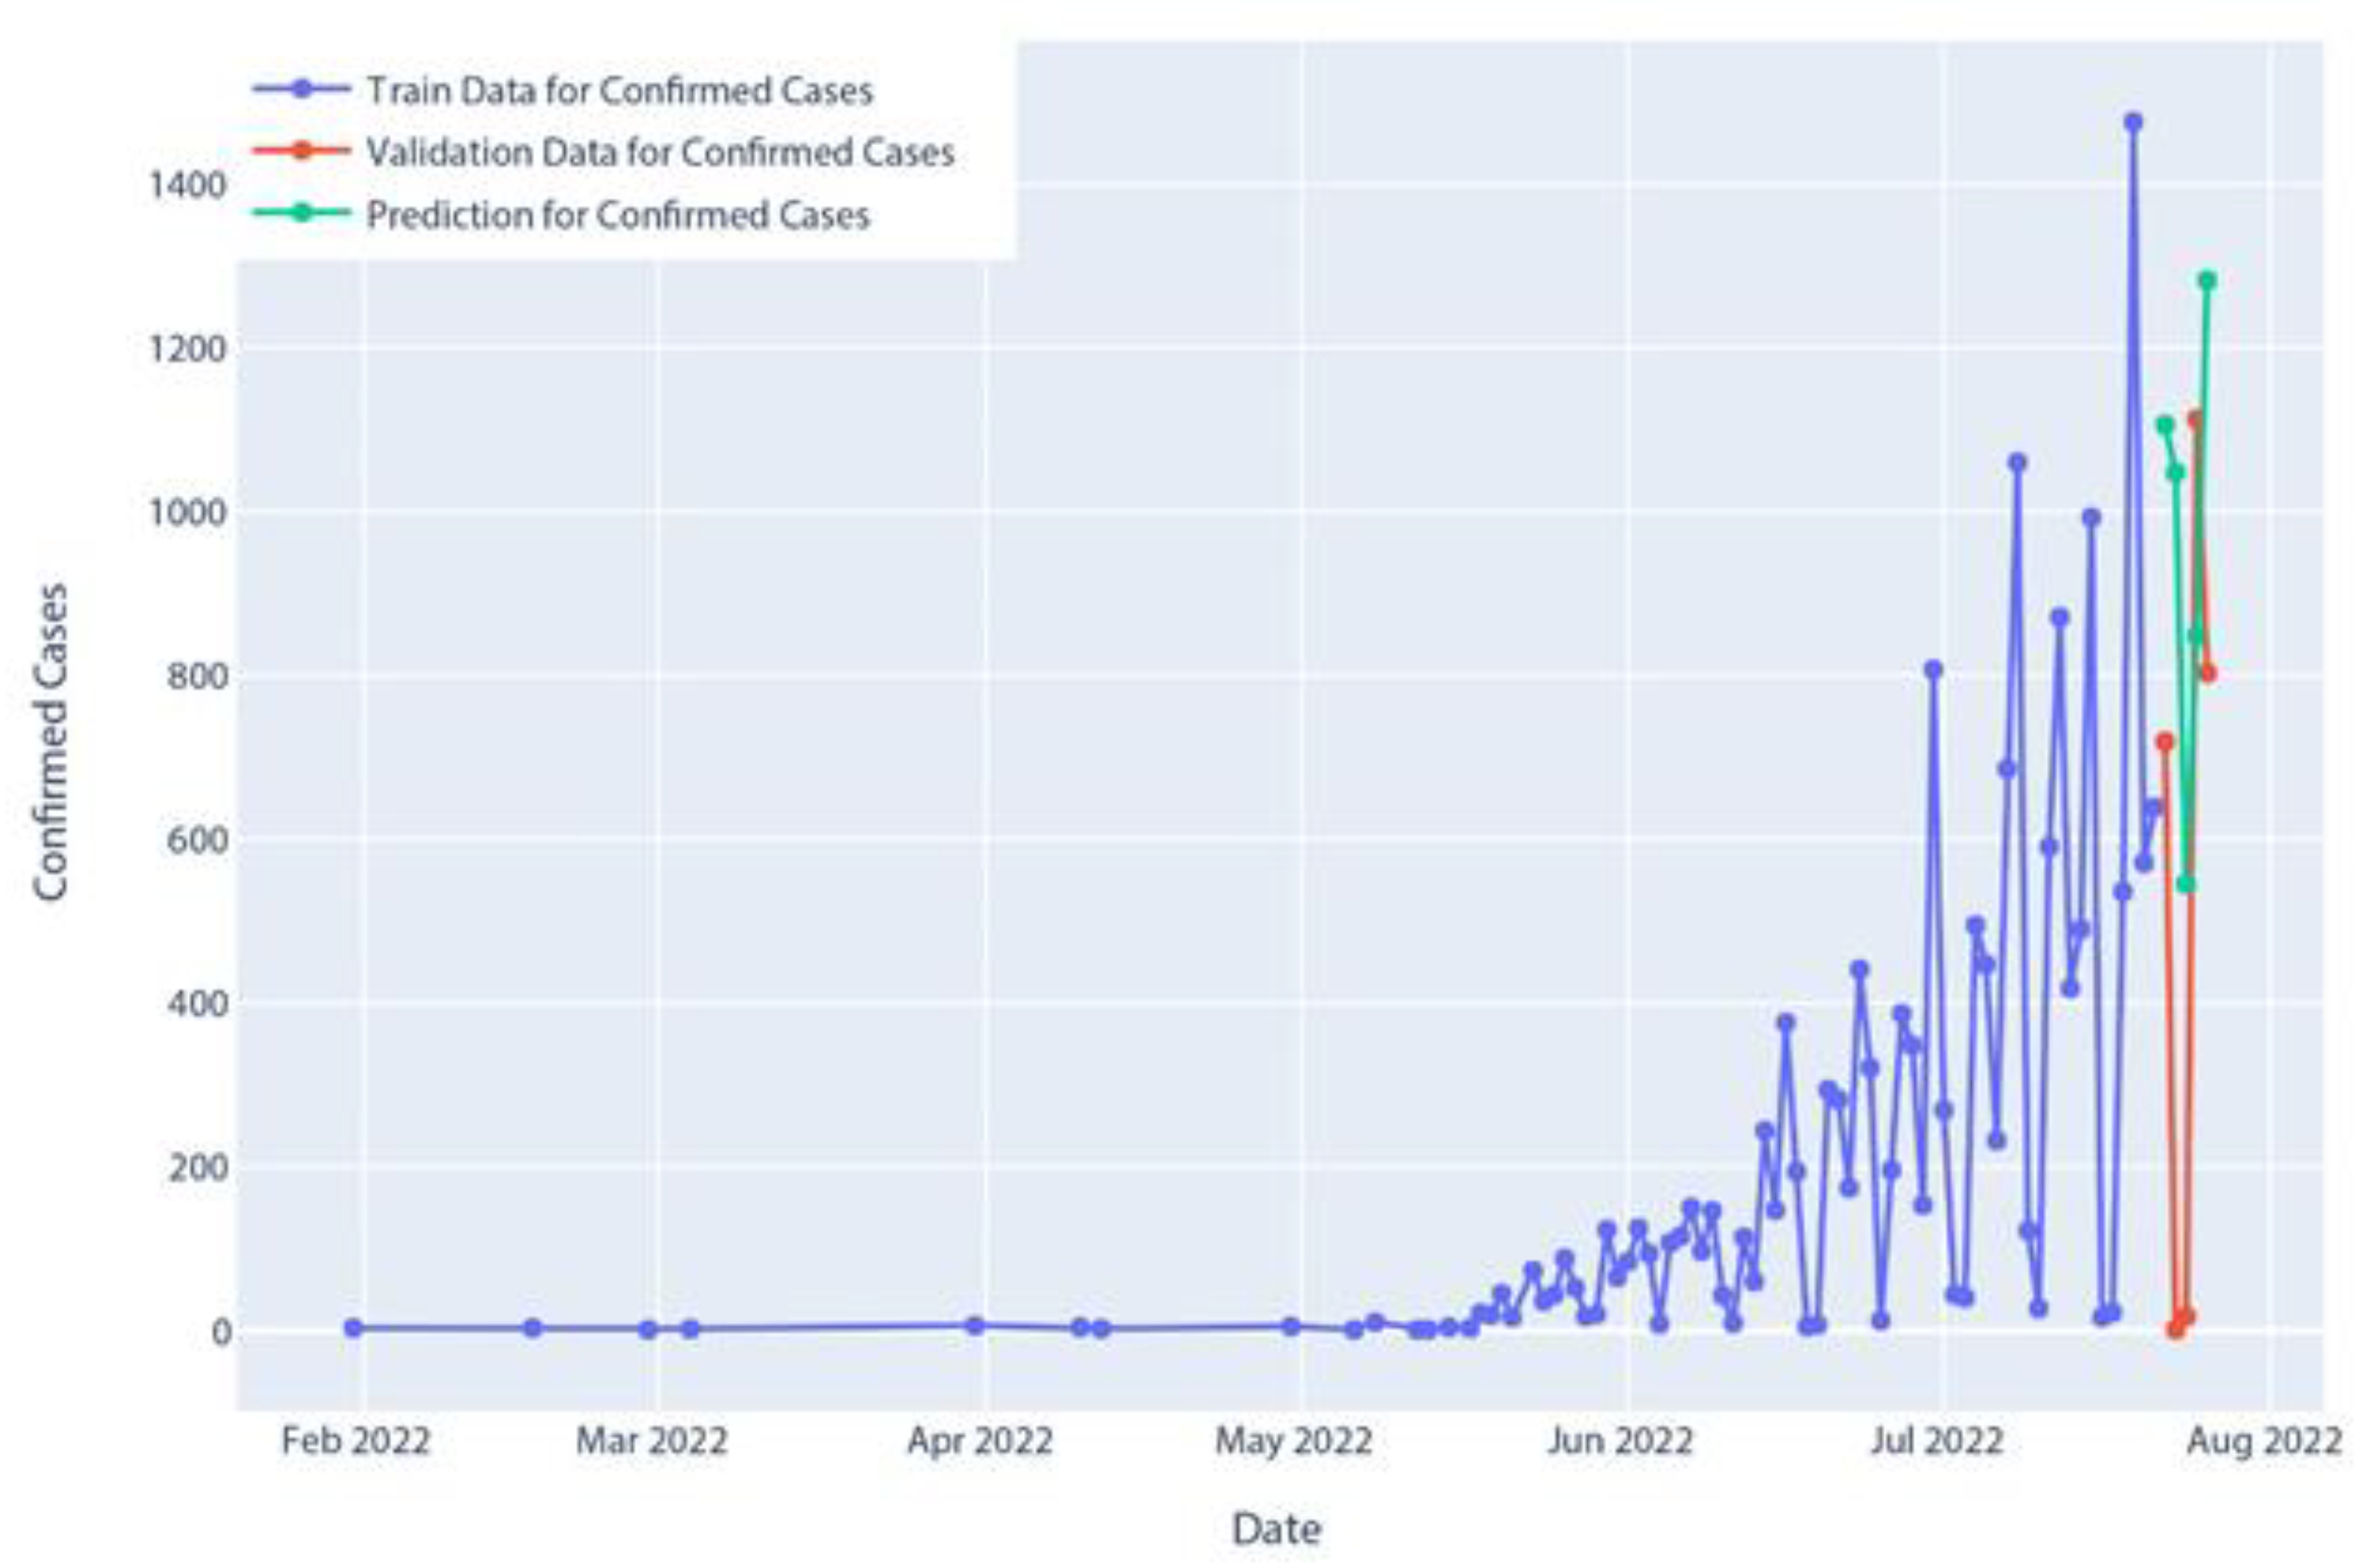
Figure 21.
Confirmed cases of ARIMA model prediction.
Figure 21.
Confirmed cases of ARIMA model prediction.
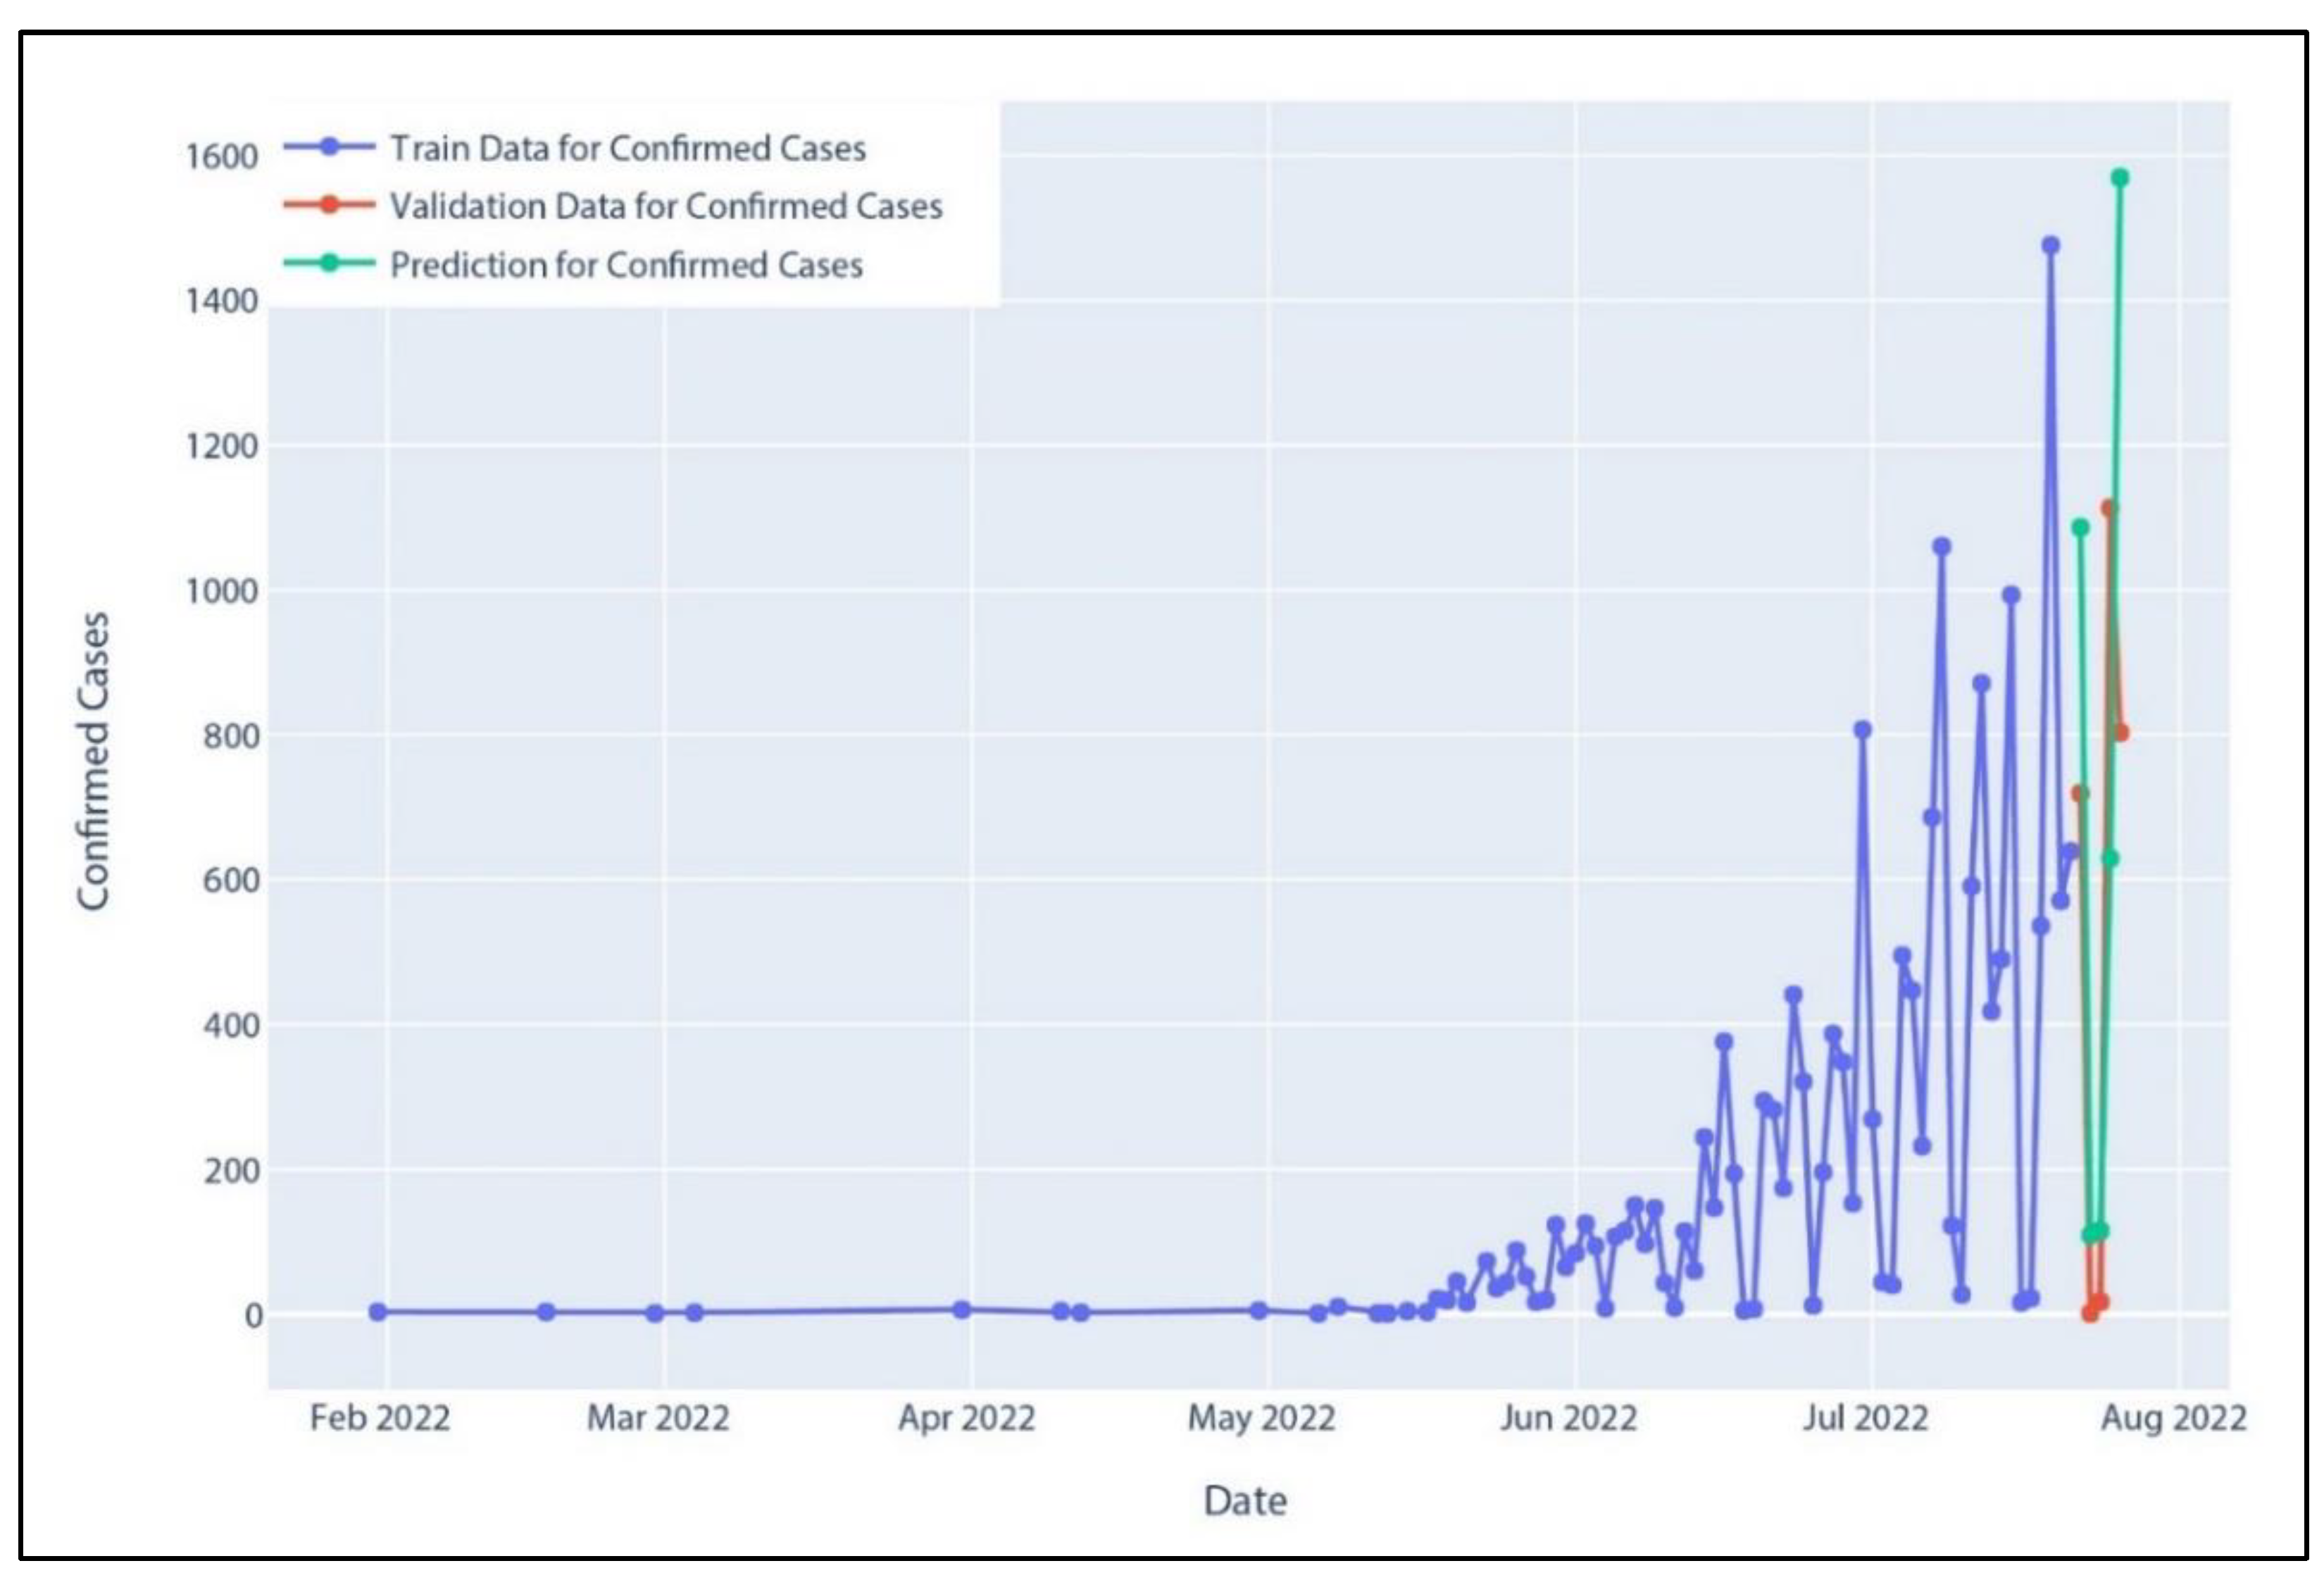
Figure 22.
Confirmed cases of SARIMA model prediction.
Figure 22.
Confirmed cases of SARIMA model prediction.
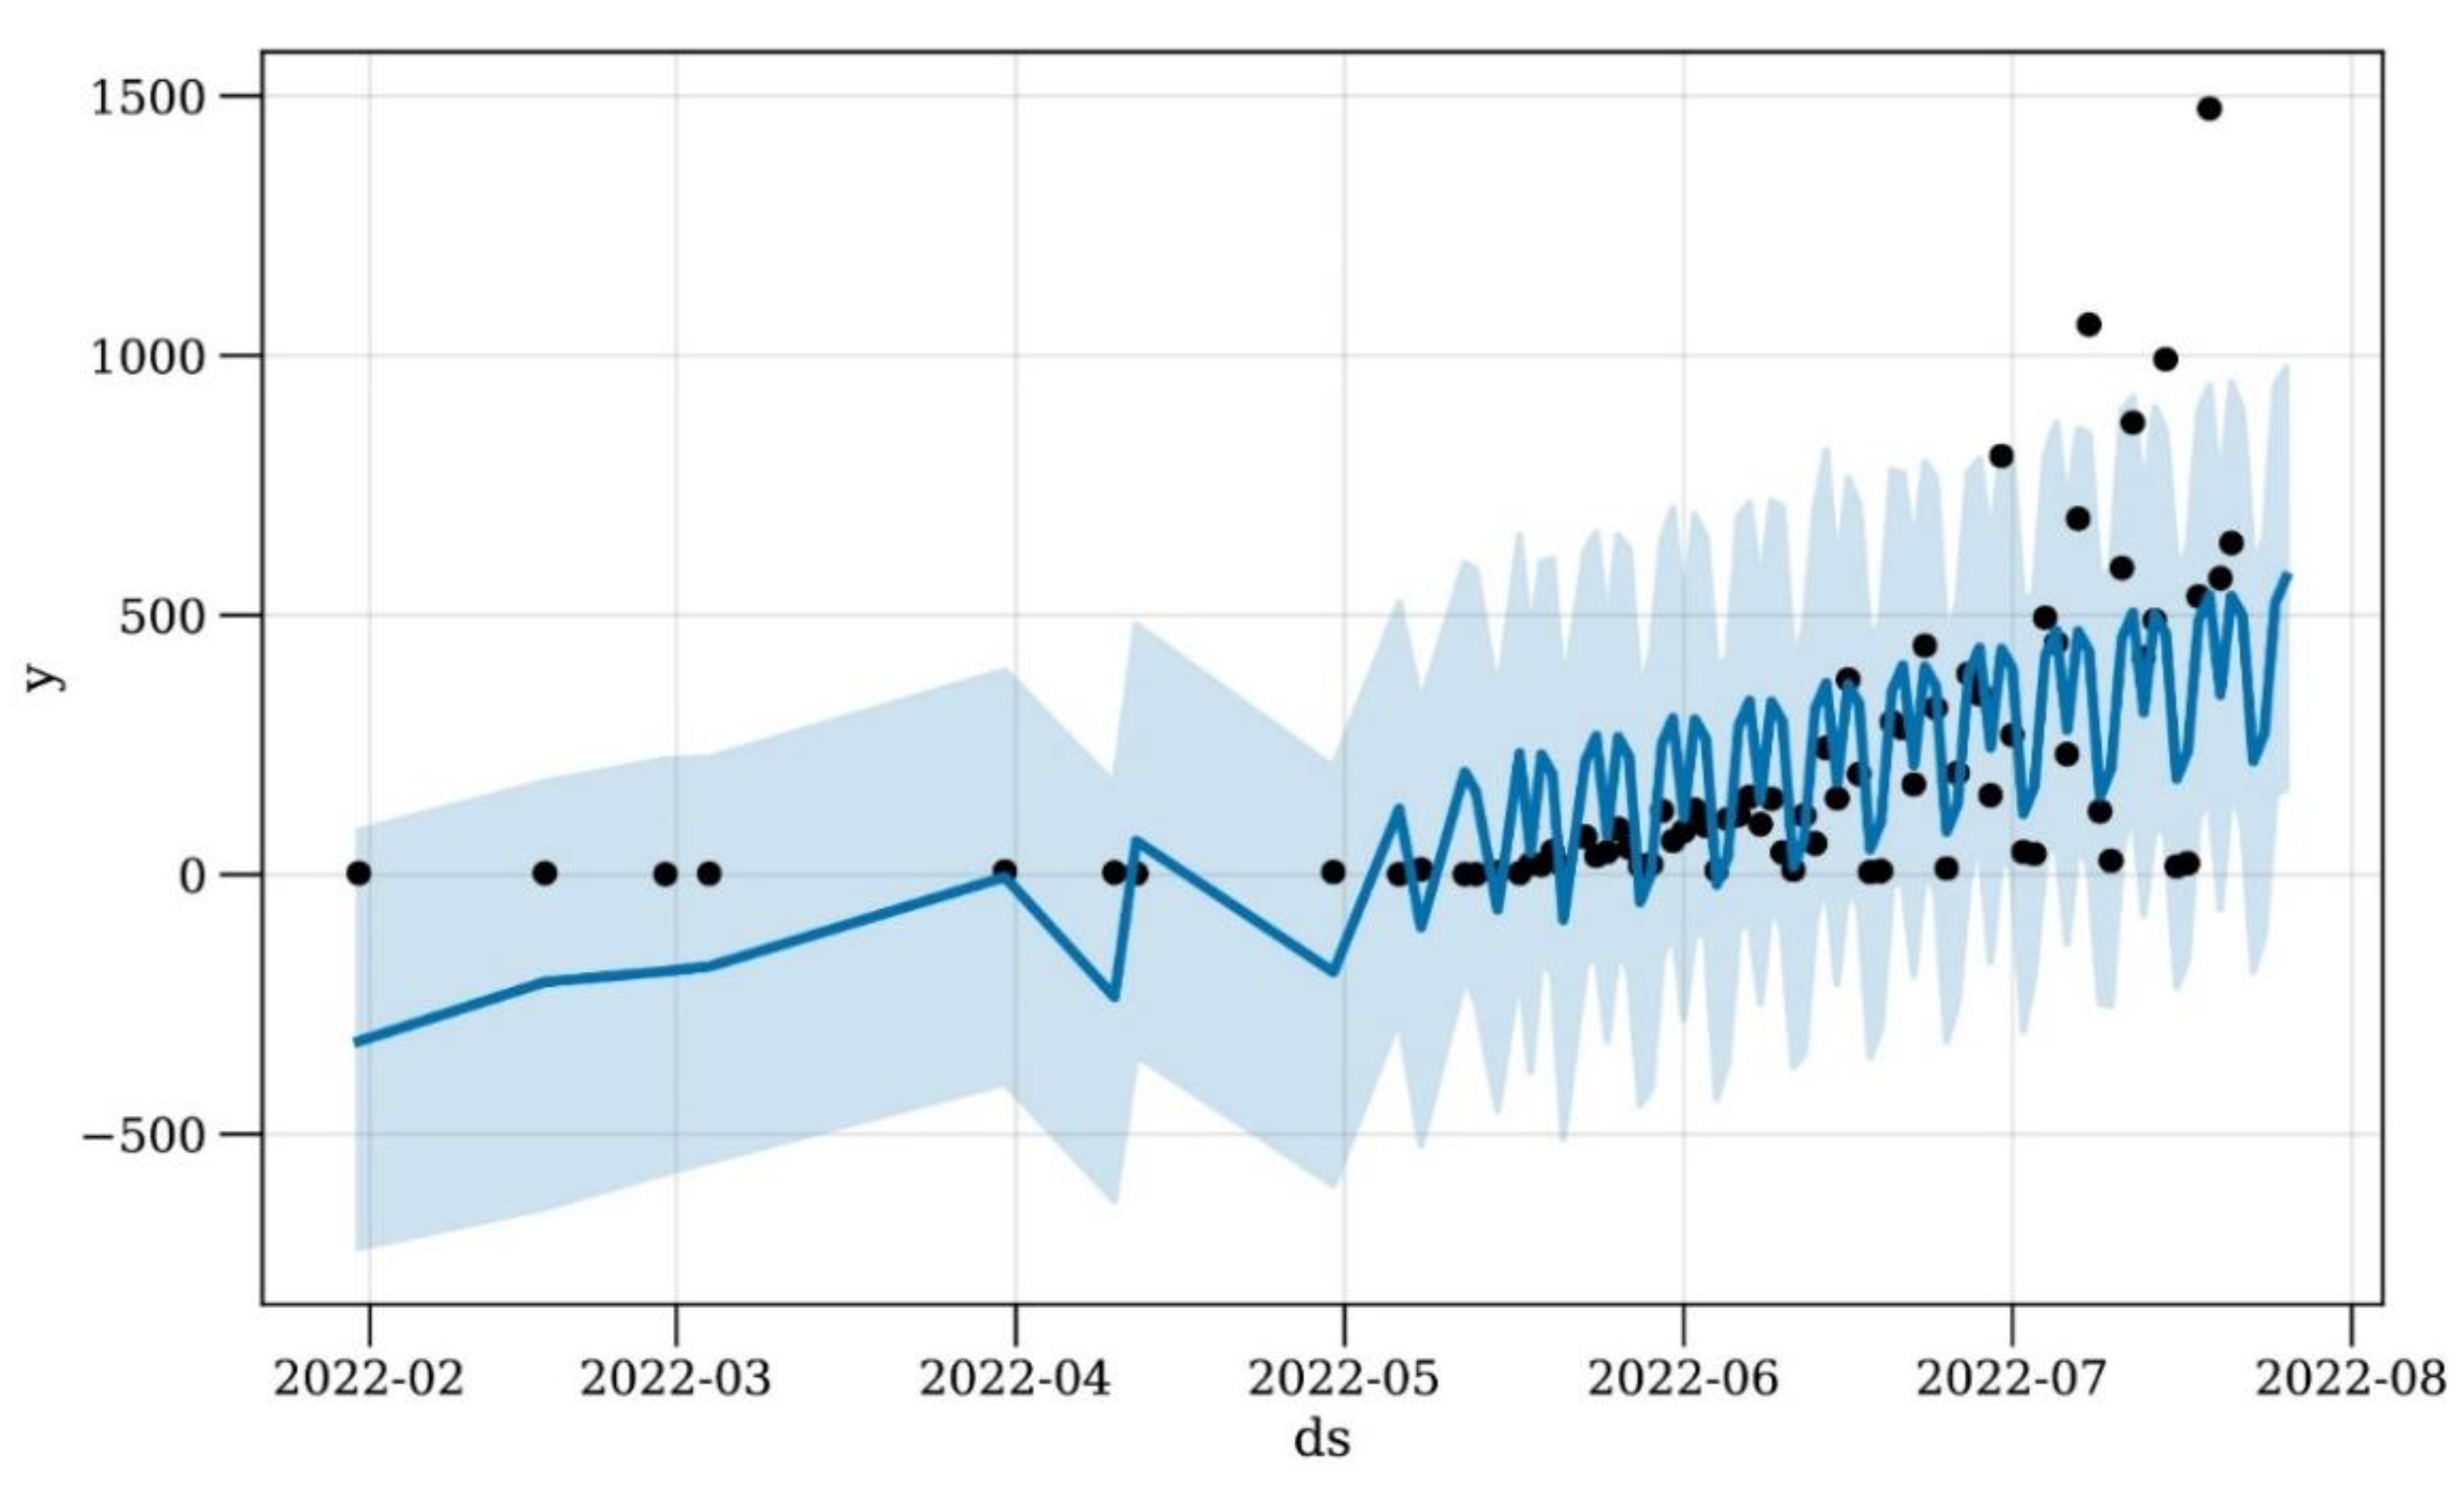
Figure 23.
Confirmed cases of Prophet model prediction. Where ‘y’ represents the measurement of forecast and ‘ds’ represents date stamps. The original data are represented by black dots on the blue line, while the forecast error is shown by the shaded blue area.
Figure 23.
Confirmed cases of Prophet model prediction. Where ‘y’ represents the measurement of forecast and ‘ds’ represents date stamps. The original data are represented by black dots on the blue line, while the forecast error is shown by the shaded blue area.
Table 1.
Polynomial regression model of confirmed case prediction over five days.
Table 1.
Polynomial regression model of confirmed case prediction over five days.
| | Date | Polynomial Regression |
|---|
| 0 | 22 July 2022 | 755 |
| 1 | 23 July 2022 | 795 |
| 2 | 24 July 2022 | 838 |
| 3 | 25 July 2022 | 885 |
| 4 | 26 July 2022 | 937 |
Table 2.
SVR model confirmed case prediction for five days.
Table 2.
SVR model confirmed case prediction for five days.
| | Date | SVR |
|---|
| 0 | 22 July 2022 | 657 |
| 1 | 23 July 2022 | 681 |
| 2 | 24 July 2022 | 705 |
| 3 | 25 July 2022 | 730 |
| 4 | 26 July 2022 | 756 |
Table 3.
Holt’s linear model confirmed case prediction over five days.
Table 3.
Holt’s linear model confirmed case prediction over five days.
| | Date | Holt’s Linear Model |
|---|
| 0 | 22 July 2022 | 822 |
| 1 | 23 July 2022 | 880 |
| 2 | 24 July 2022 | 937 |
| 3 | 25 July 2022 | 994 |
| 4 | 26 July 2022 | 1052 |
Table 4.
Holt–Winter’s model confirmed case prediction over five days.
Table 4.
Holt–Winter’s model confirmed case prediction over five days.
| | Date | Holt–Winter’s Model |
|---|
| 0 | 22 July 2022 | 1075 |
| 1 | 23 July 2022 | 114 |
| 2 | 24 July 2022 | 228 |
| 3 | 25 July 2022 | 685 |
| 4 | 26 July 2022 | 942 |
Table 5.
AR model confirmed case prediction over five days.
Table 5.
AR model confirmed case prediction over five days.
| | Date | AR Model |
|---|
| 0 | 22 July 2022 | 986 |
| 1 | 23 July 2022 | 1259 |
| 2 | 24 July 2022 | 717 |
| 3 | 25 July 2022 | 782 |
| 4 | 26 July 2022 | 1087 |
Table 6.
MA model confirmed case prediction over five days.
Table 6.
MA model confirmed case prediction over five days.
| | Date | MA Model |
|---|
| 0 | 22 July 2022 | 647 |
| 1 | 23 July 2022 | 655 |
| 2 | 24 July 2022 | 663 |
| 3 | 25 July 2022 | 672 |
| 4 | 26 July 2022 | 680 |
Table 7.
ARIMA model confirmed case prediction for five days.
Table 7.
ARIMA model confirmed case prediction for five days.
| | Date | ARIMA Model |
|---|
| 0 | 22 July 2022 | 1105 |
| 1 | 23 July 2022 | 1047 |
| 2 | 24 July 2022 | 545 |
| 3 | 25 July 2022 | 848 |
| 4 | 26 July 2022 | 1282 |
Table 8.
SARIMA model confirmed case prediction over five days.
Table 8.
SARIMA model confirmed case prediction over five days.
| | Date | SARIMA Model |
|---|
| 0 | 22 July 2022 | 1086 |
| 1 | 23 July 2022 | 109 |
| 2 | 24 July 2022 | 115 |
| 3 | 25 July 2022 | 629 |
| 4 | 26 July 2022 | 1569 |
Table 9.
Prophet model confirmed case prediction for five days.
Table 9.
Prophet model confirmed case prediction for five days.
| | Date | Prophet’s Model | Prophet’s Upper Bound |
|---|
| 0 | 22 July 2022 | 499 | 870 |
| 1 | 23 July 2022 | 218 | 630 |
| 2 | 24 July 2022 | 272 | 672 |
| 3 | 25 July 2022 | 523 | 939 |
| 4 | 26 July 2022 | 572 | 982 |
Table 10.
Summarized description of all models’ performance matrices.
Table 10.
Summarized description of all models’ performance matrices.
| | RMSE [18] | MSE [18] | MAE | MAPE | R2 Score |
|---|
| Polynomial Regression | 524.83 | 275,449.04 | 402.9 | 168.64 | −0.39 |
| SVR | 466.79 | 217,897.28 | 371.85 | 144.3 | −0.1 |
| Holt’s Linear Model | 584.27 | 341,376.76 | 454.14 | 186.77 | −0.72 |
| Holt–Winter’s Model | 278.3 | 77,448.32 | 249.81 | 25.43 | 0.61 |
| AR Model | 683.65 | 467,378.37 | 568.36 | 260.19 | −1.35 |
| MA Model | 460.73 | 212,273.60 | 387.34 | 138.64 | −0.07 |
| ARIMA Model | 603.97 | 364,778.86 | 541.14 | 215.81 | −0.84 |
| SARIMA Model | 442.12 | 195,471.08 | 364.74 | 23.18 | 0.02 |
| Prophet Model | 204.75 | 41,922.55 | 146.29 | 16.82 | 0.49 |


 ,
, 


