Abstract
In this investigation, a comprehensive numerical analysis of the flow involved in an open-ended straight channel fully filled with a porous metal foam saturated and a phase change material (paraffin) has been performed using a single relaxation time lattice Boltzmann method (SRT-LBM) at the representative elementary volume (REV) scale. The enthalpy-based approach with three density functions has been employed to cope with the governing equations under the local thermal non-equilibrium (LTNE) condition. The in-house code has been validated through a comparison with a previous case in literature. The pore per inch density () and porosity () effects of the metal structure were analyzed during melting/solidifying phenomena at two Reynolds numbers (Re = 200 and 400). The relevant findings are discussed for the LTNE intensity and the entropy generation rate (Ns). Through the simulations, the LTNE hypothesis turned out to be secure and valid. In addition, it is maximum for small PPI value (=10) whatever the parameters deemed. On the other hand, high porosity (=0.9) is advised to reduce the system’s irreversibility. However, at a moderate Re (=200), a small PPI (=10) would be appropriate to mitigate the system irreversibility during the charging case, while a large value (PPI = 60) might be advised for the discharging case. In this context, it can be stated that during the melting period, low porosity (=0.7) with low PPI (=10) improves thermal performance, reduces the system irreversibility and speeds up the melting rate, while for high porosity (=0.9), a moderate PPI (=30) should be used during the melting process to achieve an optimal system.
1. Introduction
Latent Heat Thermal Energy Storage (LHTES) mode continues to gain great attention due to its large amount of energy stored in a small volume at almost constant temperature.
The LHTES systems using phase change materials (PCMs) have been applied in several engineering applications such as concentrating solar plants, thermal isolation, groundwater infiltration, solar energy, building sectors, nuclear reactors, and so on thanks to the phase transition process [1,2]. However, the only issue of these systems is the low thermal conductivity of PCM. Thereby, the integration of porous metallic structures with PCMs is one of the most suitable solutions and widely used owing to their large thermal conductivity, high specific surface area and their low cost [3]. In this area, representative studies can be found such as that of Mabrouk et al. [2] who performed a numerical study on the heat transfer improvement in a rectangular channel including a metallic foam/paraffin. They examined the porosity and pore density (PPI) effects on the thermal performance of the system under consideration. They demonstrated that high porosity with large PPI speeds up the melting phenomenon. In addition, an increase in PPI restricts the forced convection and improves the heat conduction. In a further numerical investigation of Mabrouk et al. [4], different parameters have been considered such as the porosity, Reynolds and Eckert numbers to deal with the melting/solidifying processes. They pointed out that the quantity and quality of stored energy is maximum for a low porosity value, while at moderate Re (=400) the energetic and exergetic efficiencies are optimum for a high porosity. Sardari et al. [5] have numerically conducted some morphological parameters of metal foams such as the porosity and pore size on the PCM melting progression and demonstrated that lowering porosity enhances the system performance and accelerates the melting rate compared to a pure PCM. They stated that the metal pore size has sparsely effect.Tao et al. [3] investigated the influence of the same parameters, viz., PPI and porosity on the melting process in a square cavity filled with metal foams and paraffins subjected to the natural convection. They indicated that, for a greater porosity (=0.98) with a decrease in PPI, natural convection strongly dominates the heat transfer and that the melt front evolvement advances rapidly. Zadeh et al. [6] surveyed the phase change transition in a circular thermal energy storage unit partially filled porous copper foam and nano-additives. They found that an increase in the porosity improves latent heat capacity due to the PCM volume rises, slows the melting rate and intensifies heat transfer by convection. Zhang et al. [7] numerically analyzed the heat transfer enhancement of PCM melting/solidification through a combination of heat pipe-fins-copper foam (HP-Fin-CF). They reported that when the porosity of the HP-CF combination decreases, the heat transfer rate of phase change processes of PCM rises obviously at fixed PCM volume. Also, they found the same as the number of fins increases. Nevertheless, this combination strongly restricts natural convection and strengthens conduction. Esapour et al. [8] presented a model of multi-tube heat exchanger based on a metal foam/PCM composite. They found that the melting time is reduced by 14% and 55% for porosities 0.9 and 0.7, respectively indicating thereby that a porous metal foam insertion is more efficient during PCM solidification period than that of melting. Yang et al. [9] developed an experimental and numerical study on the PCM (water) solidification features impregnated into metal foam samples with different pore parameters such as porosity (0.93 and 0.97) and pore density (8 and 30 PPI) for cold storage systems. They showed that the time interval of solidification process was reduced by 87.5% and 76.7% with porosities of 0.93 and 0.97, respectively compared with pure PCM. Furthermore, they demonstrated that porosity rather than pore density represents the key parameter that influenced and dominated heat transfer enhancement of the phenomenon.
As a relevant numerical approach for coping with complex physics and heat transfer problems, the lattice Boltzmann method (LBM) showed a sound ability over the past 30 years compared to traditional computational fluid dynamics (CFD) methods (volumes and finite elements, etc.). It is worth noting that, when dealing with transport problems in porous medium, the LBM approach is mostly split into two approaches, viz., the LBM at the pore scale and the LBM at the representative elementary volume (REV) scale [2,4]. Various studies [2,3,4], to name a few, have demonstrated that LBMs have become prominent approaches in handling fluid–fluid and fluid–solid interactions within complex models such as porous structures.
Through the works briefly mentioned herein up, it can be stated that the novelty of this paper is the study of the effects of PPI and low porosities under forced convection with phase change transition for latent heat thermal energy storage system. To the best of our knowledge, these effects have been scarcely dealt. Besides, numerical and experimental investigations available in the literature that deal with the system irreversibility are sorely lacking.
This numerical study leans on an enthalpy-based TLBM approach to investigate the influence of the metal foam pore density and porosity on heat transfer enhancement during the phase transition phenomenon of PCMs. The main aim targeted here is to analyse the entropy generation rate (Ns) and the LTNE criteria under the effect of considered parameters and two Reynolds numbers.
This paper is organized as follow. After Section 1, the physical and mathematical models are exhibited in Section 2. Afterwards, the numerical method (TLBM) is described and the in-house code is validated with available cases in literature in Section 3. In Section 4, numerical findings are illustrated and analysed. Finally, the main outcomes are highlighted in Section 5.
2. Physical and Mathematical Problem
2.1. Physical Model
The physical model with two-dimensional system deemed herein is illustrated in Figure 1. It is an open-ended straight channel with height and length fully filled with a porous structure (metal foam) and saturated with a phase change material: PCM (paraffin). The top and bottom walls are insulated (adiabatic) and non-slip. During the charging process, the fluid flow enters through the porous channel at a high temperature and a velocity , so that the paraffin begins to melt. Then the fluid leaves the channel through the east with lower constant temperature . Inversely, during the discharge process, the cold fluid enters the channel from the east at . At this point, the liquid paraffin releases more heat energy and begins to solidify. So, the fluid heats up and set (force) a flow which leaves the channel at hot temperature .
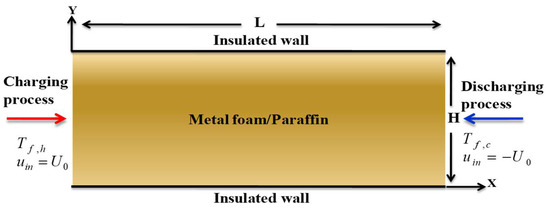
Figure 1.
Physical model.
2.2. Conjectures
To facilitate the mathematical model resolution of the problem, the following hypotheses are taken into consideration: The fluid flow is laminar, Newtonian and incompressible where forced convection mode prevails in the channel. The fluid and solid phases are in local thermal non equilibrium (LTNE) condition. The thermo-physical characteristics are assumed to be constant, homogeneous and isotropic. For more details, the reader may consult Nield and Bejan [10].
2.3. Mathematical Formulation
Based on the above conjectures, the two-dimensional governing equations for mass, momentum, and energy are as follows [2,4,11]:
Subscripts and indicate the fluid and solid phases, respectively. The variables , , , , , , , , , , , , , and represent the velocity vector, pressure, fluid and solid temperatures, metal foam porosity, density, paraffin kinematic viscosity, specific heat capacity, effective thermal conductivity, liquid fraction, latent heat, specific surface area, interfacial heat transfer coefficient, permeability and the Forchheimer coefficient, respectively.
The liquid fraction and the empirical quantities , and can be calculated as follows [11,12,13]:
where , , and denote the ligament diameter, pore size, and the pore density, respectively.
Under the LTNE assumption, the effective thermal conductivity can be correlated using the following relationships [11,14,15]:
where,
As for the medium permeability and the Forchheimer coefficient (Equation (2)), they have been computed as [11,12,13]:
2.4. Boundary and Initial Conditions (B & ICs)
The boundary and initial conditions of the physical model deemed are the following:
- , and (IC);
- at and (channel entrance);
- at and (channel exit);
- (no-slip condition) and (adiabatic condition) at and (Top and Bottom walls, respectively).
Note that the fluid flow evolves from right to left, as depicted in Figure 1, thereby initiating the discharging process.
2.5. Entropy Generation Rate
As the entropy generation reflected system irreversibility causing by heat transfer irreversibility (HTI) and fluid friction irreversibility (FFI), the local and average entropy generation rate under the LTNE assumption can be formulated as follows [16,17]:
and being the strain and stress tensors, respectively.
The average entropy generation per unit of volume can be calculated as [17]:
2.6. LTNE Intensity
The LTNE condition is computed via the following criterion [17]:
N and are the total number of nodes and the dimensionless temperature, respectively.
It should be noted that if , it is the LTNE condition that prevails, and if , the local thermal equilibrium (LTE) condition takes place.
3. Lattice Boltzmann Method (LBM)
3.1. LB Equations
The thermal lattice Boltzmann method (TLBM) controls the propagation of particles on a lattice x at time t with a discrete distribution velocities. In this study, three distribution functions are used to handle the dynamic, , and thermal, , fields using the single relaxation time SRT approach at the representative elementary volume (REV) scale. Note that the use of the SRT model could cause numerical diffusion when the collision time is not the unity [11]. To deal with this problem, the multiple relaxation time (MRT) approach should be considered [18]. Despite this weakness, the SRT approach remains the most popular and has shown its ability to handle phase change in porous media due to its simplicity, numerical precision and computational efficiency while mitigating the numerical diffusion [11,19] across phase interface. Thereby, the LBEs are expressed as [11,19]:
where and are the dimensionless collision time for velocity and for temperatures [17,19]:
, and being the lattice time step, the streaming speed and the effective diffusivity, respectively.
Under the D2Q9 model (Figure 2), the local equilibrium distribution functions and can be expressed as follows [4,11,17]:
and being the particle streaming velocity and the equilibrium weighting coefficients, which are written, respectively, as follows:
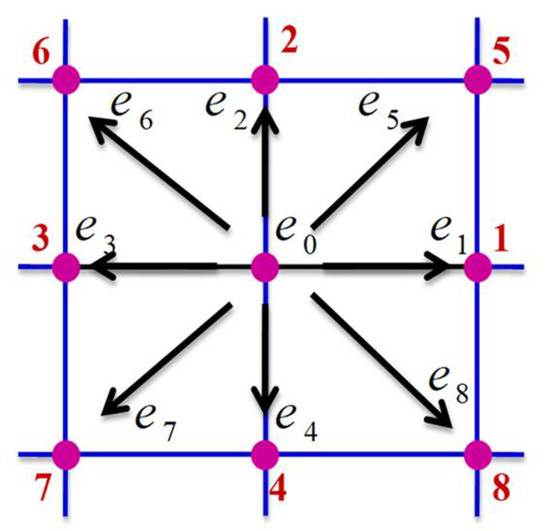
Figure 2.
D2Q9 model. Note that the pink circles are the clusters particles’ sites particles, the black arrows indicate the propagation directions, while the blue lines are the distances between sites.
The source terms , and are computed as follows [4,11,17]:
Finally, the macroscopic quantities are computed as:
The solution procedure is shown through the flow chart (see Figure 3).
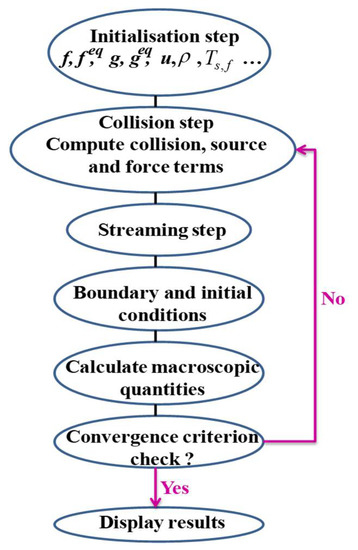
Figure 3.
Diagrammatic flow chart of the present LBM.
3.2. Validation
Figure 4 depicts our in-house code through the study by Krishnan et al. [20]. As it can observed, the evolution dimensionless fluid () and solid () temperatures for various dimensionless times corroborate the results of the Ref. [20].
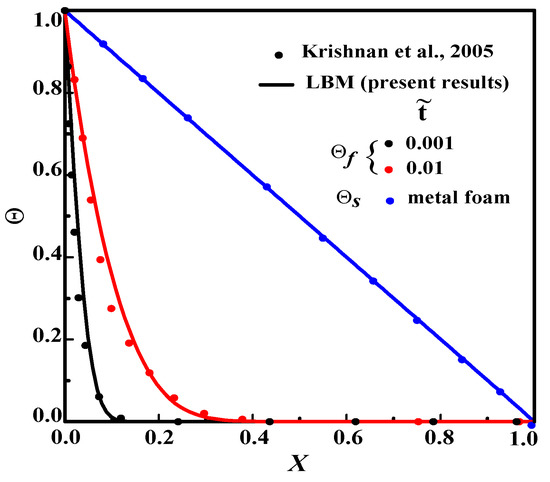
Figure 4.
Evolution of dimensionless fluid and solid temperature () vs. dimensionless distance X for .
4. Results
4.1. Grid Test
To ensure the stability of the in-house code, grid independence test for four mesh size, viz., , , and has been performed for Reynolds number of 400. The dimensionless fluid temperature () is portrayed in Figure 5. As can be seen, the profiles are close to each other. Thereby, the difference between the two last meshes is approximately 0.2%. However, it is about 0.8% between the last grid and the two first. Therefore, the grid was selected for all subsequent simulations.
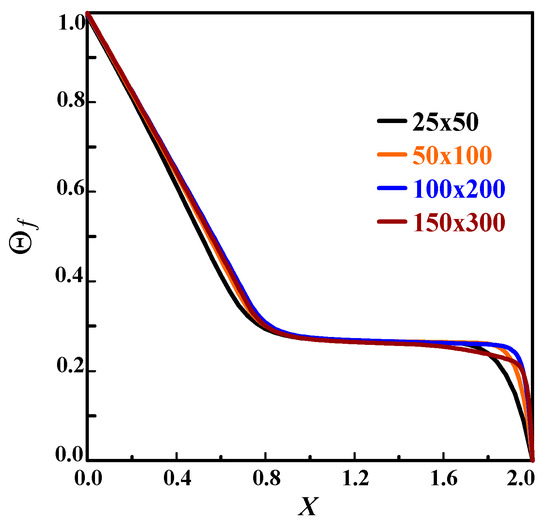
Figure 5.
Grid test of the dimensionless fluid temperature () profiles at Y = 0.5 with .
This section is devoted to analyzing the effects of pore density ( and 60) and Re number (200 and 400) while keeping the other parameters set at .
4.2. PPI’s Effect on the LTNE Condition
Figure 6 depicts the effects of the pore density (=10, 30 and 60) and porosity on the LTNE parameter for Re = 200 during the charging and discharging processes. As shown, it can be stated the LTNE condition is secured () for Re=200. For the charging case, it decreases for . However, it increases for and and then, it decreases (Figure 6a). For the discharging case (Figure 6b), it decreases whatever . It is observable that for Re = 200, the LTNE is maximum for small porosity (=0.7) and PPI (=10) values during both charging/discharging periods.
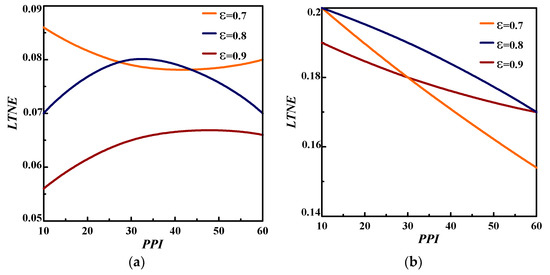
Figure 6.
Pore density effect on LTNE criteria for Re = 200 during: (a) charging case; (b) discharging case.
Figure 7 illustrates the effects of the pore density (=10, 30 and 60) and porosity on the LTNE parameter for Re =400 during the charging and discharging processes. During the charging period (Figure 7a), the LTNE increases proportionally with the PPI for and and inversely, it decreases for low porosity value (=0.7) with increasing PPI. However, during the discharging period, it decreases with the increasing PPI regardless of the porosity. For the case of Re = 400, The LTNE is maximum for lower PPI (=10) during two processes. In addition, it turns out that the increase in Re secures the LTNE validity.
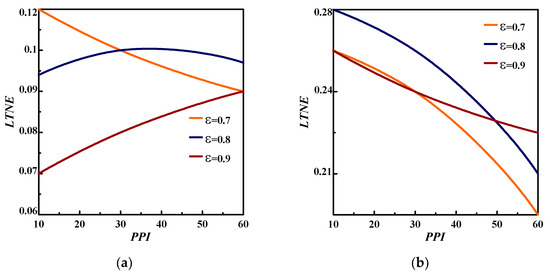
Figure 7.
Pore density effect on LTNE criteria for Re = 400 during: (a) charging case; (b) discharging case.
To sum up, a decrease in PPI for a low porosity value (=0.7) gives a maximum LTNE value during the melting case. On the other hand, during the discharging (solidifying) period, decreasing the PPI for a low porosity () increases the LTNE criteria whatever Re.
4.3. PPI’s Effect on the Dimensionless Entropy Generation Rate
The entropy generation rate is an indicator used to assess the system stability. Figure 8, Figure 9 and Figure 10 outline the pore density effect on the dimensionless entropy generation rate during changing and discharging processes for Re = 200 and 400 at and .
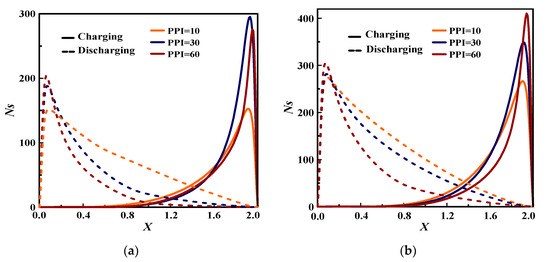
Figure 8.
Pore density effect on the dimensionless entropy generation rate during charging and discharging processes at : (a) Re = 200; (b) Re = 400.
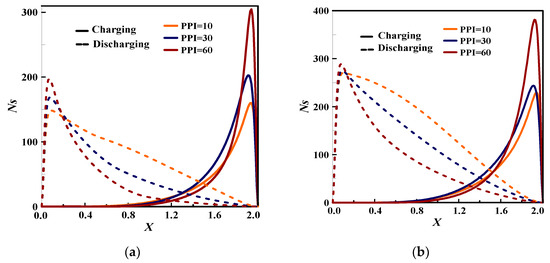
Figure 9.
Pore density effect on the dimensionless entropy generation rate during charging and discharging processes at : (a) Re = 200; (b) Re = 400.
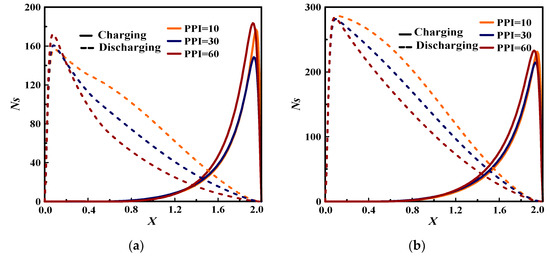
Figure 10.
Pore density effect on the dimensionless entropy generation rate during charging and discharging processes at : (a) Re = 200; (b) Re = 400.
For both cases charging/discharging and the three porosities, it can be seen that the entropy generation increases proportionally with Re number. Hence, lower Re should be used to reduce the system irreversibility, which refers to the dominance of the heat transfer irreversibility.
During charging process, for and (Figure 8 and Figure 9), the entropy generation rate is minimal for low PPI value (=10) regardless of Re. It is minimal for PPI = 30 for higher porosity (=0.9) as exhibited in Figure 8. Indeed, it is maximal for larger PPI (=60) whatever Re and . Furthermore, as Re increases (=400) and PPI is stronger (=60), the dimensionless entropy generation rate reaches it is maximum indicating that the forced convection dominates the heat transfer irreversibility. As for discharging process, at the flow entrance, the dimensionless entropy increases with the increase of PPI showing that the forced convection dominates the channel. Then, from the channel’s 1/5, it decreases as PPI increases due to the weakness of forced convection and subsequently the dominance of the heat conduction on the global heat transfer.
As seen in some cases in Figure 10 for example for , the Ns’s amplitude during the discharging period exceeds that of the charging for Re = 400, indicating the important role of the metal structure characteristics on the heat transfer irreversibility.
To sum up, to reduce the irreversibility of the system, lower PPI with lower Re should be used during the charging period, while a larger PPI could be adopted during the discharging case. In addition, high porosity (=0.9) should be used to mitigate the system irreversibility whatever the parameters deemed.
5. Conclusions
The current numerical investigation reported the porosity, pore density and Re number effects on heat transfer subjected to forced convection in an open-ended rectangular channel fully filled with porous metal foam saturated with paraffin. The computations have been performed using an enthalpy based SRT-TLBM approach at the REV scale. Validation of the built code with previous casein literature has exhibited good agreement. To cope with the present study, three distribution functions for dynamic and thermal fields have been applied under the LTNE condition. The relevance of the pore density effect is highlighted and analyzed during the melting and solidifying processes of the PCM.Based on the numerical outcomes obtained, the main conclusions are as:
- Enthalpy-based REV-TLBM method has a robust ability for handling the phase change phenomena in a porous channel subjected to steady forced fluid flow.
- During charging and discharging process, the LTNE hypothesis is valid for the case of Re = 200 and 400 whatever the PPI and .
- For the melting and solidifying periods, small PPI (=10) and porosity () give a maximum LTNE regardless of Re.
- The system irreversibility can be reduced via a small PPI (=10) and Re (=200) during the charging case, while a large value (PPI = 60) can be used during the discharging period.
- High porosity (=0.9) is recommended to mitigate the system irreversibility whatever the parameters deemed.
- From the channel’s 1/5 and during the solidification process, thermal conduction dominates the overall heat transfer as the PPI increases.
- During the charging process, a low porosity value (=0.7) with a low PPI (=10) improves heat transfer, reduces the system irreversibility and speeds up the melting rate, while for a high porosity (=0.9), a moderate PPI (=30) should be considered an optimal value during the fusion loop. This was supported in Ref. [2].
- During the solidification process, an increase in PPI gives rise to a thermal conduction improvement. For more details, one could consult Ref. [3].
The use of renewable energies such as phase change in porous media, however, faces serious challenges, one of the main ones being its small volume at almost constant temperature and fitting consideration of pore geometry. Recent advances (especially in PCMs for TES) should help better overcome these barriers. To keep future research directions consistent with major issues, the following future research can be addressed:
- Tracks such as the use of porous media with inexpensive MCPs can be followed to better deepen our knowledge of such systems.
- PCMs and latent heat energy storage systems should be also economically analysed to assess their feasibility on commercial scale, as the initial cost for setting up such systems may turn out to be high.
To sum up, this study was initiated to better understand the nature and scope of a real or artificial system able of presenting storage performances to meet the needs.
Author Contributions
The authors have contributed in different parts of the paper preparation, as follows: Conceptualization, H.D. and H.N.; Methodology, R.M., H.D., H.N. and Z.Y.; Software, R.M., H.D. and H.N.; Validation, R.M., H.D., H.N. and Z.Y.; Formal analysis, H.D., H.N. and Z.Y.; Investigation, R.M., H.D., H.N. and Z.Y.; Resources, R.M. and H.D.; Data curation, R.M. and H.D.; Writing—original draft, R.M. and H.N.; Writing—review and editing, H.D., H.N. and Z.Y.; Visualization, R.M. and H.D.; Supervision, H.D., H.N. and Z.Y.; Project administration, H.D.; Funding acquisition, H.D. All authors have read and agreed to the published version of the manuscript.
Funding
This study was funded by a scholarship that was granted by the National School of Engineers of Monastir/Monastir University as part of the doctoral thesis of the first author.
Data Availability Statement
Data sharing is not applicable to this article.
Acknowledgments
The authors would like to thank to the National School of Engineers of Monastir/Monastir University for supporting this work. All authors have read and approved the present manuscript version. In addition, the authors’ order was approved by mutual agreement between the authors.
Conflicts of Interest
The authors declare no conflict of interest.
Nomenclature
| Specific interfacial area () | |
| Biot number, | |
| Lattice speed () | |
| Specific heat capacity at constant pressure () | |
| Sound speed () | |
| Darcy number, | |
| Ligament diameter () | |
| Pore size () | |
| Eckert number, | |
| Discrete velocity in direction i | |
| Forchheimer form coefficient | |
| Body force per unit mass () | |
| Discrete body force in direction i() | |
| Distribution function in direction i | |
| Equilibrium distribution function in direction i | |
| Characteristic length scale () | |
| Forchheimer form coefficient | |
| Interfacial heat transfer coefficient () | |
| Porous medium permeability () | |
| Thermal conductivity ratio, | |
| Latent heat () | |
| Interstitial Nusselt number, | |
| Dimensionless pressure | |
| Pressure () | |
| Prandtl number, | |
| Reynolds number, | |
| Pore Reynolds number, | |
| Heat capacity ratio, | |
| Stefan number, () | |
| Temperature () | |
| PCM melting temperature () | |
| Dimensionlesstemperature | |
| Time (s) | |
| Velocity () | |
| Dimensionless velocity | |
| Cartesian coordinates () | |
| Dimensionless coordinates | |
| Greek symbols | |
| Gradient operator | |
| Divergence operator | |
| Laplacian operator | |
| Lattice step | |
| Time step | |
| Thermal diffusivity () | |
| Media porosity | |
| Pore density (PPI) | |
| Thermal conductivity () | |
| Dynamic fluid viscosity () | |
| PCM’s melting fraction | |
| Kinematic viscosity () | |
| Density () | |
| Dimensionless time | |
| Dimensionless relaxation time | |
| Weight coefficient in direction i | |
| Superscripts/subscripts | |
| eff | Effective |
| f | Fluid |
| s | Solid |
| h | Hot |
| m | Melting |
| Initial state | |
| in | Inlet |
| out | Outlet |
| Ref | Reference |
References
- Li, D.; Ding, Y.; Wang, P.; Wang, S.; Yao, H.; Wang, J.; Huang, Y. Integrating Two-Stage Phase Change Material Thermal Storage for Cascaded Waste Heat Recovery of Diesel-Engine-Powered Distributed Generation Systems: A Case Study. Energies 2019, 12, 2121. [Google Scholar] [CrossRef] [Green Version]
- Mabrouk, R.; Naji, H.; Dhahri, H.; Younsi, Z. Insight into Foam Pore Effect on Phase Change Process in a Plane Channel under Forced Convection Using the Thermal Lattice Boltzmann Method. Energies 2020, 13, 3979. [Google Scholar] [CrossRef]
- Tao, Y.B.; You, Y.; He, Y.L. Lattice Boltzmann simulation on phase change heat transfer in metal foams/paraffin composite phase change material. Appl. Therm. Eng. 2016, 93, 476–485. [Google Scholar] [CrossRef]
- Mabrouk, R.; Dhahri, H.; Naji, H.; Hammouda, S.; Younsi, Z. Lattice Boltzmann simulation of forced convection melting of a composite phase change material with heat dissipation through an open-ended channel. Int. J. Heat Mass Transf. 2020, 153, 119606. [Google Scholar] [CrossRef]
- Sardari, P.T.; Mohammed, H.I.; Giddings, D.; Gillott, M.; Grant, D. Numerical study of a multiple-segment metal foam-PCM latent heat storage unit: Effect of porosity, pore density and location of heat source. Energy 2019, 189, 116108. [Google Scholar] [CrossRef]
- Zadeh, S.M.H.; Mehryan, S.A.M.; Ghalambaz, M.; Ghodrat, M.; Young, J.; Chamkha, A. Hybrid thermal performance enhancement of a circular latent heat storage system by utilizing partially filled copper foam and Cu/GO nano-additives. Energy 2020, 213, 118761. [Google Scholar] [CrossRef]
- Zhang, C.; Yu, M.; Fan, Y.; Zhang, X.; Zhao, Y.; Qiu, L. Numerical study on heat transfer enhancement of PCM using three combined methods based on heat pipe. Energy 2020, 195, 116809. [Google Scholar] [CrossRef]
- Esapour, M.; Hamzehnezhad, A.; Darzi, A.A.R.; Jourabian, M. Melting and solidification of PCM embedded in porous metal foam in horizontal multi-tube heat storage system. Energy Convers. Manag. 2018, 171, 398–410. [Google Scholar] [CrossRef]
- Yang, X.H.; Bai, Q.S.; Zhang, Q.L.; Hu, W.J.; Jin, L.W.; Yan, J.Y. Thermal and economic analysis of charging and discharging characteristics of composite phase change materials for cold storage. Appl. Energy 2018, 225, 585–599. [Google Scholar] [CrossRef]
- Nield, D.A.; Bejan, A. Convection in Porous Media, 4th ed.; Springer: New York, NY, USA, 2013. [Google Scholar]
- Gao, D.; Tian, F.B.; Chen, Z.; Zhang, D. An improved lattice Boltzmann method for solid-liquid phase change in porous media under local thermal non-equilibrium conditions. Int. J. Heat Mass Transf. 2017, 110, 58–62. [Google Scholar] [CrossRef] [Green Version]
- Joshi, V.; Rathod, M.K. Constructal enhancement of thermal transport in metal foam-PCM composite-assisted latent heat thermal energy storage system. Numer. Heat Transf. Appl. A 2019, 75, 413–433. [Google Scholar] [CrossRef]
- Settar, A.; Nebbali, R.; Madani, B.; Abboudi, S. Numerical investigation of convective heat transfer in a plane channel filled with metal foam under local thermal non-equilibrium. Mech. Ind. 2015, 16, 504. [Google Scholar] [CrossRef]
- Boomsma, K.; Poulikakos, D. Ontheeffectivethermalconductivityofathree-dimensionallystructuredfluid-saturatedmetalfoam. Int. J. Heat Mass Transf. 2001, 44, 827–836. [Google Scholar] [CrossRef]
- Boomsma, K.; Poulikakos, D. Corrigendum. Int. J. Heat Mass Transf. 2011, 1, 746–748. [Google Scholar] [CrossRef]
- López-Núñez, O.A.; Alfaro-Ayala, J.A.; Jaramillo, O.A.; Ramírez-Minguela, J.J.; Carlos Castro, J.; Damian-Ascencio, C.E.; Cano-Andrade, S. A numerical analysis of the energy and entropy generationrateinaLinearFresnelReflectorusing computational fluid dynamics. Renew. Energy 2020, 146, 1083–1100. [Google Scholar] [CrossRef]
- Mabrouk, R.; Naji, H.; Dhahri, H.; Hammouda, S.; Younsi, Z. Numerical investigation of porosity effect on a PCM’s thermal performance in a porous rectangular channel via thermal lattice Boltzmann method. Int. Commun. Heat Mass Transf. 2020, 153, 119606. [Google Scholar] [CrossRef]
- Huang, R.; Wu, H. Phase interface effects in the total enthalpy-based lattice Boltzmann model for solid–liquid phase change. J. Comp. Phys. 2015, 294, 346–362. [Google Scholar] [CrossRef]
- Gao, D.; Chen, Z.; Chen, L. A thermal lattice Boltzmann model for natural convectioninporousmediaunderlocalthermalnon-equilibriumconditions. Int. J. Heat Mass Transf. 2014, 70, 979–989. [Google Scholar] [CrossRef]
- Krishnan, S.; Murthy, J.Y.; Garimella, S.V. Atwo-temperaturemodelforsolid-liquidphasechangeinmetalfoams. J. Heat Transf. 2005, 127, 995–1004. [Google Scholar] [CrossRef] [Green Version]
Publisher’s Note: MDPI stays neutral with regard to jurisdictional claims in published maps and institutional affiliations. |
© 2022 by the authors. Licensee MDPI, Basel, Switzerland. This article is an open access article distributed under the terms and conditions of the Creative Commons Attribution (CC BY) license (https://creativecommons.org/licenses/by/4.0/).