Article

Linkage Effects Mining in Stock Market Based on Multi-Resolution Time Series Network

1
School of Computer Engineering and Science, Shanghai University, Shanghai 200444, China
2
East Sea Information Center, SOA China, Shanghai 200136, China
*
Author to whom correspondence should be addressed.
Information 2018, 9(11), 276; https://doi.org/10.3390/info9110276
Submission received: 27 September 2018 / Revised: 29 October 2018 / Accepted: 5 November 2018 / Published: 8 November 2018
(This article belongs to the Section Information Processes)

Abstract

:
Previous research on financial time-series data mainly focused on the analysis of market evolution and trends, ignoring its characteristics in different resolutions and stages. This paper discusses the evolution characteristics of the financial market in different resolutions, and presents a method of complex network analysis based on wavelet transform. The analysis method has proven the linkage effects of the plate sector in China’s stock market and has that found plate drift phenomenon occurred before and after the stock market crash. In addition, we also find two different evolutionary trends, namely the W-type and M-type trends. The discovery of linkage plate and drift phenomena are important and referential for enterprise investors to build portfolio investment strategy, and play an important role for policy makers in analyzing evolution characteristics of the stock market.

1. Introduction

In recent years, an increasing amount of scholars have begun new research and discussion on dynamic evolution analysis and trends of financial time series. In evolutionary analysis, the analytical method of complex network is often used. Usually, the complex network analysis method with minimum spanning tree (MST) was used to study key nodes [1], and the planar maximally filtered graph (PMFG) method was used to study community dynamic characteristics [2]. Zhen et al. [3] used the correlation matrix among stocks to reconstruct the complex network and analyzed the collectivization characteristics. Zhang et al. [4] analyzed the correlation between the time and space dimensions of the stock market by studying the fractal characteristics of the complex network. Zhao et al. [5] studied the portfolio of the stock market with a time series network framework and studied market stability with the network topology. Zhu and Zhang [6] analyzed the multifractal structure characteristic of the Chinese stock market using MF-DFA (Multifractal Detrended Fluctuation Analysis) method. Lahmiri [7] studied the similarity of cluster structure in the stock market using a hierarchical method based on the Hurst index. Salighehdar et al. [8] used hierarchical clustering to measure and classify different liquidity in financial markets. In the trend analysis, the methods of machine learning and neural networks are often used for prediction analysis. The unsupervised learning method was used to study the correlation of financial markets and network clusters [9]. The neural network method was used to predict the trend of the stock market [10]. Liu et al. [11] combined the social media index with the financial time series to predict the stock trend. Paranjape-Voditel and Deshpande [12] used innovative association rule mining (ARM) to analyze the financial time series, so as to recommend some investment portfolios. It can be seen that the analysis of evolution and trend of financial time series is of great significance.
The evolutionary analysis of a complex network of financial time series mainly includes linkage analysis, community analysis, and spillover effect in the evolution analysis of financial time series. For instance, Yang et al. [13] applied the complex network on studying the stability of the market core nodes and studied the linkage characteristics for investment decision-making. Hao et al. [14,15,16] made use of complex networks to conduct a dynamic analysis of network evolution of original price time series of petroleum. A complex network is also utilized by Baumohl et al. [17] to analyze the volatility spillover effect of the stock market, so as to further inquire into market liquidity and economic openness. One of the methods that Qiao et al. [18] used to identify the linkage effect of the stock market is dynamic conditional correlation. Another is the GMM (Gaussian Mixture Model) model method for finding the important nodes in the stock network. In order to analyze collectivization characteristics of the stock market, Cai et al. [19] constructed a time-series influence matrix to reconstruct complex networks and divided the clusters by using association propagation. Therefore, it is easy to find that using complex networks to analyze the evolution of financial markets has been widely accepted and recognized.
In addition, wavelet transform has been widely used to extract periodic features in different resolutions in the field of financial research. Huang et al. [20,21] combined wavelet with complex network theory to study collectivization characteristics of related models and the long-term and short-term characteristics. By wavelet analysis, Lahmiri et al. [22] succeed in analyzing the characteristics of long- and short-term changes before and after the financial crisis. Tiwari et al. [23] used wavelet transform to re-examine the relationship between inflation and the output gap.
At present, the research on financial time series mainly focuses on the evolution and trend analysis of the whole stock market. However, those methods all lack analysis of financial time series in different resolutions and stages, which leads to failure to find some potential cyclical characteristics and evolution paths. In this paper, we propose a complex network analysis method based on wavelet transform. Based on the similar structural relations among stock time series, the network is constructed to analyze the evolution and trend characteristics of different resolutions between plates in different stages. It is found that industrial linkage effect exists in the information and material industry in the past five years. The plate drift phenomenon occurs in the mineral products plate and the multi-financial plate before and after the stock market crash. Those findings are of great significance for the analysis of the evolving characteristics between plates. Meanwhile, the discovery of linked stocks can be more conducive to create a goal-oriented investment strategy or economic policy.
The rest of this paper is organized as follows. Section 2 principally introduces the method of constructing the complex network and analysis method. Section 3 focuses on the data source and analysis results. The final section summarizes the work of this paper and give some further discussions.

2. A Complex Network Model Based on MODWT (Maximal Overlap Discrete Wavelet Transform)

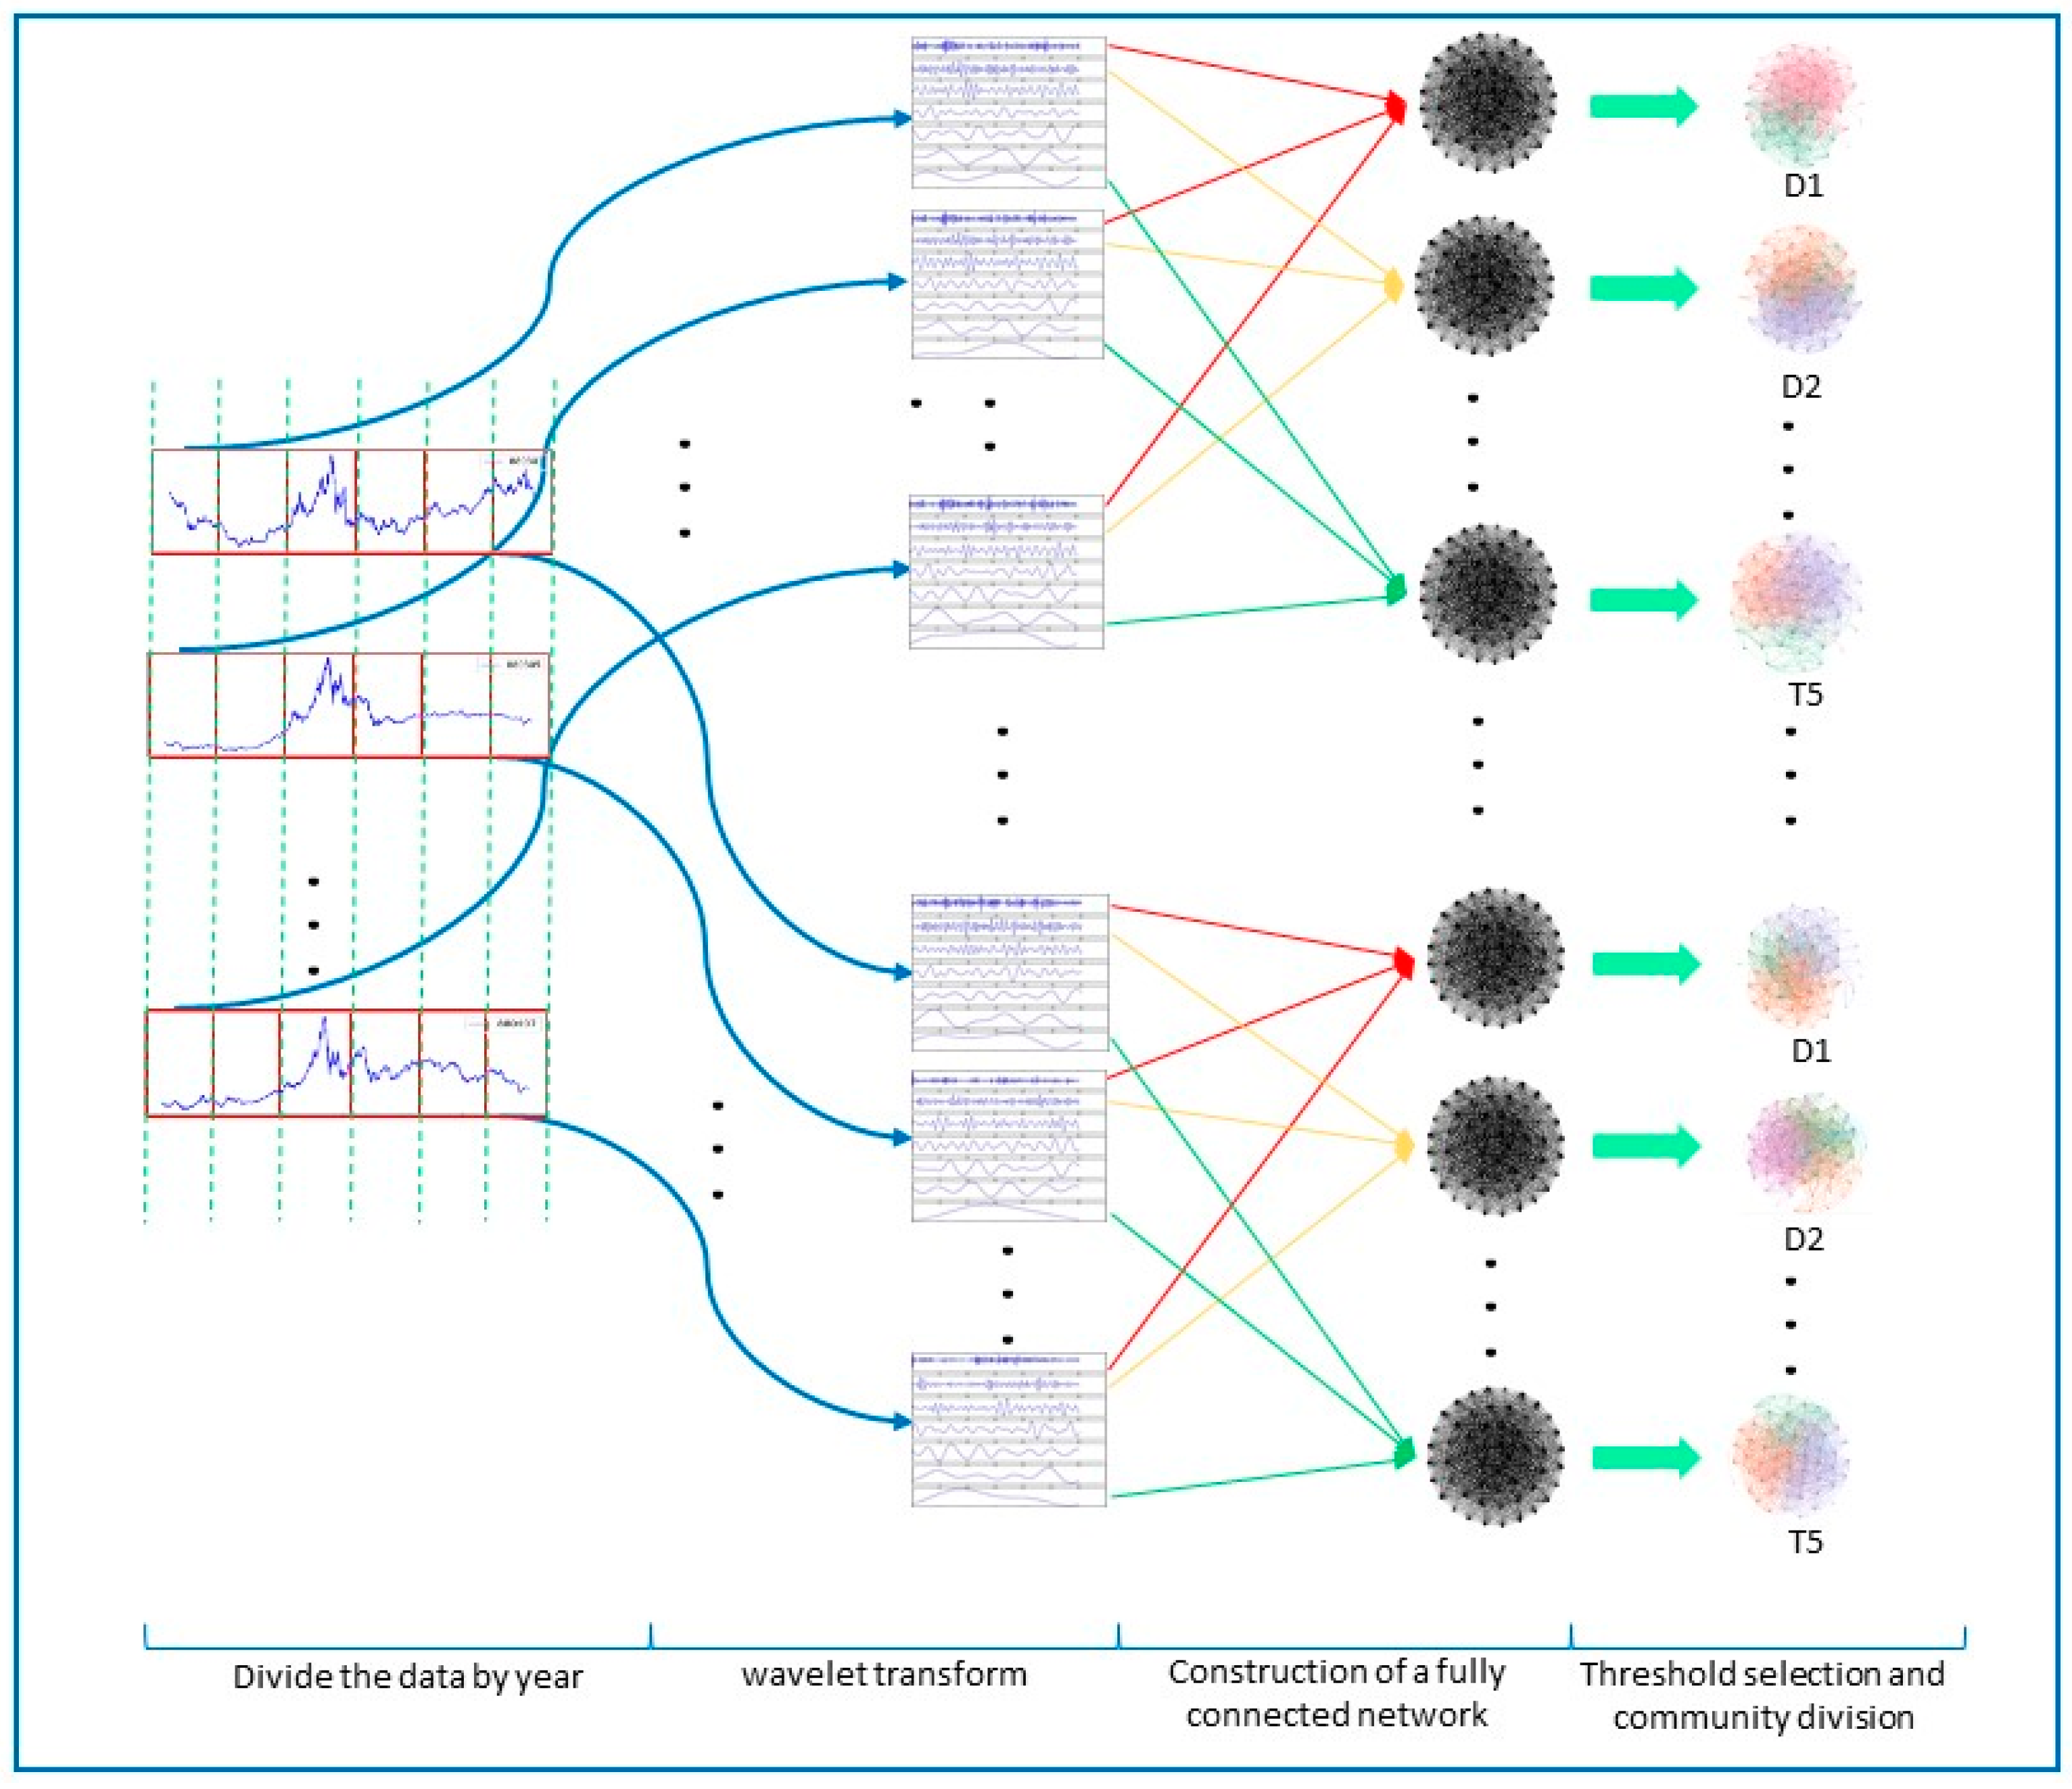
In contrast to the traditional research, an innovative complex network model based on wavelet was proposed (see Figure 1). This model includes the MODWT (used in signal analysis field), the Pearson correlation coefficient, and the complex network method. The MODWT can extract the features of multiresolution in the sequence. The Pearson correlation coefficient could measure the linear similarity between the two variables. The complex network model can analyze the characteristic of stock evolution. This research mainly consists of four steps to complete the empirical analysis.
  • Feature extraction of multi-resolution time series: the time-series data are divided by year, and then wavelet decomposition is performed on annual data, thus we can obtain the characteristic sequences of different resolutions during different stages.
  • Construction of correlation between plate stock: Pearson correlation coefficients are calculated between the wavelet sequences of different years and different resolutions as the weight of the edges in a complex network.
  • Reconstruction of multi-resolution threshold network: the network is built based on the Pearson coefficient of different plate stock, and then optimal threshold is used to select to filter the network side in order to construct a threshold network.
  • The evolutionary analysis of complex networks: the evolution and trend of networks are analyzed based on multi-resolution threshold network.

2.1. Feature Extraction of Multi-Resolution Time Series

Wavelet transform is an advanced tool for time-series decomposition. A discrete wavelet transform proposed by Percival and Walden [24] was named maximum overlap discrete wavelet transform (MODWT), which has been widely used in economic and financial fields [25]. MODWT also avoids adverse effects caused by selecting and analyzing the starting point.
Wavelet transform mainly consists of two parts as filter functions. One is the scaling function called the father wavelet, which reflects the time-domain feature. There is also a scaling variable that corresponds to the scaling function. The other is the wavelet function called the mother wavelet, which reflects the frequency-domain feature and can be scaled and translated to form a basis for the Hilbert space of square integrable functions [26]. Likewise, there is a wavelet coefficients variable that corresponds to the wavelet function. The scaling function and wavelet function are given by Equations (1) and (2), respectively. The scaling variable and wavelet coefficient variable are given by Equations (3) and (4), respectively.
φ j , k ( t ) = 2 j 2 φ ( 2 j t k )
ψ j , k ( t ) = 2 j 2 ψ ( 2 j t k )
α j , k ( t ) = φ j , k ( t ) X ( t )
β j , k ( t ) = ψ j , k ( t ) X ( t )
In those formulae, j is the scaling parameter and k is the translation parameter. Based on the scaling function and wavelet function, the reconstruction function can be given by Equation (5).
X ( t ) = k α j , k φ j , k ( t ) + n = 1 j k β n , k ψ n , k ( t )
As a result, we can transform the original time series into multiple detailed sequences, as shown in Equation (6).
S = T n + D n + D n 1 + + D 2 + D 1
In the above formula, D n represents the frequency feature sequence at the n th level, and T n represents the trend feature sequence.
In this paper, we can divide time series data into n feature sequences and one trend sequence. The practical reference period is shown in Table 1. After MODWT for different stocks, we can obtain the characteristic sequence of different stocks in different stages, thus providing more detailed data resources for this paper.

2.2. Construction of Correlation Between Plate Stock

Pearson correlation coefficient is used to measure the linear similarity between two variables to determine the degree of correlation between factors. Türker et al. [27] used Pearson coefficients to construct complex networks for key node analysis. Patwary et al. [1] analyzed the changes of key nodes before and after the financial crisis by establishing a correlation matrix for stock market returns.
The Pearson coefficient defines the quotient of covariance and standard deviation between two variables. The specific operation formula is as shown in Equation (7).
C i j = r i r j r i r j r i 2 r i 2 r j 2 r j 2
As shown above, r i and r j are vectors of return series of stock markets i and j , respectively, and · is the time average over the period investigated.
Then, the Pearson correlation matrix C is as follows:
C = [ C 11 C 12 C 1 N C 21 C 22 C 2 N C N 1 C N 2 C N N ]
In the above formula, C i j ranges from −1 to 1 and N is the number of stock markets. Because the Pearson coefficient has no direction, C i j is equal to C j i .
The Pearson correlation coefficient has an important feature that it will not cause the change of the coefficient when the change of the position and scale of the two variables occurs. Considering that it will not be affected by other variables, it can be more realistically applied in the similarity between two variables. In this paper, we calculate the coefficient matrix of stock time series in different stages and resolutions as the weight between the nodes of complex network.

2.3. Reconstruction of Multi-Resolution Threshold Network

A complex network can be represented as a binary group of edges and nodes, G = ( V , E ) , and V means a set of nodes and E stands for a set of edges. In this paper, multiple networks are constructed by reconstructing the threshold network and then analyzed by community division. Because complex network analysis could quantify the structural characteristics of the network, it can further analyze the network corresponding to the stock market implied characteristic information. In previous studies, the hierarchical clustering (HC) method was often used to study evolution characteristics. As the result of hierarchical clustering being based on a tree-like structure, the final number of communities needs to be determined artificially. It can increase the interference of human factors, so as to reduce the accuracy of classification. Using the network method to get the number of communities is based on the modularity, which reduces the interference of human factors. It can improve the accuracy of classification. Therefore, this paper uses the method of building a complex network to carry on the evolution analysis.
In this article, each plate stock represents a node. The Pearson coefficient matrix between plate stocks is regarded as the weight between nodes. After establishing a fully connected network, we filter the network by threshold value to obtain effective edge weight. The Pearson coefficient was selected as the filter threshold when the complex network has a maximum modularity. The modularity calculation is shown in Equation (9).
Q = 1 2 m v w [ A v w k v k w 2 m ] δ ( c v , c w )
In this formula, A v w stands for the adjacency matrix of the network, k v represents the degree of the node v , δ ( c v , c w ) judges whether node v and node w are in the same community, and m means the number of the node. The modularity is an important standard to measure the result of the network’s community division [28]. Accurately, the larger the modularity, the better the community division.
The construction of the multi-resolution network principally consists of the following three steps:
  • Calculating the Pearson correlation matrix between plate stock and plate stock.
  • According to the correlation matrix, as the edge weight of the network, a fully connected network is constructed.
  • By screening the modularity degree of all threshold networks, the optimal modularity degree network is selected.
The whole process of network construction is shown in Figure 2. After the analysis of the network characteristics of different stages and periods, it is accessible to gain the evolution characteristics and trend characteristics between plates.

2.4. The Evolutionary Analysis of Complex Networks

The analysis of network evolution, after establishing the optimal threshold network model of different resolutions, mainly includes three steps.
(1) Based on the feature description of the whole network, we use the fast unfolding [29] community partitioning algorithm to divide the networks. The fast unfolding community partition method is one of the popular community division algorithms based on modularity. This method gradually merges the nodes into the neighborhood community, and finds the community that makes the modularity degree increase. It then folds the aggregated community into new points. Finally, iterative calculation until the modularity does not increases. With regard to the traditional computational complexity, this method is lower than O ( n 3 ) of the hierarchical clustering (HC) and lower than O ( m 2 n ) the GN algorithm [28] (where m is the number of edges in the network and n is the number of nodes in the network). In this article, the discussion has to do with the characteristic structure of the Chinese stock market in the past five years and six different stages, in which we calculated the accuracy rate of the network community division. The calculation of accuracy is shown in Equation (10).
a c c ( f ; D ) = 1 m i = 1 m I ( f ( x i ) = y i )
The plate linkage effect in the stock market can be revealed by the plate accuracy. To be specific, the extent of interaction between different plates in the same industry was stronger than in different industries, and share price spread more easily. When the stock market that mainly dominated industry received influence from outside factors, the members of plates in different clusters will change. The classification errors of plates we analyzed can further reveal the variation characteristics of China’s industrial sector, which is crucial for policy makers.
(2) Analyze network characteristics from the perspective of network integrity. There are three evaluation indexes of the whole network characteristic employed in this part. The first index is average node weight strength (ANWS) [30], which represents the whole concentricity of Chinese plate stock price co-movement. For policy-makers, the greater the overall concentricity of the sub-cycle of unstable characteristics, the more obvious the overall coordinated movement, and the greater the value of its attention. The second evaluation index is average path length (APL) [15], which represents the spreading cost of global oil prices in different plate stock market. We use APL to measure the degree of the market spillover. The smaller the APL diffusion path for different fluctuation sub-cycles, the faster the spillover effect of different oil markets will be, and the higher the value of its concern will be. The apparent spillover effect helps policymakers build a forecasting system for stock price fluctuations. The third evaluation index is modularity, which represents the degree of industrialization. The greater modularity, the more distinct the industrial structure of the stock market. Sub-cycles with significant structural characteristics for policy makers help countries to clarify multilateral trading systems and adjust portfolios for market investors.
(3) Analyzing the key nodes and key paths of the stock market. In this part, we use the eigenvector centrality (EC) [30] to analyze the integration level of the dominant stock market in the network. The nodes with high EC score contribute more to the network than those with low EC score. In this paper, EC is used to measure the impact of different industry sectors on the degree of stock market integration. The larger EC nodes form a diffusion path with special effects, which potentially drive the stock market to become concentric. These findings help regulators to monitor and investigate important sectors.

3. Results and Analysis Based on Complex Network Analysis Method

3.1. Data and Preliminary

We conducted a study of the evolution characteristics of cooperative movement between different plate stocks according to the different division of industrial stocks in TDXS (Tong Da Xin Software) financial terminal software. In the terminal software, China’s stock market was divided into three levels by sector. There are 13 sectors in the first level, namely, energy, materials, daily consumption, optional consumption, commercial retail, social services, equipment manufacturing, utilities, transportation, finance, construction real estate, information industry, and comprehensive industry. The secondary plate has 56 plates. The third level has 109 subdivisions. The sectors data we selected are the 17 secondary plates with a relatively certain business scope, which are relatively pure (not diversified) compared with other industries. There are 6 secondary sectors in the information industry, including computer equipment (32 companies), communication equipment (113 companies), semiconductor (55 companies), components (165 companies), software services (169 companies), and Internet (54 companies). There are 7 secondary plates in material industry with steel plate (59 companies), non-ferrous metal plates (96 companies), chemical fiber plate (24 companies), building materials (279 companies), chemical plate (74 companies), paper industry plate (24 companies), and mineral products plate (18 companies). The financial industry has 4 secondary plates, namely, the banking sector (28companies), insurance (40 companies), securities plate (6 companies), and multivariate financial plate (21 companies). We chose the closing price of the index of all secondary sectors in the information industry, materials industry and the financial industry as the original data. The period was January 1, 2013 until July 19, 2018, with a total of 1,269 trading days.
In this experiment, we first preprocessed the data. The purpose of logarithmic pretreatment is to remove exponential trends and reduce the effect of slopes. We suppose that the stock’s effective trading day is p i ( 1 ) , p i ( 2 ) , , p i ( N ) , where N represents the number of days of effective trading in the stock i , And p i ( t ) represents the closing price of stock i on day t . We define the rate of the return on day t as r i ( t ) , the specific calculation of which is given as Equation (11).
r i ( t ) = l n P i ( t ) l n P i ( t 1 )
After the log operation, the data of each stock form a series of returns of N 1 observed values. There are 17 stock sequences in the secondary stock. After the log operation, 17 logarithmic rate of return sequences could be formed. We then divided the data by the years, so that each stock could form six intervals.

3.2. Plate Evolution Analysis

3.2.1. Analysis of Industry Plate Linkage Evolution

We could calculate the accuracy rate using Formula (4) after the community division of complex networks in different stages and resolutions; as shown in Table 2 below.
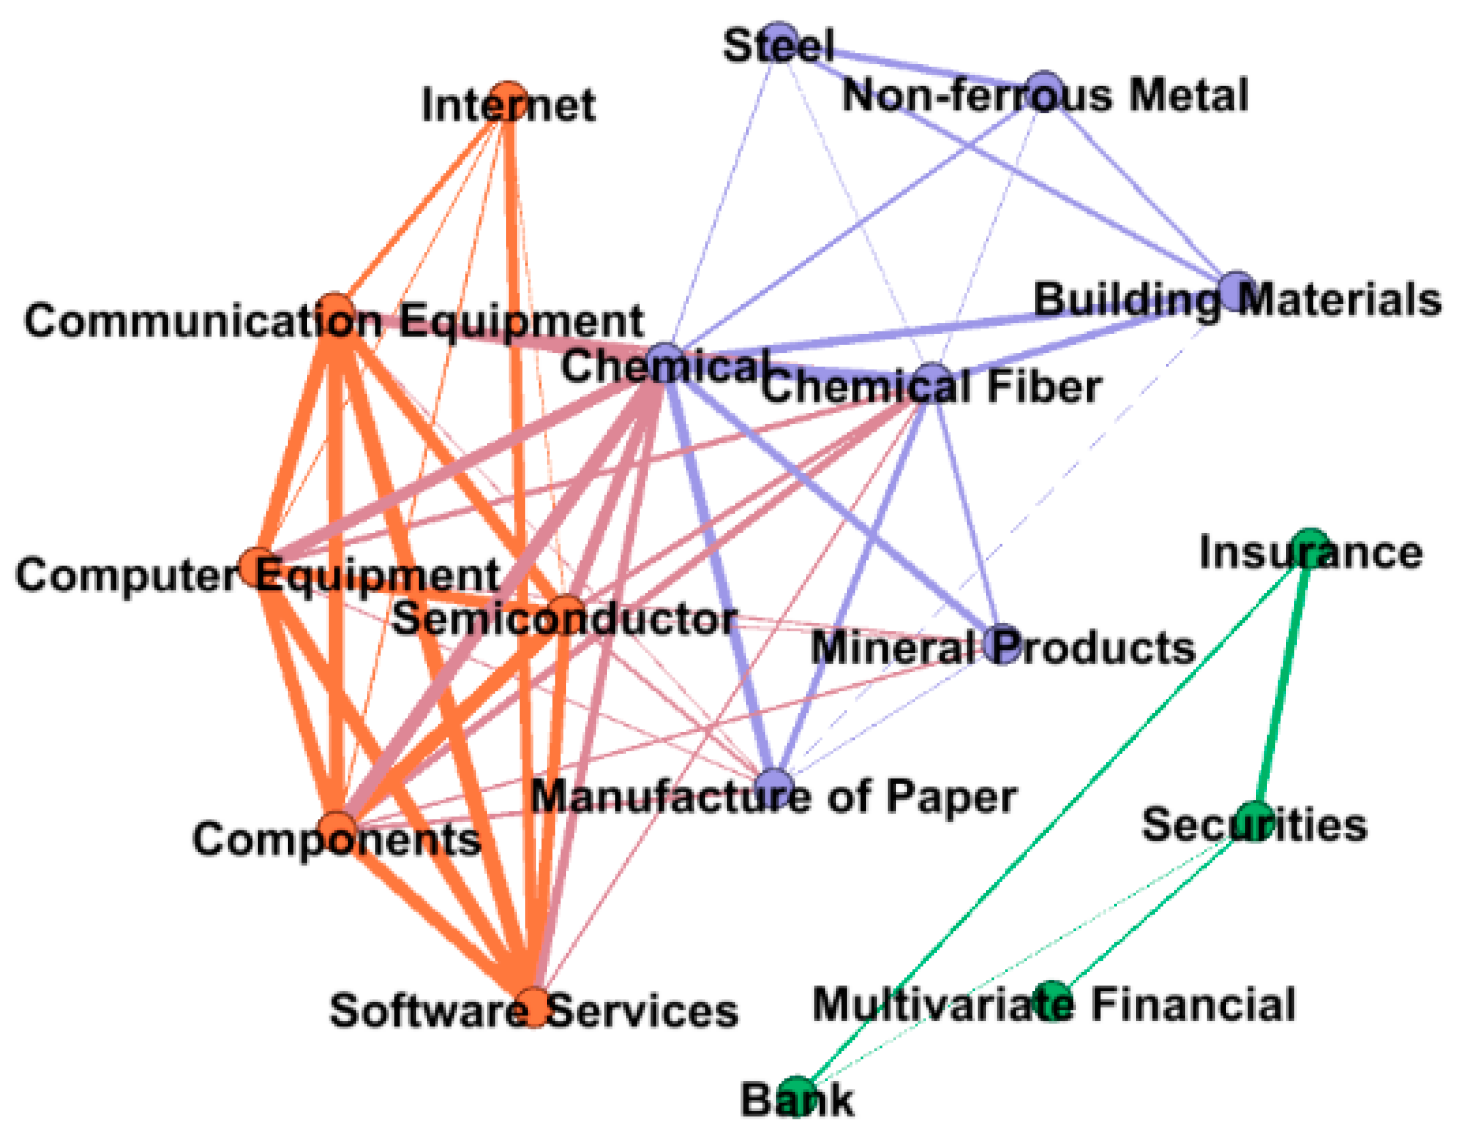
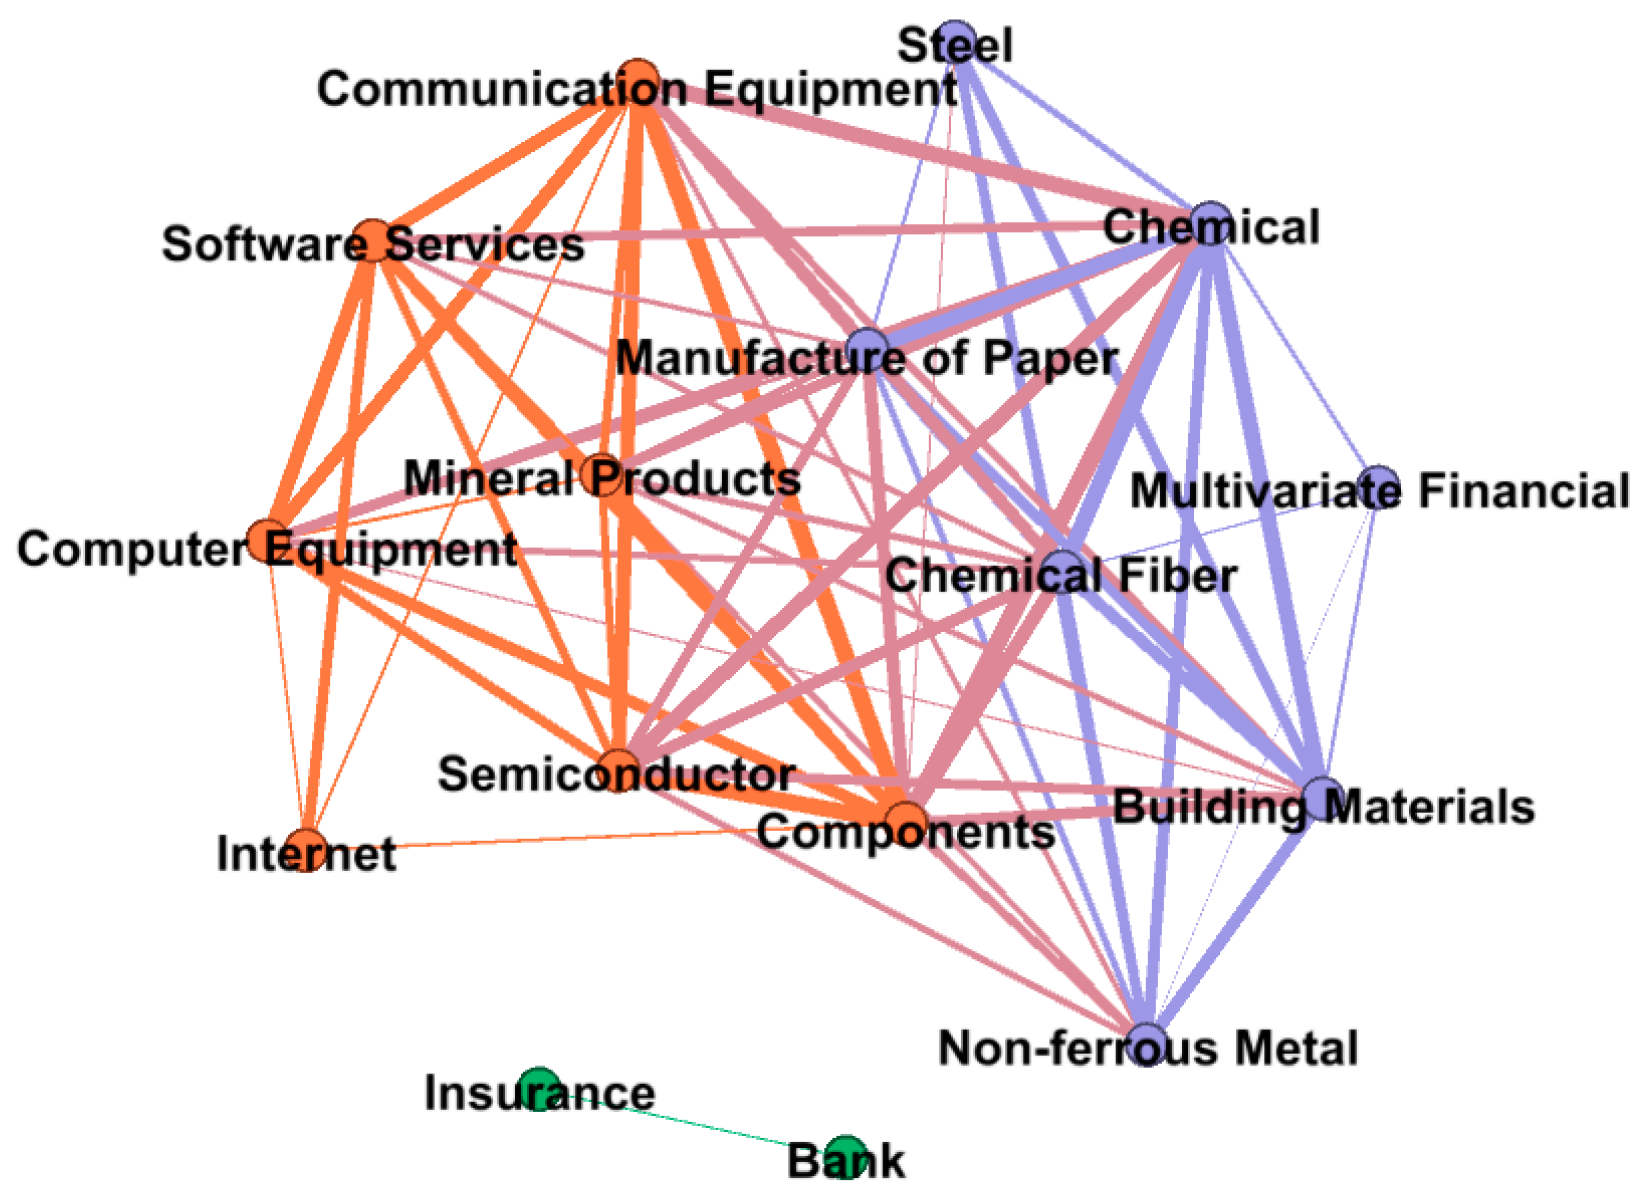
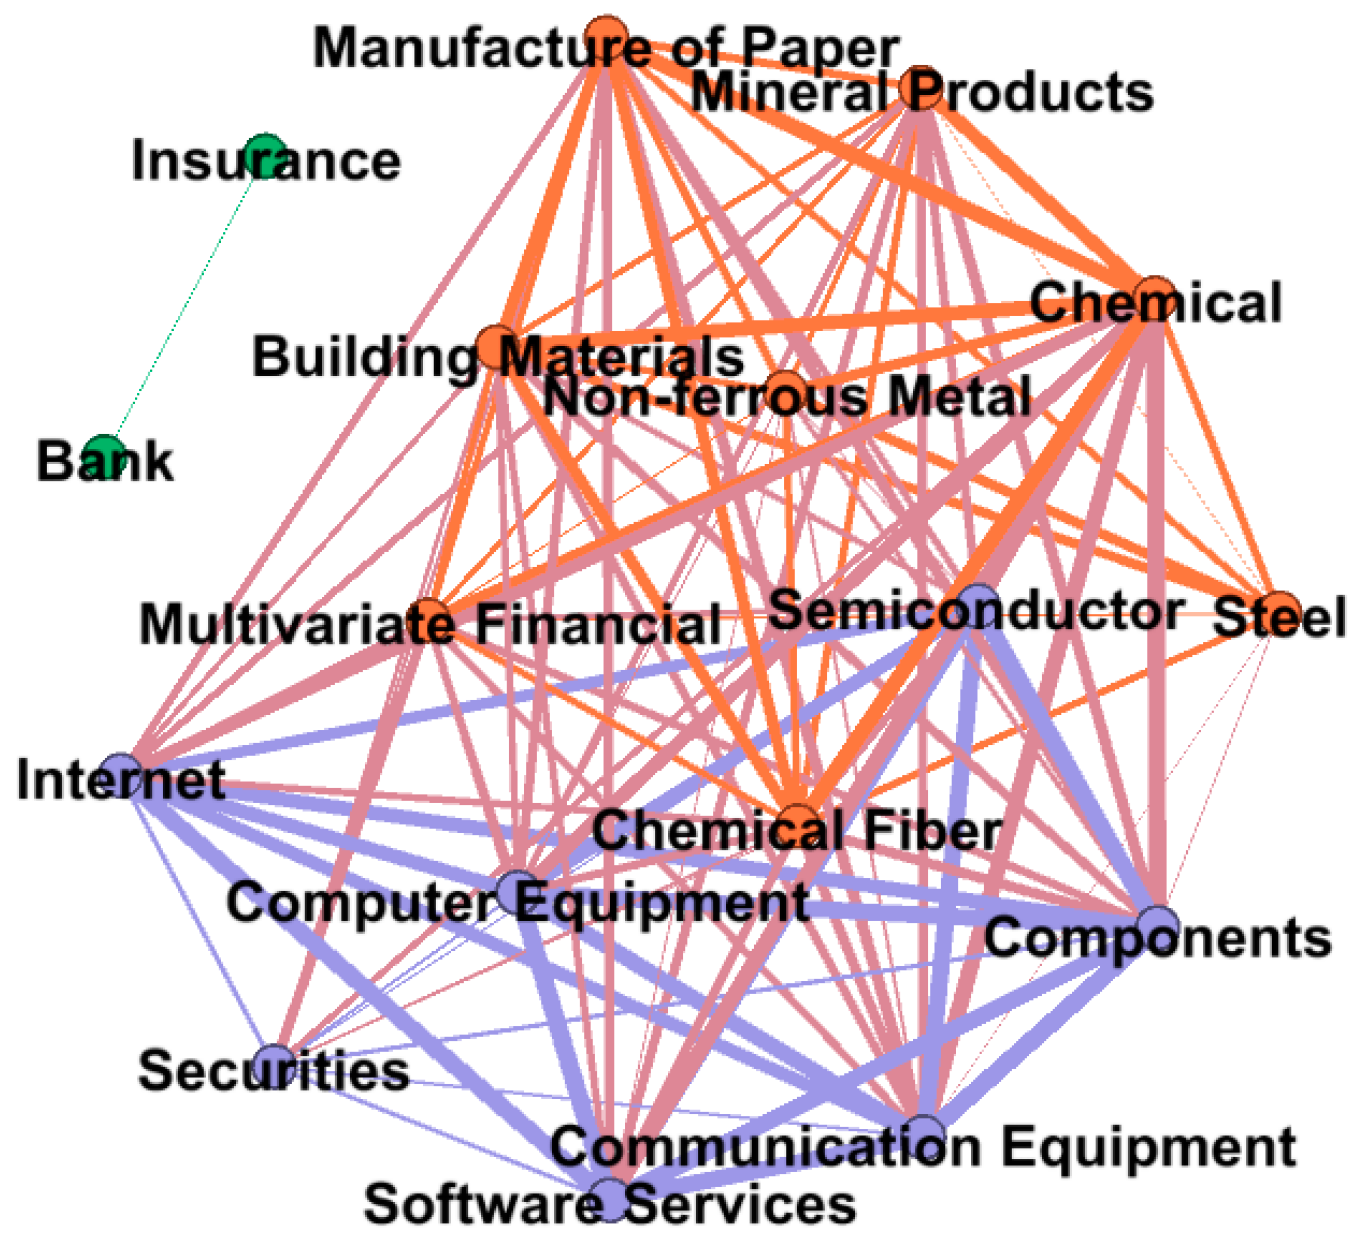
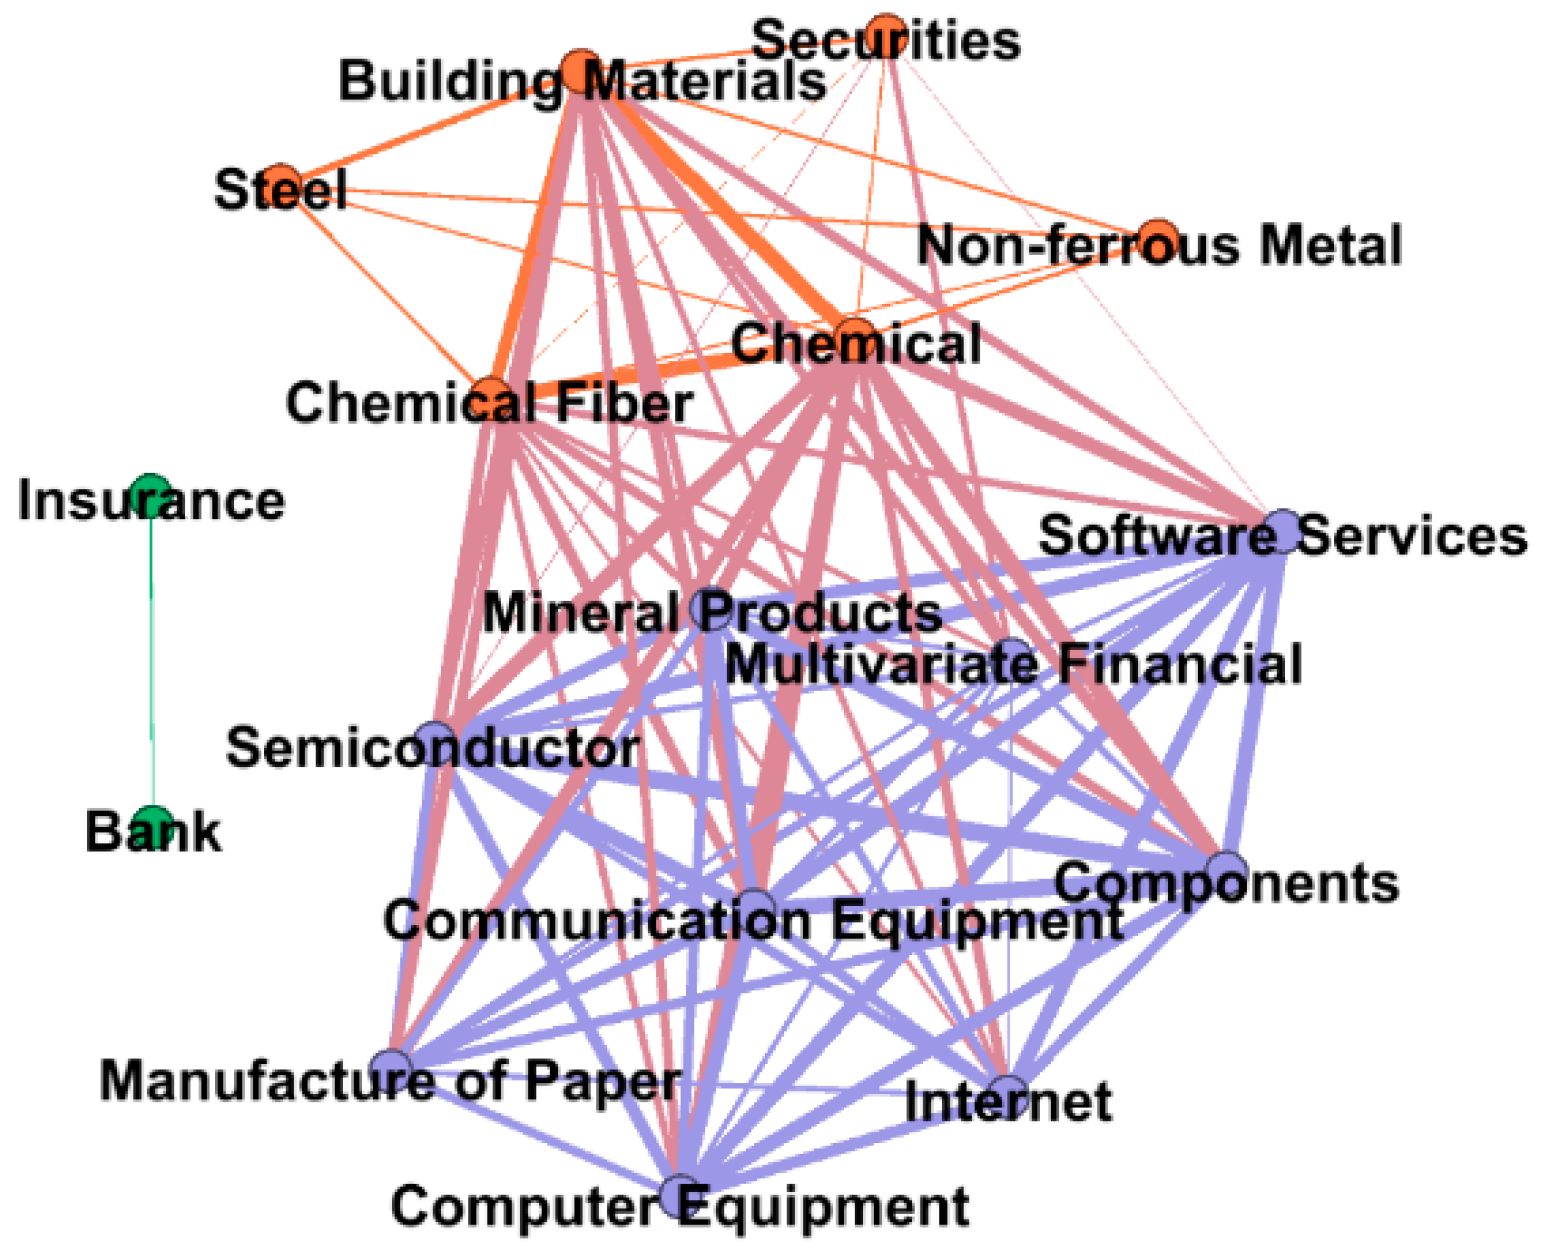
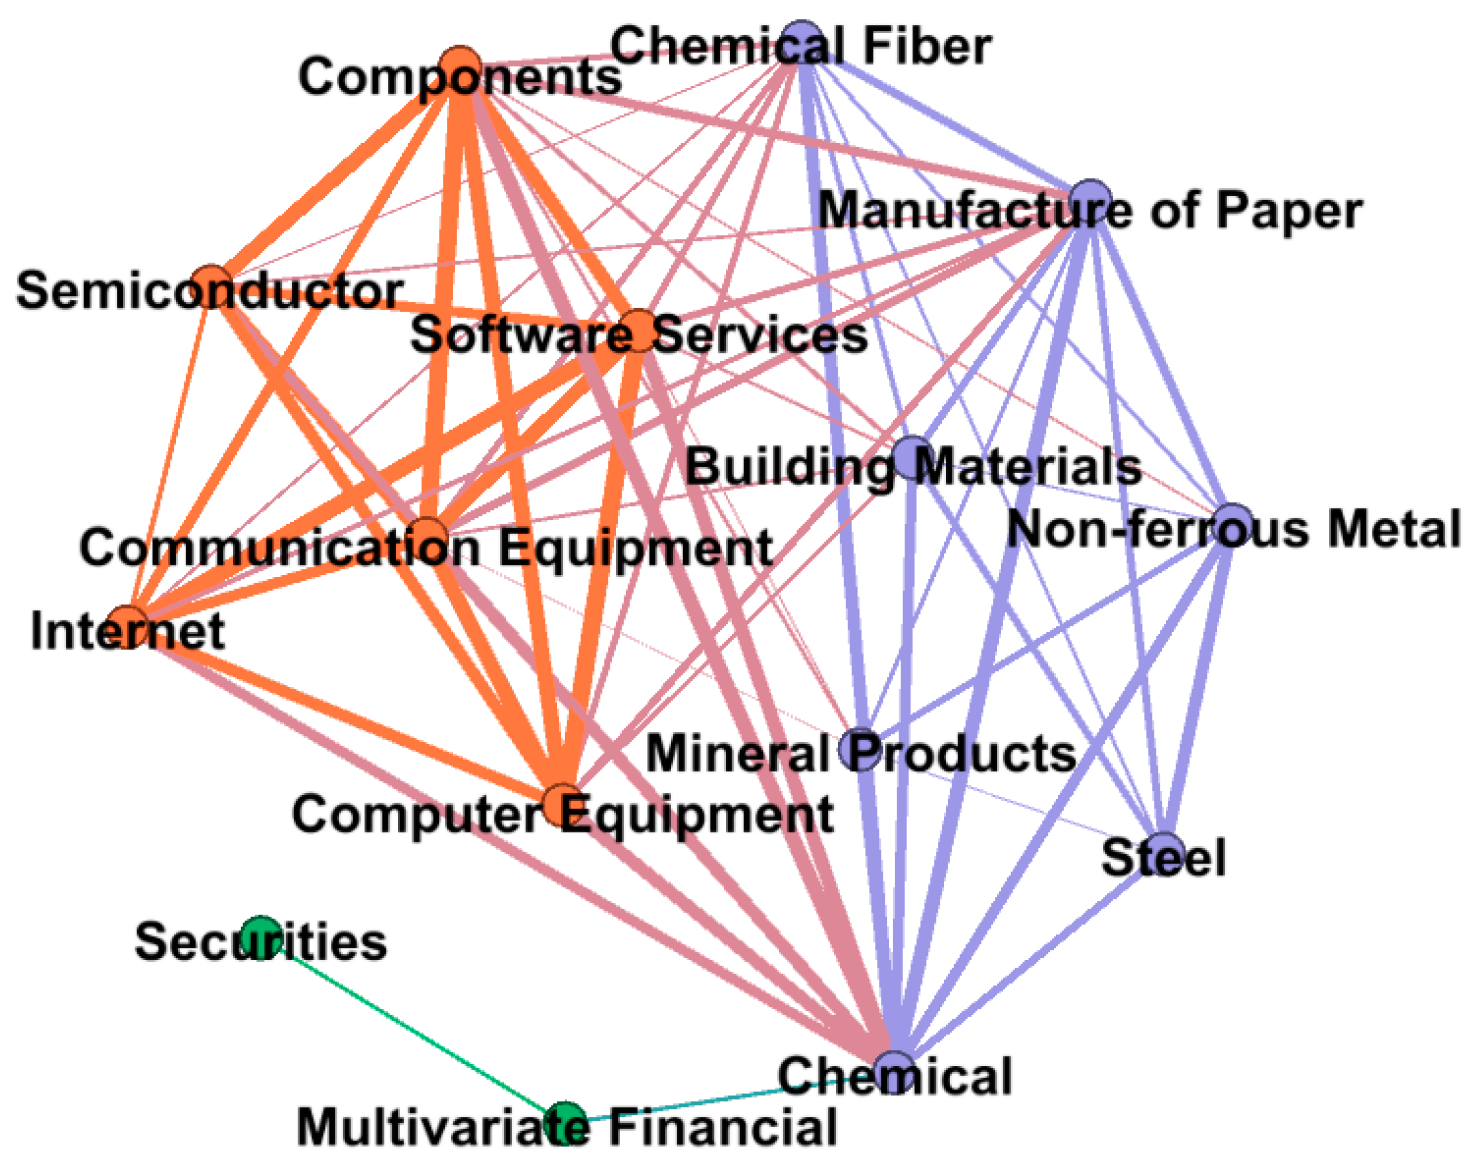
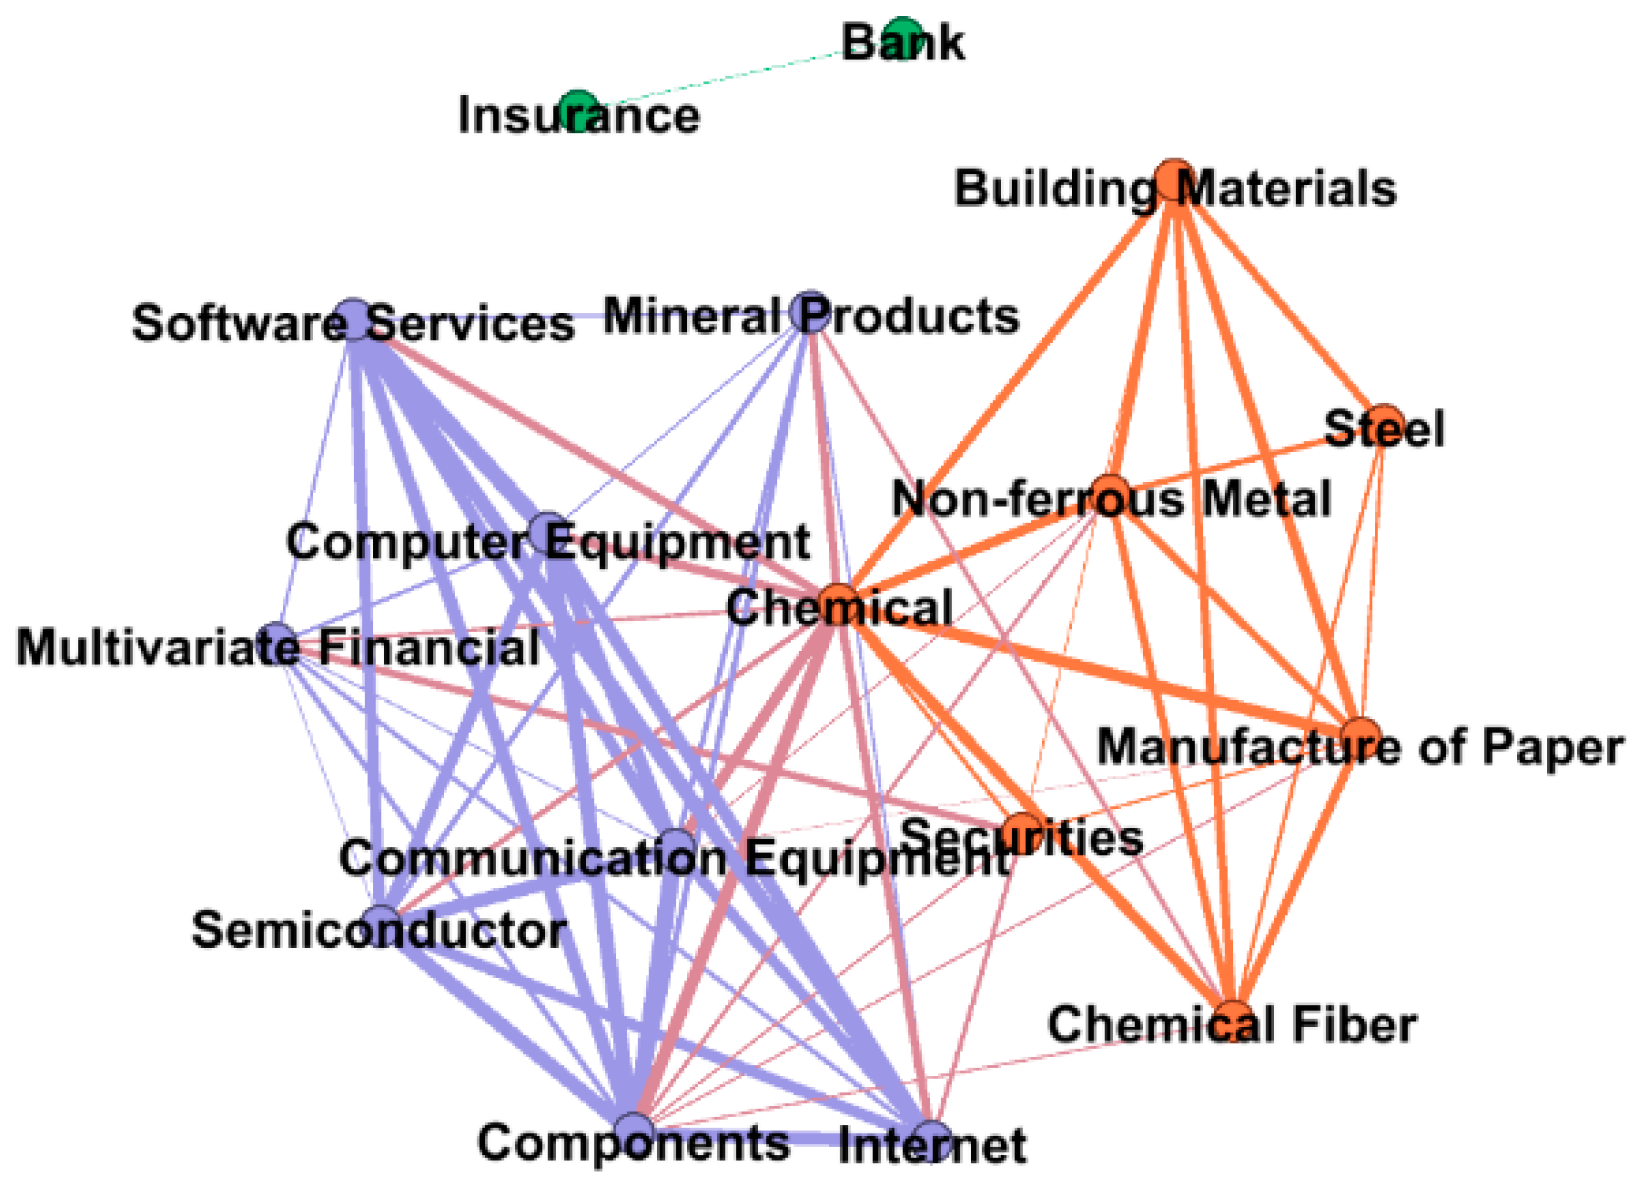
We found that community division can correctly classify most sectors in the industry, which indicates that the stock market has an obvious linkage effect of industry sectors. It can be proven from the accuracy that the linkage strength is relatively strong in the period of 2–4 days and 8–16 days. From Figure 3, Figure 4, Figure 5, Figure 6, Figure 7 and Figure 8, Internet, software service, communication equipment, semiconductor, and computer equipment have the effect in the information industry.
The analysis of the stock market in the past five years shows that it was in a stable development stage in 2013, so there was no significant change in community members in the sectors. In 2014, 2015, and 2016, China’s stock market experienced a stock market crash. From the results of corporate division, the diversified financial sector and the mineral products sector were in drift, so some sectors in the industry would be differentiated from other sectors in the same industry before and after the crash. The stock market in 2017 and 2018 was at a steady growth stage with no significant changes, so there was no significant change in community membership. We conducted further research on the drifting plates. The drifting plates were removed from the industry to calculate the accuracy of the plate division. We found that the accuracy of the removed plates is greatly improved, as shown in Table 3.
For further study, we analyzed the companies within the mineral products and diversified financial sectors. Some of the companies in mineral products engaged in new energy business, such as Beijing Easpring Material Technology Company, which mainly engaged in new energy materials research and development. Because of the new energy and new material industry, a new material industry emerged with different development models from the traditional material industry, the mineral plate drifts in the case of market instability. Therefore, we can consider that the mineral products plate is more diversified (impure) compared with other plates in the material industry. After analyzing diversified finance, we found that there are some companies engaging in information technology and materials under this sector; for instance, Hainan Haide Industry Company, Rendong Holdings Company, and Minmetails Capital Company. These companies are involved in the information industry and the material industry and are not completely related to the financial industry, so the diversified financial sector drifts when the market is unstable. This can indicate that the main business of the companies in the diversified financial sector is disorderly, and they cannot follow the development of the financial industry well when the stock market crash occurs. Therefore, we can consider the diversified financial sector as an impure sector relative to other sectors of the financial industry. As a result, we can conclude that the industry impure plate will experience the plate drift phenomenon during the occurrence of the stock market crash in the pre-, mid-, and post-stage. Hence, these analyses have important reference significance for us to make a portfolio in different periods.

3.2.2. Analysis of Network Characteristics Evolution

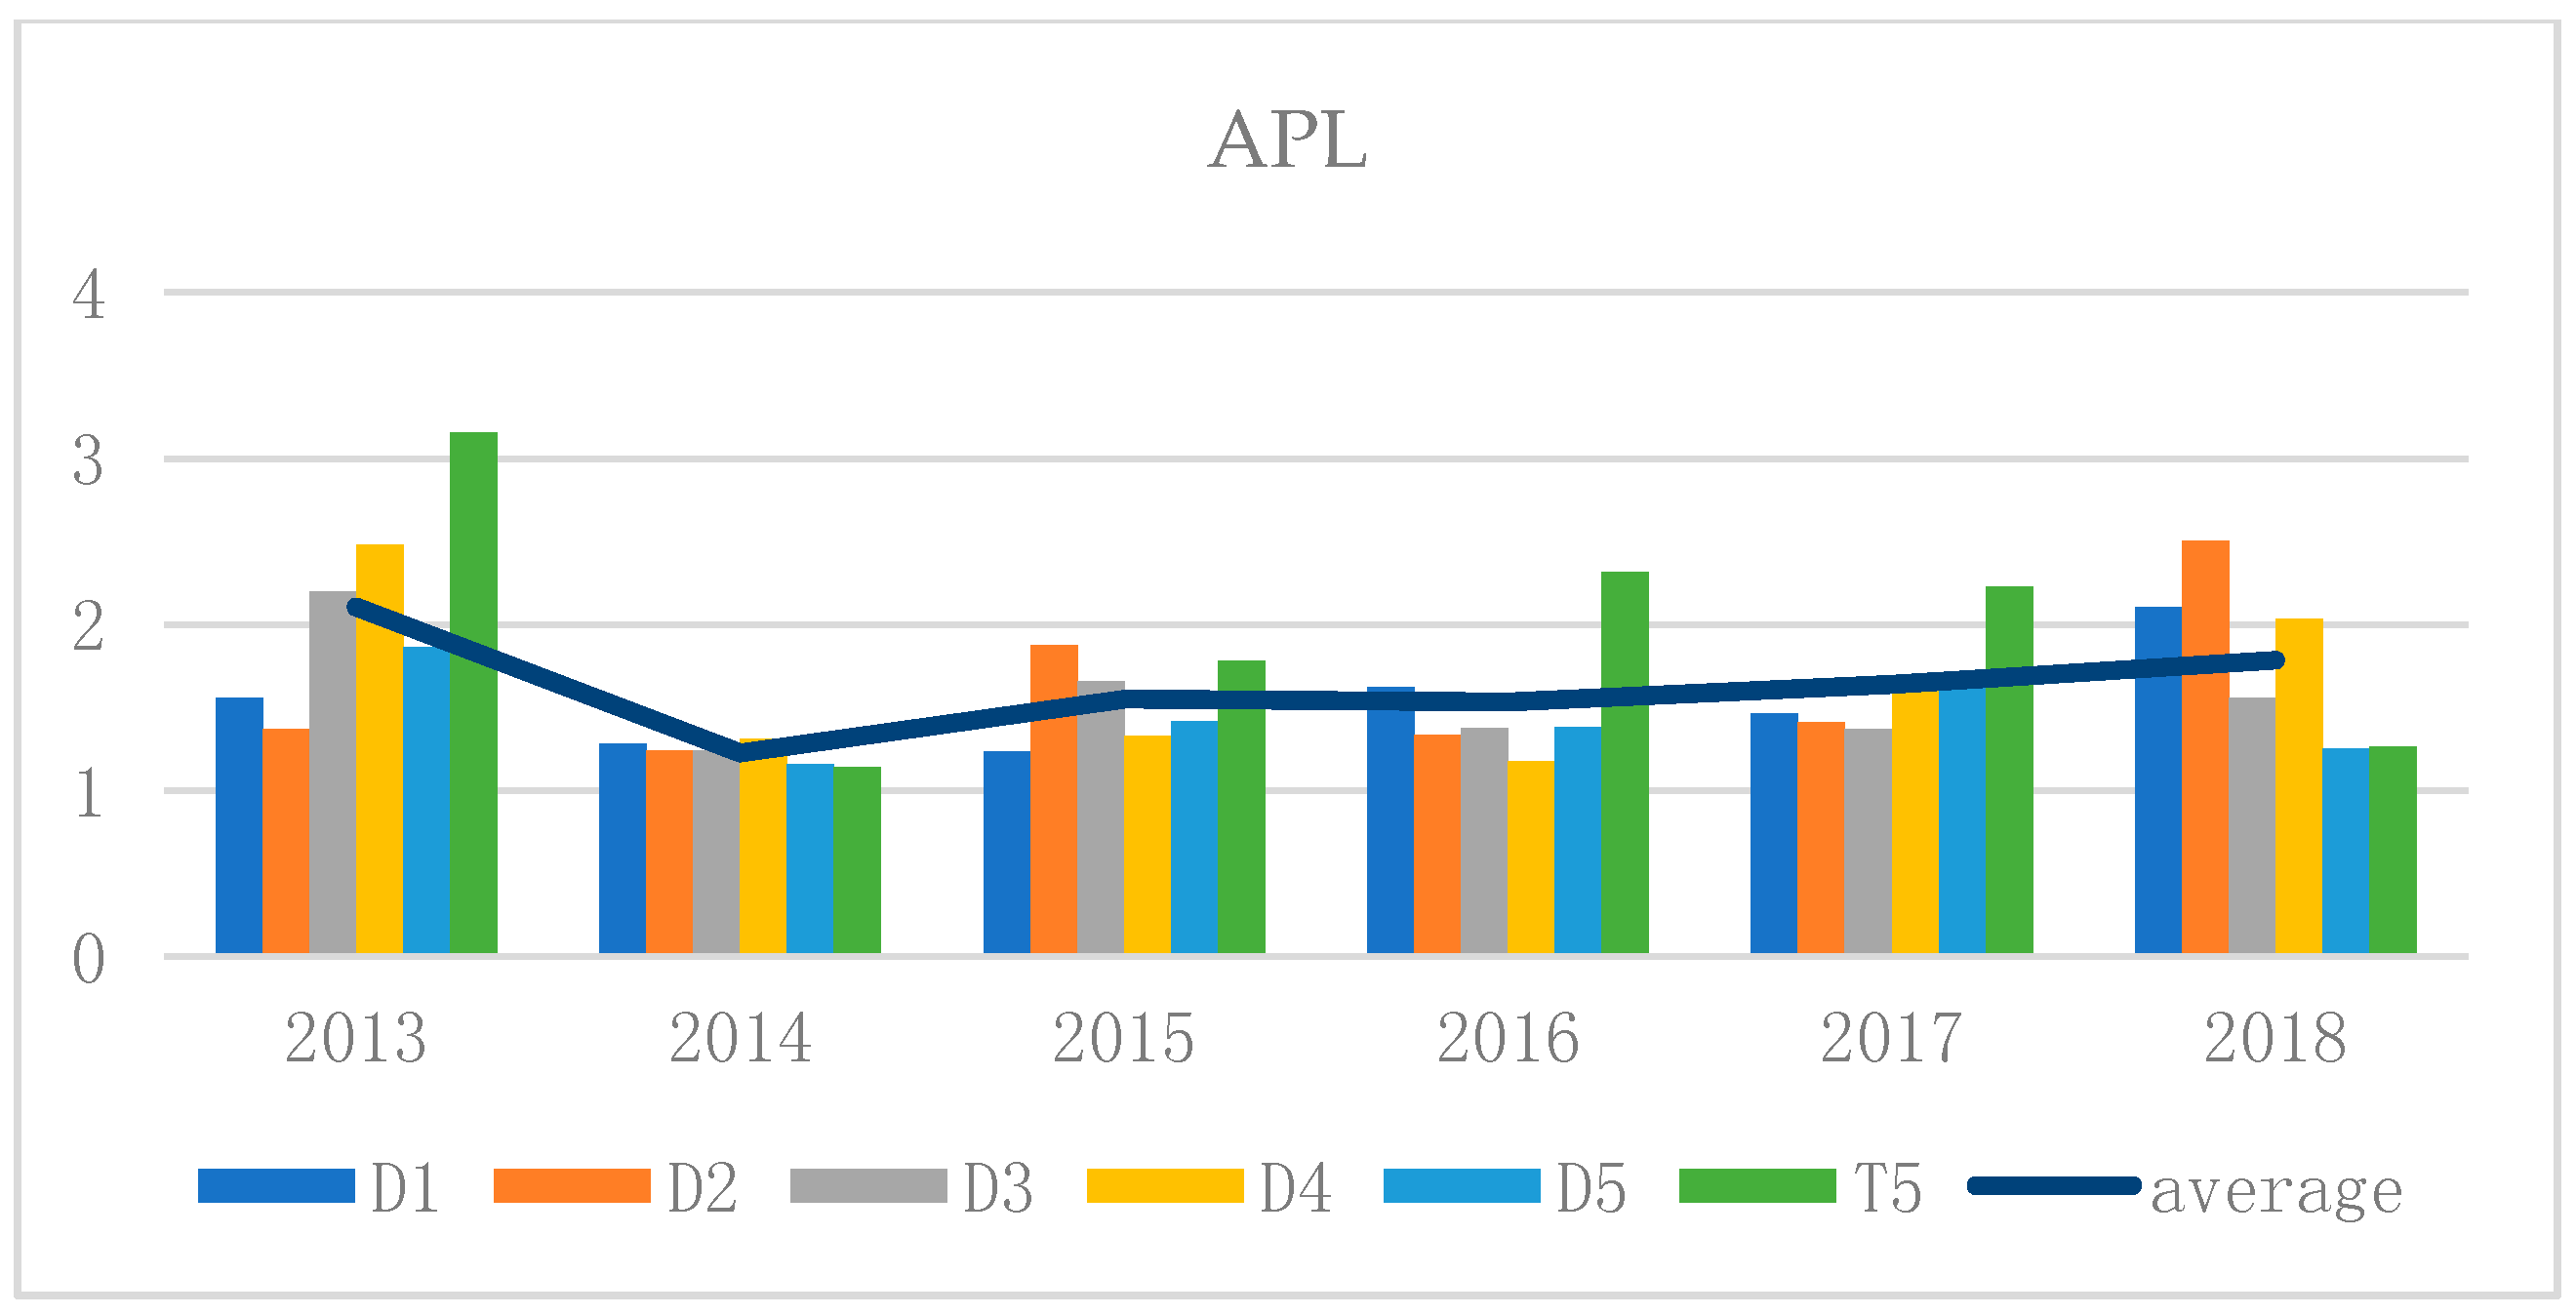
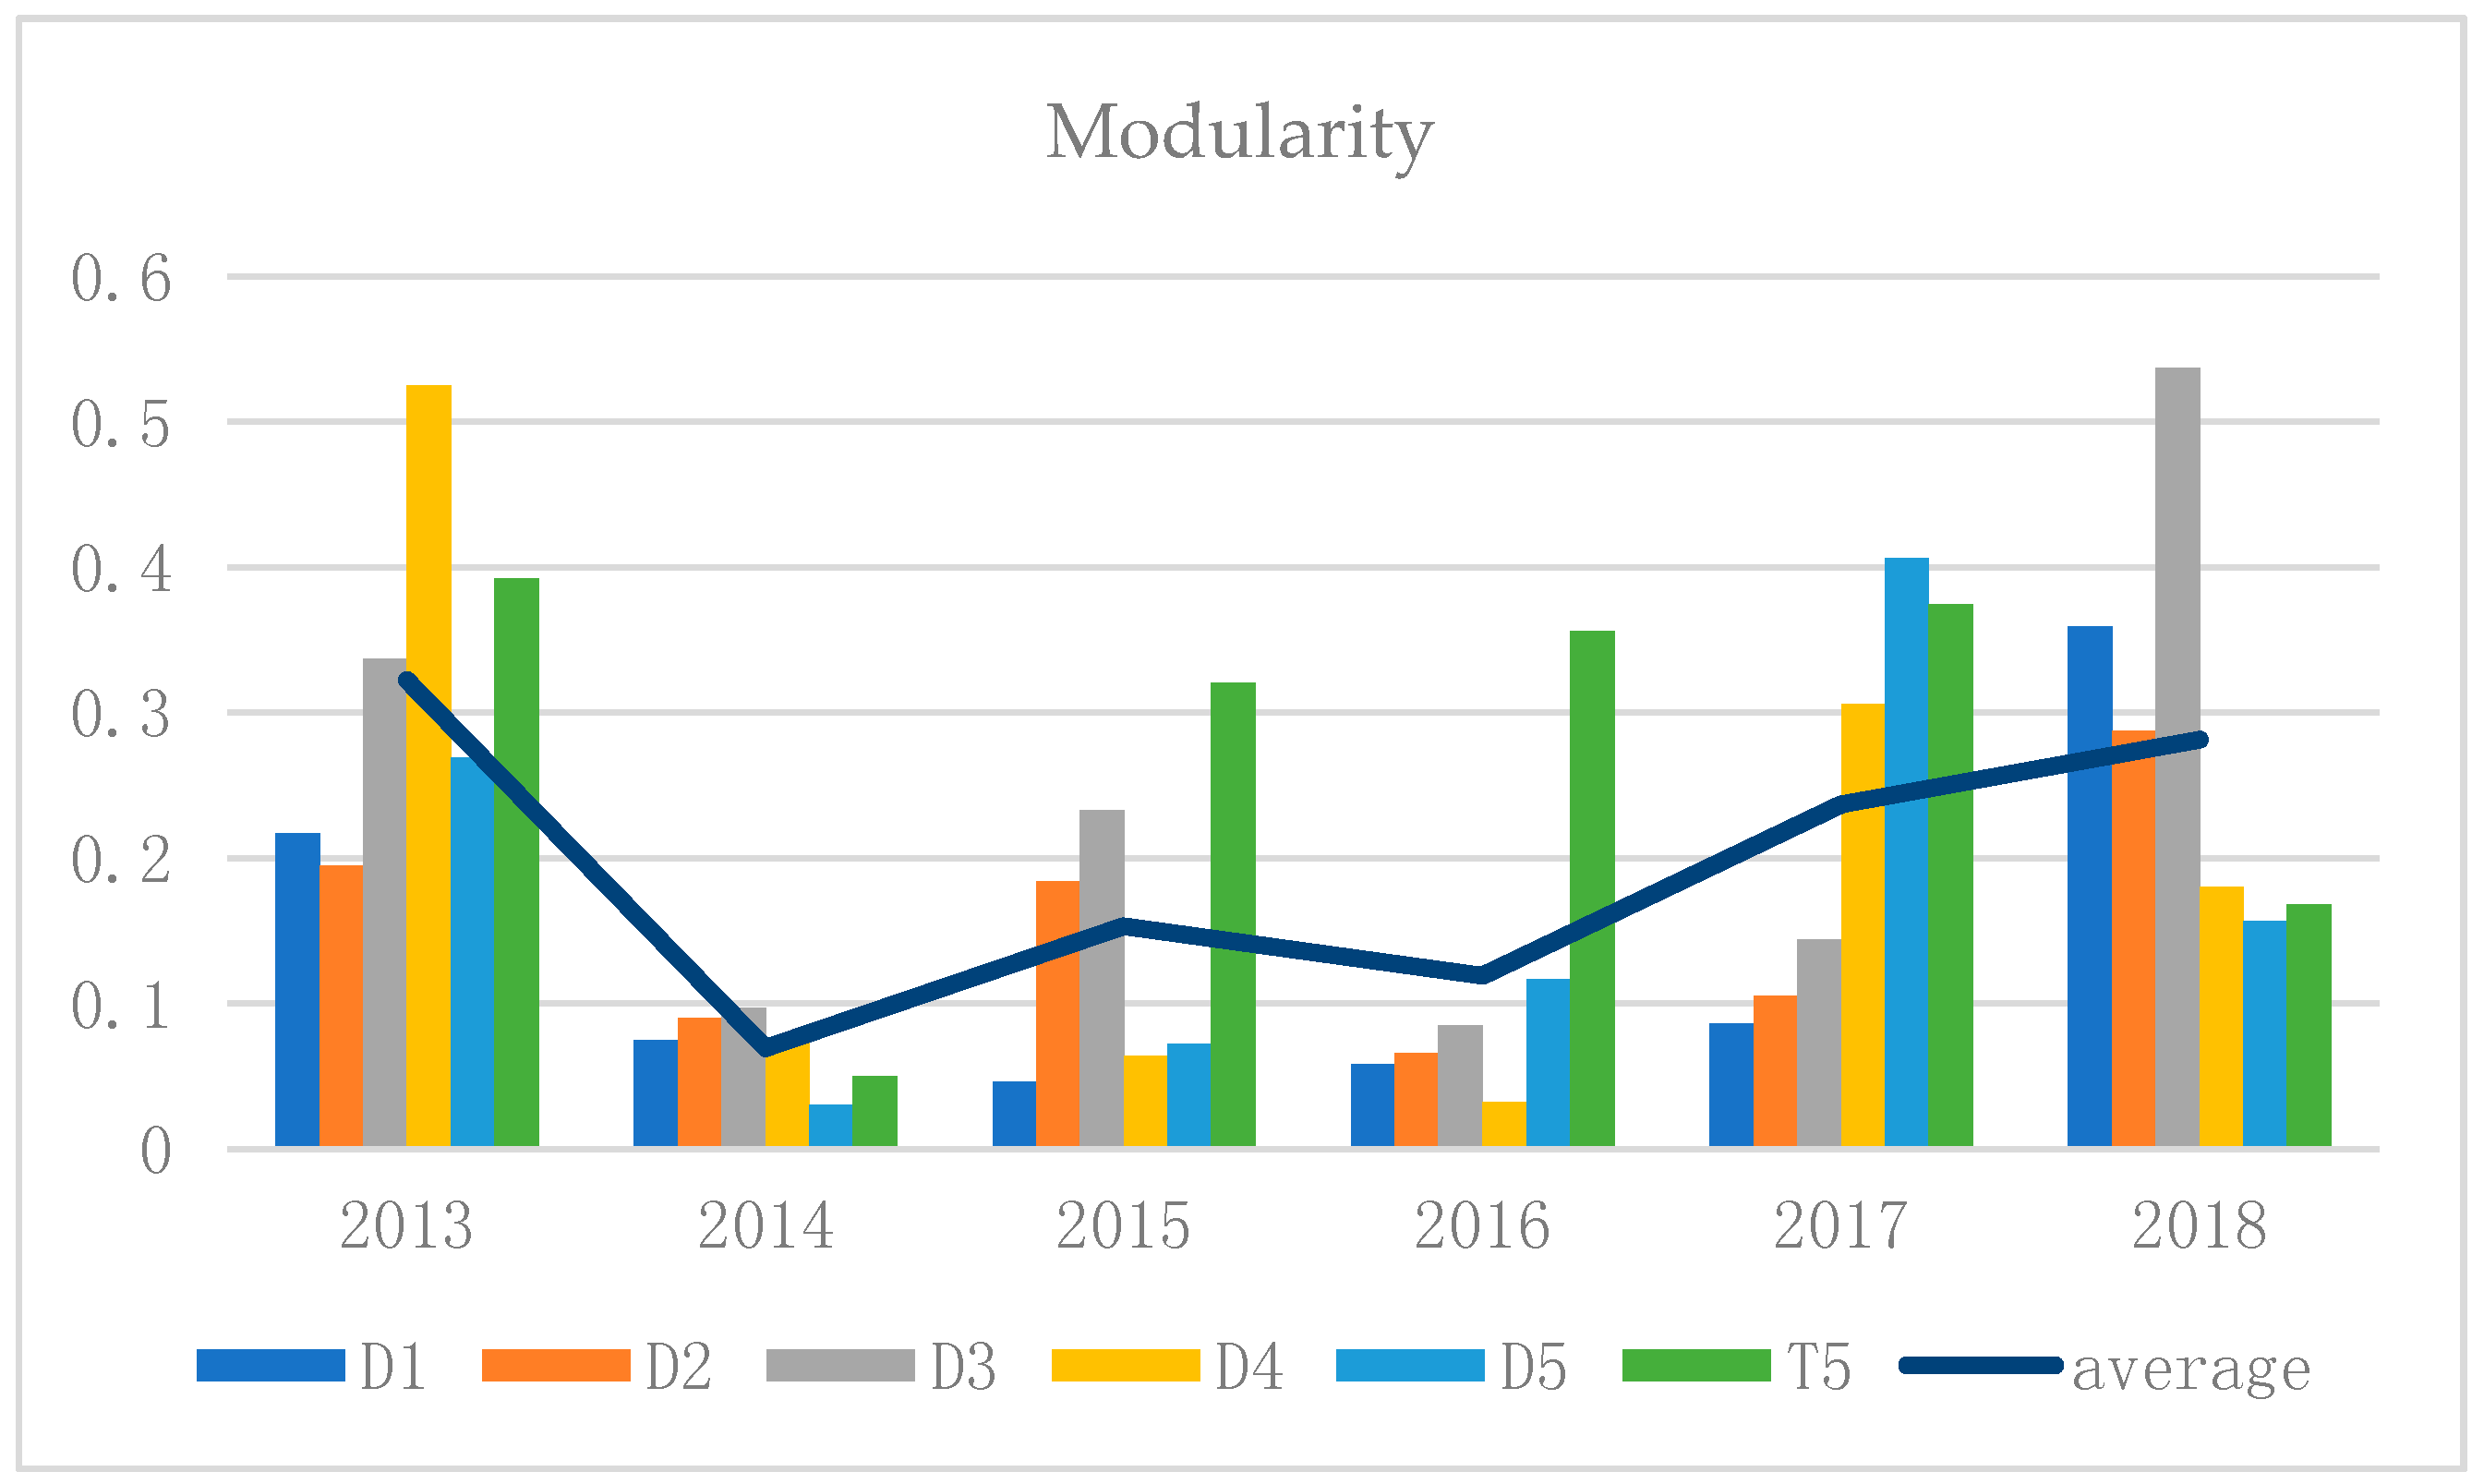
After calculating ANWS, APL, and modularity, we found that there are significant differences in ANWS, APL, and modularity in different years and cycles. This can represent the degree of market integration, the industry sector linkage degree, and the industry spillover effect in different stages of the stock market, respectively. It also indicates that the change is not constant in the stock market, but follows certain evolutionary rules. It makes sense for us to look for characteristic cycles at different resolutions.
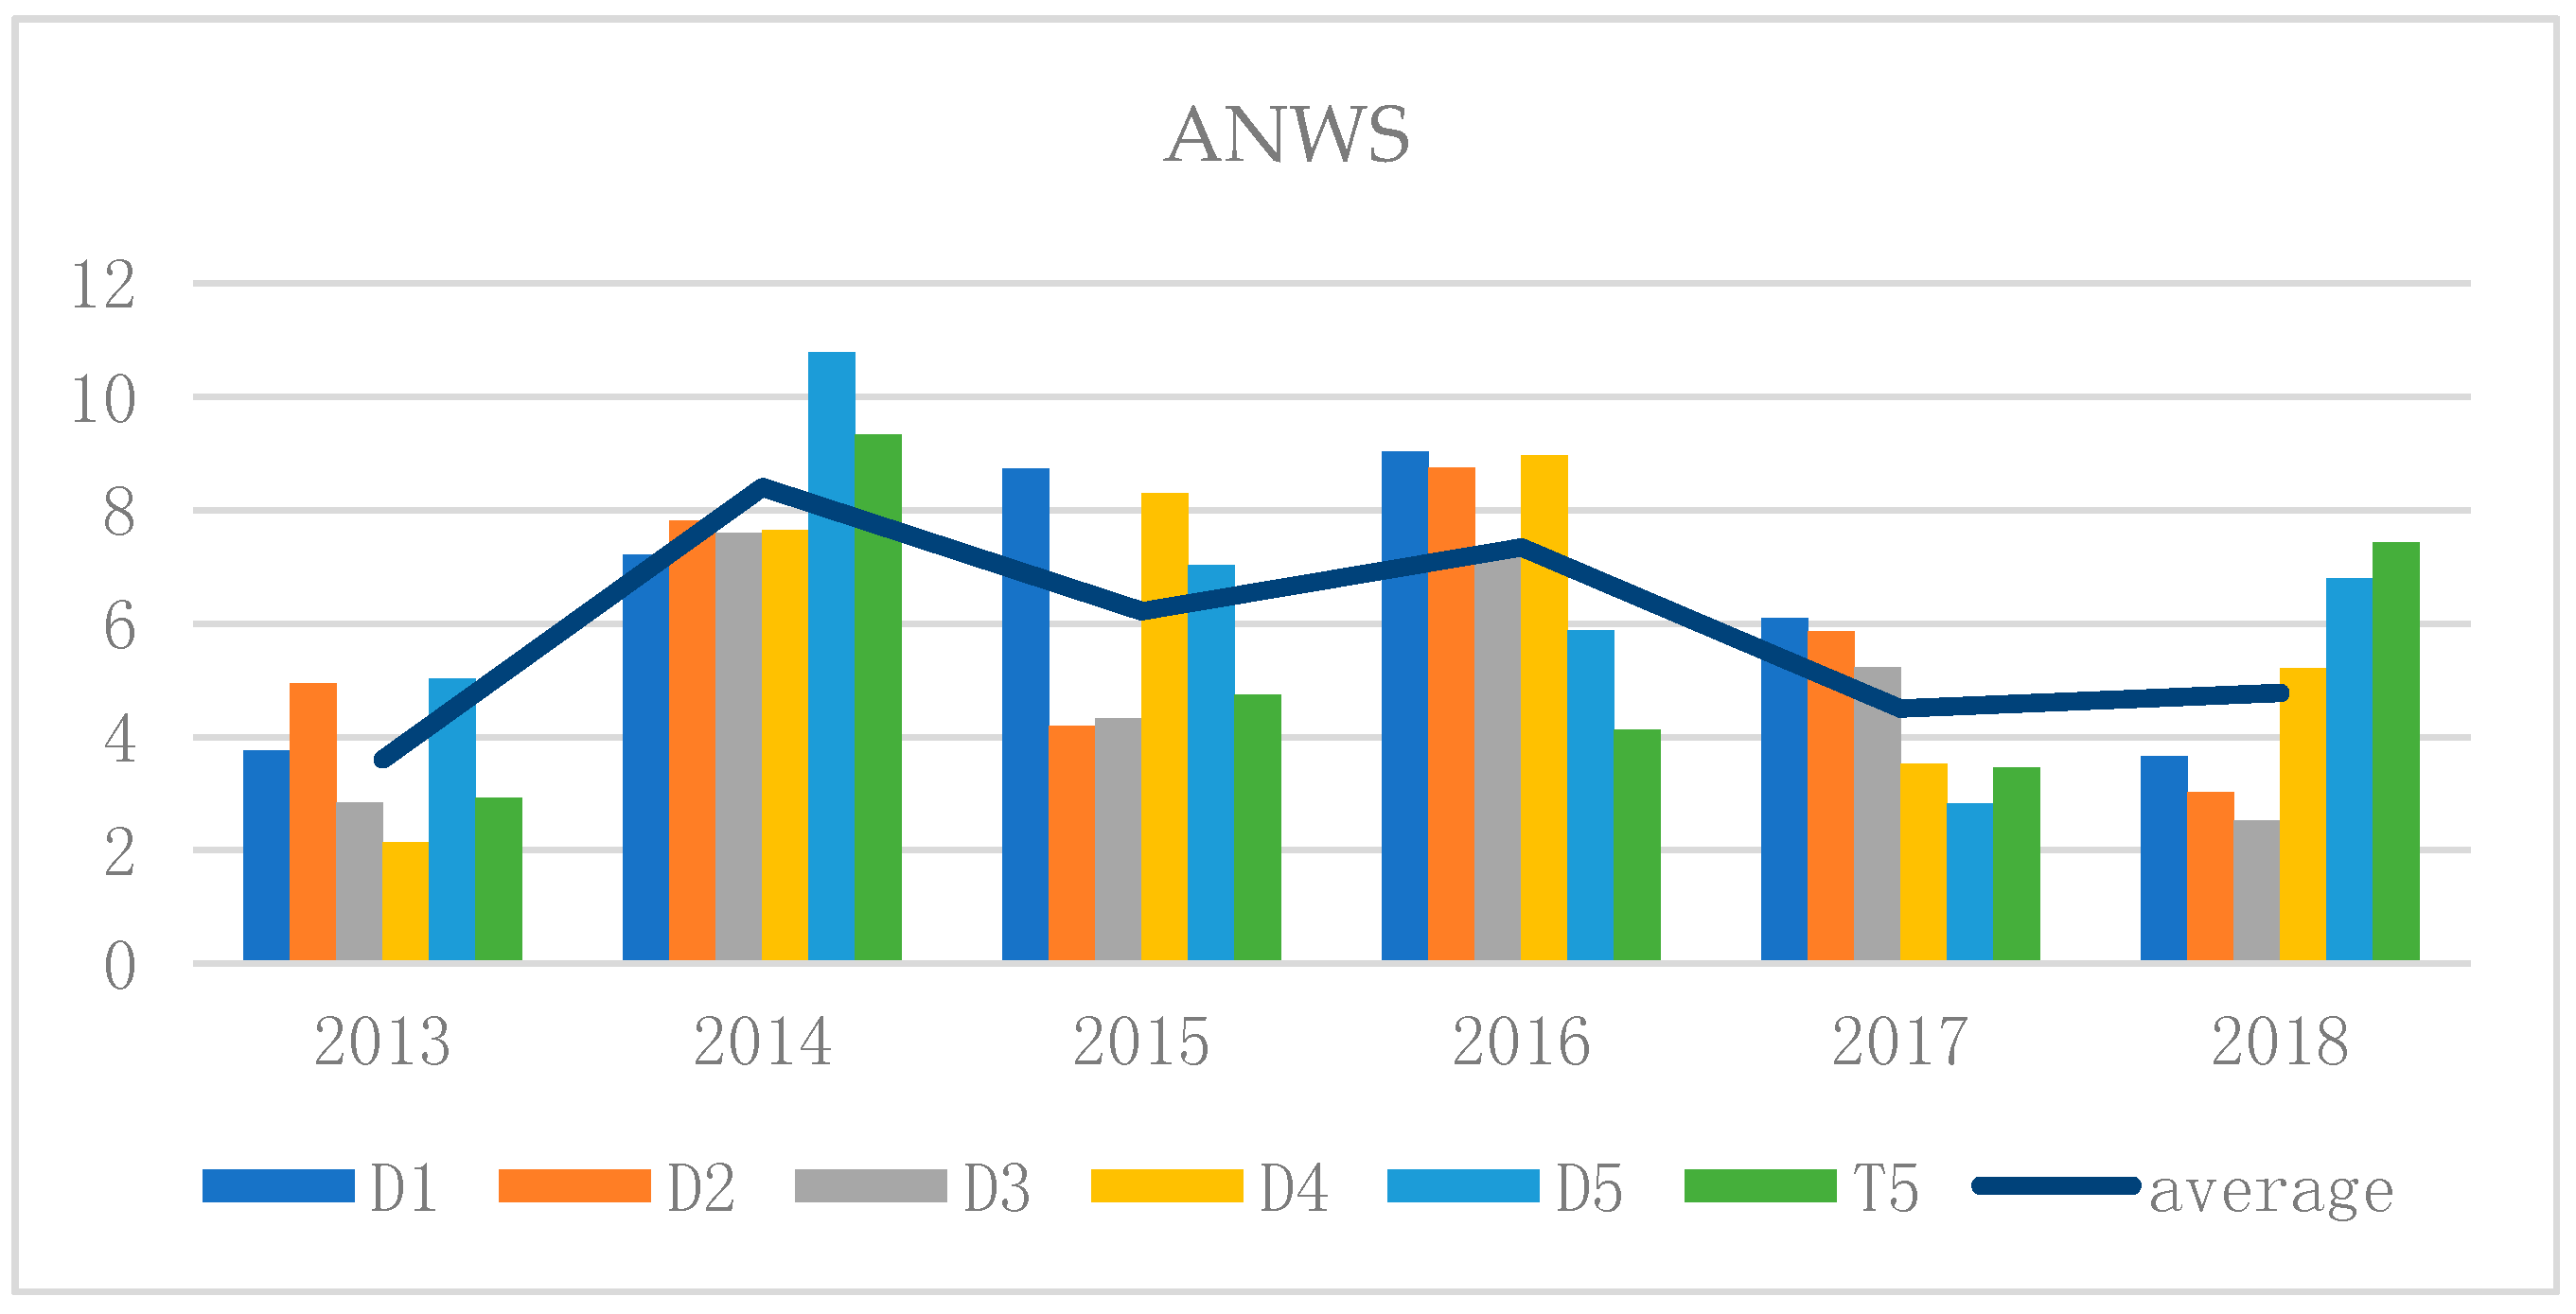
In 2015, the stock market triggered a stock market crash in order to deleverage. The maximum ANWS can represent the degree of integration, which suggests that the given cycle plays a leading role compared with other cycles. Through the observation of ANWS, we find that the average weighting around 2015 is relatively high, which indicates that the overall stock market is more integrated than normal before and after the stock crash. This trend forms an M-shape development trend (Figure 9). We can find that the leading cycle of stock market integration is D5->D5->D1->D1->D1->T5 in the last five years.
In addition, the average path length (APL) can represent the overflow effect of the stock market, so the minimum APL given cycle plays a leading role, which is relative to other cycles. We observed that the market spillover effect before and after the stock market crash was relatively obvious, and such a change trend formed a V-shaped development structure (Figure 10). Therefore, we found that the main cycle of the stock market spillover is D2->D5->D1->D4->D3->D5.
Modularity indicates the degree of industrialization of the stock market. The larger the modularity, the more obvious the degree of industrialization, and the larger modularity cycle is more dominant than other cycles. We can observe that the degree of industrialization of the market before and after the stock market crash is lower than that in general cases, which indicates that the stock market crash could increase the degree of market integration and lower the degree of industrialization. It is easy to notice that the development trend of industrialization forms a W-shaped trend characteristic (Figure 11). From the figure, we found that the industrialized leading cycle is D4->D3->S5->S5->D5->D3.
In general, we find that the dominant period of the stock market has a significant difference in different cycle characteristics during different stages. From 2013 to 2018, we can conclude from the degree of stock market integration that the annual dominant cycle change is D5->D5->D1->D1->D1->S5. From the stock market spillover effect, it can be seen that the annual dominant cycle change is D2->D5->D1->D4->D3->D5. From the degree of industrialization of the stock market, it can be seen that the leading cycle is D4->D3->S5->S5->D5->D3. Those findings can show potential signals in the stock market at different resolutions and stages. At the same time, we found that ANWS, APL, and modularity have different curve features, such as the degree of industrialization presenting W-shaped curve features before and after the stock market crash, which can provide more information for policymakers to capture potential rules.

3.2.3. Analysis of Key Node Evolution in the Stock Market

The purpose is to understand the development characteristics of the Chinese stock market clearly in the study of multi-resolution characteristics of cooperative evolutionary network structure. In another word, it is necessary to identify the specific plate stock that plays a leading role in the evolution of the Chinese stock market, so that policymakers can formulate more effective goal-oriented strategic measures.
By calculating the EC of each node in the ranking network, we find that the top EC ranking of the industrial sector is of critical importance to promote the overall development of the stock market. In addition, the total amount of money in these sectors is much higher than in other sectors, so these sectors play a leading role in controlling the degree of stock market integration. Generally speaking, the dominant plates with fluctuating characteristics in different resolutions have significant differences, and the dominant plates with fluctuating characteristics in the same resolution also have significant differences. By doing so, it is of practical significance to study the dominant plates with major characteristic scales in different resolutions. As EC is used to describe the role of plate nodes in promoting the overall development of the stock market, we summarize the dominant resolution path and dominant plate in the evolution process of the degree of integration of the stock market based on different resolutions in different stages. The dominant resolution is the dominant resolution of integration degree, and the dominant plate is the largest plate node of EC in the above dominant resolution network. In short, the change of the main plate that dominates the degree of stock market integration is as follows: chemical industry -> communication equipment -> chemical industry -> chemical industry -> chemical industry -> components. From the view of the leading plate changes, chemical plate has become the main plate force controlling the degree of stock market integration.

4. Conclusions and Discussion

Previous research mainly focused on the evolution and trend analysis of financial time series without considering the analysis of financial time series in different resolutions and stages. In order to solve this problem, this paper has proposed a kind of complex network based on the wavelet analysis method. After analyzing the characteristics of secondary industry stocks in market different periods and stages of Chinese stocks, the experiment results have proven the stock linkage effect of the Chinese stock market. The results highlight the plate drift phenomenon when the stock crash occurs, the M-type trend of the degree of Chinese stock market integration, and the W-type trend of the degree of industrialization in the recent five years.
This paper mainly draws three conclusions using the analytical method of complex network for financial time series. Firstly, the stock linkage effect of the Chinese stock market can be verified through the analysis of complex network communities in different periods. The study of plate linkage effect is of great practical significance for the analysis of China’s capital market structural stock market research. At the same time, the linkage effect can help investors make more rational investment decisions. The strength and weakness of linkage can be used to measure the possibility of risk transmission. Secondly, analysis of the communities in different resolutions demonstrates that the mineral products plate and the multi-financial plate drifted when the stock crash occurred. The drifting phenomenon of the mineral products sector and the diversified financial plate before and after the stock market crash provides an important theoretical basis for rezoning the plate where the company is located. At the same time, investors should carefully consider the company within the plate when choosing their investment portfolio. Thirdly, after analyzing the stock market in the last five years, we found the integration trend of M-type and the industrialization trend of W-type. The research on integration trend and professionalization trend can help policy makers to further analyze China’s virtual economy and provide investors with different reference decision-making cycles at different stages of the stock market.
As stated, it is sensible for financial investors and policy makers to make a financial decision according to the research result. Furthermore, the corresponding reference decision cycle can be provided to investors to improve the portfolio after finding the linked stock. At the same time, it can provide the time reference of the investment cycle for investors.
Based on the above research, we will conduct further research and analysis on the re-classification of the plate from the evolutionary behavior of the market plate.

Author Contributions

Conceptualization, H.X. and L.X.; Methodology, H.X. and J.Y.; Software, H.X.; Validation, H.X. and J.Y.; Formal Analysis, H.X. and L.X. Resource, H.X. and L.X.; Data Curation, H.X.; Writing—Original Draft Preparation, L.X., H.X., J.Y. and L.W.; Writing—Review &Editing, L.X., H.X., J.Y. and L.W.; Visualization, H.X. and J.Y.; Project Administration, H.X. and L.X.

Funding

This research received no external funding.

Acknowledgments

This work is supported by the National Key R&D Program of China (2016YFC1401900).

Conflicts of Interest

The authors declare no conflict of interest.

References

  1. Patwary, E.U.; Lee, J.Y.; Nobi, A. Changes of hierarchical network in local and world stock market. J. Kor. Phys. Soci. 2017, 71, 444–451. [Google Scholar] [CrossRef]
  2. Nie, C.X.; Song, F.T. Constructing financial network based on PMFG and threshold method. Phys. A 2018, 495, 104–113. [Google Scholar] [CrossRef]
  3. Zhen, S.; Wu, Q.; Wang, X. Excessive co-movement effect and evolution network analysis of Chinese stock market. In Proceedings of the IEEE International Symposium on System Integration, Taipei, Taiwan, 11–14 December 2017; pp. 220–225. [Google Scholar]
  4. Zhang, X.T.; Zhang, D.; Yuan, Y.; Zhuang, X.W. Fractal characteristic of the Chinese stock market complex network. Syst. Eng. Theo. Prac. 2015, 35, 273–282. [Google Scholar]
  5. Zhao, L.; Wang, G.J.; Wang, M.; Bao, W.; Li, W.; Stanley, H.E. Stock market as temporal network. Phys. A 2018, 506, 1104–1112. [Google Scholar] [CrossRef] [Green Version]
  6. Zhu, H.; Zhang, W. Multifractal property of Chinese stock market in the CSI 800 index based on MF-DFA approach. Phys. A 2018, 490, 497–503. [Google Scholar] [CrossRef]
  7. Lahmiri, S. Clustering of Casablanca stock market based on Hurst exponent estimates. Phys. A 2016, 456, 310–318. [Google Scholar] [CrossRef]
  8. Salighehdar, A.; Liu, Y.; Bozdog, D.; Florescu, I. Cluster Analysis of Liquidity Measures in a Stock Market Using High Frequency Data. J. Manag. Sci. Bus. Intell. 2017, 2, 1–8. [Google Scholar]
  9. Marti, G.; Nielsen, F.; Bińkowski, M.; Donnat, P. A review of two decades of correlations hierarchies, networks and clustering in financial market. arXiv preprint, 2017; arXiv:1703.00485. [Google Scholar]
  10. Chong, E.; Han, C.; Park, F.C. Deep learning networks for stock market analysis and prediction: Methodology, data representations, and case studies. Exp. Syst. Appl. 2017, 83, 187–205. [Google Scholar] [CrossRef] [Green Version]
  11. Liu, L.; Wu, J.; Li, P.; Li, Q. A social-media-based approach to predicting stock co-movement. Exp. Syst. Appl. 2015, 42, 3893–3901. [Google Scholar] [CrossRef]
  12. Paranjape-Voditel, P.; Deshpande, U. A stock market portfolio recommender system based on association rule mining. Appl. Soft. Comp. 2013, 13, 1055–1063. [Google Scholar] [CrossRef]
  13. Yang, R.; Li, X.; Zhang, T. Analysis of linkage effects among industry sectors in China’s stock market before and after the financial crisis. Phys. A 2014, 411, 12–20. [Google Scholar] [CrossRef]
  14. Hao, X.; An, H.; Qi, H. Evolution of the exergy flow network embodied in the global fossil energy trade: Based on complex network. Appl. Ener. 2016, 162, 1515–1522. [Google Scholar] [CrossRef]
  15. Jia, X.; An, H.; Sun, X. Evolution of world crude oil market integration and diversification: A wavelet-based complex network perspective. Appl. Ener. 2017, 185, 1788–1798. [Google Scholar] [CrossRef]
  16. Jiang, M.; Gao, X.; An, H. Reconstructing complex network for characterizing the time-varying causality evolution behavior of multivariate time series. Sci. Rep. 2017, 7, 10486. [Google Scholar] [CrossRef] [PubMed]
  17. Baumöhl, E.; Kočenda, E.; Lyócsa, Š.; Výrost, T. Networks of volatility spillovers among stock markets. Phys. A 2018, 490, 1555–1574. [Google Scholar] [CrossRef] [Green Version]
  18. Qiao, H.; Yue, X.; Ying, L. Can Network Linkage Effects Determine Return? Evidence from Chinese Stock Market. PLoS ONE 2016, 11, e0156784. [Google Scholar] [CrossRef] [PubMed]
  19. Yu, X.; Cui, X.; Cai, R. Financial data division and rules mining based on influence and AP clustering. In Proceedings of the 2016 International Conference on Audio, Language and Image Processing (ICALIP), Shanghai, China, 11–12 July 2016; pp. 504–508. [Google Scholar]
  20. Huang, X.; An, H.; Gao, X. Multiresolution transmission of the correlation modes between bivariate time series based on complex network theory. Phys. A 2015, 428, 493–506. [Google Scholar] [CrossRef]
  21. Huang, S.; An, H.; Gao, X. The Multiscale Conformation Evolution of the Financial Time Series. Math. Prob. Eng. 2015, 6, 1–9. [Google Scholar] [CrossRef]
  22. Lahmiri, S.; Uddin, G.S.; Bekiros, S. Clustering of short and long-term co-movements in international financial and commodity markets in wavelet domain. Phys. A 2017, 486, 947–955. [Google Scholar] [CrossRef]
  23. Tiwari, A.K.; Oros, C.; Albulescu, C.T. Revisiting the inflation–output gap relationship for France using a wavelet transform approach. Econ. Mode. 2014, 37, 464–475. [Google Scholar] [CrossRef]
  24. Percival, D.B.; Walden, A.T. Wavelet Methods for Time Series Analysis: The Wavelet Variance; Cambridge University Press: Cambridge, UK, 2006; p. 491. [Google Scholar]
  25. Dajčman, S. Interdependence Between Some Major European Stock Markets—A Wavelet Lead/Lag Analysis. Prague Econ. Pap. 2013, 22, 28–49. [Google Scholar] [CrossRef]
  26. Dajcman, S. Are interdependencies between central and eastern European and developed European stock markets returns multiscale? A wavelet lead/lag analysis. Act. Pro. Econ. 2012, 135, 270–283. [Google Scholar]
  27. Baydilli, Y.Y.; Bayır, S.; Türker, I. A hierarchical view of a national stock market as a complex network. Econ. Comp. Econ. Cyber. Stud. Res. 2017, 51, 205–222. [Google Scholar]
  28. Newman, M.E.J. Fast algorithm for detecting community structure in networks. Phys. Rev. E 2004, 69, 066133. [Google Scholar] [CrossRef] [PubMed] [Green Version]
  29. Blondel, V.D.; Guillaume, J.L.; Lambiotte, R.; Lefebvre, E. Fast unfolding of communities in large networks. J. Stat. Mech. 2008, 10, 155–168. [Google Scholar] [CrossRef]
  30. Newman, M. Networks: An Introduction. Astron. Nach. 2010, 8, 741–743. [Google Scholar]
Figure 1. Network evolutionary analysis model.
Information 09 00276 g001
Figure 2. Complex network construction flow chart.
Information 09 00276 g002
Figure 3. Original data partition results in 2013.
Information 09 00276 g003
Figure 4. Original data partition results in 2014.
Information 09 00276 g004
Figure 5. Original data partition results in 2015.
Information 09 00276 g005
Figure 6. Original data partition results in 2016.
Information 09 00276 g006
Figure 7. Original data partition results in 2017.
Information 09 00276 g007
Figure 8. Original data partition results in 2018.
Information 09 00276 g008
Figure 9. Average node weight strength (ANWS) distribution. (ANWS represents the degree of integration. The higher the value of each stage, the higher the degree of integration. The maximum value of each stage can form the evolutionary path of the dominant cycle).
Information 09 00276 g009
Figure 10. Average path length (APL) distribution. (APL represents the overflow effect of the stock market. The lower the value of APL, the more obvious the spillover effect will be under this resolution. The minimum of each stage can form the dominant cycle path of the spillover effect).
Information 09 00276 g010
Figure 11. Modularity distribution. (Modularity indicates the degree of industrialization of the stock market. The higher the value of modularity, the more obvious the industrialization degree. The maximum value of each stage can form the leading cycle path of industrialization).
Information 09 00276 g011
Table 1. Six different practical cycles references.
Sub-SeriesTime-Frequency Scales
D 1 2–4 days
D 2 4–8 days
D n 2 n 2 n + 1 days
T n > 2 n + 1 days
Table 2. Accuracy rate of classification.
AccuracyAllD1D2D3D4D5T5
201310.760.880.820.940.760.71
20140.820.820.820.820.710.760.71
20150.880.760.760.820.820.760.76
20160.760.820.710.470.760.760.64
20170.880.820.640.940.820.710.76
20180.820.880.760.820.760.640.71
Average0.860.810.760.780.80.750.71
Table 3. Accuracy after removal of drifting plates.
AccuracyAllD1D2D3D4D5T5
201310.730.930.860.8610.8
20140.930.860.860.930.930.730.8
20150.930.80.730.930.930.80.8
20160.860.930.730.530.860.860.73
20170.860.80.730.9310.730.8
20180.930.860.860.930.80.670.73
Average0.920.830.810.850.900.800.78