Article

Real-Time Hybrid In-Station Bus Dispatching Strategy Based on Mixed Integer Programming

School of Transportation Science and Engineering, Harbin Institute of Technology, Harbin 150090, China
*
Author to whom correspondence should be addressed.
Information 2016, 7(3), 43; https://doi.org/10.3390/info7030043
Submission received: 23 May 2016 / Revised: 5 July 2016 / Accepted: 8 July 2016 / Published: 13 July 2016
(This article belongs to the Section Information Applications)

Abstract

:
The actual bus headway often deviates from the planned departure frequency because of external factors, such as traffic conditions and public transport demand, leading to transit resource waste and reducing the quality of service. In view of the existing shortcomings of the current dispatching strategy, a mixed integer programming model, integrating a bus-holding and stop-skipping strategy, is constructed to improve transit service with a minimum cost. The real-time optimal holding and stop-skipping strategies can be obtained by solving the proposed model using the Lagrangian relaxation algorithm. A numerical example is conducted using real transit GPS (Global Position System) and IC (Intelligent Card) data in Harbin. The results show that compared to a single control strategy, the proposed hybrid model is a better trade-off between the quality of the transit service and the operation cost. Notably, such a strategy would produce a minimal passengers’ average travel time coefficient. It is a great help for promoting the transit service level and increasing competitiveness.

1. Introduction

Various indicators are proposed to evaluate the service quality of public transportation, and frequency is one of the key indexes. Increasing the frequency could provide better services intuitively. However, in fact, the improvement of transit service is limited when the frequency achieves a certain level. It is proved that bus headway fluctuation has important effects on the transit capacity [1]. Therefore, maintaining the stability of bus headway is one of the most important goals of bus dispatching.
Bus headway is the time interval between two adjacent buses of the same route. When buses are running along the route, many influence factors, such as traffic conditions, traffic signals and the public demand, disturb the route [2,3,4] and lead the buses to hardly follow the planned schedule. Thus, the bus headways fluctuate and the quality of transit service declines. Real-time bus dispatching strategies can be implemented to maintain stable headways and to evenly distribute the buses along the route as soon as possible. There are two types of these dispatching strategies, inter-station dispatching and in-station dispatching [5]. Inter-station dispatching strategies control running the processes of buses, such as transit signal priority [6,7] and bus lanes [8,9]. Bus lanes and signal priority are effective ways to reduce the influence on running buses caused by external factors. However, due to the complexity of urban traffic systems, it is difficult to coordinate with other traffic modes and these inter-station strategies hardly achieve the desired results in practical application. Alternately, the in-station dispatching strategies control only buses parking at stations. Two methods are used to adjust bus headways. The first one is a holding strategy which forces the front buses to delay for a while to maintain the headways; the other one is a stop-skipping strategy which forces the buses running behind to skip some stops to catch up with the schedule. In-station dispatching strategies are more effective in keeping the stability of bus headways for a lower level of complexity and a higher feasibility.
Optimal holding strategies can produce nearly uniform headways with minimum variance. However, the travel time of passengers in buses increases as the buses are held for an additional period of time at stations. Besides, the turnover rate of the controlled route would fall because all the buses of this route are delayed and thus the operating cost rises to some extent. Stop-skipping strategies could speed up the buses being controlled and reduce the travel time of passengers in buses. The waiting time of passengers at the skipped stops, however, is doubled. Furthermore, at some level, the coverage of transit service is narrowed. In part, these observations motivated our study. Therefore, this paper contributes to using the complementary advantages of holding and stop-skipping dispatching strategies to construct a hybrid strategy, aiming to reduce the whole travel time of all passengers and improve the transit service quality while also considering the cost. In addition, the real-time data of Automatic Vehicle Location are used to strengthen the real-time performance of the strategy.
The remainder of this paper is organized as follows. The next section reviews the related work regarding holding, stop-skipping and other in-station dispatching strategies. The third section gives a mathematical description of the problem and constructs the optimization model. The algorithm to solve the proposed model using Lagrangian relaxation is designed in the following section. In the fifth section, a case study is provided to evaluate the performance of the proposed strategy. Lastly, the final section discusses the results and concludes this paper.

2. Literature Review

The most well-studied strategy is bus holding, which can hold a bus for a certain moment at certain stops (the control points) to approach optimized targets. Two optimization guidelines are used in bus holding, schedule-based and headway-based. The schedule-based bus holding strategy is to hold buses at certain stops to match a pre-published schedule [10,11,12,13]. This kind of method is applicable to low transit demand as the headway is generally long in this case. For the case of high transit demand and shorter headways, the headway-based holding methods are preferable. With the development of Global Position System (GPS) and Automatic Vehicle Location (AVL), more complicated and practical holding strategies are becoming a hot research topic. Minimizing the waiting time of passengers at stops is mostly considered as the objective function in these models and the output results are the holding time of each bus at the control point [14,15,16]. For the sake of commercial speed, Daganzo proposes a self-adaptive control strategy which can produce approximately uniform headways [17]. The strategy determines the holding time dynamically according to the real-time information of the front bus. The simulation results show that this strategy is effective, with little disturbance from external factors. Satisfactory results cannot be found when the disturbance is obvious enough. To overcome this problem, Daganzo and Pilachowski propose another strategy with bus-to-bus cooperation which can avoid bus bunching effectively [18]. However, Bartholdi and Eisenstein aim to find the most suitable headways for the current situation. The strategy can make the system optimal rather than uniform headway [19]. As the vehicles’ seating capacity is limited, as is the tolerance of passengers, most of the studied holding strategies are difficult to apply in practice.
Also, stop-skipping strategies, which let buses skip stops when bus bunching happens, are proposed. The stop-skipping strategies were firstly studied and used in urban rail transit [20,21] because the travel time of trains can be estimated easily and exactly. Then this kind of dispatching strategy was brought in to improve the Bus Rapid Transit (BRT) [22,23]. Stop-skipping could speed up the buses and is coincident with the concept of BRT. As for the regular public transport, buses are usually running slowly because of some disruptions, especially in rush hours. So the stop-skipping strategy is considered to be effective. Obviously, this strategy inevitably brings service losses for passengers waiting or alighting at the skipped stops. Thus, stop-skipping was often considered in the planning process at first rather than real-time operation [24]. Thanks to GPS and AVL, real-time bus position data can be obtained and researchers have begun to investigate the real-time application of stop-skipping strategies [25]. The real-time stop-skipping problem describes that buses are determined to skip some stops dynamically according to the service disruptions [26,27]. Both transit operators and passengers are considered in these objective functions. Bus travel time is assumed to be random to estimate the real-time positions of buses [28]. The stop-skipping strategies can obviously speed up the buses. However, extra time is added to these passengers. The waiting times of passengers who are waiting at the skipped stops is doubled. In addition, passengers whose destinations are the skipped stops have to get off at other stops. In addition, bus headway, which is an important indicator reflecting service quality, is ignored in these strategies.
Besides, hybrid strategies are proposed to get better results. Cortés et al. integrate holding and stop-skipping based on the hybrid predictive control theory [29]. A multi-objective optimization model is constructed aiming to minimize passenger waiting time and the negative effects. The results solved by the genetic algorithm show that the two objectives are opposite and consistent. The measure is significant to promote transit service if balance solutions are obtained. Delgado et al. consider that limiting boarding could be an alternative measure rather than stop-skipping. They propose a hybrid control model in the rolling time domain using holding and limiting boarding [30]. However, the detailed implementation programs of limiting boarding are not discussed in their research. So Delgado et al. improve their model and holding and limiting boarding can be implemented more flexibly [31]. Theoretically, hybrid control measures are more effective. However, due to the confinement of assumptions on the models and algorithms, communication between several departments and the tolerance of passengers, a wide range of challenges exist for transit agencies to apply these methods in practice. Thus, it is critical to find a better hybrid strategy of holding and stop-skipping to improve the transit service quality while reducing the operating cost. This is exactly one of the contributions of this paper.

3. Real-Time Hybrid Bus Dispatching Optimal Model

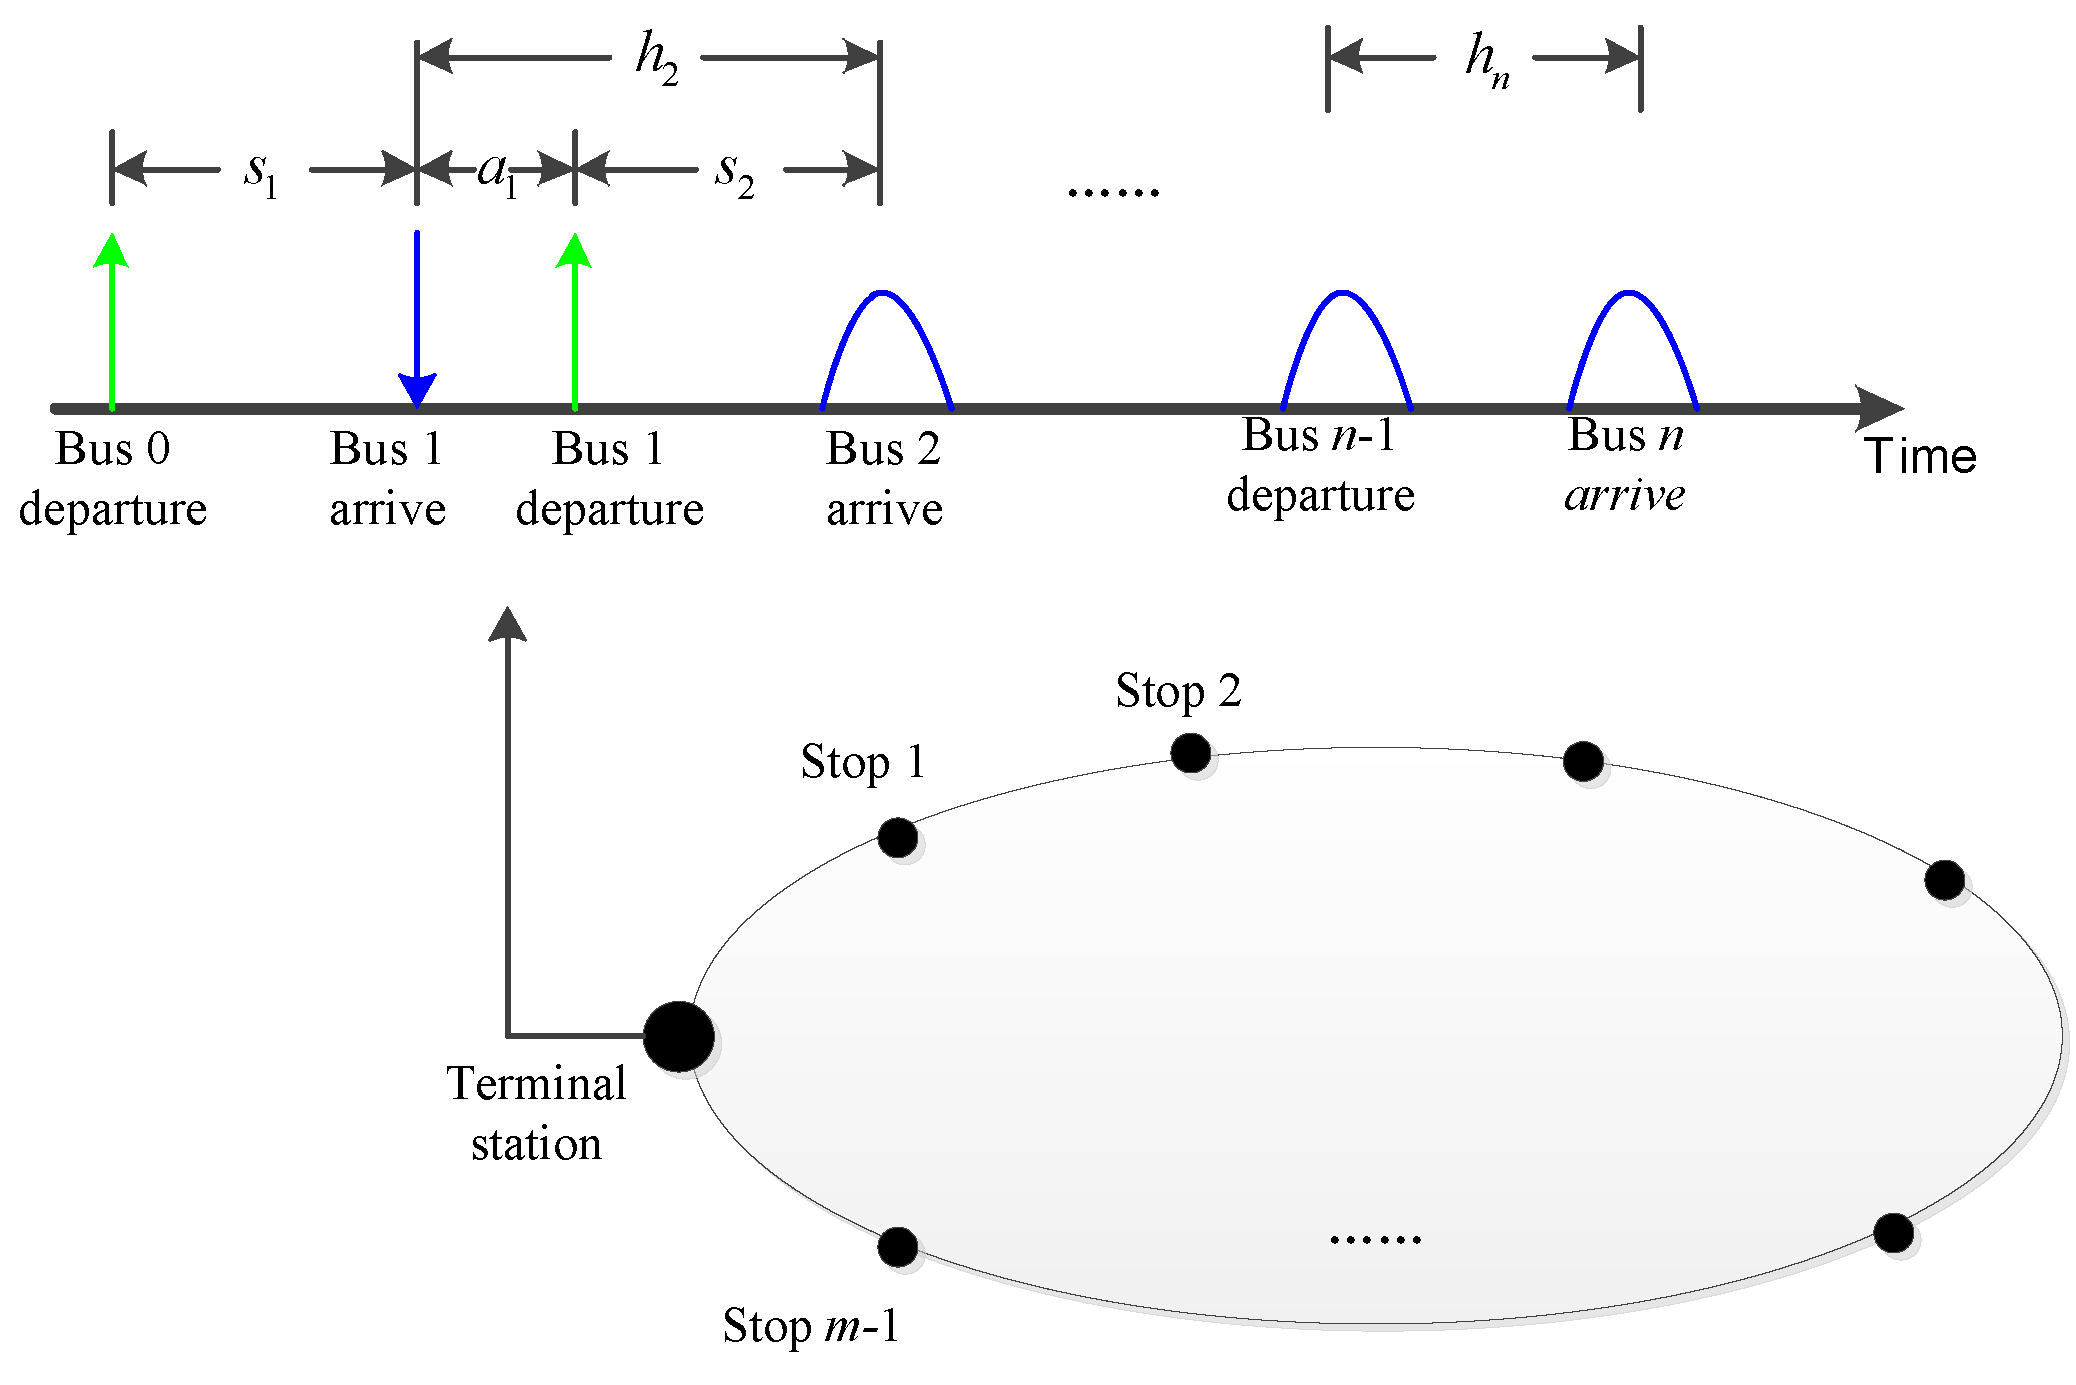
3.1. Problem Description and Assumption

This study focuses on a hybrid in-station bus dispatching method integrating holding and stop-skipping to minimize the objective function. For convenience, the following assumptions are given:
  • For the sake of simplicity, the bus route is assumed to be loop-shaped and there is only one control point, which is the terminal station, to implement the holding strategy. Of course other shapes of bus route and more control points are applicable and the idea is the same.
  • The arrival time and departure time of each bus at any station can be obtained in real-time by bus GPS.
  • The process of acceleration and deceleration of buses around stops is ignored.
  • There is a prerequisite, which is the bus arrival time prediction, for any bus dispatching strategy. In this study, the predicted inter-arrival time can be kept in its general form. In addition, it can be well replaced by any results according to the actual application.
  • The stop-to-stop origin-destination (OD) matrix can be estimated.
The purpose of this model is to determine the optimized holding time at the control point and decide the stops to be skipped. So the in-station dispatching problem can be described as a mixed integer programming model. The key variables are defined in Table 1 below.
In Table 1, a i and ω i , j are the decision variables of the proposed model. The main idea of the strategy is to determine the holding time of each bus when it arrives at the terminal station as well as the stops to be skipped of each bus to optimize the objective function. The study aims to improve the transit service quality significantly with minimal operating cost. Thus, there is a trade-off among multiple objectives in the objective function.
The transit route is represented in Figure 1 below. The holding strategy is implemented only at the terminal station and stop-skipping can be applied at any stop except the terminal station. When bus 1 arrives at the terminal station, the state of the system is s 1 which is the time interval between the departure of bus 0 and the arrival of bus 1. Then bus 1 is determined to be held for a 1 and after that bus 1 departs from the terminal station. Now the headway h 1 is ( s 1 + a 1 ) . Note that a 1 is determined according to the state of all the buses of the route, so it is necessary to predict the arrival time of other buses, which is represented by the blue distribution curves. Then a i is the optimal value which can minimize the variance of { h 1 , h 2 , ... , h n } . When a bus arrives at the terminal station, the model determines the holding time of this bus and the departure time. Stops to be skipped are decided in the process of buses running.

3.2. Objective Function

3.2.1. Passengers’ Waiting Time at Stations

The passenger waiting time at bus stations is one of the important evaluation indicators of the transit service level. So the priority is to minimize the waiting time at stops and improve transit service. Without considering the stop-skipping, the waiting time only depends on the bus headway and transit demand. Due to stop-skipping, extra waiting time occurs at the skipped stop. Usually, the average waiting time at a stop is the half of the bus headway. When the stop is skipped by bus i ( ω i , j = 0 ), the passengers, who are waiting for bus i at first, have to wait for bus i + 1 . For these passengers, the actual average waiting time is one and a half headway. In addition, new passengers arrive to wait for bus i + 1 and their average waiting time is the half of the bus headway. Figure 2 describes this situation.
Thus, the total passenger waiting time at stations can be expressed as:
J 1 = i = 1 n j = 2 m { ( 1 ω i , j ) [ 0.5 h i + 1 , j Q i + 1 , j + Q i , j * ( 0.5 h i , j + h i + 1 , j ) ] + 0.5 h i , j Q i , j ω i , j }
where Q i , j is the number of passengers waiting for bus i accumulated in h i , j ; Q i , j * is the number of passengers remaining to wait for bus i + 1 due to skips of bus i .

3.2.2. Bus Headway Variance

(1) The desired bus headway
As mentioned above, bus headway is significant for the utilization efficiency of transit capacity. Thus, the strategy aims to reduce the bus headway variance as much as possible. Usually, the bus headway of a route is the reciprocal of frequency at the initial station. The desired bus headway is the travel time of the whole route divided by the total number of buses. Thus, the buses are evenly distributed along the route. In order to reflect the dynamic characteristics, the desired bus headway changes as the travel time of the whole route changes. When a bus arrives at the terminal station, the most suitable bus headway for the system at that time equals the 85th percentile of the predicted travel times of other buses on the route divided by the total number of buses.
(2) Bus headway variance
The purpose is to minimize the fluctuation of bus headway from the desired bus headway. Thus, each time a bus arrives at the control point, the holding time to be determined is a 1 and the other buses’ holding time is a i ( i = 2 , 3 , ... , n ) sequentially. Using a i and the prediction model, the headway of each bus at each stop can be obtained. So the bus headway variance can be described as
J 2 = i = 1 n j = 2 m ( h i j H d ) 2
where H d is the desired bus headway and h i j is the predicted headway.
Clearly, the prediction model of the bus arrival time is very important here. It is used to calculate the desired bus headway and the predicted bus headway. Also, the results of the prediction model have a close relationship with stop-skipping. A little amendment can be added into the prediction model to reflect the situation of stop-skipping. Only the general form of the prediction model is used here because it is beyond the scope of this research. It is important to emphasize that the bus headway variance considered here has taken into account stop-skipping.
Actually, only a 1 is implemented among the results of the holding strategy because when the next bus arrives, it becomes bus1 and the related history data is updated. Another holding strategy is obtained and also a 1 is carried out. This ensures the strategy is in real time and can deal with any emergency situation to give the most suitable results.

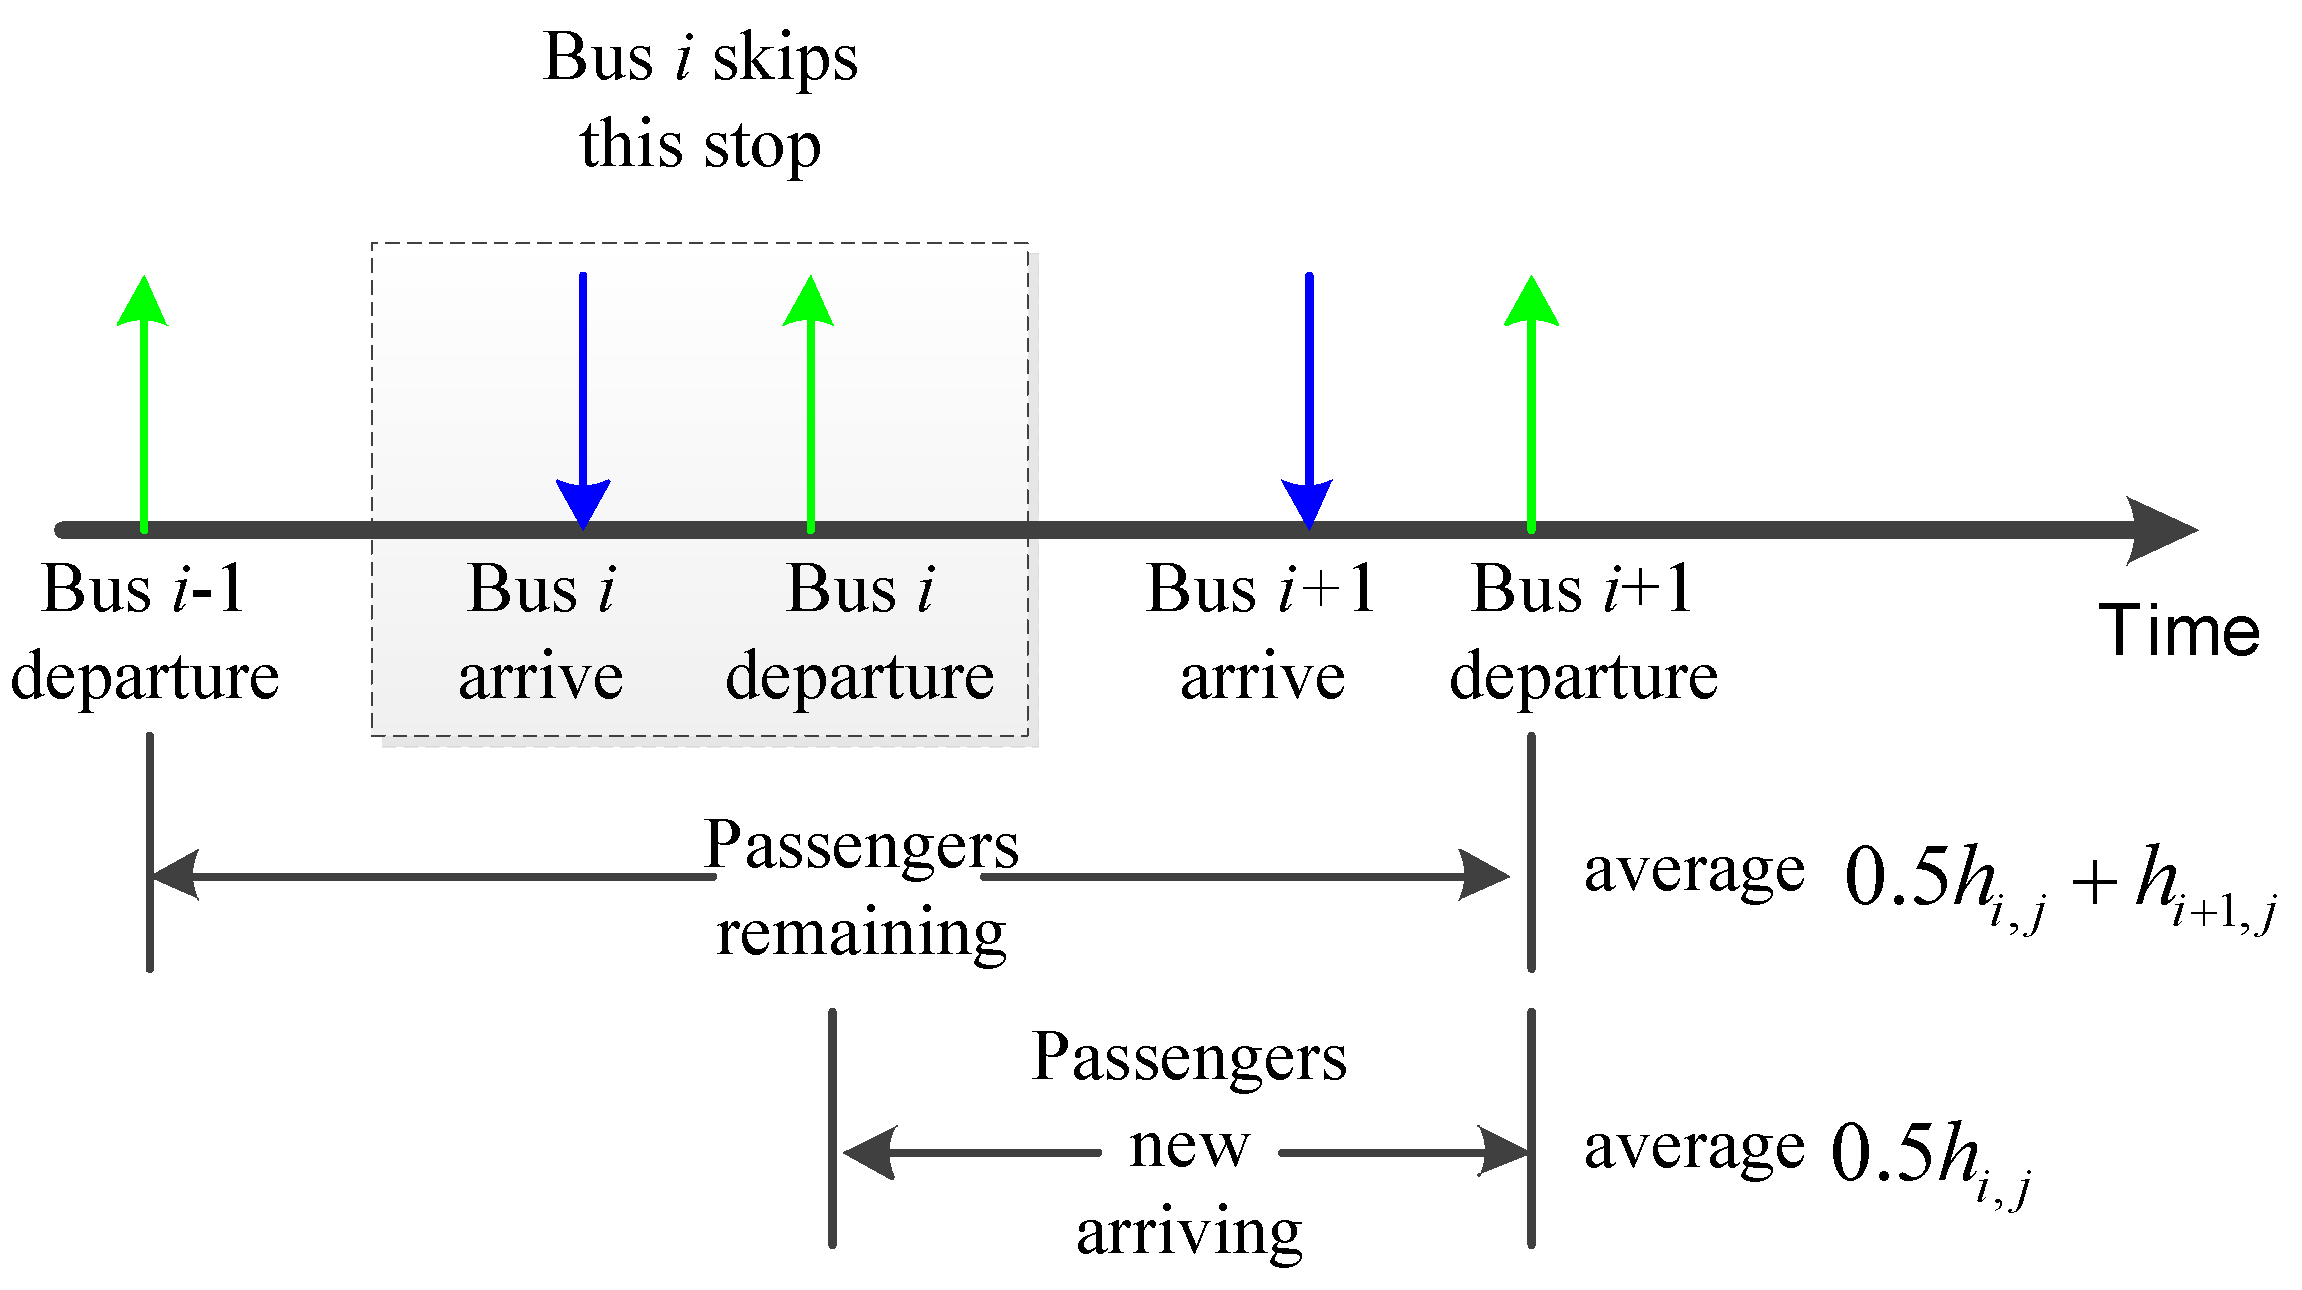
3.2.3. Extra Penalties

Extra penalty consists mainly of the negative effects of the holding and stop-skipping strategy. Although the hybrid strategy aims to improve the transit service quality, some passengers’ benefits are sacrificed for the whole.
(1) Negative effects of bus holding
Bus holding can maintain bus headway stability and reduce the average waiting time at stations. However, when buses are held at the terminal station, the in-bus passengers have to be held as well. The holding time of these passengers is their extra waiting time. Usually, the extra holding time is difficult to understand psychologically. So this is a part of the extra penalties. It is described as:
J 3 1 = i = 1 n Q i , 1 a i
where Q i , 1 is the number of passengers who are waiting at the terminal station; Q i , 1 can be calculated as the arrival rate of passengers multiplied by s i , rather than h i , because the passengers accumulated in a i have no extra waiting time.
(2) Negative effects of stop-skipping
Stop-skipping can reduce the in-bus passengers’ travel time and waiting time at the downstream stations. However, for passengers waiting at the skipped stations, their waiting time nearly doubled as analyzed above. This is also one part of the extra penalties, and it is already considered in J 1 . Besides, for the in-bus passengers who would have gone to the skipped stop, they have to get off at the previous stop. These passengers have suffered extra losses due to stop-skipping. Thus, this extra penalty can be expressed as:
J 3 2 = i = 1 n j = 2 m ( 1 ω i , j ) D i , j
where D i , j is the number of passengers who would have gone to the skipped stop. D i , j can be obtained by the transit OD matrix.
Thus, the extra penalties of the hybrid strategy can be expressed as
J 3 = J 3 1 + J 3 2

3.2.4. The Weighted Objective Function

The objective function of this model is to minimize the passengers’ waiting time at stations, the bus headway variance and the extra penalties. Intuitively, perhaps multi-objective optimization is more suitable. J 1 , J 2 and J 3 describe the purpose from different perspectives, respectively. However, these three aspects have different weights. J 1 , the passengers’ waiting time at stations, definitely is the main priority of the public transport service. J 2 , the fluctuation of bus headway from the desired bus headway. J 3 , the extra penalties, is a problem which cannot be ignored because it reflects the passengers’ psychological endurance for the strategy. So these three objects should be mixed together with appropriate weighting factors. Thus, the objective function is:
J = min ω , a ( θ 1 J 1 + θ 2 J 2 + θ 3 J 3 )
where θ 1 , θ 2 and θ 3 are weighting factors. It is clearly that θ 1 is bigger than the other two and θ 1 + θ 2 + θ 3 = 1 . The accurate values of these three factors are difficult to determine. Sensitivity analysis is to be done later for any possible combination of the three values.

3.3. Constraints

The main constraint conditions are described as follows:
ω i , j ( A T i , j A T i 1 , j ) + ( 1 ω i , j ) ( A T i + 1 , j A T i 1 , j ) h max
h i , 1 = s i + a i 1
Q i , j = T μ ( t )
ω i , j { 0 , 1 }
a i 0
Constraint Equation (7) states that the bus headway should not be bigger than a maximum value h max to ensure the service quality. A T i , j represents the bus arrival time at a station which can be obtain by GPS data or estimated by the prediction model. Constraint Equation (8) shows the relationship between the holding time and bus headway at the terminal station, as in Figure 1. The transit demand can be calculated by Equation (9), where μ ( t ) is the arrival rate which is assumed to be subject to Poisson distribution here. T is the cumulative time when no bus arrives at stop j . Constraint Equation (10) describes the stop-skipping decision variable and Equation (11) states that the holding time cannot be negative. Other information needed in this model is provided by the chosen prediction model according to actual conditions.
Thus, Equations (6)–(11) construct the main model framework. It is a mixed integer programming because of ω and a .

3.4. Lagrangian Relaxation Algorithm

The model proposed is a non-deterministic polynomial (NP) problem because of constraint Equation (7). Plenty of algorithms can be used to solve this kind of problem. It is proved that exact solutions of NP-hard problems are hard to obtained. In order to obtain an optimality gap between the obtained solution and the exact solution, Lagrangian relaxation [32] is applied in this paper.
Lagrangian relaxation finds an upper bound on the optimal solution to the original problem by solving a similar problem where constraint Equation (7) is allowed to be violated with a penalty. So the original model is converted to:
min u   min ω , a { ( θ 1 J 1 + θ 2 J 2 + θ 3 J 3 ) + u { h max [ ω i , j ( A T i , j A T i 1 , j ) + ( 1 ω i , j ) ( A T i + 1 , j A T i 1 , j ) ] } }
s.t.
u 0
Formulas (8)–(11)
where u is a non-negative vector (i.e., multipliers).
Finally, an optimality gap can be obtained if we construct a feasible solution (lower bound) to the original problem.

4. Numerical Example

The proposed model is tested on a numerical example, and the instance is solved by CPLEX using the GAMS platform on a PC with 2.67 Hz CPU and 4 GB RAM.

4.1. Route Configuration and Data Description

A real bus line, Route 110, in Harbin is selected; it has 29 stops and 18 buses. The route map is represented in Figure 3. The data used in this paper includes bus GPS data (Table 2) and bus IC data (Table 3). GPS data is used to obtain the time a bus arrives at or leaves a station. Bus IC data is useful to estimate the transit OD matrix using the method in [33].

4.2. Results and Analysis

The numerical example is divided into two experiments. In the first one, the sensitivity analysis of the weighting factors θ 1 , θ 2 and θ 3 is done to reveal the change of strategy with different priorities. In the second experiment, a comparison of the results of the proposed hybrid model with the results of only stop-kipping and only the holding strategy is presented to evaluate the performance.

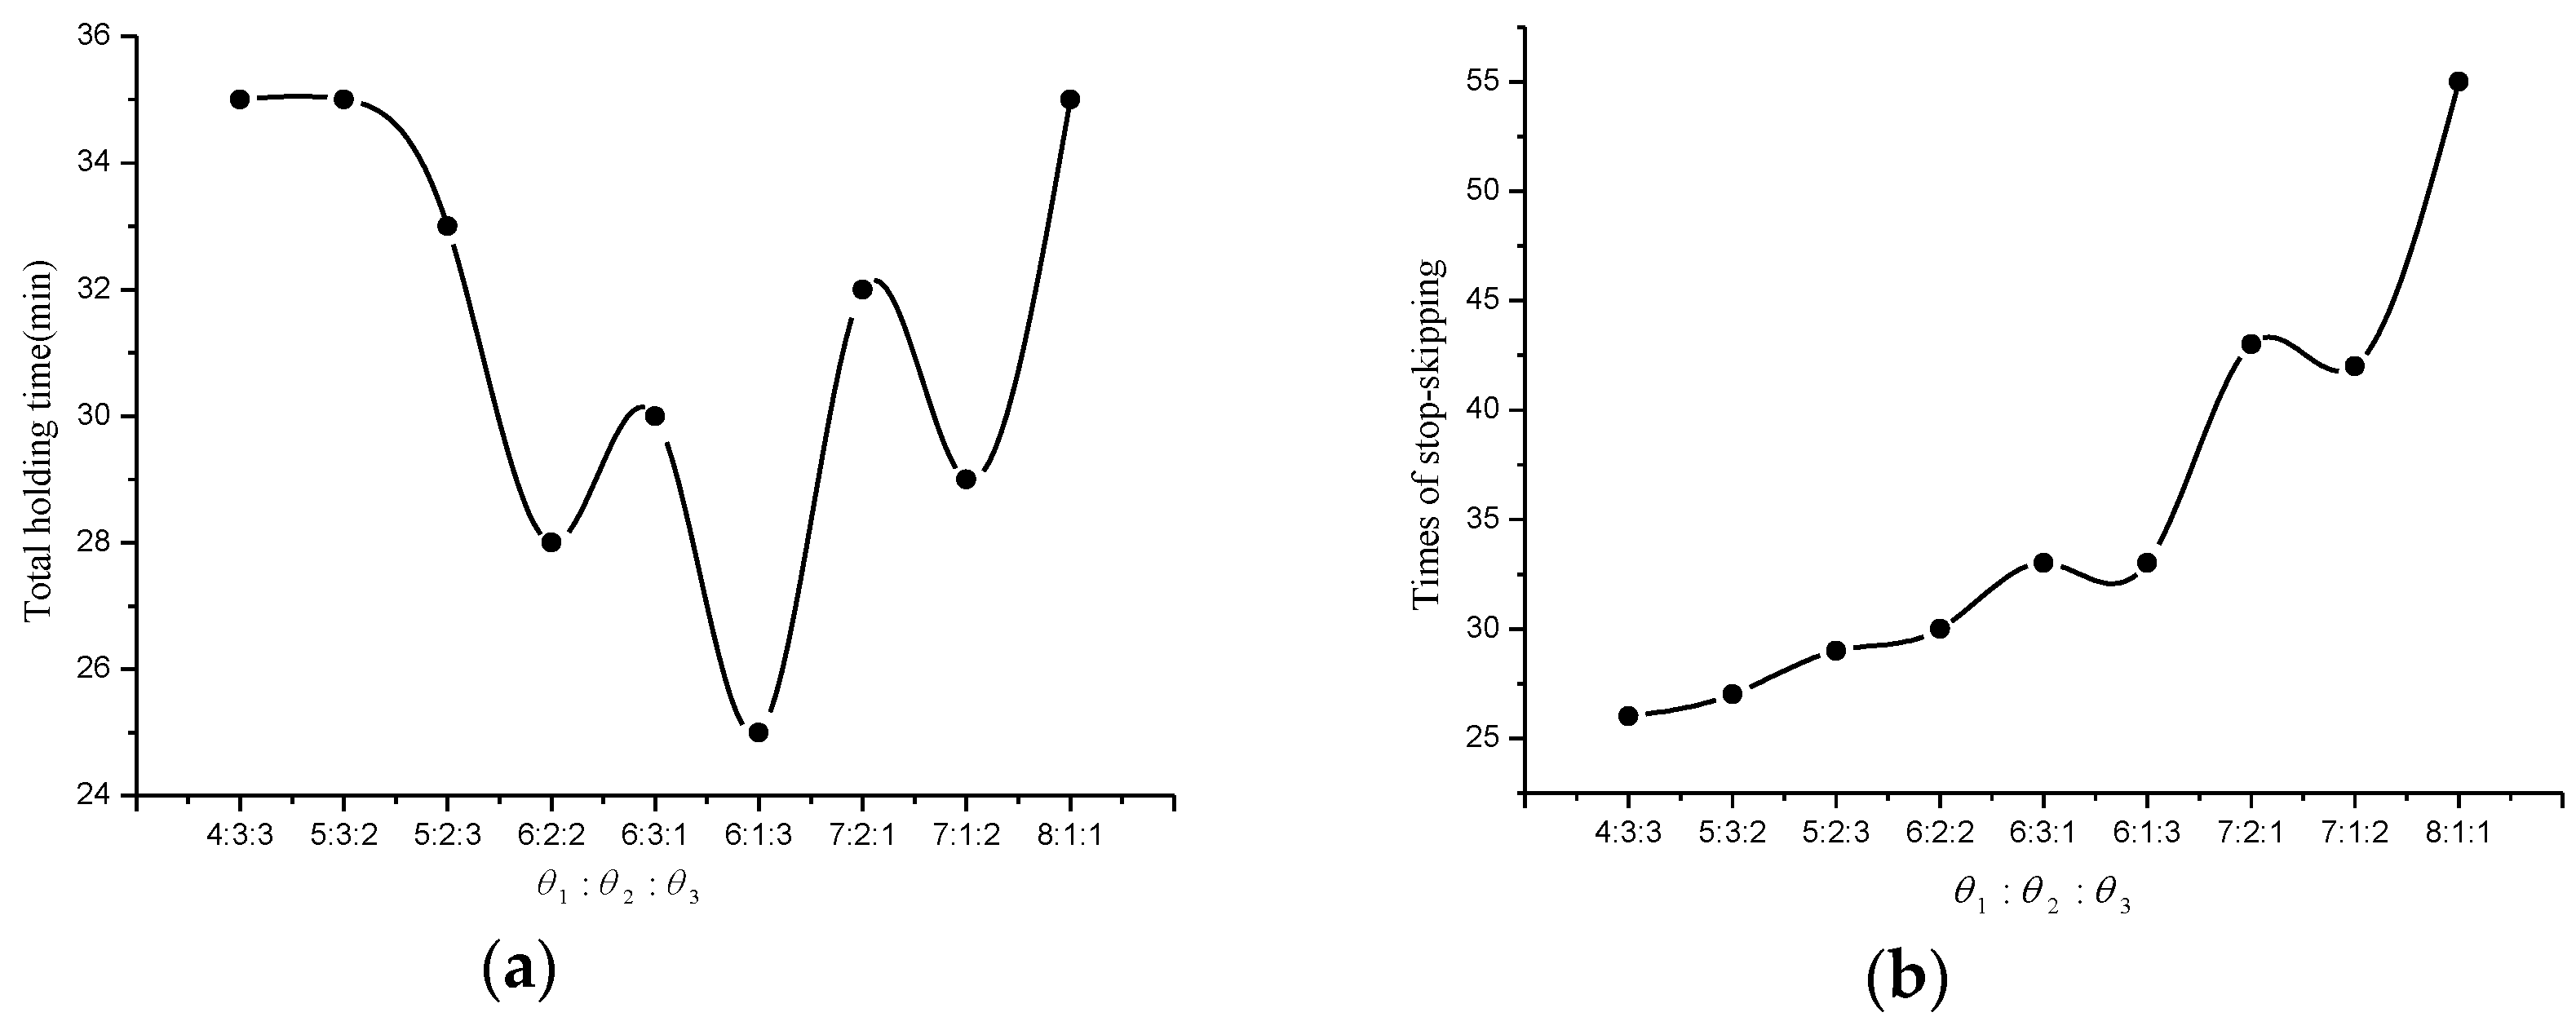
4.2.1. Sensitivity Analysis of Weighting Factors

The primary goal of public transit is to provide quick and convenient service. It is obvious that waiting at stations is harder to bear than waiting on buses for passengers. Thus, J 1 has greater weight than the other two and θ 1 is the biggest as a consequence. Every combination of weighting factors is acceptable because they are just from different points of view. However, in any case, the dispatching strategy comes at a price to a certain extent, either practical difficulties or cost for example. So in this section the total holding time and the times of stop-skipping are selected to evaluate the sensitivity of the weighting factors. In addition, it is better to find a certain combination of weighting factors which has minimum interference with the original bus route.
Nine combinations are analyzed. Additionally, for example, θ 1 : θ 2 : θ 3 = 4 : 3 : 3 means that θ 1 = 0.4 , θ 2 = 0.3 and θ 3 = 0.3 , and so on. The results are shown as Figure 4 below.
In Figure 4a, it can be found that (1) the total holding time is undulating when the weighting factors change. In the situation of θ 1 = 0.6 , the holding time is at a lower level, meaning that holding of the hybrid strategy has less interference on the original route; (2) The greater the proportion of θ 2 , the longer the total holding time is. That is because necessary holding time is needed to adjust the headway; (3) Clearly, the total holding time descends as θ 3 increases. In Figure 4b, the times of stop-skipping present a rising tendency as θ 1 grows. Also, a trough can be found when θ 1 = 0.6 . So, practically speaking, θ 1 = 0.6 may be a better option.

4.2.2. Performance Evaluation Compared to Other Strategy

The holding strategy only [19] and stop-skipping only [27] are carried out and the results are compared to the proposed hybrid strategy. The combination of the weighting factors is set as θ 1 : θ 2 : θ 3 = 6 : 3 : 1 . Four measuring indicators, including the passengers’ average waiting time, the average travel time coefficient, the average travel time of the whole route and the average bus headway, are calculated. The results are shown in Table 4.
In Table 4, the first two indicators reflect the transit service quality and the latter two reveal the transit operational state.
(1) The passengers’ average waiting time (at stations) of the proposed hybrid strategy is in the middle and the holding strategy only can minimize this indicator. Stop-skipping only has the maximum value, showing that this strategy’s detrimental effect on the passengers needs to be properly solved. However, that does not mean the method proposed is not good. Indicators in some other light are also significant to evaluate the overall performance.
(2) The passengers’ average travel time coefficient is calculated as follows:
travel time coefficient = actual travel time ideal travel time
The ideal travel time equals the distance between the original station and the destination station divided by the free speed of buses, without considering any waiting time. This indicator reflects passengers’ extra cost for using the bus compared with the car. The hybrid strategy produces the minimum travel time coefficient, meaning that this strategy is in a highly competitive position with cars. That is one of the advantages of the proposed method.
(3) The average travel time of whole route represents the turnover rate of buses. The holding strategy actually puts the departure time of buses off, causing a longer running time of the whole route and a lower turnover rate. Thus, it leads to the longest running time, 74.2 min. On the contrary, the stop-skipping strategy makes buses controlled ahead of the regular schedule with the shortest running time, 56.3 min. The hybrid method is in the medium level once again.
(4) Bus holding can homogenize the headway, and the average bus headway in this situation is the shortest. While because of skipping, some stops experience much longer headways; thus, the stop-skipping strategy leads to longest headway.
The performance of the proposed hybrid strategy is at the medium level for most of the indicators. It is because the hybrid strategy is a trade-off between the input of the public transportation and the transit service. Most important of all, the proposed method produces the smallest travel time coefficient, improving the quality of service and strengthening the transit’s competitiveness.

5. Conclusions and Discussion

This paper studies the bus in-station dispatching strategy and proposes a hybrid bus dispatching model including a holding and stop-skipping strategy. In this strategy, three sub-objectives, the passengers’ waiting time, the bus headway variance and the extra penalties caused by dispatching actions, are analyzed. A balanced objective function is proposed, integrating the three sub-objectives with different weighting factors. The Lagrangian relaxation algorithm is used to solve the NP-hard problem.
A case study is conducted based on a loop-shaped bus route in Harbin. The real GPS and IC data are used to estimate the real-time bus position and the OD matrix. Firstly, an experiment is done to analyze the sensitivity of the three weighting factors. The results show that the total holding time and the times of stop-skipping both hit the trough phase when θ 1 = 0.6 approximately. Thus, the recommended values of the weighting factors are θ 1 = 0.6 , θ 2 = 0.3 and θ 3 = 0.1 because in this situation, the strategy has minimum interference on the route. Secondly, another experiment, which comparing the proposed model with the recommended weighting values to single holding and single stop-skipping, respectively, was conducted to evaluate its performance. Most of the indicators show that the hybrid model is a better trade-off. Furthermore, the travel time coefficient of the hybrid strategy is the smallest. These findings are significantly helpful in enhancing the competitiveness of the public transportation.
The contributions as well as the advantages of the proposed approach comprise two points. On the one hand, a better trade-off between the transit service and transit cost is found with the proposed hybrid in-station bus-dispatching strategy. This can significantly improve the transit service. Especially, it could give the public transport its competitive edge against other trip modes, which is of great significance in solving traffic problems. On the other hand, bus GPS and IC data are used to make the strategy a real-time dispatching method which can match the practice better.
Additionally, there are some problems which remain unsolved. Firstly, any real-time bus-dispatching strategy is implemented well with accurate bus arrival time predictions. In this paper, the bus arrival time prediction is left in implicit terms and a classical method is used in the numerical example. Actually, both the holding and stop-skipping strategies will significantly affect the bus running time and dwell time. So improving the prediction model systematically, taking account of holding and stop-skipping, is challenging but necessary. Secondly, the passenger arrival rate is assumed to be subject to Poisson distribution. In a better way, as the bus IC data record massive amounts of transit demand information, it is essential to mine the residents’ transit trip rules and make a dispatching strategy which could correspond to these rules. Such a strategy would provide better transit service. Lastly, another future research direction is that the proposed hybrid strategy is applied to a single bus line. To solve practical problems effectively, multiple bus lines should be analyzed and the public transportation transfer also needs to be considered carefully.

Acknowledgments

This research has been supported by the National Natural Science Foundation of China, grant. NO 51478151.

Author Contributions

Shi An had conceived and designed the study, Xinming Zhang analyzed and constructed the model, drafted and revised this manuscript. Both authors have read and approved the final manuscript.

Conflicts of Interest

The authors declare no conflict of interest.

References

  1. Kittelson & Associates; KFH Group; Parsons Brinckerhoff Quade & Douglass; Hunter-Zaworski, K. Quality of service. In Transit Capacity and Quality of Service Manual; Transportation Research Board: Washington, DC, USA, 2003; Volume 100, pp. 111–113. [Google Scholar]
  2. An, S.; Zhang, X.; Wang, J. Finding causes of irregular headways integrating data mining and AHP. ISPRS Int. J. Geo-Inf. 2015, 4, 2604–2618. [Google Scholar] [CrossRef]
  3. Feng, W.; Figliozzi, M. Using archived AVL/APC bus data to identify spatial-temporal causes of bus bunching. In Proceedings of the 90th Annual Meeting of the Transportation Research Board, Washington, DC, USA, 23–27 January 2011; pp. 11–32.
  4. Mandelzys, M.; Hellinga, B.; Eng, P. Automatically identifying the causes of bus transit schedule adherence performance issues using AVL/APC archived data. In Proceedings of the 89th Annual Meeting of the Transportation Research Board, Washington, DC, USA, 10–14 January 2010.
  5. Eberlein, X.J. Real-Time Control Strategies in Transit Operations: Models and Analysis. Ph.D. Thesis, Massachusetts Institute of Technology, Boston, MA, USA, 1995. [Google Scholar]
  6. Wolput, B.; Christofa, E.; Tampère, C. Optimal traffic signal settings with transit signal priority. In Proceedings of the 94th Annual Meeting of the Transportation Research Board, Washington, DC, USA, 11–15 January 2015; pp. 1–19.
  7. Guler, S.I.; Menendez, M. Analytical formulation and empirical evaluation of pre-signals for bus priority. Transp. Res. Part B 2011, 45, 1831–1845. [Google Scholar] [CrossRef]
  8. Eichler, M.; Daganzo, C.F. Bus lanes with intermittent priority: Strategy formulae and an evaluation. Transp. Res. Part B 2006, 40, 731–744. [Google Scholar] [CrossRef]
  9. Yu, B.; Kong, L.; Sun, Y.; Yao, B.Z.; Gao, Z.Y. A bi-level programming for bus lane network design. Transp. Res. Part C 2015, 55, 310–327. [Google Scholar] [CrossRef]
  10. Ceder, A. Bus timetables with even passenger loads as opposed to even headways. Transp. Res. Rec. 2001, 1760, 3–9. [Google Scholar] [CrossRef]
  11. Furth, P.G.; Muller, T.H.J. Service reliability and optimal running time schedules. Transp. Res. Rec. 2007, 2034, 55–61. [Google Scholar] [CrossRef]
  12. Furth, P.G.; Muller, T.H.J. Optimality conditions for public transport schedules with time point holding. Public Transp. 2009, 1, 87–102. [Google Scholar] [CrossRef]
  13. Zhao, J.; Dessouky, M.; Bukkapatnam, S. Optimal slack time for schedule-based transit operations. Transp. Sci. 2006, 40, 529–539. [Google Scholar] [CrossRef]
  14. Sun, A.; Hickman, M. The holding problem at multiple holding stations. In Computer-Aided Systems in Public Transport; Springer: Berlin, Germany, 2008; pp. 339–359. [Google Scholar]
  15. Zolfaghari, S.; Azizi, N.; Jaber, M.Y. A model for holding strategy in public transit systems with real-time information. Int. J. Transport. Manag. 2004, 2, 99–110. [Google Scholar] [CrossRef]
  16. Puong, A.; Wilson, N.H.M. A train holding model for urban rail transit systems. In Computer-Aided Systems in Public Transport; Springer: Berlin, Germany, 2008; pp. 319–337. [Google Scholar]
  17. Daganzo, C.F. A headway-based approach to eliminate bus bunching: Systematic analysis and comparisons. Transp. Res. Part B 2009, 43, 913–921. [Google Scholar] [CrossRef]
  18. Daganzo, C.F.; Pilachowski, J. Reducing bunching with bus-to-bus cooperation. Transp. Res. Part B 2011, 45, 267–277. [Google Scholar] [CrossRef]
  19. Bartholdi, J.J., III; Eisenstein, D.D. A self-coördinating bus route to resist bus bunching. Transp. Res. Part B 2012, 46, 481–491. [Google Scholar] [CrossRef]
  20. Jamili, A.; Aghaee, M.P. Robust stop-skipping patterns in urban railway operations under traffic alteration situation. Transp. Res. Part C 2015, 61, 63–74. [Google Scholar] [CrossRef]
  21. Wang, Y.; De Schutter, B.; Van den Boom, T.J.J.; Ning, B. Efficient Bilevel Approach for Urban Rail Transit Operation with Stop-Skipping. IEEE Trans. Intell. Transp. 2014, 15, 2658–2670. [Google Scholar] [CrossRef]
  22. Chen, X.; Hellinga, B.; Chang, C.; Fu, L. Optimization of Headways for Bus Rapid Transit System with Stop-skipping Control. In Proceedings of the 91th Annual Meeting of the Transportation Research Board, Washington, DC, USA, 22–26 January 2012; pp. 1–17.
  23. Chen, X.; Hellinga, B.; Chang, C.; Fu, L. Optimization of headways with stop-skipping control: A case study of bus rapid transit system. J. Adv. Transp. 2015, 49, 385–401. [Google Scholar] [CrossRef]
  24. Ercolano, J.M. Limited-stop bus operations: An evaluation. Transp. Res. Rec. 1984, 994, 24–29. [Google Scholar]
  25. Li, Y.; Rousseau, J.; Gendreau, M. Real time scheduling on a transit bus route: A 0–1 stochastic programming model. In Proceedings of the Thirty-Third Transportation Research Forum, Arlington, VA, USA, 31 October–2 November1991; pp. 157–166.
  26. Fu, L.; Liu, Q.; Calamai, P. Real-time optimization model for dynamic scheduling of transit operations. Transp. Res. Rec. 2003, 1857, 48–55. [Google Scholar] [CrossRef]
  27. Sun, A.; Hickman, M. The real-time stop-skipping problem. J. Intell. Transport. Syst. 2005, 9, 91–109. [Google Scholar] [CrossRef]
  28. Liu, Z.; Yan, Y.; Qu, X.; Zhang, Y. Bus stop-skipping scheme with random travel time. Transp. Res. Part C 2013, 35, 46–56. [Google Scholar] [CrossRef]
  29. Cortés, C.E.; Sáez, D.; Milla, F.; Nunez, A.; Riquelme, M. Hybrid predictive control for real-time optimization of public transport systems’ operations based on evolutionary multi-objective optimization. Transp. Res. Part C 2010, 18, 757–769. [Google Scholar] [CrossRef]
  30. Delgado, F.; Muñoz, J.C.; Giesen, R.; Cipriano, A. Real-time control of buses in a transit corridor based on vehicle holding and boarding limits. Transp. Res. Rec. 2009, 2090, 59–67. [Google Scholar] [CrossRef]
  31. Delgado, F.; Munoz, J.C.; Giesen, R. How much can holding and/or limiting boarding improve transit performance? Transp. Res. Part B 2012, 46, 1202–1217. [Google Scholar] [CrossRef]
  32. Luh, P.B.; Hoitomt, D.J.; Max, E.; Pattipati, K.R. Schedule generation and reconfiguration for parallel machines. IEEE Trans. Rob. Autom. 1990, 6, 687–696. [Google Scholar] [CrossRef]
  33. Zhang, D.; Zhang, X.; Jian, W. Commuter travel identification based on bus IC data. In Proceedings of the 13th COTA International Conference of Transportation Professionals (CICTP), Shenzhen, China, 13–16 August 2013; pp. 1547–1555.
Figure 1. The transit route studied.
Information 07 00043 g001
Figure 2. Passengers waiting time at a skipped stop.
Information 07 00043 g002
Figure 3. The route map of line 110 in Harbin.
Information 07 00043 g003
Figure 4. Sensitivity analysis of weighting factors: (a) Total holding time varies with the weight proportion; (b) Times of stop-skipping varies with the weight proportion.
Information 07 00043 g004
Table 1. The definition of key variables.
VariablesDefinition
n Total number of buses of the studied route
m Total number of stops the studied route
ω i , j Decision variable, 0-1 variable, when bus i stops at station j , ω i , j = 1 ; otherwise, ω i , j = 0
a i Decision variable, holding time of bus i at the terminal station
s i Time interval between departure time of bus i 1 and arrival time of bus i at the terminal station
h i , j The predicted inter-arrival time between bus i 1 and bus i at stop j , i.e., the bus headway
Table 2. Information used in the research among the bus GPS data (sample data).
LINENAMEBUSNAMEARRIVEDATEARRIVETIMELEAVEDATELEAVETIMESTATIONNO
11033782015-03-1208:27:392015-03-1208:28:2926
11033892015-03-1208:28:402015-03-1208:29:1013
11033962015-03-1208:22:292015-03-1208:23:185
11033772015-03-1208:17:022015-03-1208:21:1722
11033772015-03-1208:21:182015-03-1208:21:1823
11033772015-03-1208:21:192015-03-1208:23:0124
11034122015-03-1208:28:342015-03-1208:28:4810
11033962015-03-1208:28:342015-03-1208:29:028
Table 3. Information used in the research among the bus IC data (sample data).
CardIDPosIDLineNODateTime
15000000000010073130110901102015031208:27:39
15000000000010073130110901102015031216:27:17
15000000000010173130107431102015031208:29:02
15000000000010173130107431102015031218:23:50
15000000000010313130110021102015031208:28:34
15000000000010313130109851102015031217:22:10
Table 4. Comparison of results among the three strategies.
IndicatorsHolding OnlyStop-Skipping OnlyHybrid Strategy Proposed
Passengers’average waiting time (min)4.805.605.20
Passengers’average traveltimecoefficient1.481.451.32
Average travel time of whole route (min)74.2056.3062.00
Average bus headway (min)5.105.805.30

