We consider all of these separately and jointly. SINR/interference variations caused by RRM may be stabilized by applying persistent RRM strategies. For example, downlink precoded multi-antenna transmissions, where the precoders that are not user specific but frequency resource specific and optimized for a population of users, may be considered. As a result, the SINR misprediction due to 3 partially vanishes. Not much can be done to remove the variability due to 1 and 2, however, if the user and/or the channel is mobile.
To address the impairments caused by 1-3 for URC, we consider robust link adaptation where the SINR statistics of the realized transmission conditioned on the measured SINR are known.
3.1. Changes in Wanted Signal Power
The time selectivity of the desired channel induces SINR variability at the receiver, and is discussed next. Let us assume that the interference experienced by the user of interest remains same until the transmission is realized. The distribution of the signal power
is of our interest. From Equation (4) it can be rewritten as
Then, for a given channel measurement
and the precoder used
, RV,
S can be modeled as a magnitude of a sum of two squared independent Gaussian RVs with equal variance
, and means
and
. Note that the probability distribution of the inner product of a channel vector
with independent and identically distributed (i.i.d) Gaussian elements and an arbitrary unitary vector
equals the distribution of an element of the channel vector
. Therefore, the PDF of the signal power
can be characterized by a non-central chi-square distribution with two DoF, and the non-centrality
. Here,
is the measured signal power and
is the average signal power at measurement. Note that this assumes that we indeed know both
and
,
i.e., the measured signal power and
the average signal power, together with the signal statistics. That is, we know precisely the current fading state of the signal. The PDF of the signal power is now
where
is the modified Bessel function of the first kind. The corresponding CDF is given by
. The SINR variability caused by changing desired transmission signal power can be visualized from CDF, and the realized SINR is
where
is the measured interference power which is considered fixed for the given transmission realization. Now, the outage probability becomes
. The URC outage probability target is achieved at a SINR threshold
, and the required backoff to enable robust link adaptation is
.
The outage probability can be further simplified to
where
is the Marcum-Q function, here with
[
24].
We consider a delay between measurement and transmission of ms, in accordance with the URC latency targets. For a carrier frequency GHz, user velocities , 7 and 5 km/h would lead to auto-correlation coefficients , and , respectively.
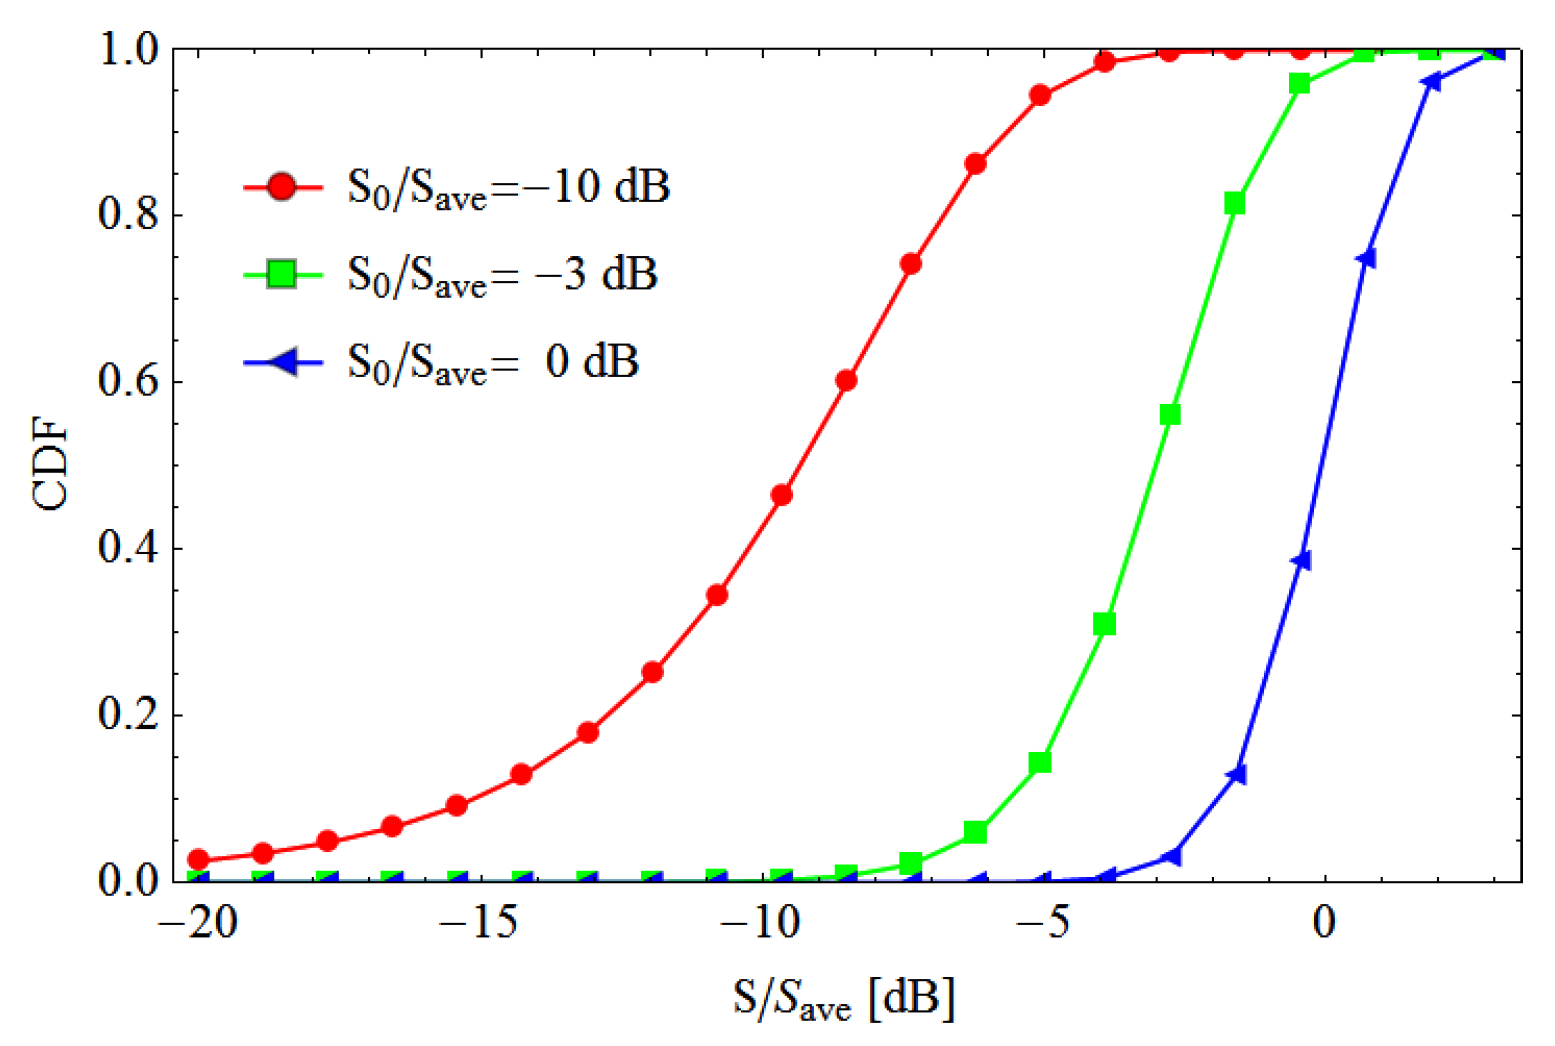
Figure 1 demonstrates how the time selectivity of a channel affects the realized transmission. We consider three situations. In one, the channel of the desired transmission during the measurement is faded (
dB), in the second it is slightly faded (
dB), whereas in the third it is not faded (
dB). In the faded state, when the measured signal power of the desired transmission is 10 times smaller than the average, the distribution of the realized signal power is wide, and the probability of dropping into deeper fade increases for the transmission instant at time
. Hence, the required backoff is significantly larger when the channel at the time of measurement is faded as compared to the situation where the channel at the measurement is on an average level, and
dB.
Note that the auto-correlation coefficient statistically characterizes the level of correlation between the measured and realized channels. When the channel (at a given channel instant) is in faded state, and , the probability of getting to a deeper fade is significant.
Figure 2 left half shows how the required backoff
b (in dB) varies with relative measured signal power
for three different channel auto-correlation coefficients
. If the measured transmission power is in the same order of the average transmission power,
i.e., when the measured channel is in a typical fading state, the required backoff is relatively small. However, when the measured signal is in a fade, extreme backoffs are required to provide ultra-reliability. This is a consequence of the Rayleigh fading statistics used here, where arbitrarily deep fades have finite probability.
The right half
Figure 2 shows the backoff as a function of
ρ. With zero correlation, the wanted signal power at outage is
dB, and the backoff thus is directly
. Here,
represents the instantaneous signal power
S at URC outage. When the measured channel was in a typical fading state, with
dB, the backoff is
dB at
, shrinking monotonously to
dB at
. For smaller
,
i.e., when the measured channel was faded, the backoff first grows with increasing
ρ. This is a consequence of increasing correlation making it more probable that the signal remains in a faded state, and goes into deeper fading. However, after a threshold, the backoff starts shrinking, going to
at
. For example, for
dB, the backoff at
would be
dB, from where it grows to a value of
dB at
, before shrinking to zero.
3.2. Changes in Interfering Channels
In addition to changes in the wanted signal, mobility also causes changes in the interfering signals. To obtain the statistics of the SINR, the distribution of total interference power is essential. We consider the interference experienced at the receiver of interest, produced by
J independent interference sources. Here, we assume that there is no change in the interference precoder from the time of measurement to the time of transmission. The realized interference power then is
where the realized channel
follows the autocorrelation model Equation (4). Note that the transmission power level is assumed to be absorbed in the channels. Then the total interference power can be represented as a linear combination of magnitude squared of
J mutually independent complex Gaussian RVs with non-zero mean and unit variance,
where
. The RV
is again characterized by complex Gaussian distribution with mean
where
. The real and imaginary components of RV
are Gaussianly distributed with unit variance and mean
and
, respectively. Hence,
can be modeled as a non-central chi square distribution with two degrees of freedom, and non-centrality
. In the subsequent analysis, we treat this as the sum of two real RVs. Without loss of generality, we can consider these two to have mean
, not
and
,
i.e., we distribute the mean evenly across the real and imaginary components of
. This is done for ease of notation and analysis, and is precise due to the underlying circular symmetry.
To characterize the distribution of total interference, we use an expansion discussed in [
25]. The probability density function of
where
are mutually independent standard normal random variables, is given by
where
is a non-central chi-square distribution, with
DoF and non-centrality parameter
. The parameter
can be chosen at will. Applying Equation (
9) to the distribution of the total interference, the PDF can be expressed as
Here, the non-centrality is
, where
is the measured interference power of the
jth interferer, and the average interference power of interferer
j is
. The multiplicative coefficients
can be derived from a recurrence formula in [
26], and
can be appropriately selected for fast convergence. In
Appendix A, it is argued that a choice guaranteeing convergence is
where
and
are the minimum and maximum values of
.
In practice, some of the interference signals may be relatively small when compared to some others (
). This may lead to extremely slow convergence of the series Equation (
10), even with an optimal selection of
β, for details see
Appendix A. A Gaussian approximation of the interference power distribution is not optimal. For URC operation, we are especially interested in the tail of the total interference distribution, which a Gaussian approximation would not capture. Instead, the large fluctuations of the distribution Equation (
10) can be treated with a moment matching non-central chi-square approximation. The interference powers of the weak interferers is added to the strongest interferer, and moment matching is applied to obtain an equivalent distribution model [
27].
For the total realized interference in Equation (
8), the
kth cumulant is
A non-central chi-square approximation is derived such that the first two cumulants, the mean
and the variance
equal the corresponding statistics of the total realized interference power. The non-centrality parameter and the DoF of the chi-square approximation
can be directly obtained from
and
. To achieve more accuracy at the tail of the distribution, the first four cumulants are considered. The parameters
and
are determined so that the skewnesses (
) of the actual distribution and the approximation are equal and the difference between the kurtoses (
) of two distributions is minimized [
27]. If
, the approximation is characterized by
and
, with
. Else, if
,
and
with
. Here,
and
. The proposed method in [
27], shows much smaller approximation errors for the model used in Equation (
10), compared to Pearson’s method [
28].
Figure 3 shows the probability distributions of the total interference power, and its moment matching chi-square approximation. The figure on the left side depicts theoretical probability density Equation (
10) for
independent interference sources together with a simulated Monte Carlo realization of the distribution, whereas the figure on the right illustrates moment matching approximation together with a Monte Carlo simulation for both approximations. The approximation with first four cumulants is especially good for the tail of the distribution. It is tight to the very high, and improbable interferences, that are of interest when addressing URC.
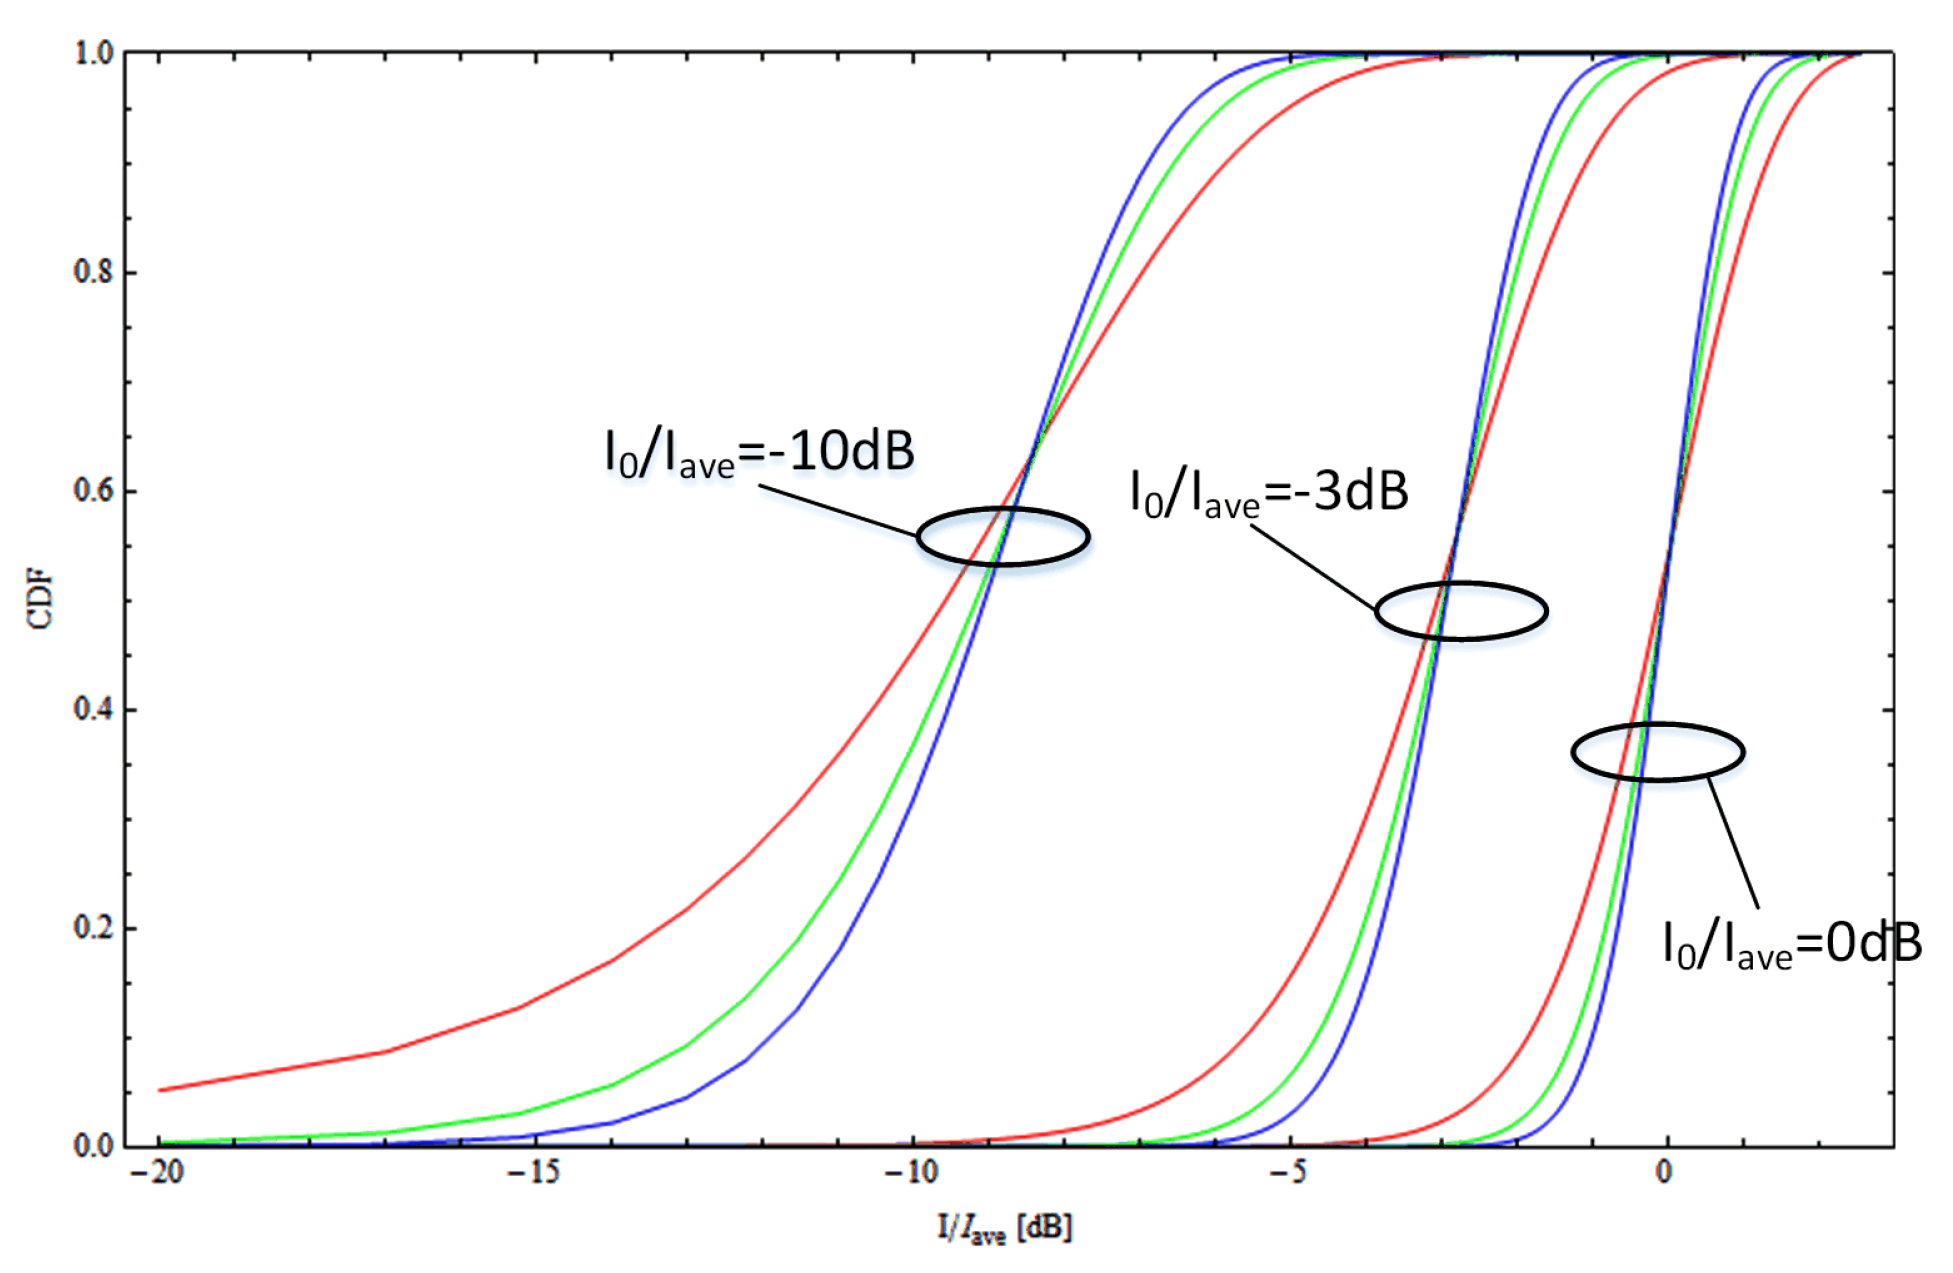
Figure 4 shows CDFs of realized total interference powers when there are
, 2, 3 independent interferers. The measured total interference
is set to
dB, as compared to the average total interference
. We assume that the average interference power is the same for all the individual interferers. When there are
interferers, the measured interference power ratio between the two is assumed to be
,
, whereas for
interferers, the ratios of measured interference powers is
,
,
. Note that here, just as in the case of the wanted signal, we assume that we know both the measured power and the average power, independently for all the
J interferers. The number of interferers has a great impact on backoff selection. The distribution becomes wider with a decreasing number of interferers.
We proceed by considering the SINR variability caused by interference channel variability only. It is assumed that the measured signal power of the desired transmission, and the precoders on both the desired channel and interferers remain same from the time of measurement to the time
τ of transmission. Then, the outage probability with backoff
becomes
where
is the total measured interference power, and the CDF of the total interference power is obtained from Equation (
10) as
For URC, the required backoff can be evaluated at point.
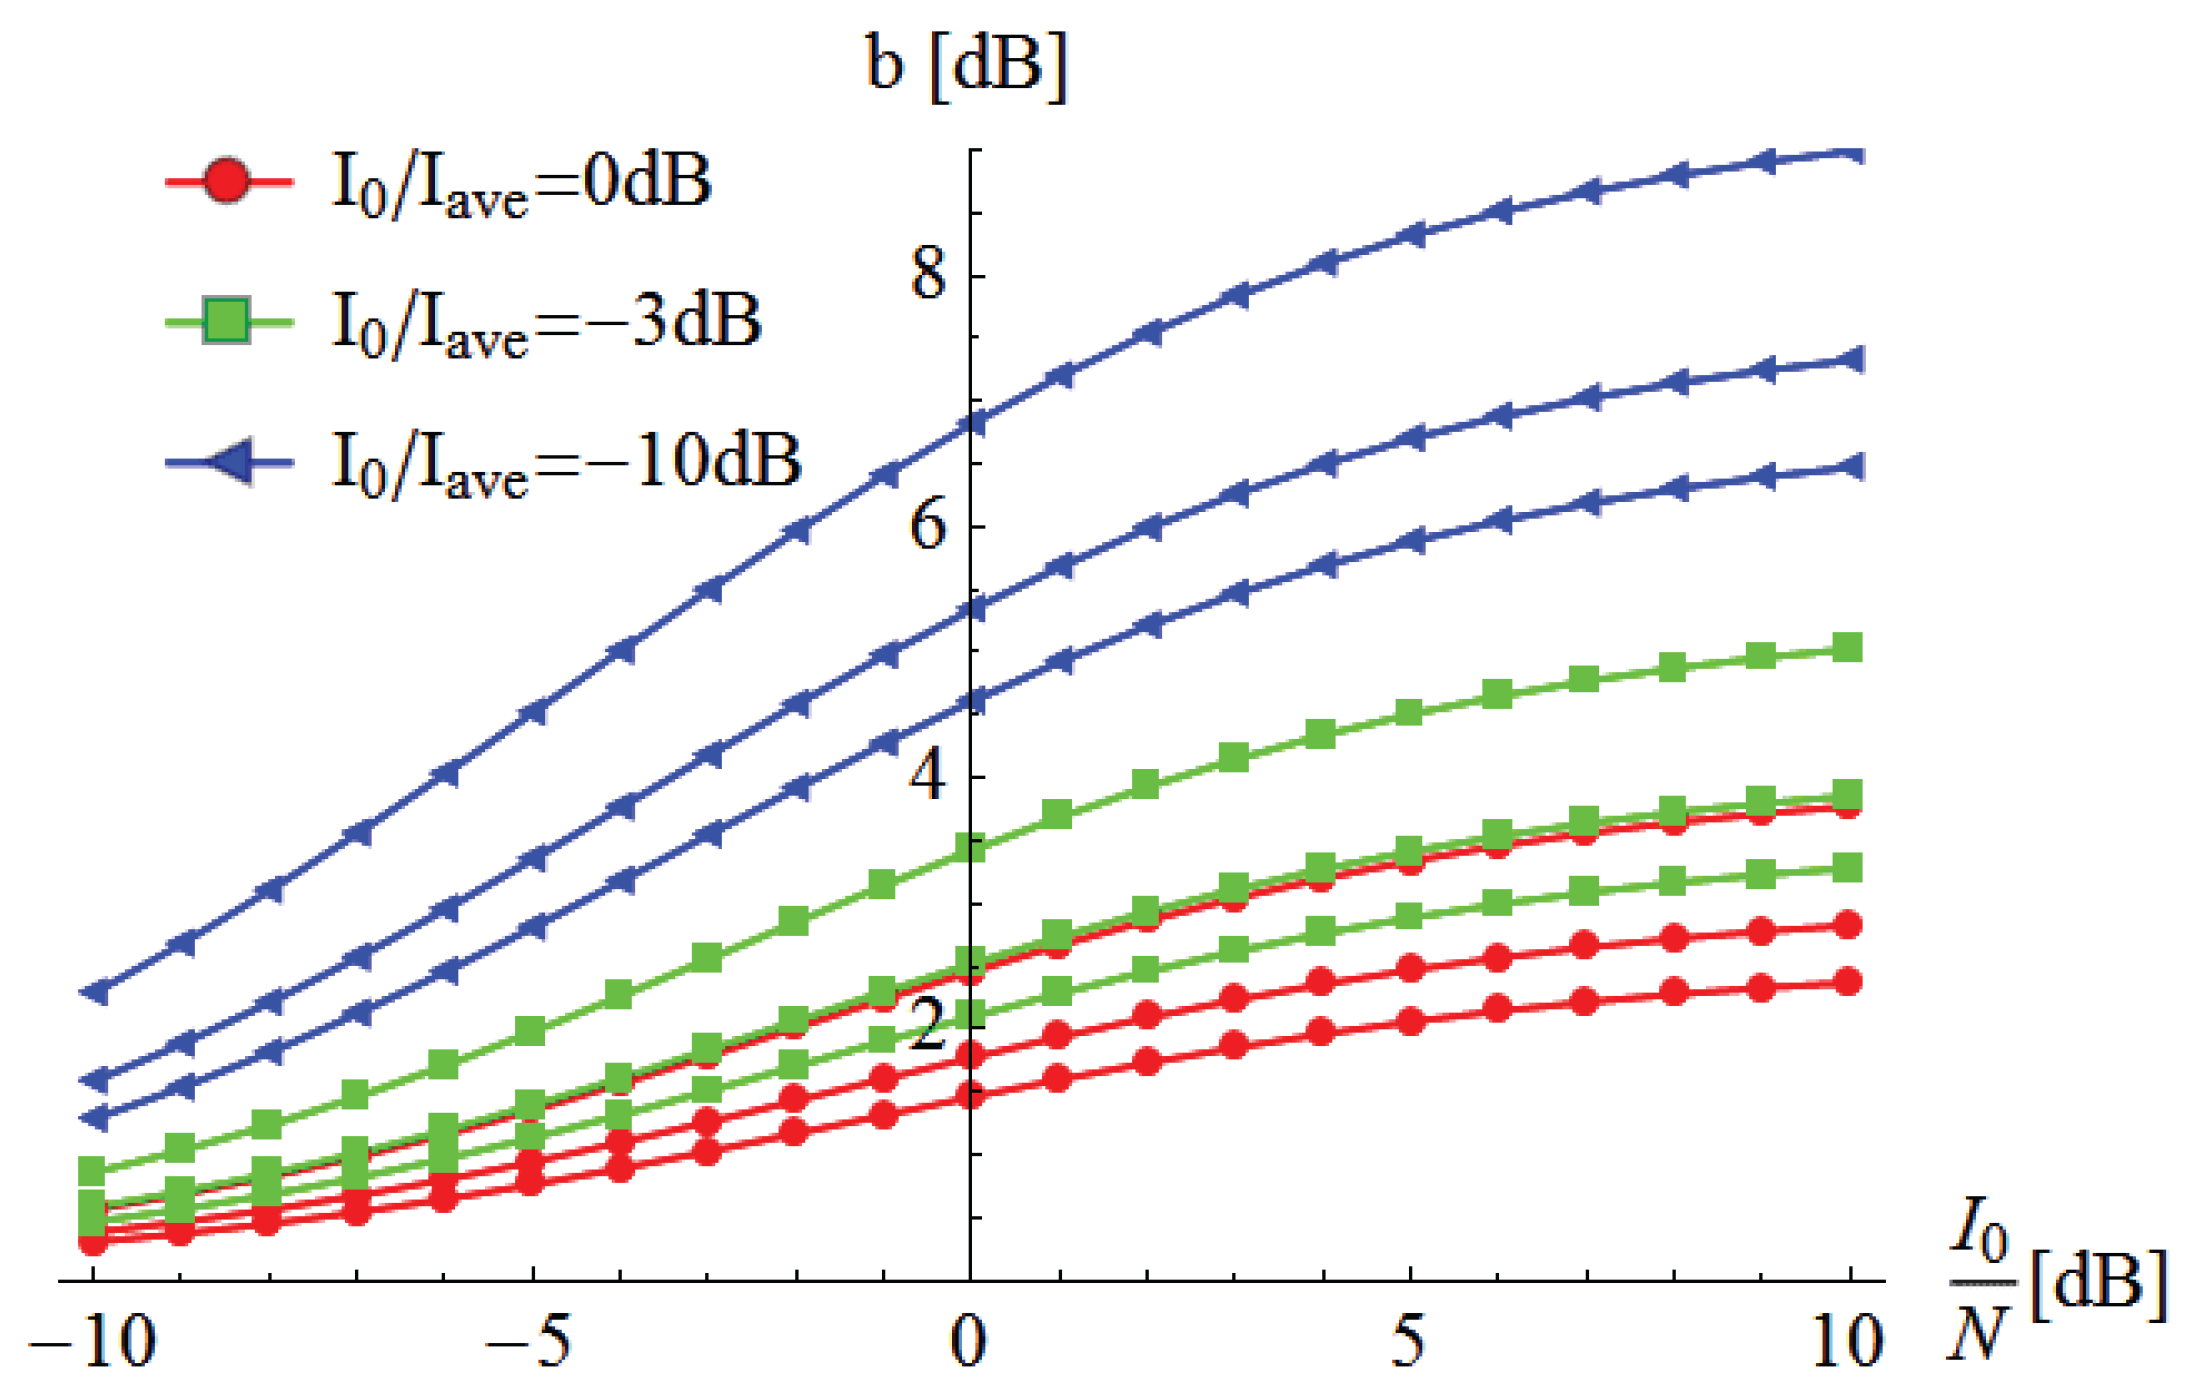
The required URC backoff for three values of the total measured-to-average-interference ratio
is reported in
Figure 5, for different values of
. For each value of
, there are three curves, corresponding to
, 2 , 3. The relative power for
, 3 are shown in
Figure 4. When there are more interferers, the backoff is systematically smaller for the same total average interference
. The figure emphasizes that the backoff required due to interference variability is large when the interferers at the time of measurement are in a fade,
i.e., when
is small. In these cases, it is likely that the interference will be larger at the time
τ of the realized transmission. It should be noted that here, the wanted signal does not vary at all.
3.3. Changes in Precoders of Interferers
The precoders used in interfering base stations may not be the same as the ones used when the channel is measured. This may cause changes in the measured interference power, causing CSI mispredictions and SINR variability [
8]. This effect is particularly strong in multiple input single output (MISO) channels. We assume that the precoder on the desired transmission is selected based on the wanted channel
, and the precoders on
J interfering base stations are selected according to the wanted channels of the intended receivers of the interfering transmissions. The precoders
used at the interfering base stations depend on the scheduled receivers in the interfering cells. We assume that these are uniformly selected from the space of all MISO precoders. If there is no mobility, the received SINR for the desired transmission is
Here,
is the wanted signal power. The powers of interfering channels are
correspond to the interfering channels
in Equation (
3), and
are the normalized interfering channels. We assume that the receiver is able to measure the average interference. The measured SINR is thus
, where
.
For a given channel vector distributed on a complex sphere with radius
, the cumulative distribution of an inner product of the channel vector and a unitary precoder
,
can be obtained from [
29]
The corresponding PDF is then
. Hence, the PDF of the total interference power
induced from
J independent interferes can be written as
where * is the convolution operation. Hence, the total interference power is distributed over domain
. For
J interferers, the CDF is generically divided into
regions [
30], depending on the relative size of the interferers.
As an example of interference variation due to changes of precoders in neighboring cells, we consider a system with , or 1 interferers. The eigenvalues of the interferers are for , and for , and for . We consider three different numbers of transmit antennas at the interferers, .
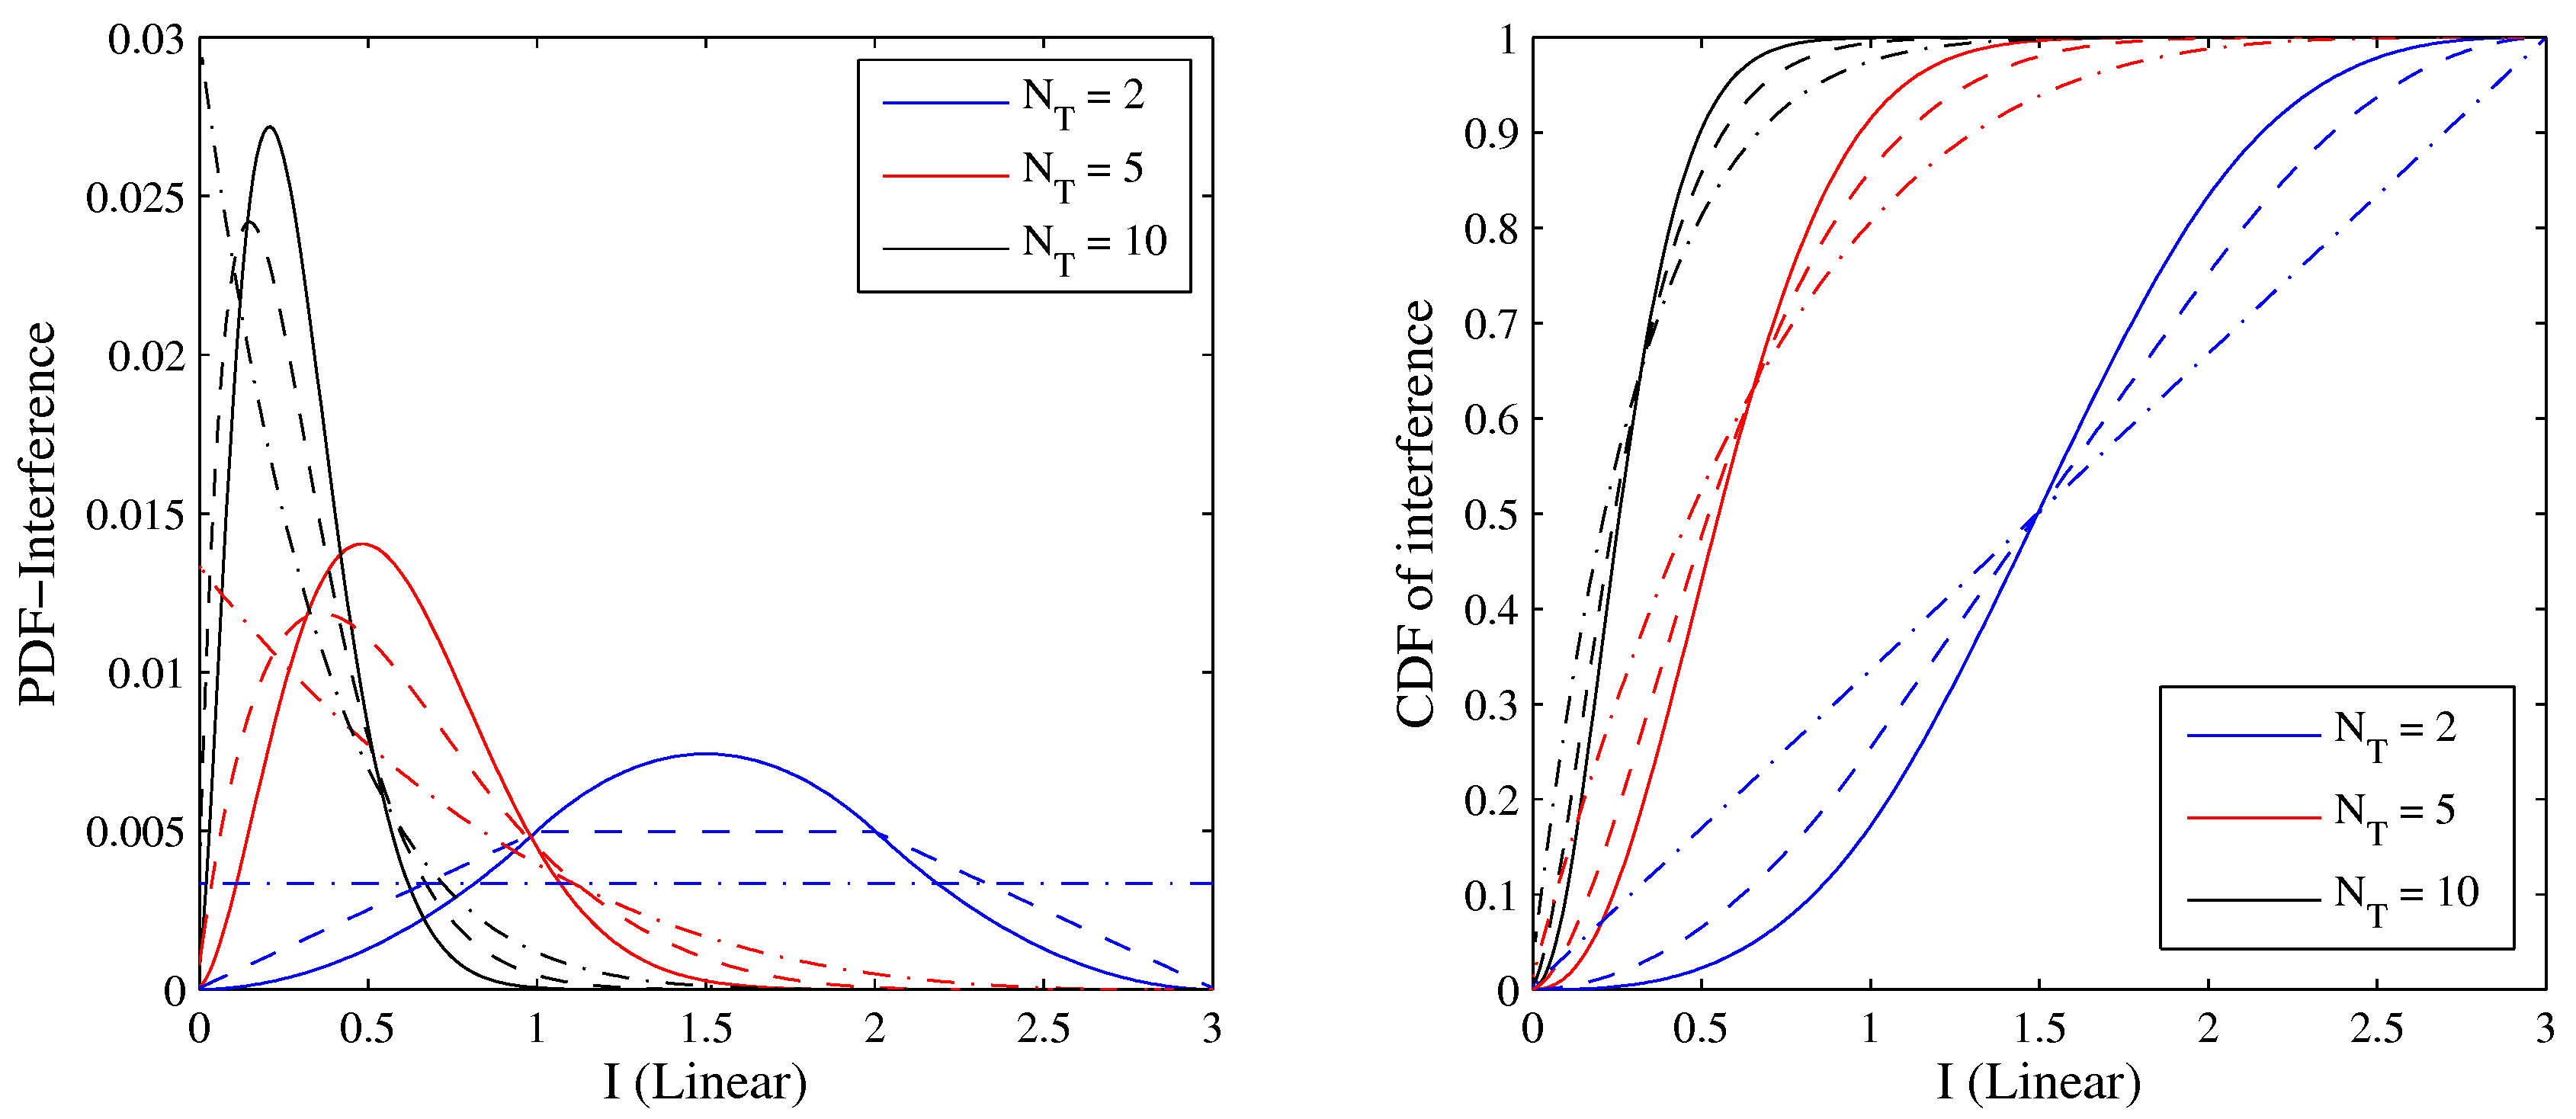
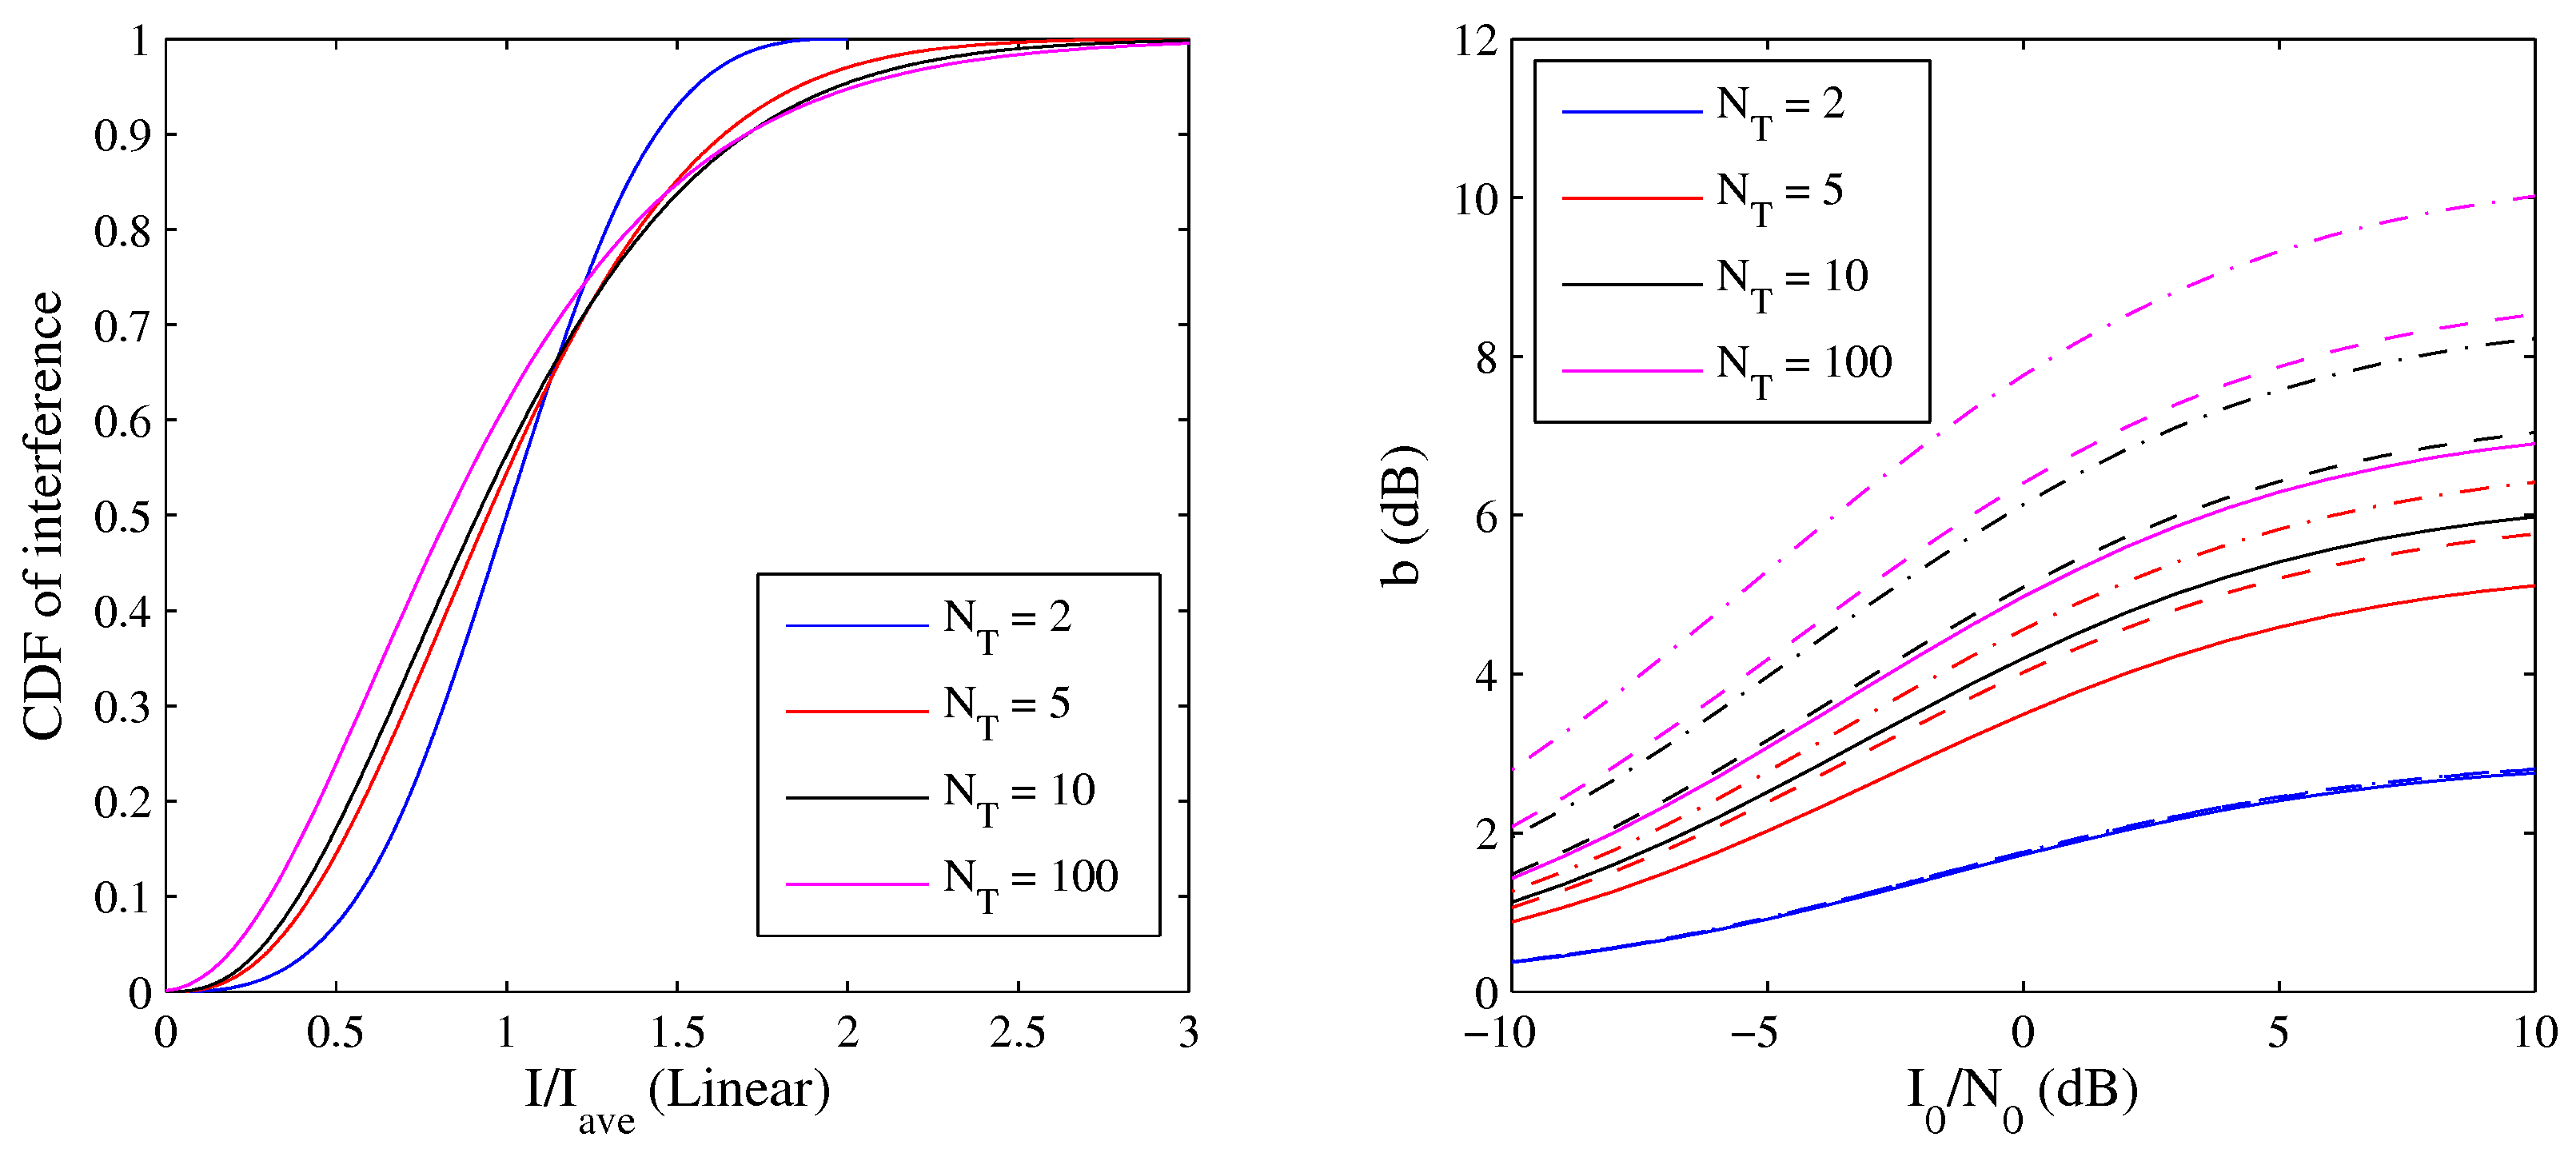
Figure 6 shows the PDF and CDF of the interference at the time of transmission, when the interferers select precoders randomly (for the clarity of the figures,
is omitted). For
, the
point of the complementary CDF of interference is virtually indistinguishable from the worst case interference. With increasing
, worst case precoders become increasingly unlikely — typical interfering signals are almost orthogonal to the wanted signal channel.
The effect observed in
Figure 6 that the distribution of the interference
I becomes narrower with increasing
does not mean that it has become easier to predict URC channel quality. Here, we assume that the channel quality estimated at the time of measurement is given by the average interference power. It turns out that the average is reduced more than the interference at outage, when
grows. To see this, the CDF of the realized interference is plotted in units of
in
Figure 7 (left).
For clarity, the distributions are plotted only for the case. For , the distribution extends to . The average interference is half of the realized. This distribution becomes broader with increasing . The required backoff is plotted in the right part of the figure. The required backoff is , where the interference at the URC target. The required backoff grows with . For , the backoff is virtually the same irrespectively of J. As the 0.99999 point of the CDF is close to the maximum interference, in this case, and the backoff in an interference limited network when would be dB.
