Article

Refined Graph-Guided Fusion Network for Explainable Multimodal Lung Cancer Classification Using CT Imaging and Semantic Features

1
Department of Computer Science & Information Technology, NED University of Engineering & Technology, Karachi 75270, Pakistan
2
JANUS Research Centre, Atlantic Technological University, F92 N8H2 Galway, Ireland
*
Author to whom correspondence should be addressed.
Information 2026, 17(9), 839; https://doi.org/10.3390/info17090839 (registering DOI)
Submission received: 20 July 2026 / Revised: 20 August 2026 / Accepted: 26 August 2026 / Published: 29 August 2026

Abstract

Classifying benign and malignant lung nodules from computed tomography (CT) images remains difficult because lung nodules can be hard to classify, and unimodal models cannot capture complementary diagnostic information. Despite the success of deep learning, existing methods rely only on image information and miss semantic information that can be obtained from an expert radiologist’s knowledge. Hence, the authors propose a new multimodal lung nodule classification model in this study, named the Graph-Guided Fusion Network (R-GGFN), that combines three-dimensional (3D) CT image features and structured radiologist annotations. The proposed architecture consists of three models. A 3D ResNet-18 network for image feature extraction, an MLP network for encoding semantic information, and a Graph Attention Network (GAT) for capturing inter-nodule relationships and fusing multimodal information with the graph. We add a tabular skip connection to preserve discriminative semantic features and use focal loss to address imbalance during training. To prevent data leakage, we partitioned the publicly available LIDC-IDRI dataset at the patient level. Experimental results on a held-out patient-level test set, accessed only once after model selection was finalized, show that the proposed R-GGFN achieves an accuracy of 85.21%, an AUROC of 0.9147, a PR-AUC of 0.9213, and an F1-score of 0.8609. Among all unimodal and multimodal baselines internally evaluated, R-GGFN achieved the best value on every reported metric, including accuracy, AUROC, PR-AUC, F1-score, Precision, sensitivity, and specificity. Furthermore, the proposed approach enhances model transparency by combining explainable AI techniques (e.g., 3D Grad-CAM, SHAP, and graph visualization) to explain the model at the image, feature, and graph levels. The results show that the graph-guided multimodal fusion method can fully leverage complementary image and semantic information, improving diagnostic accuracy and interpretability. The framework proposed here is a good and understandable computer-aided diagnosis decision-support system for lung cancer and a step towards future external dataset validation.

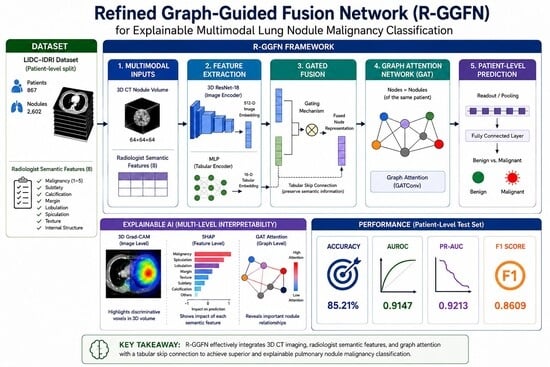
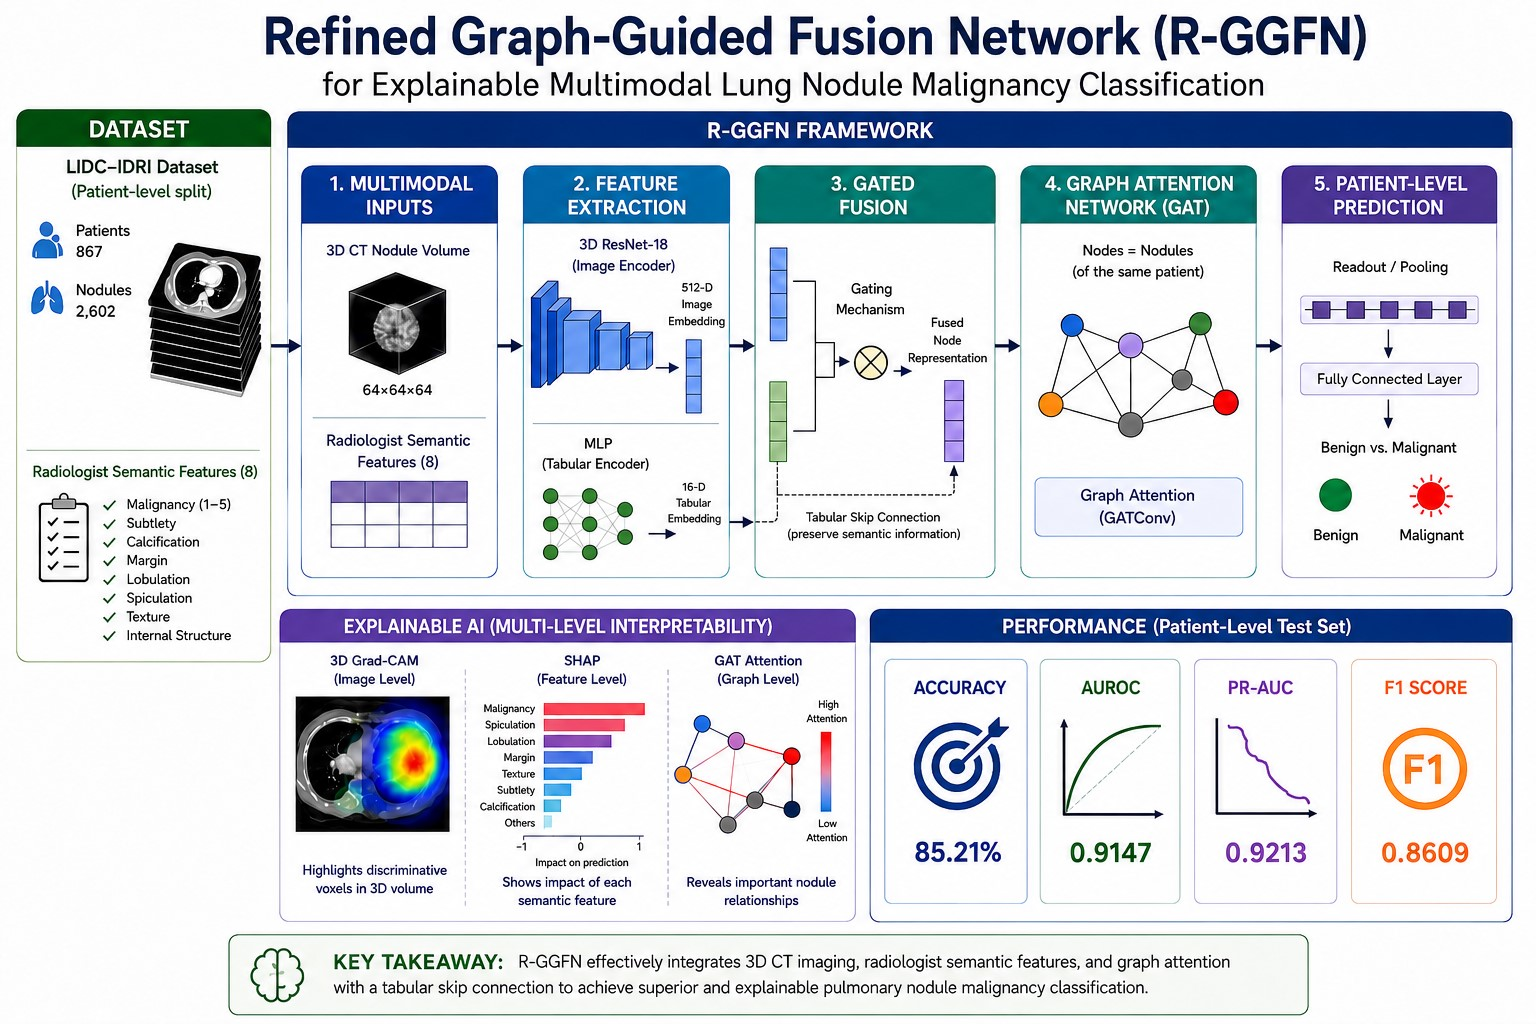
Graphical Abstract

1. Introduction

While imaging technology is a significant advancement in cancer diagnosis and treatment, it has seen tremendous progress in the field, and lung cancer continues to be one of the leading causes of cancer deaths worldwide. According to estimates of the World Health Organization (WHO), in 2022, there will be 2.5 million new cases of lung cancer and 1.8 million deaths from it around the world [1]. Lung cancer may be broadly classified into two types—small cell lung cancer (SCLC) and non-small cell lung cancer (NSCLC)—which account for approximately 85% of all lung cancers [2]. Pulmonary nodules on computed tomography (CT) scans may be benign, premalignant, or malignant, and diagnosing these nodules is essential for early detection and management [3]. Timely detection is crucial for survival, but interpreting CT images can be difficult because nodules vary widely in appearance, size, shape, texture, and density, and inter-observer variability among radiologists is common. As such, computer-aided diagnosis (CAD) systems based on artificial intelligence (AI) have been developed and are used as an easy-to-use tool to support radiologists in detecting suspicious pulmonary nodules and reducing diagnostic errors.
In recent years, the performance of automatic lung cancer detection and classification has greatly improved with advances in deep learning (DL), particularly convolutional neural networks (CNNs). Several research papers have shown how to obtain volumetric representations directly from computed tomography (CT) images using 3D CNNs [4]. Existing approaches, however, use only image data and cannot leverage other clinical information, such as semantic information provided by expert radiologists. In addition, a single model architecture may not capture different features of pulmonary nodules and may, therefore, not be generalizable.
These disadvantages have been increasingly recognized, and multimodal learning has become increasingly popular by adding imaging features with structured clinical data. The Lung Image Database Consortium and Image Database Resource Initiative (LIDC-IDRI) [5] is a well-established, publicly available, well-standardized computed tomography (CT) image database that contains a large number of well-annotated images and freely available, publicly labeled reference images. It is the standard dataset used to evaluate pulmonary nodules. In addition to image data, LIDC-IDRI includes other semantic attributes, such as margin, texture, calcification, spiculation, lobulation, and other morphological attributes that contain clinically relevant information and can be used to enhance image representation.
While multimodal fusion has improved classification performance, the explicit relationships between nodules have not been defined, and semantically important information is not preserved when most multimodal fusion methods concatenate image and tabular features. Furthermore, deep learning models are not yet clinically usable because they lack interpretability. Clinicians need to understand the ‘why’ behind the prediction model; this transparency and accountability are essential for using AI-based predictions in clinical decision-making. Explainable Artificial Intelligence (XAI) is thus becoming a crucial component of a trustworthy medical AI system. To visualize the CT regions, the model’s most important regions for predictions are displayed as 3D Gradient-weighted Class Activation Mapping (3D Grad-CAM), and the learned relationships in the Graph Attention Networks (GATs) are visualized as graph attention visualizations to highlight semantic features. These complementary techniques increase model transparency and make clinical interpretation of prediction results easier.

1.1. Motivation and Challenges

This paper addresses the drawbacks of multimodal approaches with a Refined Graph-Guided Fusion Network (R-GGFN) for pulmonary nodule classification. The proposed framework combines two types of image features: volumetric image features extracted by a 3D convolutional network and multimodal structured annotations provided by radiologists. The proposed architecture contains a tabular skip-connection approach to preserve discriminative information from radiologist-assigned semantic imaging annotations throughout the fusion process, unlike conventional fusion methods. Furthermore, focal loss [6] is used to address class imbalance, and a reduced learning rate with weight-decay regularization is adopted to avoid instability during training; a ReduceLROnPlateau learning-rate scheduler is also used for better model generalization. The proposed framework is tested on the LIDC-IDRI dataset, which includes patient-level information and is split into 15% training and 15% validation to avoid data leakage. Evaluation uses standard classification methods and compares the proposed framework with a baseline image-only classifier and a baseline multimodal model. Moreover, various XAI techniques are incorporated to provide detailed explanations at the image, feature, and graph levels to explain the models’ results.

1.2. Novelty

The novelty of the research lies not in developing a new machine learning [7,8] paradigm but in systematically combining complementary components in a multimodal approach to classify nodules. The newly introduced architecture, the Refined Graph-Guided Fusion Network (R-GGFN), exploits 3D volume CT representation, radiologists’ semantic information, gated multimodal fusion [9], context learning using a Graph Attention Network (GAT) [10], and a tabular skip connection for the retention of clinically relevant semantic information during feature learning based on graphs. Explanations at different levels are included using 3D Grad-CAM, SHAP semantic feature analysis, and graph attention visualization.
The following are key findings of this research:
  • This work proposes a novel model, the Refined Graph-Guided Fusion Network (R-GGFN), to represent 3D CT images and doctors’ descriptions of pulmonary nodule structures and to fuse multiple images to classify pulmonary nodules.
  • In multimodal feature fusion and gradient propagation, preserving discriminative radiologist-derived semantic information through a tabular skip connection is a key challenge, so we add a tabular skip-connection mechanism.
  • We use an optimized training strategy that includes focal loss, weight decay, a reduced learning rate, and the ReduceLROnPlateau scheduler to ensure stable convergence, counteract class imbalance, and improve model generalization.
  • The explainability and transparency of multimodal lung cancer classification are enhanced by designing a unified Explainable Artificial Intelligence (AI) model, which combines 3D Grad-CAM, SHAP, and graph attention visualization.

2. Related Work

2.1. Image-Based Deep Learning

Early CAD systems for lung cancer mainly focused on discriminative features extracted from computed tomography (CT) images, along with trained convolutional neural networks (CNNs) [11]. CNN-based networks such as DenseNet [12], EfficientNet, and hierarchical CNNs have been shown to work well for pulmonary nodule classification, as they learn high-level image representations autonomously. These methods are usually limited to CT images and do not use other information, including semantic information from radiologists and clinical data. In general, image-based systems do not incorporate heterogeneous information, which can help improve diagnostic accuracy. Recent developments have focused on improving feature extraction by using significant regions in an image. However, these models are limited to imaging data and cannot explicitly include contextual relationships between patients [13].

2.2. Multimodal Information Fusion

Recent studies have explored integrating diverse data modalities. They include clinical data, PET images, histopathology, and radiology reports. These modalities [14] help overcome the limitations of image-based learning [15]. These approaches show that diagnostic information quality can be improved by using heterogeneous information sources that provide complementary clinical context. Meanwhile, many multimodal approaches involve either concatenation, attention mechanisms [16], or decision-level fusion [17]. They often lack explicit modeling of structural relations between patients or keep multimodal information at the fusion stage. Some methods rely on multiple imaging modalities, such as CT-PET, or on various imaging reports, including radiology and PET, which are data-intensive and offer limited clinical utility [18,19,20].

2.3. Graph Neural Networks

In recent years, Graph Neural Networks (GNNs) have been applied to medical samples for modeling. Early multimodal solutions focused on lung tumor analysis, where they did not consider adaptive neighborhood aggregation and used a simple graph-building method [21]. Unlike subsequent models such as the Graph Attention Network (GAT) [21], CSEGAT adds learnable importance weights to neighboring nodes to improve contextual representation. CSEGAT also adds learnable importance weights to the neighboring nodes, which other models such as the Graph Attention Network (GAT) do not include. Yet existing graph learning methods fail to leverage these enhanced imaging characteristics fully and are not well suited to incorporate radiologist-specific semantic annotations structured for graph-based representational learning. A limitation is the lack of mechanisms that effectively use semantic knowledge to aggregate features [22].

2.4. Explainable Artificial Intelligence

Explainable Artificial Intelligence (XAI) has become increasingly important for improving the transparency and clinical acceptance of deep learning models. Grad-CAM is a widely used tool that highlights discriminative image regions, while SHAP approximates feature importance. Although these methods enhance model interpretability, they typically offer only a single level of explanation. Most existing methods do not integrate image-, feature-, and graph-level visualization and analysis. Currently, existing XAI methods address only certain aspects of the decision-making process in multimodal deep-learning systems [23,24].

2.5. Comparative Analysis of CNN, Graph Neural Network, Multimodal Fusion, and XAI

The consolidated comparison in Table 1 shows how lung-nodule classification has evolved from CNN-based image representation to multimodal fusion, graph-based relational learning, and Explainable Artificial Intelligence. CNN-based methods like Aamir et al. [12] use automatically learned image representations, while later multimodal methods leverage additional clinical, molecular, radiomic, or other structured data. Additionally, Pushpa et al. [18], Saihood et al. [13], and Tong et al. [25] have further improved representation learning by modeling relationships between the nodules. Another growing area is explainability, with works using attention-based interpretation or SHAP to gain insight into model predictions. R-GGFN, by contrast, unifies these methodological directions in a single framework: it employs gated multimodal fusion [26] of 3D CT features and radiologist-provided semantic imaging annotations, uses a Graph Attention Network for relational learning, and uses a tabular skip connection to retain semantic information. Moreover, attention visualization methods at the image, semantic-feature, and graph levels (3D Grad-CAM, SHAP) complement each other and offer additional explanations. Therefore, the proposed framework progresses from a single component of image, multimodal, graph, or explainability to a framework of integrated multimodal and graph-guided explainable classification.

2.6. Feature Comparison of Existing Methods

Whereas each of the above-mentioned papers focused on analyzing CNN learning, multimodal fusion, GNNs [28], and explainable AI separately, the methodology framework in question is missing from any of those approaches. The abilities of the methodologies of recent state-of-the-art approaches are summarized in Table 2 below.
As shown in Table 2, all currently available approaches focus on one or two methodological aspects. However, no approach considers 3D CT image processing, radiologist semantic feature extraction, graph attention learning, tabular skip connections, optimal training, and multiple explainability approaches simultaneously. Thus, we propose the R-GGFN approach.

2.7. Research Gap

This research has some interesting gaps in its comparative analyses. First, the image-only models do not use structured radiologist semantic information to complement imaging features derived from a CT image. Second, most multimodal representations in the literature show that multimodality can enhance feature representation; however, most methods rely on simple feature concatenation or apply an attention model to combine features, which does not explicitly model inter-patient contextual relationships. Third, most graph-based approaches build graphs based on image features rather than semantic annotations, and few graph-based representation learning approaches use semantic annotations. Finally, current explainability methods usually provide only one interpretation of the model decision, limiting transparency.
In this study, we overcome these limitations by proposing a multimodal approach for volumetric CT imaging, called a Refined Graph-Guided Fusion Network (R-GGFN), which uses semantic (XML) features provided by the radiologist. Notably, the proposed architecture preserves semantic information using a tabular skip connection and models inter-patient contextual information using a Graph Attention Network, unlike previous methods. Moreover, it leverages several complementary explainability tools, such as Grad-CAM, SHAP, and graph attention visualization, for image-level, feature-level, and graph-level explanations. It is an all-in-one design aligned with the research trends in MDPI’s Information on multimodal information fusion, intelligent information processing, graph representation learning, and Explainable Artificial Intelligence.

3. Methodology

3.1. Experimental Setup

The proposed Refined Graph-Guided Fusion Network (R-GGFN) is based on the deep learning framework PyTorch 2.10.0 [29] and the graph representation learning library PyTorch Geometric 2.8.0. Model development and training were performed on an NVIDIA Tesla T4 GPU with an Intel Xeon 2.30 GHz processor and 29 GB RAM, running Ubuntu. CUDA 12.6 was used to speed up GPU computations. Other software libraries used for data processing, model evaluation, visualization, and explainability analysis were NumPy 2.0.2 [30], Scikit-learn 1.6.1, MONAI (Project MONAI) [31], Matplotlib 3.10.0, and SHAP 0.51.0.
The experiments were conducted in five steps: (i) multimodal data processing, (ii) features extracted from volumetric computed tomography (CT) images and the semantic annotation by the radiologist, (iii) multimodal feature fusion based on a graph model, (iv) model optimization with the aid of the focal loss and adaptive learning-rate scheduling, and (v) quantitative and qualitative evaluation by calculating the classification metrics according to the conventional method and the Explainable Artificial Intelligence (XAI). We used the same experimental setup, patient-level data partitioning, and evaluation procedure for all baseline models and the proposed framework.

3.2. Dataset Description

We used one of the most popular pulmonary nodule evaluation and computer-aided diagnosis (CAD) databases, the Lung Image Database Consortium and Image Database Resource Initiative (LIDC-IDRI) [32], to test this proposed framework. This collection includes thoracic computed tomography (CT) scans from 1010 patients, comprising over 100,000 DICOM images from healthcare centers worldwide, with varying imaging parameters and hardware. This diversity offers clinical variability and helps to build strong deep learning models. Of these, 875 patients had at least one nodule with a valid image series in the pre-extracted slice archive used in this study, for a total of 2630 candidate nodules; after nodule-level annotation matching (Section 3.3.2), the final analytical sample included 867 patients and 2602 nodules (Section 3.3.5).
A major advantage of the LIDC-IDRI dataset is its complete expert annotations [33].
A two-step annotation process was used to independently annotate all CT exams by up to 4 experienced thoracic radiologists. Multiple semantic descriptors, such as subtlety, internal structure, calcification, sphericity, margin, lobulation, spiculation, texture, and malignancy score, were used to annotate pulmonary nodules of diameter ≥ 3. The annotations reflect important information not captured in the images and can be clinically significant, as well as important domain knowledge for multimodal learning.
Unlike most public datasets, which only have consensus labels, LIDC-IDRI also includes labels from multiple radiologists—each of which captures inter-observer variability—which enables more reliable and meaningful diagnostic models to be developed. The images are represented multimodally (volumetric CT), and the annotations are represented semantically (structured semantic), which is especially suitable for graph-guided multimodal learning, the focus of LIDC-IDRI.

3.3. Data Preprocessing

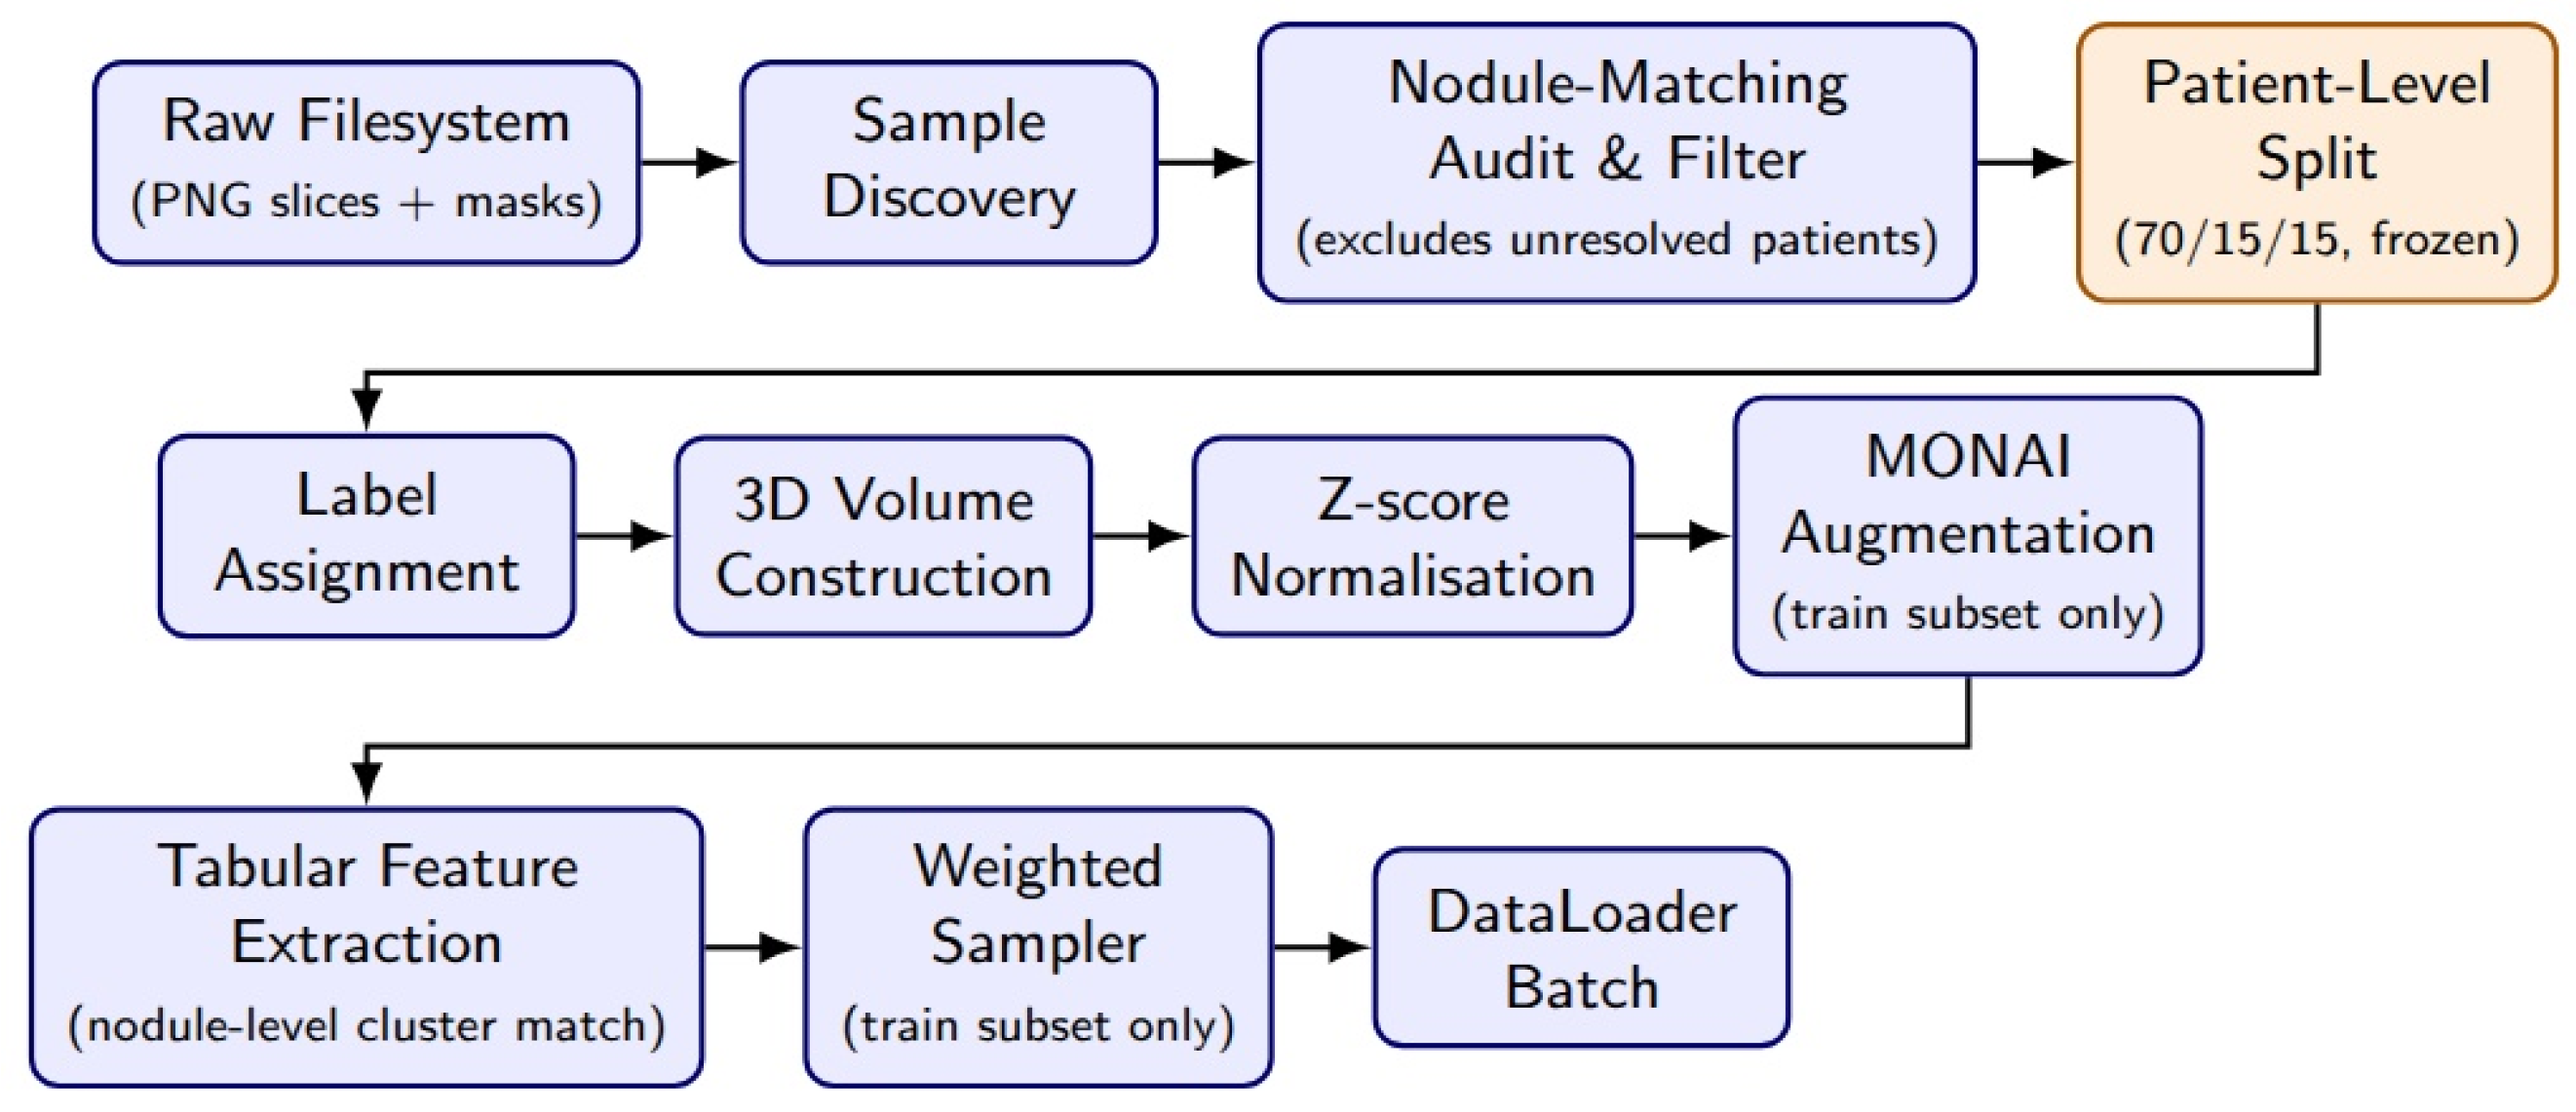
Figure 1 shows the overall preprocessing process. In the proposed framework, the heterogeneous data sources are handled separately, meaning the image and semantic modalities are each processed along their own pipeline before being fused. The primary purpose of this preprocessing stage was to ensure data consistency, minimize differences between samples, prevent information leakage, and enhance the model’s generalization ability.
We have followed the following preprocessing pipelines:
  • Reconciled loading of volumetric CT and semantic annotation by the radiologist.
  • Normalized the intensity distribution of images.
  • Built a volume of images from a series of X-ray CT images.
  • Multi-annotation as a single semantic feature vector for multiple training runs done by different radiologists.
  • Eliminating data leakage by doing patient-level partitioning.
  • Using only data augmentation for the training set.
  • Weighted random sampling and focal loss to tackle class imbalance.
This study used preprocessed grayscale PNG slices from the original CT scans, which were obtained and not directly preprocessed by any conventional CAD systems. Therefore, decoding the DICOM images, converting Hounsfield units, and extracting slices were not required. The first part of the preprocessing pipeline was designed to reduce computational work while preserving clinically relevant anatomical information, since the image volumes were already normalized.
The image and semantic modalities were then mapped to a common feature representation for the multimodal graph-based learning. The proposed R-GGFN framework adds complementary diagnostic information as an independent framework for each modality, removes redundancy, and optimizes feature fusion for graph representation learning.
  • Image Modality Preprocessing
The proposed approach is to process the 3D image of pulmonary nodules created from a series of 2D images acquired in a CT scan into a 3D branch image. All grayscale PNG slices of a nodule were loaded and stored simultaneously, preserving spatial continuity [34]. If slices were invalid or corrupted, they were automatically excluded from the data load. If no slices were valid, a 64 × 64 × 64 volume was created and set to zero, so the input remained uniform across all samples. To verify that this fallback did not introduce an artificial signal into the analytical sample, every nodule in the final training, validation, and test subsets was audited for this condition; zero of 2602 nodules (0.00%) triggered the all-zero fallback, indicating that a valid image series was available for every sample used in this study. Each volume was first normalized using z-score normalization (zero mean, unit variance) to reduce intensity differences across CT images from various CE studies [35]. This normalization will help minimize intensity differences across scanners and improve training stability. Later, a singleton channel dimension was added to create the 3D convolutional neural network’s format. Finally, to ensure the same input size for training, all image volumes were resampled to a common size of 64 × 64 × 64 voxels.

3.3.1. Data Augmentation

Only the training set was augmented online using the Medical Open Network for Artificial Intelligence (MONAI) framework [35] to improve the model’s generalization and reduce overfitting. The augmentation included random spatial flipping, Gaussian noise injection, and random rotations.
These changes result in a more diverse training set while maintaining the anatomical characteristics of pulmonary nodules. The model is thus more tolerant of variations in image acquisition, geometric orientation, and small intensity variations. The image dataset was not augmented on the validation dataset because augmentation could bias performance evaluation.

3.3.2. Tabular Modality Preprocessing

The proposed framework also includes semantic annotations in the form of structured data provided under the guidance of expert thoracic radiologists, in addition to volumetric CT images. The tabular part of the network uses eight radiologist-assigned semantic imaging annotations (subtlety, internal structure, calcification, sphericity, margin, lobulation, spiculation, and texture).
These descriptors are qualitative visual assessments recorded by the annotating radiologists as part of the LIDC-IDRI protocol. We refer to them throughout this manuscript as semantic imaging annotations rather than independent clinical data, since they are derived from the same imaging examination and the same reader panel as the reference-standard malignancy label (see Limitations for the discussion of the resulting incorporation-bias risk).
The malignancy of the radiologists was not included as an input feature because it was the ground-truth class label in this dataset for binary classification. Therefore, the model avoids information loss and does not learn meaningful semantic relationships between malignancy statuses.
Before training the model, we standardized all semantic features to make the feature distributions in each model as uniform as possible, better stabilizing the optimization process and improving multimodal feature fusion.

3.3.3. Cross-Radiologist Annotation Aggregation

For a given nodule, there may be multiple semantic descriptions in the LIDC-IDRI annotation set, since up to four radiologists could independently annotate a single nodule. To assign each nodule its own annotation set, rather than pooling all annotations available for a patient, we established nodule-level correspondence using PyLIDC’s spatial annotation-clustering utility (Scan.cluster_annotations), which groups annotations from different radiologists into per-nodule clusters based on the three-dimensional proximity of their centroids. Each cluster was matched to its corresponding nodule folder in the pre-extracted slice archive by depth-sorted index order, and this correspondence was validated for every patient by comparing the number of on-disk nodule folders against the number of PyLIDC-derived clusters for that patient. Of 875 audited patients, 867 (99.1%) showed an exact match between these two counts and were retained; the remaining 8 patients (0.9%), for whom PyLIDC clustering could not be unambiguously reconciled with the on-disk nodule count, were excluded from the analytical sample rather than matched by assumption, removing 28 nodules. Arithmetic mean values were computed across the annotations within each nodule’s own matched cluster, yielding a nodule-specific eight-feature semantic vector so that nodules belonging to the same patient receive distinct annotation vectors reflecting their individual radiological appearance rather than a shared patient-level average.
Similarly, the malignancy score (S) given by each radiologist, recorded on the LIDC-IDRI 1–5 ordinal rating scale, was also averaged to obtain a consensus estimate of malignancy. The average malignancy score of S ≥ 3 was considered malignant, and S < 3 was considered benign (this is a score threshold, not a size threshold; nodule size is a separate LIDC-IDRI inclusion criterion of ≥3 diameter, described above). We note that a mean score of exactly 3 falls on the indeterminate midpoint of the LIDC-IDRI malignancy scale rather than a clearly benign or malignant rating; such boundary cases were assigned to the malignant class following the threshold convention used in prior LIDC-IDRI classification studies [32,36], and this boundary-case handling is acknowledged as a source of label uncertainty in the Limitations. This consensus-based labeling strategy, consistent with previous LIDC-IDRI studies, provides the reference standard used for supervised learning in this work [32,36].

3.3.4. Patient-Level Dataset Partitioning

Instead of splitting at the nodule level, we split data at the patient level to prevent information leakage between correlated samples. We partitioned all 867 patients retained after nodule-level annotation matching once into training (606 patients, 1820 nodules; 70%), validation (130 patients, 356 nodules; 15%), and test (131 patients, 426 nodules; 15%) subsets. This partition was generated once, persisted with a content hash of its constituent patient-identifier lists (SHA-256: 085086144d7be461), and reused unchanged for every baseline and proposed model reported in this paper; the complete list of patient identifiers in each subset is provided in the Supplementary Material. The validation subset was used exclusively for checkpoint and epoch selection, architecture comparison, and decision-threshold calibration; the test subset was held out and evaluated exactly once, after every modeling decision had been finalized on the training and validation subsets, with performance on the test subset reported only in the Results.
This reduces the chance of overly optimistic performance results when using correlated samples, which are still from two subsets of CT scans but now from two different patients. Only training images were augmented, and deterministic preprocessing (normalization, resizing) was applied to the validation set images.

3.3.5. Class Imbalance Handling

The LIDC-IDRI dataset is unequally distributed between benign and malignant pulmonary nodules after processing (961 benign and 859 malignant nodules in the training subset). Extreme class imbalance can cause overfitting to the majority class and result in a deep learning model that may be less sensitive to malignant cases.
Two approaches were taken for this. To boost the chances of having examples from the minority class in mini-batches, the Weighted Random Sampler is used in generating mini-batches. Second, the proposed framework used an optimization objective similar to focal loss. Focal loss gives more importance to those difficult and misclassified samples and less importance to those that are easy to classify, as compared to the standard cross-entropy loss. This encourages the model to learn more discriminative representations of malignant nodules and reduces the misclassification error in imbalanced datasets.

4. Proposed Refined Graph-Guided Fusion Network (R-GGFN)

4.1. Overview of the Proposed Framework

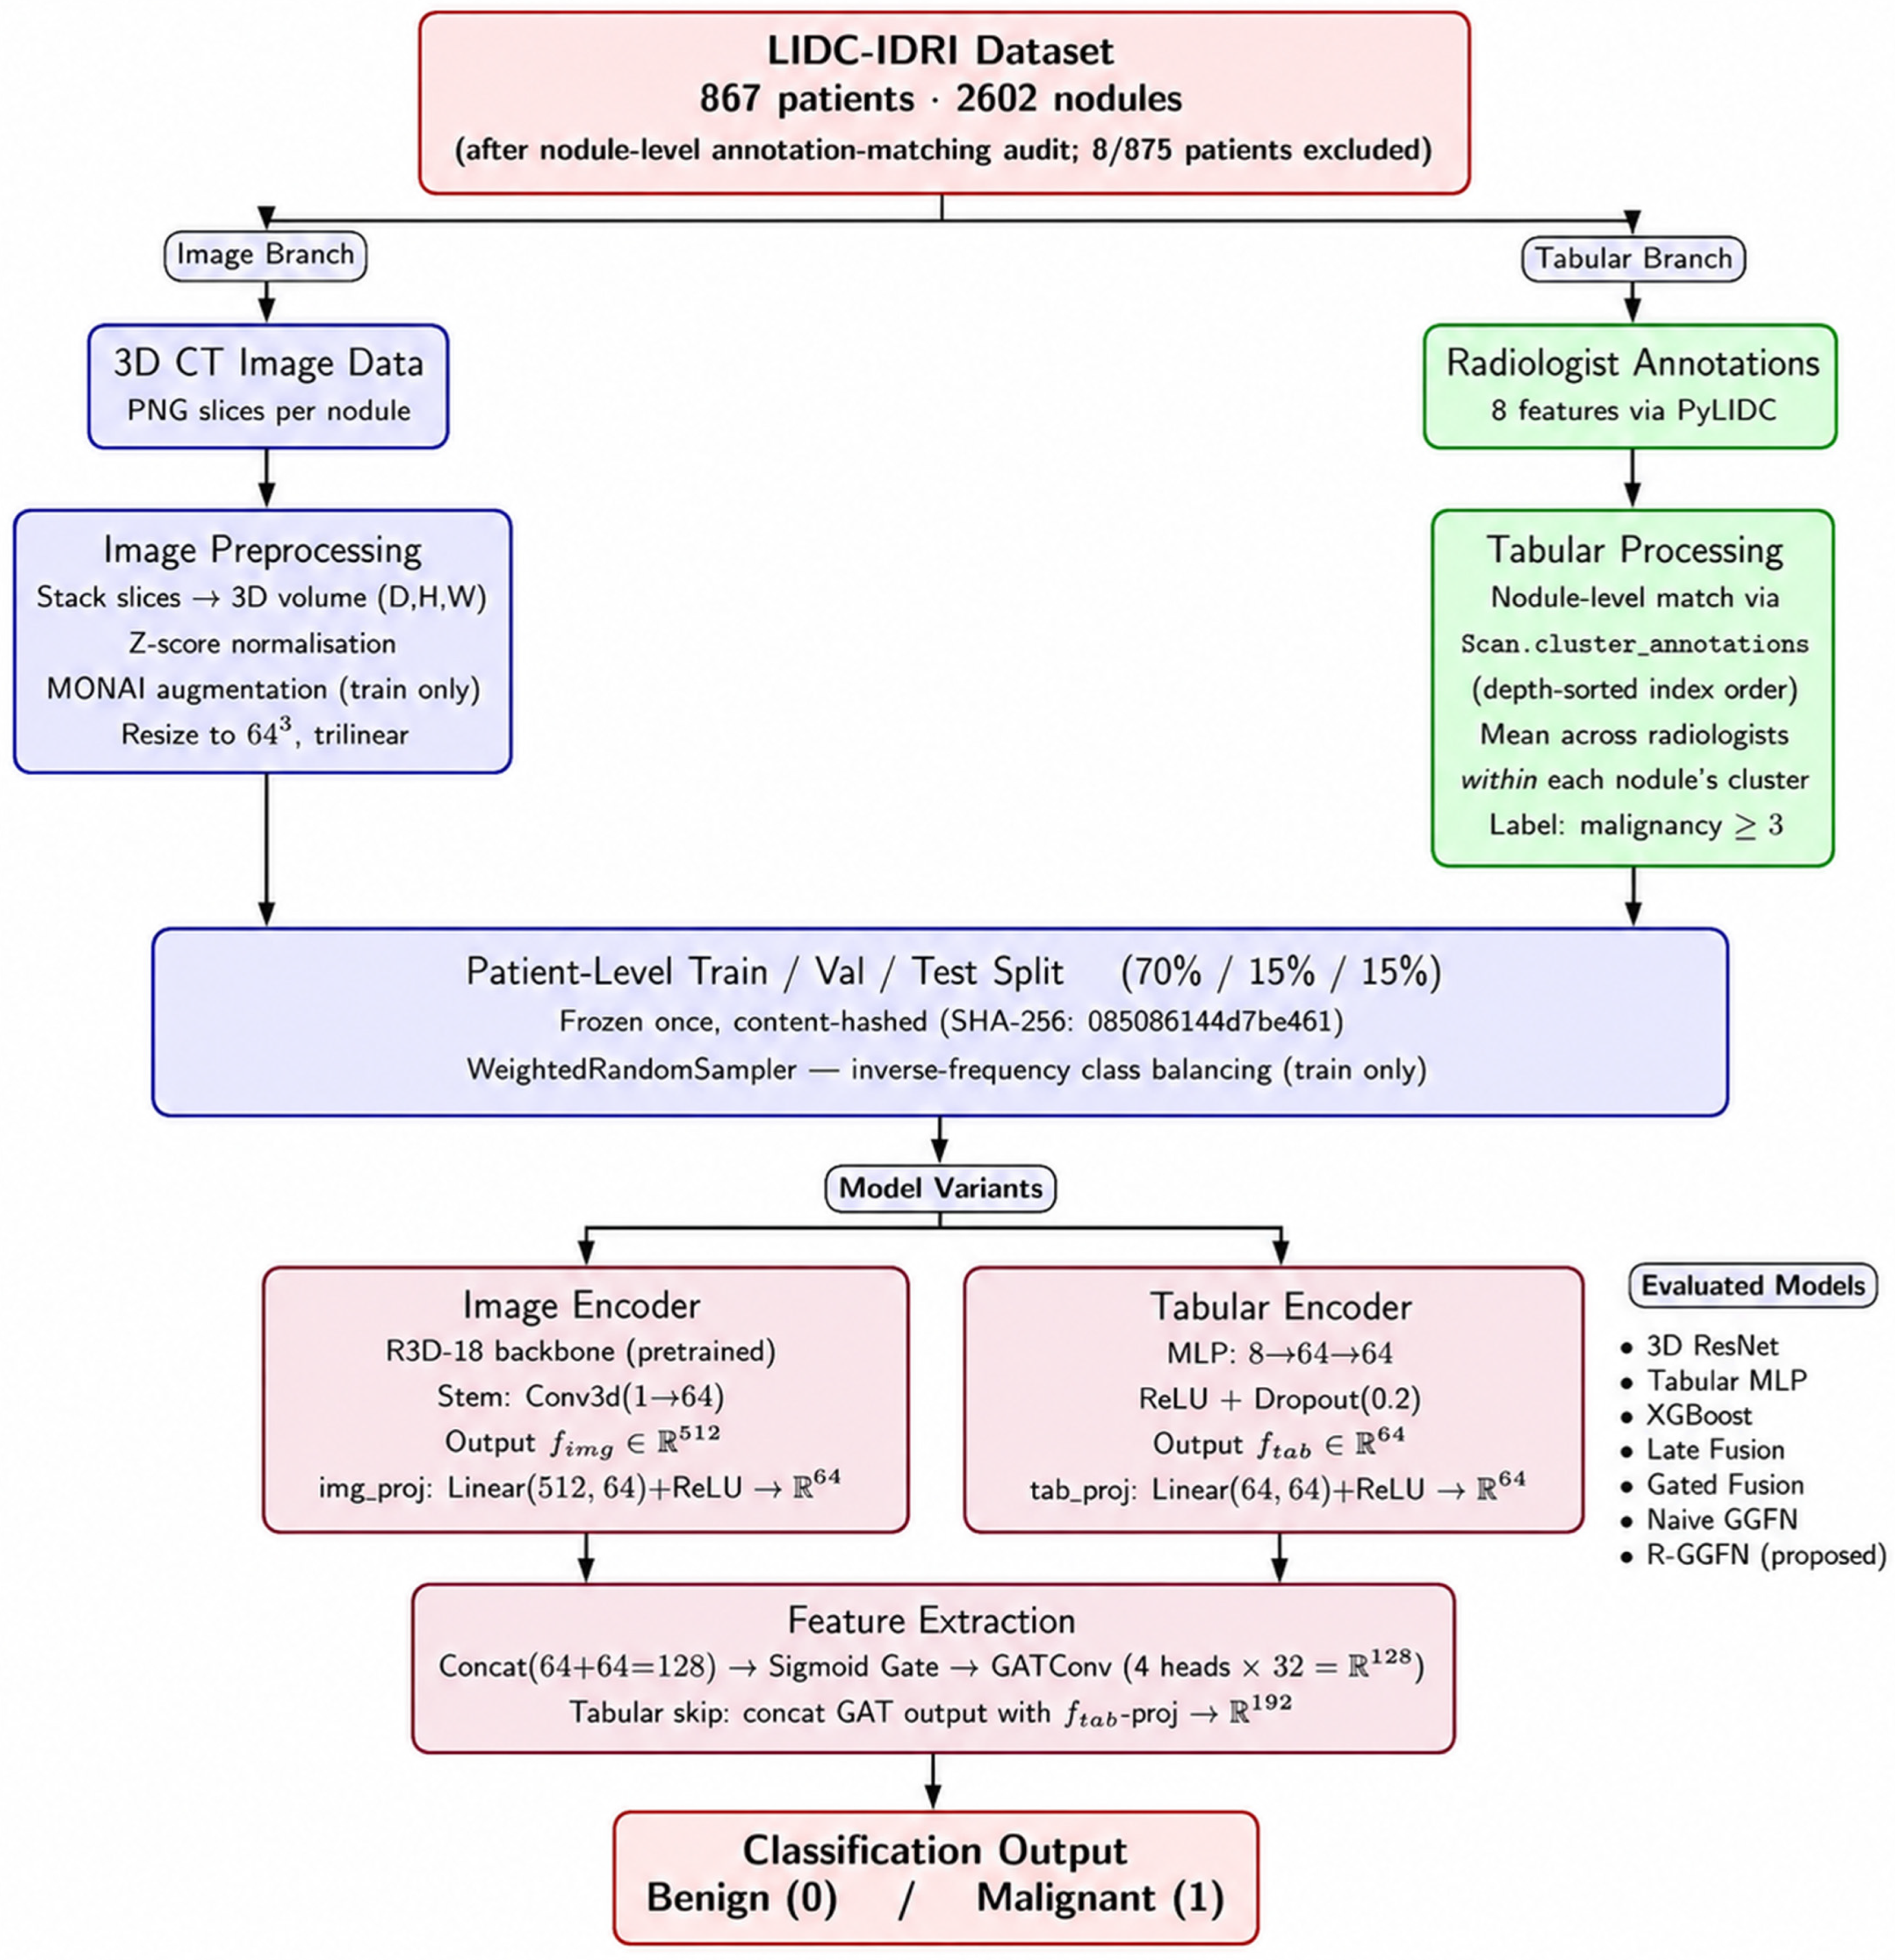
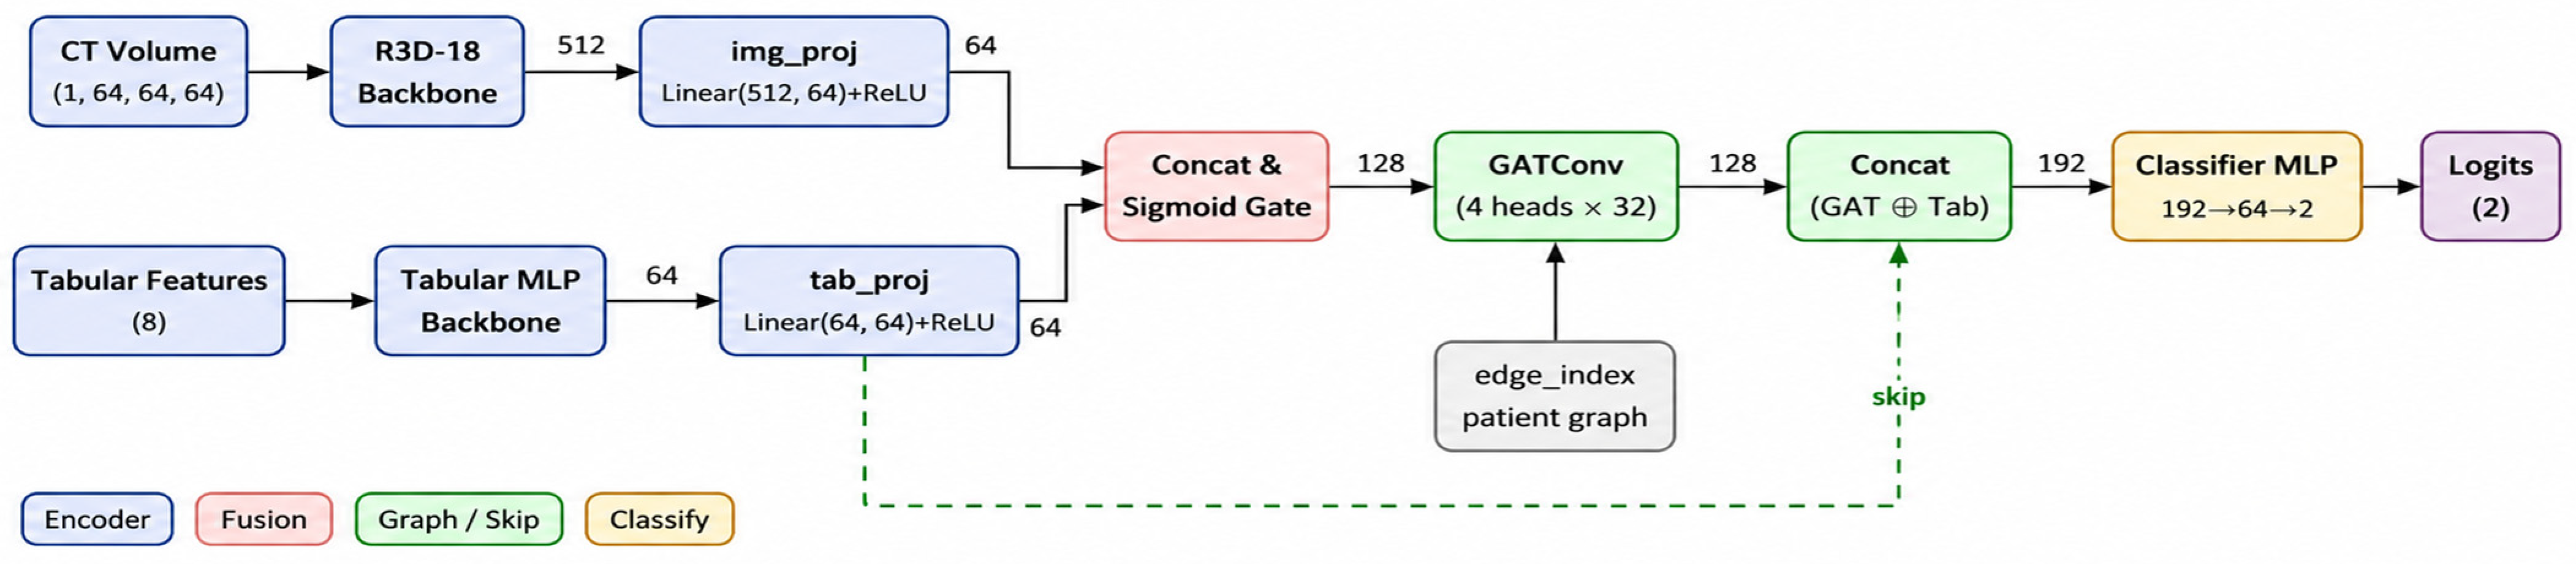
The proposed Refined Graph-Guided Fusion Network (R-GGFN) uses complementary information from volumetric CT images and radiologists’ semantic annotations on pulmonary nodule categories. The proposed framework combines multimodal representation learning and graph-based contextual reasoning with multi-level explainability, unlike traditional multimodal fusion techniques that only concatenate multiple modalities.
As illustrated in Figure 2, the framework consists of four major components:
  • A 3D ResNet-18 backbone for extracting volumetric image features.
  • A multilayer perceptron (MLP) for learning semantic representations from radiologist annotations.
  • A Graph Attention Network (GAT) that models contextual relationships among pulmonary nodules.
  • A refined classifier incorporating a tabular skip connection, enabling direct preservation of clinically meaningful semantic information throughout graph-based feature learning.
The overall architecture combines image characteristics, structured clinical knowledge, and graph-based contextual information into a unified representation for binary lung nodule classification.

4.2. Image Feature Extraction

Volumetric CT images were processed using a modified 3D ResNet-18 architecture [37,38]. Compared with conventional two-dimensional convolutional networks, the three-dimensional backbone learns spatial autocorrelation across adjacent CT slices and learns discriminative volumetric representations of pulmonary nodules.
Each normalized CT volume was passed through successive three-dimensional convolutional layers and residual blocks. Global average pooling then generated a compact, high-level feature vector representing the anatomical characteristics of each pulmonary nodule. These image embeddings served as the visual branch of the multimodal framework.

4.3. Semantic Feature Learning

Radiologist-derived semantic annotations provide clinically meaningful descriptors that imaging alone cannot directly infer. To capture these characteristics, we processed the eight semantic attributes using a multilayer perceptron with fully connected layers, Rectified Linear Unit (ReLU) activation functions, and dropout regularization, as shown in Figure 3. The MLP transforms the original low-dimensional semantic descriptors into a richer latent representation while suppressing redundant information. This learned embedding complements the volumetric image features and provides clinically interpretable information during multimodal fusion.
The proposed Refined Graph-Guided Fusion Network (R-GGFN) aims to leverage complementary information from volumetric CT images and radiologist-provided semantic information for pulmonary nodule classification. The proposed framework extends the multimodal fusion paradigm by adding multimodal representation learning, graph-based contextual reasoning, and multi-level explainability, which are not included in the multimodal fusion paradigm.

4.4. Multimodal Feature Fusion

To fuse image and semantic embeddings, we present a gated multimodal fusion mechanism. The gating network is not equally weighted; instead, the feature weights are learned adaptively during training.
The model, therefore, focuses on the modality that provides the most diagnostic information to screen each pulmonary nodule dynamically. The adaptive fusion strategy produces a more discriminative multimodal representation than traditional feature concatenation strategies.

4.5. Graph-Guided Contextual Learning

Current architectures are independent for each pulmonary nodule, while multimodal fusion can improve feature representation; however, relationships between pulmonary nodules from the same patient are not considered. To overcome this drawback, this work proposes a Graph Attention Network (GAT) [39] following the multimodal fusion, as shown in Figure 4. Each graph node corresponds to one pulmonary nodule. Within a training or evaluation batch, edges connect every pair of nodules belonging to the same patient, including a self-loop on each nodule; no edge connects nodules from different patients. A patient contributing a single nodule to a given batch is therefore represented by an isolated node with only a self-loop, and the graph attention layer reduces, for that node, to a learned linear projection of its own fused features with no neighboring context to aggregate. The number of nodes in a batch-level graph accordingly ranges from 1 (a solitary nodule) up to the largest number of nodules any one patient contributes; the median number of nodules per patient in the analytical sample is small, so single-nodule (self-loop-only) graphs are common. Edges are defined purely by shared patient identity and do not encode spatial proximity or feature similarity between nodules. The graph attention mechanism learns weights for neighboring nodes that are relevant to the context, so the network can consider the relevant context when aggregating nodes. GAT differs from conventional graph convolution in that it automatically calculates the influence of neighboring nodes using learnable attention coefficients. It incorporates complex relations between nodes into the framework and filters out unnecessary context information.

4.6. Tabular Skip Connection

The next step toward the proposed structure is to add a tabular skip connection, as shown in Figure 4. Graph propagation may lose clinically relevant semantic descriptors or corrupt them across multiple propagation steps. The information is then directly concatenated with the graph-enhanced representation before the final classifier to preserve it.
This skip connection enables the classifier to be utilized at the same time:
  • Graph-enhanced contextual features;
  • Original radiologist semantic information;
  • Multimodal image representations.
The model thus retains clinically relevant information while providing graph-based contextual reasoning that improves classification performance.

4.7. Model Optimization

The LIDC-IDRI dataset is imbalanced, with harder samples (malignant) receiving higher weight because a modified focal loss was used to optimize the proposed R-GGFN. The following strategies are implemented to achieve the following objectives: higher stability in optimization and better generalization of the model:
  • Adam optimizer;
  • Adaptive learning-rate scheduling (ReduceLROnPlateau);
  • Weight decay regularization;
  • Gradient clipping;
  • Early convergence monitoring.
The proposed optimizations aim to minimize overfitting, increase training stability during neural network training, and speed up training. To ensure a fair comparison across all evaluated models, a uniform training and model-selection protocol was adopted rather than uniform hyperparameters, since architecturally heterogeneous models, namely a shallow tabular MLP, a deep 3D convolutional backbone, and multimodal graph-attention fusion models, are not expected to share an optimal learning rate. Each unimodal baseline was trained for up to 10 epochs, with early stopping if validation PR-AUC failed to improve for four consecutive epochs, while each multimodal fusion model (Late Fusion, Gated Fusion, Naïve GGFN, and R-GGFN) was trained for a fixed 10 epochs, the same budget used throughout this line of work; this extended and equalized the previously disproportionate baseline training budget relative to the image-only 3D ResNet baseline (originally 2 epochs, now 10, matching the tabular baseline and the fusion models); the fusion models’ own 10-epoch training budget was not itself extended in this revision (see the Limitations discussion in the Conclusion). For the multimodal models, the pretrained R3D-18 image backbone and the randomly initialized fusion, graph-attention, and classifier layers were optimized with differential learning rates (1 × 10⁻⁵ for the pretrained backbone and 1 × 10⁻⁴ for all newly initialized layers; AdamW; weight decay 1 × 10⁻² for R-GGFN and 1 × 10⁻⁴ for the remaining fusion models) to avoid disrupting pretrained image features while still allowing the randomly initialized fusion components to learn within the fixed epoch budget. The image backbone’s batch-normalization affine parameters were not updated during backpropagation for the first two epochs of every model with an image branch, along with a one-epoch linear learning-rate warm-up, to prevent early-training instability; we monitored gradient norms throughout to confirm convergent, non-oscillatory training for every model. Model and epoch selection for every model, baseline and proposed alike, used a single pre-registered criterion, maximum validation PR-AUC, fixed in advance of training and applied identically without inspecting other epochs’ results before selection. The binary decision threshold for each trained model was likewise selected exclusively on the validation subset, using Youden’s J statistic, and this frozen threshold was then applied once to the held-out test subset; the test subset was not accessed for any other modeling decision.

4.8. Explainable Artificial Intelligence Techniques

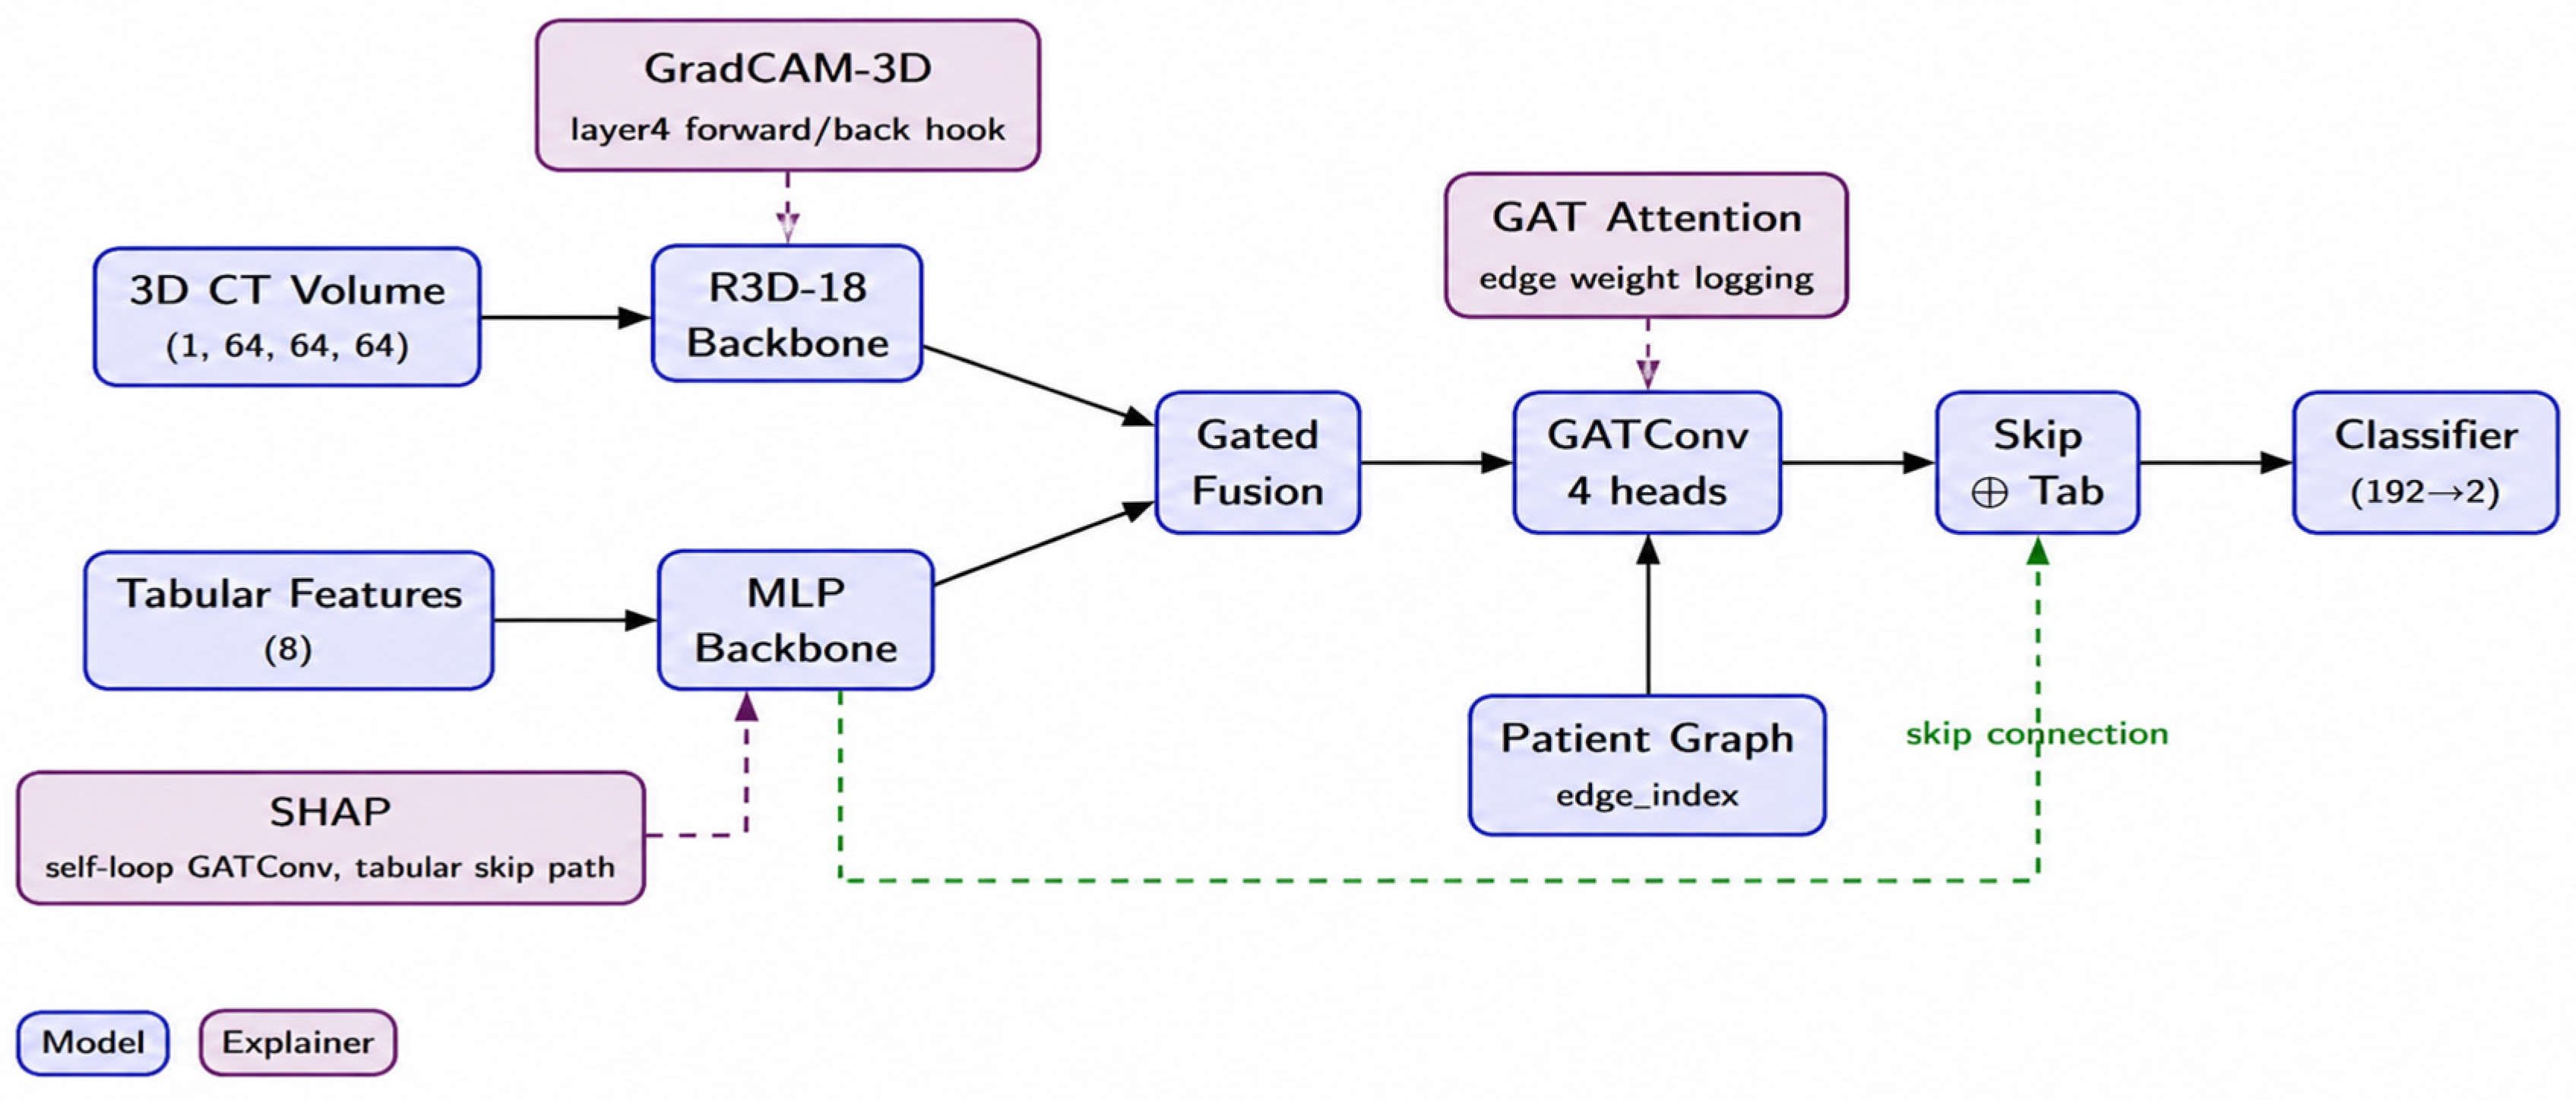
The deep learning models should be interpretable and transparent for clinical acceptance. Thus, within the proposed framework, three complementary techniques directly implement explainability, as shown in Figure 5.
The Grad-CAM [40] method was used to visualize discriminative regions in volumetric CT images that contributed to the final prediction.
SHAP [41] analysis was used to quantify each semantic feature, and the clinical significance of the radiologists’ annotations was interpreted.
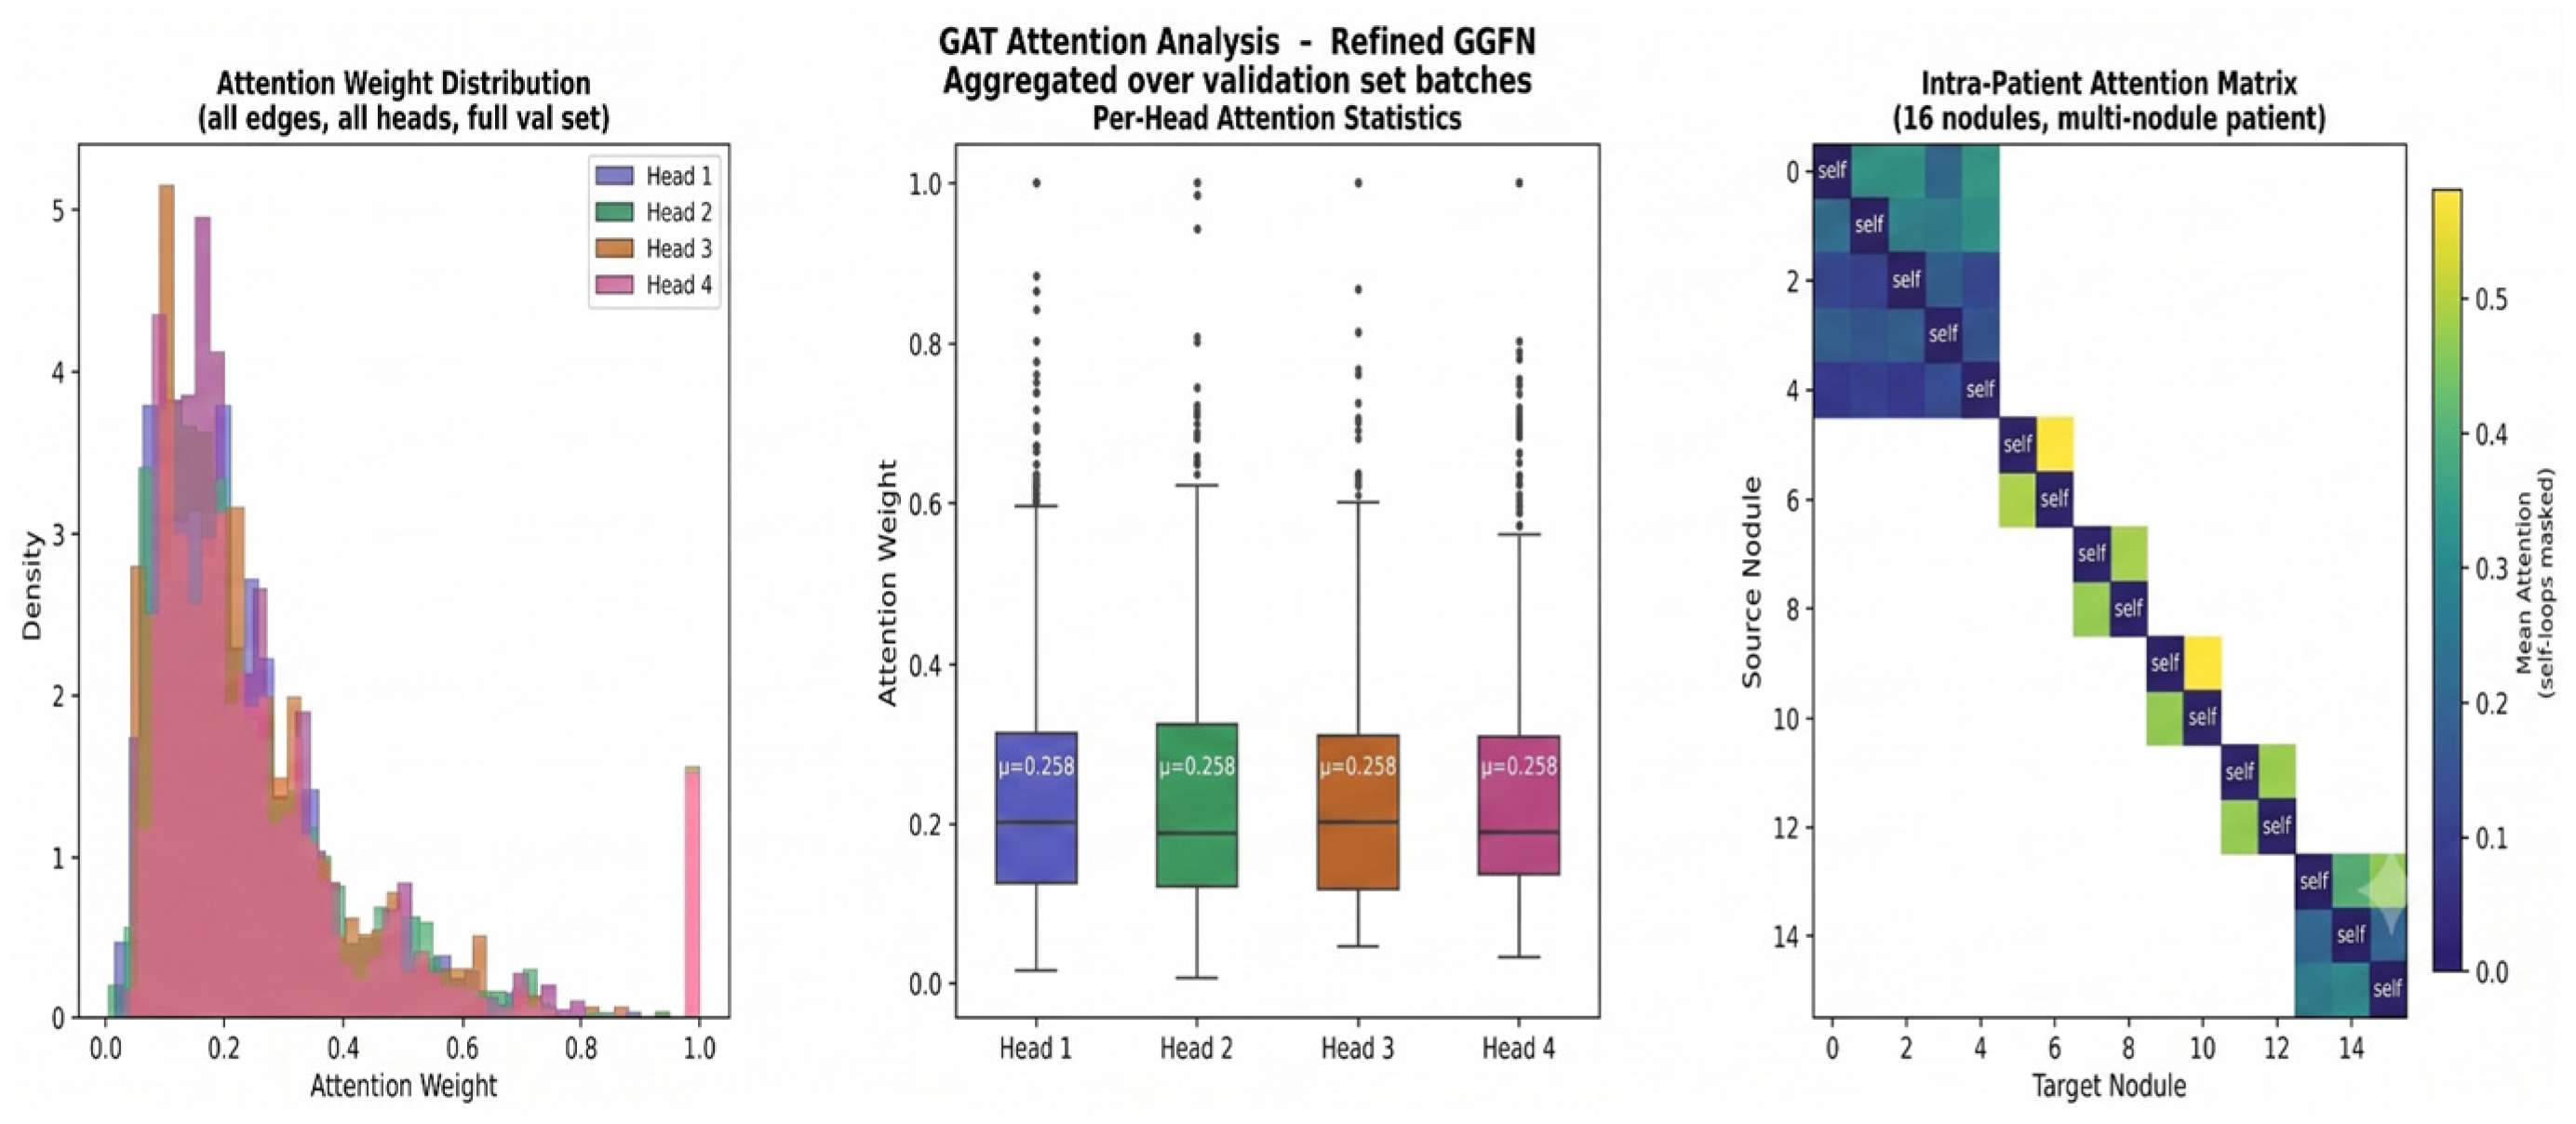
Lastly, the graph attention visualization showed the attention coefficients that the Graph Attention Network [42] learned, demonstrating how neighboring pulmonary nodules affected feature aggregation and classification. In addition, Figure 5 provides multi-level explanations at the image, feature, and graph levels, creating a complete picture of the model’s decision process and making it more transparent, reliable, and clinically applicable. Table 3 summarizes XAI techniques.

5. Experimental Results

This section presents the results of the proposed cancer classification framework. The goal of the study was to review and integrate information, including clinical images and clinical information in tabular form, to classify accurately. We used standard classification metrics to assess the model’s performance. The following subsections discuss each model’s performance.

5.1. Baseline Model Performance Result

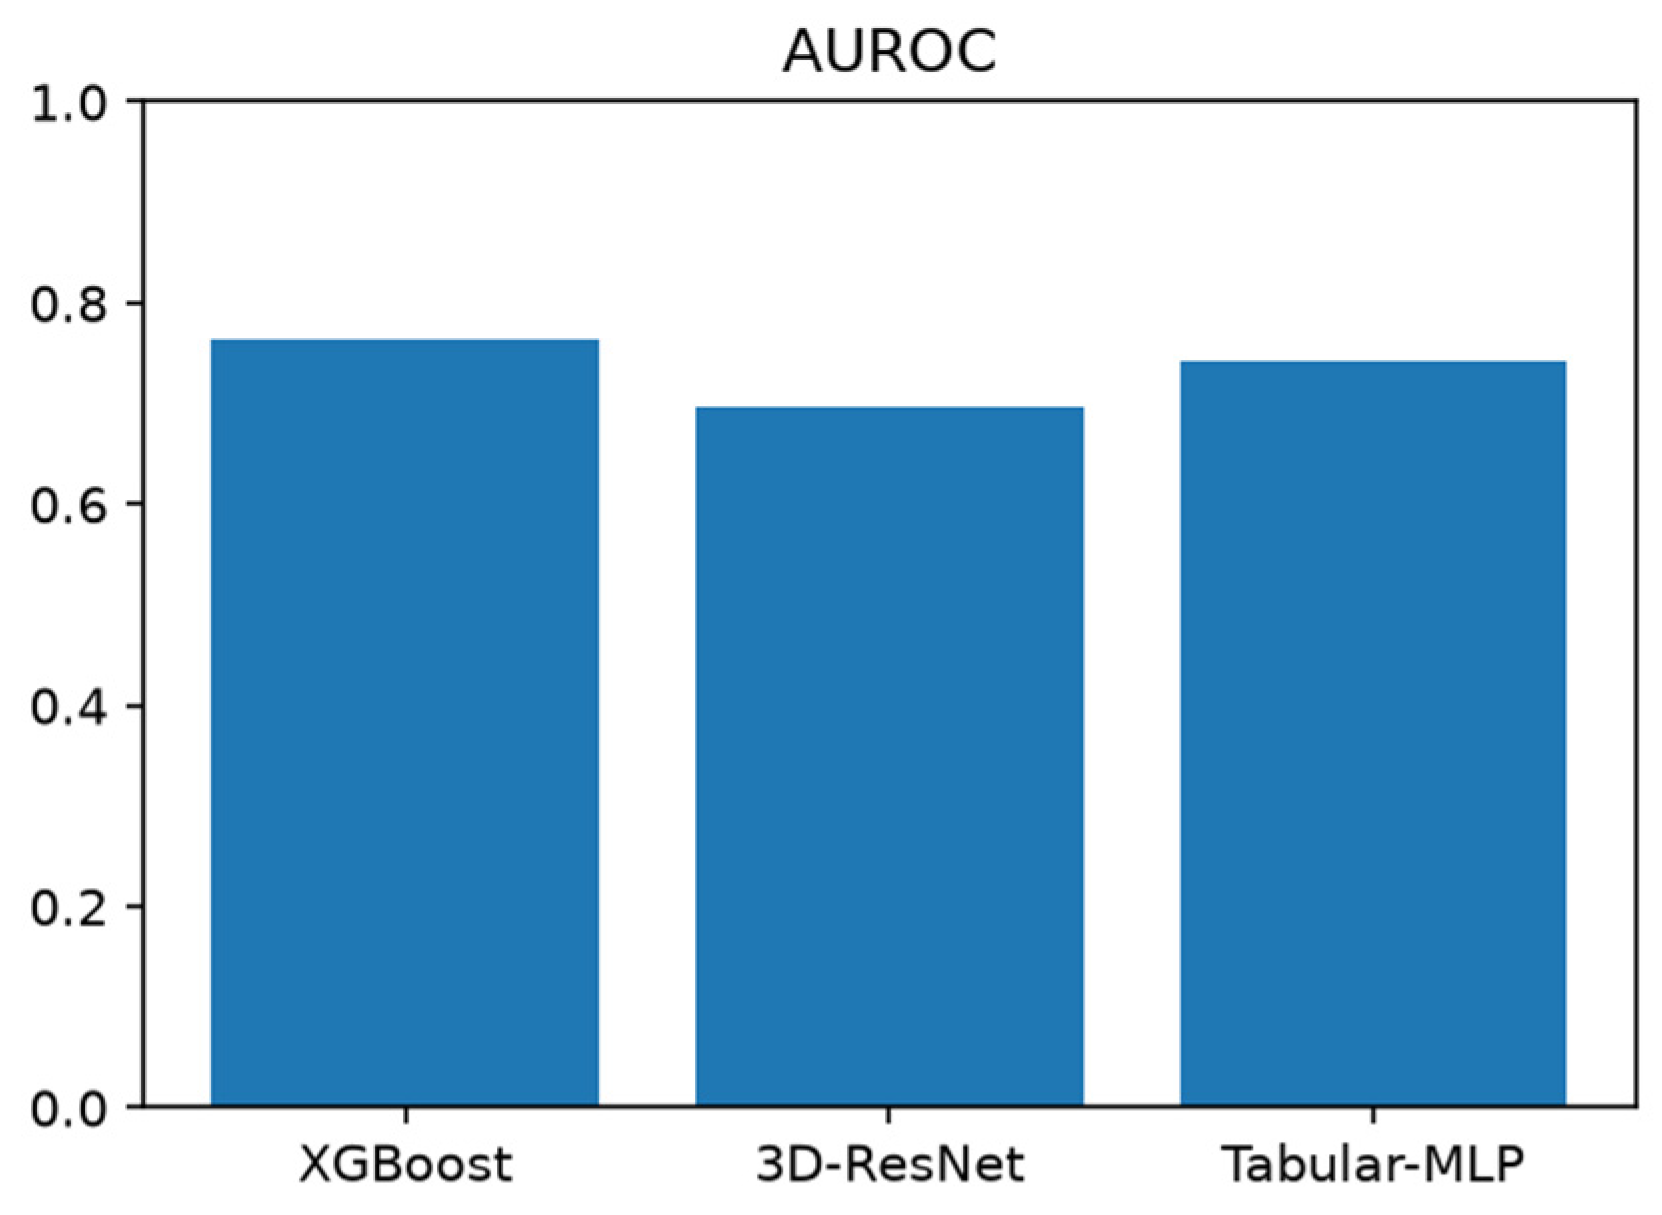
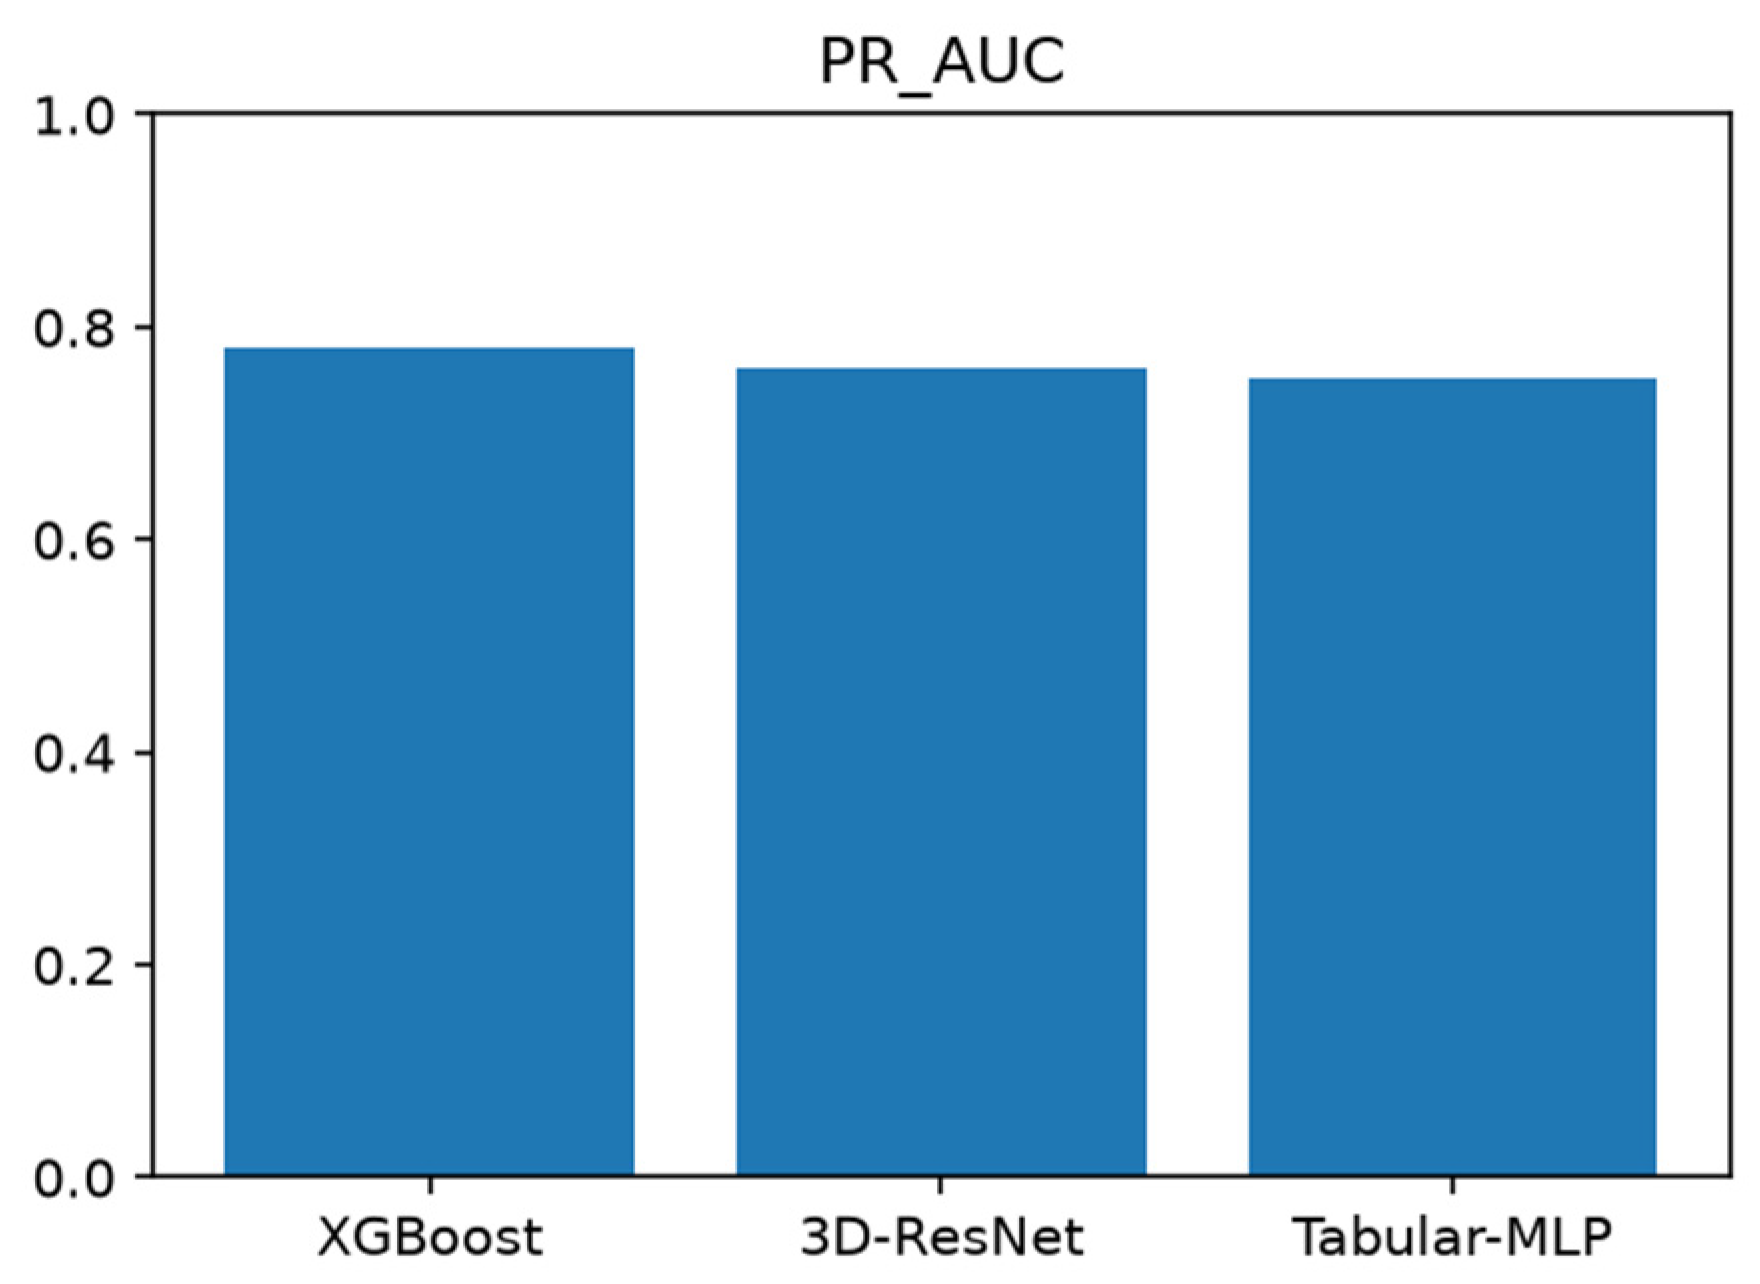
Table 4 reports the final held-out test-set metrics for all three baseline models, each trained under the fair, extended epoch budget and the pre-registered checkpoint-selection criterion described in Section 4.7. Tabular MLP achieved the highest accuracy among the three baselines, with XGBoost [43] close behind and the 3D ResNet performing comparatively worse; Figure 6 and Figure 7 discuss this pattern and a possible explanation for it in more detail.
Figure 6 shows the Area Under the Receiver Operating Characteristic Curve (AUROC) of three baseline models: XGBoost, 3D ResNet, and Tabular MLP. This section explains the results. XGBoost obtained the highest AUROC of the three baselines, at about 0.76, indicating that gradient boosting over the eight radiologist-assigned semantic features discriminates well between benign and malignant nodules. The Tabular MLP model followed closely with an AUROC of about 0.74 on the same tabular features, confirming that the neural network is nearly as effective as the tree-based model at this task. The 3D ResNet had the lowest AUROC of the three, at about 0.70, still clearly above the random-classification line but behind both tabular models. This is consistent with volumetric feature learning from a comparatively small number of CT scans being a harder task than learning from compact, radiologist-curated semantic descriptors, even under the fair, extended training budget now used for every baseline (Section 4.7).
Figure 7 compares the Precision–Recall Area Under the Curve (PR-AUC) of three baseline models (XGBoost, 3D ResNet, Tabular MLP). The XGBoost model achieved the best precision and Recall, with a PR-AUC of ~0.78, demonstrating the effectiveness of the tree-based model in leveraging the tabular features provided by the radiologists to detect malignant nodules with minimal false alarms and missed detections. The 3D ResNet achieved a PR-AUC of approximately 0.76, slightly lower than XGBoost, but still produced reasonably precise predictions when the decision threshold was tuned on the validation set. Although the Tabular MLP model had a different Precision–Recall balance at the chosen threshold, it still achieved a PR-AUC of approximately 0.75, which was the lowest of the three and slightly worse than the other two baselines.

5.2. Multimodal Fusion Results (Late Fusion and Gated Fusion)

We trained the two multimodal models for a fixed 10 epochs (Section 4.7). Table 5 below lists the peak validation metrics obtained per epoch. Compared with the 3D ResNet baseline, both models significantly outperformed it in accuracy and showed strong discriminative power (AUROC scores), with performance close to XGBoost.
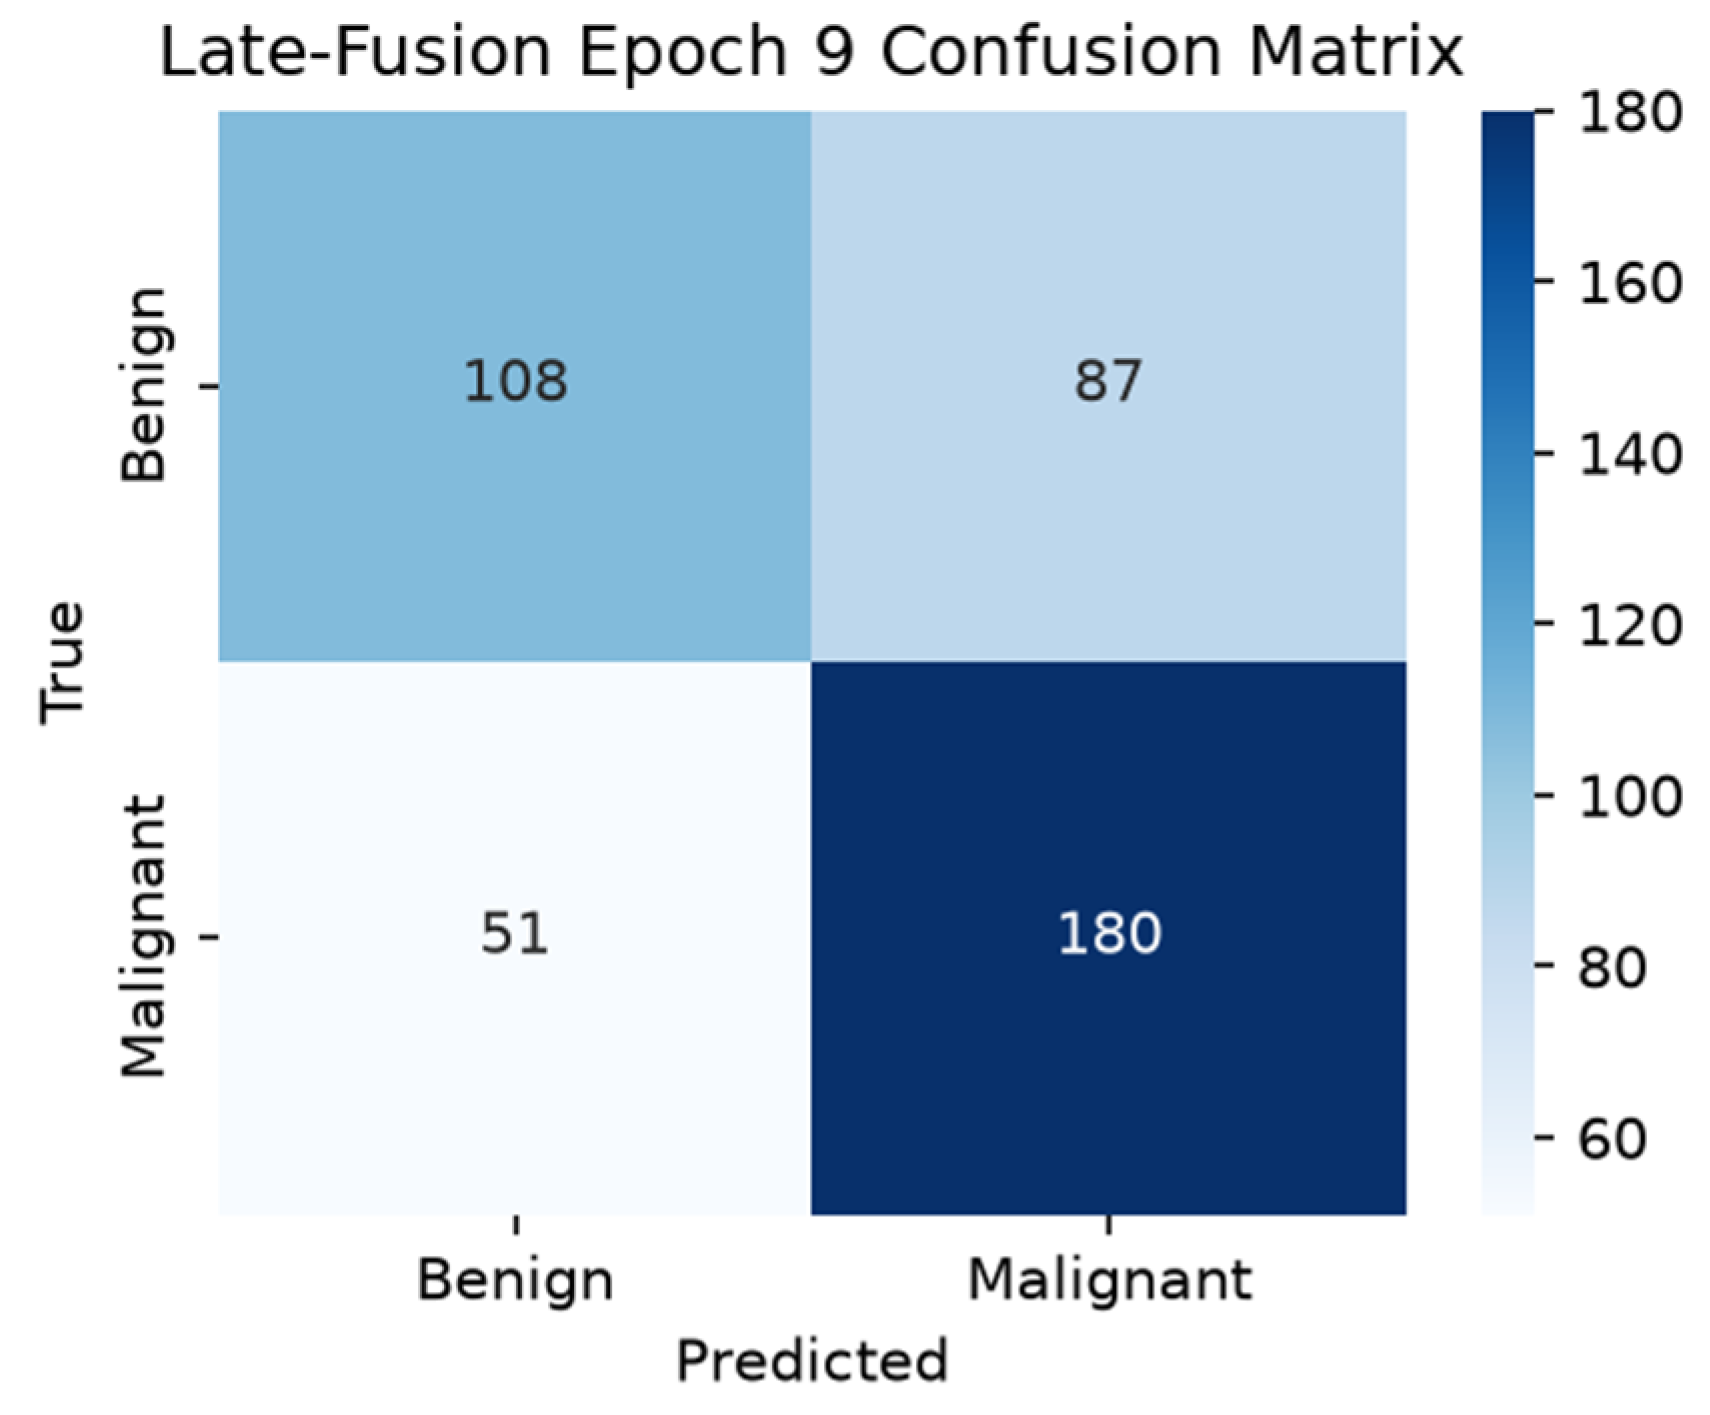
Table 5 shows the overall accuracy of the Lung Cancer Classification model using Late Fusion. The best epoch for the model was epoch 9, selected by the pre-registered maximum-validation-PR-AUC criterion. On the held-out test set, accuracy was 67.61% (correctly classifying just over two-thirds of the lung nodules). F1-score = 0.7229, indicating a reasonable balance of Precision and Recall. The model’s AUROC was 0.7427, indicating moderate performance across classification thresholds. The PR-AUC value is reasonable for identifying malignant cases (PR-AUC 0.7688), particularly given the class imbalance. Finally, the model performed well in detecting malignant nodules, achieving a malignant-class Recall (sensitivity) of 0.7792. Overall, the results show the efficacy of the image and tabular features and the reliable classification results throughout the process, according to the Late Fusion model.

5.2.1. Late Fusion

Based on the confusion matrix in Figure 8, the Late Fusion approach provided an AUROC of 0.7427 and PR-AUC of 0.7688 on the held-out test set (Table 5), indicating that the combination of CT image and radiologist annotations improves classification relative to the purely image-based baseline, with a favorable classification pattern for malignant nodules.

5.2.2. Gated Fusion

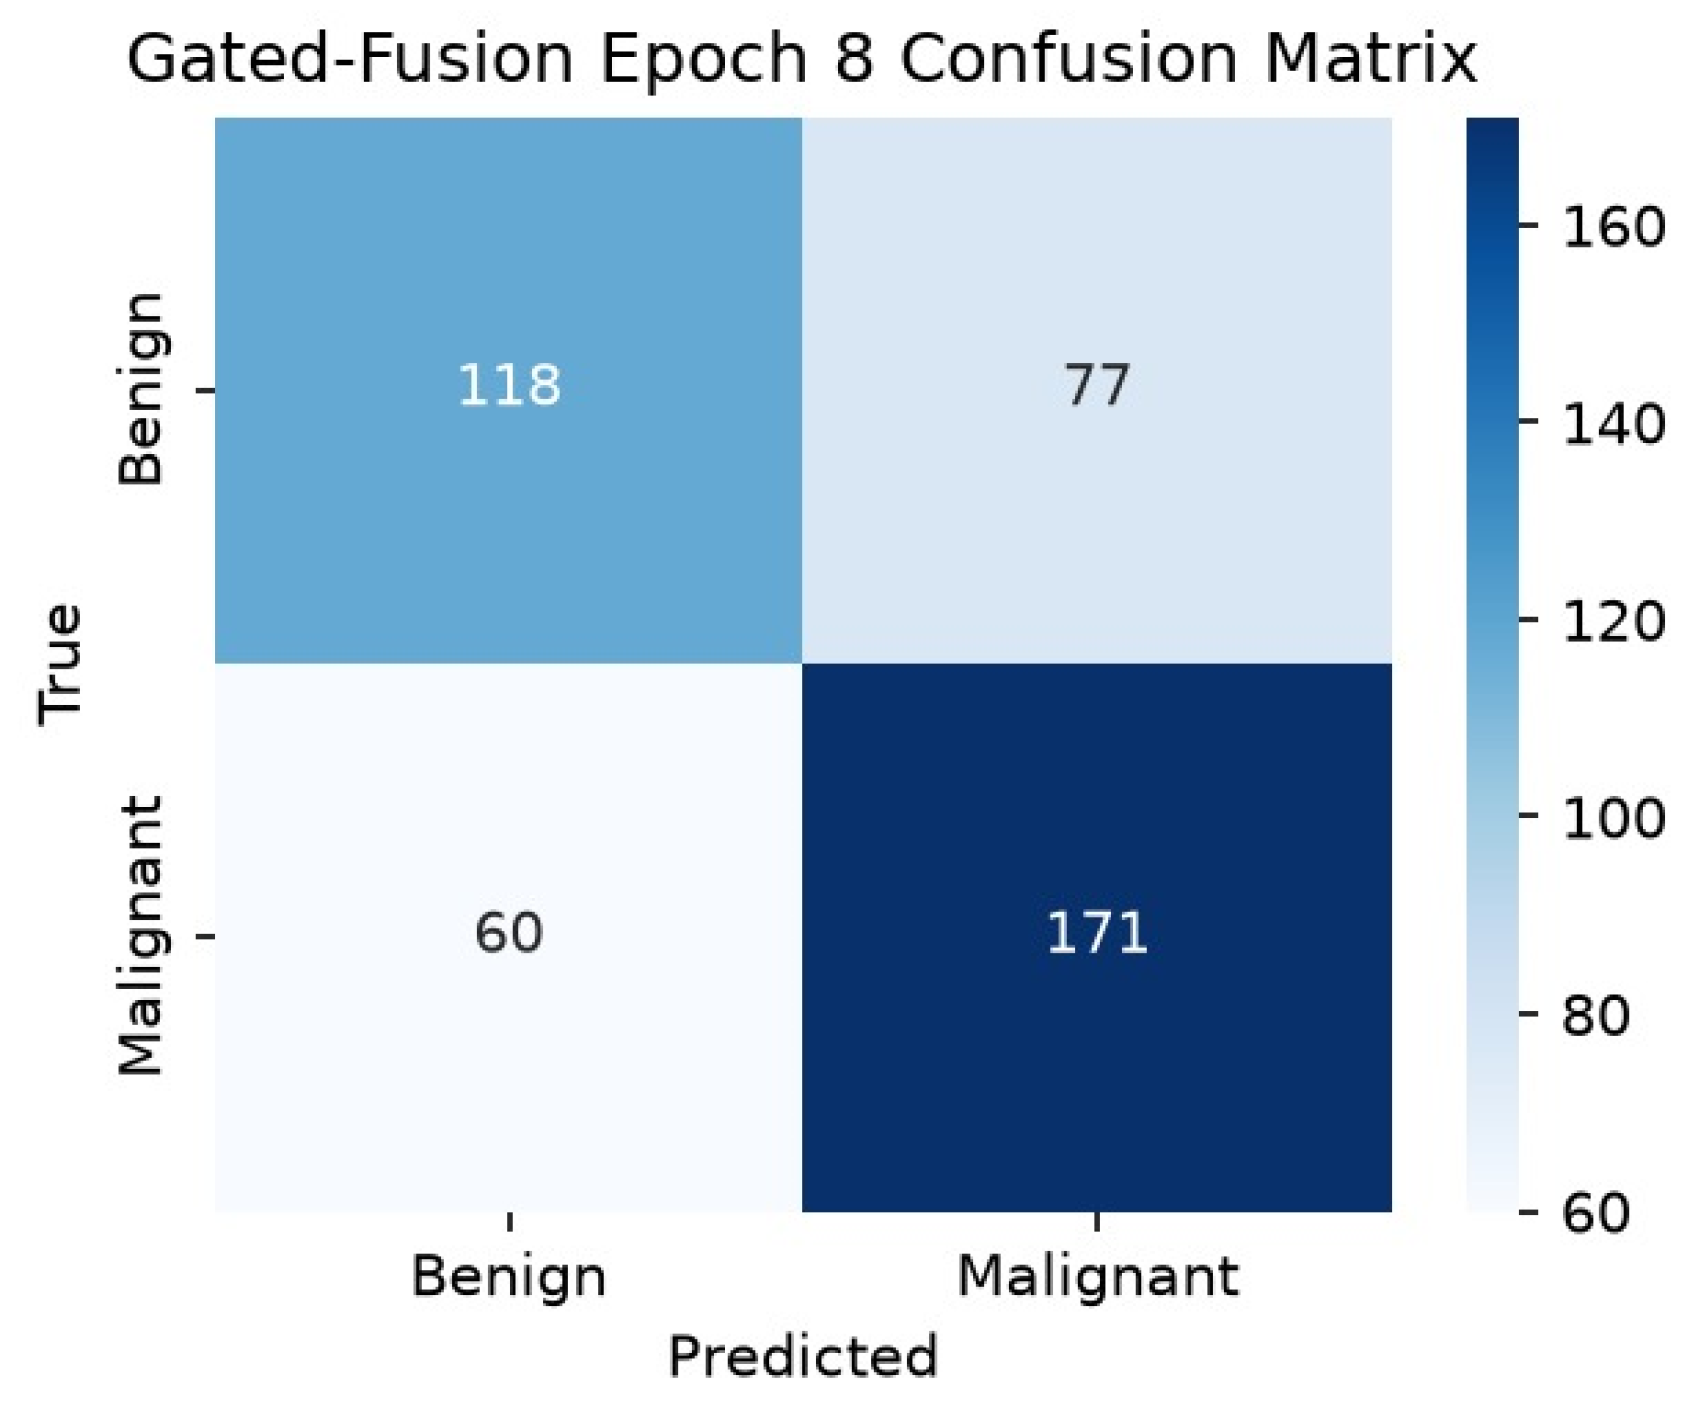
Figure 9 illustrates the performance of the Gated Fusion model, and Table 5 summarizes it. The model achieved an accuracy of 67.84%, an AUROC of 0.7457, a PR-AUC of 0.7720, and an F1-score of 0.7140, an improvement over the unimodal image-only baseline, though not over the strongest tabular-only baseline on every metric. These values are now reported identically here and in Table 5, resolving the discrepancy between the two presented in an earlier draft. The confusion matrix indicates that most benign and malignant nodules were correctly classified, although a moderate number of false-positive and false-negative predictions remain.
The Gated Fusion model delivered a modest improvement across all assessment metrics. Results indicate that the learnable gating mechanism adaptively weights image and semantic features, rather than fusing them equally.
Consequently, the model learns a more discriminative multimodal representation that better captures complementary diagnostic information from CT images and radiologist annotations. However, although there were some improvements, Gated Fusion does not consider the contextual relationships between nodules and processes each pulmonary nodule individually. Consequently, this architecture cannot capture interdependencies among nodules that may be used for diagnosis. This is clearly seen in the lower results of Gated Fusion compared with the proposed Refined Graph-Guided Fusion Network (R-GGFN), which uses graph attention to learn contextual information while aggregating features. In summary, the Gated Fusion model shows that adaptive multimodal feature weighting provides better classification results than standard feature concatenation. However, the results show that graph-based contextual learning and preserving semantic information using the tabular skip connection are required for further improvements.

5.3. Naïve GGFN Training Results

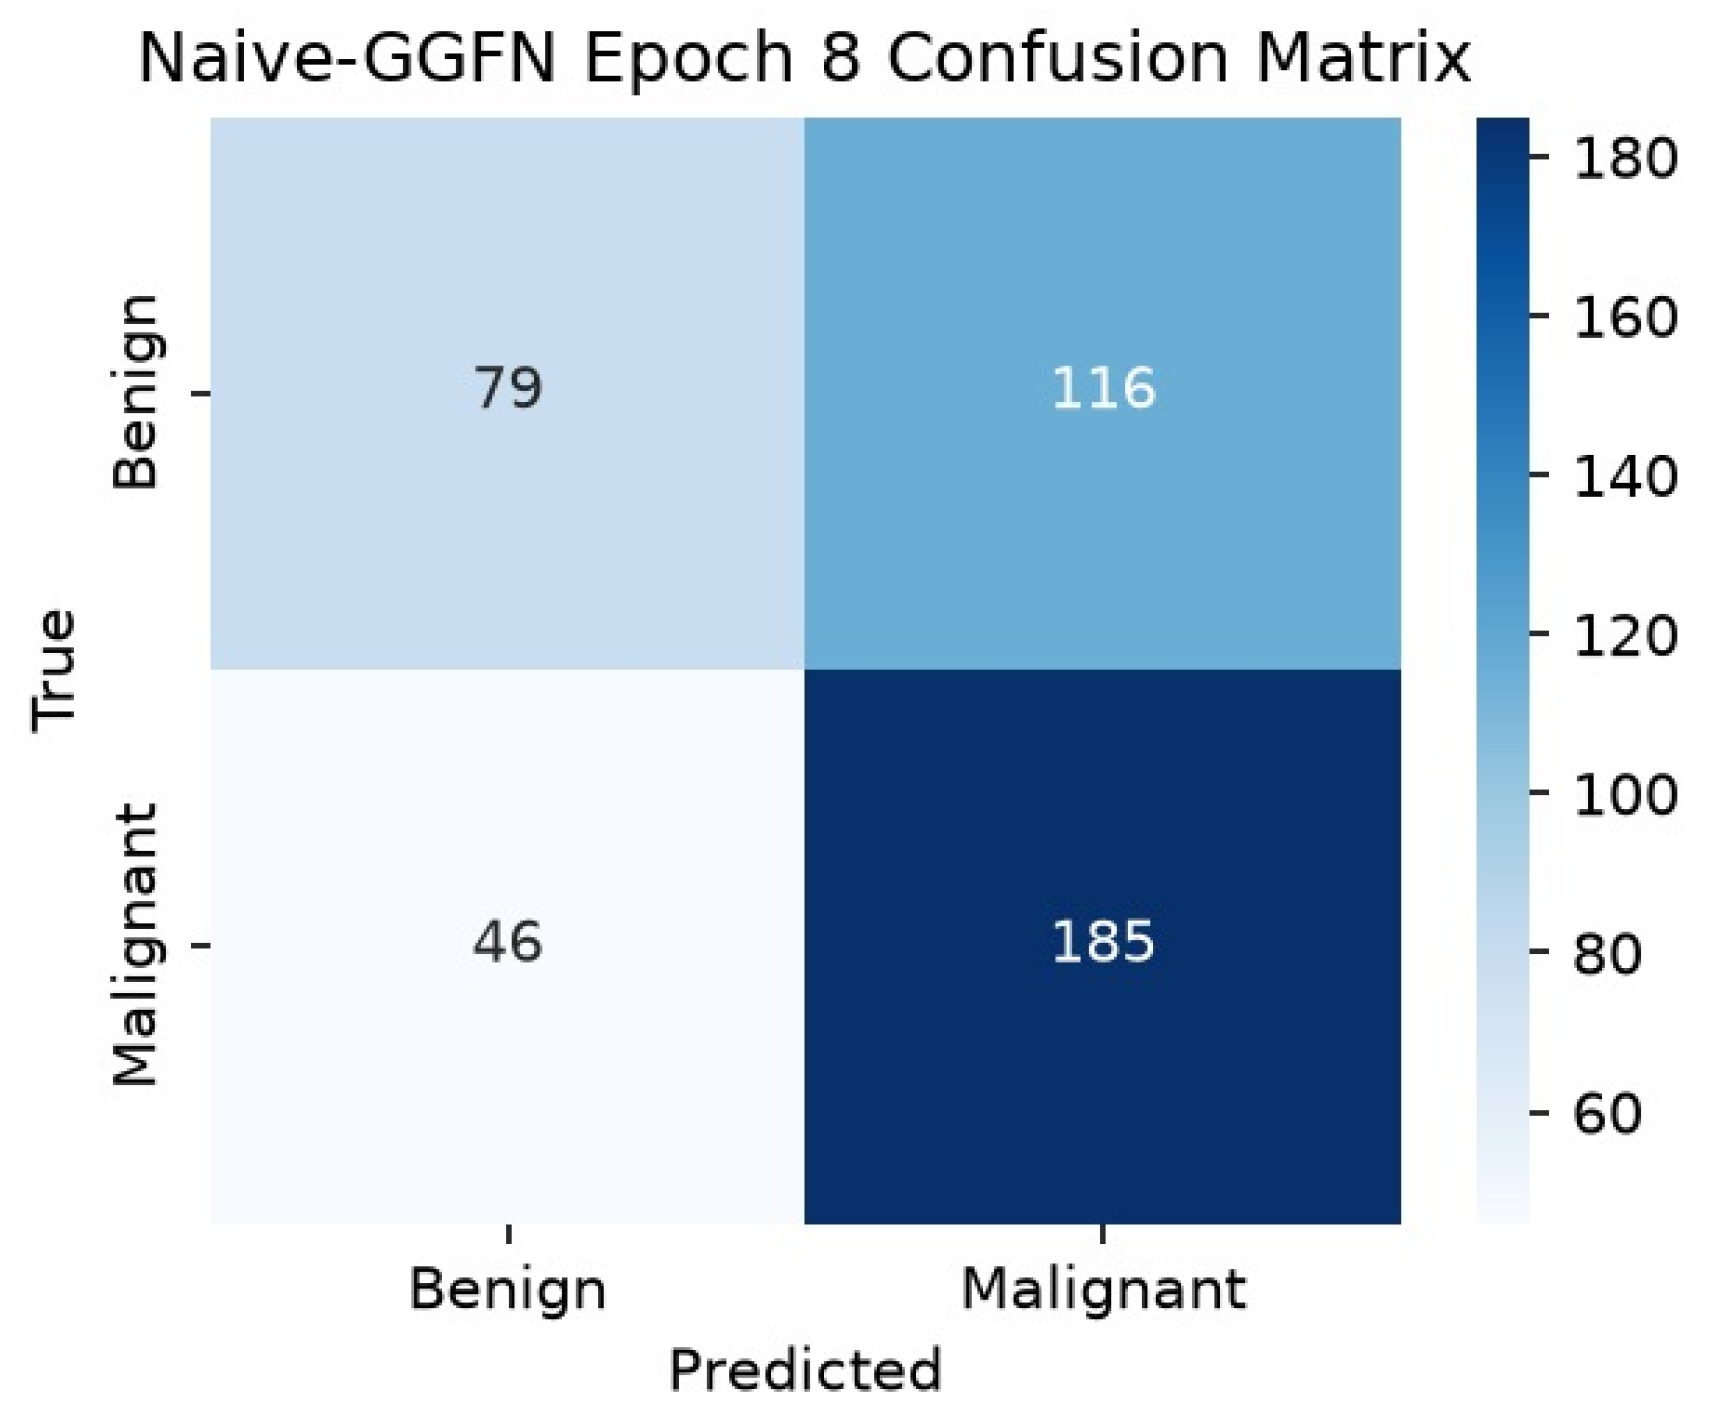
Table 6 shows that performance validation fluctuated across training epochs. Sensitivity was highest at epoch 10 (86.14%) at the cost of specificity (47.89%). In comparison, epochs 1 and 2 nominally reached 100% sensitivity only by predicting nearly every sample as malignant (specificity 3.68% and 1.58%, respectively), which does not indicate genuine discriminative performance. Applying the single pre-registered maximum-validation-PR-AUC selection criterion described in Section 4.7, fixed in advance and applied without inspecting other epochs’ results before selection, epoch 8 was selected as the final checkpoint (accuracy 66.29%, Precision 60.27%, Recall 81.33%, F1-score 69.23%, specificity 53.16%, AUROC 0.7597, PR-AUC 0.7265). Because this criterion is applied identically to every model reported in this paper, it is deliberately unaffected by any individual epoch’s apparent sensitivity-specificity balance.
The confusion matrix of Naïve GGFN is shown in Figure 10.
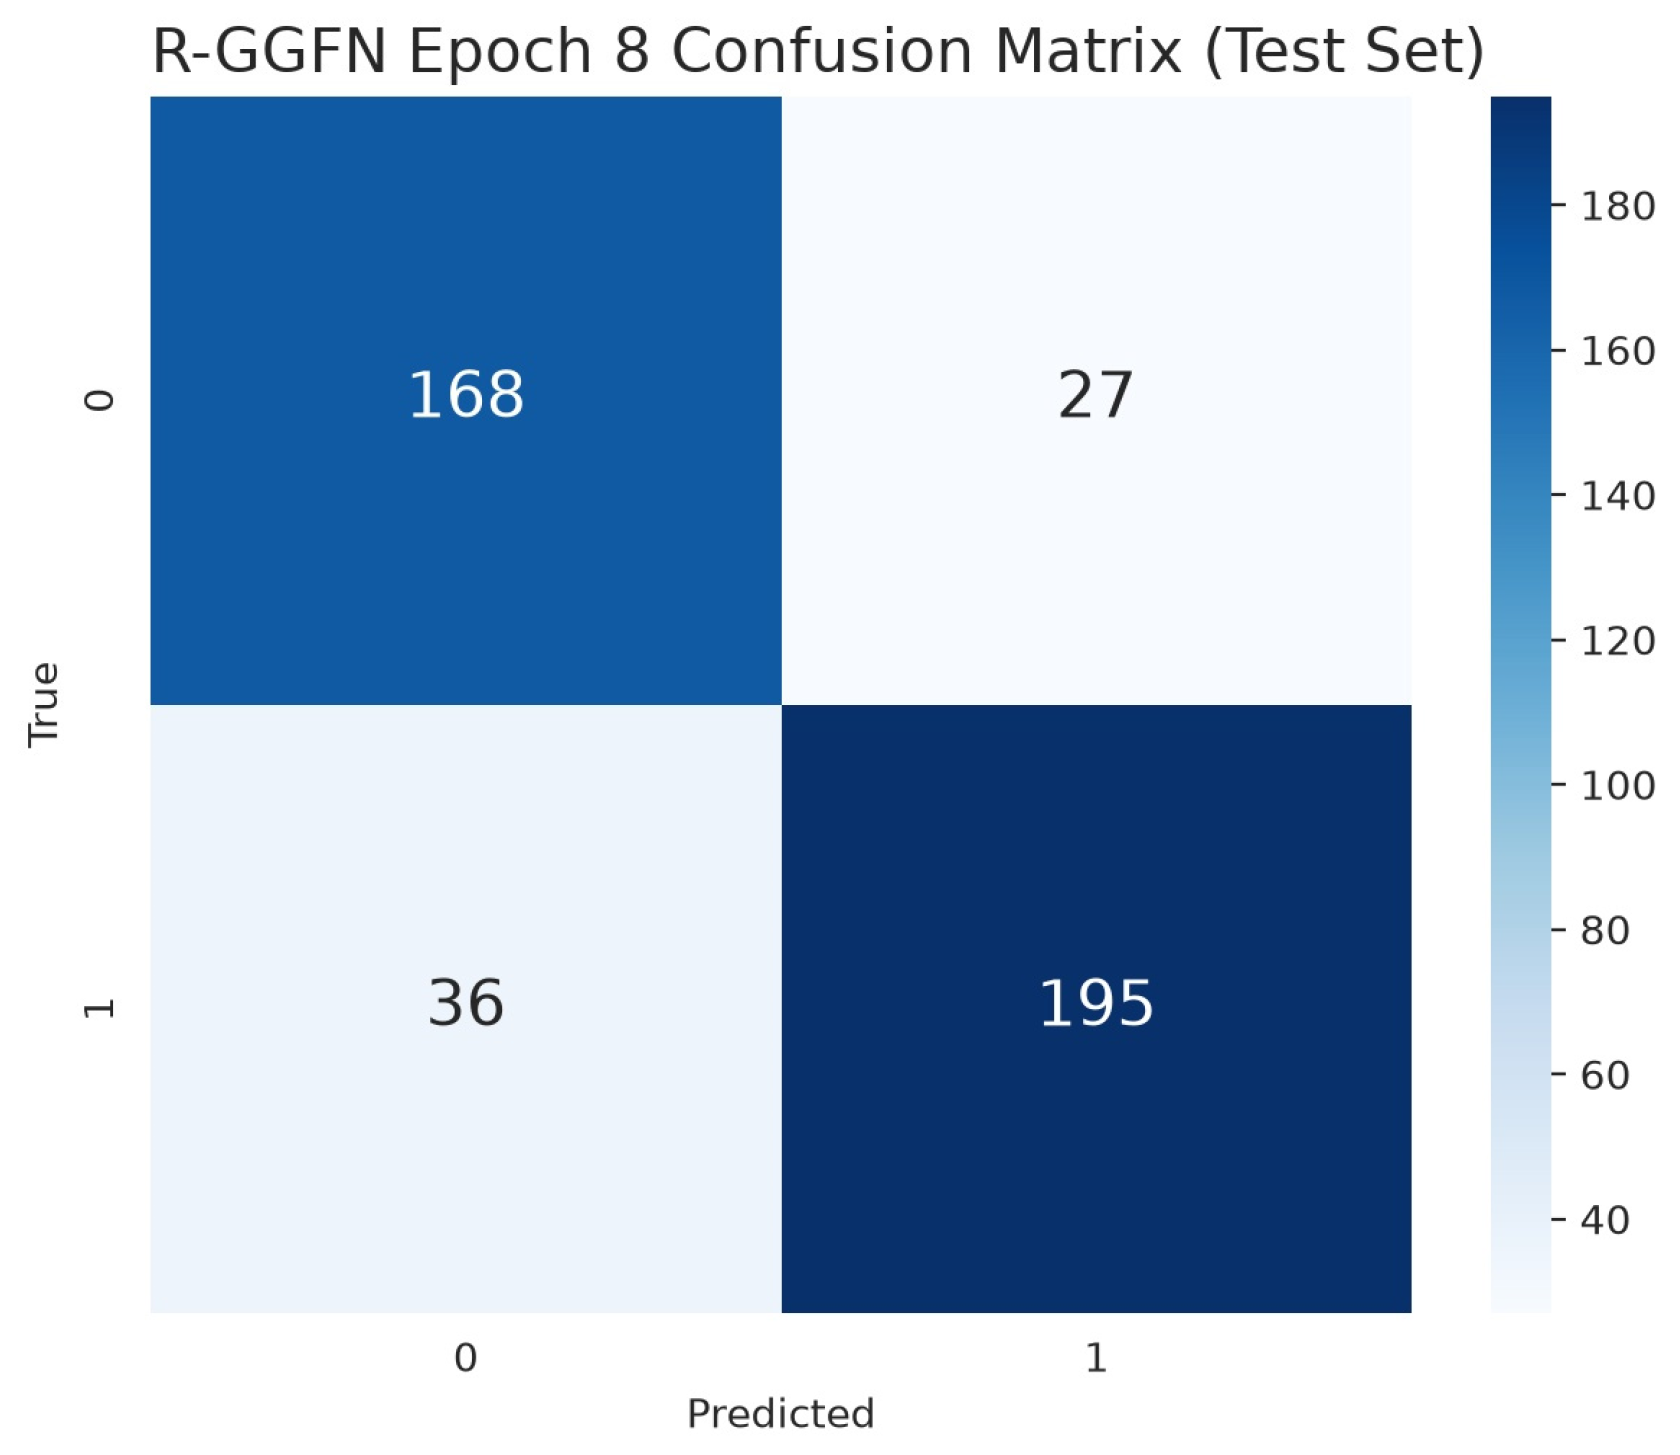
The proposed R-GGFN is trained for a fixed 10 epochs (Section 4.7). Figure 11 shows its confusion matrix on the held-out test set. On the held-out test set, the proposed R-GGFN achieved AUROC: 0.9147; PR-AUC: 0.9213; accuracy: 85.21%; and F1-score: 0.8609.

5.4. R-GGFN Result

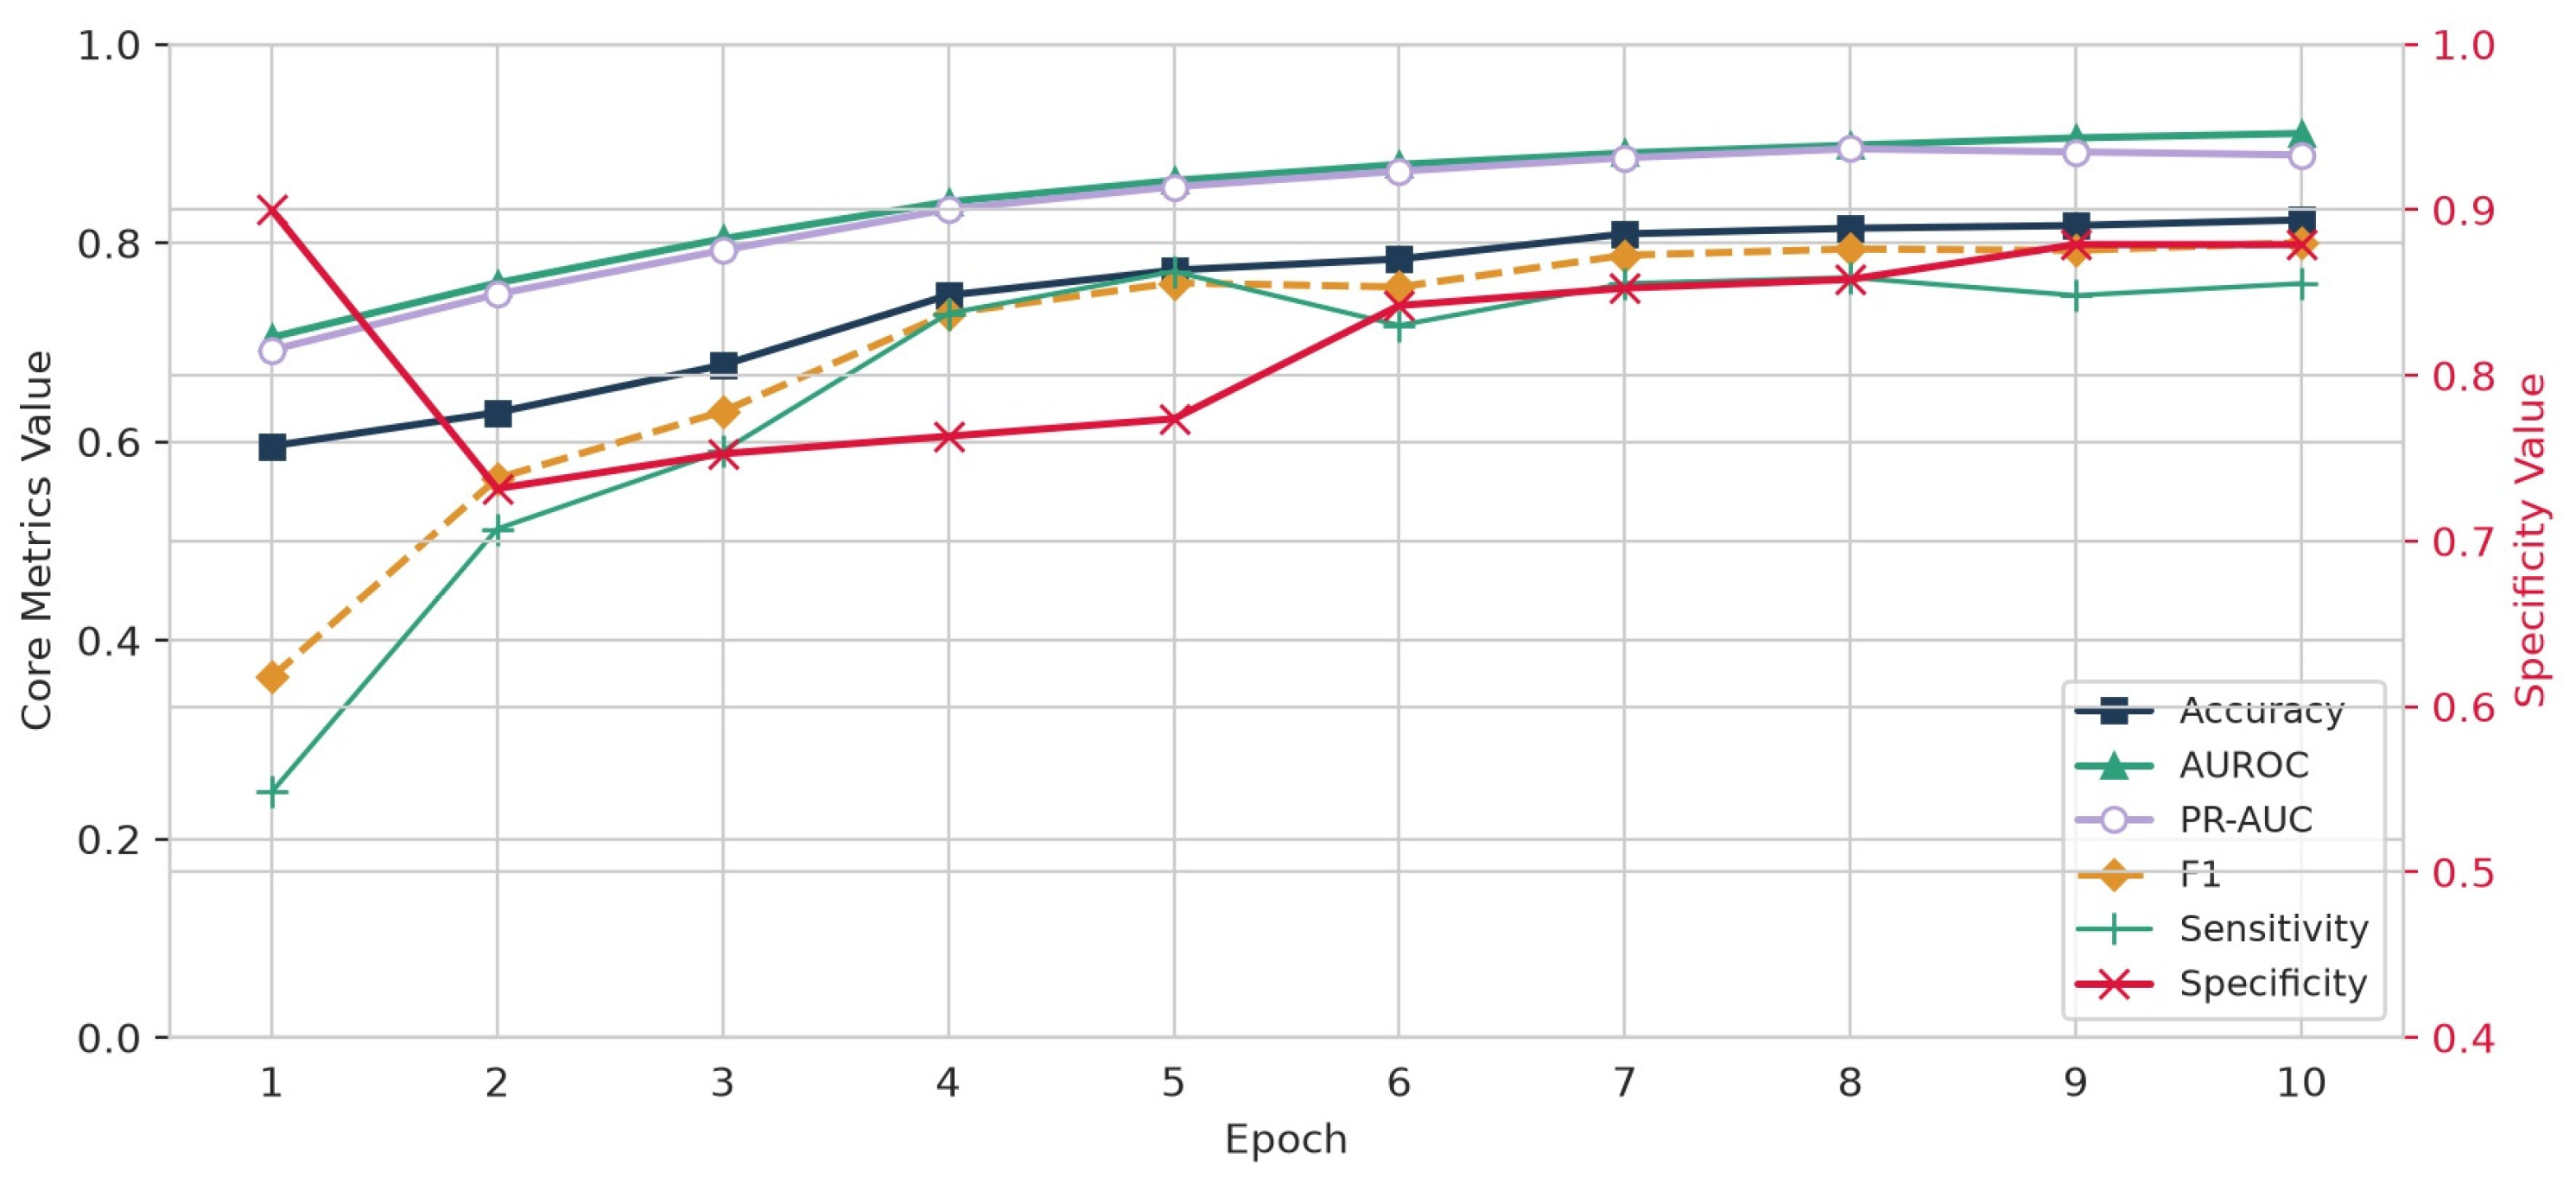
This proposed model shows a significant improvement in training performance. Validation accuracy increased from 59.55% at epoch 1 to 81.46% at epoch 8, the epoch selected by the pre-registered maximum-validation-PR-AUC criterion, while validation PR-AUC increased from 0.6921 to 0.8946 over the same interval. Table 7 summarizes the training performance.
Figure 11 and Table 7 show the performance of the proposed Refined Graph-Guided Fusion Network (R-GGFN). On the held-out test set, the proposed network achieved the highest value on every reported metric among all internally evaluated models, with an accuracy of 85.21%, AUROC of 0.9147, PR-AUC of 0.9213, and an F1-score of 0.8609. The confusion matrix shows a favorable reduction in both false negatives and false positives compared with the baseline and other multimodal models, improving the ability to discriminate between benign and malignant lung nodules.
Compared with conventional multimodal fusion methods, R-GGFN showed better results across all classification performance criteria. This can be explained by graph-guided, context-aware learning combined with multimodal feature fusion. Unlike conventional approaches that consider each sample separately, the Graph Attention Network (GAT) models context among nodules, allowing neighboring samples to provide additional information for feature aggregation. An important architectural improvement in the proposed framework is the use of tabular skip connections that help preserve semantically meaningful information at each step of the graph learning process. Although the graph attention mechanism helps capture contextual dependencies, feature transformation steps in the network can diminish the importance of the original semantic features. Combining the original tabular embeddings and graph-augmented features for classification enables the proposed architecture to use complementary information from both modalities. The superior results achieved by the R-GGFN over the Naïve GGFN support the above claim about the importance of the improvement in question and the necessity of retaining semantically meaningful information. In addition, the proposed optimization technique is an important component of the framework that helps improve performance. Using focal loss addresses the class imbalance in the LIDC-IDRI dataset by focusing more on hard malignant cases, while adapting the learning rate, weight decay, and gradient clipping techniques supports consistent training and generalization. Model explainability analysis also helps demonstrate the framework’s reliability. First, Grad-CAM identifies important areas of the nodule that affect classification, SHAP values help evaluate the effect of semantic features obtained by radiologists on predicting malignancy, and graph attention visualization shows how relationships between neighboring nodules impact feature extraction. These explainable AI techniques can improve transparency in the decision process and enable the proposed framework to serve as an interpretable computer-aided diagnostic system. Thus, the results show that the proposed R-GGFN framework successfully integrates graph-guided contextual learning, multimodal information fusion, semantic feature retention, and explainable AI into a single framework. Its consistent improvement over other internally evaluated multimodal fusion baselines, along with the highest value on every reported metric among all evaluated models, demonstrates the effectiveness of the proposed network architecture for pulmonary nodule classification.

5.5. Comparative Performance: All Models

Table 8 summarizes the comparative test-set performance of all evaluated models. Despite the substantial and fair training budget (see Section 4.7), the image-only 3D ResNet model was the least successful, as it is very challenging to learn from a relatively limited number of training images compared with learning from a small, radiologist-curated semantic feature vector. The image-only model was outperformed by the tabular models (MLP and XGBoost) on every reported metric, suggesting that much of the predictive information lies in the radiologist-generated semantic annotations. The Multimodal Fusion Models (Multimodal Late Fusion and Gated Multimodal Fusion) performed better in AUROC and Recall than the unimodal models, demonstrating the benefit of combining visual and semantic information. The proposed R-GGFN achieved the highest value among all seven evaluated models on every reported metric: accuracy (85.21%), AUROC (0.9147), PR-AUC (0.9213), F1-score (0.8609), Precision (87.84%), sensitivity (84.42%) and specificity (86.15%), reflecting the benefit of inter-nodule graph reasoning, the tabular skip connection, and focal loss for prioritizing malignant-case detection under class imbalance in the overall evaluation.

5.5.1. Statistical Significance of the Model Comparisons

To address the absence of any statistical analysis in the originally submitted manuscript, five significance tests were run on the frozen 70/15/15 patient-level split described in Section 3.3: a paired t-test and a Wilcoxon signed-rank test comparing R-GGFN’s per-epoch validation-set metrics against those of Naïve GGFN, Gated Fusion and Late Fusion across their shared 10-epoch training histories; McNemar’s test on the held-out test-set predictions, comparing R-GGFN against each of the other four models; and 95% confidence intervals for AUROC, PR-AUC, accuracy and F1-score, computed both analytically (DeLong’s method, AUROC only) and via 2000-resample bootstrapping of the held-out test set, for every model. Because the paired t-test, Wilcoxon, and McNemar tests were each run across multiple metrics and multiple model pairs (20 tests in total), a Holm-Bonferroni correction was applied within each test family to control the family-wise error rate at α = 0.05; results below are reported after this correction unless stated otherwise. XGBoost, which is trained by boosting rounds rather than epochs, was included in the test-set-level tests (McNemar, bootstrap and DeLong) but not in the per-epoch paired tests, since its round count is not directly comparable to the fixed 10-epoch histories recorded for the neural network models.
The comparison most central to the architectural claims of this paper, R-GGFN against Naïve GGFN, is statistically robust by every test applied: McNemar’s test on the held-out test-set predictions is significant (χ2 = 70.10, p < 0.0001, surviving Holm-Bonferroni correction), and the paired per-epoch tests agree on AUROC, PR-AUC, and accuracy (all p < 0.0001 after correction; F1 does not survive correction). Given that R-GGFN and Naïve GGFN differ in the tabular skip connection and in the optimization protocol simultaneously (Section 6), this result supports the conclusion that the combination of changes introduced between the two models produces a real, non-trivial improvement. However, it does not, on its own, isolate the tabular skip connection’s individual contribution.
Against the other three baselines, the picture is equally decisive. On the held-out test set, McNemar’s test reaches significance for R-GGFN versus Gated Fusion (χ2 = 39.18, p < 0.0001), Late Fusion (χ2 = 40.56, p < 0.0001) and XGBoost (χ2 = 40.56, p < 0.0001), each surviving Holm-Bonferroni correction, and the 95% bootstrap and DeLong confidence intervals for AUROC, PR-AUC, accuracy and F1-score no longer overlap between R-GGFN and any of these three models; for example, R-GGFN’s AUROC 95% CI (0.887–0.942, DeLong) is well clear of XGBoost’s (0.719–0.809). Of the per-epoch paired tests against Gated Fusion and Late Fusion, the AUROC, PR-AUC and accuracy comparisons all survive Holm-Bonferroni correction; only the F1 comparisons do not. Taken together, these results support the point estimates reported in Table 8, which show R-GGFN ahead of Gated Fusion, Late Fusion, XGBoost and every other internally evaluated model on every reported metric, and indicate that this ordering is statistically distinguishable from chance at the present test-set size (n = 426), consistent with the framing adopted throughout this manuscript (Section 5.5 and Section 6).
For reference, the full 95% bootstrap confidence intervals (2000 resamples, held-out test set) are: R-GGFN—AUROC 0.9147 (0.8861–0.9418), PR-AUC 0.9213 (0.8795–0.9550), accuracy 85.21% (81.84–88.58%), F1 0.8609 (0.8250–0.8947); XGBoost—AUROC 0.7642 (0.7186–0.8062), PR-AUC 0.7810 (0.7264–0.8304), accuracy 67.61% (63.15–71.83%), F1 0.7089 (0.6623–0.7514); Gated Fusion—AUROC 0.7457 (0.7007–0.7880), PR-AUC 0.7720 (0.7131–0.8273), accuracy 67.84% (63.38–72.30%), F1 0.7140 (0.6667–0.7574); Late Fusion—AUROC 0.7427 (0.6948–0.7860), PR-AUC 0.7688 (0.7082–0.8243), accuracy 67.61% (63.15–71.83%), F1 0.7229 (0.6789–0.7644); Naïve GGFN—AUROC 0.6930 (0.6442–0.7407), PR-AUC 0.7006 (0.6334–0.7690), accuracy 61.97% (57.28–66.44%), F1 0.6955 (0.6498–0.7397). Sensitivity, specificity, and Precision were not bootstrapped in this analysis and remain a natural extension of this significance testing.

5.5.2. Comparison with State-of-the-Art Methods

To estimate the efficiency of the proposed R-GGFN approach, we evaluate its performance against other state-of-the-art approaches for classifying lung cancers. Although the experimental design and setup differ across approaches, the analysis shows methodological progress and effectiveness.
Comparison Table 9 compares the developed Refined Graph-Guided Fusion Network (R-GGFN) with the latest state-of-the-art methods for lung cancer classification. The approaches presented earlier have significantly advanced feature extraction by employing CNNs, multimodal learning, graph neural networks, and explainable AI. However, each of those has addressed no more than two of the factors mentioned above. CNN-based multimodal approaches have shown they can improve feature fusion but lack contextual graph reasoning; meanwhile, graph neural network approaches are mostly based on imaging data alone and do not consider radiologists’ semantic annotations. In addition, explainable AI studies commonly employ a single technique (SHAP or attention visualization) to analyze a single model output. Unlike the proposed R-GGFN, the multimodal feature fusion, contextual graph-based learning using the Graph Attention Network, the tabular skip connection to preserve the clinically relevant semantic information, the optimized training using the focal loss and adaptive optimization, and the three complementary explainable AI techniques (Grad-CAM, SHAP, and graph attention visualization) were employed independently. It should be emphasized that, except the proposed R-GGFN’s own row, the performance figures in Table 9 are as reported in each cited paper’s own evaluation, on its own dataset, cohort and validation protocol; they are not the result of re-implementing these methods and evaluating them on the same LIDC-IDRI test partition used here, and are presented as qualitative, contextual points of reference rather than a controlled head-to-head comparison.
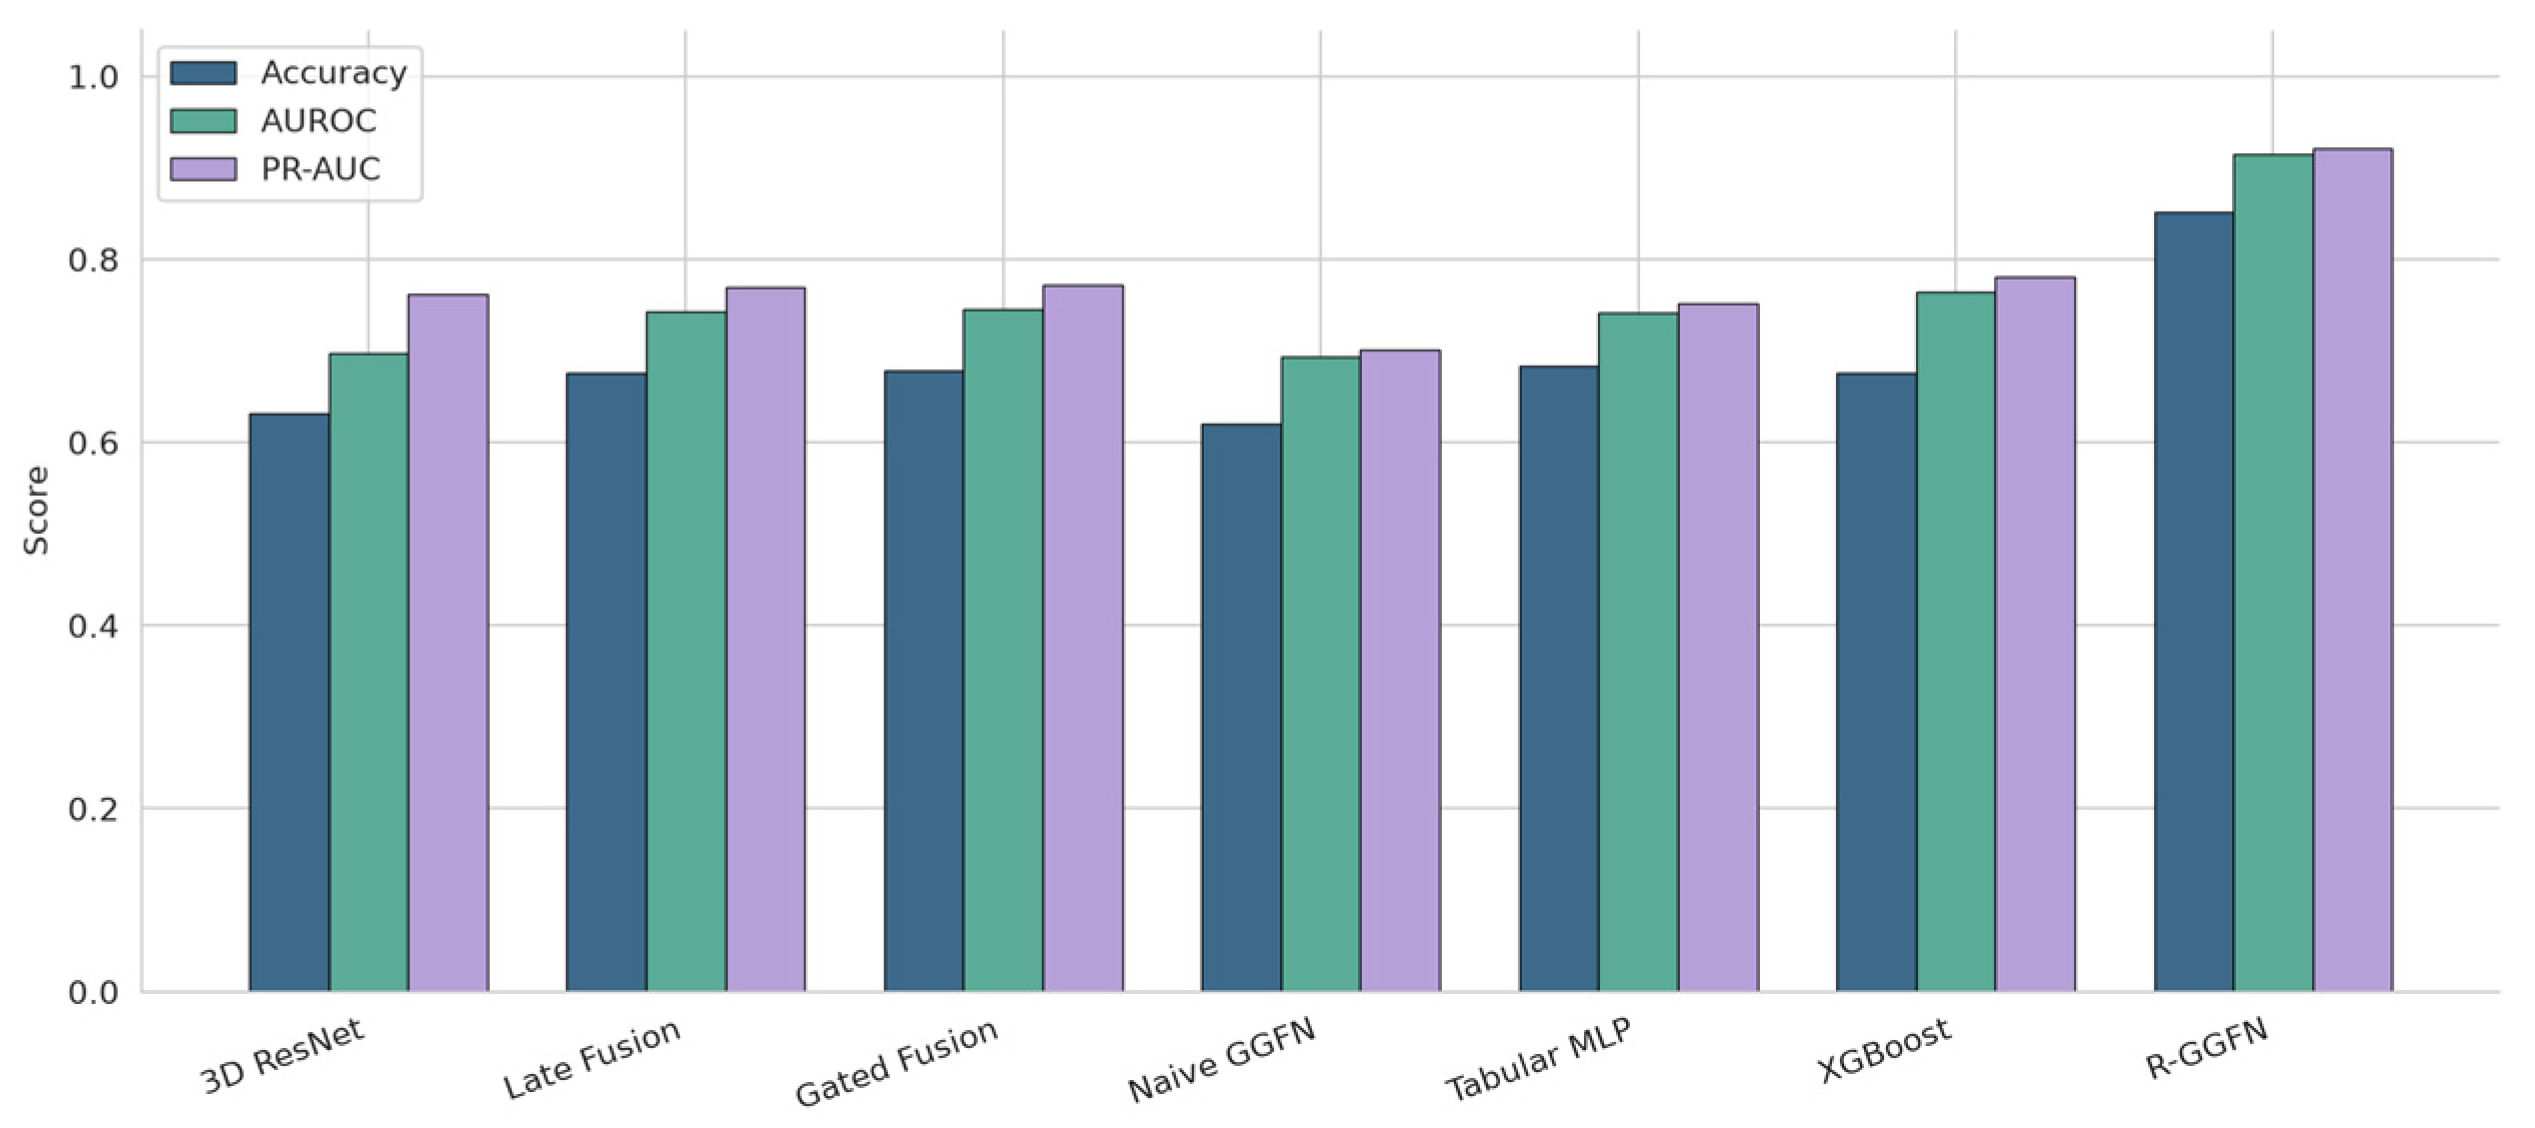
As shown in Figure 12, the proposed R-GGFN achieves the highest value on every metric—accuracy, Precision, sensitivity, specificity, F1-score, AUROC, and PR-AUC—among all seven evaluated models (Section 5.5). The experiments confirm that graph-guided multimodal fusion with semantic features is competitive with, and on most metrics ahead of, the traditional multimodal fusion strategies and unimodal baselines evaluated here.
In this respect, Figure 13 shows the ten-epoch training process of the proposed R-GGFN. The model started with relatively low specificity (90.0%) and sensitivity (24.7%) at epoch 1, increased significantly at epochs 2–5 (up to 77.1%), then decreased slightly and recovered at epochs 6–10. Sensitivity stabilized within a relatively tight accuracy range (between 71% and 77%, the differences in that range being statistically insignificant) and accuracy and AUROC were statistically significantly improving (albeit incrementally at times) for the rest of the training (from epoch 5 onwards); validation PR-AUC had reached its peak level at epoch 8, and the pre-registered maximum-validation-PR-AUC criterion as defined in Section 4.7 had picked this epoch as the reported one of the model’s training. In contrast, accuracy and AUROC continued to rise slightly through epoch 10. This is similar to how the model initially captures the majority (benign) class. Then the graph-attention and tabular skip-connection layers combine to learn a new representation that makes the model more specific while maintaining sensitivity.

5.6. Results and Interpretation with Explainable AI

5.6.1. GradCAM-3D Image Branch Feature

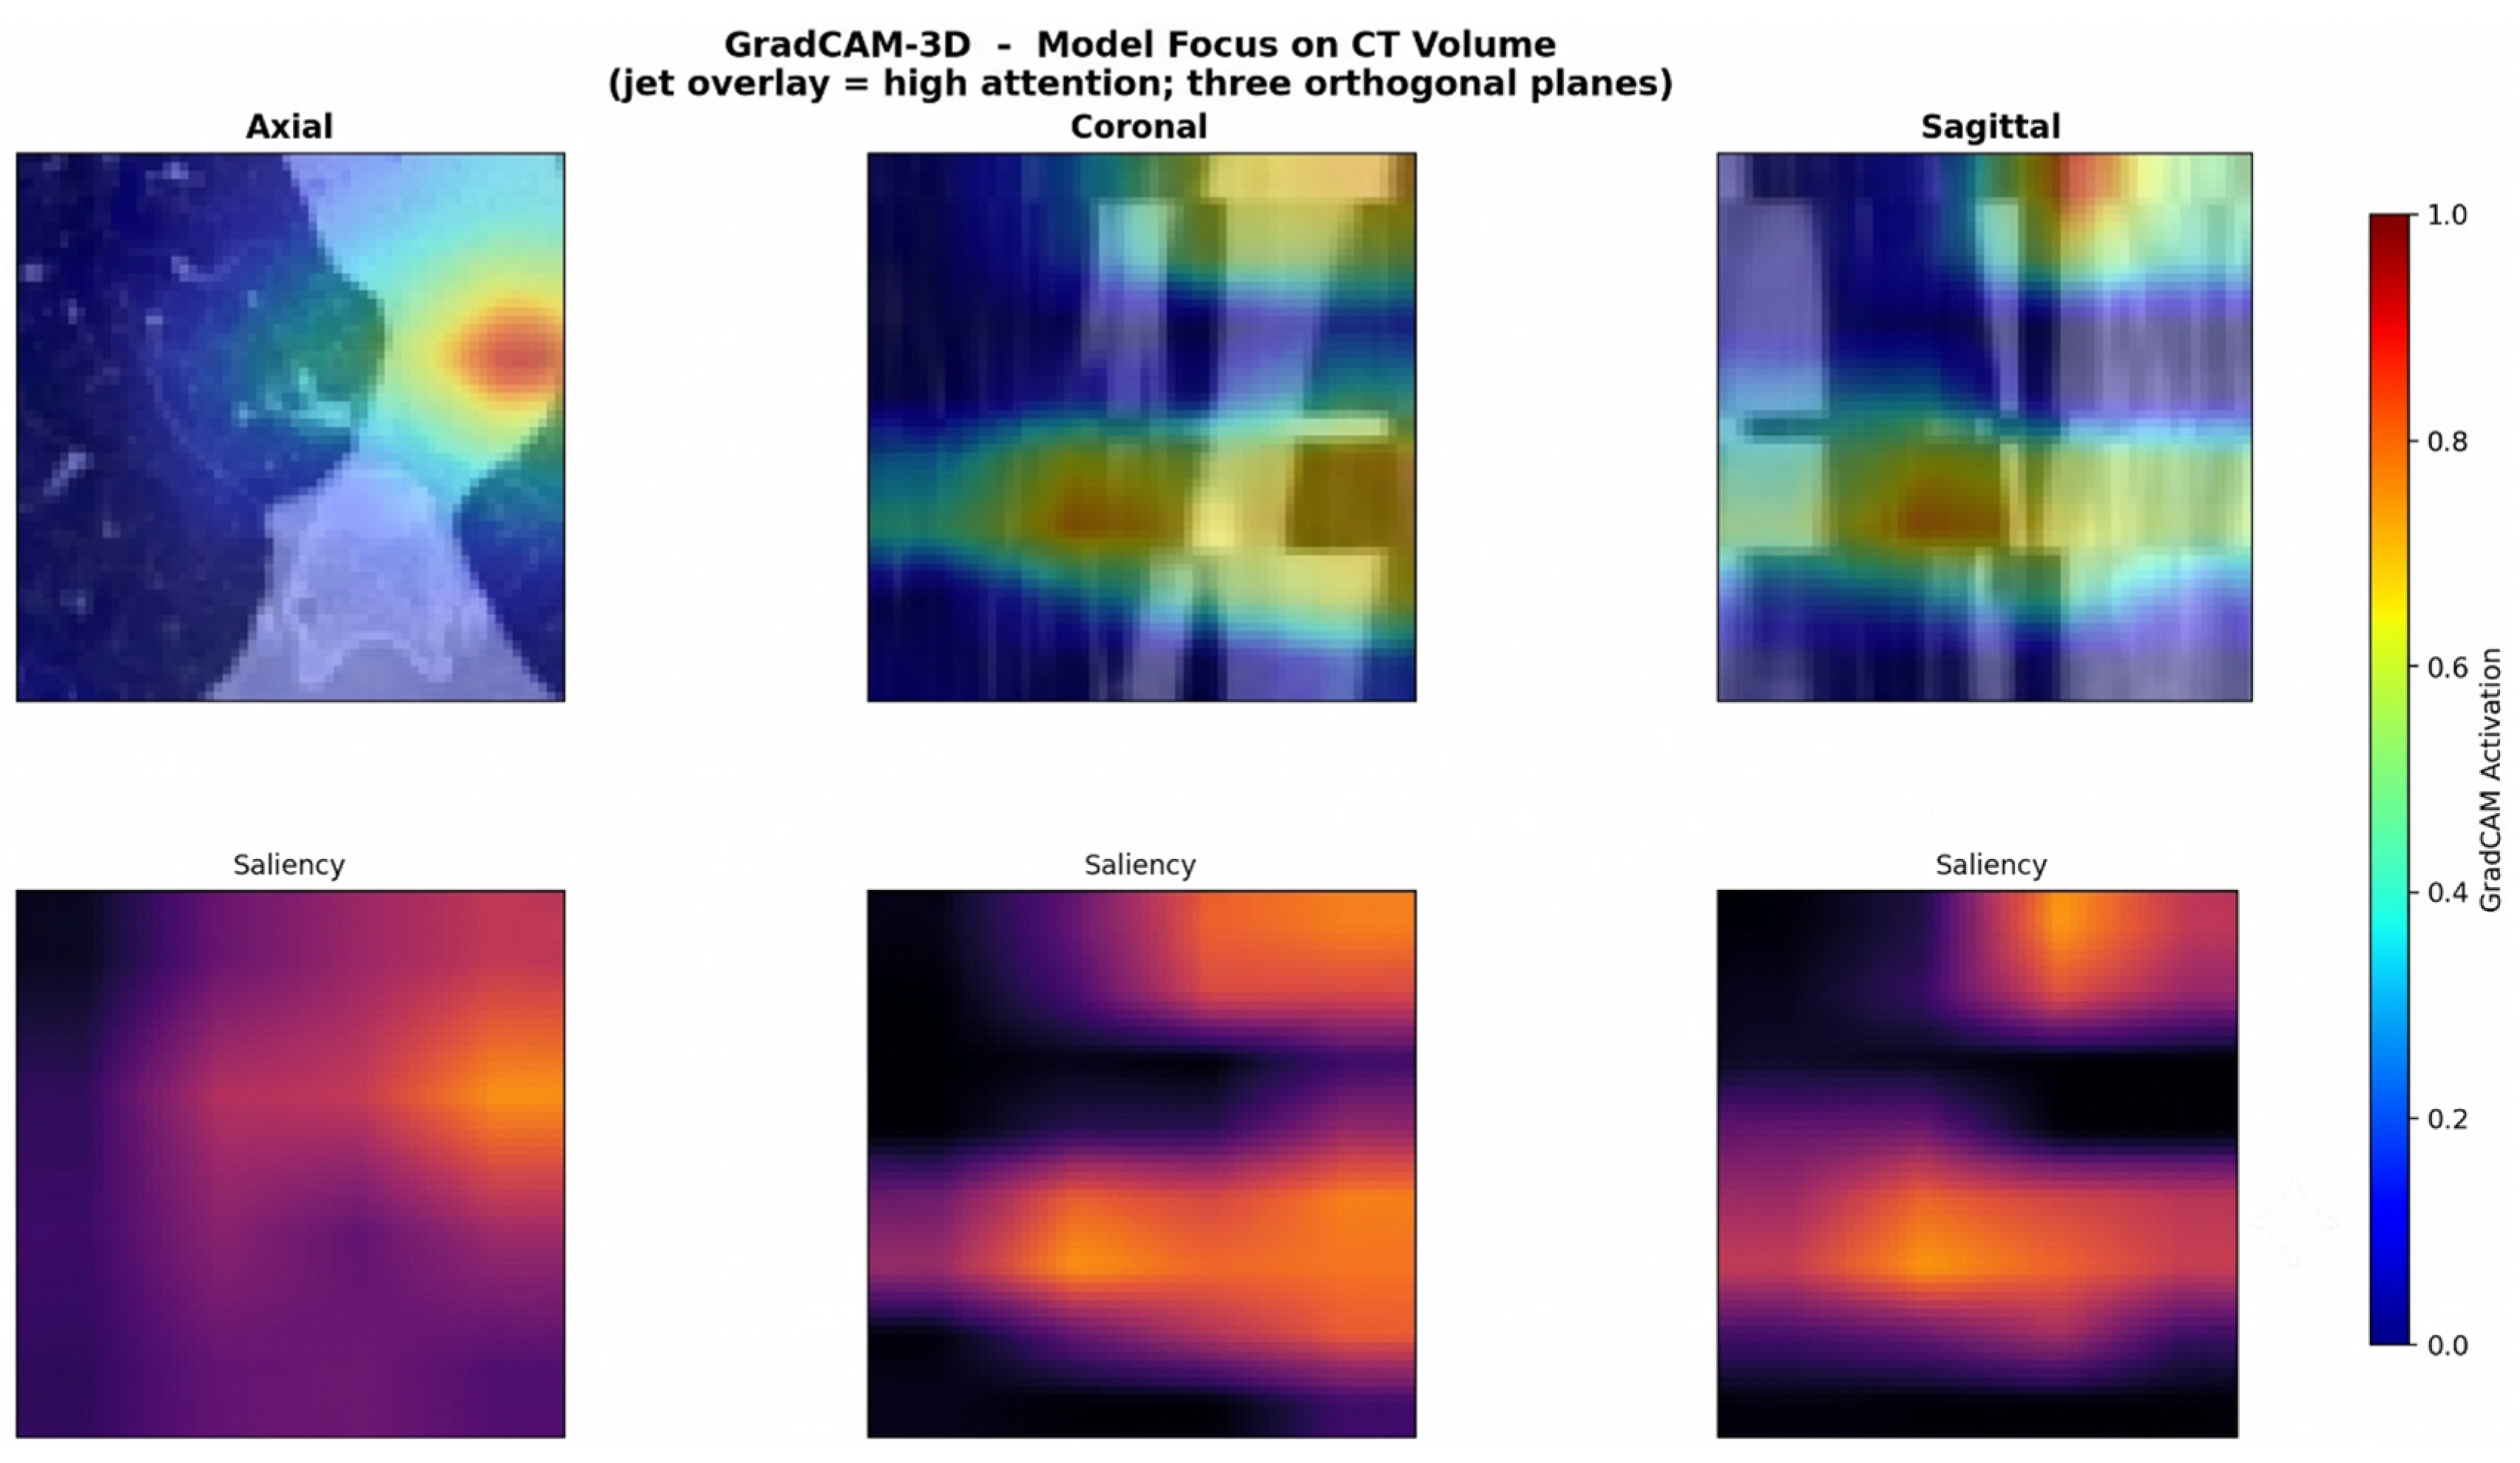
Figure 14 shows GradCAM-3D saliency maps for four validation-set nodules, selected as the most confident example of each prediction category rather than a single arbitrarily chosen case: a true positive (predicted malignancy probability 0.807), a true negative (0.840), a false positive (0.754). and a false negative (0.672). For each case, the first row shows the jet colormap (red/yellow: high attention, blue: low) overlaid on the percentile-normalized CT background in three orthogonal planes, and the bottom row shows the standalone saliency map in the inferno colormap, isolating the spatial distribution of model attention from the underlying CT signal. In the true-positive case, the model’s strongest activation (yellow/red) concentrates over the nodule mass itself in all three orthogonal planes, rather than spreading into the surrounding lung parenchyma, indicating that the model’s saliency is spatially localized to the region of clinical interest rather than to irrelevant background structures. The coronal and sagittal planes show a block pattern with maximum activation around mid-depth; this blocky appearance is an artifact of upsampling the coarse (8 × 4 × 4) layer-4 feature map to a 643 volume, in which each CAM “pixel” spans roughly 8 slices of depth. The mid-depth activation is consistent with the model attending to the central nodule body rather than the empty lung at the volume edges. Typical GradCAM implementations produce only a single 2D heatmap; this implementation instead generates a full volumetric saliency tensor of size 64 × 64 × 64 by trilinear upsampling, displayed as three orthogonal cross-sections, since a feature such as spiculation along the coronal axis would not necessarily be visible from the axial view alone. The false-positive and false-negative examples are included so that the explanation is not limited to cases where the model was correct; a systematic quantitative error analysis by nodule characteristics across the full test set has not yet been carried out and is noted as future work in Section 6.

5.6.2. SHAP: Tabular Branch Feature Importance

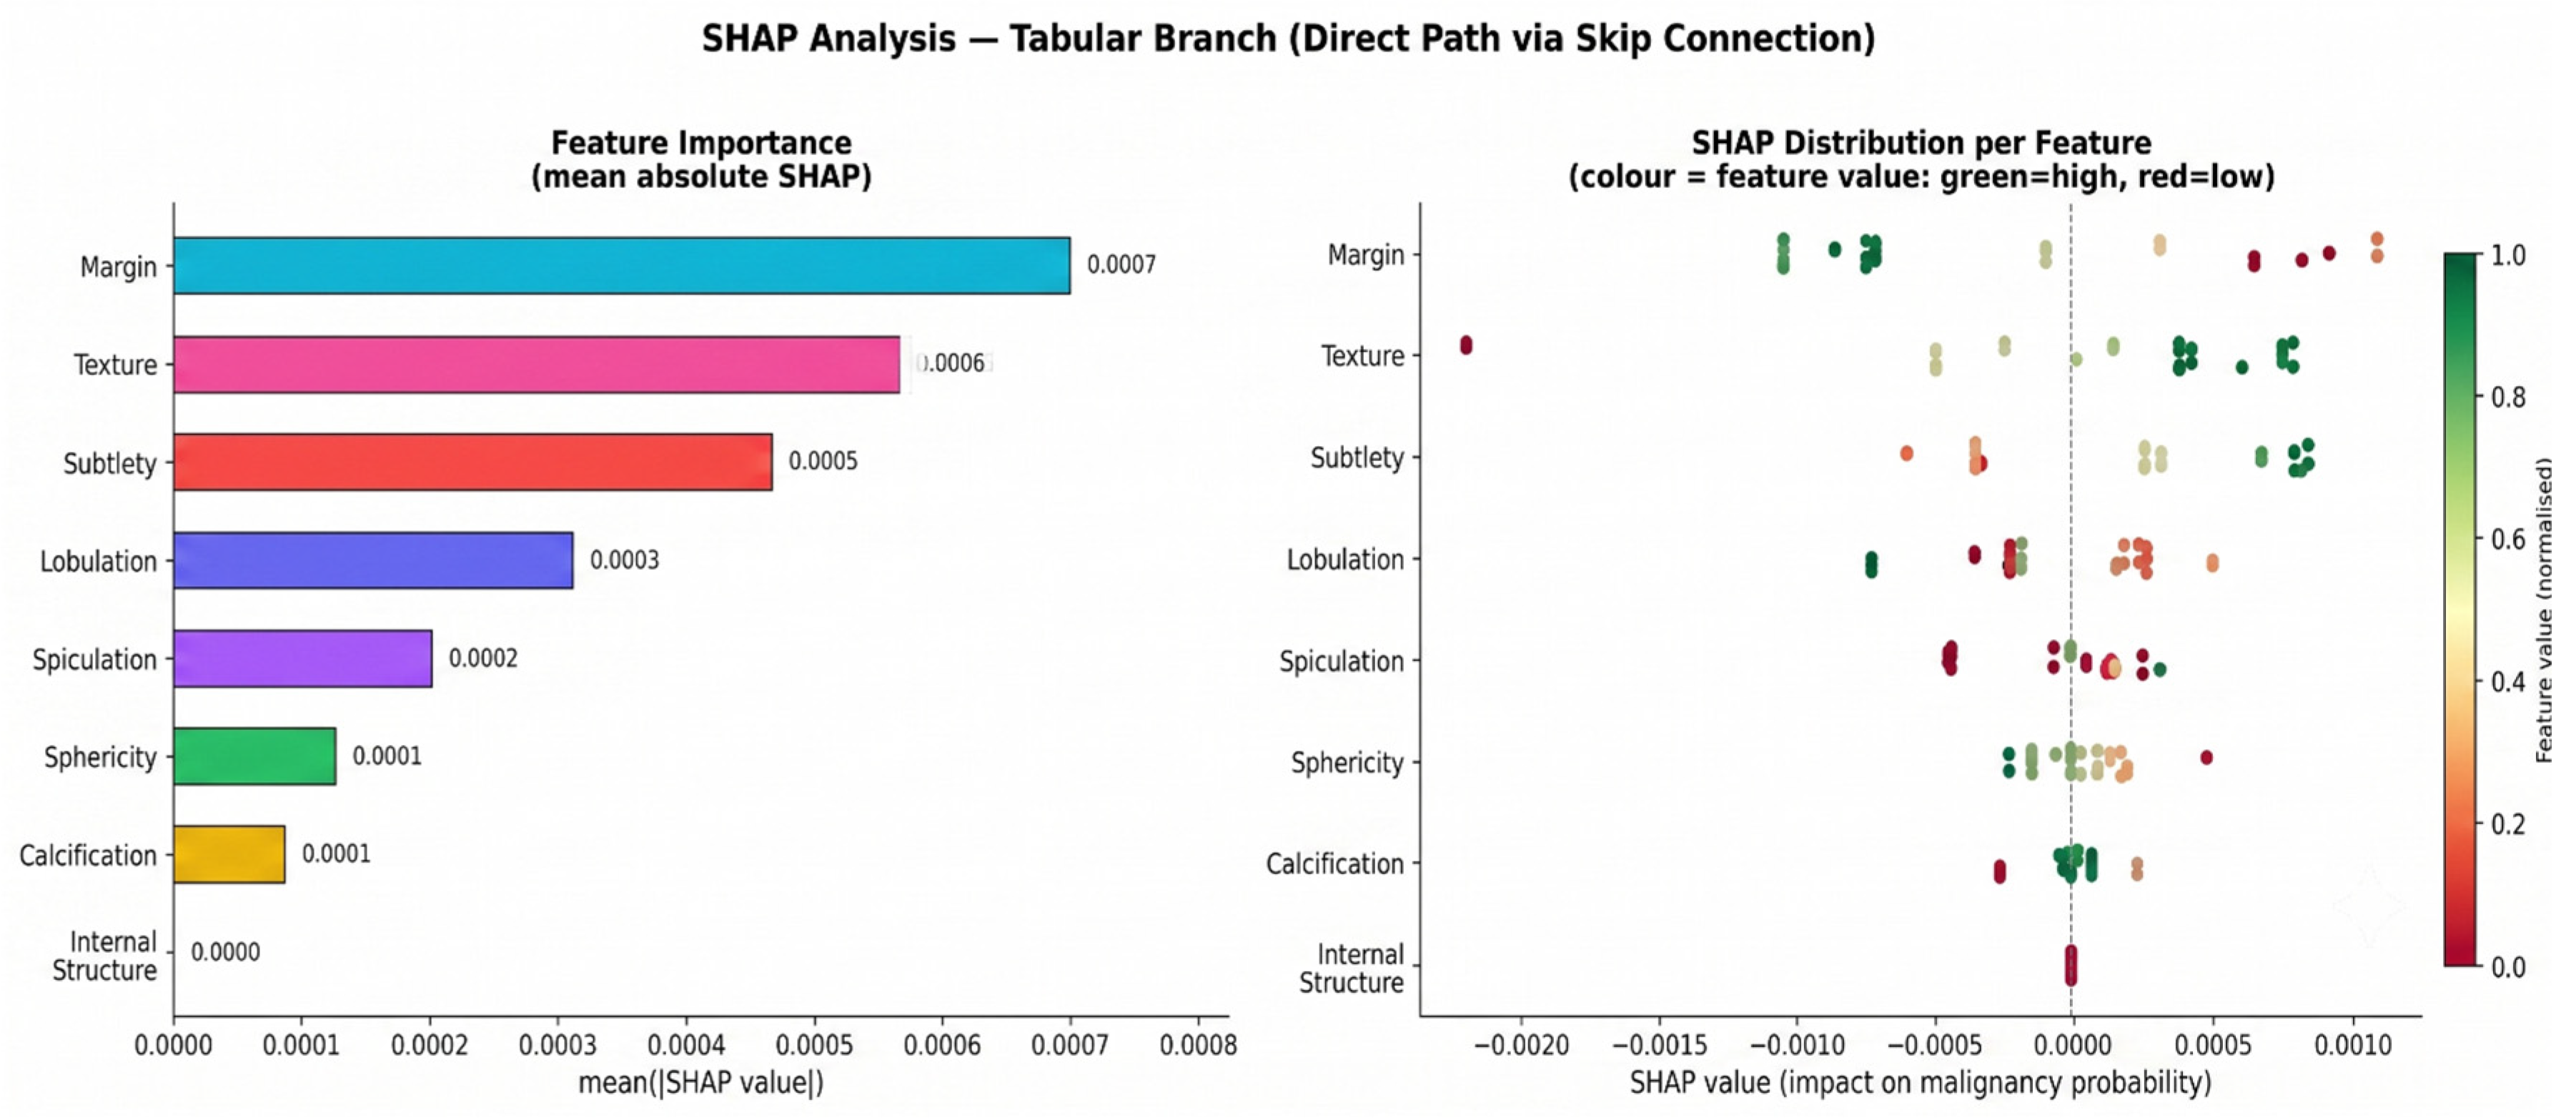
SHAP (Kernel Explainer) estimates the contribution of each of the eight radiologist-assigned semantic features to the tabular branch’s direct, skip-connection contribution to the fused prediction. Because the graph-attention pathway is evaluated with a self-loop-only edge index for this analysis, rather than the full multi-nodule graph used at inference for patients with more than one nodule, the reported SHAP values are best read as a branch-specific, surrogate explanation of the tabular pathway rather than a complete decomposition of the fully fused model’s decision. By mean absolute SHAP value, the ranked feature importance is: Subtlety (0.0373), Texture (0.0260), Sphericity (0.0209), Spiculation (0.0170), Margin (0.0155), Lobulation (0.0131), Calcification (0.0092), and Internal Structure (effectively zero), as shown in Figure 15. Subtlety, texture, and shape descriptors such as sphericity are all standard components of radiological nodule characterization, so this ranking is broadly plausible. However, it should not be read as a precise replication of any single clinical scoring rubric.
The direction of effect is clinically interpretable for the features with the clearest SHAP separation. For Spiculation, low feature values (red) cluster at negative SHAP values and high values (green) cluster at positive SHAP values, meaning more spiculated margins push the prediction toward malignancy, consistent with spiculation being a recognized malignancy indicator. For Sphericity, the pattern is reversed, with rounder nodules (high sphericity) pushing toward benign and less spherical nodules pushing toward malignancy, again consistent with clinical expectation. For Subtlety, higher values (more conspicuous nodules) push toward malignancy and lower values (more subtle nodules) push toward benign in this sample. The absolute SHAP values reported here are an order of magnitude larger than in an earlier version of this analysis, which used a bypass of the graph pathway (a fixed slice of the fused embedding) rather than a genuine self-loop-only GATConv evaluation; even so, the ranking and sign of the contributions are the more robust part of this analysis, since the reported magnitudes remain specific to this isolated evaluation path rather than the fully fused, multi-nodule model, and should not be interpreted as the tabular branch’s overall importance relative to the image branch.

5.6.3. GAT Attention: Graph Branch Interpretability

The left panel of Figure 16 shows the attention-weight density histogram for each of the four GAT heads across all edges in the validation set; the center panel shows the corresponding per-head box plots. All four heads converge to a very similar distribution, with an identical mean attention weight of 0.269 to three decimal places; in the absence of any attention-regularization term (Section 7.1), this indicates that the four heads have not specialized into distinguishable attention patterns and should be read as four near-redundant views of the same underlying weighting rather than four complementary relational signals. The right panel shows the intra-patient attention matrix for the largest multi-nodule group found in the validation set (16 nodules from one patient, self-loops masked); attention is concentrated in small blocks of two to four adjacent nodules along the diagonal, rather than spread evenly across all nodules belonging to the patient, with one notably higher-attention pair standing out from the rest.
To test whether these attention weights are functionally meaningful, rather than only descriptively structured, we carried out an attention-fidelity check: we measured the model’s AUROC on the validation set after removing the highest-attention-weighted edges, and separately after removing an equal number of random edges, and compared both to the unmodified baseline. Baseline AUROC was 0.8132; removing the top-attention edges gave 0.8194, and removing an equal number of random edges gave 0.8179, a difference of only 0.0015 between the two perturbations. In other words, removing the edges the model attends to most did not degrade performance any more than removing an equivalent number of edges at random. This is reported here as a genuine limitation rather than a positive finding: on this test, the learned attention weights do not reliably identify which inter-nodule connections are most influential for the classification decision, and the graph attention visualization in Figure 16 should accordingly be read as evidence of what the model attends to, not as evidence that this attention pattern is necessary for, or faithfully explanatory of, its predictions. This finding is consistent with the possibility, raised in Section 6, that the current fully connected intra-patient graph construction does not give the attention mechanism a strongly informative signal on which to discriminate between edges.
Taken together, GradCAM, SHAP and graph-attention visualization provide an image-based, feature-based and graph-based view of the model’s internal behavior. Read alongside the branch-specific framing of the SHAP analysis and the attention-fidelity result above, they support a qualified, partial account of what the model attends to at each stage, rather than a demonstration that this behavior is clinically reliable or trustworthy; establishing that would require radiologist assessment or a formal user study, neither of which has been carried out here.

6. Discussion

In this study, they introduced a new approach called the Refined Graph-Guided Fusion Network (R-GGFN), which combines multiple modalities for pulmonary nodule classification, such as volumetric computed tomography (CT) imaging, radiologist-provided semantic annotations, graph attention learning, and Explainable Artificial Intelligence (XAI) within a single network. The experimental results show the effectiveness of the proposed framework compared with baseline frameworks such as image-only, tabular-only, conventional multimodal fusion, and graph-based multimodal fusion models. On the held-out test set, the proposed architecture achieved an accuracy of 85.21%, AUROC of 0.9147, PR-AUC of 0.9213 and F1-score of 0.8609, the highest value on every reported metric accuracy, AUROC, PR-AUC, F1-score, Precision, sensitivity and specificity among all internally evaluated models; this indicates that the proposed architecture provides a discriminative representation for pulmonary nodule classification, offering uniformly strong performance across the full range of evaluated metrics rather than a narrower, single-axis trade-off. The comparison indicates that there is a lot to learn from medical information that is heterogeneous and complementary to baseline models. The 3D ResNet that was fed with image data alone had the lowest accuracy among the three baselines; this is now a fairly and fully trained model (Section 4.7), not the previously under-trained 2-epoch version, so the gap most likely reflects that learning discriminative volumetric features from a comparatively small number of CT scans is a harder task than learning from compact, radiologist-curated semantic descriptors, rather than a general insufficiency of CT imaging as a modality for this problem. Depending on the imaging data available, pulmonary nodules can show subtle variations in morphology and texture, boundary density and appearance, and other subtle features that are difficult to learn, even with a small training sample size. In contrast, the tabular models yielded much improved performance because the radiologist-derived semantic descriptors are explicitly clinical (e.g., margin, texture, spiculation, lobulation, and calcification). These findings are consistent with previous findings that semantic information provides little diagnostic value yet can benefit the image–based representation.
The multimodal Late Fusion and Gated Fusion models were also explored, which leveraged both visual and semantic information. The information in these diverse data sources was complementary, and both fusion strategies outperformed the unimodal baselines in AUROC and PR-AUC. Traditional fusion techniques, however, combine or adaptively fuse features from different modalities without considering differences among pulmonary nodules. Hence, they cannot benefit from contextual relationships between nodules or pass clinically relevant semantic information from one feature transformation to another. This constraint hampers their ability to use information in a multimodal way.
The proposed R-GGFN position is based on the main strength of the strategy being used, graph-guided contextual learning. To model relationships between nodules, the Graph Attention Network (GAT) explicitly propagates relationships between adjacent nodules and dynamically weights adjacent-nodule features when aggregating nodule features. The network’s graph-based reasoning allows it to create a more sophisticated feature representation than traditional convolutional networks based on pulmonary nodule similarity. The results show that contextual graph reasoning provides helpful information for multimodal fusion, and the improvement is better than that of Late Fusion and Gated Fusion.
The other major architectural improvement is the tabular skip connection. Features will multiply on the graph and may eventually be suppressed or changed from the original meaning of the radiologists. The planned skip connection directly maintains these clinically meaningful semantic embeddings and combines them with multimodal embeddings augmented by graph information for ultimate classification. The results for the suggested R-GGFN and Naïve GGFN indicate that the original semantic descriptors are preserved while learning graph information, increasing feature discrimination and further improving classification accuracy. It should be noted, however, that R-GGFN and Naïve GGFN differ not only in the tabular skip connection but also in the optimization protocol used at that training stage (Section 4.7), so the improvement observed cannot be attributed to the skip connection in isolation; the nested-architecture design used across Late Fusion, Gated Fusion, Naïve GGFN and R-GGFN (Section 4.4) is a step toward a controlled ablation, but a full one-component-removed-at-a-time comparison under an identical optimization protocol stays necessary before the individual contribution of the skip connection can be established with confidence. Another important factor that improved the model’s performance was the optimization strategy. The optimization was stable, and focal loss, weighted random sampling, adaptive learning-rate scheduling, weight decay regularization, and gradient clipping effectively handled class imbalance in the LIDC-IDRI dataset. Focal loss emphasized challenging malignant samples, which facilitated optimization. To ensure smooth convergence and improve generalization during training, we used an adaptive optimization strategy. This improves with the number of epochs, showing that the optimization elements used effectively reduce overfitting and achieve a good balance between sensitivity and specificity.
The proposed framework has a detailed explainability plan as a significant advantage. In contrast, many existing works use only one interpretability method, while the proposed framework combines 3D Grad-CAM, SHAP analysis, and graph attention visualization for multi-level explanations. The network can produce boundaries of clinically relevant nodules while ignoring irrelevant background structures, as shown in the Grad-CAM analysis of volumetric CT images. SHAP measures the contribution of each semantic feature, meaning that, for instance, texture, margin, and subtlety are the most influential semantic features that clinical experts identified to predict malignancy. In addition, graph attention visualization visualizes contextual information from neighboring nodules in the graph aggregation. The complementary explanation methods further enhance model transparency and yield clinically relevant indications to support its predictions; however, this transparency reflects internal consistency with known radiological reasoning rather than externally validated clinical trust, since no radiologist assessment or user study of the explanations has yet been carried out.
The suggested plan had some issues, but it performed well. All experiments were performed on the publicly available LIDC-IDRI database. External validation of the proposed framework on other databases collected from various centers, with different imaging protocols and patient cohorts, is required to check the robustness and generalizability of the proposed framework; a genuine held-out test set was used within this dataset, but that is a different thing from an external, independent cohort, and the two should not be conflated. Second, the current graph construction is based on patient identity alone, connecting all nodules within a patient regardless of their actual similarity; other graph construction methods (such as clinical similarity, spatial proximity, or a learned graph structure) may be more appropriate for representation learning. It also remains an open question whether a fully connected intra-patient graph pushes predictions for several nodules belonging to the same patient closer together than would be clinically warranted, since nodules within one patient can legitimately differ in malignancy. Third, we explored several different explanation approaches. Still, a systematic false-positive/false-negative error analysis, characterizing misclassified nodules by size, density, morphology, inter-radiologist disagreement, and number of nodules per patient, has not yet been carried out, and clinical experts’ assessment of the explanations remains future work. Finally, further statistical proof through repeated experiments and confidence intervals, as well as significance testing against the baselines, will provide evidence of the reliability of these performance gains.
A further limitation concerns the reference standard itself. Both the eight semantic descriptors used by the tabular branch and the malignancy label used as the classification target are derived from the same radiologists’ readings of the same LIDC-IDRI annotations, so part of the apparent predictive value of the semantic features may reflect this shared origin rather than an independent clinical signal; the ground truth used throughout this study is the consensus LIDC-IDRI malignancy rating, not a pathology-confirmed diagnosis or a longitudinal clinical outcome, and the results should be interpreted accordingly. Related to this, the intended use of the framework within a radiology workflow is not yet established: the current model requires a radiologist to have already assigned the eight semantic descriptors before a prediction can be produced, and whether this offers a meaningful incremental benefit over the radiologist’s own judgment, made at the same time as those descriptors, is presently uncertain and would need to be tested directly. It should also be acknowledged that nodule-level tabular annotations were matched to image data using an index-based, z-sorted correspondence between on-disk nodule folders and pylidc annotation clusters (Section 3.3), which resolved 867 of 875 patients (99.1%); the excluded 0.9% and the underlying matching assumption remain a residual source of uncertainty rather than a fully solved problem. Finally, an earlier iteration of this pipeline trained the image-only and tabular-only baselines for substantially fewer epochs than the multimodal models, which was identified as an unfair comparison and corrected before the results reported here (Section 4.7); this history is noted here for transparency, since it affected model comparisons in an earlier version of this manuscript.
Finally, the proposed Refined Graph-Guided Fusion Network shows that fusing multimodal information, graph-based contextual learning, semantic preservation, and multi-level Explainable Artificial Intelligence is a powerful solution to the pulmonary nodule classification problem. Aiming to improve overall diagnostic performance, the results are generally superior to baseline models that rely only on images, showing the impact of each component in the architecture on diagnostic performance. The results suggest that graph-guided multimodal learning is a promising direction for computer-aided diagnostic support. However, its readiness to support radiologists in clinical decision-making has not yet been established. It would require prospective evaluation, radiologist-in-the-loop assessment, and external validation before any such claim could be made. Other areas that need further work to improve the real-world applicability of the proposed framework include multi-center external testing, more advanced graph construction methods, incorporation of additional clinical modalities, and prospective evaluation of its real-world applicability.

7. Conclusions

This section concludes the study by summarizing the major findings, assessing the extent to which the study’s objectives were addressed, and outlining directions for future improvement. This work aims to design a multimodal deep learning system that classifies pulmonary nodules according to their consensus LIDC-IDRI malignancy rating using medical imaging data, expert radiologist semantic descriptors, and graphical relation learning between nodules. The aim was to address the limitations of single-modality approaches by combining several information sources, while also improving model transparency through Explainable Artificial Intelligence (XAI) techniques. This study had five objectives. First, to build a deep learning-based framework for classifying pulmonary nodules from medical imaging data. Second, to combine clinical and tabular data with imaging features to improve classification performance. Third, to design a fusion approach that learns relationships among multiple nodules within a patient using a graph representation. Fourth, to increase the proposed model’s interpretability through XAI techniques. Fifth, to compare different classification strategies under a consistent evaluation protocol. Each of these five objectives was addressed within the scope of this study, on the internally evaluated LIDC-IDRI cohort described in Section 3; the extent to which the resulting framework generalizes beyond this cohort, and beyond the consensus malignancy rating used as its reference standard, has not yet been established and is discussed further below.

7.1. Limitations

R-GGFN showed good classification performance on the consensus LIDC-IDRI malignancy rating, but the proposed network has a few limitations that could be improved in future work. First, the framework uses an intra-patient graph that is fully connected, meaning every nodule belonging to a patient is connected to every other nodule from that same patient. This allows information to be exchanged freely between any pair of nodules. Still, it also produces a high number of graph edges relative to the number of nodes, adds computational complexity, and risks [44] introducing non-anatomically motivated connections between nodules that may not actually be related; a graph in which edge weights reflect, for instance, 3-D Euclidean distance between nodules, or in which only clinically relevant neighbors are connected, may be a more principled alternative. This concern is discussed further above in Section 6.
Second, the current model design uses only one Graph Attention Network (GAT) layer, limiting the model’s ability to learn complex relationships among unrelated nodules. This model cannot learn any dependencies between multiple nodules. In the future, the model could be improved by adding additional GAT layers to enable deeper relational learning.
A related methodological point, now resolved in the current version of this work, is that tabular annotations were originally extracted at the patient level rather than the nodule level, meaning every nodule belonging to one patient received an identical set of semantic features; this has since been corrected by matching each nodule to its own pylidc annotation cluster (Section 3.3), and the results reported throughout this manuscript already reflect the corrected, nodule-level annotations. A residual limitation of this corrected matching procedure, and of the reference standard itself, is discussed above in Section 6.
An earlier version of this framework compared a fully trained R-GGFN against baselines that were themselves under-trained (the image-only 3D ResNet was trained for only 2 epochs); that asymmetry has been corrected by extending the baselines to the same up-to-10-epoch budget used by the multimodal fusion models (Section 4.7). The multimodal fusion models, including R-GGFN, remain trained for a fixed 10 epochs, the same budget used throughout this line of work; this budget was not extended to 20 epochs. Over these 10 epochs, R-GGFN’s core discrimination metrics (accuracy, AUROC, PR-AUC, F1) improve substantially and largely stabilize from around epoch 7–8 onward (Figure 13). Still, accuracy and AUROC continue to increase marginally through epoch 10, so full convergence beyond the current 10-epoch budget has not been established and remains a limitation of the present results. In addition, the proposed framework does not accept segmentation masks as an input. This leads to the loss of useful information about the exact limits, shap, and morphology of the lung nodules during feature extraction. To more accurately target the lesion area, segmentation masks could be provided as an additional input modality to the network, or an auxiliary segmentation loss could be used to improve the quality of the segmentation features and classification results.
Lastly, we do not regularize attention in the Graph Attention Network. If not regularized, the different heads of attention will learn the same graph representations, and the same graph representation could be learned by different heads. Attention regularization can be added in the future to encourage the learning process to use different attention heads to learn complementary structural relationships between the nodes, making the learning process more robust and easier to interpret.
In summary, the proposed R-GGFN framework is expected to benefit further from a more principled graph construction, additional graph attention layers, segmentation-guided learning, and attention regularization; the annotation-matching issue and the baseline training-budget asymmetry noted in earlier iterations of this work have already been addressed in the version reported here; whether the multimodal fusion models’ own 10-epoch training budget is sufficient for full convergence remains an open question, as described above.

7.2. Future Recommendation

The proposed R-GGFN framework has several interesting directions for future research. First, external validation on an independent, multicenter cohort, ideally with pathology-confirmed outcomes rather than consensus radiologist ratings, would be needed before any claim of clinical readiness could be made; the patient-level split already used within this study (Section 3.3) protects against leakage within the LIDC-IDRI cohort, but is not a substitute for testing on genuinely unseen institutions and scanners.
Another interesting enhancement is mask supervision during training. The current framework relies solely on raw CT images and can no longer accurately measure lung nodule boundaries. With segmentation masks as an additional supervision signal, the model can focus more on the lesion region and thus improve performance. This additional spatial information can help improve the features extracted and the network’s classification accuracy.
Lastly, as noted above, the baseline training-budget asymmetry has already been corrected, but the multimodal fusion models’ own 10-epoch budget has not been extended, and their core metrics had not fully plateaued by epoch 10; confirming full convergence, whether by training for more epochs or by further hyperparameter tuning and repeated runs across random seeds, remains necessary future work rather than a solved problem. To summarize, the future directions proposed here aim to improve the reliability, external generalizability, and clinical interpretability of the proposed multimodal approach to pulmonary nodule malignancy classification from CT imaging, ahead of any prospective or clinical use.

Supplementary Materials

The following supporting information can be downloaded at: https://www.mdpi.com/article/10.3390/info17090839/s1. The completed CLAIM checklist is provided.

Author Contributions

Conceptualization, A.J. and R.A.; methodology, A.J., R.A. and S.M.J.; software, A.J.; validation, A.J., R.A. and S.M.J.; formal analysis, A.J.; investigation, A.J.; data curation, A.J.; visualization, A.J.; writing—original draft preparation, A.J.; writing—review and editing, A.J., R.A. and S.M.J.; supervision, R.A. and S.M.J. All authors have read and agreed to the published version of the manuscript.

Funding

This research received no external funding.

Institutional Review Board Statement

Not applicable.

Informed Consent Statement

Not applicable.

Data Availability Statement

The LIDC-IDRI dataset analyzed in this study is publicly available from Kaggle at https://www.kaggle.com/datasets/zhangweiled/lidcidri (accessed on 12 August 2026) The frozen patient-level train/validation/test split and the nodule-matching audit generated during this study are available from the corresponding author on reasonable request. To support reproducibility, the following are fixed in advance of, and unaffected by, the results reported here, as described in Section 3: the deterministic patient-level data loading, the frozen 70/15/15 train/validation/test split (SHA-256 hash 085086144d7be461), the nodule-level annotation-matching audit (Section 3.3), the pre-registered checkpoint-selection criterion (maximum validation PR-AUC), and the per-model decision thresholds (selected via Youden’s J statistic on the validation set and applied once to the test set). The exact patient-ID lists for each partition, the nod-ule-matching audit table, the trained model checkpoints, and the analysis code are available from the corresponding author on rea-sonable request.

Conflicts of Interest

The authors declare that they have no conflicts of interest.

References

  1. World Health Organization. Lung Cancer (Fact Sheet). Available online: https://www.who.int/news-room/fact-sheets/detail/lung-cancer (accessed on 12 August 2026).
  2. Alsatari, E.S.; Smith, K.R.; Galappaththi, S.P.L.; Turbat-Herrera, E.A.; Dasgupta, S. The Current Roadmap of Lung Cancer Biology, Genomics and Racial Disparity. Int. J. Mol. Sci. 2025, 26, 3818. [Google Scholar] [CrossRef] [Scilit] [PubMed]
  3. Gilad, S.; Lithwick-Yanai, G.; Barshack, I.; Benjamin, S.; Krivitsky, I.; Edmonston, T.B.; Bibbo, M.; Thurm, C.; Horowitz, L.; Huang, Y.; et al. Classification of the Four Main Types of Lung Cancer Using a MicroRNA-Based Diagnostic Assay. J. Mol. Diagn. 2012, 14, 510–517. [Google Scholar] [CrossRef] [Scilit] [PubMed]
  4. Hussein, S.; Cao, K.; Song, Q.; Bagci, U. Risk Stratification of Lung Nodules Using 3D CNN-Based Multi-Task Learning. In International Conference on Medical Image Computing and Computer-Assisted Intervention (MICCAI); Springer: Cham, Switzerland, 2017. [Google Scholar] [CrossRef] [Scilit]
  5. Armato, S.G., III; McLennan, G.; Bidaut, L.; McNitt-Gray, M.F.; Meyer, C.R.; Reeves, A.P.; Zhao, B.; Aberle, D.R.; Henschke, C.I.; Hoffman, E.A.; et al. The Lung Image Database Consortium (LIDC) and Image Database Resource Initiative (IDRI): A Completed Reference Database of Lung Nodules on CT Scans. Med. Phys. 2011, 38, 915–931. [Google Scholar] [CrossRef] [Scilit] [PubMed]
  6. Lin, T.-Y.; Goyal, P.; Girshick, R.; He, K.; Dollár, P. Focal Loss for Dense Object Detection. In IEEE International Conference on Computer Vision (ICCV); IEEE: New York, NY, USA, 2017; pp. 2980–2988. [Google Scholar]
  7. Rahane, W.; Dalvi, H.; Magar, Y.; Kalane, A.; Jondhale, S. Lung Cancer Detection Using Image Processing and Machine Learning Healthcare. In 2018 International Conference on Current Trends Towards Converging Technology (ICCTCT); IEEE: New York, NY, USA, 2018; pp. 1–5. [Google Scholar] [CrossRef] [Scilit]
  8. Ioffe, S.; Szegedy, C. Batch Normalization: Accelerating Deep Network Training by Reducing Internal Covariate Shift. In 32nd International Conference on Machine Learning (ICML); PMLR: Cambridge, MA, USA, 2015; pp. 448–456. [Google Scholar]
  9. Arevalo, J.; Solorio, T.; Montes-y-Gómez, M.; González, F.A. Gated Multimodal Units for Information Fusion. In Proceedings of the 5th International Conference on Learning Representations (ICLR) Workshop, Toulon, France, 24–26 April 2017. [Google Scholar]
  10. Rahman, M.; YongZhong, C.; Bin, L. Graph Attention Network-Based Multimodal Approach for Lung Diseases Classification. Sci. Rep. 2026, 16, 10914. [Google Scholar] [CrossRef] [Scilit] [PubMed]
  11. Shen, W.; Zhou, M.; Yang, F.; Yang, C.; Tian, J. Multi-Scale Convolutional Neural Networks for Lung Nodule Classification. In International Conference on Information Processing in Medical Imaging (IPMI); Springer: Cham, Switzerland, 2015; pp. 588–599. [Google Scholar]
  12. Zhang, C.; Aamir, M.; Guan, Y.; Al-Razgan, M.; Awwad, E.M.; Ullah, R.; Bhatti, U.A.; Ghadi, Y.Y. Enhancing Lung Cancer Diagnosis with Data Fusion and Mobile Edge Computing Using DenseNet and CNN. J. Cloud Comput. 2024, 13, 91, Correction in J. Cloud Comput. 2024, 13, 111. https://doi.org/10.1186/s13677-024-00673-1. [Google Scholar] [CrossRef] [Scilit]
  13. Saihood, A.; Hasan, M.A.; Shnawa, S.M.; Fadhel, M.A.; Alzubaid, L.; Gupta, A.; Gu, Y. Multiside Graph Neural Network-Based Attention for Local Co-Occurrence Features Fusion in Lung Nodule Classification. Expert Syst. Appl. 2024, 252, 124149. [Google Scholar] [CrossRef] [Scilit]
  14. Sousa, J.V.; Matos, P.; Silva, F.; Freitas, P.; Oliveira, H.P.; Pereira, T. Single Modality vs. Multimodality: What Works Best for Lung Cancer Screening? Sensors 2023, 23, 5597. [Google Scholar] [CrossRef] [Scilit] [PubMed]
  15. Oncu, E. Multimodal AI Framework for Lung Cancer Diagnosis: Integrating CNN and ANN Models for Imaging and Clinical Data Analysis. Preprint 2024. [Google Scholar] [CrossRef] [Scilit]
  16. Dubey, R.; Dhaka, A.; Nandal, A.; Sharma, A.K. An Attention-Guided Multimodal Deep Learning Framework by Integrating CT-PET Imaging and Clinical Data for Lung Cancer Detection. Sci. Rep. 2026. [Google Scholar] [CrossRef] [Scilit] [PubMed]
  17. Sun, M.; Cui, C. Advanced AI-Driven Image Fusion Techniques in Lung Cancer Diagnostics: Systematic Review and Meta-Analysis for Precision Medicine. Robot. Intell. Autom. 2024, 44, 579–593. [Google Scholar] [CrossRef] [Scilit]
  18. Pushpa, M.; Gomathi, P.R.; Kota, P.S.; Kumar, D.A.; Pundir, S. Integrating Deep Learning and Graph Neural Networks for Multimodal Lung Tumor Analysis: A Novel Approach for Improved Classification and Predict. In International Conference on Smart Systems and Advanced Applications; IEEE: New York, NY, USA, 2023; pp. 346–352. [Google Scholar] [CrossRef] [Scilit]
  19. Waqas, A.; Tripathi, A.; Ramachandran, R.; Stewart, P.; Rasool, G. Multimodal Data Integration for Oncology in the Era of Deep Neural Networks: A Review. arXiv 2023, arXiv:2303.06471. [Google Scholar] [CrossRef] [Scilit]
  20. Das, S.P.; Mitra, S. Deep Ensembling with Multimodal Image Fusion for Efficient Classification of Lung Cancer. In International Conference on Computing, Communication and Networking Technologies (ICCCNT); IEEE: New York, NY, USA, 2024; pp. 1–7. [Google Scholar] [CrossRef] [Scilit]
  21. Fu, X.; Meng, X.; Zhou, J.; Ji, Y. High-Risk Factor Prediction in Lung Cancer Using Thin CT Scans: An Attention-Enhanced Graph Convolutional Network Approach. arXiv 2023, arXiv:2308.14000. [Google Scholar] [CrossRef] [Scilit]
  22. Priya, B.U.; Reddy, V.L. Hierlungxai: A Hierarchical and Explainable Deep Learning Framework for CT-Based Lung Cancer Classification. Asian Pac. J. Cancer Biol. 2026, 11, 649–667. [Google Scholar] [CrossRef] [Scilit]
  23. Li, J.; Chen, Y.; Wang, Y.; Ye, Y.; Sun, M.; Ren, H.; Cheng, W.; Zhang, H. Interpretable Pulmonary Disease Diagnosis with Graph Neural Network and Counterfactual Explanations. In IEEE International Conference on Systems, Man, and Cybernetics; IEEE: New York, NY, USA, 2023. [Google Scholar] [CrossRef] [Scilit]
  24. Sukumal, B.; Aueawatthanaphisut, A. Dual-Modal Lung Cancer AI: Interpretable Radiology and Microscopy with Clinical Risk Integration. arXiv 2026, arXiv:2604.16104. [Google Scholar] [CrossRef] [Scilit]
  25. Tong, G.; Xue, Z.; Dang, T.; Cao, T. Lung Nodule Malignancy Classification on 3D CT Images Using a Cosine Similarity-Enhanced Graph Attention Network. In Proceedings of the 47th Annual International Conference of the IEEE Engineering in Medicine and Biology Society (EMBC), Copenhagen, Denmark, 14–18 July 2025; pp. 1–6. [Google Scholar] [CrossRef] [Scilit] [PubMed]
  26. Al-Shabi, M.; Lee, H.K.; Tan, M. Gated-Dilated Networks for Lung Nodule Classification in CT Scans. IEEE Access 2019, 7, 178827–178838. [Google Scholar] [CrossRef] [Scilit]
  27. Shivwanshi, R.R.; Nirala, N.S. A Hybrid AI Method for Lung Cancer Classification Using Explainable AI Techniques. Phys. Medica 2025, 134, 104985. [Google Scholar] [CrossRef] [Scilit] [PubMed]
  28. Ying, Z.; Bourgeois, D.; You, J.; Zitnik, M.; Leskovec, J. GNNExplainer: Generating Explanations for Graph Neural Networks. In Proceedings of the 33rd Conference on Neural Information Processing Systems (NeurIPS), Vancouver, BC, USA, 8–14 December 2019. [Google Scholar]
  29. Paszke, A.; Gross, S.; Massa, F.; Lerer, A.; Bradbury, J.; Chanan, G.; Killeen, T.; Lin, Z.; Gimelshein, N.; Antiga, L.; et al. PyTorch: An Imperative Style, High-Performance Deep Learning Library. In Proceedings of the 33rd International Conference on Neural Information Processing Systems (NeurIPS), Vancouver, BC, Canada, 8–14 December 2019; Volume 32, pp. 8024–8035. [Google Scholar]
  30. Harris, C.R.; Millman, K.J.; van der Walt, S.J.; Gommers, R.; Virtanen, P.; Cournapeau, D.; Wieser, E.; Taylor, J.; Berg, S.; Smith, N.J.; et al. Array Programming with NumPy. Nature 2020, 585, 357–362. [Google Scholar] [CrossRef] [Scilit] [PubMed]
  31. Cardoso, M.J.; Li, W.; Brown, R.; Ma, N.; Kerfoot, E.; Wang, Y.; Murrey, B.; Myronenko, A.; Zhao, C.; Yang, D.; et al. MONAI: An Open-Source Framework for Deep Learning in Healthcare. arXiv 2022, arXiv:2211.02701. [Google Scholar]
  32. Gu, Y.; Chi, J.; Liu, J.; Yang, L.; Zhang, B.; Yu, D.; Zhao, Y.; Lu, X. A Survey of Computer-Aided Diagnosis of Lung Nodules from CT Scans Using Deep Learning. Comput. Biol. Med. 2021, 137, 104806. [Google Scholar] [CrossRef] [Scilit] [PubMed]
  33. Chang, C.; Zhao, Q.; Zhao, L.; Yang, X. Explainable AI for Lung Nodule Detection and Classification in CT Images. In SPIE Medical Imaging Conference; SPIE: Bellingham, WA, USA, 2024. [Google Scholar] [CrossRef] [Scilit]
  34. Lundberg, S.M.; Lee, S.-I. A Unified Approach to Interpreting Model Predictions. In Proceedings of the 31st Conference on Neural Information Processing Systems (NeurIPS), Long Beach, CA, USA, 4–9 December 2017; Volume 30. [Google Scholar]
  35. Veličković, P.; Cucurull, G.; Casanova, A.; Romero, A.; Liò, P.; Bengio, Y. Graph Attention Networks. In Proceedings of the International Conference on Learning Representations (ICLR), Vancouver, BC, Canada, 30 April–3 May 2018. [Google Scholar]
  36. Zhu, W.; Liu, C.; Fan, W.; Xie, X. DeepLung: 3D Deep Convolutional Nets for Automated Pulmonary Nodule Detection and Classification. In IEEE Winter Conference on Applications of Computer Vision (WACV); IEEE: New York, NY, USA, 2018; pp. 673–681. [Google Scholar]
  37. He, K.; Zhang, X.; Ren, S.; Sun, J. Deep Residual Learning for Image Recognition. In IEEE Conference on Computer Vision and Pattern Recognition (CVPR); IEEE: New York, NY, USA, 2016; pp. 770–778. [Google Scholar]
  38. Tran, D.; Wang, H.; Torresani, L.; Ray, J.; LeCun, Y.; Paluri, M. A Closer Look at Spatiotemporal Convolutions for Action Recognition. In IEEE Conference on Computer Vision and Pattern Recognition (CVPR); IEEE: New York, NY, USA, 2018. [Google Scholar]
  39. Selvaraju, R.R.; Cogswell, M.; Das, A.; Vedantam, R.; Parikh, D.; Batra, D. Grad-CAM: Visual Explanations from Deep Networks via Gradient-Based Localization. In IEEE International Conference on Computer Vision (ICCV); IEEE: New York, NY, USA, 2017; pp. 618–626. [Google Scholar]
  40. Kipf, T.N.; Welling, M. Semi-Supervised Classification with Graph Convolutional Networks. In Proceedings of the International Conference on Learning Representations (ICLR), Toulon, France, 24–26 April 2017. [Google Scholar]
  41. Rajkumar, K.V.; Kachapuram, B.R.; Sudhakar, G.; Bhukya, S.; Thota, P.; Bharat Siva Varma, P. Multi-Scale Attention-Driven Deep Learning Framework for Lung Cancer Classification from CT Images. Discov. Comput. 2026, 29, 371. [Google Scholar] [CrossRef] [Scilit]
  42. Lin, C.; Jiang, H.; Ma, S.; Tang, J.; Ning, Y.; Jin, L.; He, W.; Bai, J.; Xiong, Z.; Zhu, B.; et al. Multi-Center Validated Attention-BiFPN Deep Learning for CT-Based Lung Cancer Subtype Classification. Eur. J. Med. Res. 2026. [Google Scholar] [CrossRef] [Scilit]
  43. Chen, T.; Guestrin, C. XGBoost: A Scalable Tree Boosting System. In 22nd ACM SIGKDD International Conference on Knowledge Discovery and Data Mining (KDD); ACM: New York, NY, USA, 2016; pp. 785–794. [Google Scholar]
  44. Zhao, D.; Xi, J.; Guo, X.; Chai, J.; Xu, Z.; Li, L.; Xue, Y.; Sun, Q.; Zheng, Y.; Liu, S. Graphicalized Vision-Language Modeling for Comprehensive Lung Nodule Analysis and Risk Stratification. npj Digit. Med. 2026, 9, 442. [Google Scholar] [CrossRef] [Scilit] [PubMed]
Figure 1. Overview of the multimodal preprocessing pipeline adopted for the proposed R-GGFN framework.
Information 17 00839 g001
Figure 2. Flow diagram of the proposed model.
Information 17 00839 g002
Figure 3. Tabular MLP flow diagram.
Information 17 00839 g003
Figure 4. R-GGFN forward pass with skip connection.
Information 17 00839 g004
Figure 5. Explainable AI components layered on the R-GGFN.
Information 17 00839 g005
Figure 6. AUROC comparison of baseline models.
Information 17 00839 g006
Figure 7. PR-AUC comparison of baseline models.
Information 17 00839 g007
Figure 8. Late fusion confusion matrix.
Information 17 00839 g008
Figure 9. Gated Fusion confusion matrix.
Information 17 00839 g009
Figure 10. Naïve GGFN Confusion Matrix.
Information 17 00839 g010
Figure 11. Confusion matrix of the proposed R-GGFN.
Information 17 00839 g011
Figure 12. Accuracy, AUROC, and PR-AUC performance profiles across all evaluated model configurations.
Information 17 00839 g012
Figure 13. R-GGFN training dynamics.
Information 17 00839 g013
Figure 14. GradCAM-3D saliency maps for the most confident true-positive, true-negative, false-positive and false-negative validation-set predictions.
Information 17 00839 g014
Figure 15. SHAP analysis of tabular branch.
Information 17 00839 g015
Figure 16. GAT attention analysis.
Information 17 00839 g016
Table 1. Comparative analysis of CNN-based, multimodal fusion-based, graph neural network-based, and explainable AI-based approaches for lung nodule classification, including the proposed R-GGFN framework.
ReferenceDatasetSample SizeReference StandardModel TypeValidation DesignExplainability MethodPerformance
Aamir et al. (2024) [12]Public CT lung cancer dataset4500 CT images/casesLung cancer/tissue classification labelsDenseNet + CNN-based multimodal data fusion with Mobile Edge ComputingReported in the original studyNoneAccuracy 99.3%; Precision 99.3%; Recall 99.3%; F1-score 99.3%
Pushpa et al. (2023) [18]Multimodal lung tumor data including CT images, clinical, and molecular informationNot reported Not reportedCNN + Graph Neural Network for multimodal lung tumor analysisReported in the original studyNoneAccuracy: 85%
Saihood et al. (2024) [13]LIDC-IDRI; LUNGx for external evaluationLIDC-IDRI: 1570 nodules (858 malignant, 712 benign); LUNGx: 73 nodules from 60 CT scans (37 benign, 36 malignant)Radiologist-assigned LIDC-IDRI malignancy scores; score 3 treated as undetermined and excluded from the final binary setMulti-side Graph Neural Network with attention-based local co-occurrence feature fusion10-fold cross-validation on LIDC-IDRI; external testing on unseen LUNGxGraph/attention-based interpretability analysisLIDC-IDRI: 87.17% Accuracy, 95.00% AUC; LUNGx: 69.86% Accuracy, 70.20% AUC
Tong et al. (2025) [25]LIDC-IDRINot reported LIDC-IDRI radiologist-assigned malignancy ratings3D CNN + cosine-similarity graph + Graph Attention Network (CSEGAT)Patient-level classification; exact split not reported in accessible informationnoneAccuracy: 90.85%. Sensitivity: 88.84%. Specificity: 90.65%
Shivwanshi & Nirala (2025) [27]Public CT datasetNot reported Five-class lung-nodule malignancy classificationRadiomic features + InceptionNet + Vision Transformer + XGBoost feature selection + CatBoostNot clearly reported in accessible informationSHAPAccuracy: 96.74%; Precision: 93.68%; Recall: 96.74%; F1: 95.19%; AUC: 99.76%
Proposed R-GGFN (2026)LIDC-IDRI867 patients; 2602 nodulesConsensus LIDC-IDRI radiologist-assigned malignancy rating; mean S ≥ 3 = malignant, S < 3 = benign3D ResNet-18 + MLP semantic encoder + gated multimodal fusion + GAT + tabular skip connectionPatient-level split: 70% training (606 patients, 1820 nodules), 15% validation (130 patients, 356 nodules), and 15% held-out test (131 patients, 426 nodules); test set accessed once after model selection3D Grad-CAM + SHAP + GAT attention visualizationAccuracy: 85.21%; AUROC: 0.9147; PR-AUC: 0.9213; F1: 0.8609
Table 2. Feature comparison table.
Method3D CTClinical FeaturesMultimodal FusionGraph LearningSkip ConnectionFocal LossMulti-XAIExternal Validation
Aamir et al. [12]
Pushpa et al. [18]
Saihood et al. [13]Partial
CSEGAT [25]Partial
Hybrid AI + SHAP [27]
Proposed R-GGFN
Note: ✓ indicates that the feature is present, whereas ✗ indicates that the feature is absent or not reported.
Table 3. The three explanation methods and the questions they answer.
MethodBranchAttachment PointQuestion Answered
GradCAM-3DImageLayer 4 of R3D-18 forward + backward
hook on the last convolutional block
Which 3D voxel regions most drove the
predicted class?
SHAP
Kernel-Explainer
TabularMLP backbone + tabular skip connection path, evaluated via a self-loop-only GATConv pass (no cross-nodule graph)Which of the 8 radiologist annotation features pushed the output toward or away from malignancy?
Gat AttentionGraphreturn_attention_weights = True, attention edge weights collected across the validation setHow much did each neighboring patient (co-patient) node contribute contextual information to the prediction?
Table 4. Performance table of baseline models.
ModelAccuracyF1AUROCPR-AUCPrecisionRecallSpecificity
3D ResNet (best epoch 10)63.15%0.6390.6980.7620.6810.6020.667
Tabular MLP (best epoch 9)68.31%0.7100.7420.7520.7050.7140.646
XGBoost (best round 16)67.61%0.7090.7640.7810.6910.7270.615
Note: each baseline is now trained to a fair, extended epoch budget with a single pre-registered checkpoint-selection criterion (Section 4.7); the previous 2-epoch snapshots are superseded.
Table 5. Performance table of multimodal fusion.
ModelBest EpochAccuracyF1AUROCPR-AUCRecall (Malignant)
Late Fusion967.61%0.7230.7430.7690.779
Gated Fusion867.84%0.7140.7460.7720.740
Table 6. Training results of Naïve GGFN.
EpochAcc.PrecisionRecallF1Sens.Spec.AUROCPR-AUC
10.48600.47561.00000.64471.00000.03680.62550.5791
20.47470.47031.00000.63971.00000.01580.67740.6630
30.61800.56880.74700.64580.74700.50530.69640.6719
40.66570.63740.65660.64690.65660.67370.71590.6846
50.66010.60980.75300.67390.75300.57890.73200.7038
60.69380.65410.72890.68950.72890.66320.74800.7040
70.69940.66120.72890.69340.72890.67370.75750.7215
80.66290.60270.81330.69230.81330.53160.75970.7265
90.68820.64100.75300.69250.75300.63160.75900.7148
100.65730.59090.86140.70100.86140.47890.75010.6987
Table 7. Training result of R-GGFN.
EpochAcc.PrecisionRecallF1Sens.Spec.AUROCPR-AUC
10.59550.68330.24700.36280.24700.90000.70480.6921
20.62920.62500.51200.56290.51200.73160.75960.7483
30.67700.67590.59040.63020.59040.75260.80410.7925
40.74720.72890.72890.72890.72890.76320.84130.8338
50.77250.74850.77110.75960.77110.77370.86270.8564
60.78370.79870.71690.75560.71690.84210.87890.8721
70.80900.81820.75900.78750.75900.85260.89040.8856
80.81460.82470.76510.79380.76510.85790.89820.8946
90.81740.84350.74700.79230.74700.87890.90560.8915
100.82300.84560.75900.80000.75900.87890.91010.8884
Table 8. Best test-set performance across all models.
ModelTypeAcc.AUROCPR-AUCF1
3D ResNetImage-only63.15%0.6980.7620.639
Late FusionMultimodal67.61%0.7430.7690.723
Gated FusionMultimodal67.84%0.7460.7720.714
Naïve GGFNMultimodal + Graph61.97%0.6930.7010.695
Tabular MLPTabular-only68.31%0.7420.7520.710
XGBoostTabular-only67.61%0.7640.7810.709
R-GGFNMultimodal + Graph85.21%0.91470.92130.861
Table 9. Comparison of the proposed R-GGFN with recent state-of-the-art lung cancer classification methods.
ReferenceDatasetImage ModalityMultimodal FusionGraph LearningExplainable AIKey ContributionReported Performance Limitation
Aamir et al. (2024) [12]Public CT DatasetCTCNN-based multimodal feature fusion with Mobile Edge ComputingReported in original paperNo graph reasoning or interpretable predictions
Pushpa et al. (2023) [18]Public Lung Cancer DatasetCT(GNN)Early multimodal GNN frameworkReported in original paperLimited graph modeling and no explainability
Saihood et al. (2024) [13]LIDC-IDRICT(Attention GNN)Partial (Attention)Attention-based graph learning for lung nodulesReported in original paperImage-only learning without radiologist annotations
CSEGAT (2025) [25]LIDC-IDRI3D CT(Cosine Similarity GAT)Partial (Attention)Graph Attention with cosine similarity graph constructionReported in original paperNo multimodal fusion or comprehensive XAI
Hybrid AI + SHAP (2025)
[27]
Public CT DatasetCT + Clinical(SHAP)Explainable multimodal CNN frameworkReported in original paperNo graph-based contextual learning
My Proposed R-GGFNLIDC-IDRI3D CT + Radiologist Semantic Features(Graph Attention Network)(Grad-CAM, SHAP, GAT Attention)Graph-guided multimodal fusion with tabular skip connection, optimization strategy, and multi-level explainabilityAccuracy = 85.21%, AUROC = 0.9147, PR-AUC = 0.9213, F1 = 0.8609Requires external multi-center validation
Note: ✓ indicates that the feature is present, whereas ✗ indicates that the feature is absent or not reported.
Disclaimer/Publisher’s Note: The statements, opinions and data contained in all publications are solely those of the individual author(s) and contributor(s) and not of MDPI and/or the editor(s). MDPI and/or the editor(s) disclaim responsibility for any injury to people or property resulting from any ideas, methods, instructions or products referred to in the content.