Article

Exploring Visual-Based Sprint Evaluation Using Convolutional Neural Networks and Agile Project Metrics

by
Yadira Jazmín Pérez Castillo
1,*,
Sandra Dinora Orantes Jiménez
1,*,
José Juan Carbajal Hernández
1,
Patricio Orlando Letelier Torres
2,
María Elena Acevedo Mosqueda
3 and
Vanessa Alejandra Camacho Vázquez
4
1
Centro de Investigación en Computación, Instituto Politécnico Nacional, México City 07738, Mexico
2
Departament de Sistemes Informàtics i Computació, Universitat Politècnica de València, 46022 Valencia, Spain
3
ESIME Zacatenco, Instituto Politécnico Nacional, México City 07738, Mexico
4
Escuela Superior de Cómputo, Instituto Politécnico Nacional, México City 07738, Mexico
*
Authors to whom correspondence should be addressed.
Information 2026, 17(9), 813; https://doi.org/10.3390/info17090813
Submission received: 26 July 2026 / Revised: 19 August 2026 / Accepted: 20 August 2026 / Published: 23 August 2026
(This article belongs to the Special Issue Software Applications Programming and Data Security)

Abstract

Agile project monitoring commonly relies on numerical metrics and visual artifacts, such as Burndown charts, to assess Sprint progress and identify potential deviations. However, most automated approaches focus on structured data, while the visual patterns contained in agile charts remain underexplored. This paper presents an exploratory study on visual-based Sprint evaluation using convolutional neural networks and agile project metrics. The proposed approach uses Burndown and Completed vs. Uncompleted Work chart (TTvsNT) images to classify Sprint performance into four categories: Poor, Regular, Good, and Excellent. A transfer-learning strategy based on MobileNetV2 was applied, including image preprocessing, Sprint-level data partitioning, two-phase training, and multiclass evaluation. The model achieved an overall accuracy of 70.33% on the evaluation set. Class-level results showed better performance for the Poor and Excellent categories, while the intermediate classes presented greater ambiguity. The main contribution of this study lies in evaluating Sprint monitoring charts as a complementary visual representation to traditional metric-based models. The findings provide preliminary evidence that these images contain useful performance-related patterns; however, the limited dataset size and current accuracy do not support production-level deployment. Further research with larger datasets, additional architectures, and multimodal approaches is required.

1. Introduction

Software development in agile environments has gained prominence in recent years due to several factors, such as the key involvement of the client throughout each development cycle. At every stage of these cycles, known as Sprints, valuable data is generated that is essential for timely project monitoring, primarily because it allows problems to be detected early on.
Current tracking approaches typically use metrics, such as user story points; however, the visual representations offered by the agile approach, such as burndown or burnup charts, visually depict the evolution of remaining work throughout the Sprint, revealing team behaviors that produce distinct patterns which are characteristic of these charts; this suggests the existence of visual patterns associated with Sprint performance. This can help determine whether there is a risk of failing to complete the activities planned for a Sprint on time, which could lead to development delays, possible adjustments to the backlog, etc.
The analysis of these visual representations, particularly in multi-project environments, where more than one project is tracked simultaneously, holds great potential for analysis using artificial intelligence techniques. However, a review of the current literature reveals that few studies have explored the use of images from agile projects in conjunction with machine learning (ML) techniques, specifically convolutional neural networks (CNNs). The current studies use tabular metrics, such as completed story points, Sprint velocity, defect counts, etc., as input for ML models; in contrast, visual representations could capture temporal relationships and behavioral patterns that are difficult to model using isolated numerical variables.
Therefore, the objective of this exploratory study is to analyze whether visual representations of Sprints contain useful information for their automatic classification using techniques such as CNNs. The main contributions of this work are:(1) the construction of a preliminary visual dataset of agile Sprints, (2) the exploration of CNN-based models for classifying Sprint performance, and (3) an analysis of the opportunities and limitations of visual Sprint evaluation in agile project monitoring.
This study differs from our previous work [1] in both data representation and modeling strategy. The previous study represented each Sprint through structured numerical metrics and evaluated conventional machine learning algorithms. In contrast, the present work constructs a new image-based dataset composed of Burndown and TTvsNT charts and investigates whether a CNN can learn performance-related patterns directly from visual Sprint representations. Therefore, the novelty of the present study does not lie in proposing a new class taxonomy but in evaluating an alternative visual modality and analyzing its potential to complement the prior metric-based approach.
This paper is organized as follows: Section 2 identifies related work; Section 3 presents the study design; Section 4 details the construction of the preliminary visual dataset of agile Sprints; Section 5 describes the exploratory evaluation process of CNNs for classifying Sprints; Section 6 presents the key results of the study; and Section 7 discusses the findings. Finally, the conclusions and proposals for future research are presented in Section 8 and Section 9, respectively.

2. Background and Related Work

2.1. Agile Project Monitoring

Agile software development (ASD) is characterized by organizing work in iterative and incremental cycles, in which teams plan, execute, inspect and adapt their activities continuously. In Scrum, each Sprint represents a defined time interval in which the aim is to achieve a specific objective and generate an increase in value for the product. During each iteration, the team must inspect progress towards the Sprint goal and adapt the Sprint backlog when necessary, so monitoring becomes a critical activity to identify deviations, delays, or risks before the iteration ends [2] [3].
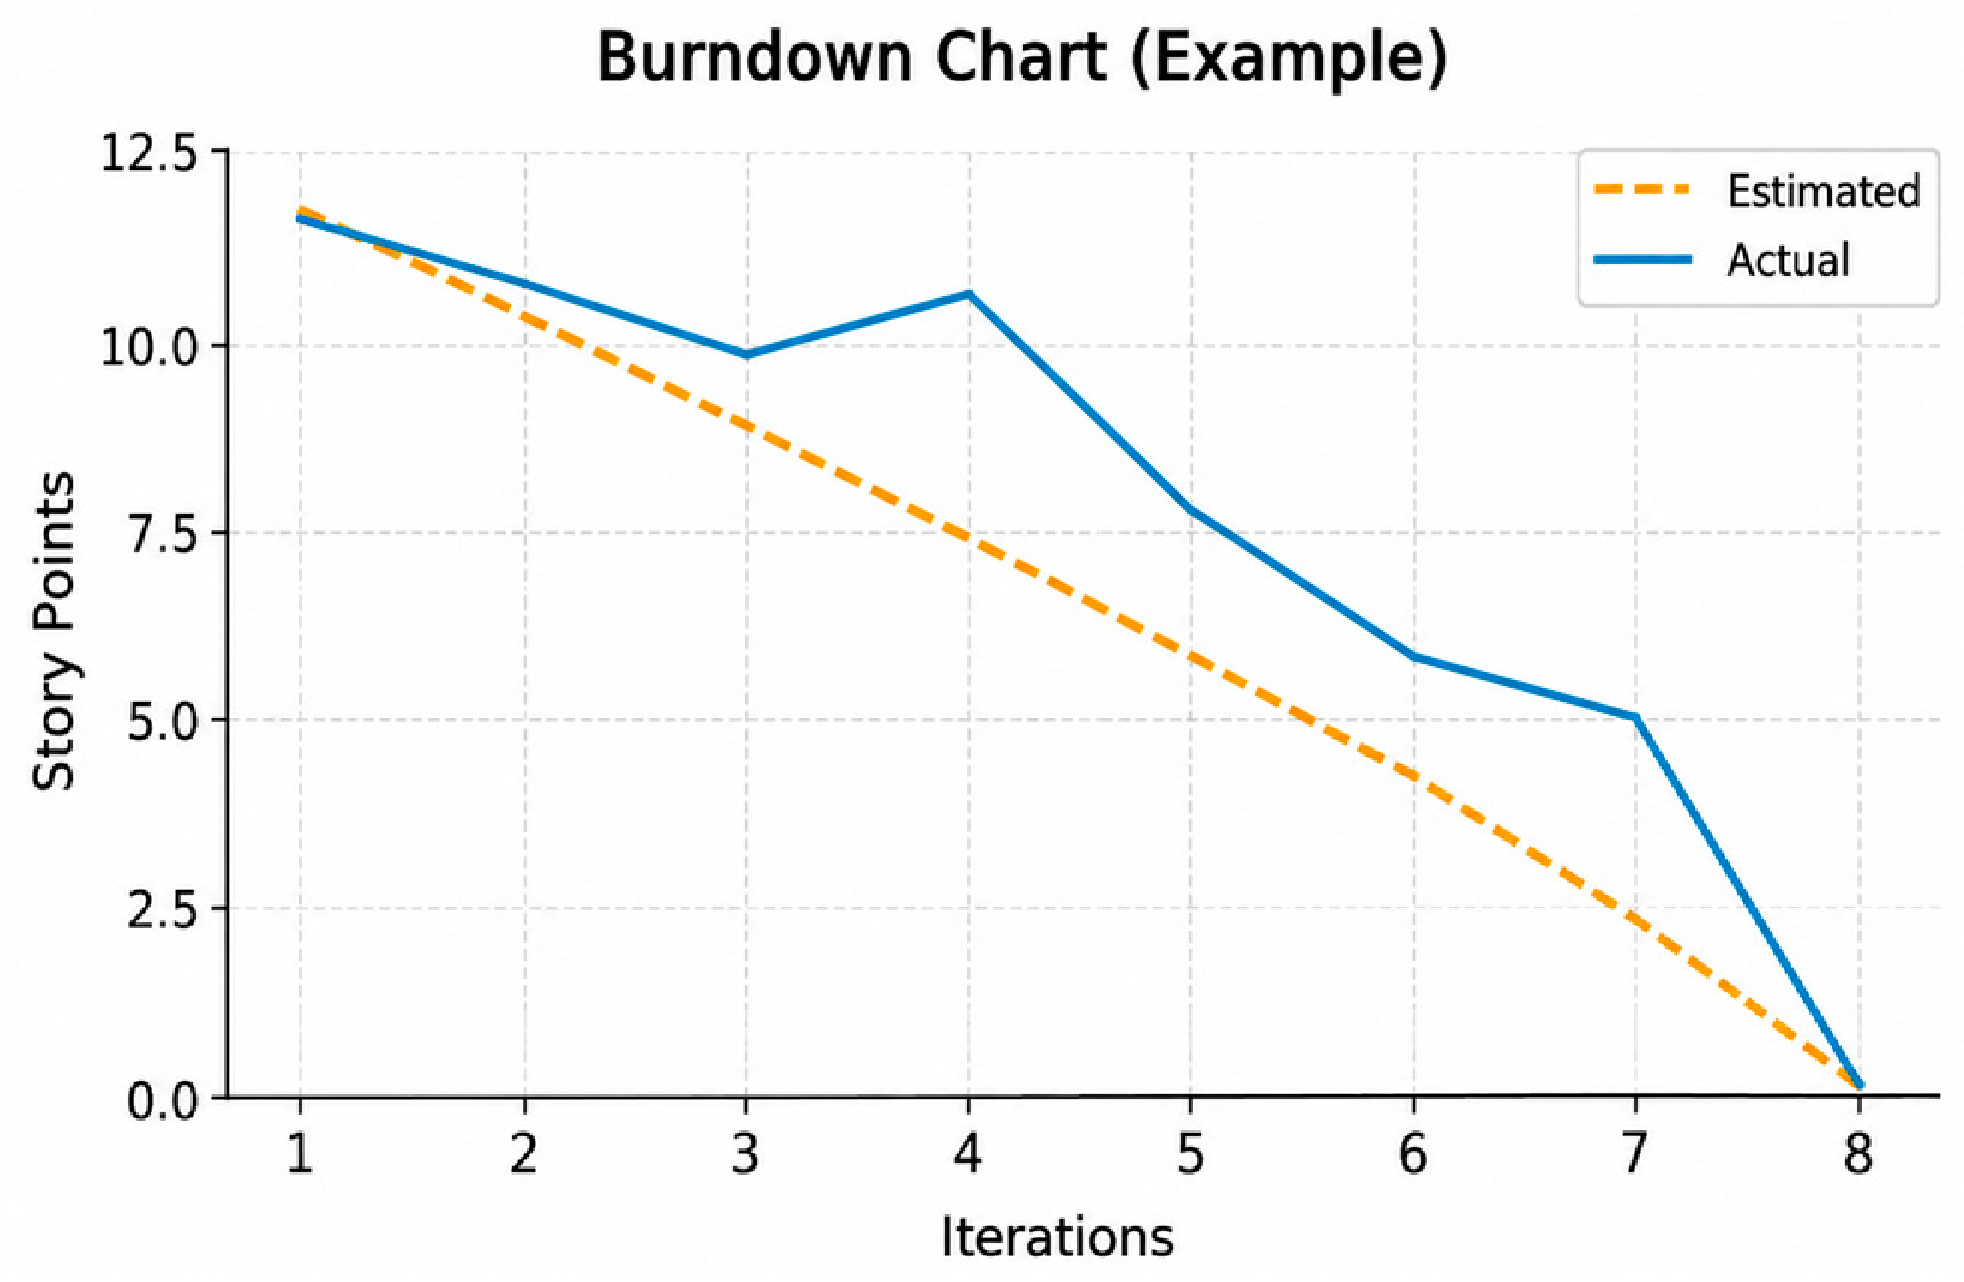
The monitoring of Sprints is usually supported by agile metrics and visual representations that allow the evolution of the work to be observed. Among these tools, the Burndown chart (Figure 1) is one of the most widely used, as it shows the amount of work remaining over time and allows the comparison of actual progress with expected progress [4]. Figure 1 is a general illustrative example included to explain the structure and interpretation of a Burndown chart; it is not part of the visual dataset used in the experiments. The vertical axis is expressed in Story Points because this unit is commonly used to represent estimated Sprint effort. In contrast, the charts extracted from Worki and used in the experimental dataset may represent work effort in hours, according to the configuration of the corresponding project. This difference in measurement units does not affect the image-based classification process, since the model receives the complete chart as a visual representation rather than directly processing the numerical values of the axes.
Likewise, metrics such as velocity, work completed, backlog, cycle time, and cumulative flowcharts can provide useful insights into team performance, bottlenecks, and deliverability in future iterations. Recent studies indicate that performance metrics in agile development are widely used in practice, although they also present challenges related to their application, transparency and standardization [5].
However, while these metrics and visualizations offer valuable insights, their interpretation often depends on the expertise of the Scrum Master, project leader, or team itself. This can introduce a degree of subjectivity, especially when monitoring multiple projects, teams, or Sprints simultaneously [6].
In this context, the early detection of problematic Sprints is relevant, since behaviors such as backlog of backlogs, irregular progress, low speed, or late completion of tasks can affect the fulfillment of Sprint objectives.
Previous work has pointed out the importance of evaluating progress and the pace of work during Sprints using data derived from agile tracking tools, including information associated with graphs such as the Burndown chart [4]. Therefore, agile monitoring can benefit from computational approaches that enable the identification of performance patterns and support decision-making before the negative outcome of the Sprint is evident.

2.2. Machine Learning in Agile Software Development

ML has been increasingly explored within Software Engineering and Agile Project Management (APM) due to its ability to analyze historical data, identify patterns, and support decision-making processes. In agile contexts, ML techniques have been applied to tasks such as effort estimation, planning, risk identification, task assignment, productivity analysis, quality improvement, and project performance prediction [7] [8] [9]. These applications are relevant because agile environments continuously generate data through backlogs, user stories, tasks, estimates, progress logs, and tracking metrics.
The systematic review carried out on the current literature on ML applied to APM allowed us to identify the most used techniques and detect areas of opportunity within this field [7].
In a complementary way, other studies have shown that ML can contribute to efficiency in agile management by supporting planning, risk identification, task assignment and improving code quality [10] [11]. In addition to traditional ML models, deep learning approaches have been proposed to estimate story points, based on user stories [12].
Within this line of research, Sprint performance can be approached as a classification problem, where each Sprint is represented by a set of attributes derived from its behavior and subsequently assigned to a performance category. In previous work, evaluating the progress and speed of the Sprints was proposed, using numerical data obtained from agile tracking representations, to provide an objective and quantifiable perspective of the progress of the work [1]. This approach reduces the exclusive dependence on manual interpretation and generates additional evidence to support corrective actions.
However, most of the approaches identified focus on structured data or numerical metrics. While this data is useful, agile tools also produce visual representations, such as burndown charts, that can contain shape patterns related to Sprint behavior. Therefore, in addition to the tabular analysis of metrics, there is the possibility of studying the performance of the Sprint from a visual perspective.

2.3. Convolutional Neural Networks for Visual Pattern Recognition

Convolutional neural networks (CNNs) are deep learning models that are particularly suitable for image analysis and visual pattern recognition. This type of network learns hierarchical representations from the data so that the first layers can capture simple features, such as edges or shapes, while the later layers can represent more complex visual structures [13]. Because of this capability, convolutional networks have been widely used in image classification, object detection, and visual recognition tasks.
CNNs continue to be a relevant approach for image-based classification tasks, as they allow hierarchical visual patterns to be automatically learned without relying on manual feature extraction [14]. In software engineering, CNN-based models have also been applied in predictive tasks, such as defect prediction, by combining semantic representations and traditional metrics [9] [15].
In addition, recent studies on time-series-to-image approaches show that temporal behavior can be transformed into visual representations that can be classified using a CNN [16]. This supports the idea that Sprint burndown charts, such as burndown charts and Completed vs. Uncompleted work visualizations, can contain useful patterns for evaluating Sprint performance.
In the context of this research, convolutional networks are relevant because agile tracking graphs can be analyzed as images that summarize work behavior during a Sprint. Instead of extracting only numerical metrics, an image-based model could learn visual patterns associated with different levels of performance. For example, a steady drop in backlog, a flat line for several days, or an abrupt reduction at the end of the Sprint can all represent distinct visual behaviors that could be related to the outcome of the iteration.
Transfer learning is especially useful when the available dataset is limited. This strategy involves using a pre-trained model on a large dataset and adapting it to a specific new task [17]. Instead of training CNN from scratch, the model reuses previously learned general visual features and adjusts its final layers to the new problem. This can reduce computational costs and improve performance when large volumes of labeled images are not available.
Visual analytics systems have also been proposed to support the interpretation and comparative assessment of convolutional neural networks. For example, VAC-CNN provides visual mechanisms for comparing CNN architectures, internal representations, and model behavior [18]. Although its objective differs from Sprint classification, it demonstrates the relevance of visual analytics for understanding CNN-based models.
Architectures such as MobileNetV2 and EfficientNetB0 are widely used in image classification tasks based on transfer learning. In particular, MobileNetV2 employs inverted residual blocks and linear bottlenecks, which enable the construction of efficient models for computer vision applications [19]. EfficientNet proposes a composite scaling strategy that balances network depth, width, and resolution to improve model efficiency and accuracy [20]. These architectures provide a good methodological basis for exploring whether Sprint graph images can be classified according to performance patterns.

2.4. Research Gap

Although machine learning has been applied in agile project management for tasks such as estimating, planning, risk identification, and evaluating Sprint performance, most studies have concentrated on the analysis of numerical metrics or structured data [1] [8] [12]. At the same time, agile monitoring often uses visual representations, such as burndown charts, which contain temporal information and behavioral patterns that may not be fully captured by isolated indicators.
An important research gap is identified: there are few studies that explore whether visual representations of Sprints can be used directly as input for deep learning models.
This gap motivates the present work, whose objective is to analyze the use of convolutional neural networks and transfer learning to classify the performance of Sprints from agile visual representations. In this way, the present study seeks to complement the analysis based on numerical metrics and contributes to the development of visual and data-driven approaches to the evaluation of Sprints.

3. Research Design

3.1. Research Objective

To explore the feasibility of using convolutional neural networks to classify Sprint performance based on visual representations derived from agile project metrics.

3.2. Research Questions

  • RQ1. Can visual representations of agile Sprints provide useful information for Sprint performance classification?
  • RQ2. How well can CNN-based models distinguish between poor, regular, good, and excellent Sprint performance?
  • RQ3. What methodological and performance limitations are observed when using a small visual dataset for exploratory Sprint classification?

4. Dataset Construction

4.1. Source of Sprint Data

The visual dataset used in this study was constructed from historical records of Sprints obtained from Worki [21], an agile management tool that belongs to the TUNE-UP Process [22]. In this case, the data source does not correspond directly to tabular numerical values but to graphical representations of the Sprint progress generated within the Worki dashboard.
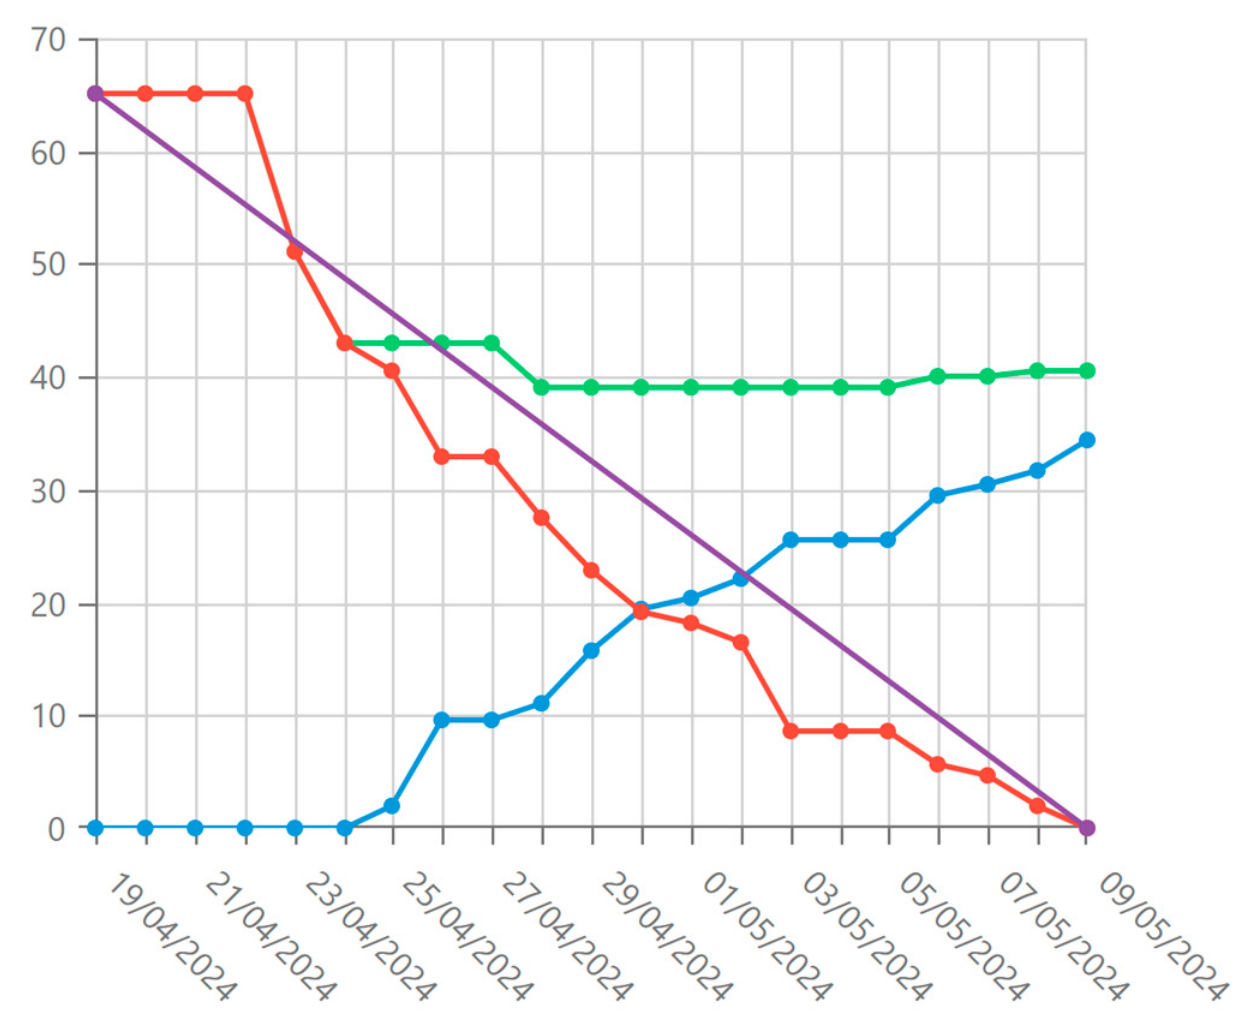
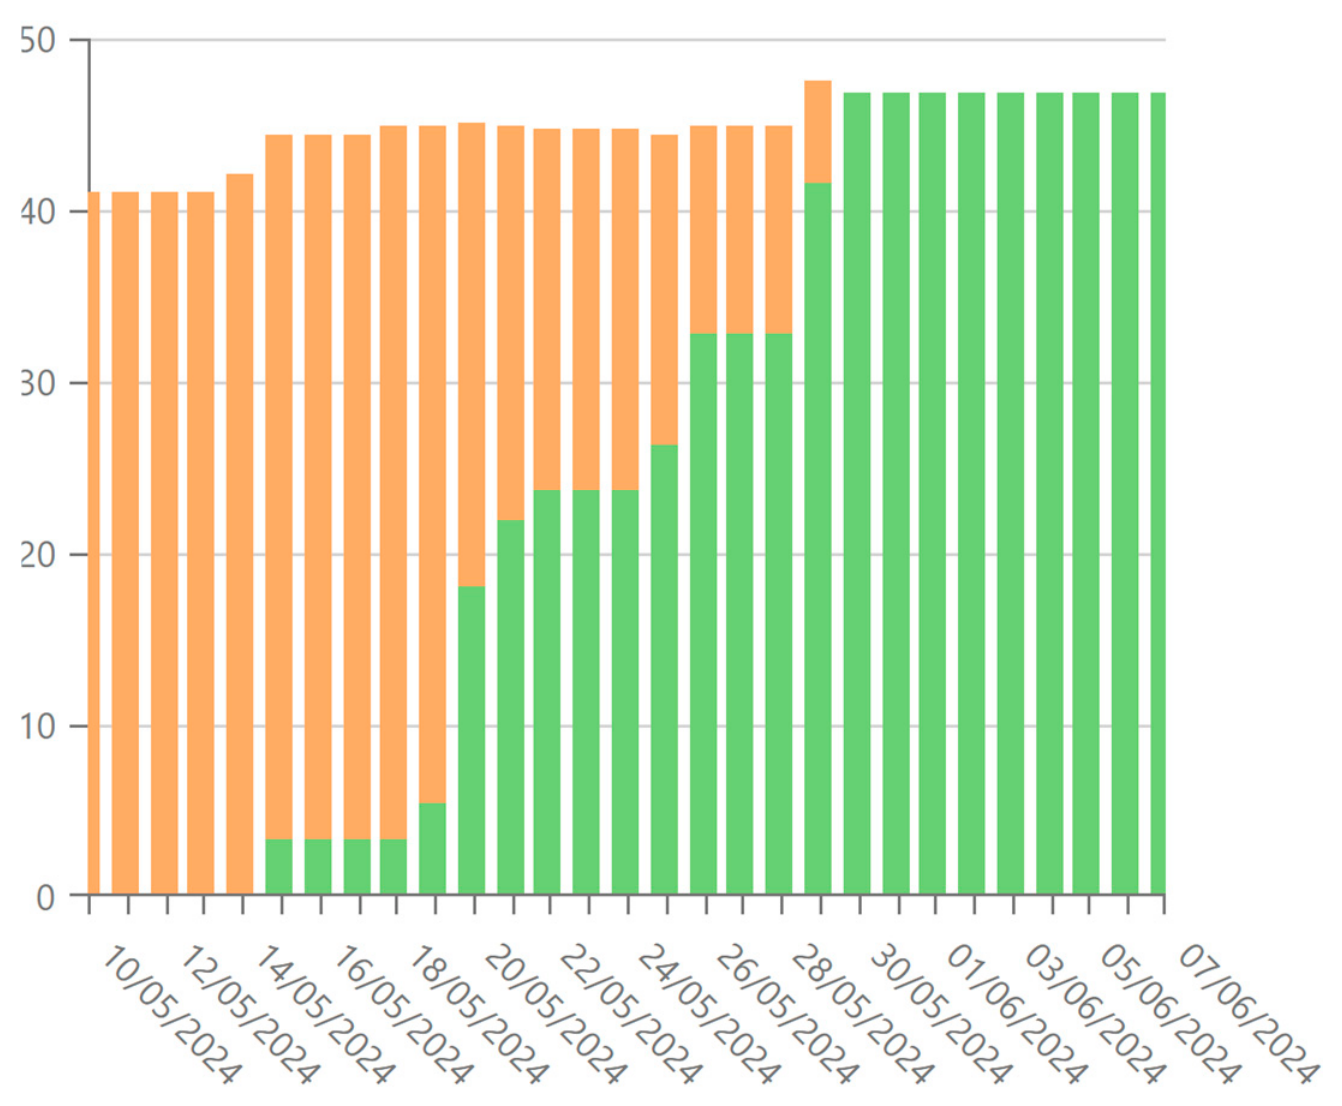
For the construction of the visual dataset, two main graphs associated with the monitoring of the pace and progress of work in the Sprints were considered: the Burndown graph (Figure 2) and the Completed vs. Uncompleted Work chart (TTvsNT) (Figure 3).
These graphs were selected because they provide a visual representation of Sprint behavior, including the reduction of pending work, the progress of completed work and possible irregularities in the pace of development. Unlike the tabular dataset previously constructed from the numerical series extracted using the Worki API [1,21], an image dataset was built for the CNN experiment. This image dataset was obtained through a script developed in Python 3.11.5, whose purpose was to automate the capture of the Burndown and TTvsNT graphs directly from the Worki interface.
The visual extraction process was carried out using the Playwright library [23] in a Python environment, since it enables automated and asynchronous control of a web browser. The script starts by setting up the work environment and creating a folder to store the captured images. Subsequently, the script opens a Chromium browser (The Chromium Projects, “Chromium,” Chromium.org. [Online]. Available: https://www.chromium.org/. [Accessed: 29 June 2026]), automatically accesses Worki, logs in, selects the corresponding job site, and navigates to the Sprint Dashboard module, where the graphs used for analysis are located.
Once inside the dashboard, the script goes through the different lines of work available and, for each of them, iterates through the Sprints defined on the platform. In each combination of work line and Sprint, the system waits for the complete update of the graphs and then captures the images corresponding to Burndown and TTvsNT. In this way, each Sprint is visually represented by two images, one for each chart considered. Table 1 shows a summary of the items used in the experiment.
Finally, the set used for the CNN experiment was made up of 458 Sprints, considering both charts for each Sprint, which resulted in a total of 916 images. These images were organized into folders according to the same evaluation classes previously used: Excellent, Good, Regular and Poor. The final distribution was 121 Excellent, 79 Good, 120 Regular and 138 Poor Sprints, equivalent to 242, 158, 240 and 276 images respectively.

4.2. Sprint Labeling Procedure

The Sprint labels were not assigned through visual inspection of the Burndown or TTvsNT charts. Instead, the class of each Sprint was inherited from the metric-based evaluation procedure introduced in our previous study [1]. In that study, Sprint performance was determined from structured variables describing progress, work completion, pending work, velocity, and deviations from the expected behavior. Based on the resulting evaluation criteria, each Sprint was assigned to one of four mutually exclusive categories: Poor, Regular, Good, or Excellent. Therefore, no human expert manually labeled the images used in the present study, and inter-rater agreement was not applicable. The images were generated only after the Sprint class had been established using the previous metric-based procedure.

4.3. Dataset Limitations

Although the visual dataset allowed us to explore the use of CNNs for Sprint classification, it is important to recognize several limitations associated with the dataset.
First, the size of the dataset can be considered small for a deep learning-based approach, as CNNs typically require a larger number of images to learn visual patterns more robustly. The study acknowledges that, although the model managed to learn patterns of all classes, performance could be improved by incorporating more images from Sprints.
Another important limitation corresponds to the imbalance between classes. Although balanced weights were applied during model training, the distribution of the visual dataset was not completely uniform among the evaluation categories. This can influence the learning of the model, especially in those classes with less representation, and it can affect the ability to generalize to new Sprints.
In addition, some classes exhibit similar visual behaviors. This occurs mainly in the intermediate classes, such as Regular and Good, where the differences in the Burndown and TTvsNT graphs may be less apparent than in the extreme cases.
For example, a Poor Sprint may show clearer visual signs of anomaly, while an Excellent Sprint may exhibit a more stable forward pattern; however, intermediate cases may share close visual features, making them difficult to separate using CNN.
This difficulty is also reflected in the results of the model. In the confusion matrix of the CNN experiment, classification errors are observed between close classes, particularly between Regular, Good, and Excellent. Likewise, the metrics obtained show that the Regular and Good classes achieved lower F1-scores than the extreme classes, suggesting that the network had greater difficulty distinguishing intermediate visual patterns.
Finally, it should be considered that the images were obtained through an automated capture process from Worki. As a result, the visual quality of the images may not be completely optimal for this type of experiment. The study indicates that improving the quality of the images generated by the extraction process could contribute to strengthening the performance of the model in future experiments.
Taken together, these limitations do not invalidate the results obtained, but they do allow them to be contextualized. The study should be understood as an initial exploration of the use of CNN for the visual evaluation of Sprints, with promising results but still subject to improvement through a larger, better-balanced dataset, with higher-quality images and with a greater diversity of agile scenarios.

5. Methodology

This section describes the methodological process followed to train and evaluate a CNN-based model for the visual classification of Sprints. Unlike the tabular approach, in this experiment the model input corresponds to images generated from Sprint tracking graphs, specifically the Burndown and Completed vs. Uncompleted Work graphs (TTvsNT). The objective was to analyze whether a CNN could identify visual patterns associated with the performance of the Sprint and classify each case into one of four categories: Poor, Regular, Good and Excellent.

5.1. Image Preprocessing

Prior to model training, the images extracted from Worki were preprocessed to standardize their format and ensure compatibility with the CNN architecture. First, all images were resized to 224 × 224 pixels, corresponding to the input size required by MobileNetV2.
The images were then converted to RGB format, preserving three color channels. Although grayscale conversion was initially explored, it was not used in the final experiment because it reduced model performance. Therefore, the original color information of the Worki charts was retained.
Pixel values were also normalized to an appropriate scale for neural network training. This step improved training stability and prevented differences in pixel-value ranges from affecting the optimization process.
The dataset was divided into training and evaluation subsets using a stratified 80/20 split, preserving the distribution of the four performance classes. To prevent data leakage, the partition was performed at the Sprint level rather than at the individual image level. Consequently, the Burndown and TTvsNT images associated with the same Sprint were always assigned to the same subset.
Data augmentation was not applied in the reported experiment. Since the input images are charts whose axes, orientation, and spatial relationships have semantic meaning, transformations such as flipping or substantial rotation were avoided because they could alter their interpretation.
Due to the limited dataset size and class imbalance, dropout and balanced class weights were used during training to reduce the risk of overfitting and bias toward the most represented classes.

5.2. CNN Architecture

For the visual classification of the Sprints, an approach based on transfer learning was explored because the image dataset was too limited to train a deep CNN from scratch. The use of transfer learning makes it possible to take advantage of previously trained architectures on large sets of images and adapt their upper layers to the specific problem of Sprint classification.
In this experiment, MobileNetV2 was used as the base architecture, since it is a lightweight and efficient convolutional network, suitable for scenarios where a model with good visual feature extraction capacity is required without excessive computational load. The base network was used as a feature extractor, while the upper layers were adapted to perform multiclass classification.
MobileNetV2 was selected as a representative lightweight transfer-learning architecture for this initial feasibility study. The objective was not to conduct an exhaustive architecture benchmark but to determine whether visual Sprint representations contain patterns that can be learned by CNN. Consequently, the results should be interpreted as evidence regarding the feasibility of the visual modality rather than evidence that MobileNetV2 is superior to other classical or deep learning models.
Additional classification-oriented layers were incorporated into the base architecture, including a dropout regularization layer with a value of 0.4 to reduce the risk of overfitting. Finally, an output layer with softmax activation and four neurons was added, corresponding to the Poor, Regular, Good, and Excellent classes. This configuration allowed the model to learn visual patterns present in the Burndown and TTvsNT graphs, such as reduction of pending work, accumulation of uncompleted work, continuity of progress and behaviors associated with anomalies in Sprint development.

5.3. Training Strategy

The training of the model was carried out in two phases. In the first phase, the convolutional base was kept frozen so that only the upper layers added for the classification of the problem were trained. This stage allowed the final classifier to be adapted to the four performance categories without initially modifying the weights learned by the network. In the second phase, fine-tuning was applied, allowing part of the pre-trained architecture to be adjusted to improve the adaptation of the model to the specific characteristics of the Sprint images. This strategy sought to improve the recognition of visual patterns typical of the graphs generated by Worki.
The partitioning of the dataset was performed using an 80/20 split, where 80% of the Sprints were used for training and the remaining 20% for evaluation, while both images associated with each Sprint were kept in the same subset. The division was carried out in a stratified way to preserve the distribution of the classes in both subsets.
Due to the imbalance between the categories, balanced weights were used per class during training. This decision sought to reduce the bias of the model towards classes with a greater number of examples and to favor the learning of patterns in less represented classes.
The main hyperparameters used are summarized in Table 2: image size of 224 × 224 pixels, batch size of 16, 50 epochs for the base phase, 50 epochs for the fine-tuning phase, dropout of 0.4, validation size of 20% and random seed equal to 42 to ensure reproducibility.

5.4. Evaluation Metrics

The performance of the CNN model was evaluated using metrics commonly used in multiclass classification problems. First, we considered the overall accuracy, which allows us to know the total proportion of correct predictions made by the model. In addition, precision, recall, and F1-score per class were used.
Precision allowed us to analyze how reliable the predictions made were for each category; the recall made it possible to measure the model’s ability to correctly identify the cases belonging to each class; and the F1-score allowed us to obtain a balanced measure between precision and recall.
The Macro F1-score was also considered because the dataset presents an imbalance between classes. This metric is useful because it calculates the average F1-score of all classes by giving equal weight to each one, regardless of the number of examples available per category.
Finally, a confusion matrix was used to analyze in greater detail the classification errors between classes. This matrix allowed us to observe which categories were most frequently confused, especially in intermediate cases such as Regular and Good, where visual patterns may be more similar to each other.

6. Results

This section presents the results obtained with the convolutional neural network model used for the visual classification of Sprint performance. The evaluation was carried out on an evaluation set of 91 instances, distributed in four performance categories: Poor, Regular, Good and Excellent. The analysis considers the overall performance of the model, its behavior by class and the study of the confusion matrix to identify the main patterns of success and failure.

6.1. Overall Performance

The CNN model achieved an overall accuracy of 70.33% in the evaluation set, correctly classifying 64 of 91 instances. This result indicates that visual representations of Sprint behavior, such as burndown graphs and TTvsNT graphs, contain relevant information to estimate their performance.
Although the model does not achieve a perfect classification, the result obtained is significant considering the preliminary nature of the study and the complexity of the task. Sprint performance categories do not always present clearly defined visual boundaries, especially in intermediate cases, where the differences between Poor, Good, and Excellent may depend on subtle variations in the evolution of the backlog, completed work, or compliance with expected Sprint progress. Overall, these results suggest that the use of visual information may be a viable alternative to support automated evaluation of Sprint performance in agile environments, particularly as a complement to traditional metrics-based approaches.

6.2. Performance by Class

Table 3 presents the classification report obtained for each category. The results show that the Poor class obtained the highest precision, with a value of 0.9048, indicating that when the model predicted that a Sprint belonged to this category, the prediction was correct in most cases. However, its recall was 0.7037, which means that some Poor Sprints were classified as other categories, mainly as Regular.
The Excellent class also performed solidly, with a precision of 0.7727, a recall of 0.7083 and an F1-score of 0.7391. This suggests that the model managed to identify several visual patterns associated with high-performance Sprints, although some cases were confused with nearby classes, especially with Good.
For the Good class, the model achieved a recall of 0.75, indicating that most of the actual instances in this category were successfully detected. However, its precision was 0.60, which shows that some predictions labeled as Good corresponded to other categories, mainly Regular or Excellent. The Regular class presented the lowest performance in terms of F1-score, with a value of 0.6154. This result is reasonable, since it is an intermediate category that shares visual characteristics with both low-performance Sprints and well-performing Sprints. In other words, the model had more difficulty distinguishing those cases where the behavior of the Sprint was neither clearly deficient nor clearly outstanding.
Taken together, these results show that the model was more effective at identifying more marked visual patterns, particularly in the Poor and Excellent classes. In contrast, the intermediate categories presented greater ambiguity, which is consistent with the gradual nature of Sprint performance.

6.3. Confusion Matrix Analysis

Table 4 presents the confusion matrix of the CNN model. The values on the main diagonal represent the correct classifications, while the values outside the diagonal correspond to classification errors between categories. The confusion matrix shows that the model correctly classified 19 instances of Poor, 16 of Regular, 12 of Good, and 17 of Excellent. The best behavior was observed in the Poor class, where most instances were correctly identified and there was no confusion with the Good class. This suggests that underperforming Sprints generate more distinctive visual patterns, for example, a slow decline in backlogs, deviations from expected progress, or a persistent backlog of uncompleted tasks.
The main source of confusion arose between the Poor and Regular classes, as 7 instances labeled as Poor were classified as Regular. This may indicate that some underperforming Sprints were still showing certain levels of progress that visually resembled intermediate behavior. Relevant confusions were also observed between the categories Regular, Good and Excellent. For example, some instances of Regular were rated as Good or Excellent, while some instances of Excellent were rated as Good or Regular. This behavior suggests that the transition between acceptable, good, and excellent performance levels is visually gradual, rather than a clearly defined separation.
Overall, the confusion matrix confirms that the model was able to capture visual patterns useful for evaluating Sprint performance. However, the observed errors also indicate that visual information alone may not be enough to separate all performance categories. This opens the possibility of exploring multimodal approaches in future work that combine graph images with numerical metrics from the Sprint, such as work completed, backlog, speed, cycle time or deviation from the expected progress.

7. Discussion

The results obtained allow us to discuss the feasibility of using visual representations of Sprints as input for deep learning models aimed at performance evaluation in agile projects. Although the CNN model developed in this study does not reach a sufficient level of accuracy to be considered a production-ready solution, the results suggest that agile tracking images contain useful patterns that can be learned by visual classification models.
In particular, the performance achieved by CNN shows that graphs generated during the Sprint, such as backlog and completed/uncompleted representations, can reflect behaviors associated with different levels of performance. This is relevant because, in many agile environments, these visualizations are mainly used as descriptive monitoring tools but not necessarily as data sources for predictive models or automatic classifiers.
A direct numerical comparison with the previous study [1] should be interpreted cautiously because the two experiments use different input representations and evaluation procedures. The previous approach classified Sprints from structured metrics, whereas the present model uses chart images. Therefore, the main purpose of the comparison is not to determine which model is universally superior but to establish whether visual representations provide an additional source of information that could be combined with numerical metrics in future work.

7.1. Feasibility of Visual Sprint Assessment

Visual evaluation of Sprints represents a viable line of research, especially when agile graphs are considered to visually summarize the evolution of work during an iteration. Unlike traditional numerical metrics, images can capture global patterns of behavior, such as cumulative delays, irregular progress, concentration of work at the end of the Sprint, or consistent compliance trends. The experimental results indicate that CNN was able to identify general patterns associated with the performance classes. The overall accuracy obtained shows that there is a visual signal in the images used; however, it also shows that the current dataset is still too limited to train a robust and generalizable model. For this reason, the results should be interpreted as preliminary evidence of feasibility and not as a definitive validation of the approach.
In addition, the confusion observed between close classes, particularly between Regular, Good, and Excellent, suggests that the visual boundaries between performance levels are not always clear. This is consistent with the gradual nature of Sprint performance, where small variations in the progress of work can change the final label without necessarily making a strong visual difference.

7.2. Main Findings

The first relevant finding is that Sprint tracking images do contain useful information for automatic performance ranking. CNN was able to learn visual patterns associated with the four categories analyzed: Poor, Regular, Good, and Excellent. This confirms that agile visualizations can be used not only as support for human interpretation but also as input for machine learning models.
The second finding is that extreme or visually differentiated classes tend to perform better. In particular, the Poor class obtained the highest precision, suggesting that underperforming Sprints can generate more obvious visual patterns, such as persistent delays, backlog of backlogs, or deviations from expected progress. Similarly, the Excellent class showed relatively stable performance, although with some confusion towards nearby classes. Excellent Sprints generally show more stable and consistent progress, whereas Regular Sprints present more gradual variations, interruptions, or temporary stagnation, making their visual patterns less distinctive.
The third finding is that the intermediate classes are more ambiguous. The Regular class obtained the lowest F1-score, which can be explained by the fact that it represents a transition zone between deficient behaviors and satisfactory behaviors. This category can share visual characteristics with both Poor and Good, making it difficult to separate them by images alone.
The fourth finding relates to the limitations of the dataset. Although the model achieved promising results, the visual dataset remains too small to train deep models with high generalizability. In addition, the distribution of classes can influence model performance, especially in categories with fewer instances or less defined visual patterns.
Taken together, these findings suggest that CNNs can learn general patterns from Sprint images, but that there is a need to expand the visual dataset, improve class balance, and explore additional training strategies to strengthen model performance.

7.3. Implications for Agile Project Monitoring

From the perspective of agile project monitoring, the results of this study open the possibility of complementing models based on numerical metrics with visual approaches. In the previous study, the evaluation of Sprint performance was mainly addressed through structured variables extracted from the agile process, such as work completed, pending work, expected progress, deviations and other metrics associated with the behavior of the Sprint. The visual approach presented in this article can be understood as an extension of that line of work.
The main implication is that tracking images could become an additional source of information for intelligent decision support systems. Instead of relying solely on numerical values, a monitoring tool could analyze both structured metrics and visual representations of the Sprint, generating more comprehensive assessments of project status. This approach could also be integrated into agile tracking platforms like Worki, where Sprint charts are already part of the monitoring process.
In a future scenario, the images generated by the platform could be automatically processed by a CNN model or by a multimodal model, with the aim of identifying risk patterns, anticipating possible non-compliances or supporting the classification of the Sprint’s performance.
However, for a real integration in a production environment, it would be necessary to improve the quality and quantity of the data, validate the model with new projects and compare the visual approach with models based on numerical metrics. In this way, visual assessment should not replace traditional indicators but complement them as an additional source of evidence.

8. Conclusions

This paper presented a preliminary study on the use of convolutional neural networks for the visual evaluation of Sprint performance in agile projects. From images associated with Sprint tracking, the CNN model was trained to classify instances into four performance categories: Poor, Regular, Good, and Excellent.
The primary innovation of this study is the use of automatically captured Sprint monitoring charts as a distinct input modality for performance classification. Rather than replacing the structured metric-based approach introduced in previous work, the visual model explores whether global chart patterns can provide complementary evidence about Sprint behavior.
The results obtained show that the visual representations of Sprints contain patterns relevant to automatic classification. The model achieved an overall accuracy of 70.33%, suggesting that agile graphs can provide useful information for estimating the performance of an iteration. Likewise, the analysis by class showed that the model performed better in categories with more defined visual patterns, particularly in the Poor class, while the intermediate classes presented greater ambiguity.
The analysis of the confusion matrix allowed us to observe that the main errors occur between close categories, especially between Poor and Regular, as well as between Regular, Good and Excellent. This confirms that visual classification of Sprint performance is a complex task, because the differences between some categories can be gradual and difficult to distinguish from images alone.
Overall, the results support the feasibility of the visual approach as a complementary line for agile monitoring. However, they also show that the current model should be considered preliminary. To reach a more robust solution, it is necessary to expand the dataset, improve the balance between classes, and explore approaches that combine visual information with numerical metrics from the Sprint.
Therefore, this study provides an initial exploration of the use of computer vision models for Sprint evaluation and establishes a basis for future research on visual and multimodal agile project monitoring.

9. Future Work

As future work, it is proposed to expand the visual dataset used for the training and evaluation of the model. A greater number of images would improve CNN’s generalizability and reduce the risk of overfitting. Likewise, it would be convenient to incorporate data from different projects, teams and organizational contexts to evaluate the stability of the model in more diverse scenarios.
An improvement in the balance between classes is also proposed, since a more balanced distribution could favor the learning of patterns in less represented categories. This can be done through the collection of new instances, data augmentation techniques, or training strategies geared toward minority classes.
Another relevant strand is to explore additional CNN architectures and more advanced transfer-learning models. Models such as EfficientNet, ResNet, or Vision Transformers could be compared to the architecture used in this study to determine if they offer improvements in the visual classification of Sprint performance.
In addition, it is considered important to move towards multimodal approaches that combine agile graph images with numerical metrics of the Sprint. This integration would allow the model to leverage both visual patterns and structured information generated during the iteration, which could improve the accuracy of the model and provide a more complete evaluation of performance.
Finally, the integration of the model into an agile monitoring platform such as Worki is proposed as a future line. This integration would allow the evaluation of the approach’s behavior in a real environment, automating the analysis of Sprint graphs and generating early warnings or recommendations to support the development team’s decision-making.

Author Contributions

Conceptualization, P.O.L.T.; Methodology, S.D.O.J.; Software, Y.J.P.C.; Validation, Y.J.P.C., V.A.C.V. and S.D.O.J.; Formal analysis, P.O.L.T.; Investigation, Y.J.P.C., S.D.O.J., P.O.L.T., J.J.C.H., M.E.A.M. and V.A.C.V.; Data curation, Y.J.P.C.; Writing—review and editing, Y.J.P.C., J.J.C.H., M.E.A.M. and V.A.C.V.; Project administration, Y.J.P.C. and S.D.O.J. All authors have read and agreed to the published version of the manuscript.

Funding

This research received no external funding.

Institutional Review Board Statement

Not applicable.

Informed Consent Statement

Not applicable.

Data Availability Statement

The data supporting the reported results of this study are available on request from the corresponding author. The data is not publicly available due to privacy restrictions associated with the confidential data management protocols of Worki.

Conflicts of Interest

The authors declare no conflicts of interest. The funders had no role in the design of the study; in the collection, analyses, or interpretation of data; in the writing of the manuscript; or in the decision to publish the results.

References

  1. Pérez Castillo, Y.J.; Orantes Jiménez, S.D.; Letelier Torres, P.O. Sprint management in agile approach: Progress and velocity evaluation applying machine learning. Information 2024, 15, 726. [Google Scholar] [CrossRef] [Scilit]
  2. Schwaber, K.; Sutherland, J. The Scrum Guide: The Definitive Guide to Scrum: The Rules of the Game; Scrum.org: Burlington, MA, USA, 2020; Available online: https://scrumguides.org/docs/scrumguide/v2020/2020-Scrum-Guide-US.pdf (accessed on 25 June 2026).
  3. Project Management Institute; Agile Alliance. Agile Practice Guide; Project Management Institute: Newtown Square, PA, USA, 2017. [Google Scholar]
  4. Lai, S.-T.; Susanto, H.; Leu, F.-Y. Project management mechanism based on burndown chart to reduce the risk of software project failure. In Advances on Broad-Band Wireless Computing, Communication and Applications, Proceedings of the 16th International Conference on Broad-Band Wireless Computing, Communication and Applications (BWCCA 2021); Springer: Cham, Switzerland, 2022; pp. 197–205. [Google Scholar] [CrossRef] [Scilit]
  5. Pham, K.P.; Neumann, M. How to measure performance in agile software development? A mixed-method study. In Proceedings of the 50th Euromicro Conference on Software Engineering and Advanced Applications (SEAA), Paris, France, 28–30 August 2024; pp. 443–450. [Google Scholar] [CrossRef] [Scilit]
  6. Ram, P.; Rodriguez, P.; Oivo, M. Software process measurement and related challenges in agile software development: A multiple case study. In Product-Focused Software Process Improvement; Lecture Notes in Computer Science; Springer: Cham, Switzerland, 2018; Volume 11271, pp. 272–287. [Google Scholar] [CrossRef] [Scilit]
  7. Pérez Castillo, Y.J.; Orantes Jiménez, S.D.; Letelier Torres, P.O. A systematic literature review on machine learning applications for agile project management. Ing. Investig. Tecnol. 2024, 25, 17. [Google Scholar] [CrossRef] [Scilit]
  8. Ramessur, M.A.; Nagowah, S.D. A predictive model to estimate effort in a Sprint using machine learning techniques. Int. J. Inf. Technol. 2021, 13, 1101–1110. [Google Scholar] [CrossRef] [Scilit]
  9. Abdu, A.; Zhai, Z.; Abdo, H.A.; Algabri, R.; Al-Masni, M.A.; Muhammad, M.S.; Gu, Y.H. Semantic and traditional feature fusion for software defect prediction using hybrid deep learning model. Sci. Rep. 2024, 14, 14771. [Google Scholar] [CrossRef] [Scilit] [PubMed]
  10. Periyasamy, K.; Chianelli, J. A project tracking tool for Scrum projects with machine learning support for cost estimation. In Proceedings of the 29th International Conference on Software Engineering and Data Engineering; EPiC Series in Computing; EasyChair: Stockport, UK, 2021; Volume 76, pp. 76–86. [Google Scholar] [CrossRef] [Scilit]
  11. Gültekin, M.; Kalipsiz, O. Story point-based effort estimation model with machine learning techniques. Int. J. Softw. Eng. Knowl. Eng. 2020, 30, 43–66. [Google Scholar] [CrossRef] [Scilit]
  12. Choetkiertikul, M.; Dam, H.K.; Tran, T.; Pham, T.; Ghose, A.; Menzies, T. A deep learning model for estimating story points. IEEE Trans. Softw. Eng. 2019, 45, 637–656. [Google Scholar] [CrossRef] [Scilit]
  13. LeCun, Y.; Bengio, Y.; Hinton, G. Deep learning. Nature 2015, 521, 436–444. [Google Scholar] [CrossRef] [Scilit] [PubMed]
  14. Zhao, X.; Wang, L.; Zhang, Y.; Han, X.; Deveci, M.; Parmar, M. A review of convolutional neural networks in computer vision. Artif. Intell. Rev. 2024, 57, 99. [Google Scholar] [CrossRef] [Scilit]
  15. Khleel, N.A.A.; Nehéz, K. A novel approach for software defect prediction using CNN and GRU based on SMOTE Tomek method. J. Intell. Inf. Syst. 2023, 60, 673–707. [Google Scholar] [CrossRef] [Scilit]
  16. Al Joumaa, H.; Al-Shrouf, L.; Jelali, M. Time series-to-image encoding for classification using convolutional neural networks: A novel and robust approach. Mach. Learn. Knowl. Extr. 2025, 7, 155. [Google Scholar] [CrossRef] [Scilit]
  17. TensorFlow. Transfer Learning and Fine-Tuning. Available online: https://www.tensorflow.org/tutorials/images/transfer_learning (accessed on 25 June 2026).
  18. Sandler, M.; Howard, A.; Zhu, M.; Zhmoginov, A.; Chen, L.-C. MobileNetV2: Inverted residuals and linear bottlenecks. In Proceedings of the IEEE/CVF Conference on Computer Vision and Pattern Recognition, Salt Lake City, UT, USA, 18–23 June 2018; pp. 4510–4520. [Google Scholar] [CrossRef] [Scilit]
  19. Xuan, X.; Zhang, X.; Kwon, O.-H.; Ma, K.-L. VAC-CNN: A visual analytics system for comparative studies of deep convolutional neural networks. IEEE Trans. Vis. Comput. Graph. 2022, 28, 2326–2337. [Google Scholar] [CrossRef] [Scilit] [PubMed]
  20. Tan, M.; Le, Q.V. EfficientNet: Rethinking model scaling for convolutional neural networks. In Proceedings of the 36th International Conference on Machine Learning; PMLR: Cambridge, MA, USA, 2019; Volume 97, pp. 6105–6114. Available online: https://proceedings.mlr.press/v97/tan19a.html (accessed on 25 June 2026).
  21. Worki. Available online: https://cliente.tuneupprocess.com/web/#/login (accessed on 25 June 2026).
  22. TUNE-UP Process. Available online: http://www.tuneupprocess.com/ (accessed on 25 June 2026).
  23. Microsoft. Playwright for Python: Installation and Introduction. Available online: https://playwright.dev/python/docs/intro (accessed on 25 June 2026).
Figure 1. Example of Burndown Graph. Source: Authors.
Information 17 00813 g001
Figure 2. Burndown graph. The purple line represents the expected progress, while the red, blue, and green lines represent the evolution of the Sprint work overtime. Source: [21].
Information 17 00813 g002
Figure 3. TTvsNT chart. The green bars represent completed work, while the orange bars represent uncompleted work. Source: [21].
Information 17 00813 g003
Table 1. Dataset experiment setup.
ItemDescription
SourceWorki/Dashboard Sprint
Data typeGraphic images
GraphsBurndown and TTvsNT
Sprints used458
Total images916
ClassesExcellent, Good, Regular, Poor
ExtractionScript Python + Playwright
BrowserAutomated Chromium browser
Table 2. Hyperparameters used in the experiment.
ParameterValue Used
Image Size224 × 224 Pixels
ChannelsRGB
Batch size16
Epochs in base phase50
Fine-tuning epochs50
Dropout0.4
Evaluation split20%
Class weightsYes
Random Seed42
Output Classes4
Output ActivationSoftmax
Table 3. Classification report of the CNN model.
PrecisionRecallF1-ScoreSupport
Good0.60.750.666716
Excellent0.77270.70830.739124
Poor0.90480.70370.791727
Regular0.57140.66670.615424
Totals 91
Table 4. Confusion matrix of the CNN model.
Real Tag/PredictionPoorRegularGoodExcellent
Poor19701
Regular21642
Good02122
Excellent03417
Disclaimer/Publisher’s Note: The statements, opinions and data contained in all publications are solely those of the individual author(s) and contributor(s) and not of MDPI and/or the editor(s). MDPI and/or the editor(s) disclaim responsibility for any injury to people or property resulting from any ideas, methods, instructions or products referred to in the content.