1. Introduction
Mortality from non-communicable diseases (NCDs) remains a primary concern in the global public health landscape. Among the many NCDs, cardiovascular diseases (CVDs, e.g., stroke, hypertensive heart disease [HHD], and ischaemic heart disease [IHD]) and diabetes are the most fatal, especially in low- and middle-income countries (LMICs). Between 2020 and 2021, for example, approximately 80% of the 35 million deaths attributable to NCDs occurred within LMICs [
1,
2]. Moreover, the NCDs epidemic has been greatest in LMICs in Africa. From 2000 to 2019, the proportion of deaths attributable to these NCDs increased from 24.2% to 37.1%, representing a relative increase of over 53% [
3]. Indeed, sub-regional differences in NCDs mortality persist, with LMICs in East Africa already accounting for approximately 40% of all NCDs deaths from 2015 to 2020. Country-specific estimates of NCDs mortality reach up to 44% in Tanzania and approximately 50% in Rwanda, with Burundi, Kenya, and Uganda also among major contributors [
4,
5].
These mortality patterns are associated with a multitude of risk factors, including socio-demographic development—proxied by indices such as the socio-demographic index (SDI)—and major metabolic risk factors such as high body mass index (BMI), elevated fasting plasma glucose (FPG), and elevated systolic blood pressure (SBP) [
6,
7]. In a region characterised by porous borders, high population mobility [
8], shared environmental risks, similar socio-economic and behavioural transitions (e.g., rapid urbanisation, unhealthy diets, physical inactivity, tobacco) [
4,
9], and cross-border trade, health outcomes in one country may be associated with conditions in neighbouring countries [
10]. Chinembiri et al.’s [
11] study on spatial and temporal inequalities in NCDs mortality across East Africa adds that NCDs mortality risk across the East African Community (EAC) is spatially structured and associated with contextual socio-economic and environmental conditions. Such spatial patterns have been linked to population movement, policy diffusion, environmental exposures, and differential healthcare access across borders [
12].
International agencies such as the Africa Centres for Disease Control and Prevention (CDC) recognise Africa as an area characterised by high cross-border movement, and public health management challenges [
13]. Concurrently, there is a growing recognition of SDI and risk factors as essential determinants of NCDs patterns in the region. Given these conditions, understanding whether spatial predictive patterns persist after accounting for these factors is therefore analytically important for regional health planning. A critical evidence gap remains, however. Existing studies (e.g., [
8,
11,
12]) have examined spatial clustering and associations between NCDs mortality and contextual factors but have not assessed whether observed spatial patterns reflect cross-border structure or are attributable to shared socio-demographic characteristics and metabolic risk exposures across neighbouring countries. For instance, Chinembiri et al. [
11] described spatial patterns and associations between NCDs mortality and factors such as gross domestic product (GDP), environmental conditions, and urbanisation. However, the analysis did not incorporate SDI, an index combining education, income, and fertility, thereby limiting a comprehensive assessment of development-related spatial patterns. Findlater and Bogoch [
12] examined human mobility and infectious disease spread but provided limited evidence on the role of geographic boundaries in shaping NCDs epidemics. A further limitation of the existing literature is the treatment of cause-specific mortality as a single aggregate outcome, which obscures heterogeneity across diseases and between sexes. Minja et al. [
14] identified research priorities for CVDs in Africa but did not provide disaggregated evidence for stroke, HHD, IHD, or diabetes mortality by sex across East Africa. Collectively, these gaps leave unresolved whether stroke, IHD, HHD, and diabetes exhibit distinct spatial predictive patterns after accounting for SDI and metabolic risk factors, and whether these patterns vary by sex. The analytical approaches applied in existing studies represent a further limitation. Spatial analyses of NCDs mortality have predominantly relied on models that assume linear, fixed, and spatially homogeneous relationships [
15,
16,
17,
18]. These assumptions may be too restrictive for the complex, non-linear, and multi-dimensional spatial processes characterising NCDs epidemiology across heterogeneous country contexts. Deep learning methods including attention-based architectures such as graph transformers offer a more flexible analytical framework capable of representing heterogeneous relational structures and non-linear interactions without imposing strong parametric assumptions [
19,
20,
21]. Whether such approaches yield substantively different insights into NCDs spatial patterns in East Africa, compared with conventional spatial models, remains an open empirical question that this study addresses.
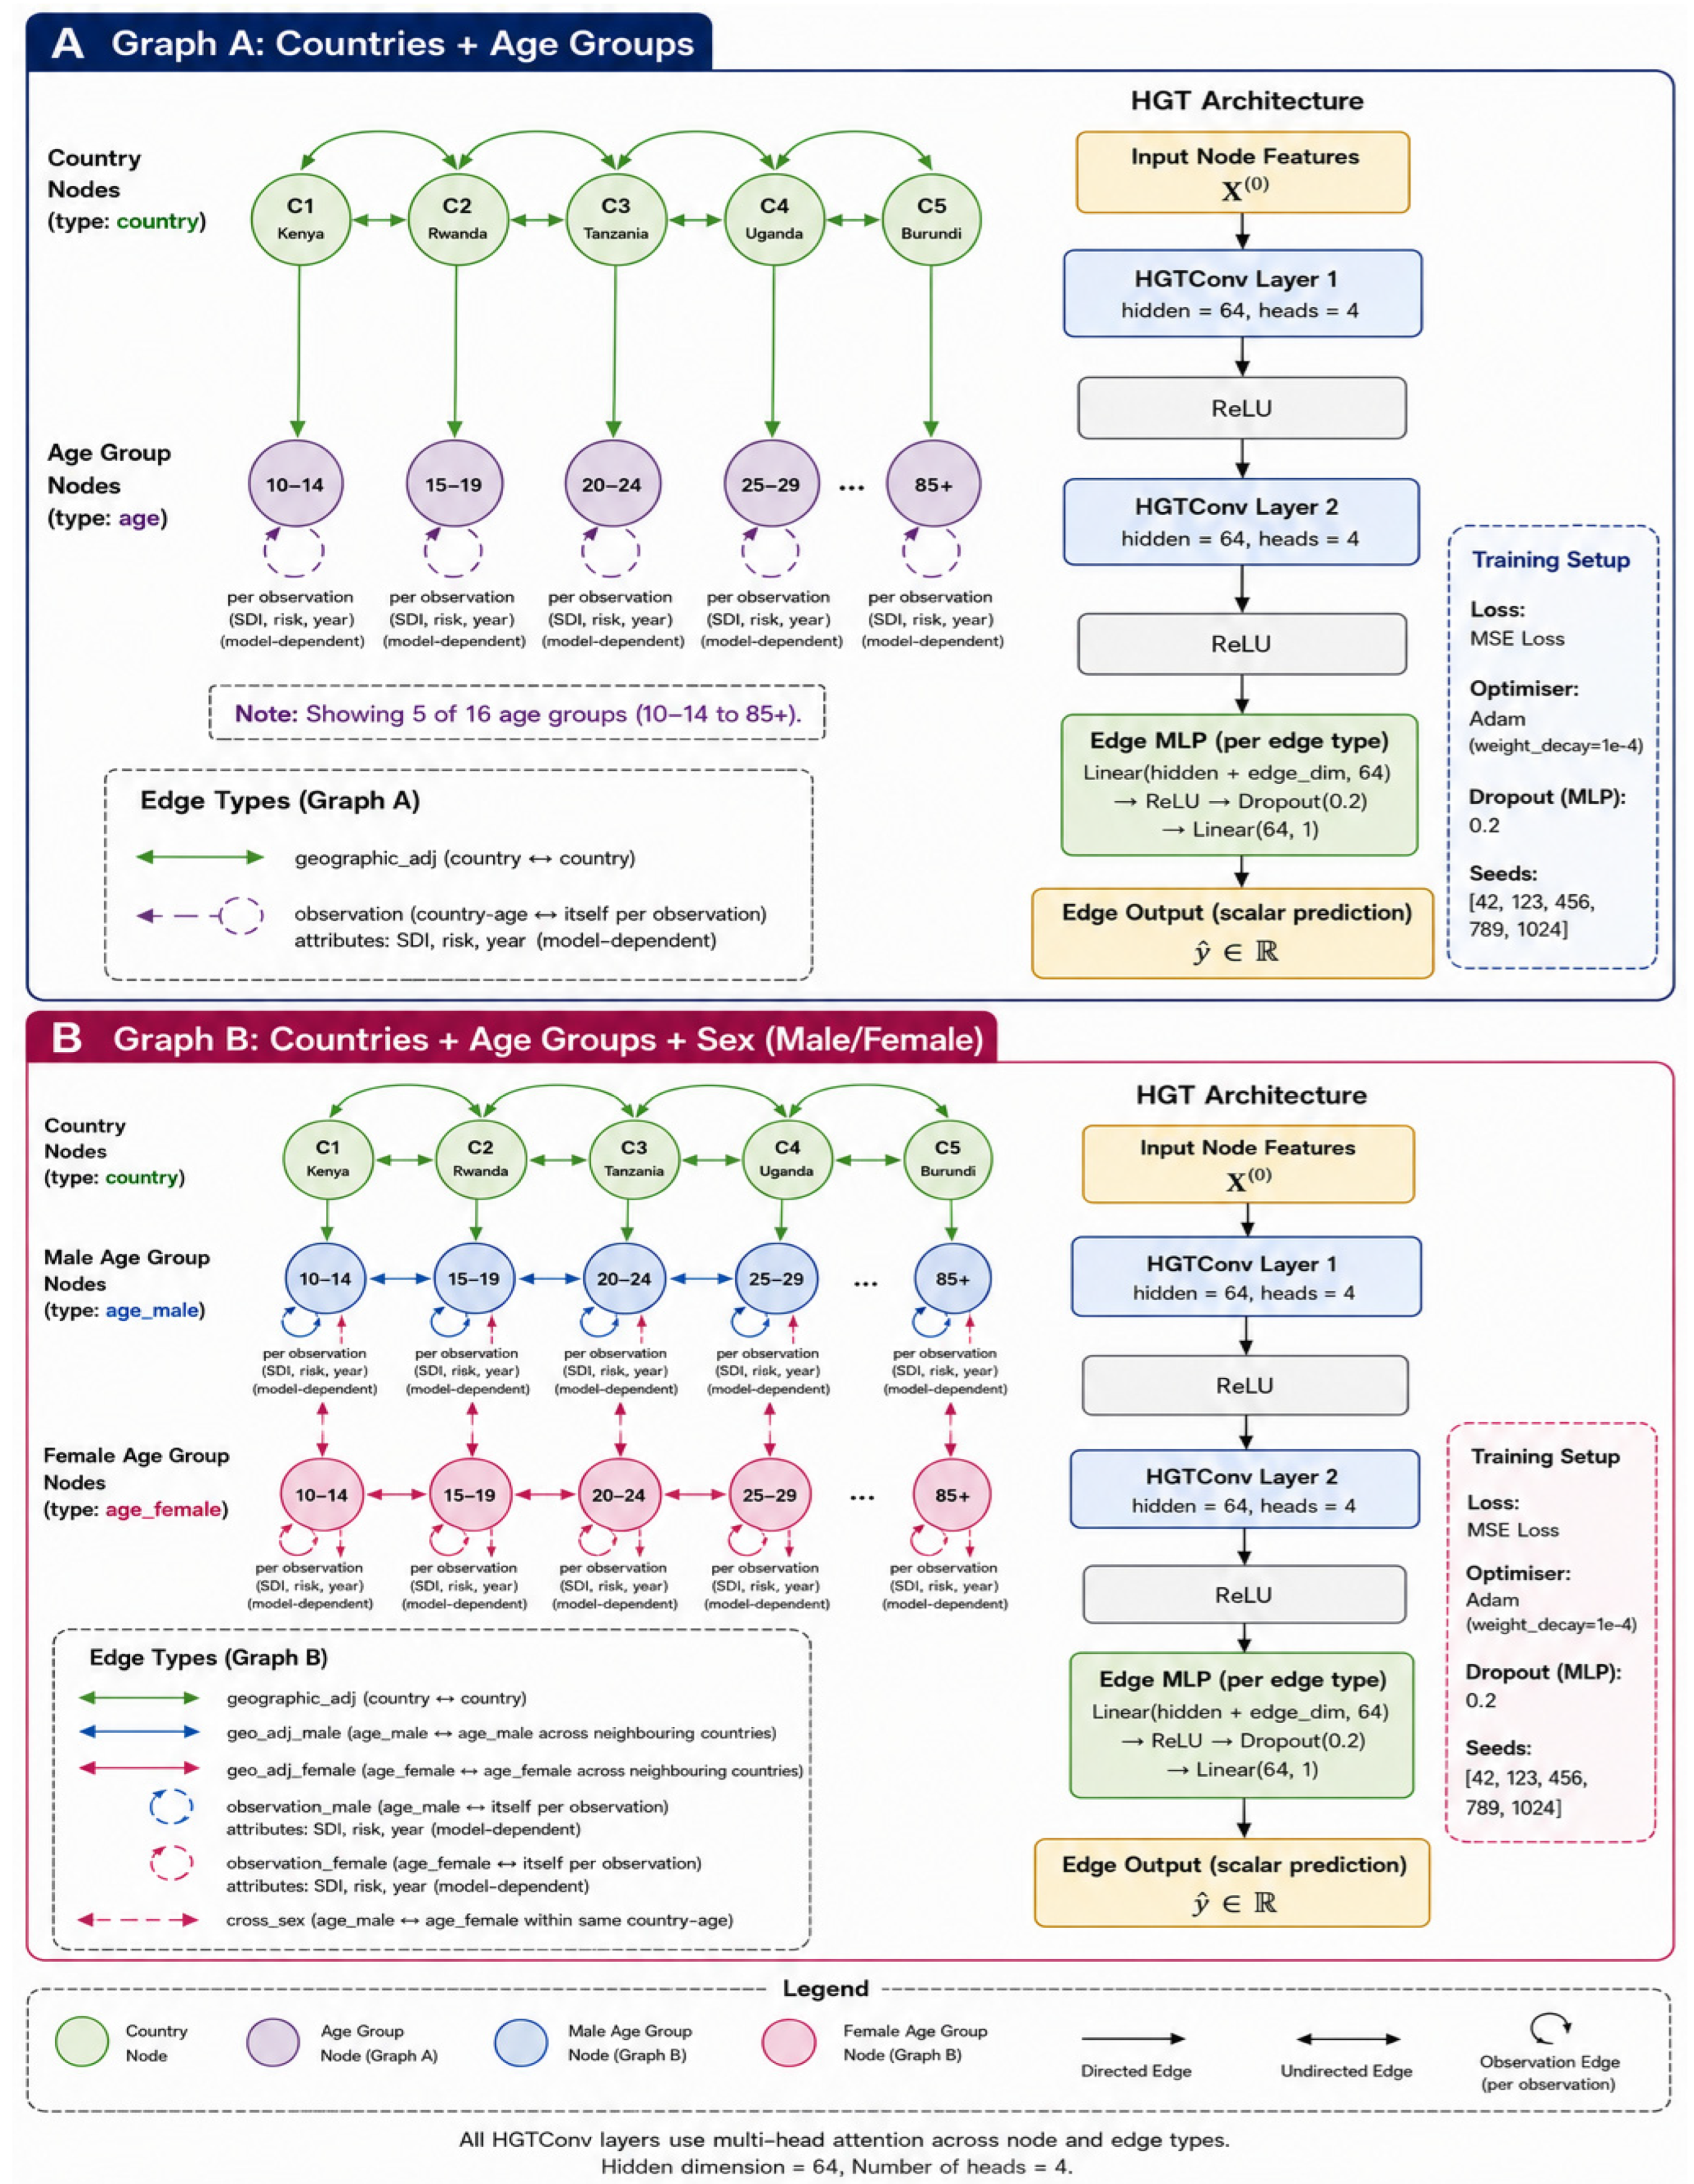
Therefore, this study examined whether spatial predictive patterns in cause-specific NCDs mortality across East Africa are detectable after controlling for SDI and key metabolic risk factors, and how these patterns vary across stroke, HHD, IHD, and diabetes. Five questions are addressed: (1) To what extent are spatial predictive patterns in cause-specific NCDs mortality detectable after controlling for socio-demographic development (SDI)? (2) To what extent do metabolic risk factors (BMI, FPG, and SBP) associate with observed spatial patterns in cause-specific mortality? (3) Do spatial predictive patterns persist after jointly controlling for SDI and metabolic risk factors? (4) How do spatial predictive patterns vary across stroke, HHD, IHD, and diabetes? (5) Does sex disaggregation, incorporating male and female mortality estimates as distinct graph nodes, correlate with the detectability and strength of spatial predictive patterns relative to both-sex aggregate estimates?
4. Discussion
To our knowledge, this is the first study to apply graph transformers to cause-specific mortality spatial predictive patterns across five East African countries, namely, Tanzania, Rwanda, Burundi, Kenya, and Uganda, after controlling for socio-demographic development and key risk factors. This study addressed four core questions: whether spatial patterns are detectable after controlling for SDI, whether metabolic risk factors explain these patterns, whether they persist after joint control, and whether they vary across diseases. The application of the heterogeneous graph transformers framework enabled the identification of complex spatial heterogeneity using IHME GBD population estimates spanning 1990 to 2023 for NCDs, SDI (income, fertility, and education), and metabolic risk factors (BMI, SBP, FPG). Specifically, across all four questions, the findings reveal a disease-specific picture that departs substantially from a uniform regional spatial narrative. These findings underscore the importance of advanced neural network and sequence-modelling architectures as effective tools for capturing complex, non-linear dependencies and multi-dimensional relationships [
19,
20] in health and mortality data within vulnerable populations.
The HGT produced substantially higher R
2 values than the OLS spatial lag and CAR benchmarks across all diseases and specifications. The CAR benchmark produced negative R
2 values for all diseases, reflecting the limitation of aggregate spatial econometric models with five spatial units rather than a general inadequacy of spatial econometric approaches. These performance differences are consistent with the expectation that a model specifically designed to handle heterogeneous node and edge types may capture variation unavailable to models operating on country-aggregated data with a single relational structure [
19,
20,
33]. This comparison is, however, limited to two benchmark types, and the performance advantage observed here should not be generalised beyond this analytical context without further empirical validation across different datasets, spatial configurations, and disease settings. Whether graph transformer approaches will consistently outperform spatial econometric methods in other LMICs remains an open empirical question.
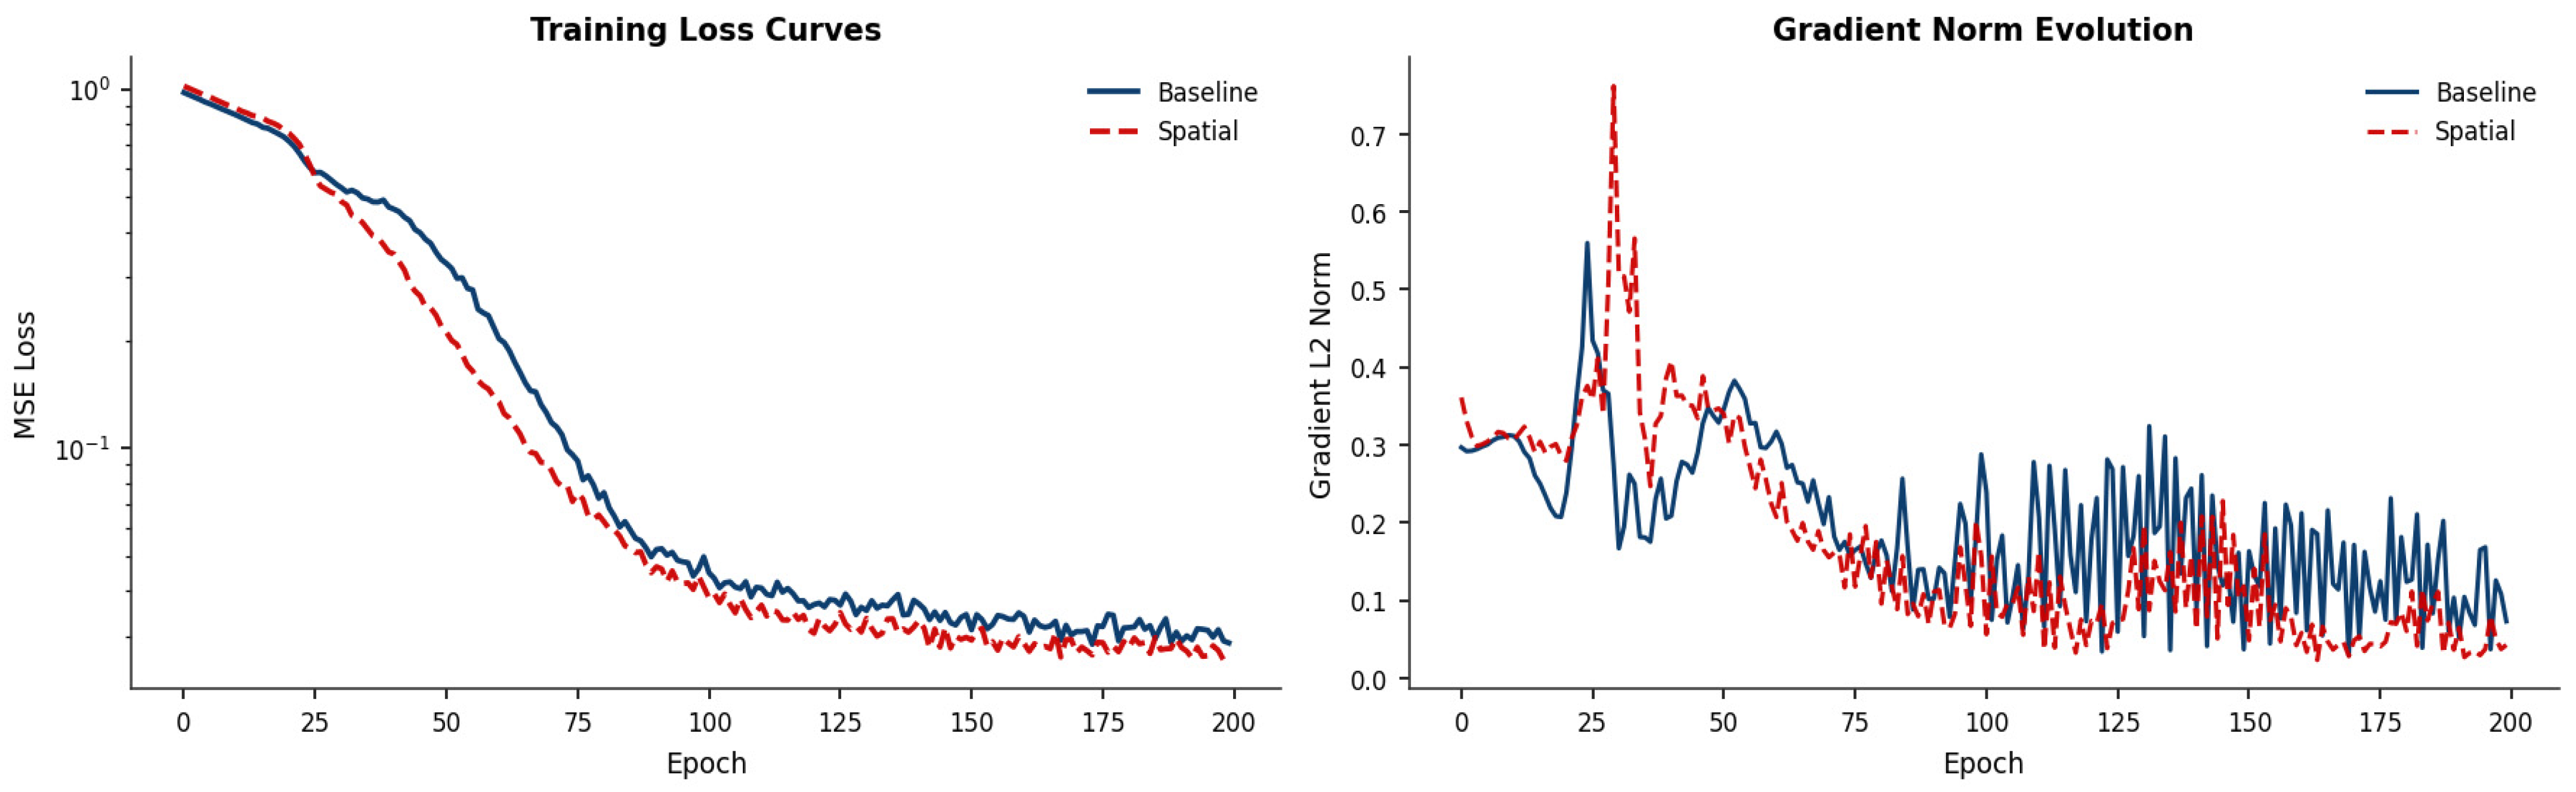
It is necessary to consider alternative technical explanations alongside epidemiological ones. The observed patterns—particularly the severe degradation for HHD and diabetes and the modest positive performance for stroke—are consistent with epidemiological interpretations but are equally consistent with several technical explanations that the present design cannot fully separate. First, graph misspecification is a plausible contributor: the binary land border contiguity matrix may not adequately represent the true relational structure among countries, which varies substantially in intensity, directionality, and composition across country pairs. If the adjacency structure does not reflect the actual channels through which NCD mortality patterns co-vary across borders, spatial edges will introduce structural noise regardless of the underlying epidemiology. Second, oversmoothing is a known limitation of multi-layer GNN architectures, including HGT, in which repeated message-passing can cause node representations to converge towards a common value, erasing the country-specific variation that drives predictive accuracy [
19,
20,
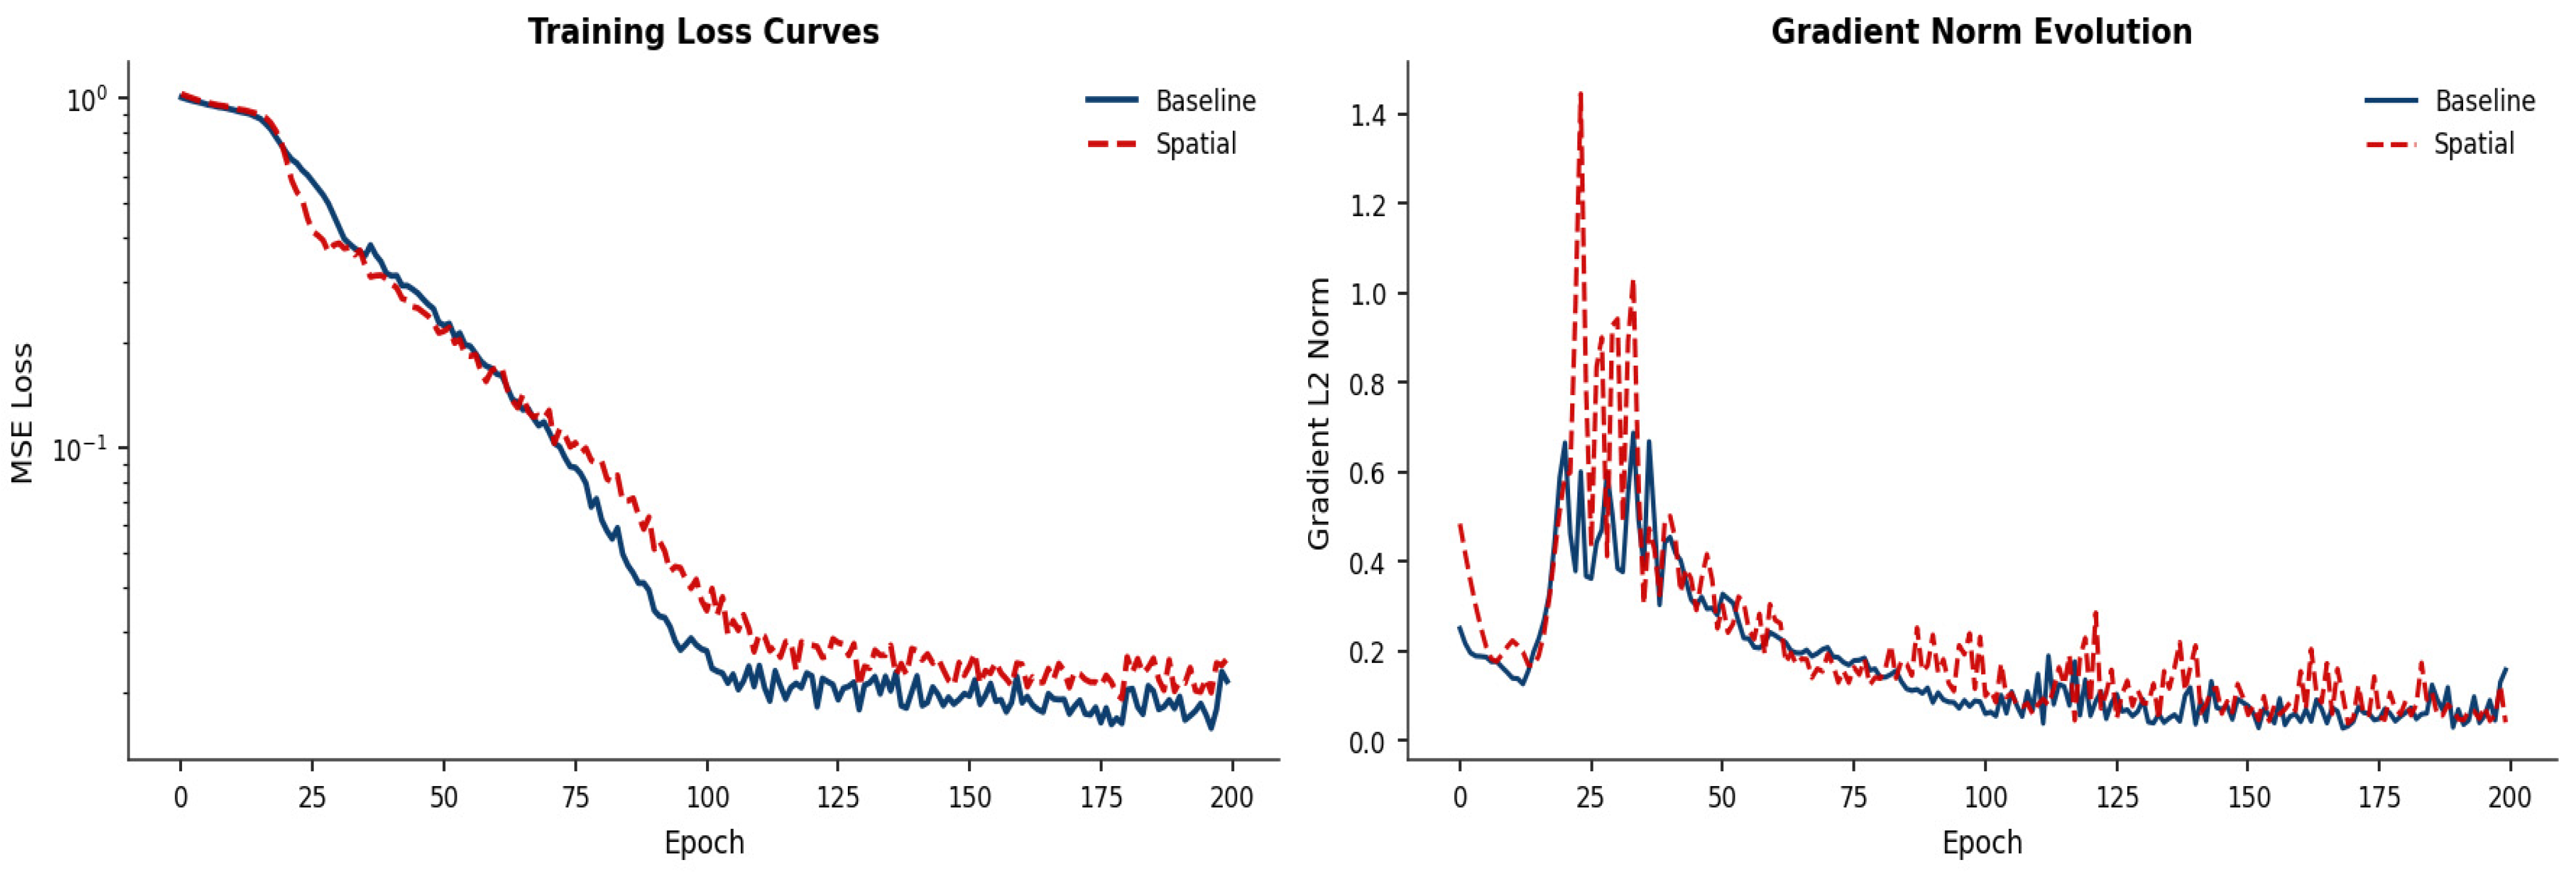
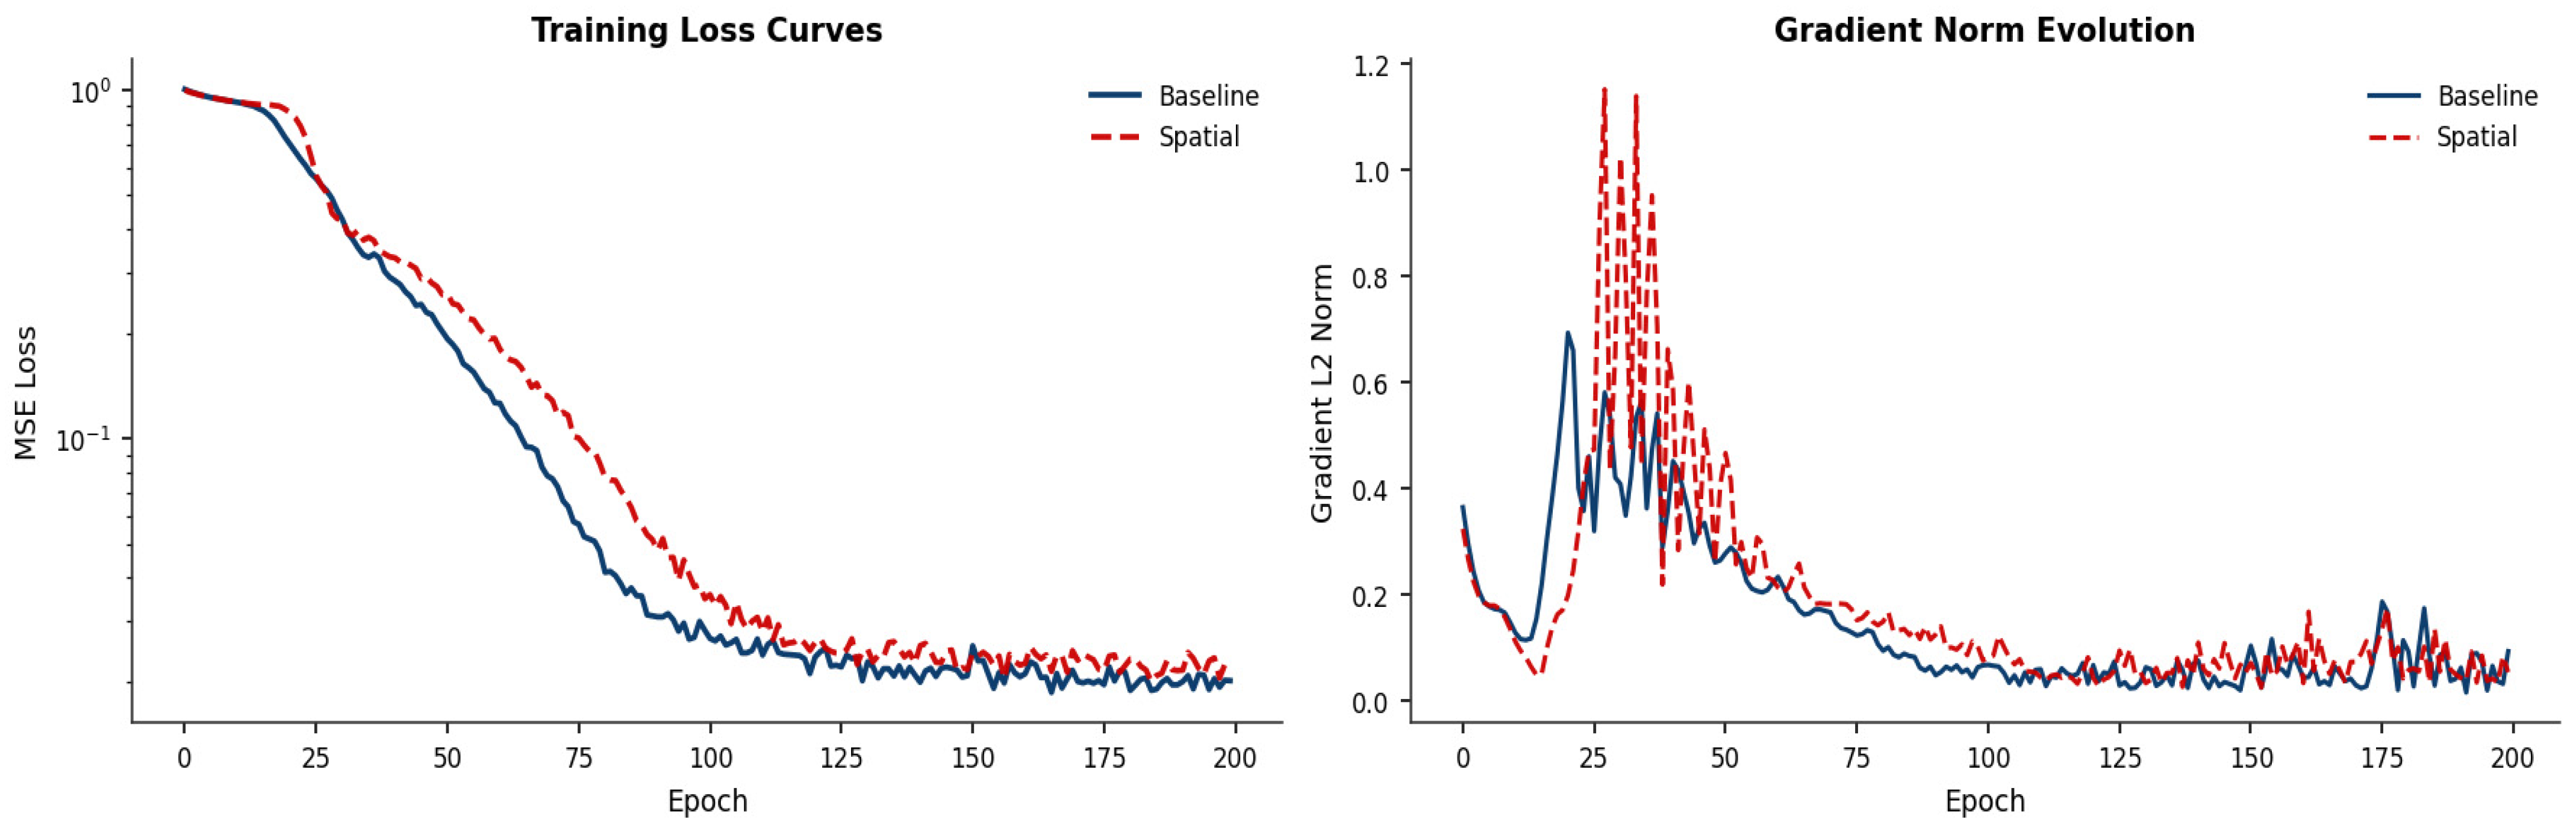
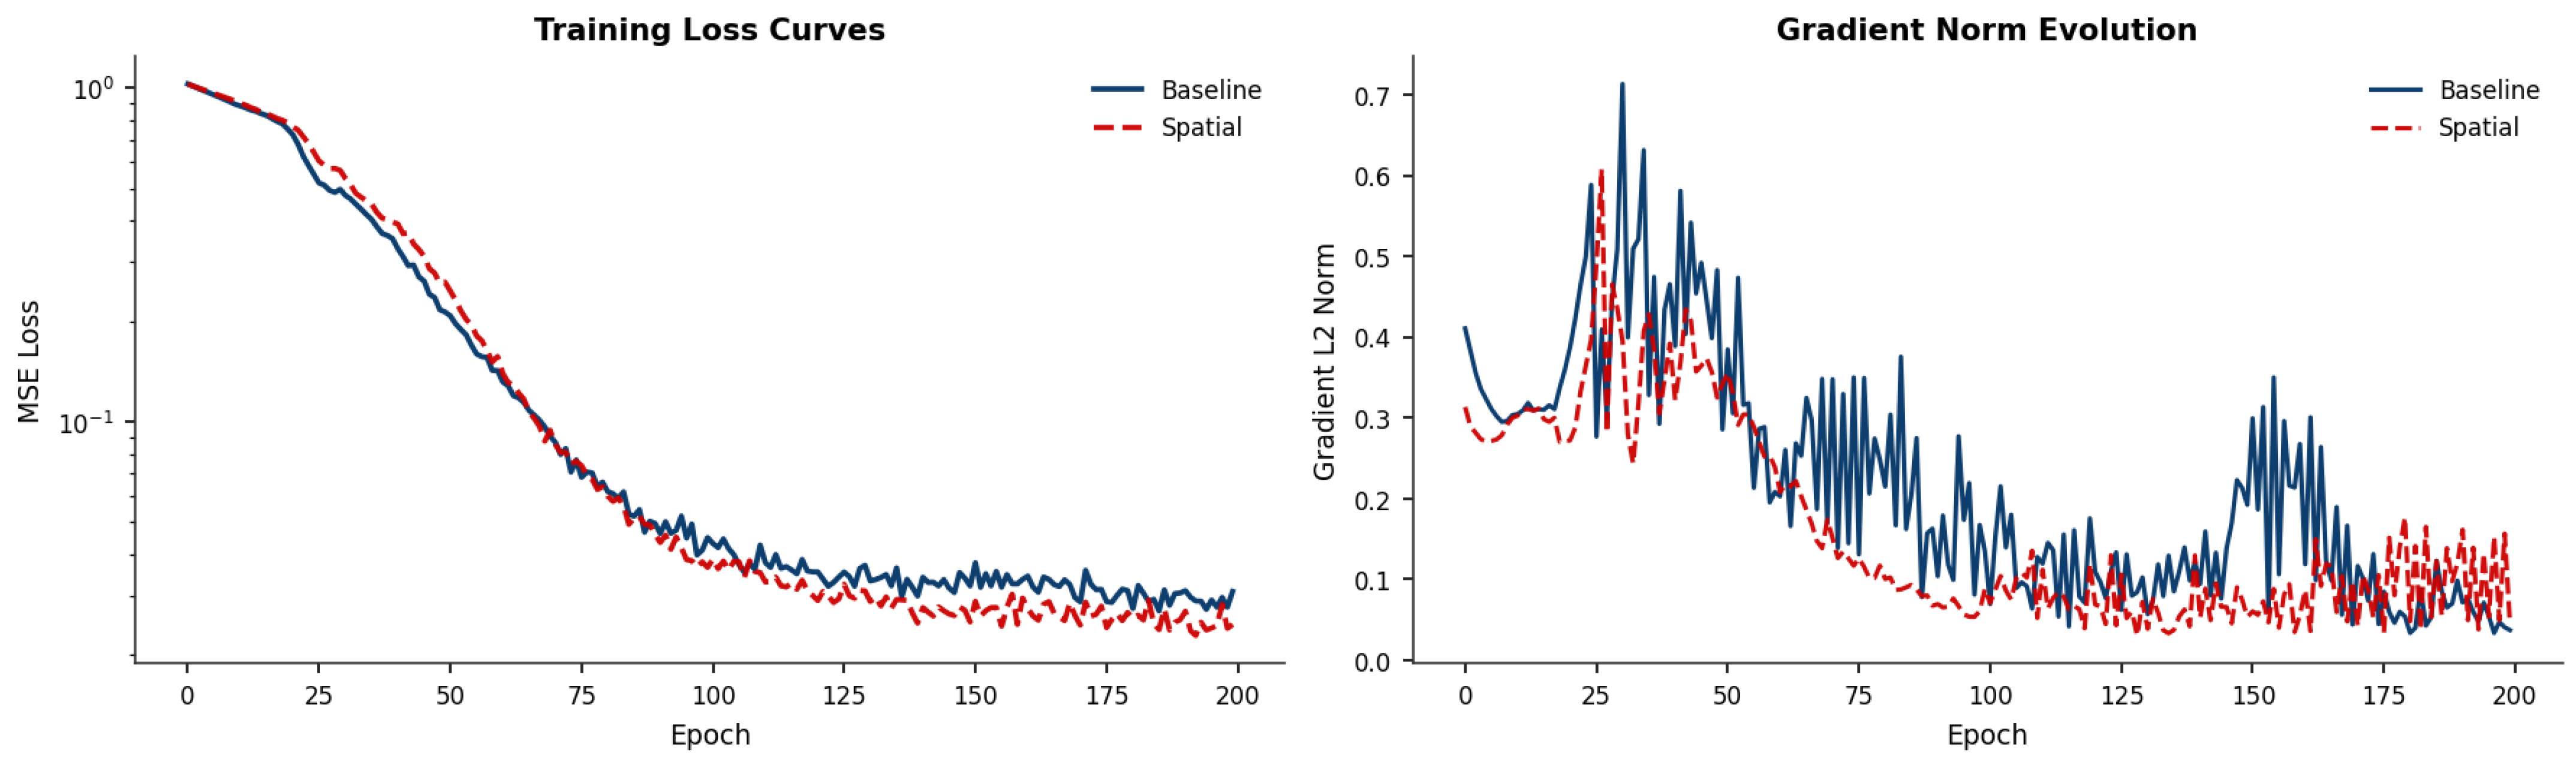
32]. With two HGTConv layers and geographic adjacency edges, oversmoothing may contribute to performance degradation for diseases where country-specific patterns are strong. Third, attention instability—reflected in gradient norm spikes observed in early training—is consistent with optimisation difficulty arising from conflicting signal structures rather than from a substantive epidemiological incompatibility. Fourth, the sparse five-node graph topology fundamentally limits the reliability of graph-level inferences: with only five country nodes, the permutation distribution of graph-based statistics is extremely coarse, and any graph-level finding carries substantial uncertainty. These technical alternatives do not invalidate the predictive findings, but they do qualify the epidemiological interpretations that can be drawn from them, and are considered explicitly in the disease-specific discussion below.
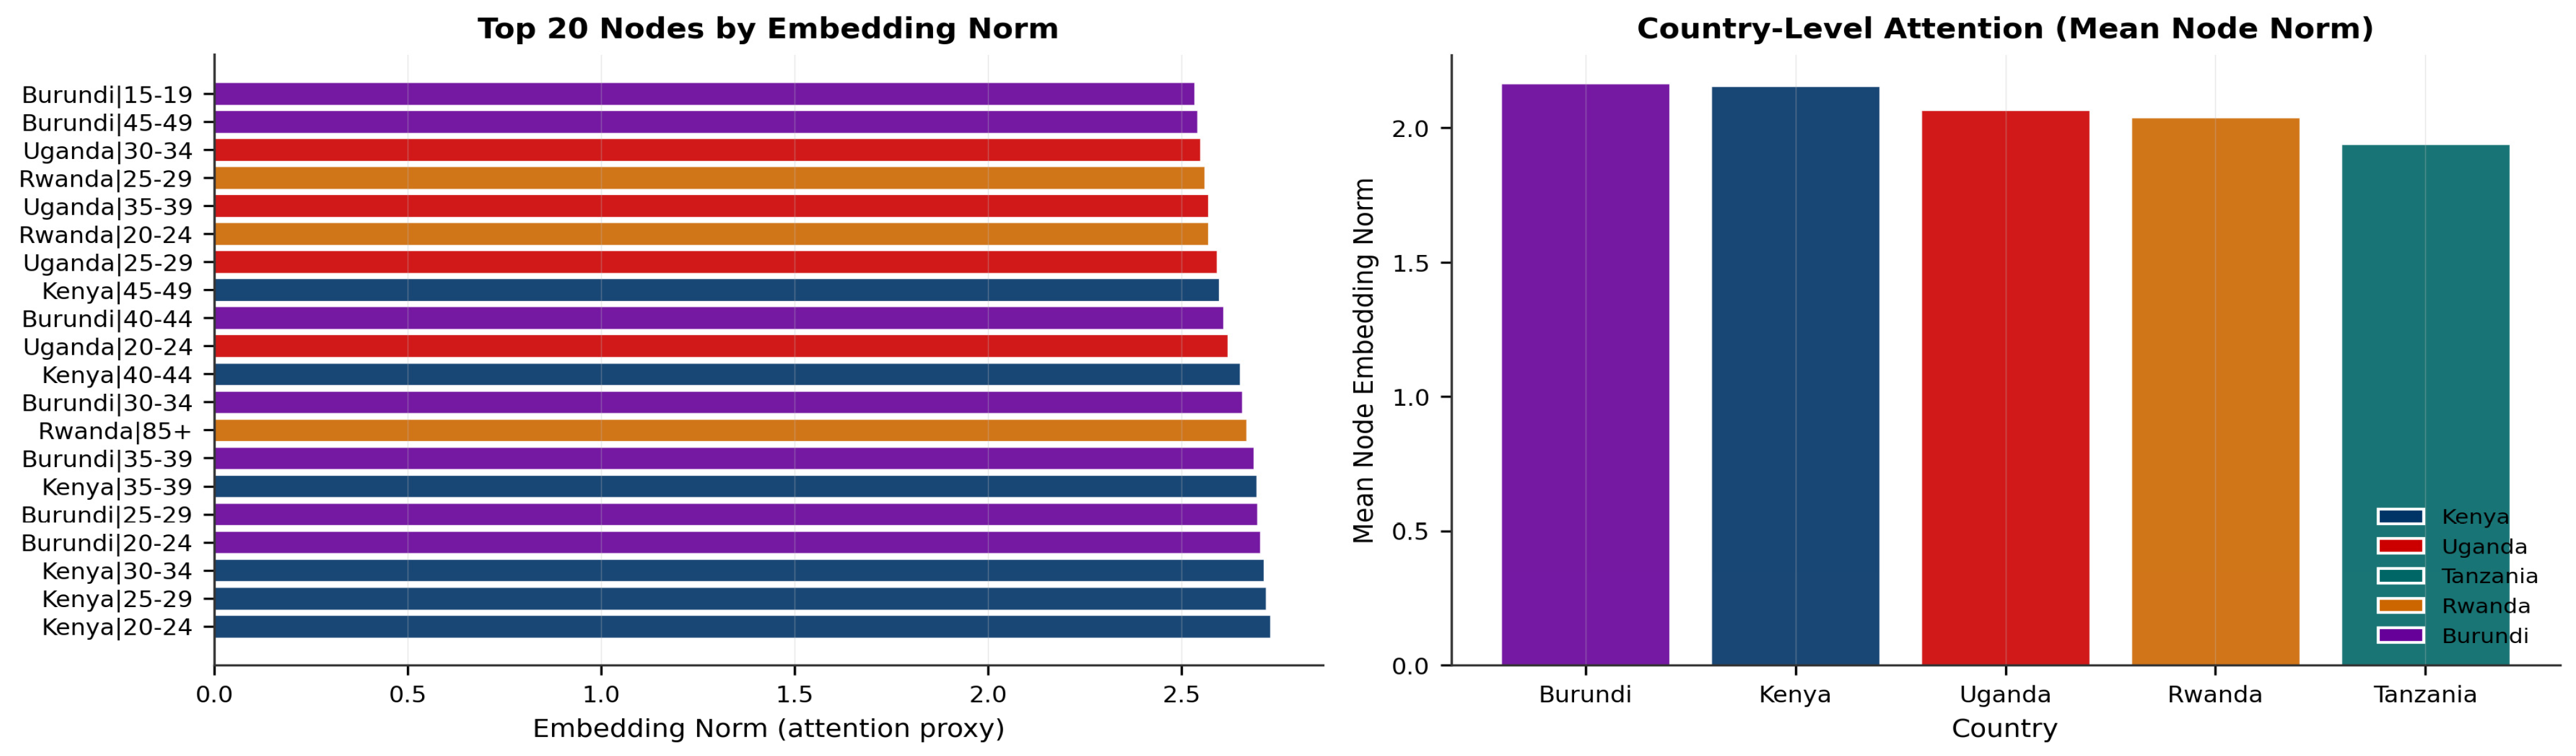
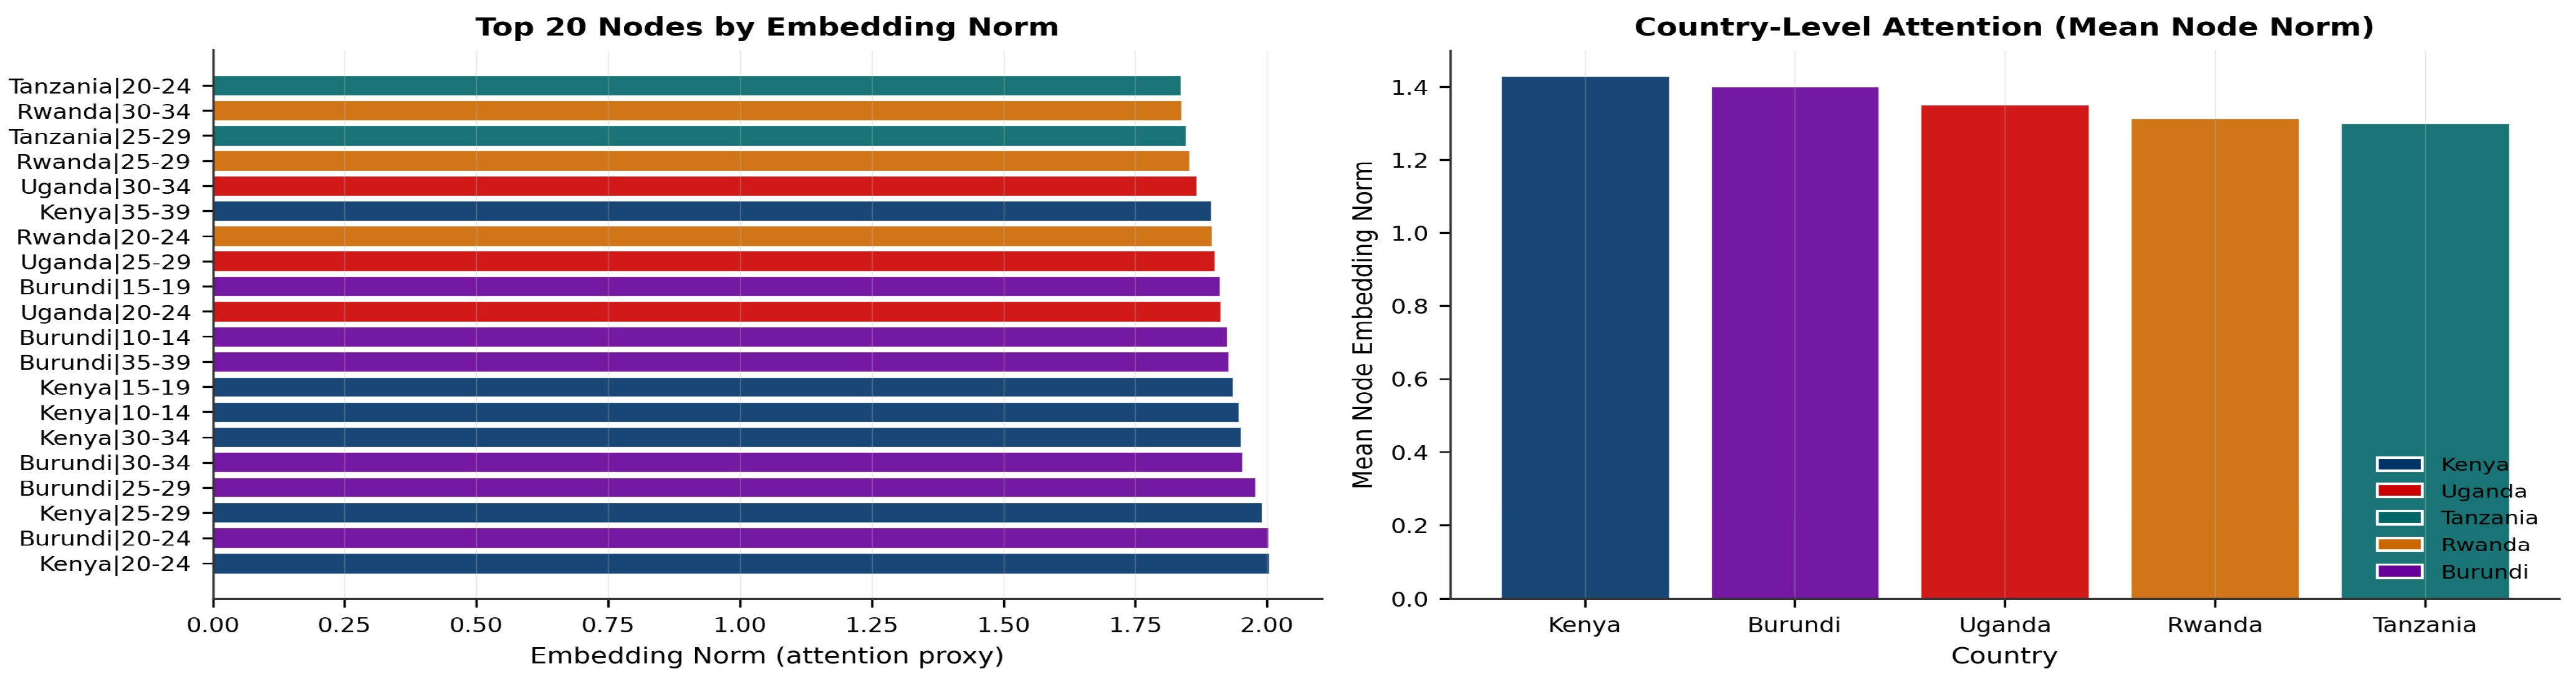
The attention weight analysis revealed that for HHD, node embedding norms were substantially higher than for any other disease, yet geographic adjacency consistently degraded predictions. This dissociation is consistent with the adjacency structure conflicting with country-specific HHD mortality patterns but is equally consistent with oversmoothing erasing country-specific variation or graph misspecification introducing noise that the model cannot overcome. The ablation study provides partial mechanistic evidence: for HHD, degradation amplifies specifically when metabolic risk covariates are introduced, which is consistent with the conflict arising from the interaction between covariate information and adjacency structure. However, whether this reflects a genuine epidemiological incompatibility or an oversmoothing effect amplified by high-dimensional covariates cannot be established from these analyses. For stroke, training dynamics showed the spatial model falling below baseline loss from approximately epoch 75 in Graph A. This is consistent with the model extracting useful structure from geographic adjacency in some configurations—though this is a single-seed observation and should be treated as indicative rather than confirmatory. These analyses collectively address a recognised limitation of black-box deep learning in epidemiological research [
42]—that predictive performance alone cannot distinguish genuine spatial learning from spurious overfitting—by providing convergent mechanistic evidence across multiple independent diagnostics. Additionally, the Monte Carlo uncertainty propagation further supports the interpretation that performance differences reflect model and graph properties rather than GBD data noise, and identifies model randomness as the dominant source of variability [
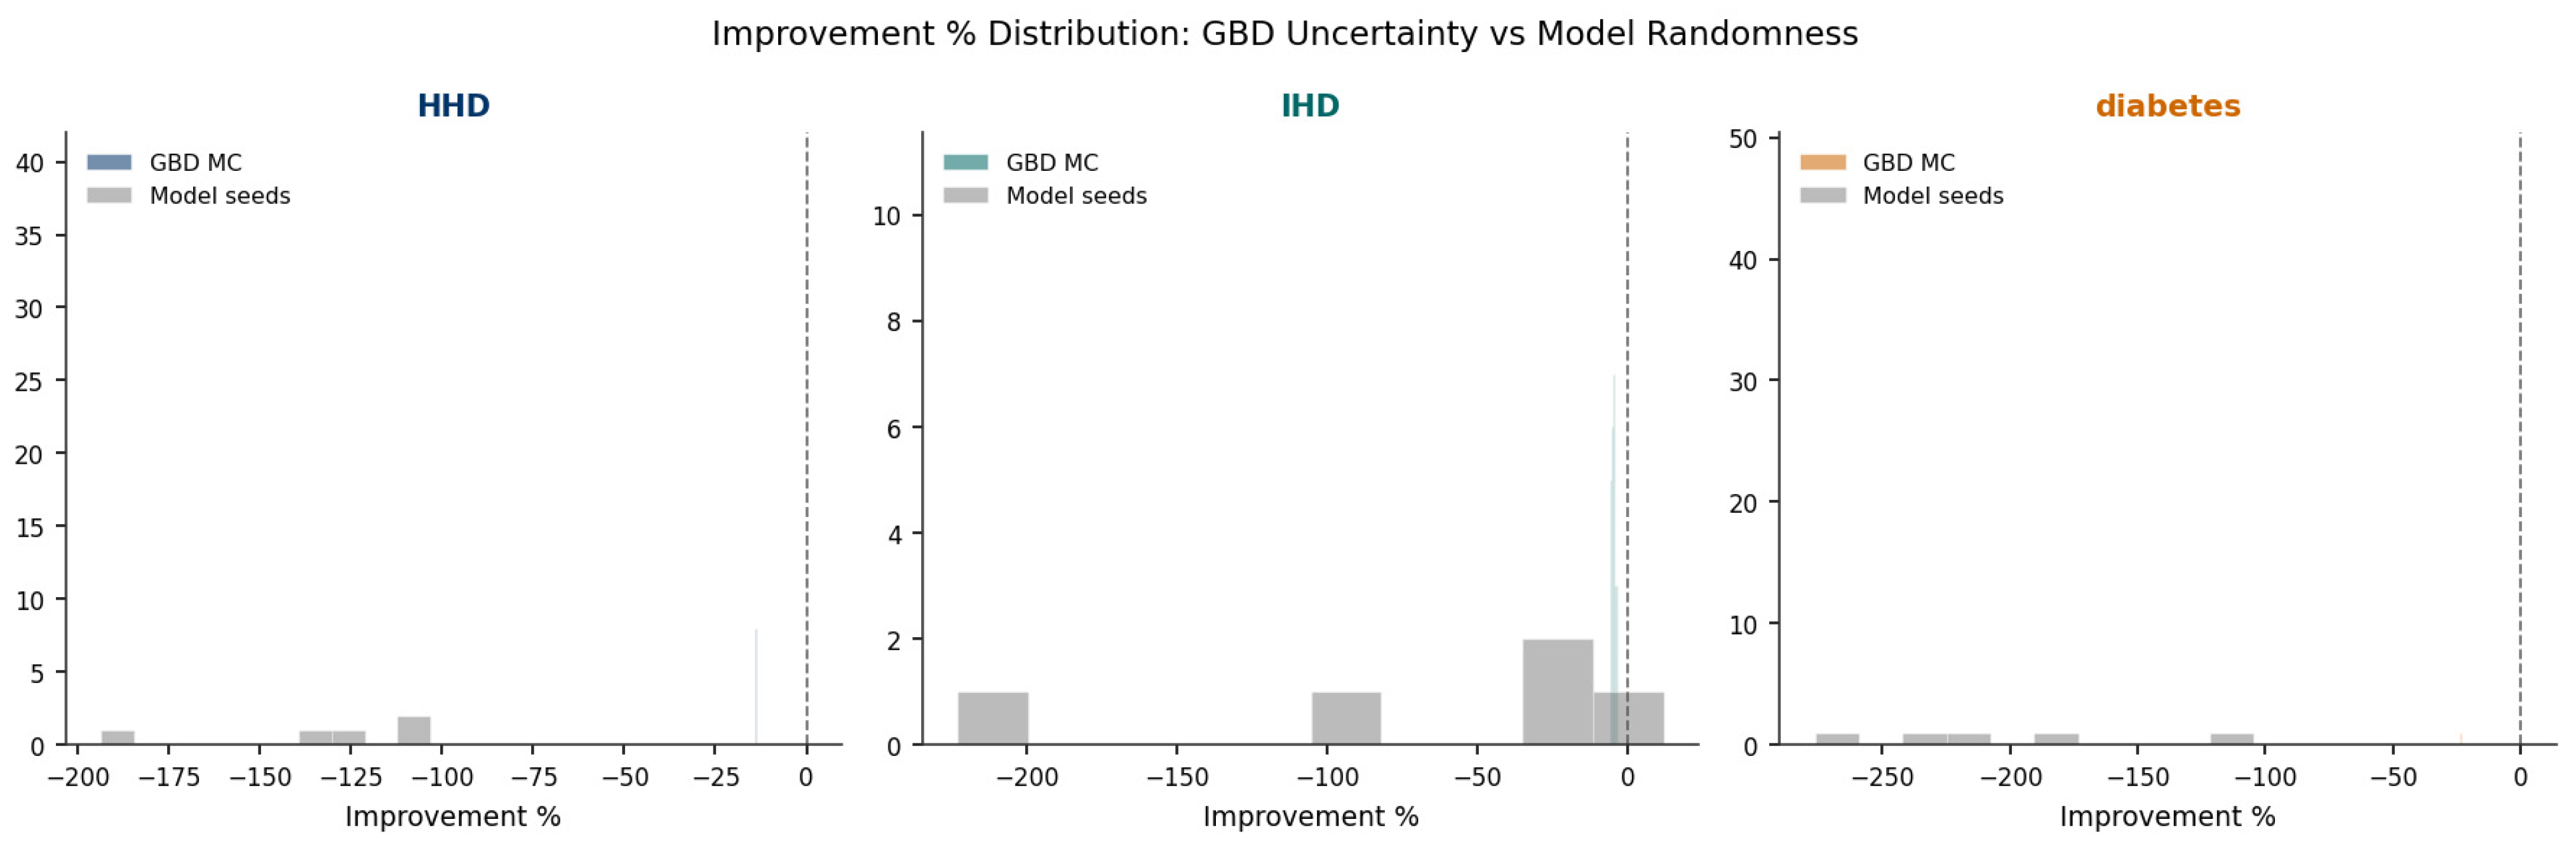
43,
44]. This distinction has practical implications for where methodological investment in future work is most likely to yield returns.
Spatial predictive performance differences were disease-specific rather than uniformly regional—the primary substantive finding of this study. This pattern is consistent with Xing et al.’s [
45] documentation of spatial heterogeneity in stroke determinants globally, and highlights the importance of disease-disaggregated analyses over aggregate regional approaches. The findings also illustrate that the relationship between geographic adjacency and predictive performance cannot be reduced to a single spatial narrative for East Africa, as different diseases exhibit fundamentally different patterns of spatial predictive structure when controlled for the same covariates [
13,
46,
47,
48].
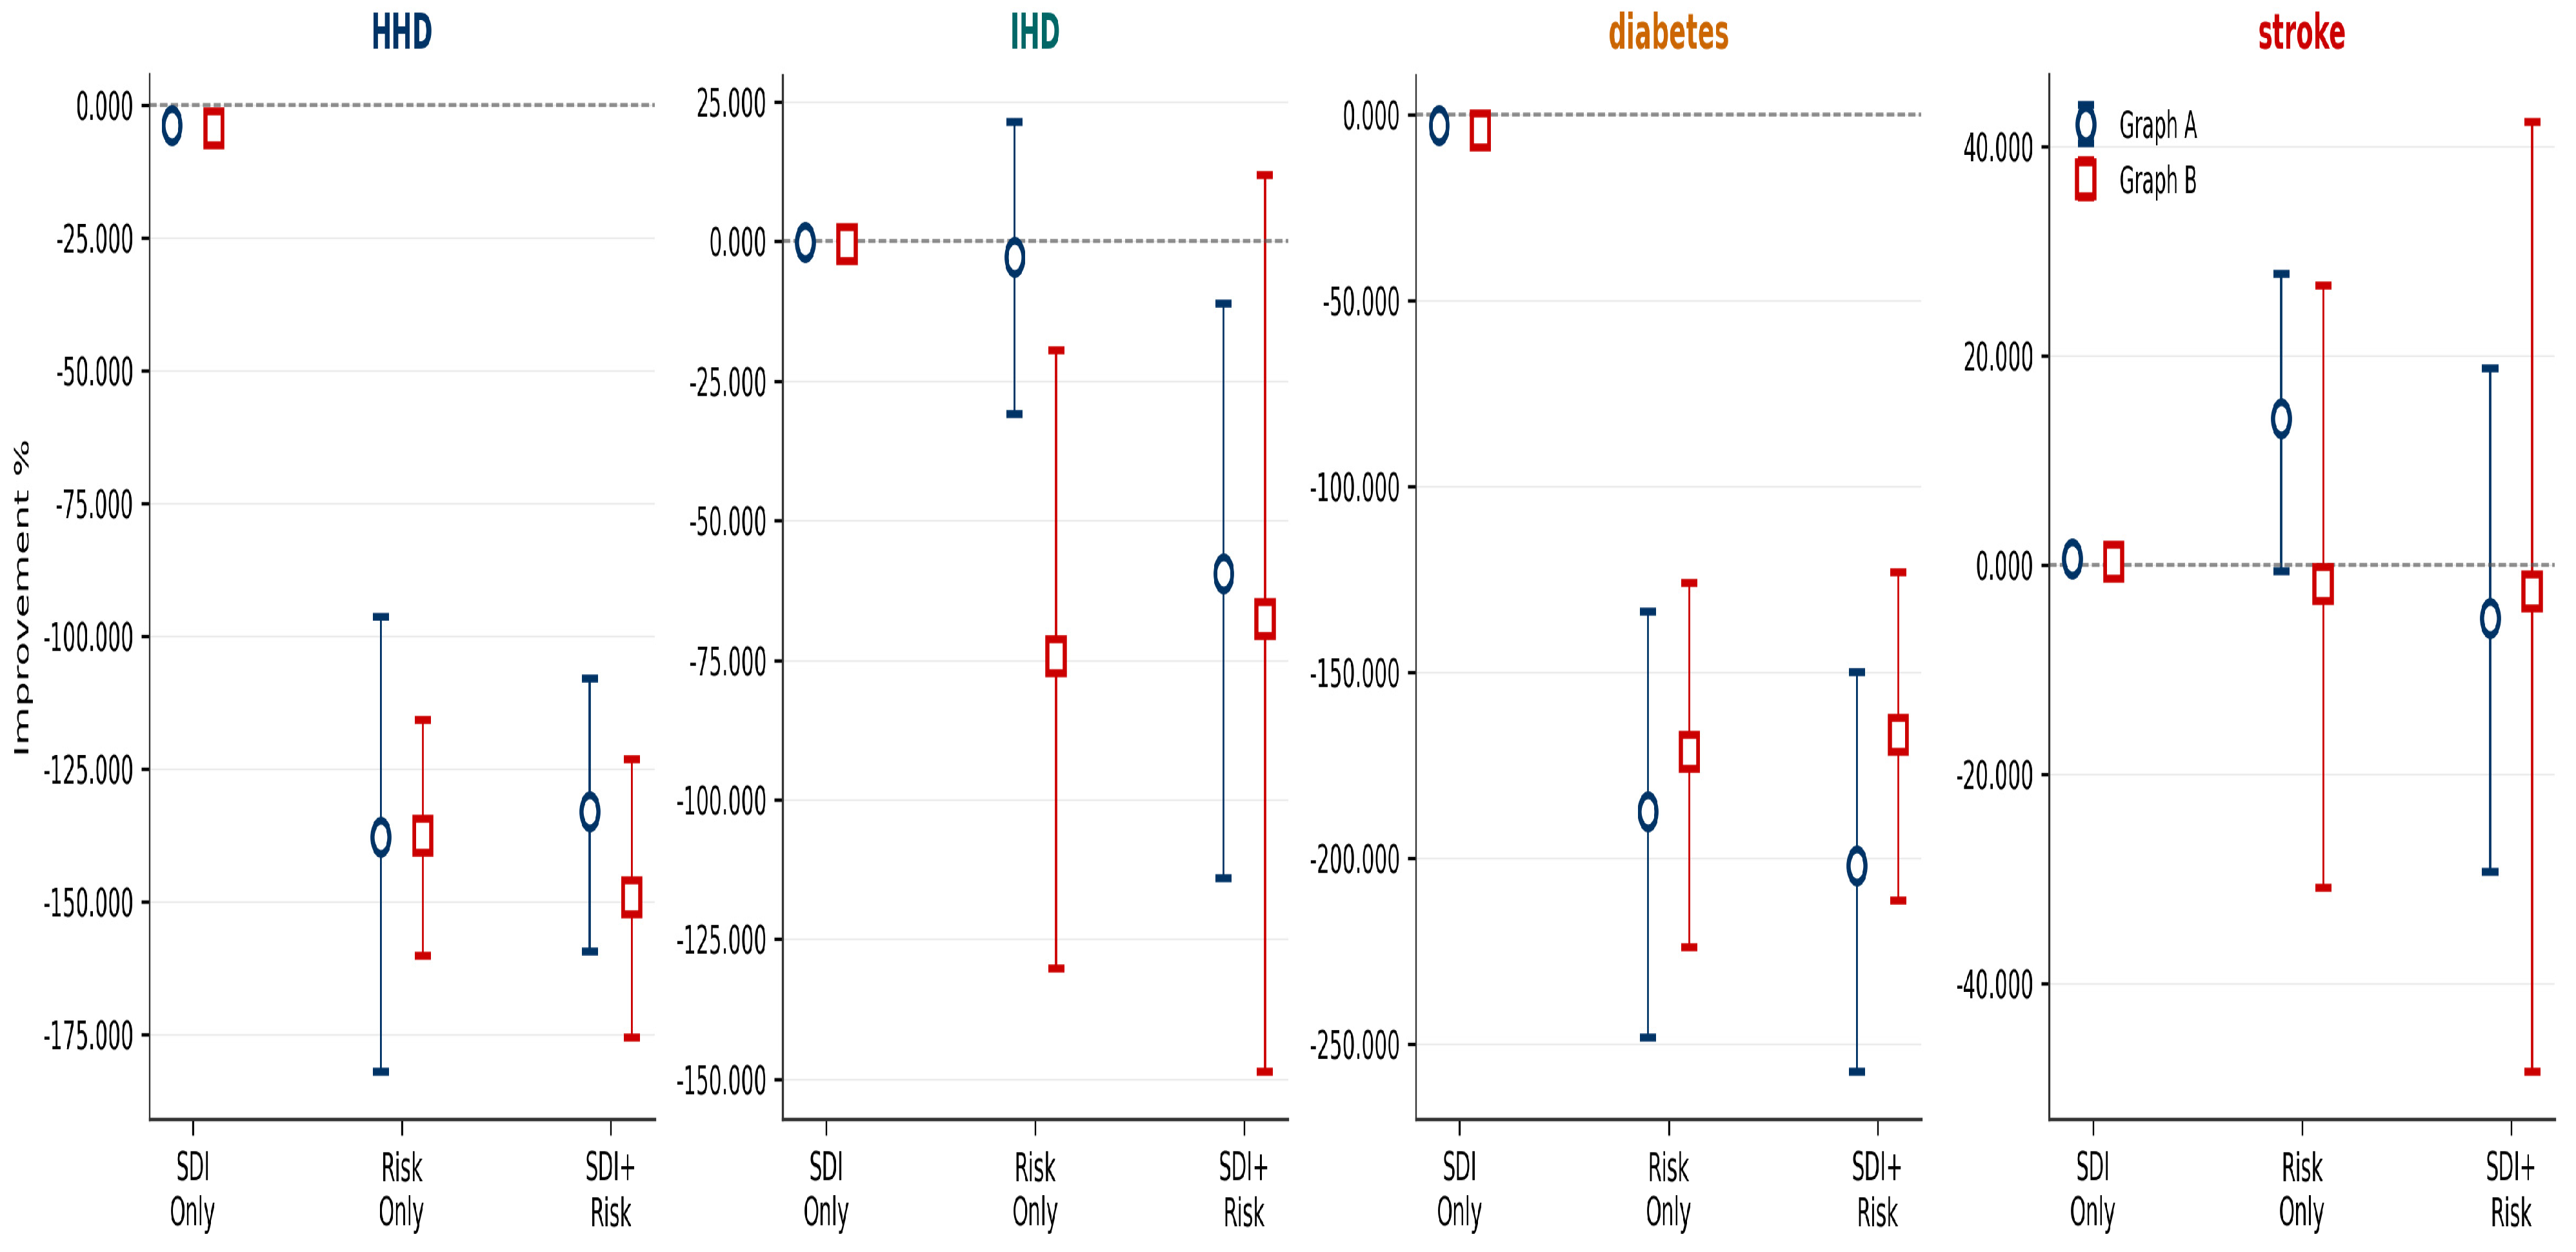
Stroke was the only disease for which adding geographic adjacency edges was consistently associated with positive changes in predictive performance in some specifications. The SDI-only specification produced the only fully reliable positive result, and the Risk-only specification the largest point estimate, though classified as uncertain due to the CI marginally crossing zero. These patterns are consistent with the broader literature on stroke as a disease associated with shared regional risk factor distributions, elevated SBP, glucose dysregulation, and dietary transitions across the East African Community [
4,
8,
9] and with Chinembiri et al.’s observation that NCD mortality in East Africa is spatially structured and associated with shared contextual conditions [
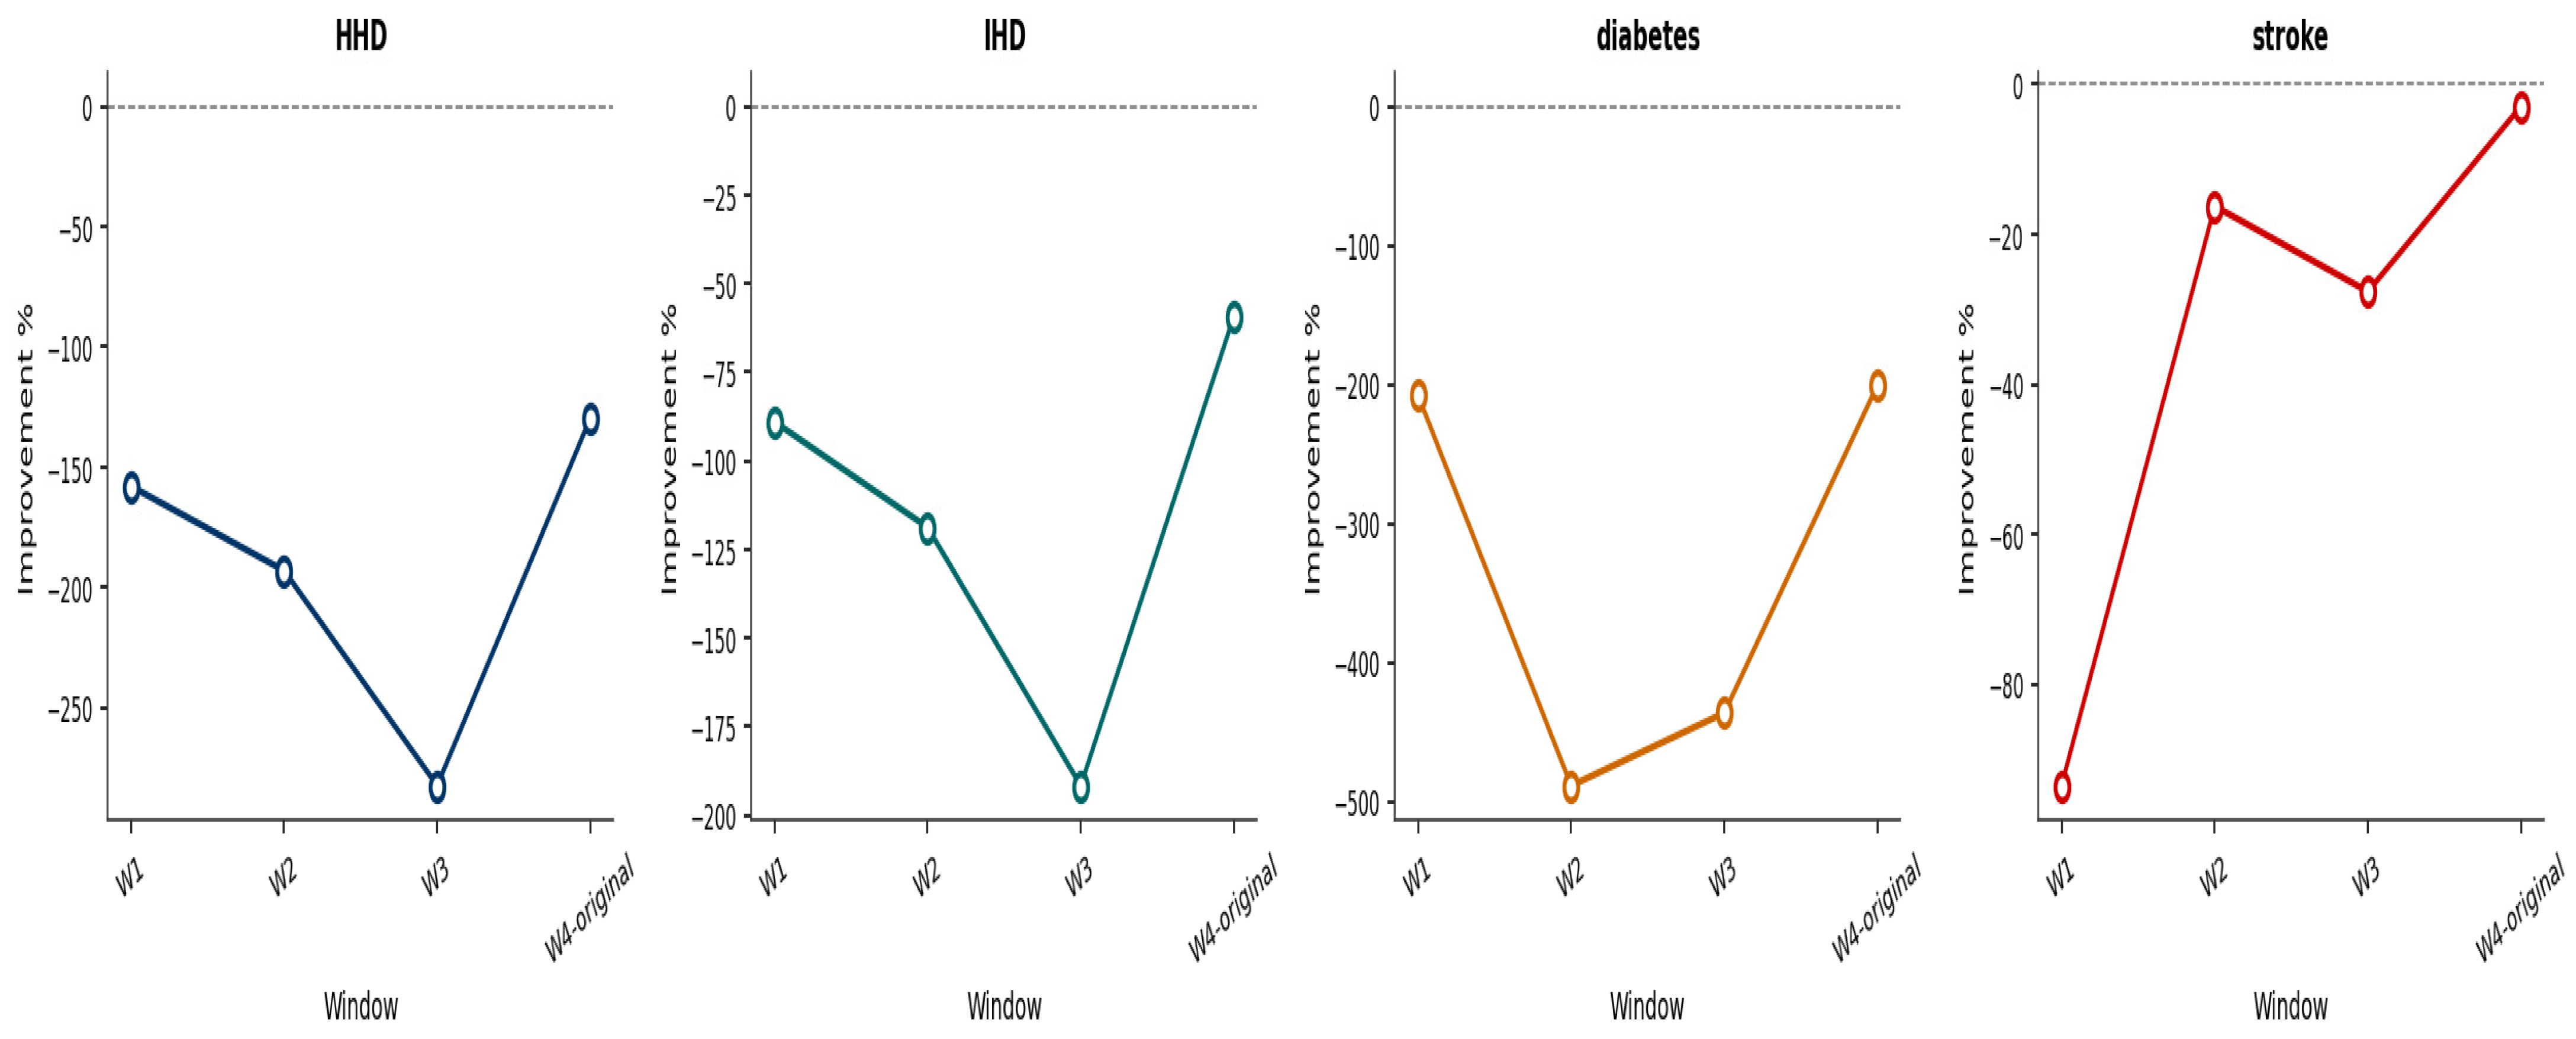
11]. The progressive attenuation of negative spatial improvement across rolling temporal windows is consistent with an emerging or strengthening cross-border spatial structure post 2015, potentially associated with regional convergence in CVD-relevant risk factor distributions [
49,
50]. However, whether this pattern reflects genuine epidemiological cross-border spatial structure, a data regularity specific to the post-2015 GBD modelling cycle, or a technical property of the specific graph and covariate configuration cannot be established from predictive analyses alone. The suppression of the spatial signal in the SDI + Risk specification is consistent with near-constant SDI values across the five Low-SDI countries, introducing collinear variance that destabilises the attention mechanism. This pattern has implications for model specification in developmentally homogeneous regional samples. For IHD, the near-zero and uncertain results across multiple configurations indicate that detectable spatial predictive structure is absent in this dataset for this disease, consistent with IHD’s known aetiological complexity and heterogeneous risk factor profile [
6,
7,
51,
52].
HHD produced the most consistent pattern of spatial performance degradation, with all model/graph combinations yielding severe or mild degradation with fully negative confidence intervals. No specification or sex disaggregation approach was associated with positive spatial predictive performance for HHD. The ablation evidence suggests that degradation is associated specifically with the combination of metabolic risk covariates and geographic adjacency rather than with the graph architecture alone. This pattern may correlate with country-specific SBP distributions and healthcare access patterns that may not co-distribute across borders [
53,
54,
55], as documented in the established epidemiology of hypertension in East Africa, where SBP patterns are associated with country-specific dietary salt intake, detection rates, and treatment access rather than cross-border dynamics. However, oversmoothing from the two-layer HGTConv architecture and graph misspecification from the binary adjacency assumption are equally consistent with this pattern and cannot be excluded. The marginally reduced degradation in Graph B compared with Graph A is consistent with male and female HHD patterns having slightly different relational structures, though the dominant pattern of severe degradation persists for both sexes in all specifications.
Diabetes showed strong and stable spatial degradation across all configurations, with narrow confidence intervals confirming seed stability. This is unexpected given that diabetes is strongly associated with dietary transitions and obesity patterns often described as regionally shared in SSA [
4,
56]. The extreme degradation in W2 and W3 compared with W1 and W4 is consistent with non-stationarity in diabetes-relevant spatial patterns during 2006–2015, possibly associated with diverging national dietary transition trajectories before partial reconvergence [
57,
58]. The attention weight analysis showed broadly distributed country-level norms with no dominant spatial source—consistent with national risk factor heterogeneity rather than cross-border co-distribution, though this inference relies on embedding norms as a proxy rather than direct attention weight measurement [
59]. This observation underscores the need to shift from broad, cross-border health policies to localised interventions.
The sex-disaggregated graph configuration (Graph B) was associated with stronger stroke spatial signals in the single-seed diagnostic (+25.698% vs. −2.792% in Graph A). The training dynamics for Graph B stroke showed earlier divergence from baseline, consistent with the model identifying sex-specific relational structure more efficiently when male and female nodes are treated separately. These patterns are consistent with latent sex-specific spatial heterogeneity that is masked by both-sex aggregation [
60,
61]. However, this pattern did not achieve statistical reliability in the multi-seed analysis, where all Graph B stroke configurations remained uncertain. The tension between detection at the single-seed level and robustness across initialisations reflects genuine variability in the model’s ability to identify this signal and should be treated cautiously. Sex-disaggregated graph construction may offer methodological value for identifying latent spatial heterogeneity in health data, but further validation across larger and more diverse country sets is needed before this can be treated as a stable finding.
These findings contribute to the existing literature in several ways, with the important caveat that all contributions should be understood as preliminary and context-specific. First, they provide a disease-specific analysis of spatial predictive performance in NCD mortality that extends beyond the aggregate spatial clustering reported by Chinembiri et al. [
11] and the risk factor associations identified by King et al. [
46]. Second, they show—in this specific five-country, Low-SDI context—that shared metabolic risk factors do not uniformly generate positive spatial predictive performance when modelled through a heterogeneous graph framework, and that the direction and magnitude of performance change are disease-specific. Third, they suggest that sex-disaggregated graph structures may offer methodological utility for identifying latent heterogeneity, though this requires validation. Fourth, they provide the first formal temporal stability assessment of spatial predictive patterns in NCD mortality in East Africa using this approach, indicating that stroke spatial performance may be strengthening post 2015 while diabetes exhibits non-stationarity during 2006–2015. Replication in other geographic settings, with different country compositions and covariate structures, will be necessary to determine how generalisable these patterns are.
4.1. Practical Implications
Measures to alleviate NCDs and their related mortality burden in East Africa should adopt a dual approach. There should be a focus on regional dynamics while improving proximal and structural factors associated with socio-economic conditions, genetics, dietary habits, physical activity, population mobility, and healthcare access. Our findings also suggest that policy efforts should not only address current NCDs burdens but also anticipate future patterns. The disease-specific nature of spatial predictive patterns supports the need for disease-disaggregated rather than aggregate regional NCD strategies. The finding that stroke exhibits detectable spatial predictive structure while HHD and diabetes do not suggests that coordinated cross-border approaches—such as joint surveillance systems, shared clinical protocols, and regionally harmonised risk factor screening—are more likely to add value for stroke prevention and management than for HHD or diabetes, where country-specific determinants dominate. This is consistent with the East African Community’s mandate to coordinate regional health policies but provides empirical specificity about where such coordination is most analytically justified.
In addition, this study highlights disparities in metabolic burden across regions with varying levels of socio-economic development, revealing specific challenges in lower SDI settings and underscoring the need for targeted, context-specific interventions. The results also emphasise the complex relationship between societal transitions and metabolic risk factors, suggesting that rapid economic development may not be accompanied by adequate attention to NCD prevention through metabolic risk mitigation. These findings warrant increased policy attention not only in East Africa but also in other LMICs undergoing epidemiological and socio-economic transitions.
The progressive strengthening of stroke spatial predictive structure over time—approaching zero degradation in W4 compared to severe degradation in W1—suggests that cross-border patterns in stroke-relevant risk factor distributions may be emerging as a consequence of regional economic integration, urbanisation convergence, and dietary transitions in the post-2015 period. Health planners in East Africa should anticipate that diseases currently showing no cross-border spatial structure may develop such a structure as the region continues to integrate. Prospective surveillance systems that monitor not just mortality levels but also the cross-border co-movement of risk factor distributions would be valuable for detecting such emerging patterns early.
The demonstration that GBD measurement uncertainty contributes less to result variance for HHD, IHD, and diabetes is practically significant for health information systems. It indicates that for these diseases, investment in improving model reliability (reducing seed-to-seed variability through larger training sets or more robust architectures) is likely to yield greater analytical returns than investment in improving input data quality alone. For stroke, where age-specific prevalence patterns create computational challenges, improving sub-national age-disaggregated stroke estimates in East Africa would directly address the feasibility limitation of uncertainty propagation.
The sex-disaggregated findings for stroke—where Graph B revealed substantially stronger spatial signals than Graph A in the diagnostic analysis—highlight the value of disaggregated surveillance and analysis. National health information systems in East Africa that collect and report sex-disaggregated mortality and risk factor data should include age group dynamics to enable more precise identification of the most at-risk population subgroups or population subgroups driving emergent NCD spatial patterns. Such information can guide the creation of more targeted prevention strategies.
The superior performance of HGT over OLS spatial lag across all diseases demonstrates the practical value of graph-based deep learning for health system planning in data-rich, multi-dimensional settings. The framework is extensible to a wider geographic scope—covering the broader African continent—and to additional risk factors such as tobacco use, physical inactivity, and air pollution, which were not included in the present analysis due to data availability constraints. As GBD sub-national data become increasingly available, future implementations could operate at the administrative level, providing finer-grained spatial intelligence for health resource allocation.





 ,
,