Article

Tissue-State-Dependent Near-Infrared Spectral Responses and SSC Prediction Stability in Navel Orange

1
College of Engineering, Huazhong Agricultural University, Wuhan 430070, China
2
Joint Institute of Huazhong Agricultural University and Lincoln University, Wuhan 430070, China
3
Key Laboratory of Agricultural Equipment in Mid-Lower Yangtze River, Ministry of Agriculture and Rural Affairs, Wuhan 430070, China
4
National Digital Crop Cultivation (Orchard) Innovation Sub-Center, Ministry of Agriculture and Rural Affairs, Wuhan 430070, China
*
Author to whom correspondence should be addressed.
Information 2026, 17(8), 746; https://doi.org/10.3390/info17080746
Submission received: 23 May 2026 / Revised: 11 July 2026 / Accepted: 30 July 2026 / Published: 1 August 2026

Abstract

The near-infrared (NIR) spectral responses under different tissue states are important for nondestructive soluble solids content (SSC) assessment of thick-peeled citrus, but the effects of peel removal and progressive tissue exposure remain unclear. Diffuse reflectance and transmittance spectra of Zigui navel oranges were collected at 650–1050 nm under four sequential states: intact fruit, first-slice fruit, second-slice fruit, and half fruit. Raw, first-derivative, and second-derivative spectra were analyzed using wavelength-wise paired tests, effect-size summaries, empirical response indices, and repeated validation of SSC prediction models. Slicing clearly altered the NIR spectral profiles, although these changes should not be interpreted as direct measurements of physical penetration depth. Diffuse reflectance spectra were more sensitive to surface-related changes, whereas transmittance spectra reflected cumulative optical-path responses. In 100 repeated stratified random splits, intact-fruit spectra showed only an average tendency toward more stable SSC prediction. Absolute prediction accuracy was weak for all tissue states, with the highest mean R2p being only 0.262 for intact fruit and negative mean R2p values for the other states. Thus, increased tissue exposure did not improve model generalization. This study mainly clarifies tissue-state-dependent spectral responses and provides a cautionary reference for SSC prediction in thick-peeled citrus.

1. Introduction

Citrus fruit is one of the most widely cultivated and consumed horticultural crops worldwide. Fruit quality affects consumer acceptance, postharvest grading, storage management, and market value. For fresh citrus fruit such as navel orange, soluble solids content (SSC) is closely related to sweetness and maturity, while acidity, water status, sugar–acid balance, and tissue structure also contribute to eating quality. Conventional SSC measurement is destructive and labor-intensive and therefore cannot meet the requirements of rapid sorting and large-scale nondestructive quality detection. Visible and near-infrared (Vis-NIR/NIR) spectroscopy has consequently been widely investigated for fruit-quality assessment because it can rapidly acquire optical information related to internal composition and tissue status [1,2,3,4,5].
The principle of NIR-based fruit-quality detection is to relate spectral signals to reference quality indices through chemometric modeling. Light entering fruit tissue undergoes absorption, scattering, reflection, and transmission, and the acquired spectrum contains mixed information from chemical components and tissue structure. However, fruit samples are heterogeneous biological materials with irregular shape, variable surface curvature, and nonuniform internal structure. Their spectra are easily influenced by scattering, baseline drift, local tissue differences, acquisition geometry, and instrument conditions. Standard normal variate transformation, detrending, derivative processing, and other preprocessing methods are therefore commonly used to reduce nonchemical interference and improve model stability [6,7,8]. Recent reviews have further emphasized that although Vis-NIR/NIR spectroscopy has considerable potential for nondestructive SSC detection, robust practical application still depends on sample representativeness, acquisition mode, preprocessing strategy, feature selection, model transferability, and independent validation [4,5].
NIR detection of citrus fruit has already established a solid research foundation. Early studies demonstrated the feasibility of nondestructive sugar-content determination in Satsuma mandarins and other loose-skin citrus using transmittance spectroscopy [9,10]. Subsequent studies on mandarin, Satsuma mandarin, Nanfeng mandarin, orange, and related citrus materials further showed that Vis-NIR/NIR spectra can be used to evaluate intact-fruit SSC, acidity, firmness, sweetness-related parameters, and internal quality attributes [11,12,13,14,15,16,17,18,19]. More recent studies have extended citrus SSC detection using portable Vis-NIR spectroscopy, near-infrared transmittance, multi-region fusion, external-factor fusion, and characteristic-variable selection, showing the continued development of spectral sensing methods for citrus quality evaluation [20,21,22,23,24]. Nevertheless, model performance remains strongly affected by cultivar, origin, fruit size, maturity stage, measurement position, sample range, and calibration transfer. Therefore, high spectral difference or good calibration performance under one sample population does not necessarily indicate robust generalization.
For thick-peeled citrus fruit, SSC prediction is further complicated by the optical effects of the peel and shallow tissues. The flavedo, albedo, juice sacs, and pulp differ in absorption and scattering properties, and the final measured spectrum depends on how light interacts with these tissue layers. Previous studies have shown that measurement region, fruit size, multi-region fusion, and external-factor fusion can influence citrus SSC prediction [20,21,22,23]. Comparisons of tissue optical properties have also indicated that citrus fruit may show different scattering and absorption behavior from other fruits, implying that the same acquisition mode may correspond to different effective information depths in different fruit types [25]. In addition, recent work on NIR diffuse reflectance penetration through fruit peel suggests that NIR light does not always sufficiently penetrate thick citrus peel and that penetration-related responses are affected by peel thickness, peel composition, wavelength region, and measurement conditions [26].
The role of the peel in citrus NIR detection is therefore not straightforward. One view regards the peel mainly as an interference source because peel thickness, color, oil glands, surface roughness, and curvature can modify scattering background and weaken pulp-related signals. Another view suggests that peel-related optical properties may also contain indirect information associated with maturity, water status, or internal fruit quality and may therefore contribute to prediction under certain sample populations and acquisition modes [17,18,20,21,22,23]. Studies on internal citrus disorders, such as granulation, also indicate that NIR spectra can respond to tissue-structure changes, but the response depends on optical-path mode, measurement position, and characteristic wavelength selection [27]. These findings indicate that it is overly simplistic to assume that peel removal is always beneficial or that intact-fruit spectra are always sufficient. A clearer understanding of tissue-state-dependent spectral responses is needed.
Most previous citrus SSC studies have focused on improving prediction accuracy through spectral preprocessing, wavelength selection, regression algorithms, or sampling strategies. However, fewer studies have examined how spectra collected from the same fruit change under sequential tissue exposure and whether increased exposure of inner tissues actually improves SSC model generalization. For thick-peeled citrus, this question is important because removing peel or exposing pulp may increase spectral differences, but it may also introduce new variability, including altered surface geometry, juice-sac disruption, water redistribution, dehydration at the cut surface, and mismatch between the optical sampling region and the destructive SSC reference value. Therefore, tissue exposure should not be assumed to improve SSC prediction without repeated validation.
Based on this background, the present study collected diffuse reflectance and transmittance spectra from the same navel orange samples under four sequential tissue states: intact fruit, first-slice fruit, second-slice fruit, and half fruit. The sliced states were not intended to represent practical nondestructive detection modes or direct measurements of physical optical penetration depth. Instead, they were used as reference tissue states to support paired comparisons of spectral responses under sequential tissue-removal conditions. The objectives were to: (1) compare tissue-state-dependent spectral responses of the same fruit under diffuse reflectance and transmittance modes; (2) evaluate relative peel/shallow-tissue effects using paired spectral comparisons and empirical response indices; and (3) investigate whether different tissue states influence SSC prediction stability using repeated validation. The principal finding is that sequential tissue exposure clearly changed NIR spectral responses, but these spectral changes did not translate into improved SSC prediction, indicating that tissue exposure should not be assumed to enhance model generalization in thick-peeled citrus.

2. Materials and Methods

2.1. Sample Preparation

Thirty Zigui navel oranges were purchased from an online commercial supplier through an e-commerce platform in January 2026. According to the product information provided by the supplier, the fruit originated from Zigui County, Hubei Province, China. All samples were obtained from the same order batch. The fruit were not collected directly from a plantation; therefore, detailed orchard-level information and exact harvest date were not available. Fruit with visible mechanical damage, disease symptoms, insect injury, or decay were excluded before spectral acquisition.

2.2. Spectral Data Acquisition

Spectral data were acquired using an AvaSpec-HS2048XL-EVO-ZHD1 spectrometer (Avantes, Apeldoorn, The Netherlands). The main acquisition parameters are listed in Table 1.
Before sample acquisition, dark and white reference spectra were collected for black–white correction of the raw spectral data. This procedure reduced the influence of dark current, environmental noise, and source fluctuation and ensured comparability among samples. During acquisition, each navel orange was fixed on the sample tray with the stem end upward, and diffuse reflectance and transmittance spectra were collected from the intact-fruit state. Subsequently, using the fruit height direction as the reference axis, a thin slice was removed perpendicular to the height axis. The remaining main part was retained and measured again, and this state was defined as the first-slice state. After that, a second thin slice was removed along the same direction, and the remaining fruit was measured again as the second-slice state. Finally, the fruit was cut transversely along the equatorial plane, and the cut surface was placed parallel to the detector plane to obtain the half-fruit state. For each tissue state, 30 valid spectra were obtained, including intact fruit, first-slice fruit, second-slice fruit, and half fruit. All spectra were corrected, named by sample number and tissue state, and saved for subsequent spectral response analysis and SSC modeling.
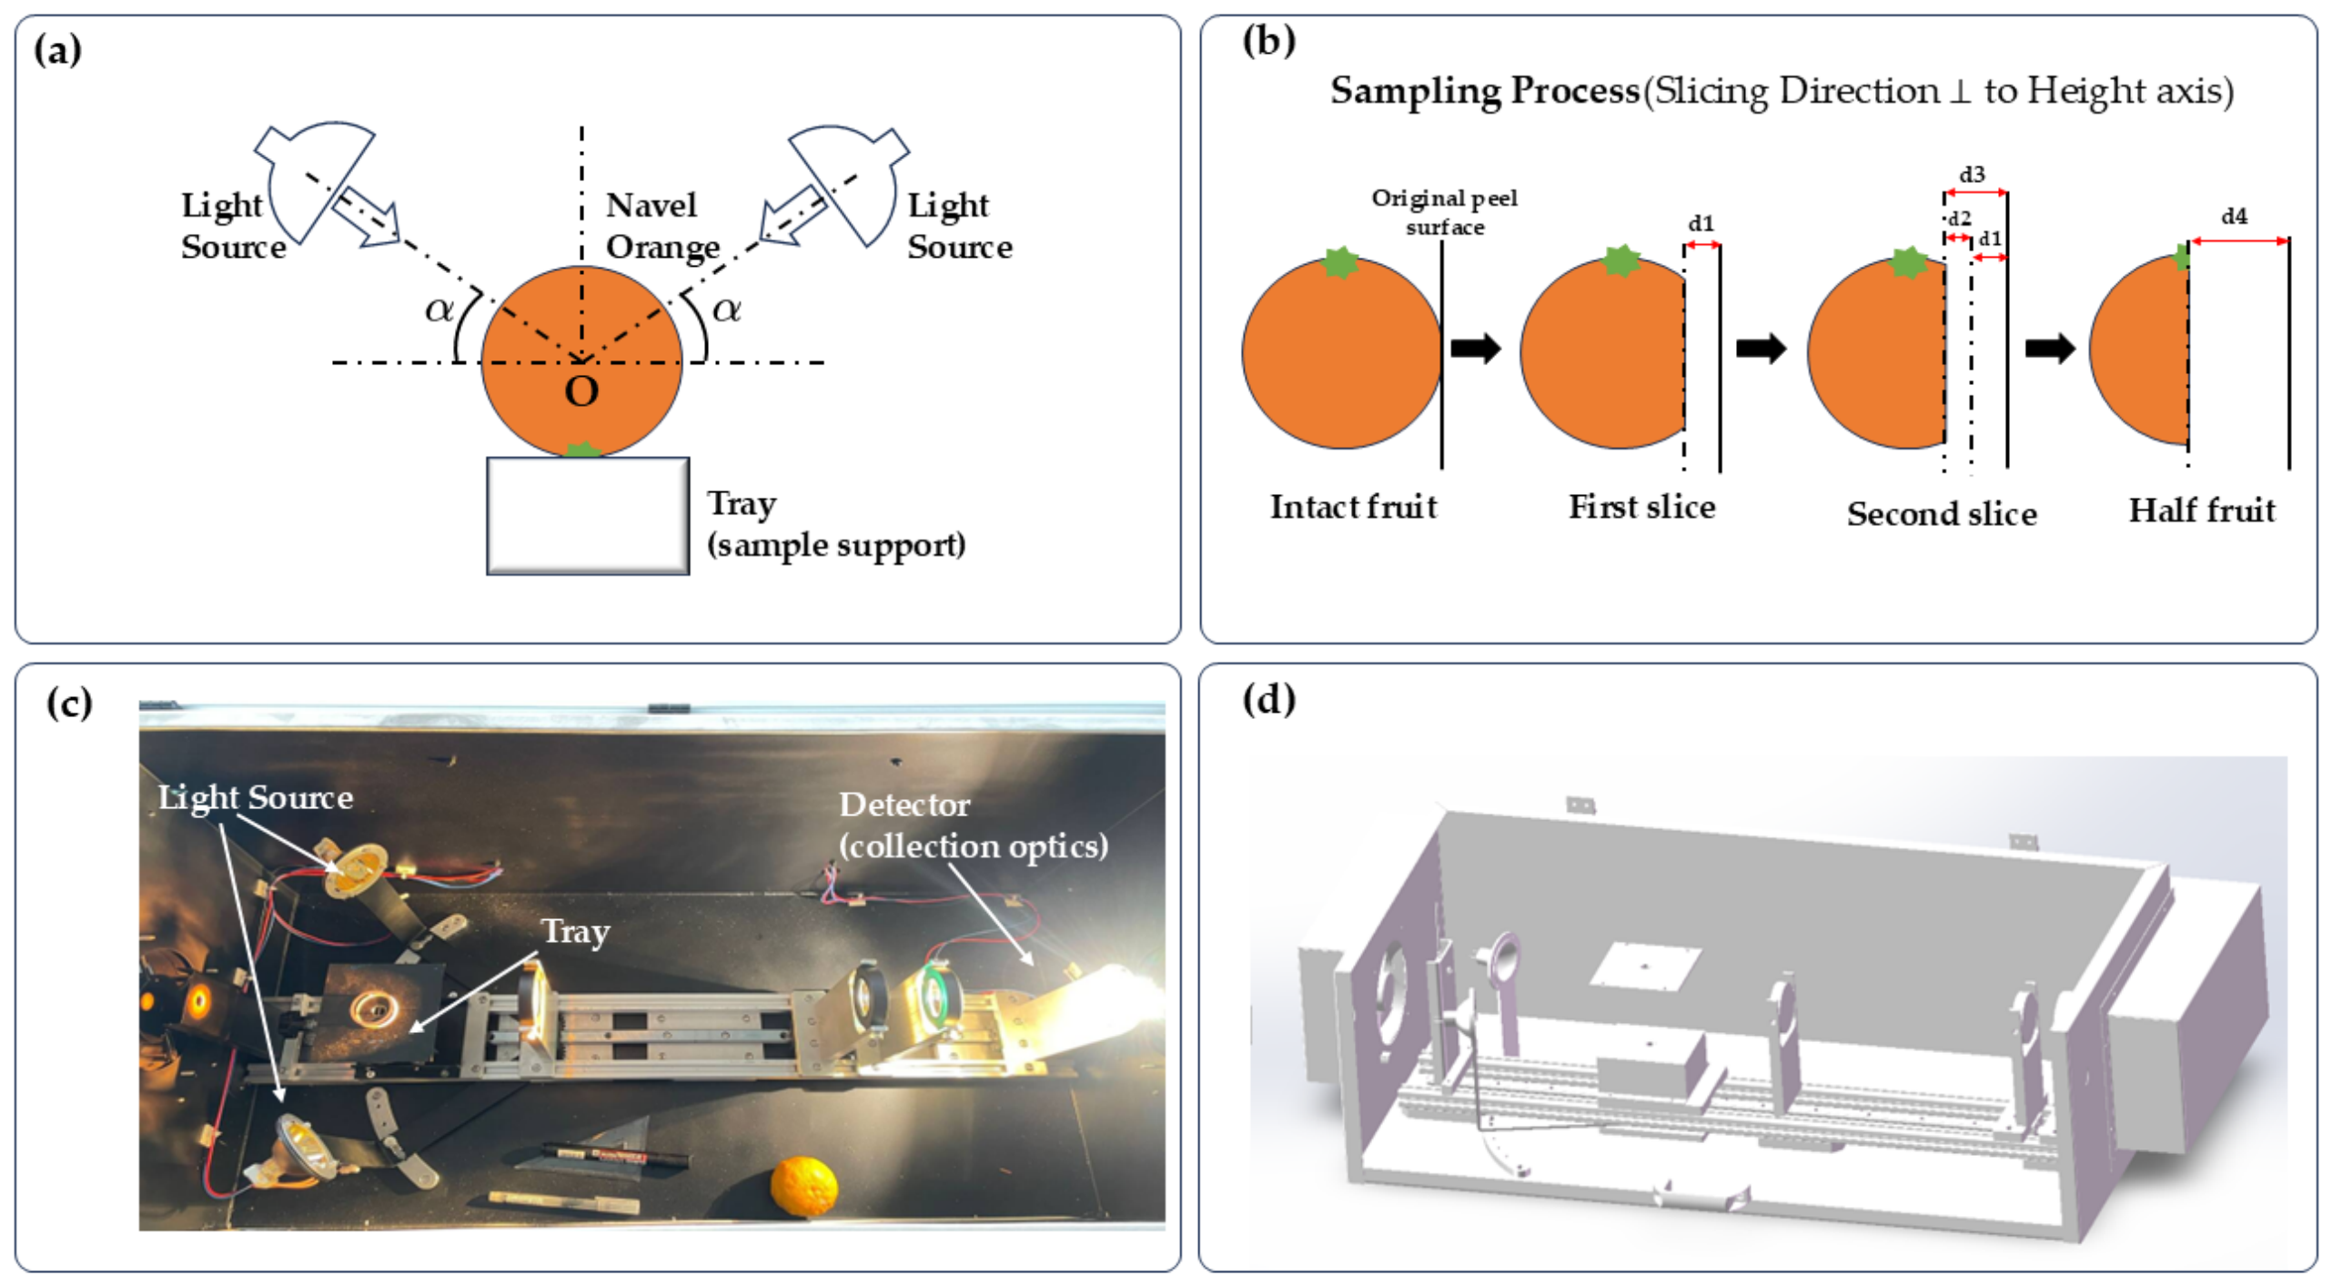
After the spectra of intact fruit were collected, sequential slicing was performed from the detector-facing side of each fruit. The fruit height direction was used as the reference axis, and the slices were removed perpendicular to this axis. The first-slice state was defined as the remaining fruit after removal of the first surface slice. The thickness of the first removed slice represents the distance from the original peel surface to the first exposed cut surface, with a mean value of 2.19 ± 0.25 mm and a range of 1.47–2.60 mm.
The second-slice state was defined as the remaining fruit after an additional slice was removed from the first exposed cut surface on the same side. The thickness of the second removed slice represents the additional distance from the first exposed cut surface to the second exposed cut surface, with a mean value of 3.45 ± 0.99 mm and a range of 2.10–5.71 mm. Therefore, the cumulative removed thickness represents the distance from the original peel surface to the second exposed cut surface, with a mean value of 5.64 ± 0.96 mm and a range of 4.12–7.39 mm. The half-fruit state was obtained by cutting the fruit transversely along the equatorial plane, and the cut surface was placed parallel to the detector plane for spectral acquisition.
It should be noted that the first-slice and second-slice states were defined according to measured removed thicknesses. The first-slice state corresponded to an exposed surface approximately 2.19 mm from the original peel surface, whereas the second-slice state corresponded to an exposed surface approximately 5.64 mm from the original peel surface. Because fruit size and surface curvature varied among samples, these sliced states should be interpreted as measured relative tissue-state conditions rather than strictly fixed radial depths from the fruit surface to the fruit center.

2.3. Measurement of Soluble Solids Content

After spectral acquisition, SSC was measured according to the Chinese agricultural standard NY/T 2637-2014 [28], Determination of SSC in Fruits and Vegetables by Refractometry. To improve the correspondence between the optical sampling region and the destructive SSC measurement, pulp was collected from the same side of the fruit where spectral acquisition had been performed. For each fruit, two to three pulp subsamples were taken from nonadjacent positions around the spectral acquisition region after removing the peel and albedo tissue. The sampling positions were selected as close as possible to the detector-facing region, while avoiding visibly damaged tissue, segment membranes, and the central core. The collected pulp subsamples from each fruit were combined and manually squeezed to obtain a mixed juice sample, which was used to represent the local average SSC near the spectral acquisition region. Approximately 2 mL of juice was dropped onto the prism of a PAL-1 digital refractometer (ATAGO Co., Ltd., Tokyo, Japan). Each juice sample was measured three times, and the average value was recorded as the SSC of that fruit. The overall experimental workflow was illustrated in Figure 1.

2.4. Spectral Preprocessing

The raw NIR spectra were affected by fruit surface condition, light-source fluctuation, detector noise, scattering differences, and baseline drift. For spectral response analysis, three spectral forms were obtained: RAW, FD, and SD. RAW spectra represent the corrected spectra after black–white correction. In the diffuse reflectance mode, RAW spectra were expressed as corrected reflectance; in the transmittance mode, RAW spectra were converted from corrected transmittance to absorbance. FD and SD represent the first- and second-derivative spectra, respectively, and were used to enhance spectral slope changes and local curvature variations.
For SSC modeling, standard normal variate (SNV), multiplicative scatter correction (MSC), Savitzky–Golay smoothing (SG), detrending (Detrend), first derivative (FD), and second derivative (SD) were used to preprocess both reflectance and transmittance spectra. SNV was used to reduce multiplicative scatter effects caused by particle scattering and optical-path differences. MSC was used to correct spectral offsets caused by surface heterogeneity, illumination variation, and scattering differences. SG smoothing reduced random noise while preserving the main spectral profile. Detrend was used to remove baseline drift and slowly varying background signals. FD enhanced slope changes and highlighted absorption edges and overlapping peaks, whereas SD further amplified local curvature changes. Combined preprocessing strategies, including Detrend-SNV, SG-MSC, and SG-SNV, were also tested to compare the effects of different preprocessing strategies on spectral feature extraction and SSC prediction.

2.5. Spectral Response Analysis and Statistical Methods

To evaluate the spectral responses of NIR light in the peel, shallow pulp, and deeper pulp of navel orange, spectra collected from the same fruit under the four tissue states were treated as repeated-measures data. All statistical comparisons were performed using sample number as the paired unit to reduce interference from differences in mass, size, fruit shape, and SSC. The comparison between intact fruit and first-slice fruit was used to characterize peel and shallow-tissue effects; first-slice fruit versus second-slice fruit represented the first deeper-tissue effect; second-slice fruit versus half fruit represented the second deeper-tissue effect; and intact fruit versus half fruit represented the total optical-path effect.
For each wavelength in the 650–1050 nm range, a statistical test was performed. The Friedman test was first used to evaluate whether a global tissue-state effect existed among the four tissue states. This nonparametric repeated-measures test preserves the paired structure of the data and avoids the loss of pairing information caused by independent-sample tests. Based on the global test, paired Wilcoxon signed-rank tests were further used to compare adjacent tissue states and intact fruit versus half fruit at each wavelength. Because wavelength-by-wavelength testing involves a large number of variables, all p values were corrected using the Benjamini–Hochberg false discovery rate (FDR) method. Corrected q values lower than 0.05 were considered significant. The number of significant wavelength points and continuous significant wavelength intervals were then extracted.
Because adjacent wavelengths in NIR spectra are highly correlated, the number of significant wavelengths after FDR correction was used only as descriptive information and was not interpreted as the number of independent spectral effects. To provide an additional measure of effect magnitude, the Wilcoxon effect size was calculated for each wavelength-level paired comparison. The effect size was expressed as |r| = |Z|/√n, where Z was calculated from the Wilcoxon signed-rank statistic and n is the effective number of paired samples after excluding zero differences. For each tissue-state comparison, the median |r| across wavelengths was reported as a summary of the overall effect magnitude.
To quantify the relative influence of shallow tissues on spectral responses, a Surface-Proximity Ratio (SPR) for diffuse reflectance and a Peel-Contribution Ratio (PCR) for transmittance were calculated. SPR evaluates the proximity between the intact-fruit reflectance spectrum and the first-slice spectrum, where a larger value indicates a stronger similarity between the intact-fruit spectrum and the shallow exposed-tissue spectrum. PCR evaluates the relative contribution of the absorbance change from intact fruit to first-slice fruit to the total absorbance change from intact fruit to half fruit. Larger values indicate a greater relative contribution of peel or shallow tissues at that wavelength. SPR and PCR were calculated using Equations (1) and (2), respectively.
Previous work has evaluated NIR penetration through fruit peel using peel-related optical measurements and depth-oriented experimental designs [27]. In contrast, the SPR and PCR indices used in the present study were not intended to provide absolute penetration depths or to replace physically validated penetration-depth measurements. Instead, they were defined as empirical response indices based on paired spectra of the same fruit under sequential tissue states. Their purpose was to provide a simple supporting description of the relative spectral changes caused by peel removal and progressive pulp exposure under the present experimental conditions.
S P R ( λ ) = 1 | R W ( λ ) R F 1 ( λ ) | | R W ( λ ) R H ( λ ) | + ε
P C R ( λ ) = | A W ( λ ) A F 1 ( λ ) | | A W ( λ ) A H ( λ ) | + ε
Therefore, SPR and PCR should be interpreted only as relative, tissue-state-based spectral response indices. They do not represent real optical penetration depth in millimeters and should not be used independently as physical penetration-depth parameters.
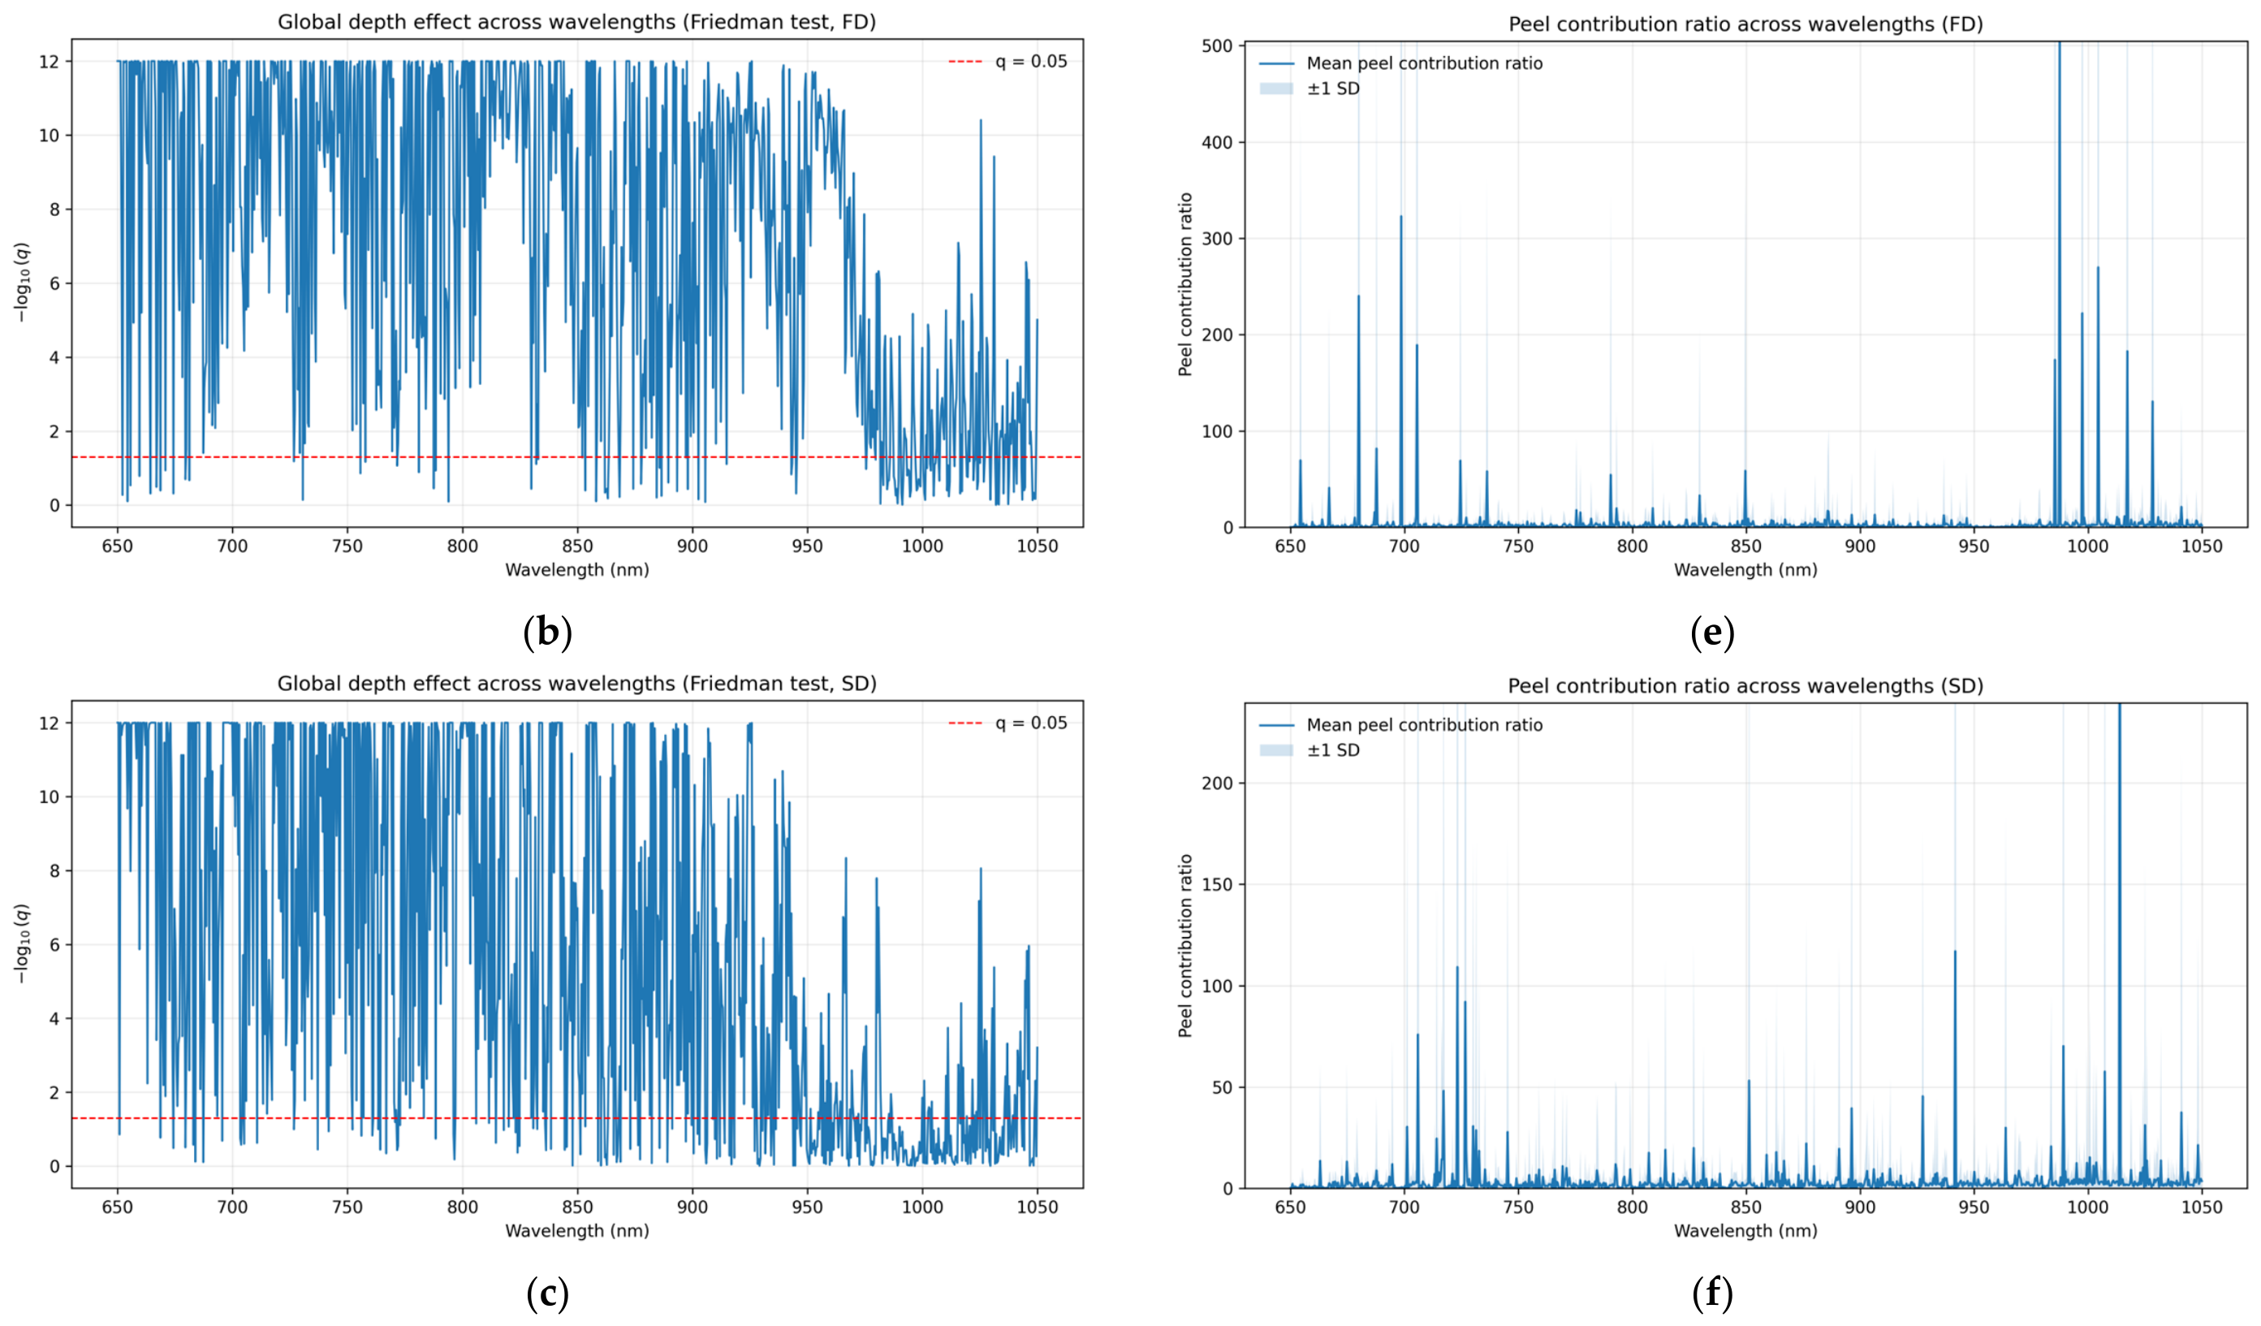
In these equations, RW, RF1, and RH represent the diffuse reflectance spectra of intact fruit, first-slice fruit, and half fruit, respectively; AW, AF1, and AH represent the corresponding transmittance absorbance spectra; and ε is a small constant used to avoid instability when the denominator approaches zero. In this study, ε was set to 1 × 10⁻¹² for both SPR and PCR calculations. SPR and PCR were used only as auxiliary empirical indices to support the qualitative interpretation of relative tissue-state-dependent spectral response patterns; they should not be interpreted as absolute physical optical penetration depths. In FD and SD spectra, derivative processing may cause the local total-path difference to approach zero and thereby amplify the ratio values. Therefore, ratio peaks in derivative spectra should be interpreted with caution.
All wavelength-wise spectral response analyses, paired statistical tests, effect-size calculations, empirical response-index calculations, and figure generation were performed in Python 3.13.

2.6. Dataset Division and Repeated Validation

To avoid information leakage among tissue states, the fruit number was used as the basic unit for dataset division. Spectra collected from the same orange under different tissue states, including intact fruit, first-slice fruit, second-slice fruit, and half fruit, were always assigned together to either the calibration set or the prediction set. This prevented different tissue-state spectra from the same fruit from appearing simultaneously in both sets.
A repeated validation procedure was performed to evaluate the stability of SSC prediction under the limited sample size. The dataset was repeatedly divided into calibration and prediction sets using stratified random splitting based on SSC distribution. In each repetition, 75% of the samples were used for calibration and 25% were used for prediction. This procedure was repeated 100 times. In each repetition, model selection, including preprocessing selection, regression algorithm comparison, and hyperparameter optimization, was conducted only within the calibration set using five-fold cross-validation. The prediction set was used only for final model evaluation.

2.7. Model Establishment

To evaluate the SSC prediction ability of NIR spectra under different tissue states, the measured SSC values were used as reference values, and spectral variables within 650–1050 nm were used as input variables. SSC prediction models were established separately for intact fruit, first-slice fruit, second-slice fruit, and half fruit.
Partial least squares regression (PLSR), least absolute shrinkage and selection operator (LASSO) regression, and support vector regression (SVR) were selected as candidate regression methods. PLSR was used as a classical chemometric method for high-dimensional and collinear spectral data. LASSO was used to reduce model complexity by shrinking some regression coefficients toward zero. SVR with a radial basis function kernel was used to handle possible nonlinear relationships between spectral variables and SSC.
For each tissue state and each repeated split, different spectral preprocessing methods and regression models were evaluated within the calibration set. The tested preprocessing methods included RAW, SNV, MSC, SG, Detrend, FD, SD, Detrend + SNV, SG + MSC, and SG + SNV. Model selection and hyperparameter optimization were performed only within the calibration set using five-fold cross-validation. The prediction set was not used for preprocessing selection, model selection, or hyperparameter optimization.
The parameter search grids were as follows. For PLSR, the number of latent variables was searched from 1 to the maximum allowable number determined by the calibration-set size and the number of spectral variables. For LASSO, the regularization parameter α was searched among 1 × 10⁻⁴, 3 × 10⁻⁴, 1 × 10⁻³, 3 × 10⁻³, 1 × 10⁻², 3 × 10⁻², and 1 × 10⁻¹. For SVR, the radial basis function kernel was used, and C was searched among 0.5, 1, 2, 5, and 10; ε was searched among 0.01, 0.05, 0.10, and 0.20; and γ was searched among scale, 0.01, 0.05, and 0.10.
For each repetition, the final model combination was selected according to the lowest cross-validation RMSE within the calibration set. The selected preprocessing method, regression algorithm, and hyperparameter values for each repeated split were recorded, and their selection frequencies were summarized in the Supplementary Table S2. The prediction set was used only for final evaluation of the selected model in each repetition. The calibration metrics reported in Supplementary Table S1 were calculated after the selected model was refitted on the full calibration set and were provided only to describe the in-sample fit. These calibration metrics were not used for model selection or for evaluating predictive performance; model selection was based on cross-validation RMSE within the calibration set, and predictive performance was assessed using the prediction-set metrics.

2.8. Model Evaluation

Model stability and accuracy were evaluated using the coefficient of determination of the calibration set (R2c), coefficient of determination of the prediction set (R2p), root mean square error of calibration (RMSEC), root mean square error of prediction (RMSEP), and residual predictive deviation (RPD). A higher coefficient of determination and a lower RMSE indicate better model performance. The metrics were calculated as Equations (3)–(5).
R 2   =   1     i = 1 n   ( y i     y ^ i ) 2 i = 1 n   ( y i     y ) 2
R M S E C / R M S E P = i = 1 n ( y i y ^ i ) 2 n
R P D = S D y R M S E P
where yi is the measured SSC value of the ith sample, ŷi is the predicted value, ȳ is the mean measured SSC value, SDy is the standard deviation of measured SSC values in the prediction set, and n is the number of samples. Because R2 is calculated relative to the mean of the measured values, a negative R2p can occur when the prediction residual sum of squares is larger than the total sum of squares of the prediction-set SSC values.
For the repeated validation procedure, prediction-set metrics were recorded for each of the 100 repeated stratified random splits. Because the 100 repeated splits were generated from the same 30 fruit and were therefore not statistically independent, the repeated-split results were summarized primarily as mean ± standard deviation. The standard deviation was used to describe the variability of the resampling procedure, rather than the true uncertainty of model generalization. Accordingly, the repeated-validation results were used only to compare average tendencies and stability patterns among tissue states under the present dataset.

3. Results

3.1. Tissue-State-Dependent Spectral Response Analysis

3.1.1. Sample Characteristics and Dataset Division

A total of 30 valid spectral datasets were obtained. The statistical characteristics of fruit mass, geometric dimensions, slicing thickness, and measured SSC are summarized in Table 2.

3.1.2. Diffuse Reflectance Spectral Response

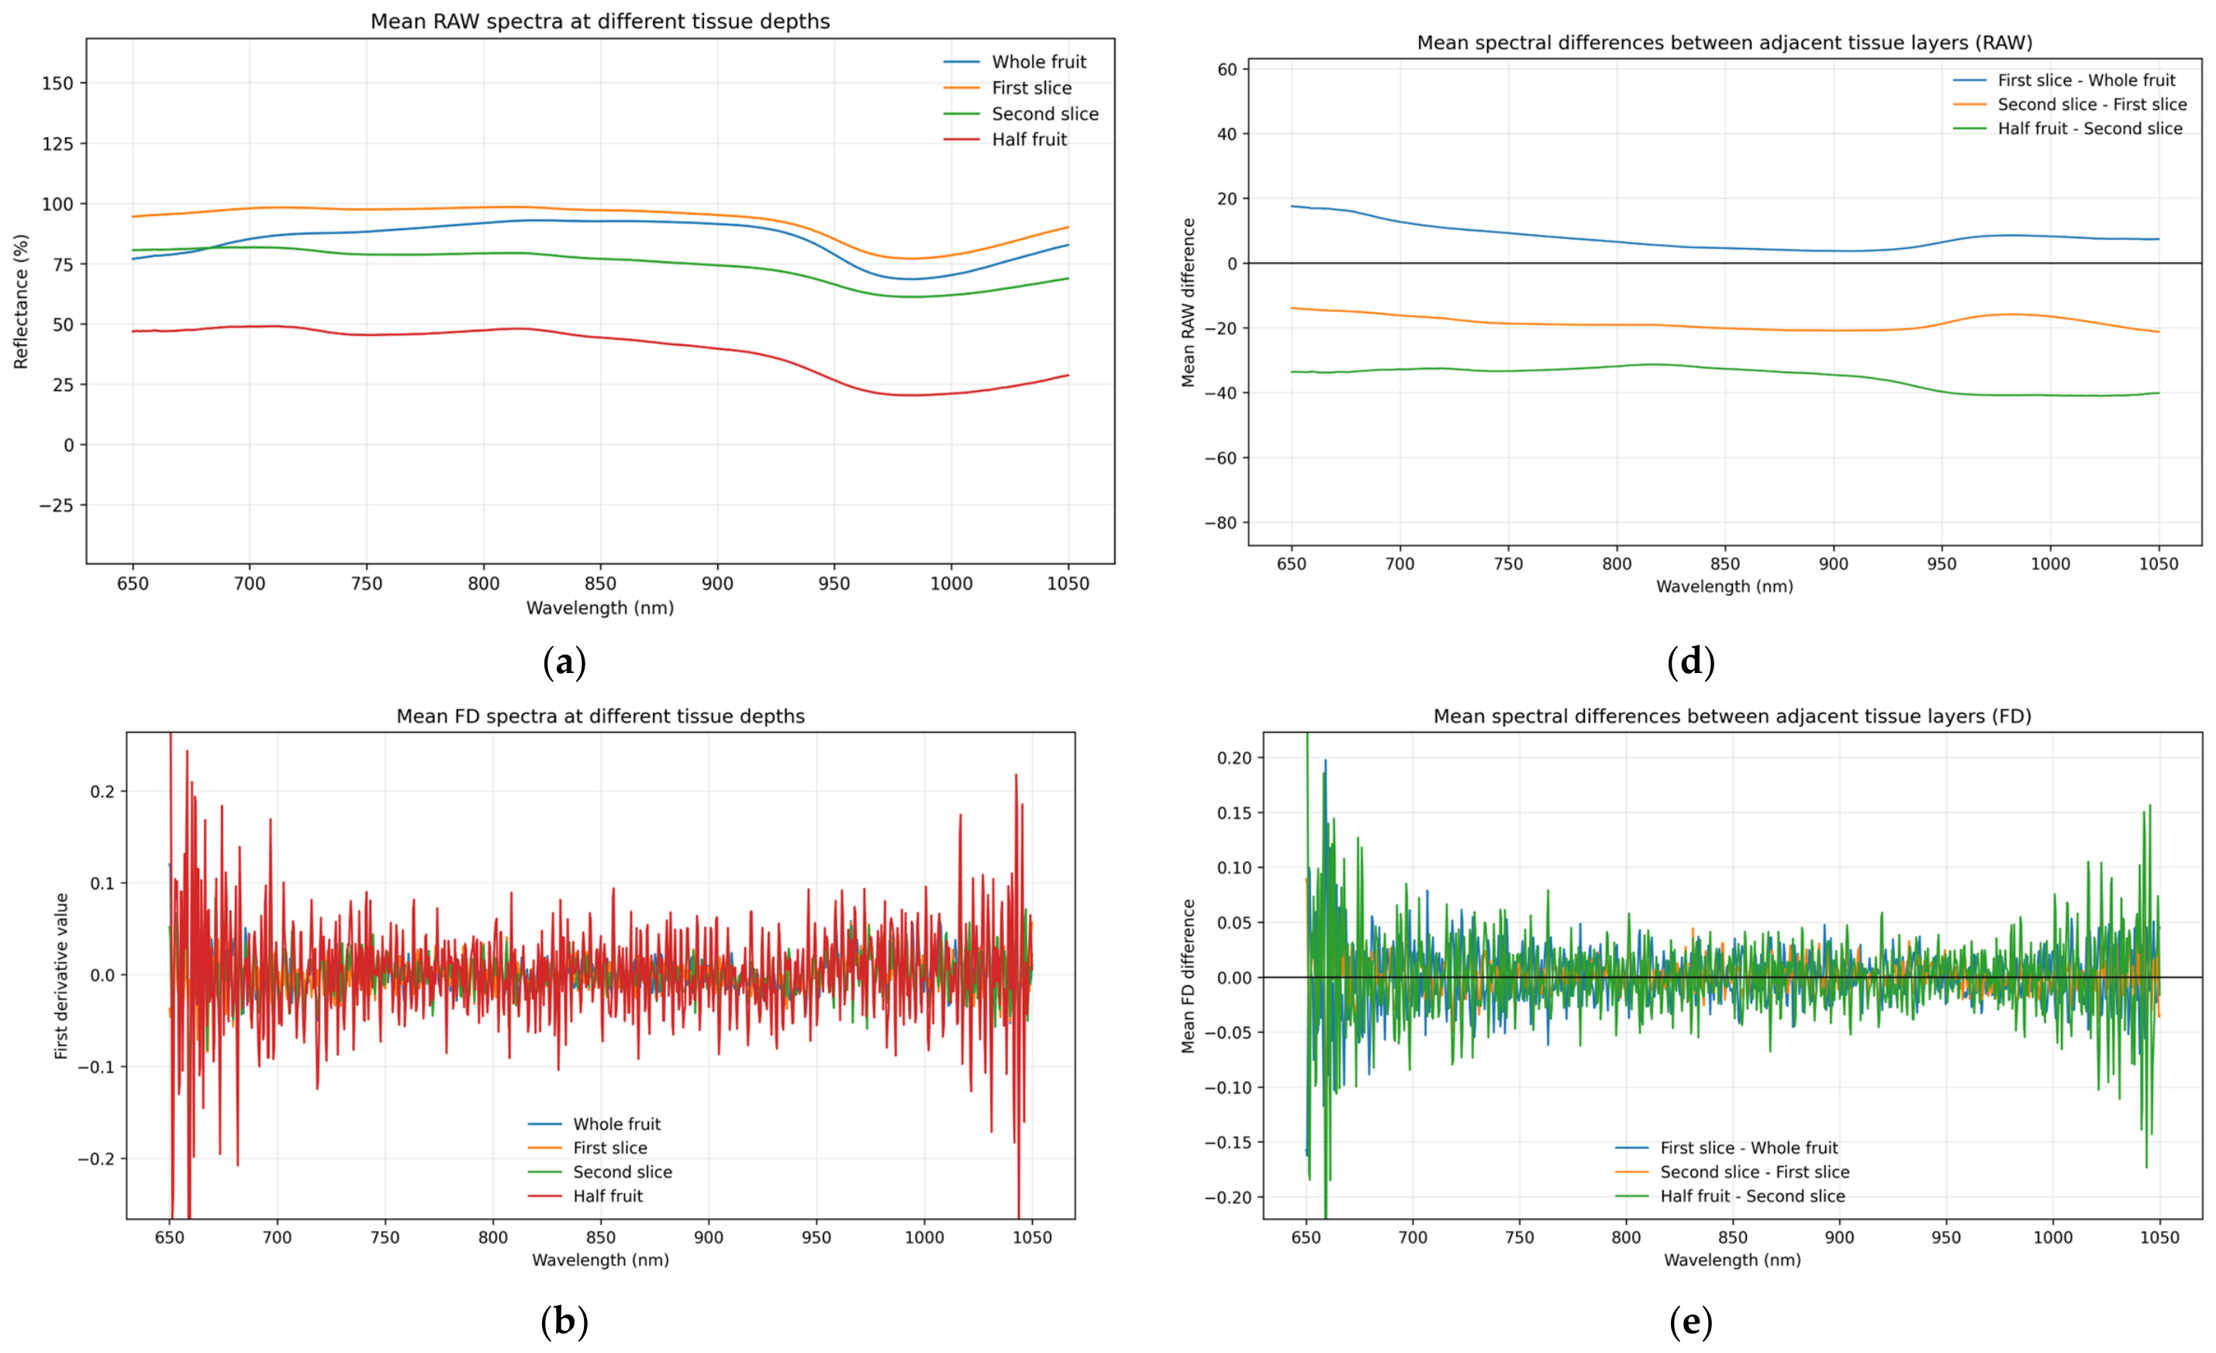
In the diffuse reflectance mode, RAW spectra showed clear differences among tissue states. The mean reflectance of the first-slice state was generally higher than that of intact fruit, whereas the reflectance of the second-slice and half-fruit states decreased progressively, which were shown in Figure 2. This change may be associated with the combined effects of peel removal, shallow-tissue exposure, and changes in surface geometry. Specifically, the intact fruit had a curved surface, whereas the sliced states had relatively flat exposed cut surfaces, which could influence surface reflection, scattering paths, and the efficiency of light collection by the detector. Therefore, the observed reflectance changes should be interpreted as tissue-state-dependent spectral responses under the present measurement conditions rather than as isolated tissue optical effects.
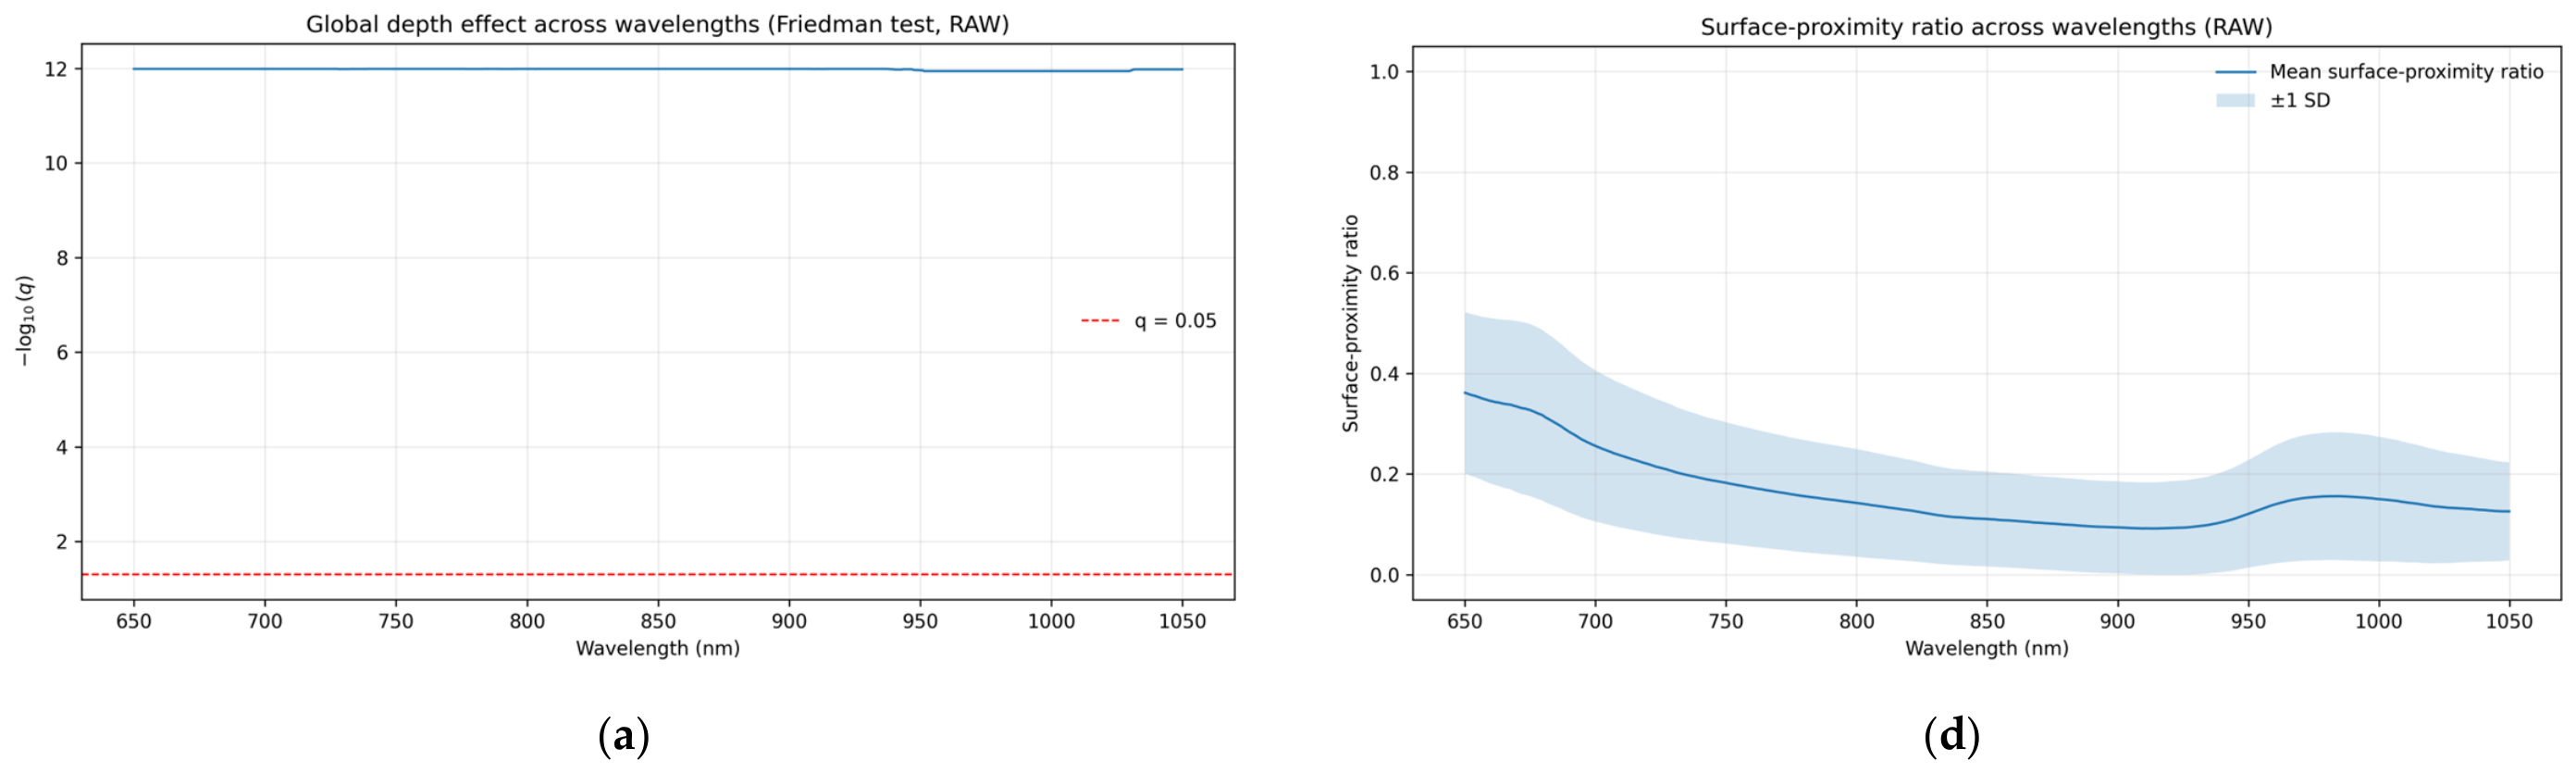
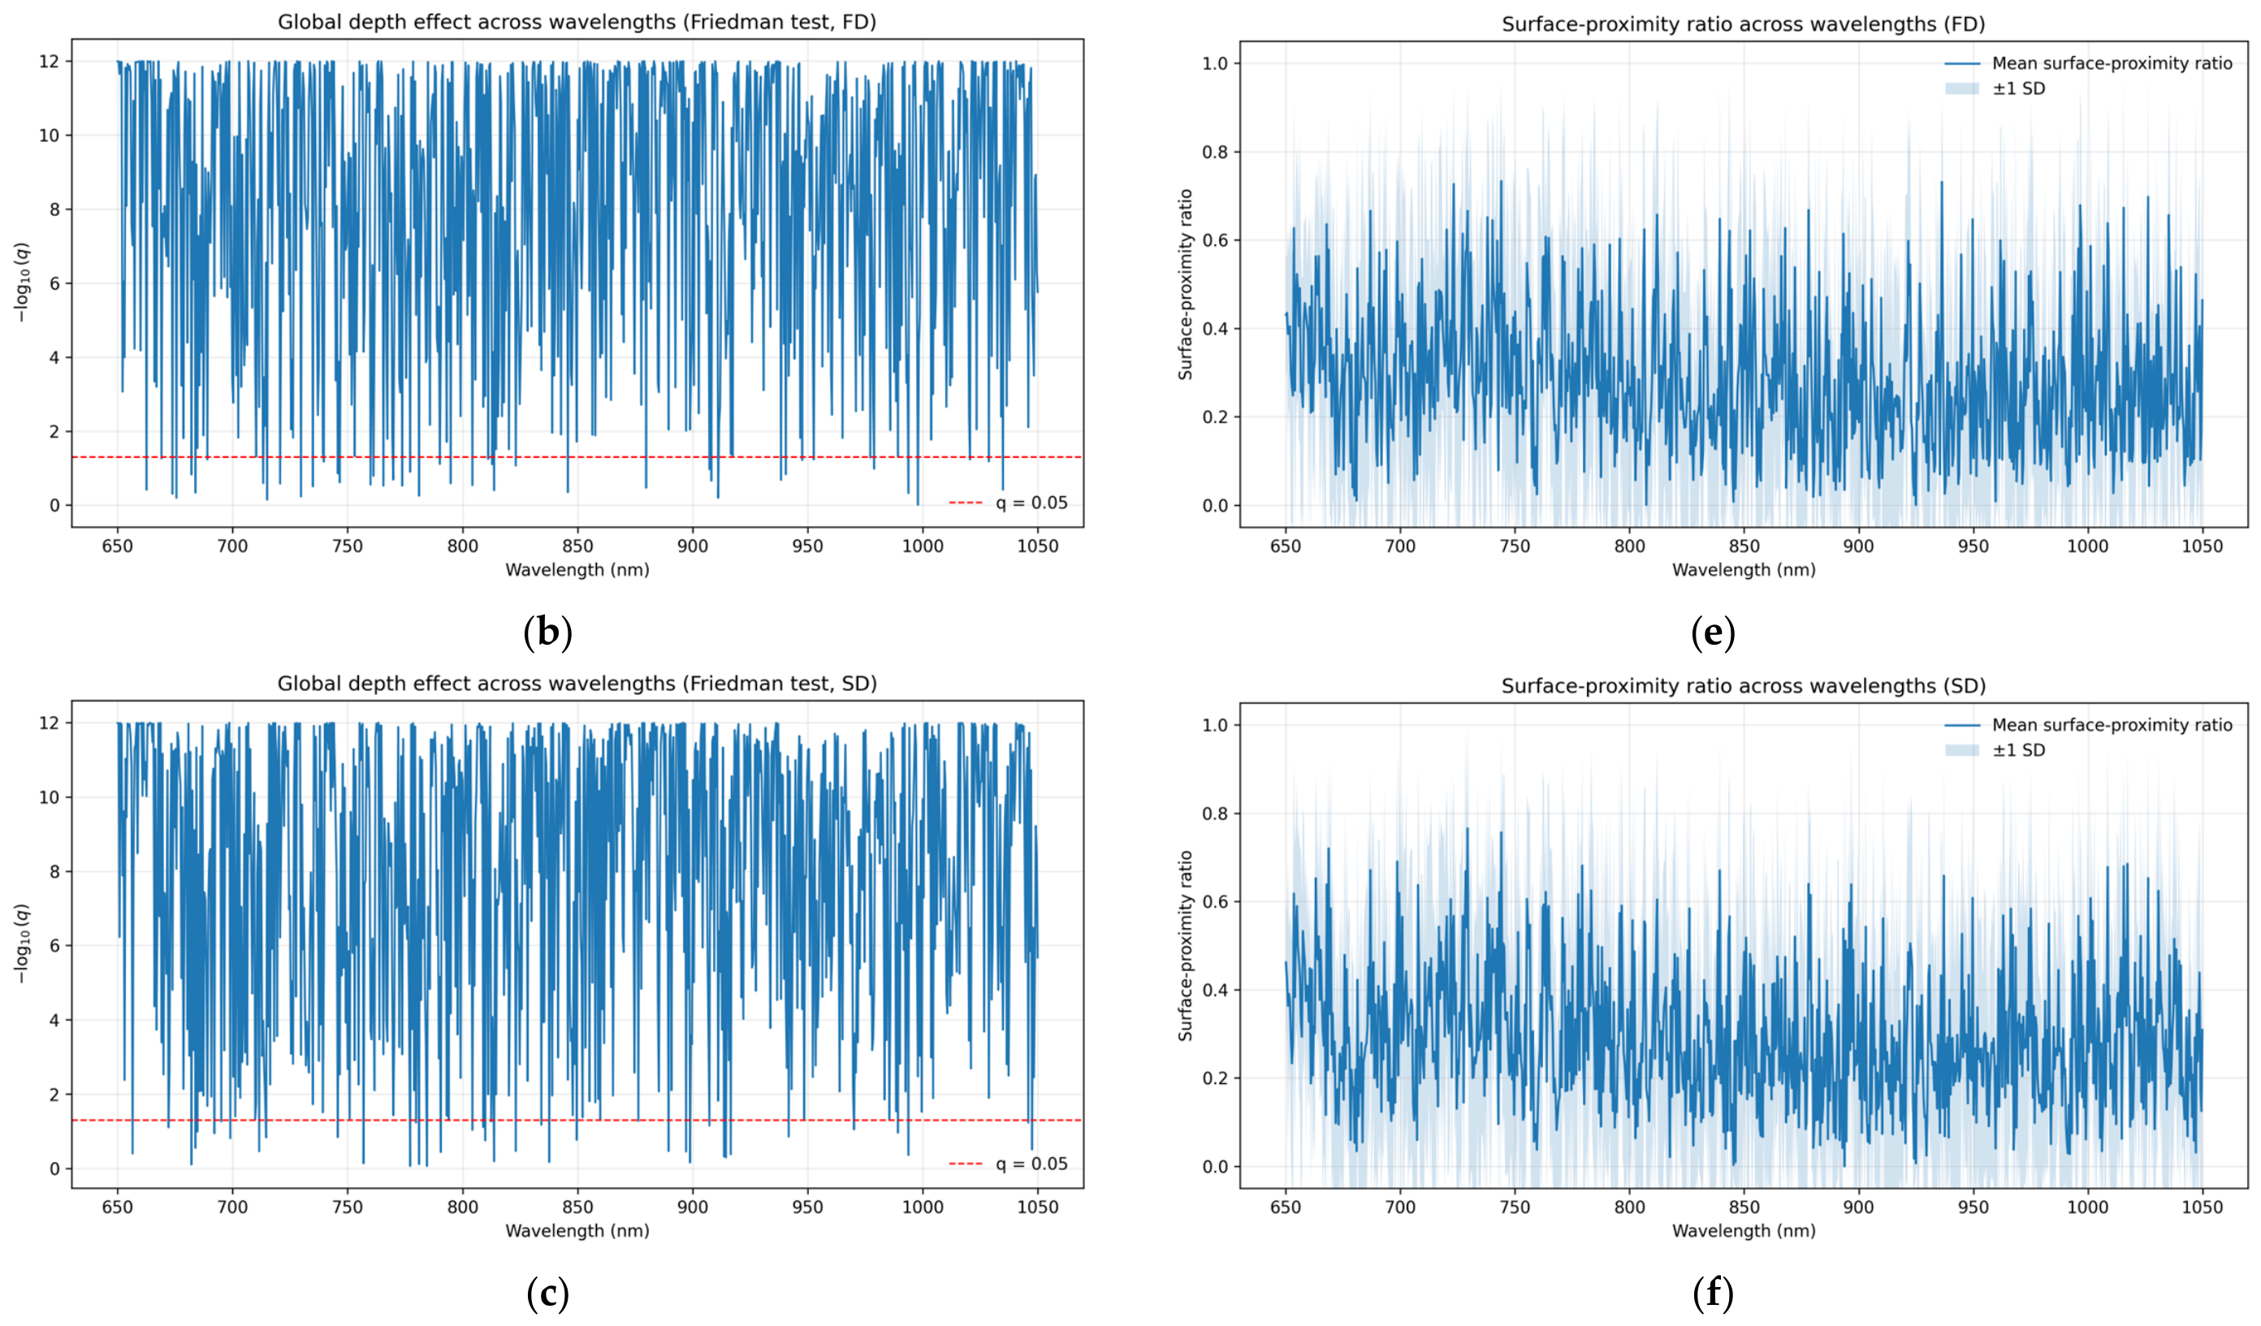
Wavelength-by-wavelength statistical analysis showed broad tissue-state-related spectral differences in diffuse reflectance spectra after FDR correction. Under the RAW condition, all 944 wavelength points were significant for the global tissue-state effect and for the four paired comparisons (Table 3). However, because adjacent wavelengths in NIR spectra are highly correlated, the number of significant wavelengths should be interpreted only as descriptive information rather than as the number of independent spectral effects. Therefore, the significance-count results were interpreted together with effect-size summaries. The RAW comparisons showed median |r| values ranging from 0.753 to 0.873. After FD and SD processing, the number of significant wavelengths decreased, but the median |r| values still indicated clear paired spectral differences, particularly for comparisons involving the half-fruit state. This indicates that derivative processing did not completely remove tissue-state-related spectral differences; instead, it changed the observed differences from overall intensity variations into local spectral-shape variations.
The RAW-based SPR results were used as an auxiliary description of the relative similarity between intact-fruit and first-slice diffuse reflectance spectra. As shown in Table 4, the mean SPR under the RAW condition was 0.162, with a range of 0.092–0.361, and the maximum value occurred at 650.0 nm. These relatively low SPR values indicate that the intact-fruit reflectance spectra were not highly similar to the first-slice spectra over most wavelengths. This result may reflect the influence of peel, surface condition, and shallow-tissue exposure on the collected diffuse reflectance signal.
For FD and SD spectra, SPR curves were used only for qualitative comparison in Figure 3. Because derivative transformation may amplify local spectral fluctuations and generate unstable ratio values when the denominator approaches zero, the mean and range values of derivative-based SPR were not reported or interpreted quantitatively.

3.1.3. Transmittance Spectral Response

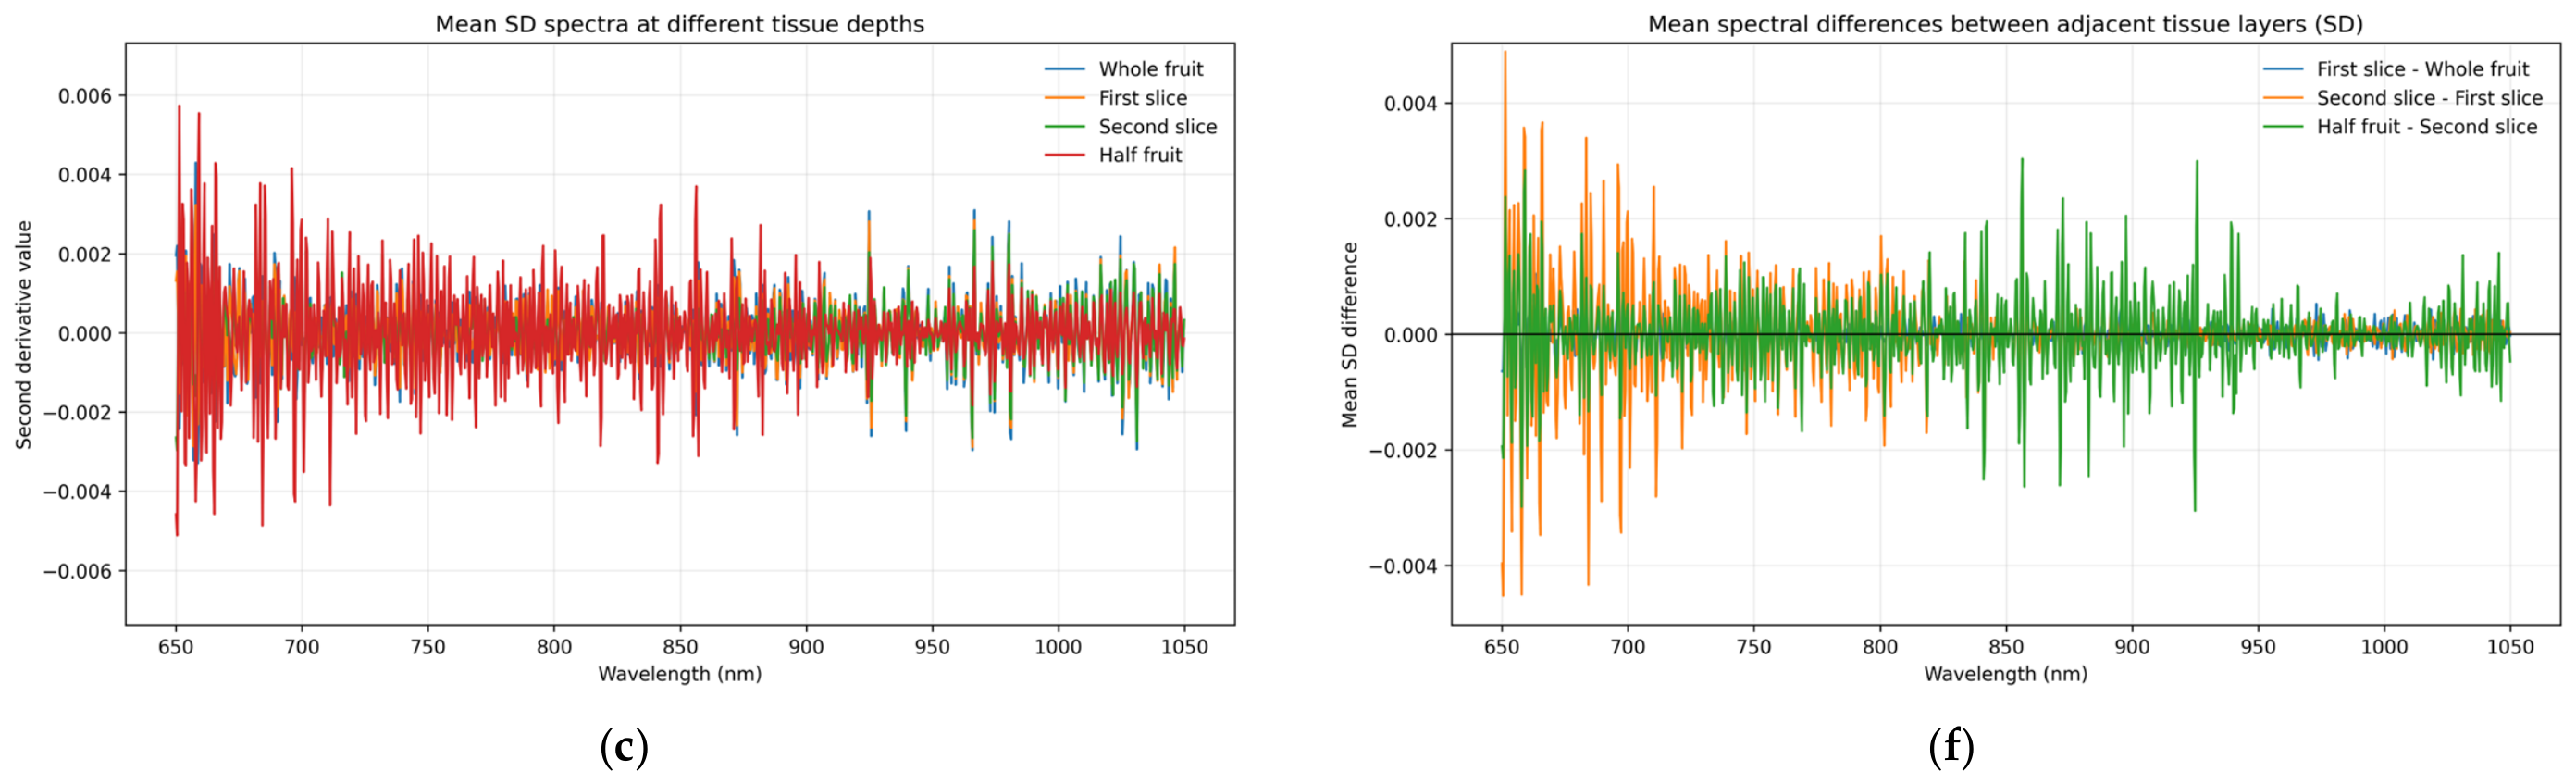
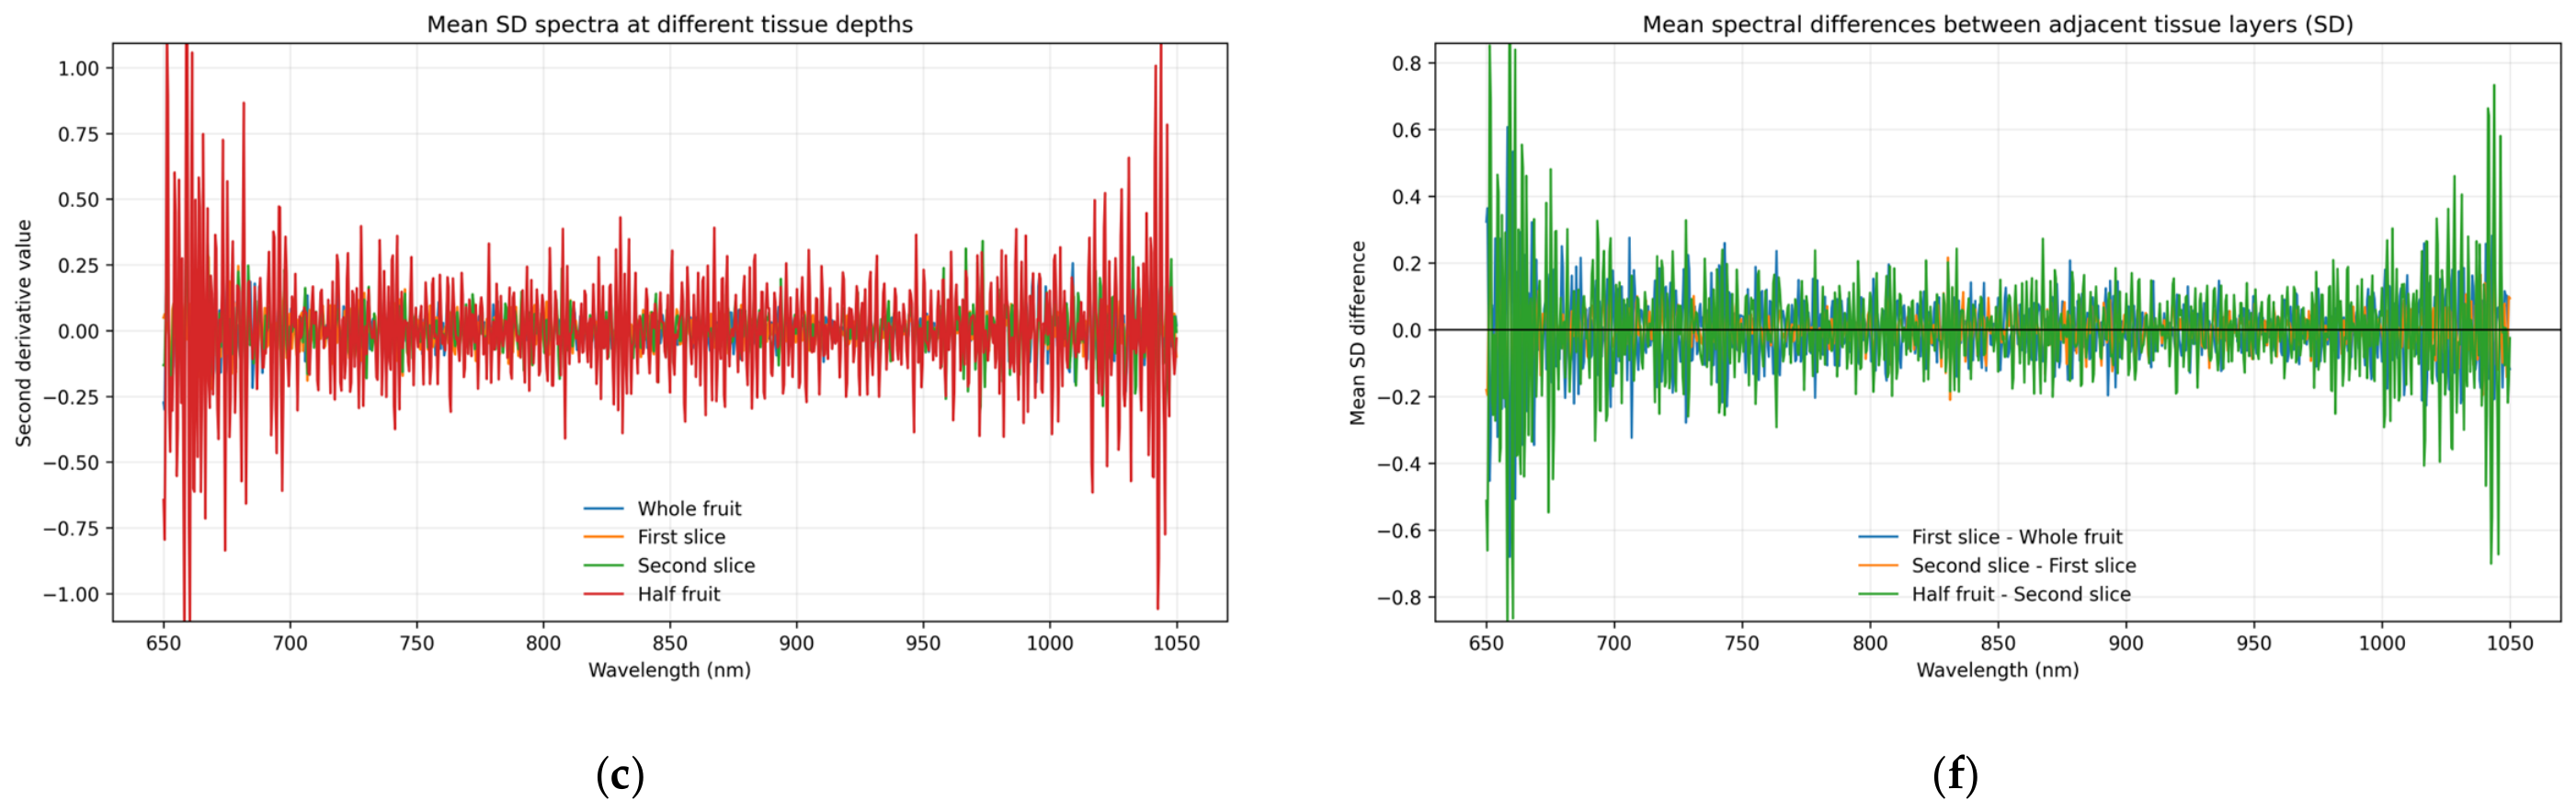
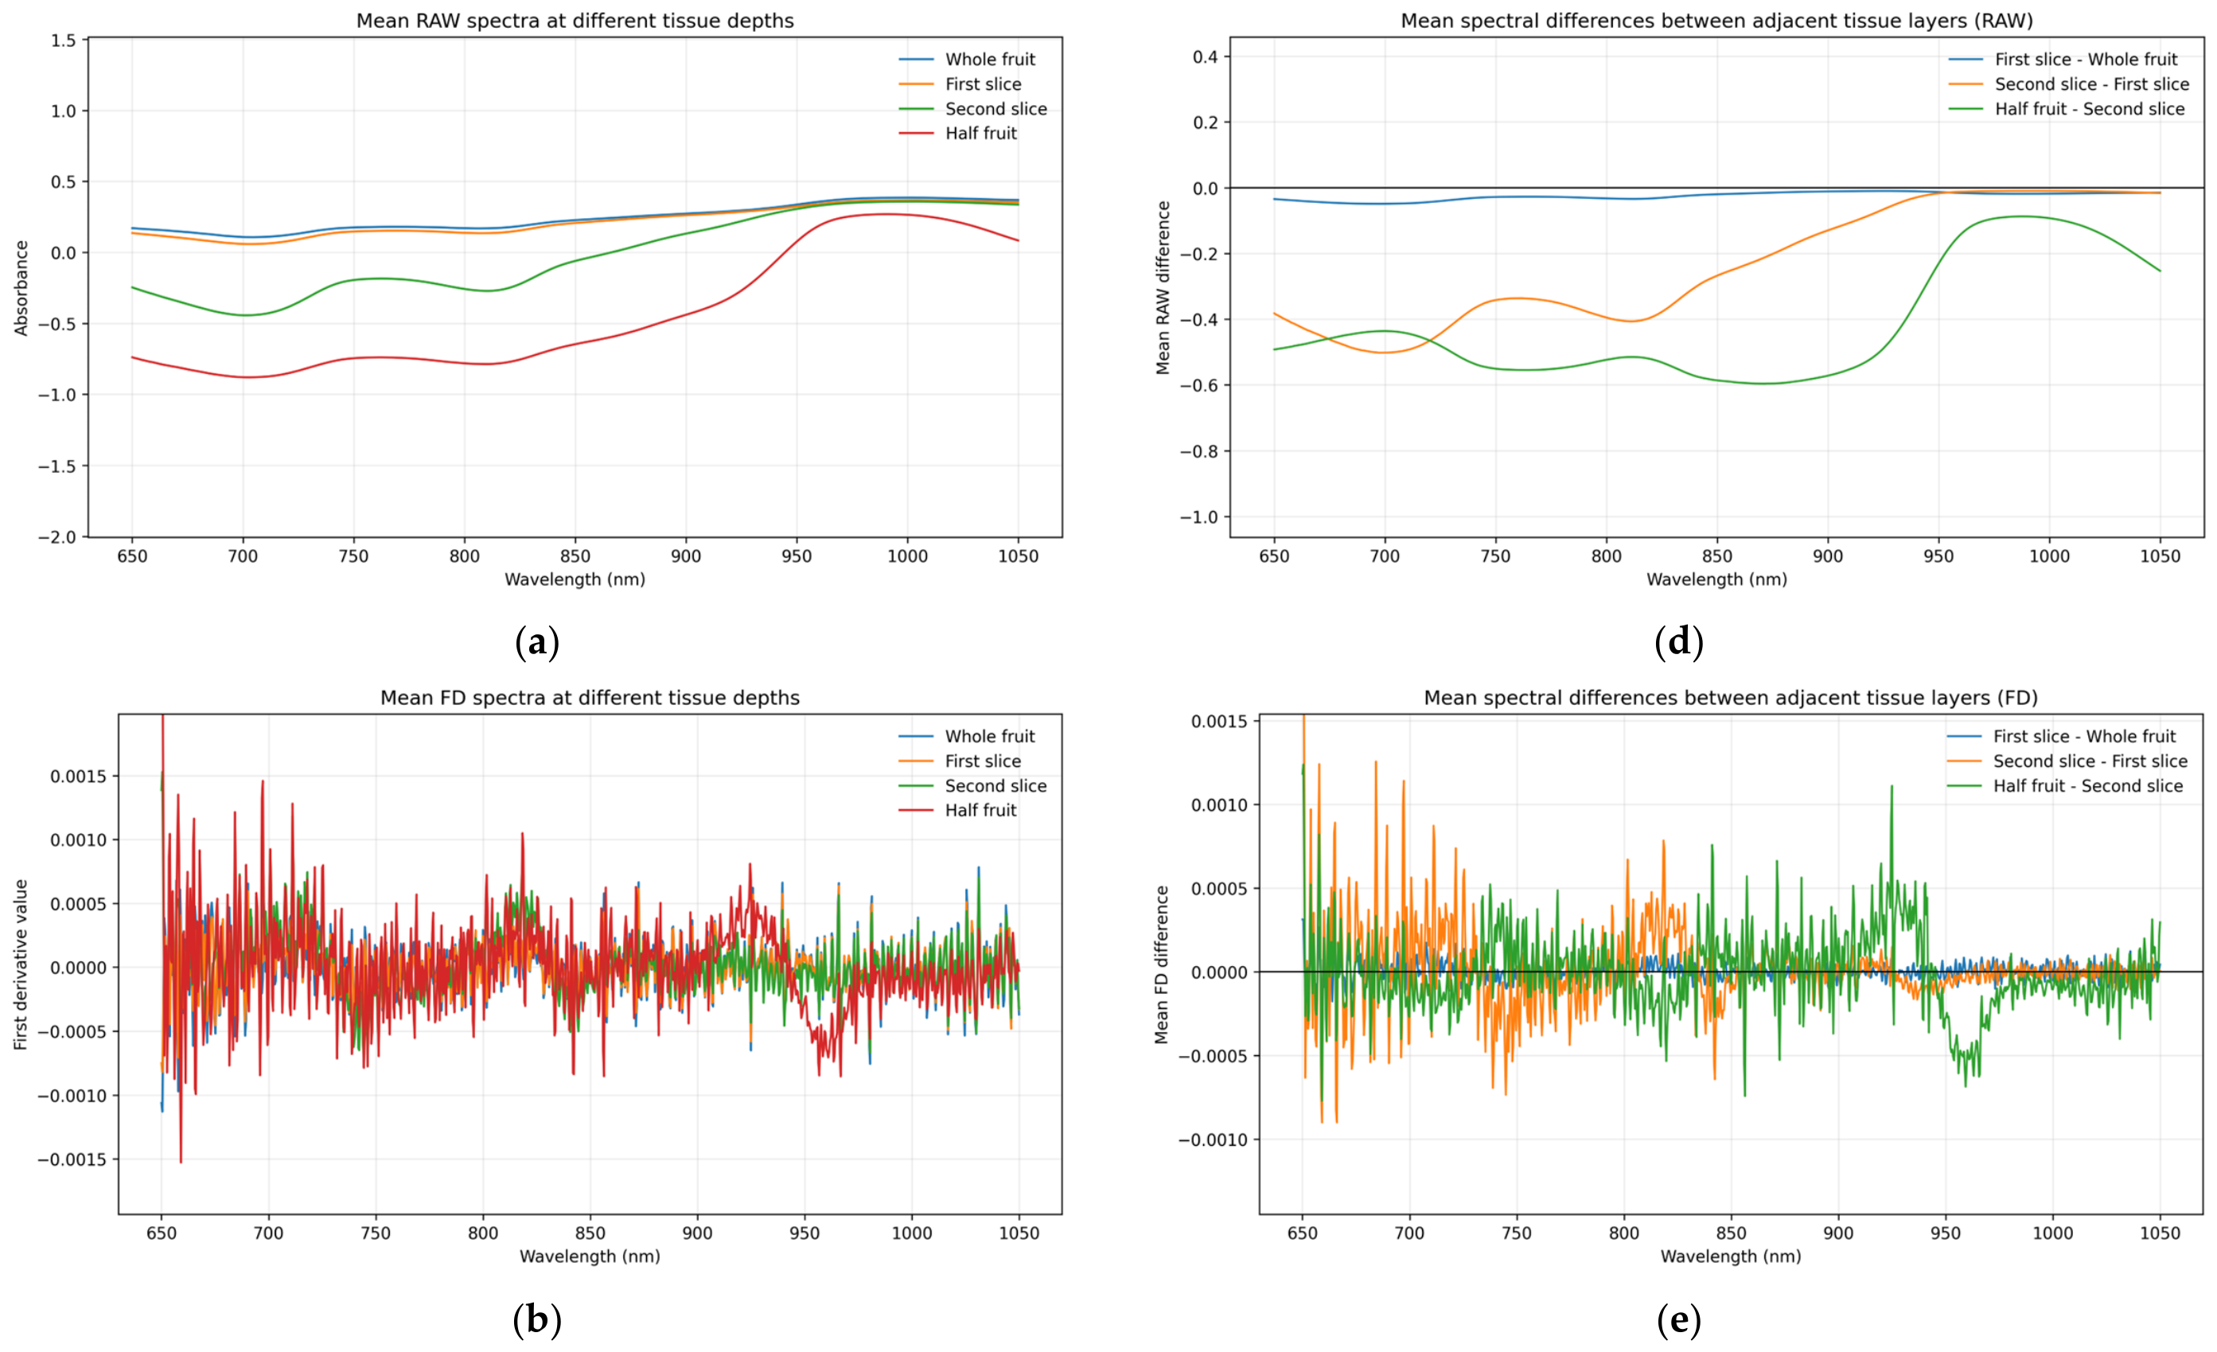
Transmittance RAW spectra were expressed as absorbance. Illustrated in Figure 4, the curves of intact fruit and first-slice fruit were generally similar, whereas the second-slice and half-fruit states showed a clear decrease in the 650–900 nm range, and the differences among states became smaller after approximately 950 nm. This indicates that the first thin slicing had a relatively weak effect on the overall transmittance path, whereas deeper tissue exposure had a more evident influence on absorbance. FD and SD spectra fluctuated around zero, with local peak-valley variations being more obvious in the 650–720 nm region and near 900 nm.
For transmittance spectra, the wavelength-by-wavelength significance results varied more strongly among preprocessing methods (Table 5). Under the RAW condition, broad tissue-state-related spectral differences were observed, with 665–944 significant wavelengths in the paired comparisons and median |r| values ranging from 0.565 to 0.873. However, because adjacent wavelengths are highly correlated, the significance counts were used only as descriptive information. After FD and SD processing, the intact vs. first slice comparison showed weak paired effects, with median |r| values of 0.175 and very few or no significant wavelengths. For comparisons involving deeper tissue states, the median |r| values increased, indicating stronger paired spectral differences. These results were interpreted together with effect-size summaries rather than significance counts alone.
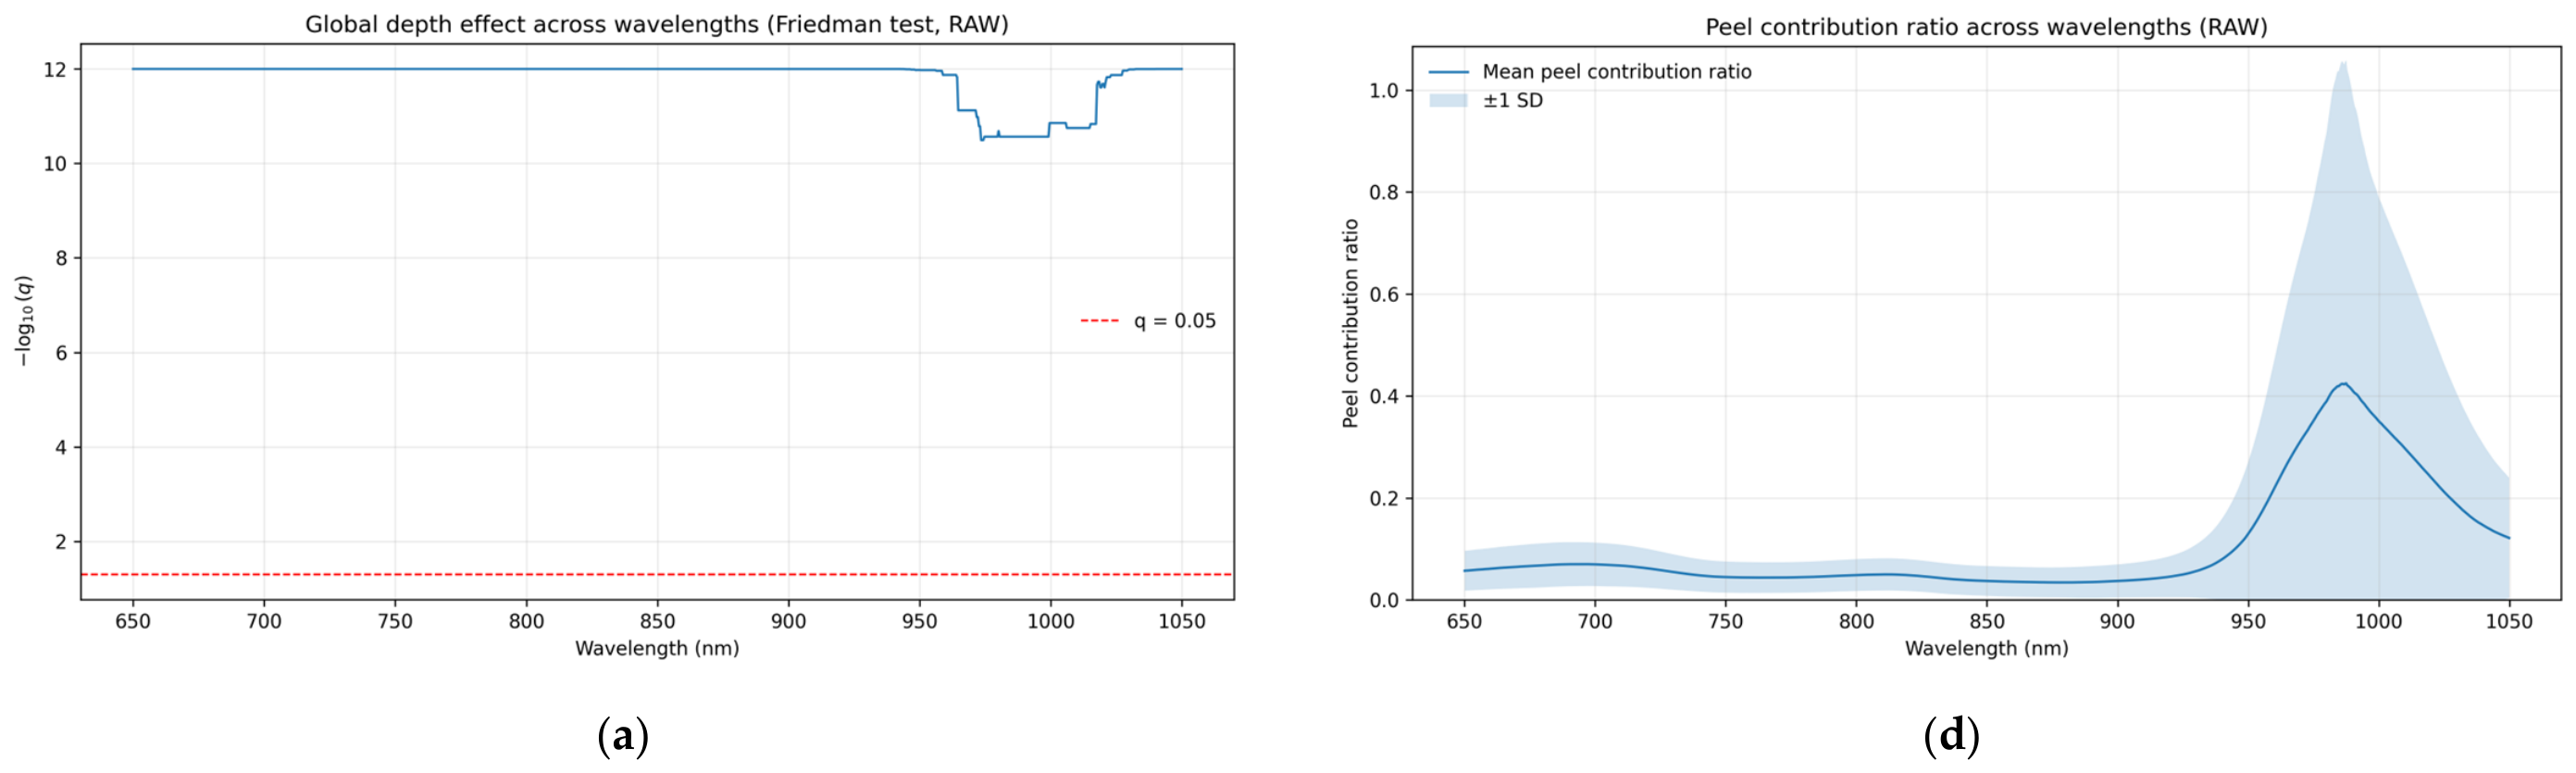
The RAW-based PCR was used as an auxiliary empirical index to describe the relative spectral change associated with peel removal in transmittance spectra. As shown in Table 6, the mean PCR under the RAW condition was 0.107, with the maximum value observed near 987.5 nm. This relatively low value indicates that the spectral change from intact fruit to first-slice fruit accounted for only a limited proportion of the total change from intact fruit to half fruit under the RAW transmittance condition.
For FD and SD spectra, PCR values were not summarized as mean or range values. Because derivative transformation may amplify local spectral fluctuations and generate unstable ratio values when the denominator approaches zero, derivative-based PCR values were not interpreted quantitatively. Therefore, the interpretation of derivative spectra was based mainly on spectral response patterns and wavelength-wise statistical comparisons rather than on PCR magnitude. The wavelength-wise significance patterns and PCR curves for the RAW, FD, and SD transmittance spectra are presented in Figure 5.

3.2. Stability of SSC Prediction Under Different Tissue States

The SSC prediction results were evaluated using 100 repeated stratified random splits to examine model stability under the limited sample size. In each repetition, preprocessing selection, regression algorithm comparison, and hyperparameter optimization were performed only within the calibration set using five-fold cross-validation, and the prediction set was used only for final evaluation.
The repeated validation results were presented in Table 7 and showed weak SSC prediction performance for all tissue states. Although the intact-fruit state showed the numerically highest mean R2p and RPD and the lowest mean RMSEP among the four tissue states, the mean R2p was only 0.262, and the RMSEP was 1.046 °Brix for a sample population with an SSC standard deviation of 1.25 °Brix. The first-slice, second-slice, and half-fruit states showed negative mean R2p values, indicating that their prediction performance was worse than simply using the mean SSC value as the prediction. Therefore, none of the tissue states provided a practically useful SSC prediction model. The apparent advantage of intact-fruit spectra should be interpreted only as a numerical average tendency within the present repeated-resampling procedure, rather than as a robust or generalizable practical difference. These results indicate that increased tissue exposure did not improve SSC model generalization in this limited dataset.
Table 7. Prediction stability of SSC models under different tissue states based on 100 repeated stratified random splits.
StateR2p Mean ± SDRMSEP Mean ± SD (°Brix)RPD Mean ± SD
Intact fruit0.262 ± 0.3901.046 ± 0.2611.373 ± 0.359
First slice−0.271 ± 0.6121.388 ± 0.3171.017 ± 0.213
Second slice−0.128 ± 0.9041.270 ± 0.4041.157 ± 0.327
Half fruit−1.133 ± 4.2361.592 ± 0.9180.957 ± 0.240
Values are presented as mean ± standard deviation based on 100 repeated stratified random splits. Negative R2p values indicate that the prediction error was larger than the error obtained by using the mean SSC value as the prediction, suggesting very limited predictive ability.
Figure 2. Mean spectra and adjacent-layer difference spectra in diffuse reflectance mode: (a) RAW mean spectra; (b) FD mean spectra; (c) SD mean spectra; (d) RAW adjacent-layer difference spectra; (e) FD adjacent-layer difference spectra; (f) SD adjacent-layer difference spectra.
Information 17 00746 g002aInformation 17 00746 g002b
Figure 3. Wavelength-by-wavelength significance and surface-proximity ratio in diffuse reflectance mode: (ac) global tissue-state effects of RAW, FD, and SD spectra; (df) surface-proximity ratios of RAW, FD, and SD spectra. In panels (ac), the blue line shows the −log10 transformed q-value across wavelengths, and the red dashed line indicates the significance threshold of q = 0.05.
Information 17 00746 g003aInformation 17 00746 g003b
Figure 4. Mean spectra and adjacent-layer difference spectra in transmittance mode: (a) RAW mean absorbance; (b) FD mean spectra; (c) SD mean spectra; (d) RAW adjacent-layer difference spectra; (e) FD adjacent-layer difference spectra; (f) SD adjacent-layer difference spectra.
Information 17 00746 g004aInformation 17 00746 g004b
Figure 5. Wavelength-by-wavelength significance and peel-contribution ratio in transmittance mode: (ac) global tissue-state effects of RAW, FD, and SD spectra; (df) peel-contribution ratios of RAW, FD, and SD spectra. In panels (ac), the blue line shows the −log10 transformed q-value across wavelengths, and the red dashed line indicates the significance threshold of q = 0.05.
Information 17 00746 g005aInformation 17 00746 g005b

4. Discussion

The different responses of diffuse reflectance and transmittance spectra should be interpreted according to their distinct measurement geometries and tissue-state conditions. Diffuse reflectance spectra are mainly affected by light scattered from relatively shallow tissue layers and are therefore sensitive to peel removal, surface condition, surface curvature, and shallow-tissue exposure. In contrast, transmittance spectra involve a longer optical path through the fruit and may contain more cumulative information from internal tissues. This optical behavior is well established and is not claimed here as a new principle. In this study, reflectance and transmittance modes were compared as a paired experimental framework to examine how sequential tissue removal influenced spectral response patterns and SSC prediction stability in the same fruit samples.
Recent reviews and citrus-specific studies have emphasized that Vis-NIR/NIR spectroscopy has strong potential for nondestructive fruit-quality assessment, but robust SSC prediction remains affected by sample heterogeneity, acquisition mode, fruit surface properties, sampling position, feature selection, and model transferability [1,2,3,4,5,20,21,22,23,24]. In citrus fruit, these issues are particularly important because the peel, albedo, juice sacs, surface curvature, and internal pulp structure jointly influence light propagation and the final collected spectrum [17,18,24,25,26]. Therefore, the present study should be interpreted within this broader research context. Rather than aiming to establish a transferable SSC prediction model, it examines how sequential tissue exposure changes NIR spectral responses and whether these tissue-state changes actually improve SSC model generalization.
The sliced states were not designed to provide direct physical penetration-depth measurements. Previous penetration-related studies have shown that the ability of NIR diffuse reflectance light to pass through fruit peel depends on peel thickness, peel composition, wavelength region, and measurement conditions [26]. Therefore, the present sliced states should not be interpreted as direct evidence that the peel completely blocks or fully permits NIR penetration. In the present experiment, the detected signals were jointly affected by scattering, absorption, peel structure, surface curvature, tissue exposure, and measurement geometry. Thus, the results should be discussed as tissue-state-dependent spectral responses under the present measurement conditions rather than as absolute measurements of optical penetration depth.
The SPR and PCR indices were used only as auxiliary empirical indicators to describe relative spectral changes among sequential tissue states. They should not be interpreted as physical optical penetration depths in millimeters. The main interpretation was based on spectral response patterns, paired statistical comparisons, effect-size summaries, and modeling stability rather than on SPR or PCR alone. In addition, derivative-based ratio values were not interpreted quantitatively because derivative transformation may amplify local spectral fluctuations and generate unstable ratio values when the denominator approaches zero.
The wavelength-wise statistical results should also be interpreted cautiously. Because adjacent wavelengths in NIR spectra are highly correlated, the number of significant wavelength points after FDR correction was used only as descriptive information and not as the number of independent spectral effects. Therefore, significance counts were interpreted together with effect-size summaries and spectral trends to avoid overinterpreting full-band significance.
A major limitation is that tissue state and sample geometry changed simultaneously during slicing. Although the same fruit samples were measured sequentially and the optical setup was kept unchanged as much as possible, slicing changed the detected surface from a curved intact-fruit surface to a relatively flat cut surface. The half-fruit state also represented a different optical situation because the cut surface was placed parallel to the detector plane. Thus, the observed spectral changes may have resulted from both tissue-related effects, such as peel removal and pulp exposure, and geometry-related effects, such as surface curvature, surface orientation, and light collection efficiency. These effects could not be fully separated in the present experimental design.
The repeated validation results showed that increased tissue exposure did not necessarily improve SSC prediction stability. Based on 100 repeated stratified random splits, all tissue states showed weak SSC prediction performance. The intact-fruit state had the numerically highest mean R2p and the lowest mean RMSEP among the four tissue states, but this result should not be interpreted as evidence of practically useful SSC prediction. The best mean R2p was only 0.262, and the corresponding RMSEP was close to the SSC variation in the sample population. The other tissue states showed negative mean R2p values, which further indicates very limited predictive ability. Therefore, the SSC modeling results provide mainly a cautionary finding: progressive tissue exposure did not improve model generalization in this limited dataset.
The apparent intact-fruit tendency may be related to preservation of the original fruit structure and measurement geometry, or to population-specific secondary correlations between peel-related optical properties and internal fruit quality. However, such correlations are unlikely to be universal and may vary with orchard, harvest time, season, maturity stage, cultivar, peel color, chlorophyll content, and growing conditions. Therefore, the intact-fruit result should be regarded only as a numerical average tendency within the present single-population dataset, not as evidence of a transferable or practically useful SSC prediction model.
The poor prediction performance of sliced and half-fruit states is also informative for interpreting tissue-state effects. Direct pulp exposure might be expected to improve SSC prediction, but slicing may introduce additional variability, including surface roughness, juice-sac disruption, local water redistribution, dehydration at the cut surface, and spatial heterogeneity of SSC. These changes can increase spectral differences among tissue states but may not provide more stable SSC-related information for prediction. Thus, sliced and half-fruit states are more suitable for understanding peel-related interference, tissue-state-dependent spectral responses, and optical-path-related changes than for defining a superior practical state for SSC modeling.
Another limitation is the possible mismatch between the optical sampling volume and the destructively sampled pulp volume used for SSC measurement. Although pulp subsamples were collected near the spectral acquisition region and mixed to obtain a local average SSC value, SSC distribution inside navel orange may not be spatially homogeneous. Moreover, the effective optical sampling volume differs between reflectance and transmittance modes and cannot be defined as a simple physical region.
More importantly, this study was based on only 30 fruit from a single harvest population. Therefore, the present dataset cannot address generalization across orchards, growing conditions, seasons, maturity levels, cultivars, or peel-property variation. These factors may strongly influence skin optical properties, internal SSC distribution, and SSC-related spectral responses. Consequently, the modeling results should be interpreted as exploratory and population-dependent. Future studies should use larger independent datasets covering broader biological and environmental variability, measure peel-related variables such as color and chlorophyll content, and design more strictly matched optical–destructive sampling protocols.
Overall, intact-fruit spectra remain relevant for true nondestructive measurement scenarios, whereas sliced states provide useful reference conditions for interpreting tissue-state-dependent spectral responses and peel-related interference. However, the present results do not demonstrate a usable or transferable SSC prediction model. The practical implication is that stronger tissue exposure or larger spectral differences should not automatically be regarded as evidence of better SSC predictability in thick-peeled citrus. The key finding is that, under the present limited dataset, deeper tissue exposure increased spectral differences but did not improve SSC model generalization.

5. Conclusions

This study investigated the spectral responses and SSC prediction stability of navel orange under four sequential tissue states, including intact fruit, first-slice fruit, second-slice fruit, and half fruit, using diffuse reflectance and transmittance spectra in the 650–1050 nm range. The results showed that progressive slicing clearly changed the NIR spectral characteristics, indicating that peel removal, shallow-tissue exposure, surface condition, and measurement geometry jointly affected the collected spectral information.
The spectral response analysis indicated that diffuse reflectance and transmittance spectra responded differently to tissue-state changes. Diffuse reflectance spectra were more sensitive to surface-related changes, while transmittance spectra reflected changes associated with the cumulative optical path through different tissue states. However, these spectral differences should not be interpreted as direct physical measurements of penetration depth. The SPR and PCR indices were used only as auxiliary empirical indicators to describe relative tissue-state-dependent spectral responses.
For SSC prediction, none of the evaluated tissue states provided practically useful performance. The best mean R2p was only 0.262 for intact fruit, with an RMSEP of 1.046 °Brix, while the first-slice, second-slice, and half-fruit states showed negative mean R2p values. Therefore, the modeling results should not be interpreted as evidence of a usable SSC prediction model. The only conclusion supported by the repeated-validation results is that progressive tissue exposure did not improve SSC model generalization in this limited dataset. The numerically better intact-fruit result represents an average tendency only, not a robust practical difference.
Overall, this study should be interpreted primarily as an exploratory spectral-response analysis under a limited single-population design. The results show that slicing clearly changed the NIR spectral characteristics of navel orange, but these spectral changes did not translate into improved SSC prediction. Thus, the main value of this work lies in clarifying tissue-state-dependent spectral responses and providing a cautionary reference for SSC prediction in thick-peeled citrus, rather than establishing an accurate or transferable SSC prediction model.
Because only 30 fruit from one harvest population were used, the results cannot be generalized across orchards, growing conditions, seasons, maturity levels, cultivars, or peel-property variation. Future studies should combine larger independent sample populations with multi-orchard, multi-season, multi-cultivar, and multi-maturity-stage validation, and should explicitly measure peel-related variables such as peel thickness, peel color, chlorophyll content, and surface geometry. Larger independent datasets covering broader biological and environmental variability are required before any conclusion about transferable SSC prediction in thick-peeled citrus can be made.


Supplementary Materials

The following supporting information can be downloaded at: https://www.mdpi.com/article/10.3390/info17080746/s1, Table S1. Detailed records of the 100 repeated stratified random splits for SSC prediction under different tissue states. Table S2: Selection frequency of preprocessing methods and regression algorithms across 100 repeated stratified random splits for four tissue states.

Author Contributions

Conceptualization, Z.C.; methodology, J.L. and Z.C.; software, Z.C., P.L. and J.X.; validation, Z.C.; formal analysis, Z.C.; investigation, Z.C., P.L., J.X., S.L. and J.S.; resources, J.L.; data curation, Z.C., P.L., J.X., S.L. and J.S.; writing—original draft preparation, Z.C.; writing—review and editing, J.L. and Z.C.; visualization, Z.C.; supervision, J.L. and P.L.; project administration, J.L. and P.L.; funding acquisition, J.L. and P.L. All authors have read and agreed to the published version of the manuscript.

Funding

This work was funded by the National Citrus Industry Technology System (Grant No. CARS-26), the National Foreign Expert Individual Program (Grant No. H20250249), the Huazhong Agricultural University Student Development Project.

Institutional Review Board Statement

Not applicable.

Informed Consent Statement

Not applicable.

Data Availability Statement

The original contributions presented in the study are included in the article; further inquiries can be directed to the corresponding author.

Conflicts of Interest

The authors declare no conflicts of interest.

References

  1. Magwaza, L.S.; Opara, U.L.; Nieuwoudt, H.; Cronje, P.J.R.; Saeys, W.; Nicolaï, B.M. NIR spectroscopy applications for internal and external quality analysis of citrus fruit—A review. Food Bioprocess Technol. 2012, 5, 425–444. [Google Scholar] [CrossRef] [Scilit]
  2. Cortés, V.; Blasco, J.; Aleixos, N.; Cubero, S.; Talens, P. Monitoring strategies for quality control of agricultural products using visible and near-infrared spectroscopy: A review. Trends Food Sci. Technol. 2019, 85, 138–148. [Google Scholar] [CrossRef] [Scilit]
  3. Aline, U.; Bhattacharya, T.; Faqeerzada, M.A.; Kim, M.S.; Baek, I.; Cho, B.-K. Advancement of non-destructive spectral measurements for the quality of major tropical fruits and vegetables: A review. Front. Plant Sci. 2023, 14, 1240361. [Google Scholar] [CrossRef] [Scilit] [PubMed]
  4. Gong, Z.; Zhi, Z.; Zhang, C.; Cao, D. Non-destructive detection of soluble solids content in fruits: A review. Chemistry 2025, 7, 115. [Google Scholar] [CrossRef] [Scilit]
  5. Yu, K.; Zhong, M.; Zhu, W.; Rashid, A.; Han, R.; Virk, M.S.; Duan, K.; Zhao, Y.; Ren, X. Advances in computer vision and spectroscopy techniques for non-destructive quality assessment of citrus fruits: A comprehensive review. Foods 2025, 14, 386. [Google Scholar] [CrossRef] [Scilit] [PubMed]
  6. Barnes, R.J.; Dhanoa, M.S.; Lister, S.J. Standard normal variate transformation and de-trending of near-infrared diffuse reflectance spectra. Appl. Spectrosc. 1989, 43, 772–777. [Google Scholar] [CrossRef] [Scilit]
  7. Delwiche, S.R.; Reeves, J.B., III. The effect of spectral pre-treatments on the partial least squares modelling of agricultural products. J. Near Infrared Spectrosc. 2004, 12, 177–182. [Google Scholar] [CrossRef] [Scilit]
  8. Fernández-Cabanás, V.M.; Garrido-Varo, A.; Pérez-Marín, D.; Dardenne, P. Evaluation of pretreatment strategies for near-infrared spectroscopy calibration development of unground and ground compound feedingstuffs. Appl. Spectrosc. 2006, 60, 17–23. [Google Scholar] [CrossRef] [Scilit] [PubMed]
  9. Kawano, S.; Fujiwara, T.; Iwamoto, M. Nondestructive determination of sugar content in Satsuma mandarin using near-infrared (NIR) transmittance. J. Jpn. Soc. Hortic. Sci. 1993, 62, 465–470. [Google Scholar] [CrossRef] [Scilit]
  10. Miyamoto, K.; Kitano, Y. Non-destructive determination of sugar content in Satsuma mandarin fruit by near-infrared transmittance spectroscopy. J. Near Infrared Spectrosc. 1995, 3, 227–237. [Google Scholar] [CrossRef] [Scilit]
  11. McGlone, V.A.; Fraser, D.G.; Jordan, R.B.; Künnemeyer, R. Internal quality assessment of mandarin fruit by Vis/NIR spectroscopy. J. Near Infrared Spectrosc. 2003, 11, 323–332. [Google Scholar] [CrossRef] [Scilit]
  12. Greensill, C.V.; Walsh, K.B. Calibration transfer between miniature photodiode array-based spectrometers in the near-infrared assessment of mandarin soluble solids content. J. Near Infrared Spectrosc. 2002, 10, 27–35. [Google Scholar] [CrossRef] [Scilit]
  13. Guthrie, J.A.; Reid, D.J.; Walsh, K.B. Assessment of internal quality attributes of mandarin fruit. 2. NIR calibration model robustness. Aust. J. Agric. Res. 2005, 56, 417–426. [Google Scholar] [CrossRef] [Scilit]
  14. Cayuela, J.A.; Weiland, C. Intact orange quality prediction with two portable NIR spectrometers. Postharvest Biol. Technol. 2010, 58, 113–120. [Google Scholar] [CrossRef] [Scilit]
  15. Liu, Y.; Sun, X.; Zhang, H.; Ouyang, A. Nondestructive measurement of internal quality of Nanfeng mandarin fruit by charge coupled device near-infrared spectroscopy. Comput. Electron. Agric. 2010, 71, S10–S14. [Google Scholar] [CrossRef] [Scilit]
  16. Sun, X.; Zhang, H.; Liu, Y. Nondestructive assessment of quality of Nanfeng mandarin fruit by a portable near-infrared spectroscopy. Int. J. Agric. Biol. Eng. 2009, 2, 65–71. [Google Scholar] [CrossRef]
  17. Jamshidi, B.; Minaei, S.; Mohajerani, E.; Ghassemian, H. Prediction of soluble solids in oranges using visible/near-infrared spectroscopy: Effect of peel. Int. J. Food Prop. 2014, 17, 1460–1468. [Google Scholar] [CrossRef] [Scilit]
  18. Wang, A.; Xie, L. Technology using near-infrared spectroscopic and multivariate analysis to determine the soluble solids content of citrus fruit. J. Food Eng. 2014, 143, 17–24. [Google Scholar] [CrossRef] [Scilit]
  19. Ncama, K.; Opara, U.L.; Tesfay, S.Z.; Fawole, O.A.; Magwaza, L.S. Application of Vis/NIR spectroscopy for predicting sweetness and flavour parameters of ‘Valencia’ orange (Citrus sinensis) and ‘Star Ruby’ grapefruit (Citrus x paradisi Macfad). J. Food Eng. 2017, 193, 86–94. [Google Scholar] [CrossRef] [Scilit]
  20. Li, P.; Li, S.; Du, G.; Jiang, L.; Liu, X.; Ding, S.; Shan, Y. A simple and nondestructive approach for the analysis of soluble solid content in citrus by using portable visible to near-infrared spectroscopy. Food Sci. Nutr. 2020, 8, 2543–2552. [Google Scholar] [CrossRef] [Scilit] [PubMed]
  21. Tian, X.; Li, J.; Yi, S.; Jin, G.; Qiu, X.; Li, Y. Nondestructive determining the soluble solids content of citrus using near-infrared transmittance technology combined with the variable selection algorithm. Artif. Intell. Agric. 2020, 4, 48–57. [Google Scholar] [CrossRef] [Scilit]
  22. Li, Y.; Jin, G.; Jiang, X.; Yi, S.; Tian, X. Non-destructive determination of soluble solids content using a multi-region combination model in hybrid citrus. Infrared Phys. Technol. 2020, 104, 103138. [Google Scholar] [CrossRef] [Scilit]
  23. Huang, C.; Cai, J.; Zhou, Y.; El-Seedi, H.R.; Guo, Z. Fusion models for detection of soluble solids content in mandarin by Vis/NIR transmission spectroscopy combined external factors. Infrared Phys. Technol. 2022, 124, 104233. [Google Scholar] [CrossRef] [Scilit]
  24. Zhang, X.; Li, S.; Shan, Y.; Li, P.; Jiang, L.; Liu, X.; Fan, W. Accurate nondestructive prediction of soluble solids content in citrus by near-infrared diffuse reflectance spectroscopy with characteristic variable selection. J. Food Process. Preserv. 2022, 46, e16480. [Google Scholar] [CrossRef] [Scilit]
  25. Wang, G.; Liu, Y.; Li, X.; Zhang, Y.; Wang, J.; Jiang, X. Differences in optical properties of fruit tissues between stone fruits and citrus fruits. Infrared Phys. Technol. 2021, 112, 103599. [Google Scholar] [CrossRef] [Scilit]
  26. Dong, Y.; Du, G.; Jiang, L.; Shan, Y.; Li, P. A new method for evaluating the penetration ability of near-infrared diffuse reflectance light to fruit peel with chemometrics. Vib. Spectrosc. 2023, 129, 103599. [Google Scholar] [CrossRef] [Scilit]
  27. Theanjumpol, P.; Wongzeewasakun, K.; Muenmanee, N.; Wongsaipun, S.; Krongchai, C.; Changrue, V.; Boonyakiat, D.; Kittiwachana, S. Non-destructive identification and estimation of granulation in ‘Sai Num Pung’ tangerine fruit using near-infrared spectroscopy and chemometrics. Postharvest Biol. Technol. 2019, 153, 13–20. [Google Scholar] [CrossRef] [Scilit]
  28. NY/T 2637-2014; Determination of Soluble Solids Content in Fruits and Vegetables by Refractometry. Ministry of Agriculture and Rural Affairs of the People’s Republic of China: Beijing, China, 2014.
Figure 1. (a) Schematic diagram of spectral detection, (b) Slicing steps, (c) Experimental photos, (d) Modeling diagram.
Information 17 00746 g001
Table 1. Parameter settings of the NIR spectral acquisition system.
Instrument ModelSpectral Range (nm)Number of Wavelength
Variables
Spectral
Resolution (nm)
Sampling Rate (ms/scan)
AvaSpec-HS2048XL-EVO-ZHD1650–1050944182.44
Table 2. Statistical characteristics of navel orange samples and slicing thicknesses.
ParameterUnitMinimumMaximumMeanSD
Massg192.70260.30211.8314.11
Heightmm70.2086.5072.873.18
Widthmm73.7081.1077.802.40
First slicing/d1mm1.472.602.190.25
Second slicing/d2mm2.105.713.450.99
Cumulative removed
Thickness/d3
mm4.127.395.640.96
Equatorial cut-plane distance/d4mm36.8540.5538.901.20
SSC°Brix9.3713.8711.261.25
SD indicates standard deviation. The cumulative removed thickness is the sum of the first and second slicing (d3 = d1 + d2). The maximum fruit height of 86.50 mm was obtained from one elongated fruit and was measured along the stem–calyx axis; therefore, it was retained as a real sample measurement.
Table 3. Significant wavelength statistics for different tissue-state comparisons in diffuse reflectance spectra.
Spectral TypeComparisonSignificant Wavelengths, n (%)Median |r|
RAWIntact vs. first slice944 (100.00%)0.753
First vs. second slice944 (100.00%)0.768
Second slice vs. half fruit944 (100.00%)0.873
Intact vs. half fruit944 (100.00%)0.873
FDIntact vs. first slice630 (66.74%)0.565
First vs. second slice518 (54.87%)0.441
Second slice vs. half fruit761 (80.61%)0.768
Intact vs. half fruit799 (84.64%)0.824
SDIntact vs. first slice632 (66.95%)0.563
First vs. second slice515 (54.56%)0.437
Second slice vs. half fruit747 (79.13%)0.755
Intact vs. half fruit783 (82.94%)0.802
Values indicate the number and percentage of wavelength points showing significant differences after FDR correction (q < 0.05). Because adjacent wavelengths in NIR spectra are highly correlated, the significance count is provided only as descriptive information and should not be interpreted as the number of independent spectral effects. Median |r| represents the wavelength-level Wilcoxon effect-size summary for each paired comparison.
Table 4. RAW-based surface proximity ratio (SPR) for diffuse reflectance spectra.
IndexSpectral TypeMeanRangeWavelength at Maximum (nm)
Surface-proximity
ratio
RAW0.1620.092–0.361650.0
A higher SPR indicates that the intact-fruit spectrum is relatively closer to the shallow first-slice spectrum under the same spectral mode. In this study, SPR was used only as an auxiliary empirical index to support the interpretation of shallow-tissue response characteristics in diffuse reflectance spectra. It should not be interpreted as a direct measurement of physical optical penetration depth.
Table 5. Significant wavelength statistics for different tissue-state comparisons in transmittance spectra.
Spectral TypeComparisonSignificant Wavelengths, n (%)Median |r|
RAWIntact vs. first slice665 (70.44%)0.565
First vs. second slice910 (96.40%)0.873
Second slice vs. half fruit944 (100.00%)0.873
Intact vs. half fruit944 (100.00%)0.873
FDIntact vs. first slice0(0.00%)0.175
First vs. second slice506 (53.60%)0.447
Second slice vs. half fruit748 (79.24%)0.719
Intact vs. half fruit765 (81.04%)0.794
SDIntact vs. first slice3 (0.32%)0.175
First vs. second slice397 (42.06%)0.321
Second slice vs. half fruit600 (63.56%)0.560
Intact vs. half fruit679 (71.93%)0.730
Values indicate the number and percentage of wavelength points showing significant differences after FDR correction (q < 0.05). Because adjacent wavelengths are highly correlated, the significance count is provided only as descriptive information. Median |r| represents the wavelength-level Wilcoxon effect-size summary for each paired comparison. In the transmittance mode, the intact fruit vs. first-slice comparison reflects spectral changes associated with peel removal and shallow-tissue exposure.
Table 6. RAW-based peel contribution ratio (PCR) for transmittance spectra.
IndexSpectral TypeMeanRangeWavelength at Maximum (nm)
Peel-contribution ratioRAW0.1070.034–0.425987.5
PCR was used only as an auxiliary empirical index to support the interpretation of relative tissue-state-dependent spectral changes in transmittance spectra. It should not be interpreted as a direct measurement of physical peel contribution or optical penetration depth. Quantitative interpretation of PCR was limited to RAW spectra, while derivative spectra were evaluated mainly through spectral trends and statistical comparisons.
Disclaimer/Publisher’s Note: The statements, opinions and data contained in all publications are solely those of the individual author(s) and contributor(s) and not of MDPI and/or the editor(s). MDPI and/or the editor(s) disclaim responsibility for any injury to people or property resulting from any ideas, methods, instructions or products referred to in the content.