Article

SRE-IDF: A Square Root Exponential Inverse Document Frequency Weighting Scheme for Automated Short Answer Grading

1
School of Computer Science and Engineering, Vellore Institute of Technology, Vellore 632014, India
2
Centre for Artificial Intelligence Research, Vellore Institute of Technology, Vellore 632014, India
*
Author to whom correspondence should be addressed.
Information 2026, 17(8), 733; https://doi.org/10.3390/info17080733
Submission received: 28 June 2026 / Revised: 27 July 2026 / Accepted: 28 July 2026 / Published: 29 July 2026

Abstract

Grading short answers on a large scale is a significant challenge for academic institutions and online learning platforms. This study proposes a Square Root Exponential Inverse Document Frequency (SRE-IDF) weighting scheme to address this challenge. The proposed SRE-IDF scheme reshapes the decay curve of the traditional IDF. It suppresses common filler terms while preserving the discriminative importance of concept-bearing vocabulary for Automated Short Answer Grading (ASAG). The SRE-IDF is a parameter-free weighting scheme. It produces bounded term weights in the interval between e−1 and one. The proposed SRE-IDF was evaluated using three benchmark datasets: SciEntsBank, Mohler, and ASAG2024. The experimental results show that SRE-IDF consistently outperformed Traditional IDF, Smoothed IDF, and Best Matching 25 (BM25) across all three datasets. A comparison with a frozen Sentence Bidirectional Encoder Representations from Transformers (SBERT) baseline shows that SRE-IDF achieves competitive predictive performance while requiring substantially lower computational cost and offering greater interpretability. The analysis of statistical significance also reaffirmed the significance of the performance gains attained by the SRE-IDF. These findings support the claim that SRE-IDF is a robust and effective term-weighting strategy for similarity-based Automated Short Answer Grading (ASAG) in settings with heterogeneous and fine-grained evaluations.

1. Introduction

Assessing short descriptive answers on a large scale is a fundamental challenge faced by instructors in educational institutions and online learning platforms [1]. The large volume of student submissions can limit the quality of the feedback that instructors can provide to students. For example, manual grading is difficult but manageable when a class of 200 students submits their written answers. The problem becomes more difficult when the same question receives thousands of responses through online learning platforms. The limitations of manual grading highlight the need for automated techniques. Automated Short Answer Grading (ASAG) is a technique that evaluates student responses against reference answers and assigns scores without manual intervention.
Lexical similarity is a widely used ASAG technique [2]. Lexical similarity techniques perform ASAG using Term Frequency-Inverse Document Frequency (TF-IDF) combined with cosine similarity. The motivation behind the lexical similarity technique is that appropriate answers written by students generally overlap with the model answer. A key advantage of this technique is that it does not require labeled training data. Only a model answer for each question is required. The results of lexical similarity techniques are generally transparent and interpretable for educators. These techniques are computationally less expensive than modern artificial intelligence-based techniques and are highly useful in resource-constrained environments. Several alternative approaches have been introduced in various studies, including word embedding, graph-based alignment, and transformer-based models such as BERT and Sentence-BERT [3]. They yield stronger performance in various Natural Language Processing (NLP) tasks. However, they require more computational resources and significant amounts of labeled training data. This makes them less suitable for low-resource deployments. In addition, it offers reduced interpretability of the results.
Inverse Document Frequency (IDF) measures the rarity of words across a collection of documents [4]. The IDF is widely used in search engines to find relevant documents from a massive and diverse collection. The goal of the grading system is to measure students’ conceptual understanding from a narrow, topic-specific perspective. Some studies have used IDF techniques for weighing ASAG tasks [5]. However, web search and ASAG are fundamentally different tasks with distinct objectives. Therefore, the same weighting strategy should not be applied to both the datasets. This mismatch is evident when looking at the distribution of terms across student answers. Domain-specific terms that show a real understanding tend to be found less often in student answers and are often found in areas of lower document frequency. In contrast, boilerplate filler phrases are less informative and should therefore receive lower importance scores. However, these filler phrases in short-answer corpora may also appear at low document frequencies because of topic fragmentation and the short length of student responses. Consequently, the document frequency distributions of domain-specific terms and filler phrases partially overlapped. Hence, using a fixed document frequency threshold cannot effectively distinguish between them, motivating the need for an adaptive weighting mechanism. The logarithmic IDF curve cannot effectively separate these cases because it becomes relatively flat at higher document frequencies. Therefore, moderately frequent terms continue to receive noticeable weights, which can inflate the similarity scores. The logarithmic IDF also assigns unbounded weights to the rare terms. This allows a single technical word to dominate the entire similarity score. The Best Matching 25 (BM25) introduced tunable parameters (k1, b) whose suitability for grading corpora remains unestablished [6]. However, proper tuning requires labeled data, and technical resources are limited in most educational deployments [7,8]. However, the BM25 IDF formulation exhibits a comparatively flatter decay, maintaining higher weights for moderately and highly frequent terms than other methods. Thus, common and less discriminative terms receive insufficient suppressions. This potentially allows boilerplate expressions to inflate the similarity scores. No parameter-free term weighting function exists that simultaneously bounds the influence of rare terms, meaningfully rewards mid-frequency explanatory vocabulary, and suppresses common filler terms without requiring corpus-specific model tuning. However, no parameter-free term weighting function exists that addresses all of these requirements. It should bound the influence of rare terms, reward mid-frequency explanatory vocabulary, and suppress common filler terms without requiring corpus-specific model fine-tuning.
This study proposed a novel term weighting function named the Square-Root Exponential IDF (SRE-IDF). The proposed SRE-IDF function addresses each of these limitations by using a fundamentally different decay profile. The SRE-IDF consistently assigned lower weights than all three baselines in the intermediate- and high-document-frequency regions. Consequently, common and less discriminative terms receive substantially greater suppression under the proposed method, reducing their ability to inflate the similarity scores. The proposed SRE-IDF preserves sufficiently large weights for informative and domain-specific terms in the low-document frequency region. This ensures that semantically important concepts continue to contribute meaningfully to the final similarity score. It is strictly bounded between the ranges of e−1 and 1. No term can receive a weight below 0.368 or above 1.0. This upper bound directly eliminates the rare-term dominance problem of the traditional logarithmic IDF. In the traditional formulation, a single uncommon word can receive an unbounded weight and unfairly dominate the overall similarity score. The major contributions of this study are as follows:
  • A novel Square-Root Exponential Inverse Document Frequency (SRE-IDF) weighting function is proposed for automated short-answer grading.
  • A mathematical analysis was presented to prove that the proposed SRE-IDF weighting function is bounded within the interval range between e−1 and 1. This ensures numerical stability without the need for additional parameters.
  • The performance of the SRE-IDF method was experimentally evaluated against the Traditional IDF, Smoothed IDF, and BM25 across three different datasets.
  • Compared the computational complexity of the SRE-IDF with that of the popular intelligent model Frozen SBERT.
  • The SRE-IDF was integrated directly into existing TF-IDF-based grading systems without any major modifications to the overall framework.
The remainder of this paper is organized as follows. Section 2 reviews the related work on automated short-answer grading and term-weighting methods. Section 3 presents a detailed description of the proposed SRE-IDF formulation, along with its properties and pseudocode. Section 4 describes the experimental methods used in this study to evaluate the performance of the proposed SRE-IDF approach. Section 5 analyzes the experimental results of the proposed SRE-IDF and existing state-of-the-art techniques. Finally, Section 6 concludes the study and discusses future directions.

2. Related Work

This section briefly reviews the progression of Automated Short Answer Grading (ASAG) from simple keyword matching to more advanced methods such as TF-IDF, BM25, and deep learning models. It also highlights the limitations of current approaches and explains the need for a better IDF method. This also motivates the proposed SRE-IDF solution.
Early essay-scoring systems relied on surface-level features and failed to score short answers due to a lack of signal density. The first systems were designed specifically for short responses in the mid-1990s. The C-rater approach compares student words with pre-approved reference patterns [9,10]. The answers were considered correct when the words matched. However, it also has some limitations, even though it works well in several cases. A student could write a completely correct answer with no single-word match with the model answer. A correct understanding does not require an identical phrasing. The gap between keyword matching, known as lexical similarity, and concept understanding, known as semantic similarity, has become the main problem in this field.
By the early 2000s, the vector space model had become the standard framework for automated scoring. Student and model answers were each represented as weighted term vectors. The cosine similarity between the answers was used to produce grades. TF-IDF was the dominant weighting strategy. Common words received low weights in this setup, whereas rare domain-specific terms received higher weights [4,11].
In 2011, the authors conducted one of the most cited evaluations of this approach by comparing TF-IDF cosine similarity with plain word overlap and several knowledge-based measures from WordNet [12,13]. Their findings are instructive in two ways. On the positive side, TF-IDF performed competitively with far more complex methods. On the negative side, they identified the same problems that already existed. A student who fully understood the concept but expressed it through synonyms or a different sentence structure lost mark. This fundamental shortcoming set the research agenda for much of the subsequent work.
In [14], the authors introduced BM25 as part of the Okapi retrieval system. It extends the TF-IDF with two important refinements. First, it capped the term frequency contributions. A word appearing 30 times in a document could no longer accumulate 30 times the weight of a word appearing once in the document. The second refinement was related to fairness. A longer answer should not be automatically scored higher because it contains more words. These two changes together gave BM25 a strong reputation on retrieval benchmarks throughout the late 1990s and into the 2000s. The question was whether BM25 is suitable for automated grading. The answer turned out to be not really. Comparative studies, including short-text classification, have found that BM25 and TF-IDF produce varying results depending on the corpus and question type [15]. Neither consistently outperformed the other in terms of accuracy. Both methods apply a logarithmic transformation to the document frequency. The weight distributions followed the same basic curve. The terms receiving high weights were similar for both methods. The suppressed terms were also similar. The core limitation was that very common terms were not strongly penalized in grading-specific corpora. This limitation exists in both methods. Replacing one with the other does not resolve this issue [7,8].
By the mid-2010s, researchers realized that using only one method at a time, such as checking only lexical similarity or only semantic similarity, was insufficient for accurate grading [16,17,18,19]. In [20], the authors demonstrated that integrating lexical, syntactic, and semantic signals within a unified scoring framework produced better grading performance than any individual feature could.
However, combination methods require labeled training data, which are difficult to obtain consistently in educational environments [21,22]. The authors of [23] addressed this concern by modifying the IDF weighting formula. It introduced a smoothed variant designed to reduce the influence of low-frequency terms. Although this approach yielded modest improvements, the underlying weighting mechanism remained the same. However, these approaches leave the core structural limitations of the formulation unresolved.
Automated grading systems can identify similarities between answers only when they share the same words before 2013. Crediting a student who expressed the correct idea using different terminology was difficult. Word2Vec and GloVe changed this by mapping terms into a vector space in which semantically related words appear close to each other [24,25]. This allowed the grading systems to recognize meaning-level overlap even when the surface vocabulary differed. In 2018, BERT was introduced to improve static embeddings by generating context-dependent term representations [26]. BERT assigns different representations to the same word, unlike Word2Vec and GloVe. This depends on the surrounding context. This enables a more precise semantic interpretation. The practical drawback of BERT is that comparing two sentences requires processing them together. This is computationally expensive on the grading scale.
Sentence-BERT (SBERT) was introduced in 2019 to address this problem [27,28,29]. SBERT reduces sentence comparison to a single vector operation by independently encoding each sentence into a fixed-length vector. SBERT significantly reduced the inference time without a meaningful loss in semantic accuracy. However, deploying transformer-based models in real educational settings still requires labeled training data, computational resources, and regular retraining when course content changes. These requirements are often difficult to meet in many educational institutions. Therefore, improving the reliability of lightweight lexical methods remains a relevant research direction.
In [30], the authors introduced logarithmic IDF as a statistical approach to quantify term informativeness in a document collection. This principle assigns greater weight to rare terms that appear in fewer documents and assigns nearly the same weight to mid-frequency and common terms. In [31], the authors conducted a comparative analysis of IDF variants and demonstrated that the logarithmic IDF does not perform optimally under all retrieval conditions. Alternative methods, such as pivoted normalization and probabilistic IDF, have been proposed over the years. All the methods reviewed above share one commonality. They rely on a logarithmic curve designed decades ago for document retrieval rather than for grading student answers. No prior study has proposed replacing the logarithmic weighting curve with a square root exponential decay function specifically for this task. This study directly addresses this gap.

3. Proposed Method

This section introduces the proposed SRE-IDF weighting scheme for short-answer grading. The mathematical properties of the proposed method are analyzed. Its behavior was compared with that of the traditional logarithmic IDF formulation to demonstrate its suitability for grading student responses.
Consider a short-answer grading scenario in which an instructor provides a reference answer d0 and M student responses d1, d2, …, dM are collected for the same question. The reference answer and student responses together form a corpus of N = M + 1 documents. Let V denote the vocabulary of unique terms in the corpus. where df(t) represents the number of documents containing term t. The objective of grading is to compute a similarity score S between each student response di and the reference answer d0.
The proposed term weighting function assigns weight w ( t ) to each term t in the vocabulary. Given a corpus of N documents in which d f ( t ) denotes the document frequency of term t , w ( t ) is defined in Equation (1):
w ( t ) = exp ( d f ( t ) N )
where d f ( t ) should be in the range 0 to N for all terms t . This is because no term can appear in more documents than the corpus contains. Assume x = d f ( t ) N , where x ranges between 0 and 1. Equation (1) is reduced to Equation (2):
w ( x ) = exp ( x )
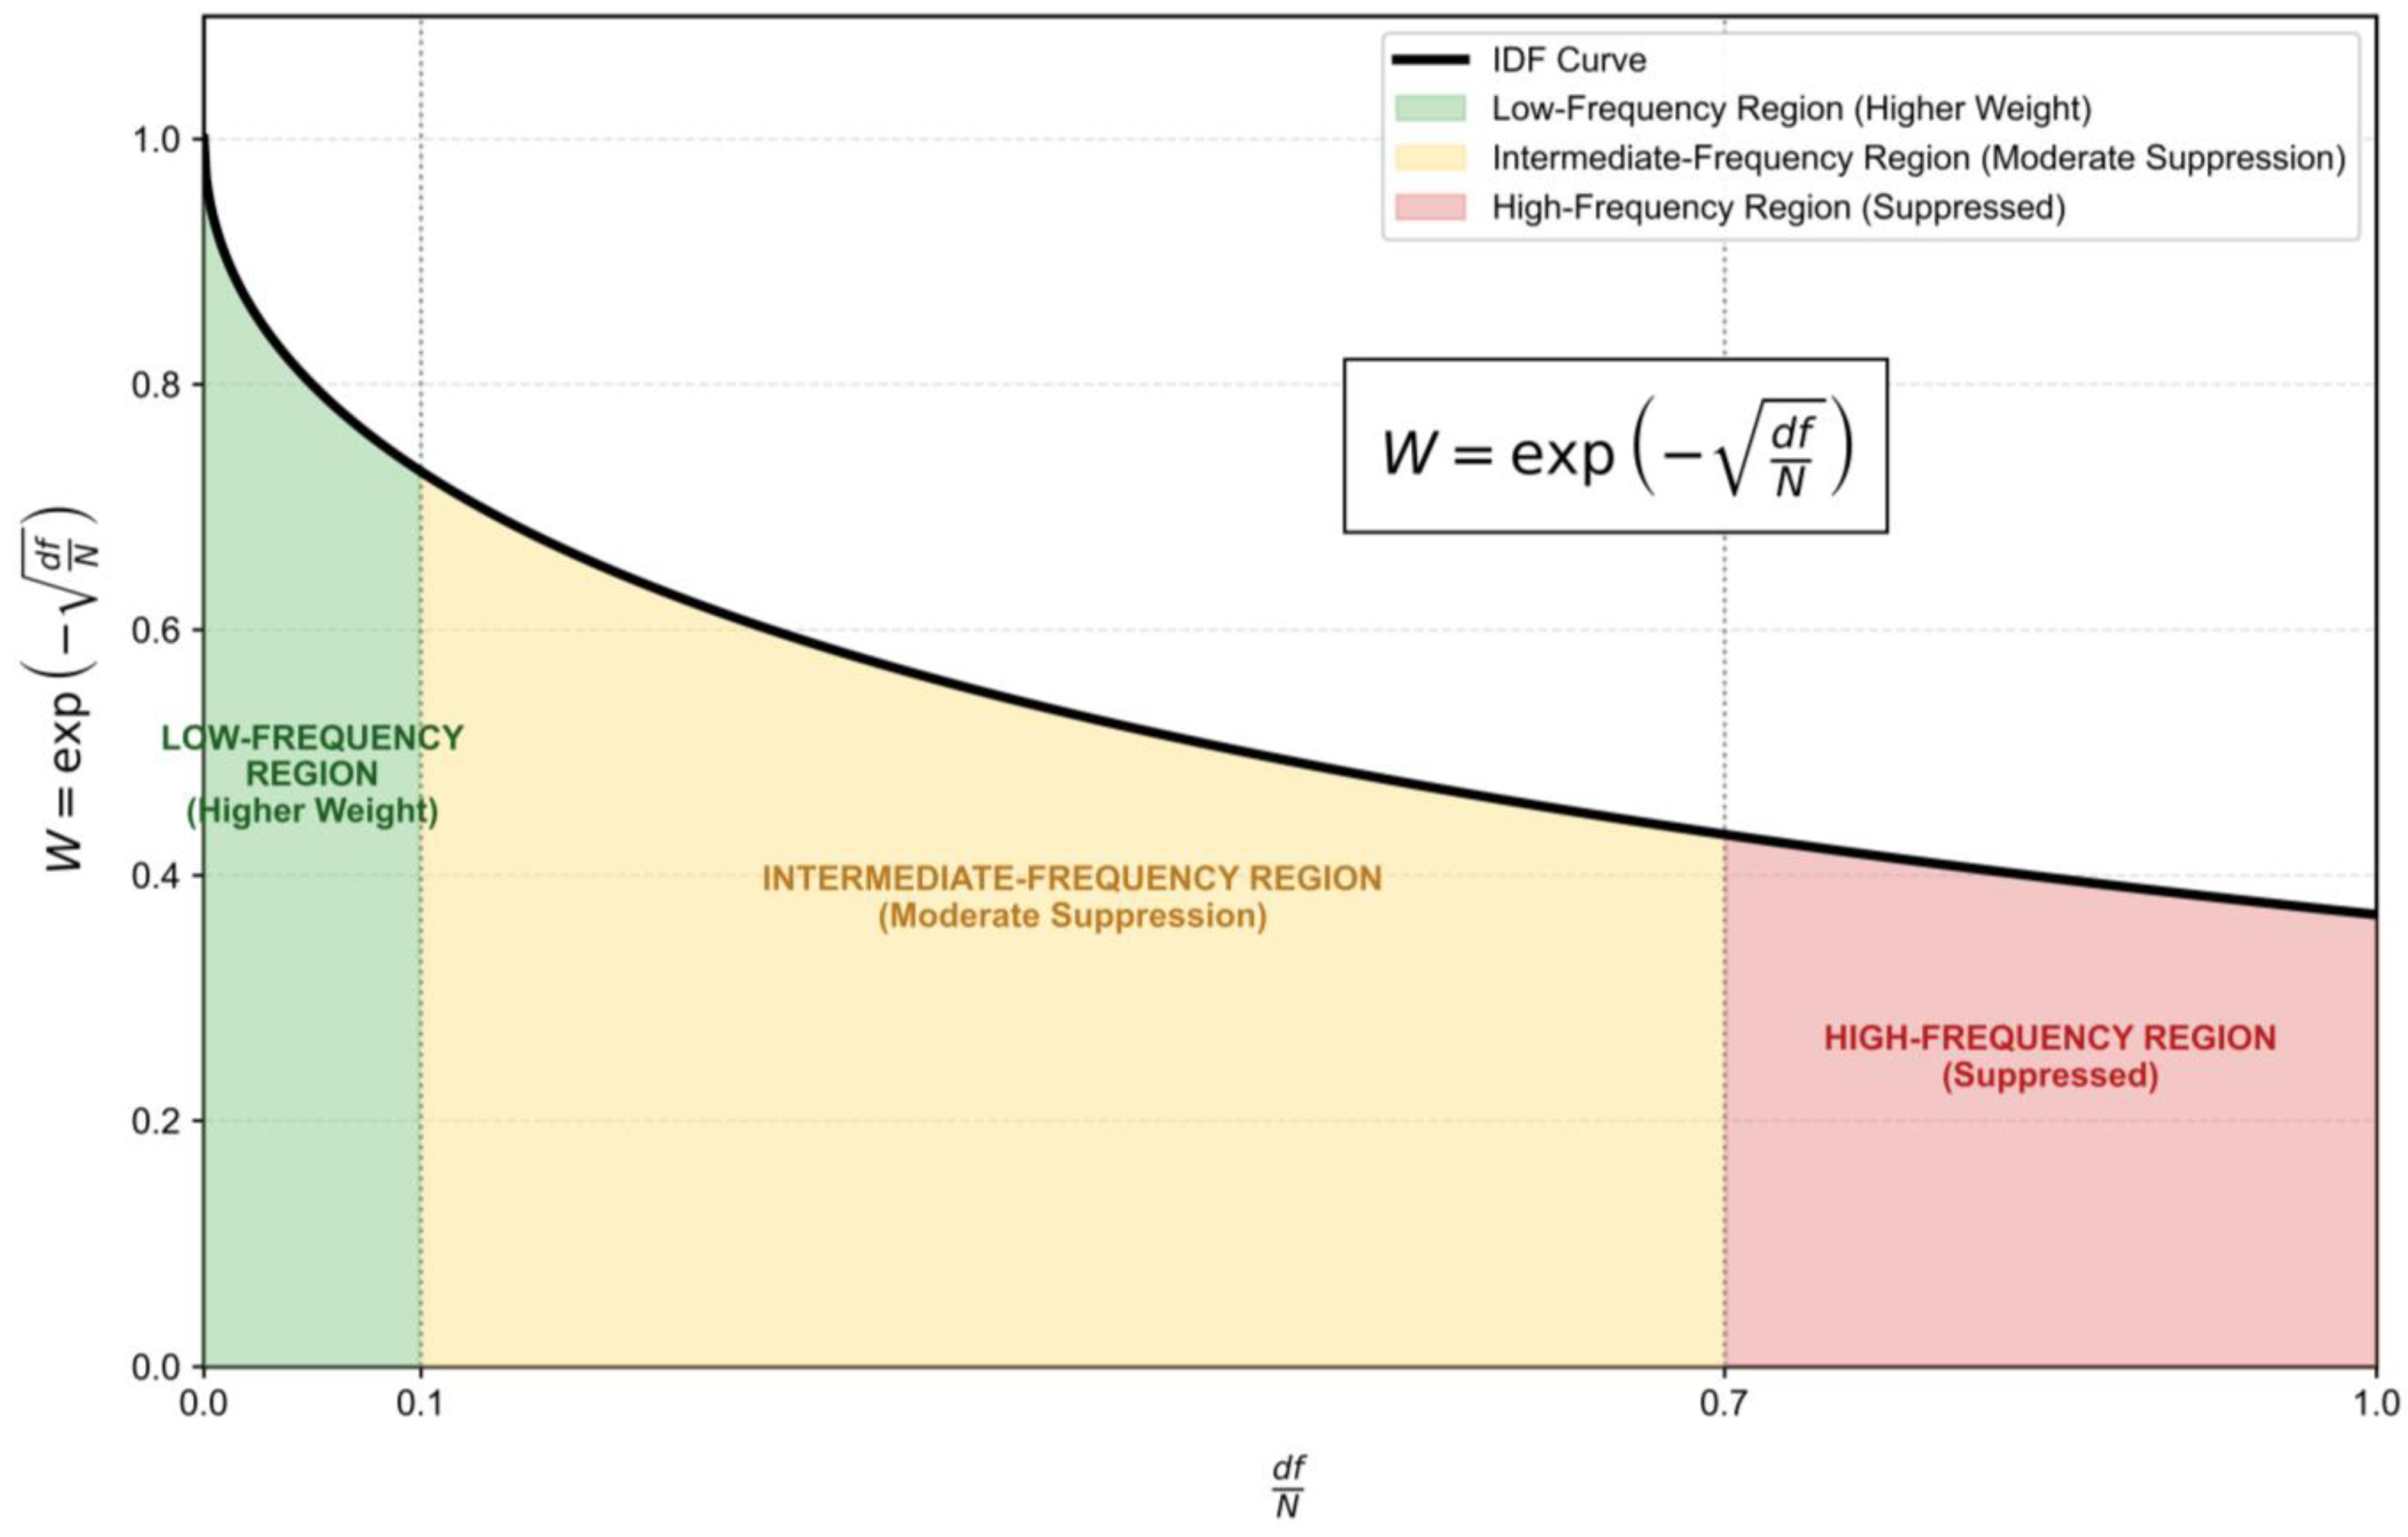
The range of w(x) over x ∈ [0, 1] follows directly from the evaluation of Equation (2) at its domain boundaries. For rare terms, as x → 0, the weight is maximum, and
l i m x 0 w ( x ) = e 0 = 1
For maximally frequent terms, at x = 1, the weight reaches its minimum,
w ( 1 ) = e 1 0.3679
These evaluations establish the bounded range of the proposed function. Because 0 d f ( t ) N 1 , taking the square root preserves the inequality 0 d f ( t ) N 1 . Negating and applying the exponential function, which is monotonically increasing, gives
e 1 w ( t ) 1
This bound, [ e 1 , 1 ] [ 0.3679 , 1 ] , holds for every term in every corpus without any parameter, as shown in Figure 1.
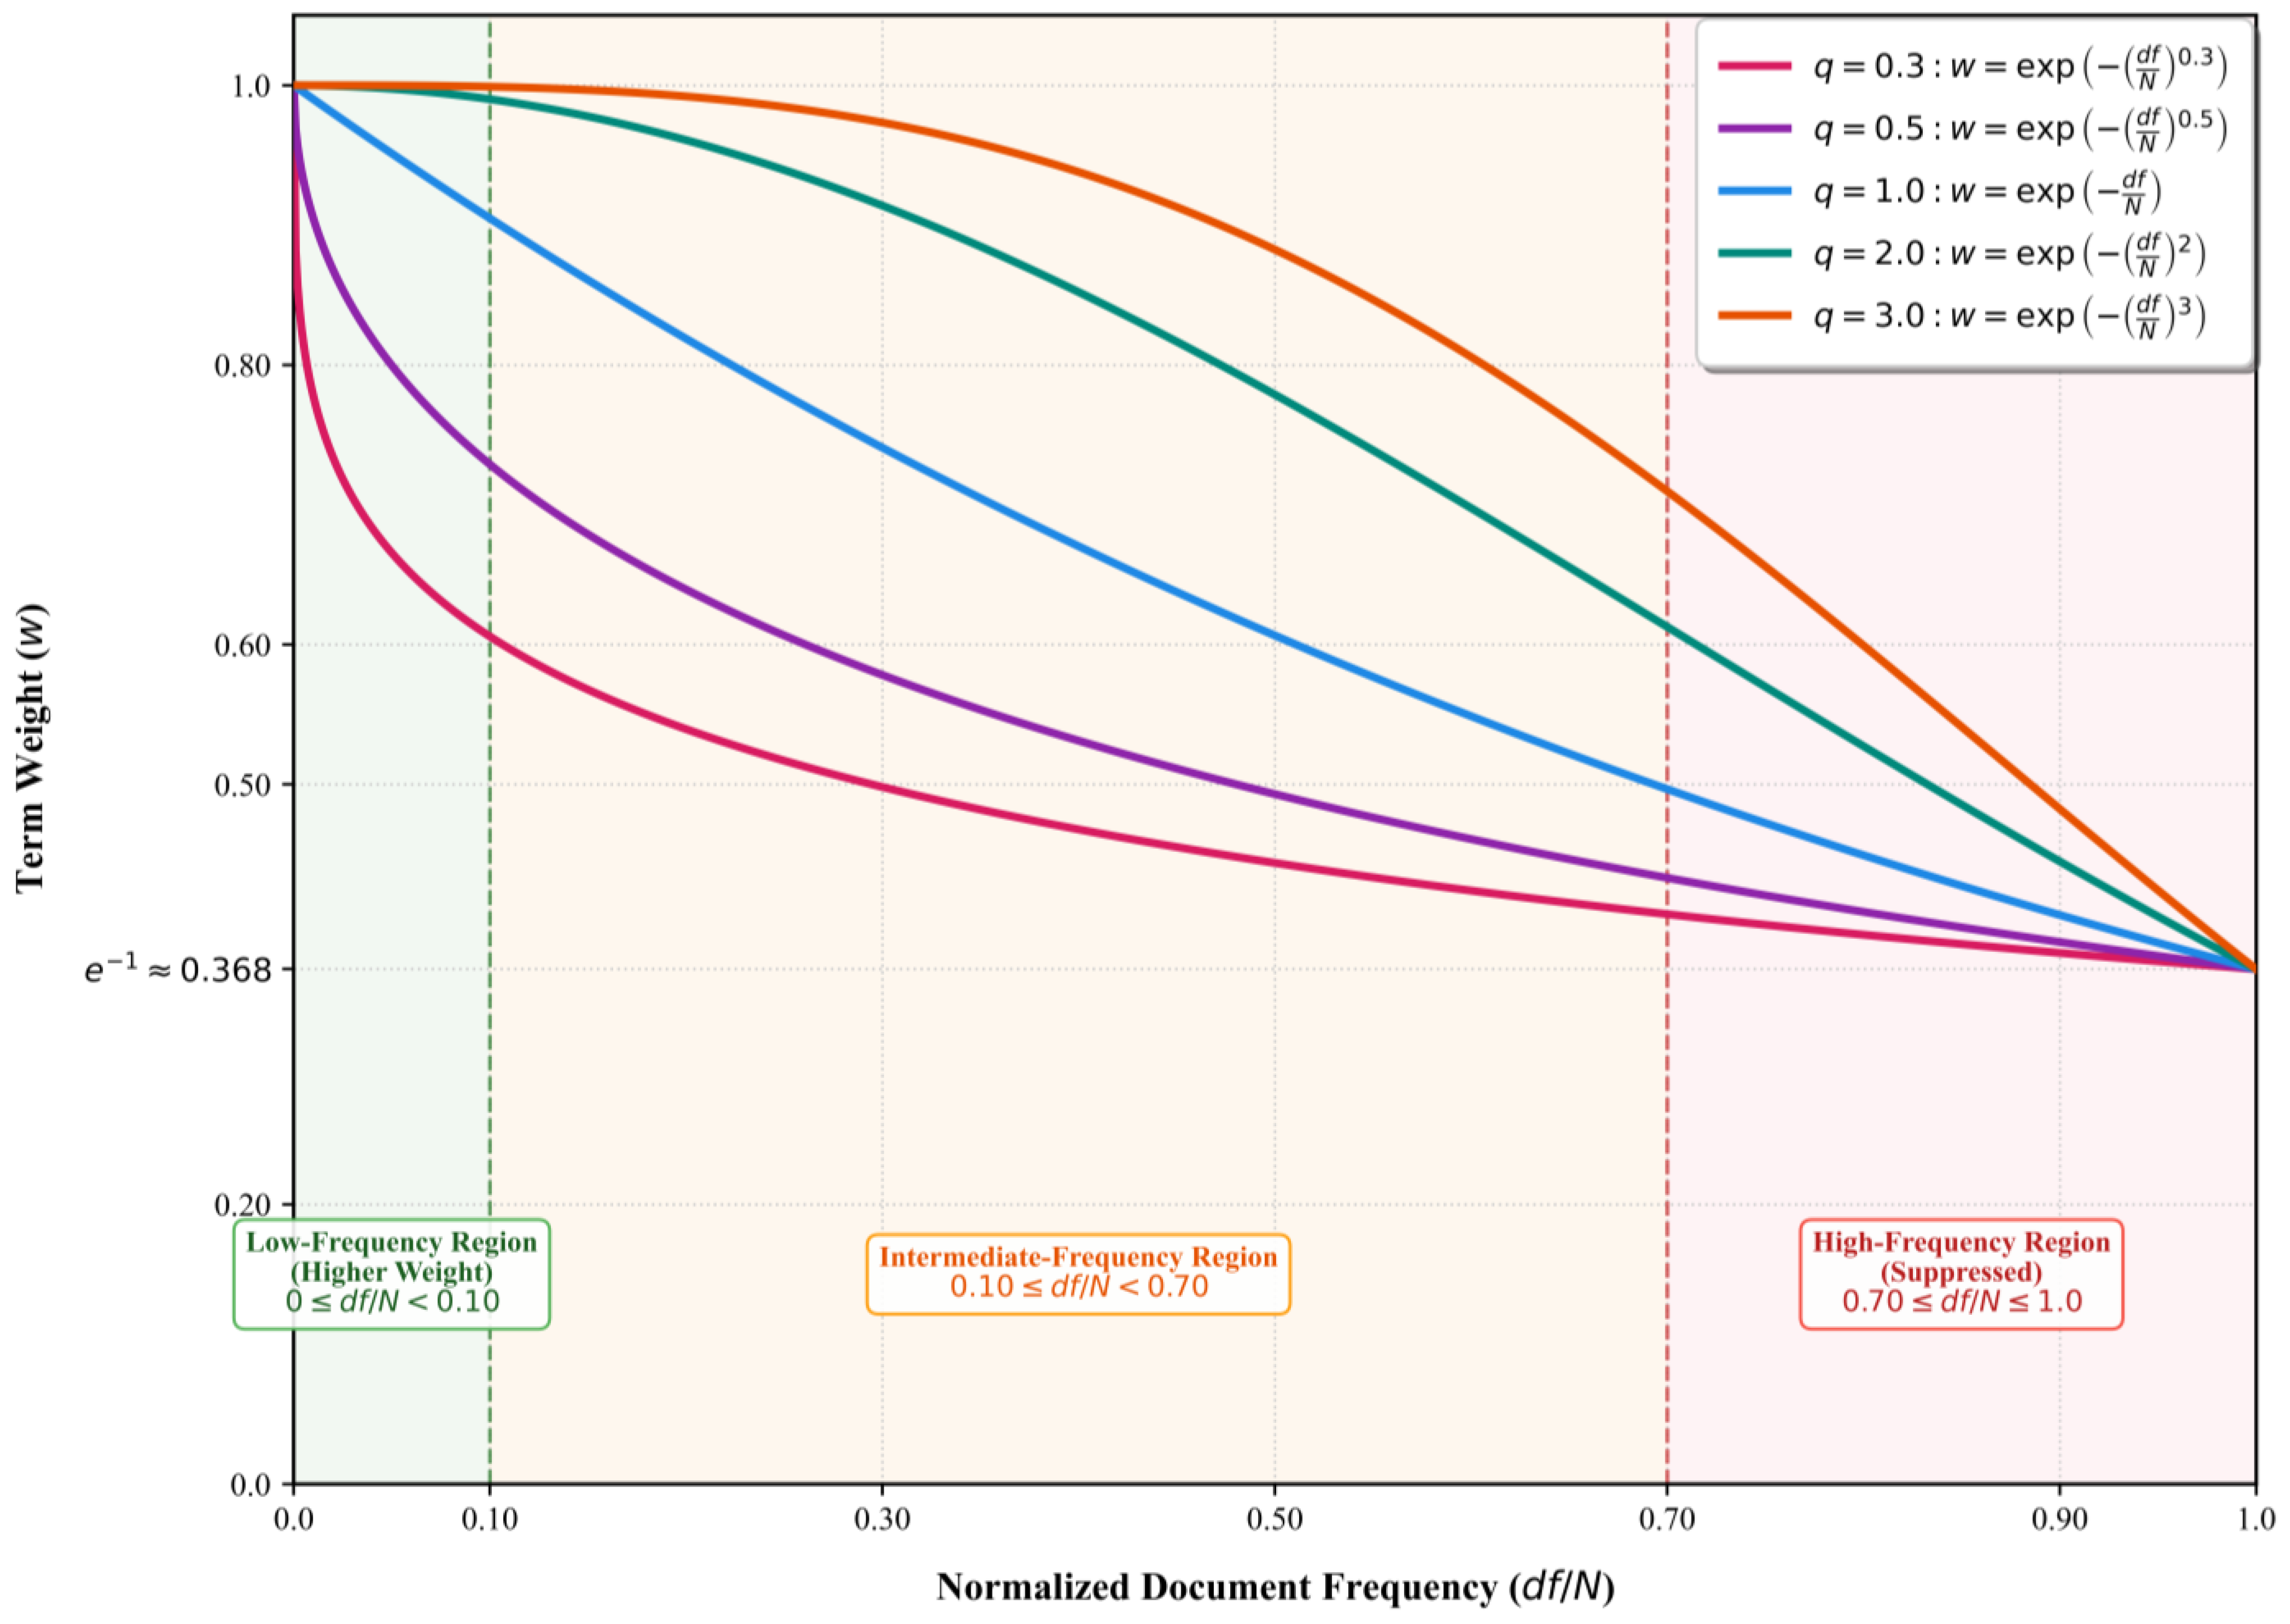
The proposed weighting function was not obtained by parameter tuning. It was designed to satisfy a small set of properties considered useful for grading short answers: (i) weight decreases as document frequency increases; (ii) weights stay within a fixed range so that no term gets an unfairly large or zero weight; (iii) frequent terms are suppressed more strongly than in logarithmic IDF; and (iv) the decay is smooth and needs no extra parameters to set. These first two properties are not unique to the square root form. As Figure 2 shows, the wider family of functions w = exp ( ( d f / N ) q ) keeps the same bounded range, [ e 1 , 1 ] , for any positive value of q . All curves started at 1. They all end at the same point, e 1 . This behavior is independent of the value of q .
The change with q is how quickly the weight drops in between. Lower values of q (such as q = 0.3 ) push the weights down very early, even for fairly rare terms. These risks suppress terms that are still meaningful for grading purposes. Higher values of q (such as q = 2 or q = 3 ) maintain the weights close to 1 for most of the range. They dropped sharply only near the end. This barely suppresses the mid-frequency terms that this method targets.
The square root case ( q = 0.5 ) lies between these extremes. It suppresses noticeably more than the standard exponential ( q = 1 ), but without the overly aggressive early drop observed at lower q values. It is a simple, fixed, parameter-free method that avoids both extremes.
Different domains or grading contexts with different frequency characteristics could, in principle, adopt a different fixed exponent without altering the core structure of the method. Importantly, this generality does not compromise the parameter-free nature of the SRE-IDF applied in this study. No tuning, search, or validation-based optimization of q was performed. The value q = 0.5 was used as a single, fixed constant across all datasets and experiments. This is consistent with the design goal of the method, which is to avoid data-dependent calibration. We present q = 0.5 as a principled, moderate default within this family. This is motivated by the balance between under-suppression and over-suppression, rather than by fitting it to any specific dataset.
The function w(x) is strictly monotonically decreasing in (0, 1). Differentiating Equation (2) with respect to x yields
d w d x = exp ( x ) 2 x
Since exp(−√x) > 0 and 2√x > 0 for all x ∈ (0, 1], the derivative is strictly negative throughout the domain. Therefore, the function assigns higher weights to rarer terms and lower weights to more frequent terms, as required for a grading-context weighting scheme. As x → 0+, the derivative diverges to −∞, indicating high sensitivity to changes in document frequency near the rare-term boundary. At x = 1, the derivative evaluates to −e−1/2 ≈ −0.1839, reflecting a smooth and gradual decay in the high frequency region.
The second derivative characterizes the curvature of the weighting functions. Differentiating Equation (6) gives
d 2 w d x 2 = exp ( x ) ( 1 + x ) 4 x 3 / 2
For all x ∈ (0, 1), both the numerator and denominator of Equation (7) are positive; therefore, the second derivative is strictly positive. Therefore, the weighting curve is concave upward throughout the equations, implying that the decay rate decreases as x increases.
A comparison with the classical logarithmic IDF clarifies the structural advantage of the proposed formulation in the grading context. Logarithmic IDF is defined as
I D F l o g ( t ) = log N d f ( t )
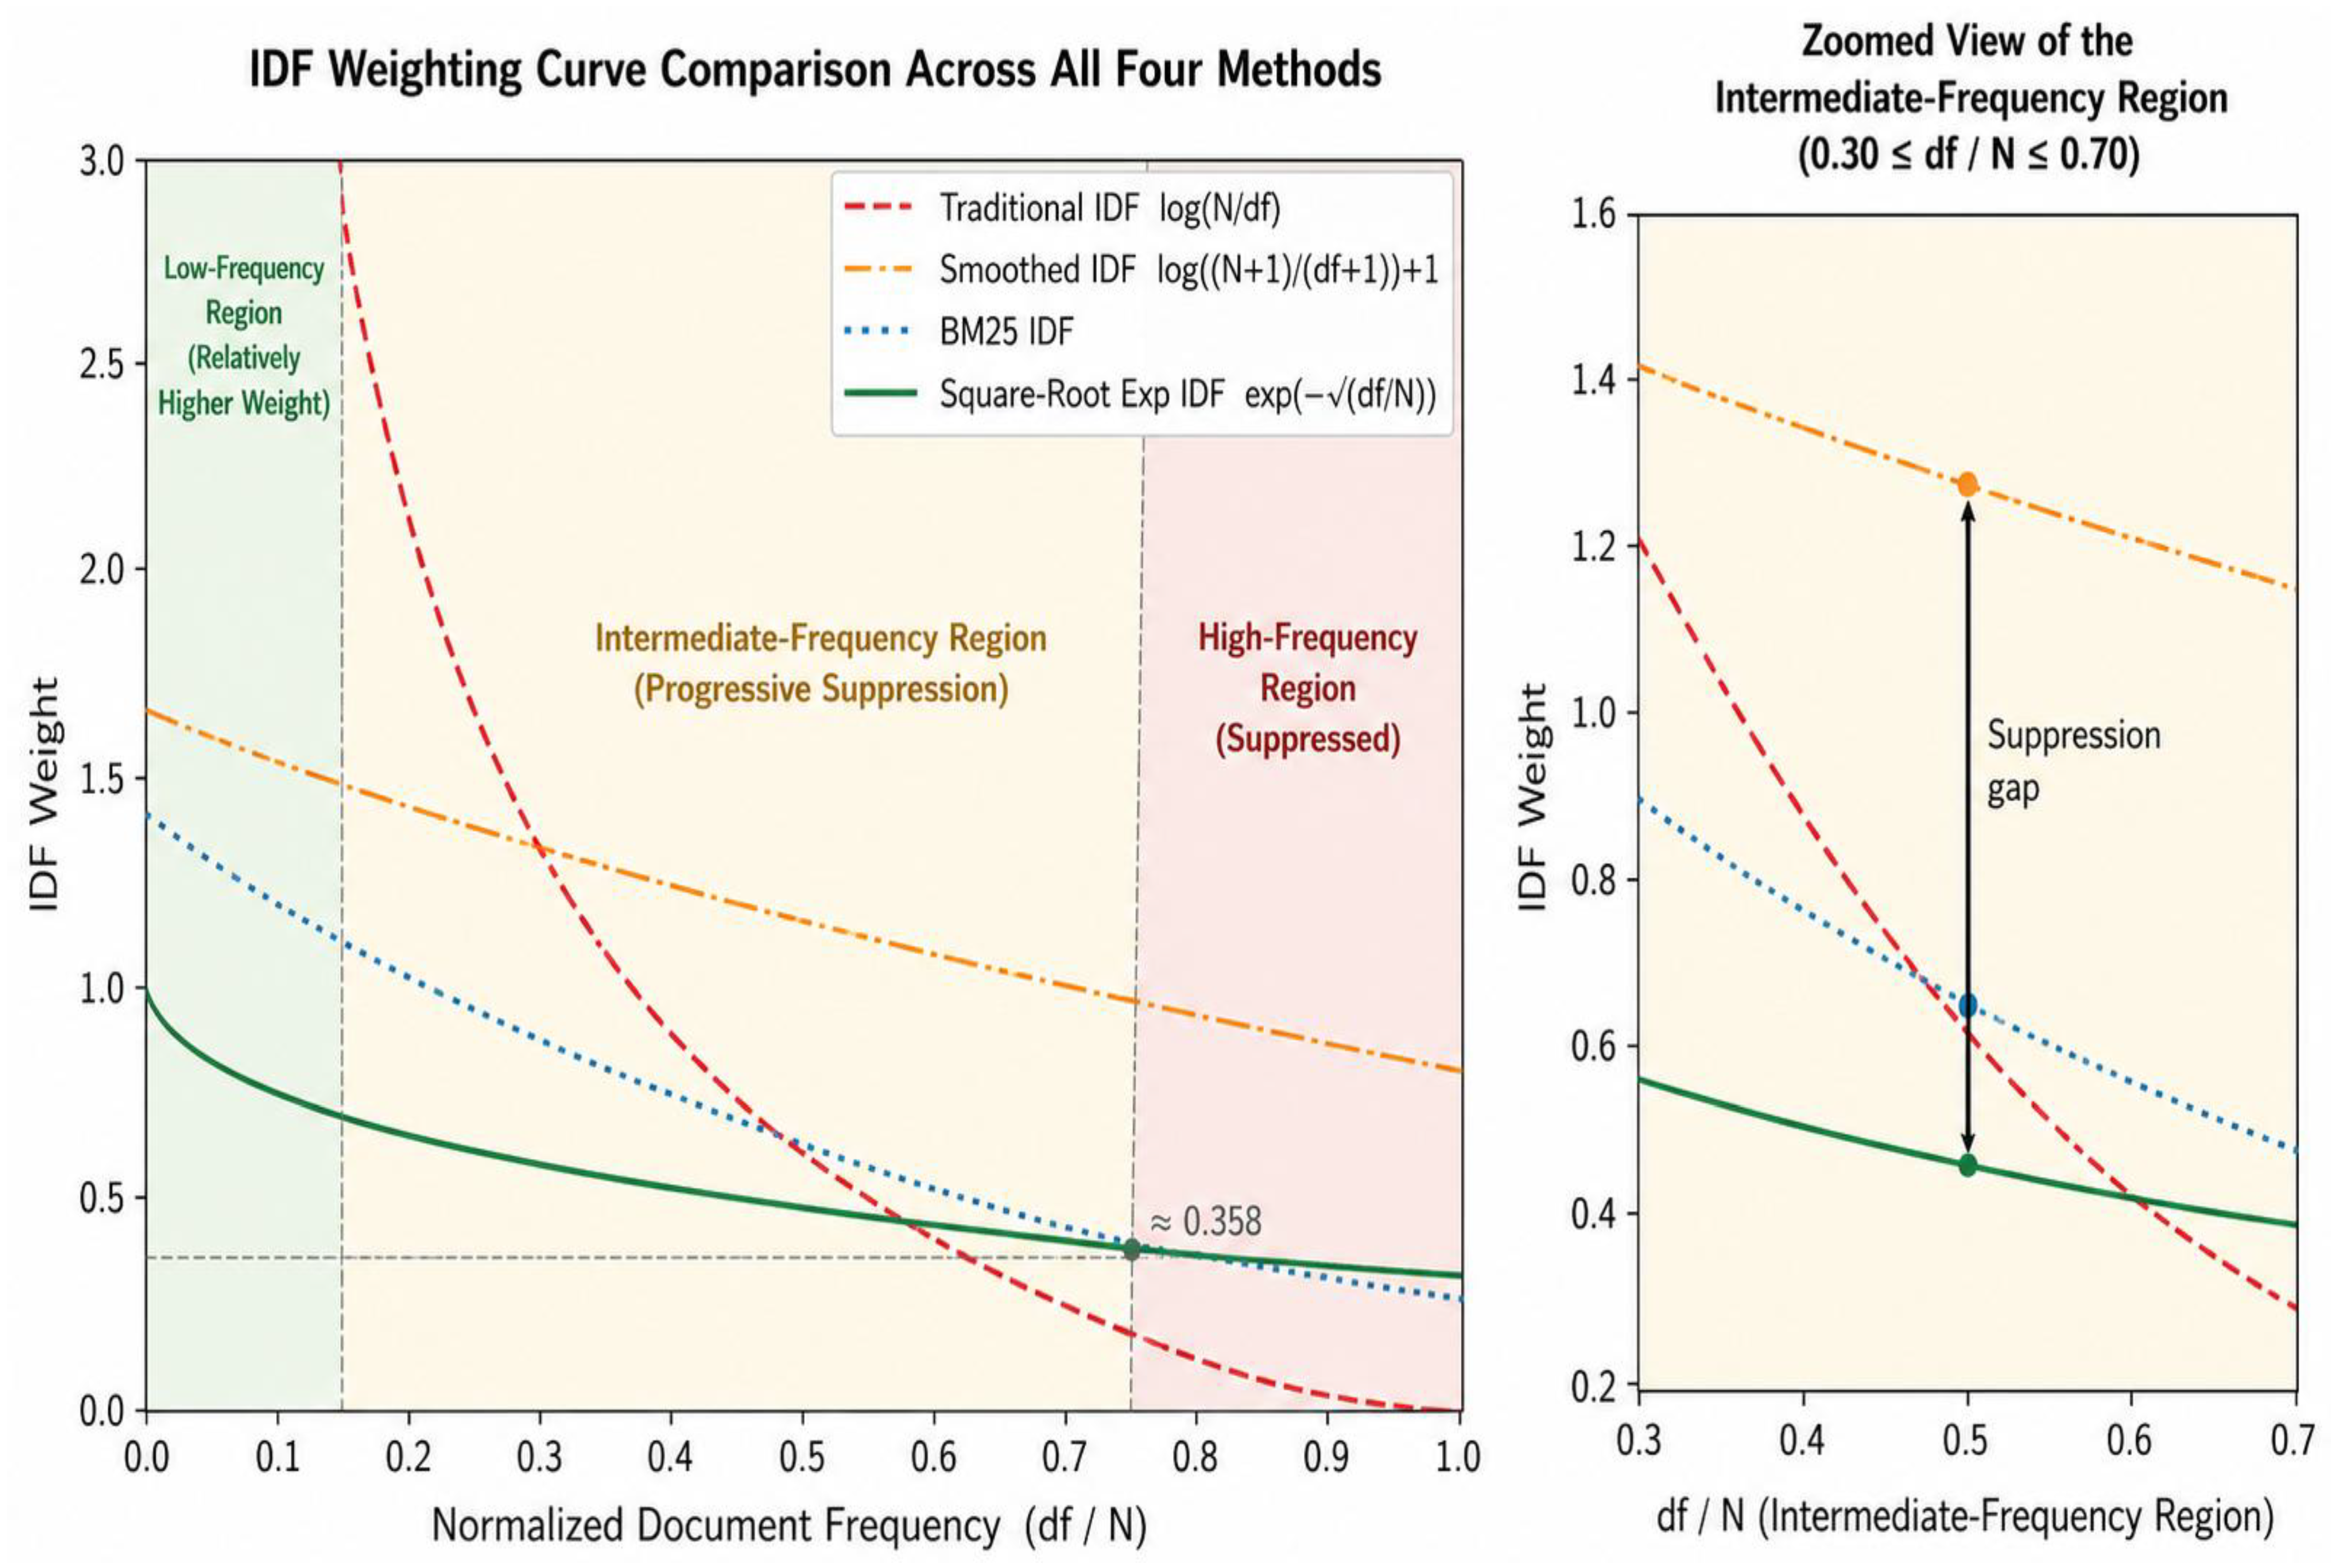
As d f ( t ) → 0, the logarithmic weight grows without bound, limx→0 log(1/x) = ∞. Compared to Equation (3), the proposed function satisfies limx→0 exp(−√x) = 1, assigning a high but strictly bounded weight to rare terms. More critically for the grading task, there exists an interval x ∈ (0.3, 0.6), this corresponding to the boilerplate frequency band, in which the proposed function satisfies
exp ( x ) < log 1 x f o r   x ( 0.3 , 0.6 )
This inequality confirms that the proposed function assigns strictly lower weights to boilerplate frequency terms than the logarithmic IDF. As illustrated in Figure 3, the SRE curve lies below all three baseline methods across the entire mid-frequency band, with a suppression gap of approximately 0.2–0.3 IDF weight units, relative to the traditional logarithmic baseline.
In the low-frequency region, the proposed function preserves sufficient discriminative weight to ensure that concept-bearing terms contribute meaningfully to the final similarity score. This suppression is not a byproduct of the bounded range of the proposed functions. At x = 1, log-IDF evaluates to 0, whereas the proposed function evaluates to e−1 ≈ 0.368, meaning that the proposed function assigns a higher weight than log-IDF at the highest end of the frequency scale. The two curves intersect near x ≈ 0.63. If the observed suppression were simply an effect of range compression, the proposed function would remain uniformly below log-IDF rather than crossing above it near x = 1. Therefore, the suppression is attributable to the difference in curvature between the two decay functions rather than the range compression. This lower-weight behavior holds for the proposed function across the entire interval x ∈ (0, ≈0.63), up to the crossing point identified above; Equation (9) further establishes this specifically within the Intermediate-frequency band (0.3, 0.6).
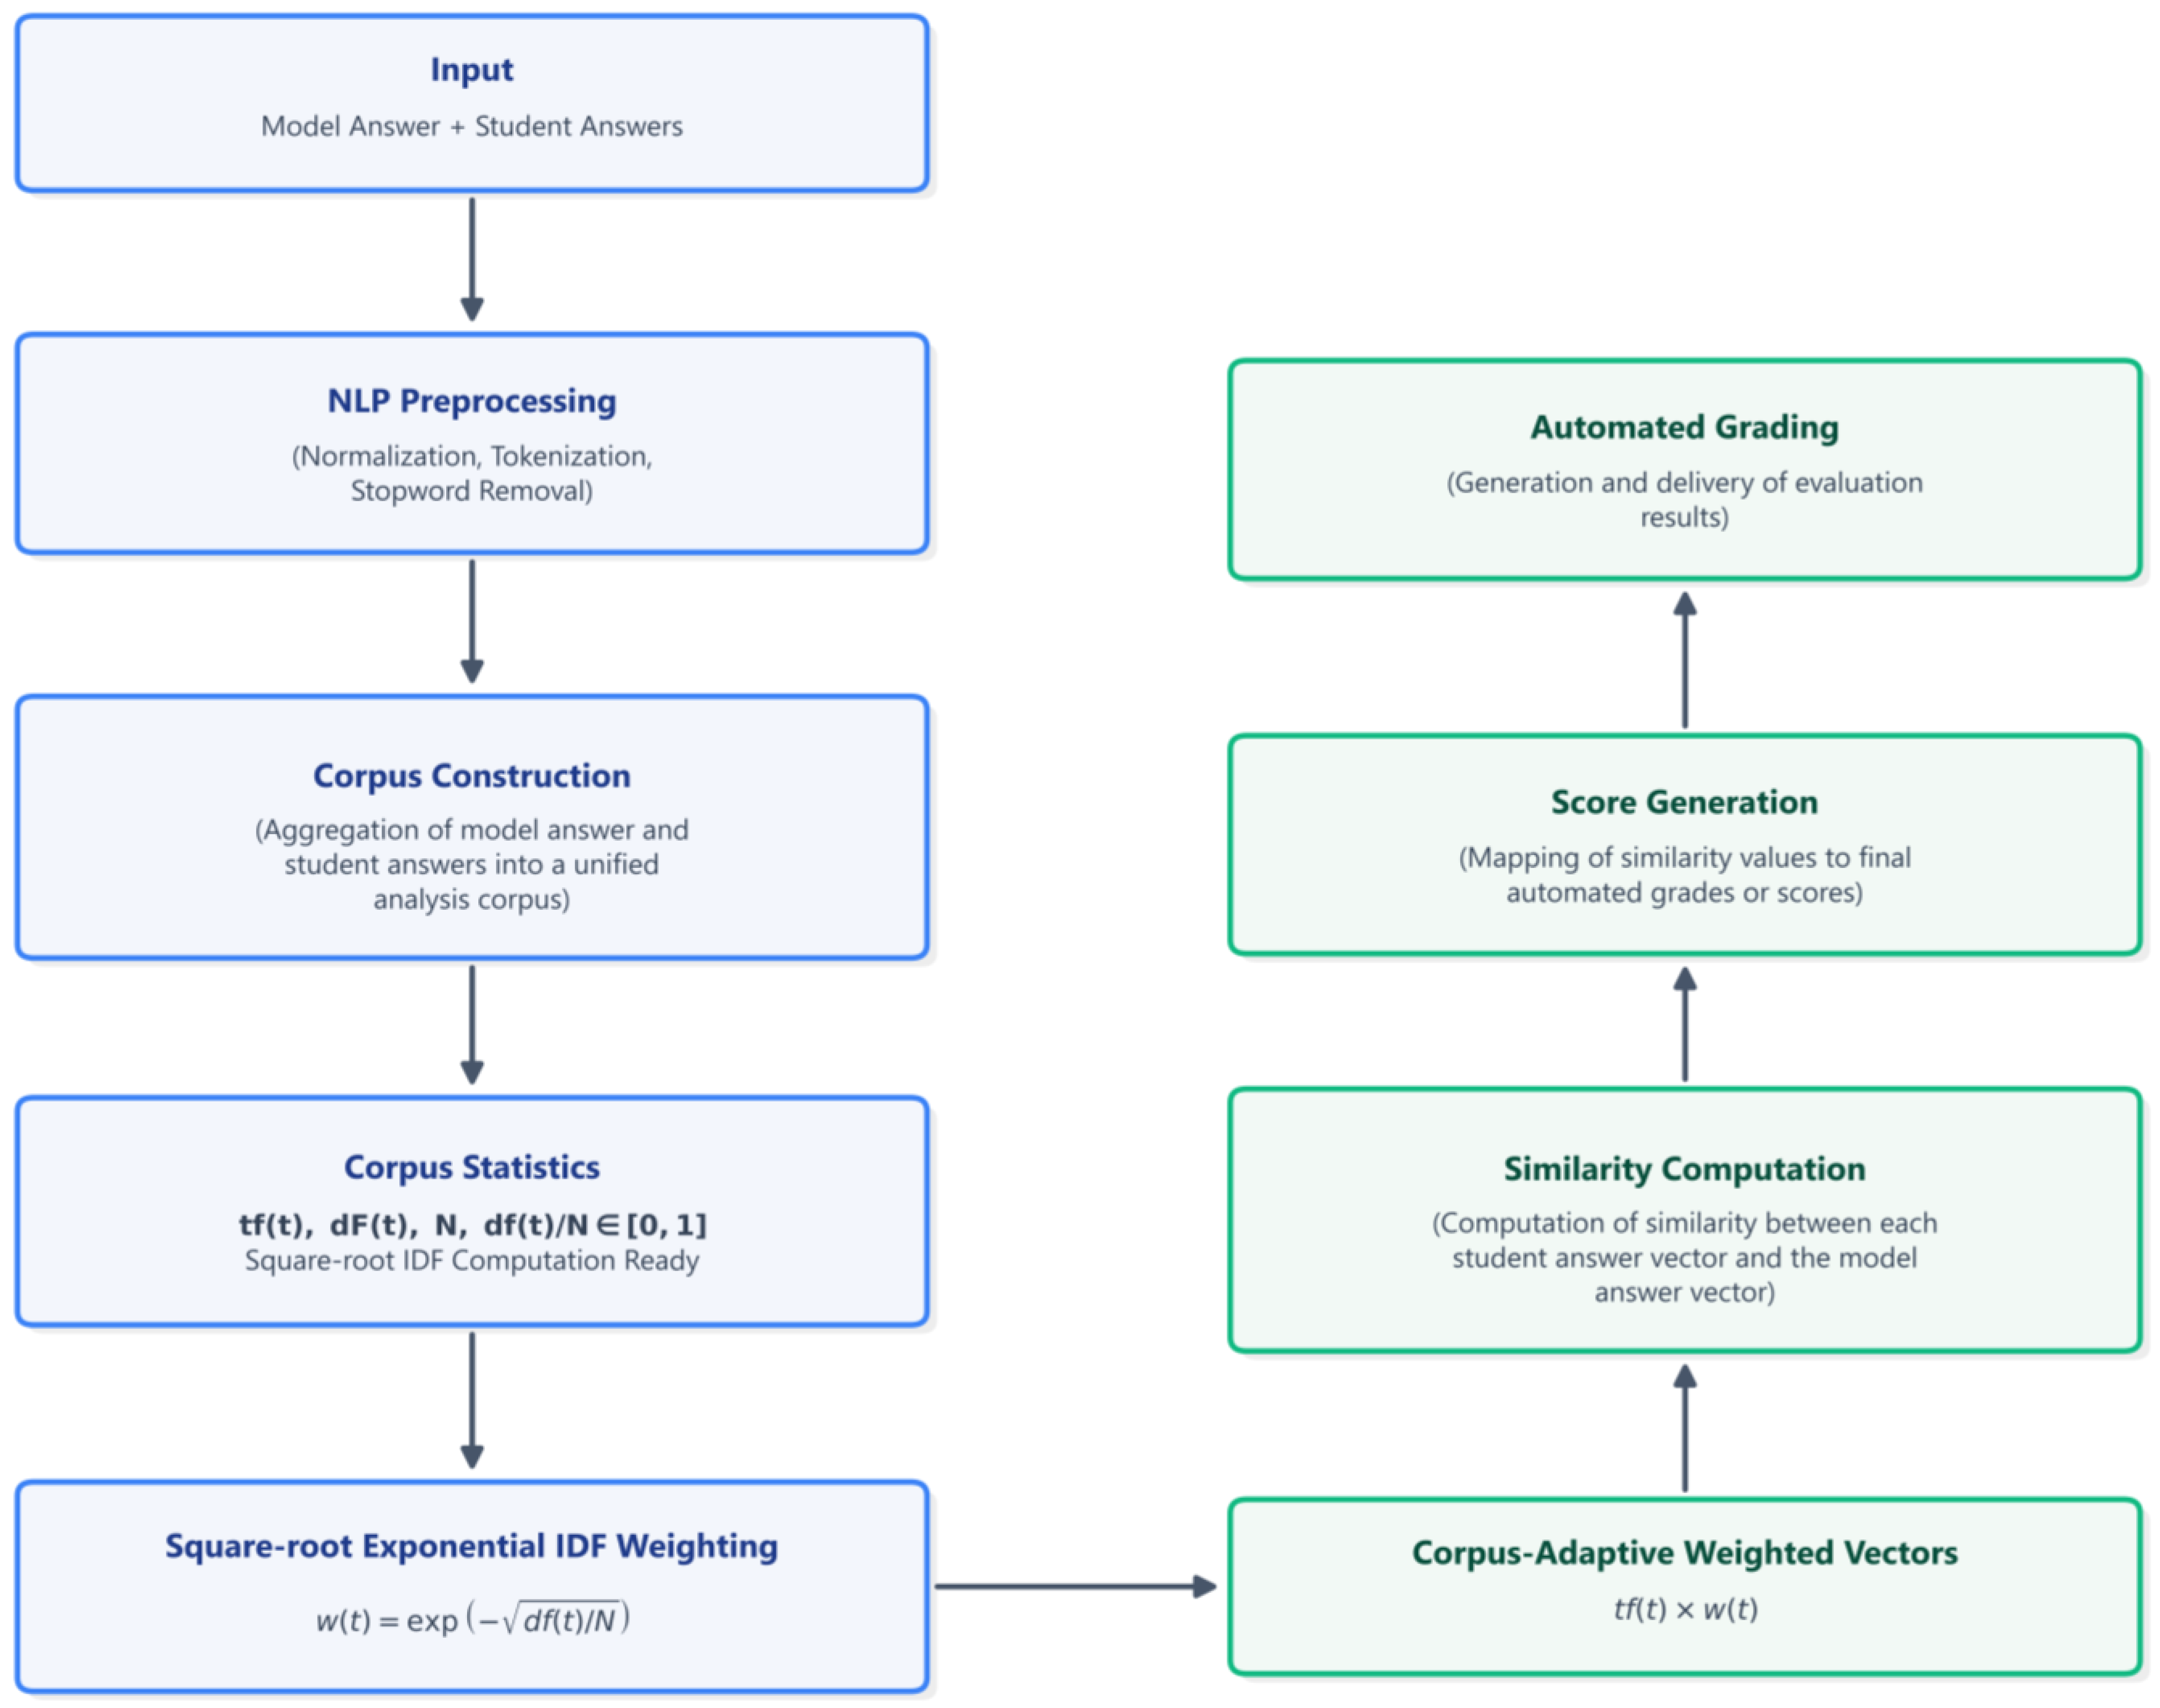
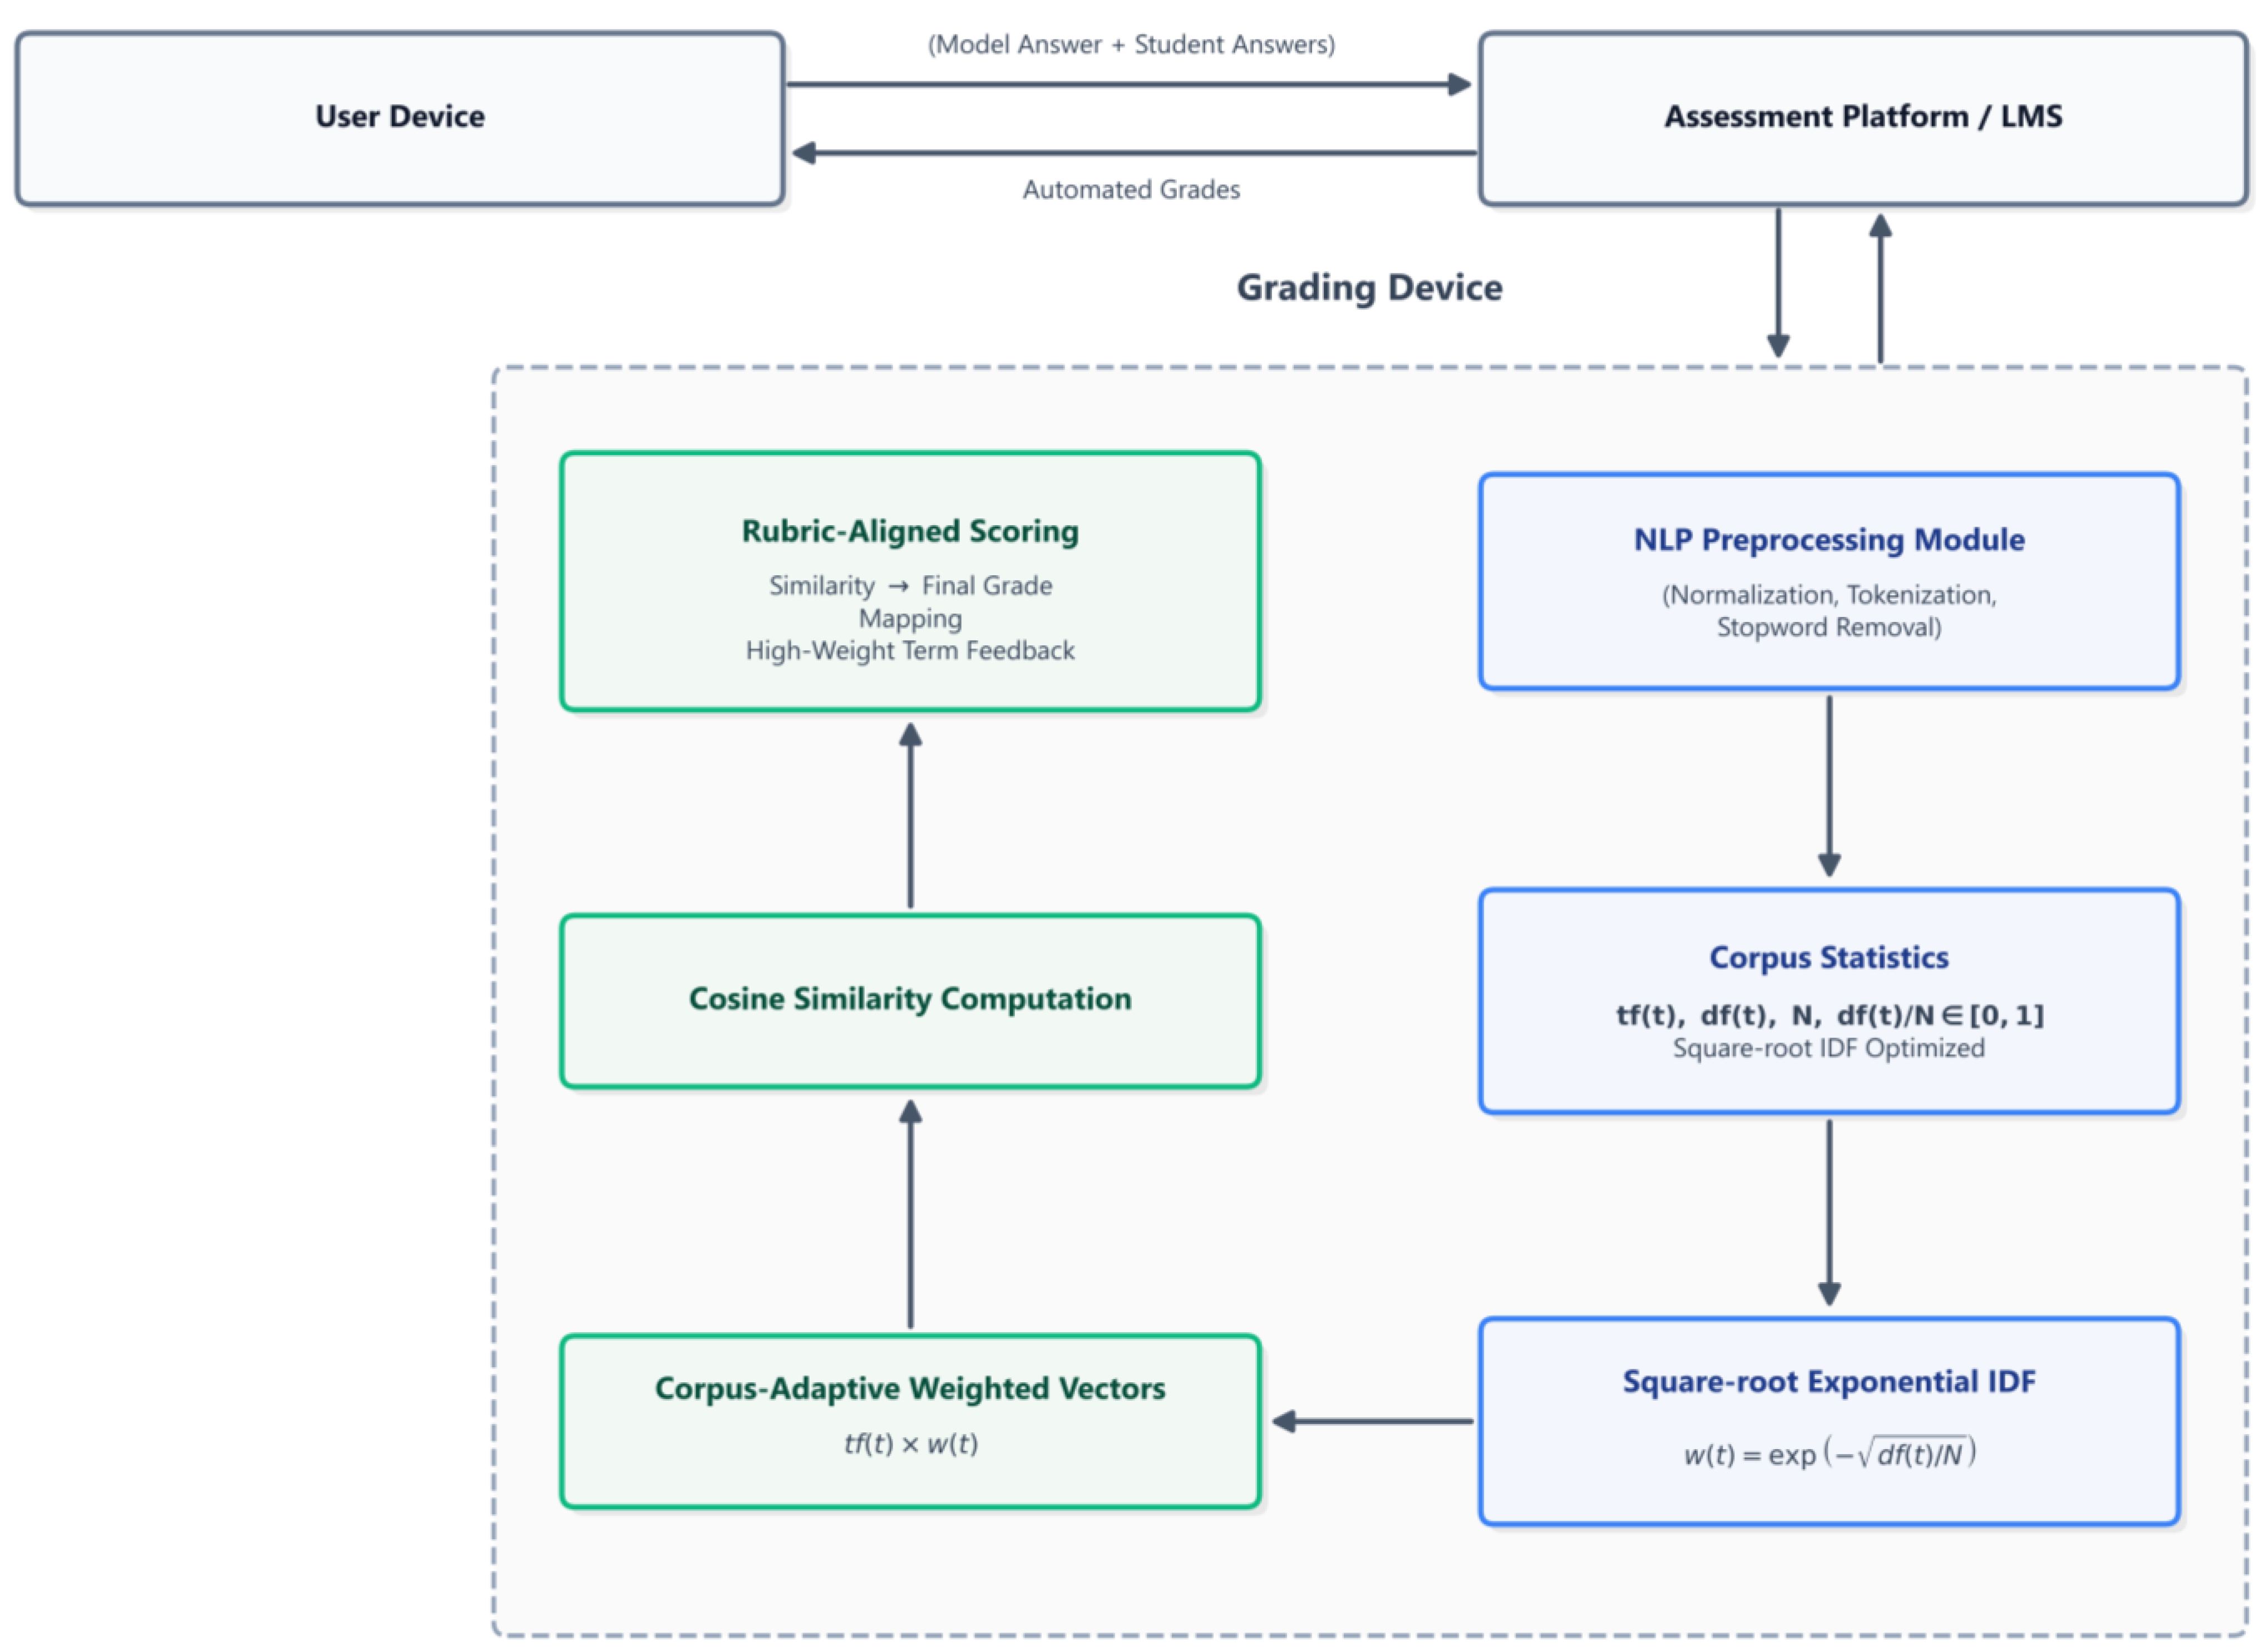
This method does not require the development of a new grading system from scratch. Any existing grading setup is already in place can continue to work exactly as it is. The only change is swapping out the old IDF function and replacing it with the new one. Figure 4 shows the workflow of the proposed grading system.
A student writes an answer, which is cleaned up, then each word gets a weight assigned to it, and then the answer gets compared against the model answer to produce a final score. Figure 5 shows the overall system architecture and internal connections.
Algorithm 1 describes the complete grading pipeline of the proposed SRE-IDF for automatic answer grading.
Algorithm 1: SRE-IDF Grading Pipeline
Input: Model answer d0, student answers {d1, d2,…, d_M}
Output: Similarity scores {s1, s2,…, s_M}
 Step 1.
All answers were preprocessed by converting to lowercase, tokenizing, and removing punctuation.
 Step 2.
Build the vocabulary V from all terms found in every answer.
 Step 3.
Set N ← M + 1
 Step 4.
For each term t in V:
   Compute df(t) = number of answers containing t
   Compute w(t) = exp(−√(df(t)/N))
 Step 5.
For each answer di (i = 0 to M):
   Build weighted vector vi
   where vi[t] = tf(t, di) × w(t)
 Step 6.
For each student, answer di (i = 1 to M):
   Compute si = cosine similarity (vi, v0)
 Step 7.
Return {s1, s2, …, s_M}

4. Experimental Setup

This section describes the experimental framework used to evaluate the proposed SRE-IDF method. This section describes the benchmark datasets, preprocessing steps, baseline methods, evaluation metrics, and implementation details used throughout the study.

4.1. Datasets and Preprocessing

Three widely used datasets were used to evaluate the performance of SRE-IDF, which are listed below.
The Mohler dataset is a well-established benchmark for Automated Short Answer Grading and contains student responses to computer science questions. The benchmark consists of open- and closed-ended subsets. Following the prior ASAG literature, we employ only the open-ended partition and further restrict the evaluation to the 2009 examinations (E01, E02, and E03). The resulting subset contained 630 student responses corresponding to 21 unique questions. Human assessment scores are continuous values ranging from 0 to 5 and are normalized to [0, 1] during the evaluation. The score distribution was highly imbalanced toward high-quality answers, with approximately 58.4% of the responses receiving normalized scores above 0.8.
The SciEntsBank benchmark contains four predefined partitions: training, unseen answers (UA), unseen questions (UQ), and unseen domains (UD). Following prior lexical ASAG studies, we employed only the training partition consisting of 4969 responses corresponding to 135 unique questions. The dataset exhibited a moderately imbalanced label distribution, with correct responses constituting approximately 40.4% of the dataset and non-domain responses accounting for less than 1%. Two evaluation settings are considered: a strict setting, where only correct responses are treated as positive examples. The second is a lenient setting, where both correct and partially correct responses are considered acceptable. A fixed decision threshold of 0.5 was used to convert the calibrated scores into binary predictions under both settings.
ASAG2024 is a large-scale benchmark that consolidates seven widely used short-answer grading datasets into a unified framework for evaluation. The benchmark contains 18,988 student responses across 283 unique questions originating from SciEntsBank, Beetle, SAF, DigiKlausur, Mohler, Stita, and CU-NLP databases. The dataset was pre-divided into training (15,190 responses), validation (1899 responses), and test (1899 responses) partitions, corresponding approximately to an 80%/10%/10% split. The normalized grading scores ranged from 0.0 (completely incorrect) to 1.0 (completely correct). Since ASAG2024 aggregates seven source datasets with heterogeneous native grading scales (e.g., 0–3 for Beetle and SciEntsBank, 0–100 for CU-NLP, and 0–5 for Mohler), all exact-match accuracy and QWK computations on the merged corpus use a common standardized integer scale of 0–5, obtained by rescaling normalized scores (×5) and rounding to the nearest integer, rather than each source dataset’s native scale. The score distribution was skewed toward higher grades, with approximately 43.5% of responses belonging to the excellent category (0.8, 1.0], while approximately 18.0% belonged to the very poor category [0.0, 0.2]. The overall mean normalized grade was 0.644.
All responses in all datasets were processed using the same lightweight preprocessing pipeline. Specifically, the text was converted to lowercase and tokenized using the default tokenizer provided by CountVectorizer. The tokenizer implicitly ignored punctuation symbols during token extraction. No stemming, lemmatization, or stop-word removal was applied. Applying identical preprocessing across all compared weighting methods ensures that any observed performance differences arise solely from the weighting formulation rather than from differences in text normalization.

4.2. Baseline Methods

Three baseline methods were evaluated using the same cosine similarity pipeline. Only the term-weighting formula varied across the conditions. All other parameters remained unchanged. This controlled design ensured that the observed performance differences in the results were caused only by the weighting formula itself. Each weighting formula was used in its standard, unmodified form without rescaling to a common numerical range, as this reflects how these methods are conventionally applied in practice.
The traditional IDF assigns a weight of log(N/df(t)) to each term and has served as the standard term weighting baseline in lexical similarity systems for decades. The smoothed IDF uses log (1 + N/df(t)), where the additive constant prevents division by zero. It also reduces sensitivity to extremely rare terms in small corpora. BM25 follows a probabilistic retrieval framework with parameters k1 and b fixed at default values of 1.5 and 0.75, respectively. This reflects realistic deployment conditions, where parameter tuning is not feasible. The proposed SRE-IDF computes the weights using Equation (1) and requires no parameter configuration.

4.3. Evaluation Metrics

Different evaluation metrics were selected according to the characteristics of each dataset and underlying prediction task. For the ASAG2024 dataset, student responses were associated with normalized ordinal scores, which were aggregated from multiple short-answer grading benchmarks. Therefore, the Quadratic Weighted Kappa (QWK) was used as the primary evaluation metric. This is because it measures the agreement between the predicted and actual scores by considering the magnitude of the prediction errors. The Root Mean Squared Error (RMSE) was used to quantify the average prediction error magnitude.
For the SciEntsBank dataset, the task was formulated as a binary classification problem under both Strict and Lenient mapping schemes, in which the original five-category human labels were collapsed into two classes (positive/negative) according to the mapping scheme used. Because the dataset had class imbalance, the Macro F1-score was selected as the primary metric. This is because it assigns equal importance to all classes, irrespective of their frequencies. Cohen’s Kappa was also taken to measure the level of agreement between the model predictions and human annotations.
For the Mohler dataset, student answers were associated with graded scores, making it an ordinal assessment task. Therefore, the Quadratic Weighted Kappa (QWK) was used to evaluate the agreement with human grading decisions. The Pearson Correlation Coefficient was used to measure the linear relationship between the predicted and actual scores.

Similarity-to-Score Mapping

The cosine similarity scores were converted into evaluation targets using global linear regression models fitted independently for each dataset. For SciEntsBank, separate regression models were fitted for the Strict and Lenient evaluation settings because the underlying target encodings differed between the two schemes.
For ASAG2024, which provides predefined training/validation/test partitions, the regression calibration model is fitted exclusively to the training partition and applied without refitting to the held-out test partition to prevent data leakage between calibration and evaluation. For Mohler and SciEntsBank, no comparable held-out partitions were used, consistent with the evaluation protocols described in Section 4.1.
For Mohler and SciEntsBank, calibrated predictions were clipped to the valid interval [0, 1] prior to downstream evaluation, whereas no clipping was applied for the ASAG2024 dataset.
For Mohler, the continuous regression output was used directly for the Pearson correlation. For ASAG2024, the continuous regression output was directly used for the RMSE computation. In both datasets, the calibrated predictions were rescaled and discretized for the QWK computation.
For SciEntsBank, the regression output was converted into class labels using a fixed threshold of τ = 0.5, as follows: The same threshold was uniformly applied across all questions within both the Strict and Lenient evaluation settings. Algorithm 2 describes the Similarity-to-Score Mapping.
Algorithm 2: Similarity-to-Score Mapping
Input: Similarity scores {s1, s2,…, sM}, dataset type D
Output: Predicted grades or class labels {ŷ1, ŷ2,…, ŷM}
1. Constructing target values:
  If D = SciEntsBank:
  Construct numeric targets yi from category labels according to the evaluation setting (Strict or Lenient):
    • Strict: correct → 1.0; contradictory, partially_correct_incomplete, irrelevant, non_domain → 0.0
    • Lenient: correct → 1.0; partially_correct_incomplete → 0.5; contradictory, irrelevant, non_domain → 0.0
  Else (Mohler, ASAG2024).
  Use yi directly from the dataset’s continuous human scores.
2. Collect (si, yi) pairs across all questions in D according to the following partitioning rule:
    • If D = ASAG2024, only pairs from the predefined training partition are used to fit the regression; similarity scores from the test partition are held out and used only for prediction in step 4.
    • If D = SciEntsBank: collect pooled pairs from the training partition, fitting a separate regression model for each evaluation setting (Strict, Lenient), because target encodings differ.
    • If D = Mohler, collect pooled pairs across all questions (no predefined splits exist for this dataset).
3. Fit the global regression model: f(s) = α·s + β, using only the (si, yi) pairs designated for fitting in step 2 (i.e., training-partition pairs for ASAG2024).
4. Compute calibrated predictions: pi = f(si) for all similarity scores in the evaluation set (for ASAG2024, this is the held-out test partition; for Mohler and SciEntsBank, this is the full pooled set collected in step 2)
5. If D ∈ {Mohler, SciEntsBank}:
Clip predictions into the valid interval [0, 1]: pi ← clip(pi, 0, 1) (No clipping applied for ASAG2024.)
6. If D ∈ {Mohler, ASAG2024}:
a. Use continuous predictions pi, computed on the held-out test partition for ASAG2024 (or the full pooled set for Mohler), directly for Pearson’s correlation (Mohler) or RMSE (ASAG2024).
b. Rescale pi to the original grading scale, rounding pi and yi to the nearest valid integer grade.
c. Compute Quadratic Weighted Kappa (QWK).
7. If D = SciEntsBank:
a. Convert pi into binary labels using fixed threshold τ = 0.5: ŷi = 1 if pi ≥ 0.5, else ŷi = 0
b. The Macro-F1 score and Cohen’s kappa were computed.
8. Return the predicted grades or labels {ŷ1, …, ŷM}.
Python version 3.14.6 was used to implement the proposed system. NLTK version 3.10.0, a Python library, was used for text preprocessing and vocabulary construction. Python dictionaries were used to store term frequencies. NumPy version 2.5.1 was used to calculate the weights of the SRE-IDF. Scikit-learn was used to calculate cosine similarity. BM25 was implemented from scratch to achieve full control over its parameters. Each dataset was treated as an independent experiment. The vocabulary and term weights were recomputed for each question to reflect real deployment conditions. All experiments were performed on a standard desktop computer without any specialized hardware. The complete implementation code of the proposed SRE-IDF approach on the ASAG2024 dataset is openly available through the Zenodo repository [32].

5. Results

This section presents the experimental results of the SRE-IDF on the Mohler, SciEntsBank, and ASAG2024 datasets. The performance of the proposed SRE-IDF was compared with that of the Traditional IDF, Smoothed IDF, and BM25 using evaluation metrics appropriate for each dataset. Statistical significance analysis was also conducted to determine whether the observed performance differences were reliable and meaningful.
Statistical significance across all comparisons was assessed using a paired t-test, with each student’s response treated as the unit of analysis. Effect sizes were reported as Cohen’s d, and 95% confidence intervals were provided alongside mean differences to quantify the reliability and magnitude of the observed improvements.

5.1. Results on the Mohler Dataset

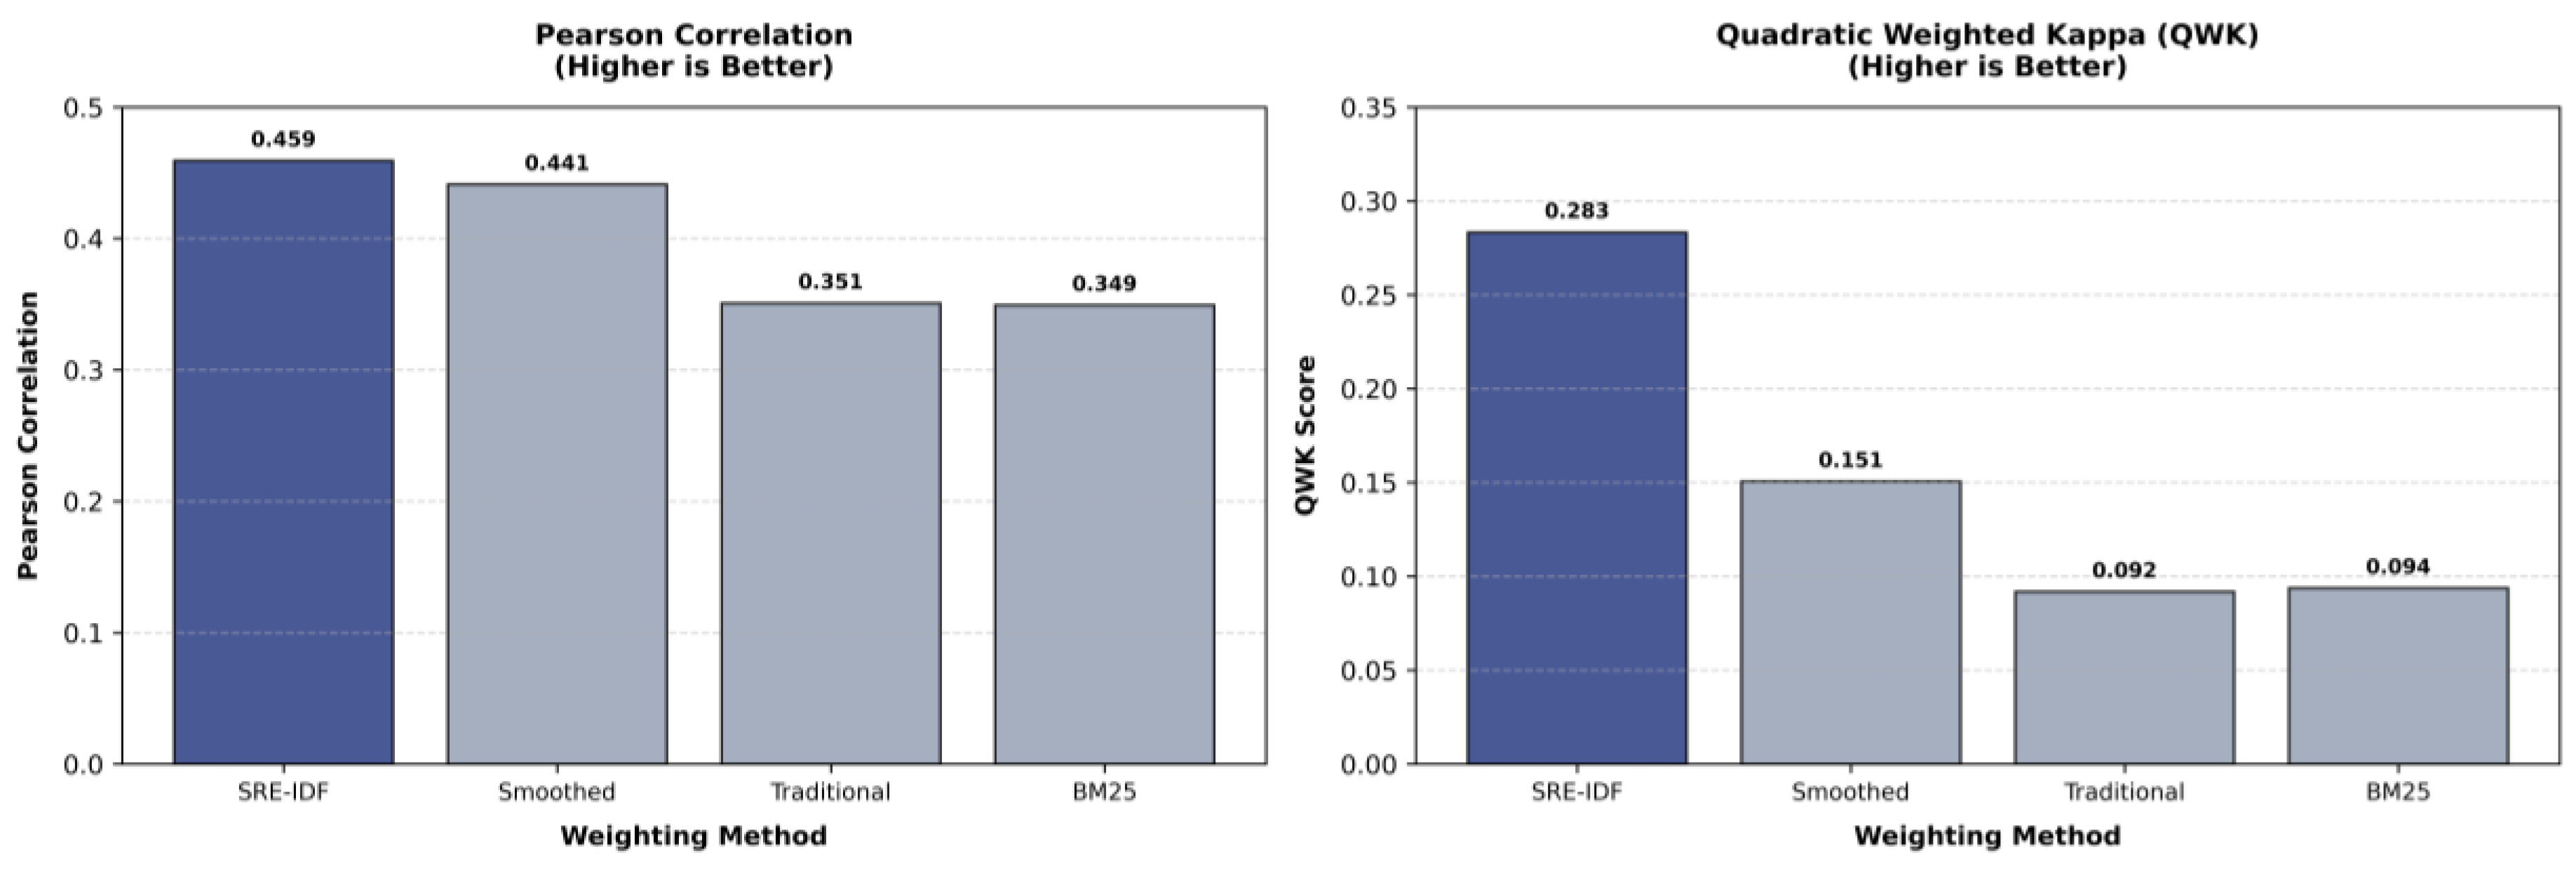
SRE-IDF got the highest Pearson Correlation score of 0.459, outperforming Smoothed IDF (0.441), Traditional IDF (0.351), and BM25 (0.349). Similarly, SRE-IDF got the highest QWK value of 0.283, which is higher than the Smoothed IDF (0.151), Traditional IDF (0.092), and BM25 (0.094). Figure 6 shows the visual performance comparison of the SRE-IDF with Traditional IDF, Smoothed IDF, and BM25 on the Mohler dataset.
A statistical significance analysis was performed to confirm these results. The results are presented in Table 1, with all comparisons returning p-values below 0.001. This confirms that the observed results were reliable. The mean differences and confidence intervals that excluded zero were positive. This confirms that SRE-IDF consistently outperformed all baseline methods in all comparisons. The strongest improvements were observed against BM25 (d = 0.2869) and Traditional IDF (d = 0.2830). The improvement over the Smoothed IDF was also meaningful, with an effect size of d = 0.2398, demonstrating the practical effectiveness of the SRE-IDF on this dataset.

5.2. Results on the SciEntsBank Dataset

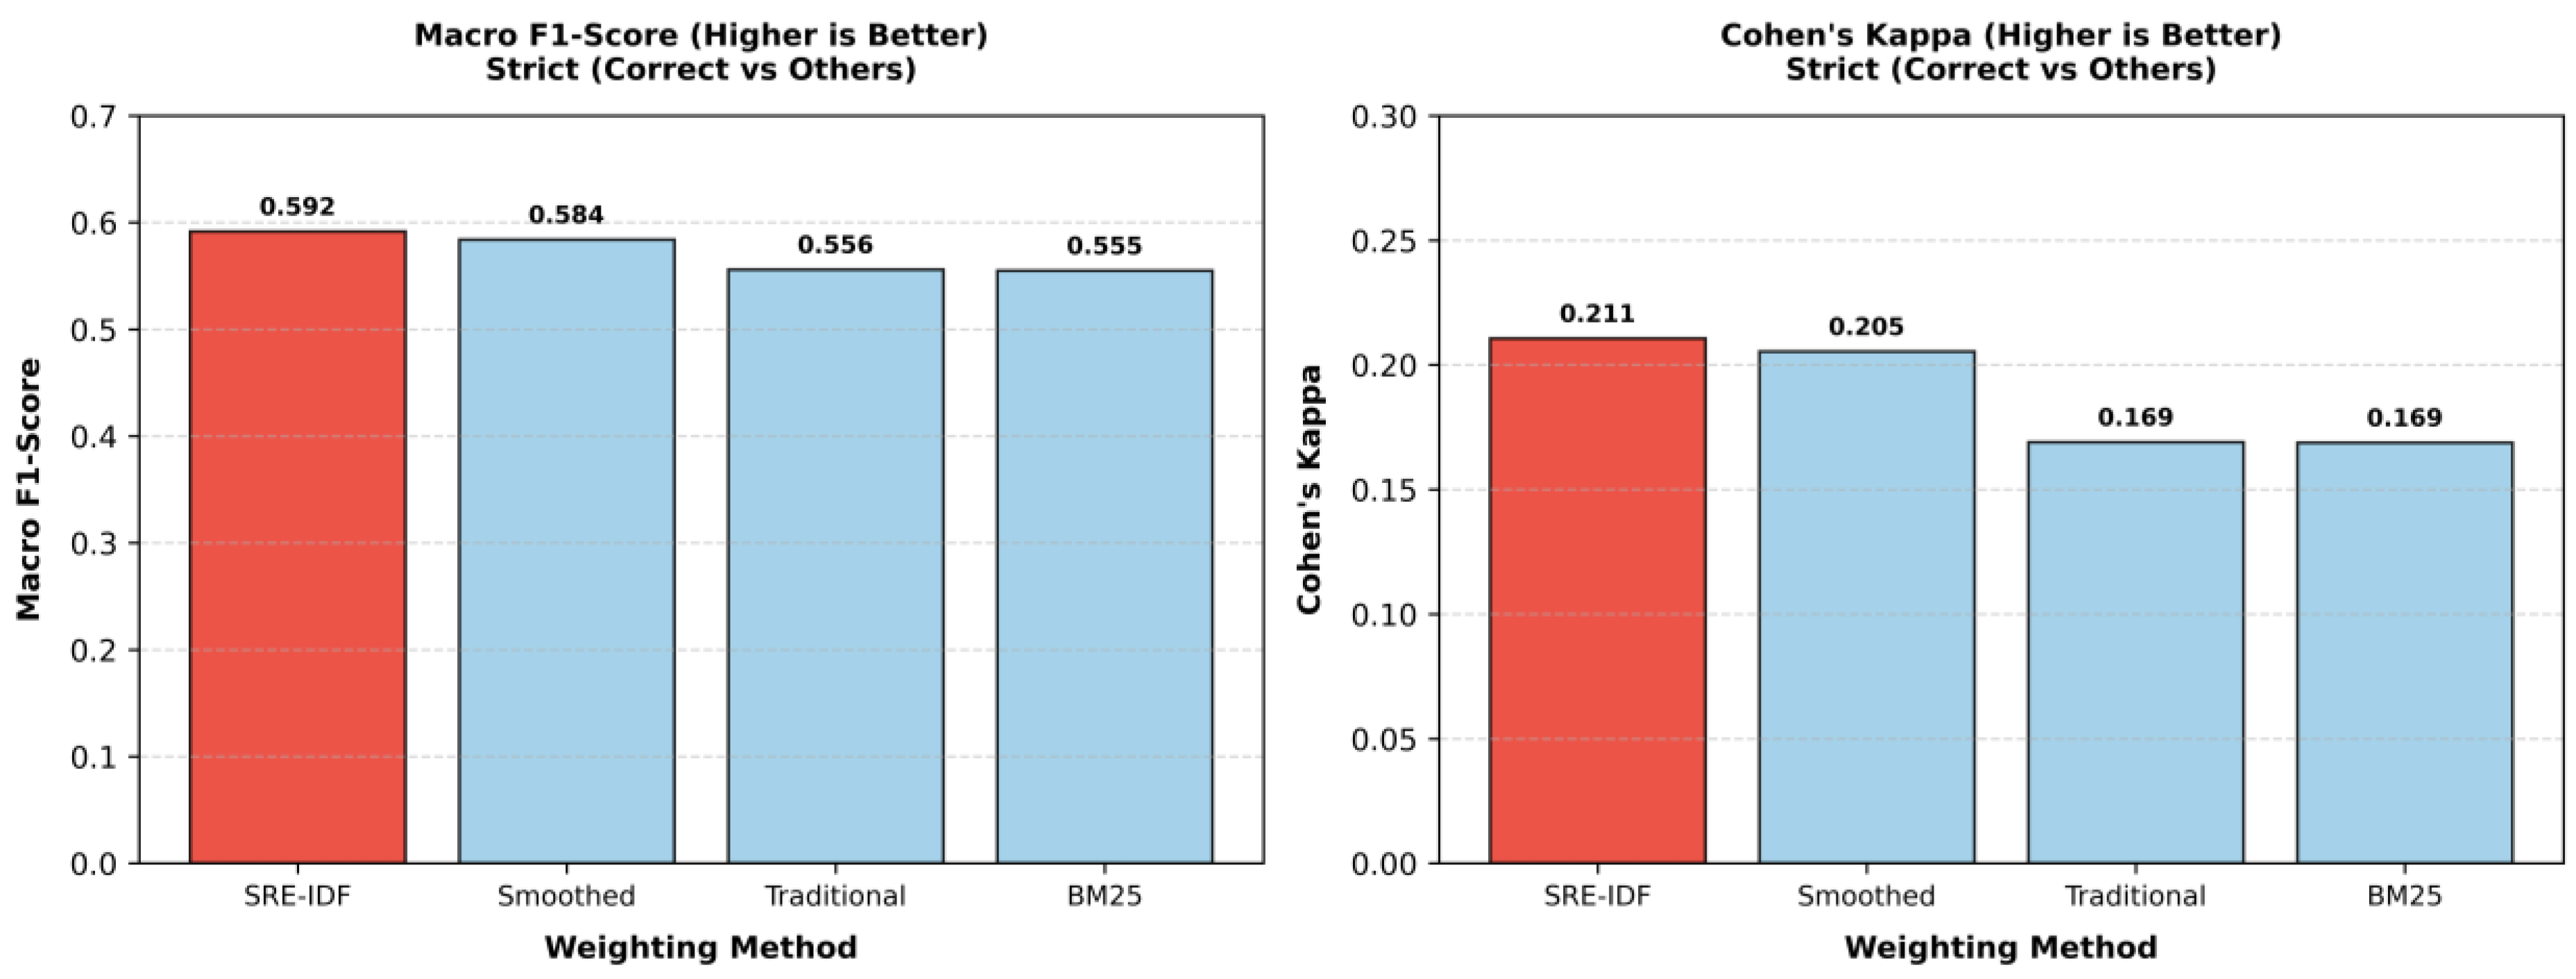
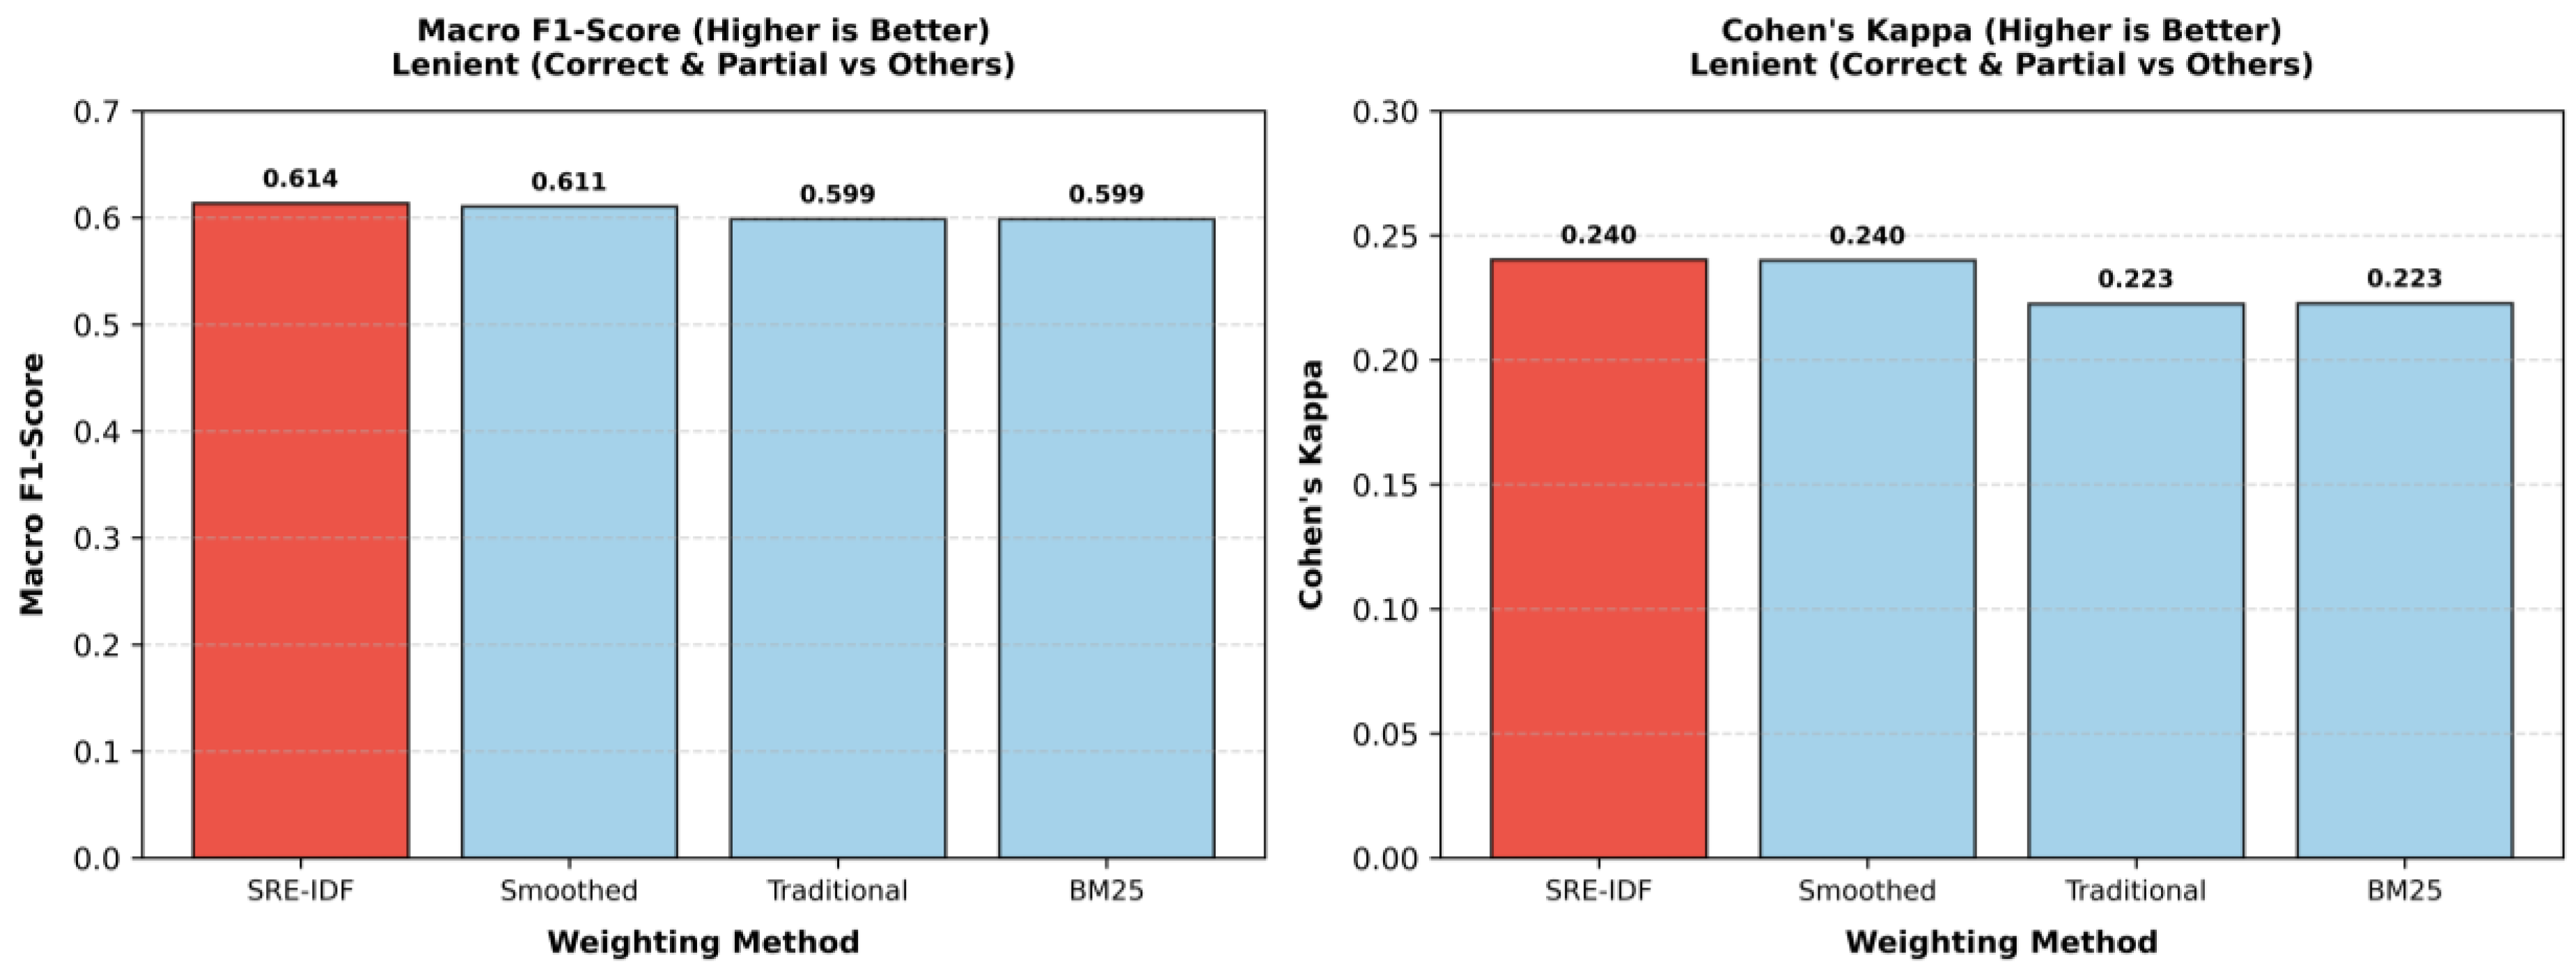
The SRE-IDF achieved the best overall performance under the strict setting, with a Macro F1-score of 0.592 and Cohen’s kappa value of 0.211. The Smoothed IDF ranked second, with scores of 0.584 and 0.205, respectively. Traditional IDF and BM25 also had comparable performance with SRE-IDF, with Macro F1-scores of 0.556 and 0.555, respectively, and a similar Cohen’s kappa value of 0.169. Figure 7 and Figure 8 present the comparative performance of the SRE-IDF against the three baseline methods under the Strict and Lenient evaluation settings, respectively.
Under the Lenient setting, SRE-IDF again obtained the highest Macro F1-score of 0.614, whereas Smoothed IDF obtained a closely comparable score of 0.611. Both the Traditional IDF and BM25 obtained the same Macro F1-scores of 0.599. SRE-IDF and Smoothed IDF obtained the highest Cohen’s kappa values of 0.240. Both the traditional IDF and BM25 obtained a value of 0.223.
To confirm these results, a statistical significance analysis was performed. Table 2 and Table 3 present the results for strict and lenient mappings, respectively. SRE-IDF outperformed Traditional IDF and BM25 under both evaluation settings (p < 0.001). The mean differences and 95% confidence intervals that excluded zero were positive. This confirms the reliability of these improvements in the proposed method. No statistically significant difference was observed between the SRE-IDF and Smoothed IDF (p > 0.05). The mean differences were negative, and the 95% confidence intervals included zero. This indicates a comparable performance between the two methods. The observed effect sizes were small (d < 0.2). SRE-IDF consistently outperformed Traditional IDF and BM25 while maintaining performance comparable to that of Smoothed IDF across different evaluation settings.

5.3. Results on the ASAG2024 Dataset

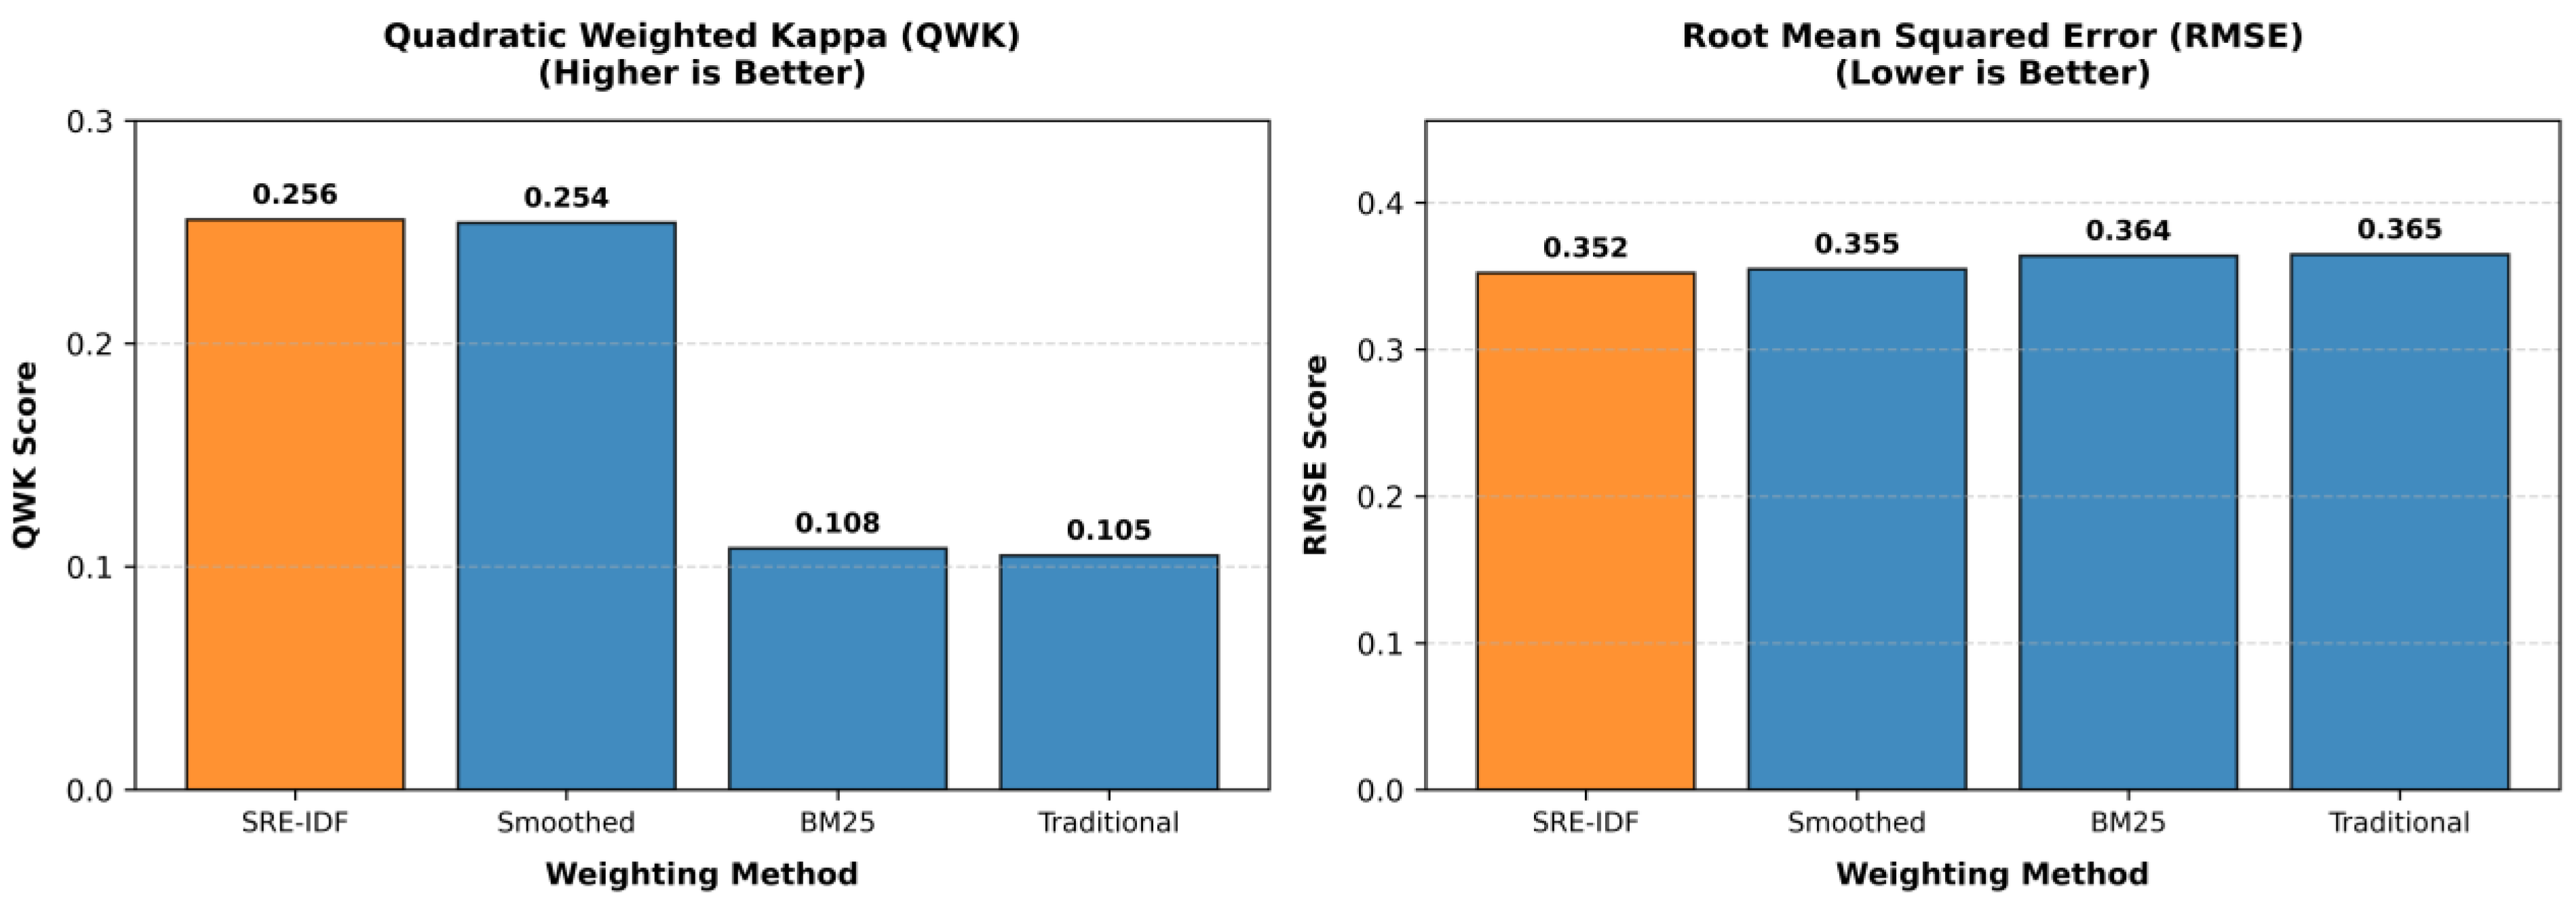
The SRE-IDF achieved the highest QWK score of 0.256, followed by Smoothed IDF (0.254), BM25 (0.108), and Traditional IDF (0.105). SRE-IDF also obtained the lowest RMSE value of 0.352, outperforming Smoothed IDF (0.355), BM25 (0.364), and Traditional IDF (0.365). Figure 9 shows the performance comparison of SRE-IDF with Traditional IDF, Smoothed IDF, and BM25 on the ASAG2024 dataset.
To verify these results, a statistical significance analysis was conducted, and the results are presented in Table 4. The comparisons between SRE-IDF and both the Traditional IDF and BM25 baselines yielded p-values below 0.001, indicating statistically significant improvements in performance. The corresponding positive mean differences and confidence intervals that exclude zero further confirm the proposed method’s superiority over these baselines. In contrast, the comparison with the Smoothed IDF produced a marginally significant difference (p = 0.0410), with a very small effect size (d = −0.0484), indicating that the performances of the two methods are highly comparable. The largest improvements were observed over the Traditional IDF (d = 0.2000) and BM25 (d = 0.1839). Overall, the effect sizes were small, suggesting that the proposed SRE-IDF provides consistent performance gains while remaining competitive with the strongest baseline on the ASAG2024 dataset.

5.4. Comparison with a Frozen Semantic Baseline

To position SRE-IDF relative to transformer-based semantic methods, we compared it with a frozen, pretrained SBERT model using mean-pooled sentence embeddings and cosine similarity, with no IDF weighting or fine-tuning applied. All experiments were conducted on a CPU (Intel Core i3) to reflect realistic deployment conditions in resource-constrained educational settings.
SRE-IDF requires O (1) computation per term, using only a pre-computed document-frequency count with no learned parameters, and O(k) per document for a document containing k terms, in contrast to the O(n2) self-attention cost of transformer-based encoders such as SBERT. The empirical runtime and memory measurements below quantify this theoretical advantage in practice.
Four measures characterize the accuracy-efficiency trade-off between the two methods. Inference Time per pair is the average time required to compute a single similarity score between one student response and its reference answer. Pipeline Time per question is the total time to score all student responses for a single question against its reference answer. Memory Used is the peak memory consumption during the scoring. All three were measured over five independent runs and are reported as mean ± standard deviation to account for run-to-run variance.
Because Mohler and ASAG2024 involve continuous grading rather than discrete classification, an additional exact-match accuracy metric was computed for these two datasets by rescaling the predicted and human scores to the original grading range, rounding to the nearest valid integer grade, and measuring the proportion of responses where the predicted grade exactly matched the human-assigned grade. For SciEntsBank, Accuracy follows its standard binary classification definition under the Strict and Lenient mapping schemes. For ASAG2024, the exact-match accuracy uses the standardized 0–5 scale defined in Section 4.1 The comparison results between the proposed SRE-IDF and Frozen SBERT on different datasets are shown in Table 5, Table 6, Table 7 and Table 8.
A comparison with Frozen SBERT demonstrates the trade-off between semantic modeling capability and computational efficiency. Although Frozen SBERT achieves slightly higher predictive performance on several benchmarks, the proposed SRE-IDF remains competitive and offers substantial practical advantages in terms of inference speed, memory footprint, and interpretability. The SRE-IDF consistently required two to three orders of magnitude fewer computational resources while maintaining comparable grading performance across all datasets. These results suggest that SRE-IDF constitutes an attractive lightweight alternative for resource-constrained and explainable ASAG systems.
In addition to its computational advantages, the SRE-IDF offers greater interpretability. Its similarity scores are directly decomposed into per-term contributions. These contributions can be traced to document frequency statistics. In contrast, the SBERT similarity arises from a dense embedding space. It has no direct correspondence with individual words. This transparency is particularly relevant for instructor-facing grading tools, where the ability to explain a score can be as important as the score itself.

6. Conclusions

This study presents a novel SRE-IDF method for an automated answer grading system. This method suppresses boilerplate terms more aggressively. It keeps all weights strictly bounded within [ e 1 ,1], eliminating rare-term dominance without any parameter tuning. Integration requires no architectural changes, except for replacing the IDF component in an existing pipeline. The proposed SRE-IDF was evaluated using three benchmark ASAG datasets. The experimental results confirmed that SRE-IDF consistently outperformed Traditional IDF, BM25, and Smoothed IDF on the Mohler datasets. On the SciEntsBank and ASAG2024 datasets, SRE-IDF outperformed Traditional IDF and BM25 while achieving performance comparable to Smoothed IDF. Statistical significance analysis confirmed that the observed improvements were reliable across the evaluated datasets ( p < 0.001 ), except for the comparison with Smoothed IDF on the SciEntsBank and ASAG2024 dataset, where no significant difference was observed. Compared with the Frozen SBERT baseline, SRE-IDF achieved competitive but not uniformly superior predictive performance, with frozen SBERT showing slightly higher accuracy-related metrics on several benchmarks; however, SRE-IDF provided substantial advantages in computational efficiency and interpretability. Overall, these results indicate that SRE-IDF is an effective weighting mechanism for automated short-answer grading and provides robust performance across heterogeneous, multi-domain, and fine-grained evaluation settings.
Although the observed effect sizes were small (Cohen’s d ranging from 0.05 to 0.29), several factors support the practical value of these gains. The improvements were consistent in direction across nearly all comparisons and datasets, with confidence intervals excluding zero, indicating a dependable rather than incidental advantage. Furthermore, SRE-IDF requires no parameter tuning, incurs no additional computational cost, and requires no changes to existing grading pipelines beyond replacing the IDF term. Given this negligible adoption cost, even modest improvements in agreement with human grading translate into practical value for instructors, particularly for answers containing boilerplate language, where the largest gains were observed in this study.
Although SRE-IDF demonstrated consistent improvements across the evaluated datasets, all experiments were conducted on English-language short-answer corpora. Therefore, the effectiveness of the SRE-IDF in multilingual and cross-lingual grading scenarios remains an open research question. SRE-IDF was evaluated within a cosine similarity-based grading framework and may require further validation in other NLP applications. Future work will investigate the integration of SRE-IDF with semantic embedding and transformer-based models to cover both lexical and semantic meanings of sentences. In addition, its applicability to multilingual short-answer grading, information retrieval, text classification, and document ranking tasks was investigated.

Author Contributions

Conceptualization, S.R. and A.P.J.; methodology, S.R. and A.P.J.; software, S.R.; validation, S.R. and A.P.J.; formal analysis, S.R. and A.P.J.; investigation, S.R.; resources, A.P.J.; data curation, S.R.; writing—original draft preparation, S.R.; writing—review and editing, A.P.J. and S.R.; visualization, S.R.; supervision, A.P.J.; project administration, A.P.J. All authors have read and agreed to the published version of the manuscript.

Funding

This research did not receive any external funding.

Institutional Review Board Statement

Not applicable.

Informed Consent Statement

Not applicable.

Data Availability Statement

The ASAG2024, SciEntsBank, and MohlerASAG datasets used in this study are publicly available through the Hugging Face Hub. The implementation code for the proposed SRE-IDF approach is publicly available in the Zenodo repository [32].

Acknowledgments

The authors gratefully acknowledge the infrastructure support provided by the Vellore Institute of Technology, Vellore, India, which played a pivotal role in the successful completion and publication of this research.

Conflicts of Interest

The authors declare no conflict of interest.

References

  1. Lai, P.; Zhang, K.; Lin, Y.; Zhang, L.; Ye, F.; Yan, J.; Xu, Y.; He, C.; Zhang, W.; Wang, Y.; et al. SAS-bench: A fine-grained benchmark for evaluating short answer scoring with large language models. Neural Netw. 2026, 203, 2026. [Google Scholar] [CrossRef]
  2. Filighera, A.; Steuer, T.; Rensing, C. Fooling automatic short answer grading systems. In Artificial Intelligence in Education; Bittencourt, I.I., Cukurova, M., Muldner, K., Luckin, R., Millán, E., Eds.; Springer: Cham, Switzerland, 2020; pp. 177–190. [Google Scholar]
  3. Navarro, L.C.; Mucciaccia, S.S.; Mutz, F.; De Souza, A.F.; Oliveira-Santos, T. Exploring question answering: Metric analysis and evaluation framework for enhanced interpretability. Neural Comput. Appl. 2026, 38, 303. [Google Scholar] [CrossRef]
  4. Kanimozhi, S.; Selvamani, K.; Dhaygude, A.D.; Talasila, V. OptBerConvoNet: A framework based on BERT and optimized deep convolutional neural network for multilingual question answering. Knowl. Inf. Syst. 2026, 68, 164. [Google Scholar] [CrossRef]
  5. Lakshmi, P.S.; Simha, J.B.; Ranjan, R. IntelliGrader: A framework for automatic short answer grading, inconsistency check and feedback in educational context—Conception, implementation and evaluation. Karbala Int. J. Mod. Sci. 2024, 10, 449–461. [Google Scholar] [CrossRef]
  6. Su, Z.; Shen, J.; Zhou, Q.; Yong, B. Deep-learning-empowered detection of large-language-model-based generative content in educational tasks. IEEE Trans. Learn. Technol. 2025, 18, 1036–1047. [Google Scholar] [CrossRef]
  7. Robertson, S.E.; Zaragoza, H. The probabilistic relevance framework: BM25 and beyond. Found. Trends Inf. Retr. 2009, 3, 333–389. [Google Scholar] [CrossRef]
  8. Kadhim, A.I. Term weighting for feature extraction on Twitter: A comparison between BM25 and TF-IDF. In Proceedings of the 2019 International Conference on Advanced Science and Engineering (ICOASE), Zakho–Duhok, Iraq, 2–4 April 2019; pp. 124–128. [Google Scholar] [CrossRef]
  9. Leacock, C.; Chodorow, M. C-rater: Automated scoring of short-answer questions. Comput. Humanit. 2003, 37, 389–405. [Google Scholar] [CrossRef]
  10. Gomaa, W.H.; Fahmy, A.A. A survey of text similarity approaches. Int. J. Comput. Appl. 2013, 68, 13–18. [Google Scholar] [CrossRef]
  11. Tulu, C.N.; Ozkaya, O.; Orhan, U. Automatic short answer grading with SemSpace sense vectors and MaLSTM. IEEE Access 2021, 9, 19270–19280. [Google Scholar] [CrossRef]
  12. Mohler, M.; Mihalcea, R. Text-to-text semantic similarity for automatic short answer grading. In Proceedings of the 12th Conference of the European Chapter of the Association for Computational Linguistics (EACL), Athens, Greece, 30 March–3 April 2009; pp. 567–575. [Google Scholar]
  13. Mohler, M.; Bunescu, R.; Mihalcea, R. Learning to grade short answer questions using semantic similarity measures and dependency graph alignments. In Proceedings of the 49th Annual Meeting of the Association for Computational Linguistics (ACL), Portland, OR, USA, 19–24 June 2011; pp. 752–762. [Google Scholar]
  14. Robertson, S.E.; Walker, S.; Jones, S.; Hancock-Beaulieu, M.; Gatford, M. Okapi at TREC-3. In Proceedings of the Third Text Retrieval Conference (TREC-3), Gaithersburg, MD, USA, 2–4 November 1994; NIST Special Publication 500-225. pp. 109–126. [Google Scholar]
  15. Kadhim, A.I. Survey on supervised machine learning techniques for automatic text classification. Artif. Intell. Rev. 2019, 52, 273–292. [Google Scholar] [CrossRef]
  16. Kaya, M.; Cicekli, I. A hybrid approach for automated short answer grading. IEEE Access 2024, 12, 96332–96341. [Google Scholar] [CrossRef]
  17. del Gobbo, E.; Guarino, A.; Cafarelli, B.; Grilli, L. GradeAid: A framework for automatic short answers grading in educational contexts. Knowl. Inf. Syst. 2023, 65, 4295–4334. [Google Scholar] [CrossRef] [PubMed]
  18. Julius, O.; Verkijika, S.F.; Obagbuwa, I.C. Hybrid semantic–syntactic NLP framework for intelligent grading of short answers and cloze questions. Appl. Sci. 2026, 16, 3191. [Google Scholar] [CrossRef]
  19. Doi, K.; Sudoh, K.; Nakamura, S. Automated essay scoring using grammatical variety and errors with multi-task learning and item response theory. arXiv 2024, arXiv:2406.08817. [Google Scholar]
  20. Sahu, A.; Bhowmick, P.K. Feature engineering and ensemble-based approach for improving automatic short-answer grading performance. IEEE Trans. Learn. Technol. 2020, 13, 77–90. [Google Scholar] [CrossRef]
  21. Divya, A.; Haridas, V.; Narayanan, J. Automation of short answer grading techniques. In Proceedings of the 2023 Fifth International Conference on Electrical, Computer and Communication Technologies (ICECCT), Erode, India, 22–24 February 2023; pp. 1–6. [Google Scholar]
  22. Aggarwal, D.; Bhattacharyya, P.; Raman, B. ‘I understand why I got this grade’: Automatic short answer grading with feedback. arXiv 2024, arXiv:2407.12818. [Google Scholar]
  23. Lakshmi, P.S.; Simha, J.B.; Ranjan, R. Empowering educators: Automated short answer grading with inconsistency check and feedback integration using machine learning. SN Comput. Sci. 2024, 5, 653. [Google Scholar] [CrossRef]
  24. Mikolov, T.; Sutskever, I.; Chen, K.; Corrado, G.; Dean, J. Distributed representations of words and phrases and their compositionality. In Proceedings of the 26th International Conference on Neural Information Processing Systems (NeurIPS), Lake Tahoe, NV, USA, 5–8 December 2013; Volume 2, pp. 3111–3119. [Google Scholar]
  25. Pennington, J.; Socher, R.; Manning, C.D. GloVe: Global vectors for word representation. In Proceedings of the 2014 Conference on Empirical Methods in Natural Language Processing (EMNLP), Doha, Qatar, 25–29 October 2014; pp. 1532–1543. [Google Scholar] [CrossRef]
  26. Devlin, J.; Chang, M.-W.; Lee, K.; Toutanova, K. BERT: Pre-training of deep bidirectional transformers for language understanding. In Proceedings of the 2019 Conference of the North American Chapter of the Association for Computational Linguistics: Human Language Technologies (NAACL-HLT), Minneapolis, MN, USA, 2–7 June 2019; pp. 4171–4186. [Google Scholar] [CrossRef]
  27. Reimers, N.; Gurevych, I. Sentence-BERT: Sentence embeddings using siamese BERT-networks. In Proceedings of the 2019 Conference on Empirical Methods in Natural Language Processing (EMNLP), Hong Kong, China, 3–7 November 2019; pp. 3982–3992. [Google Scholar] [CrossRef]
  28. Akhilesh, P.; Krishna, A.K.; Bharadwaj, S.K.; Venugopalan, M. Automated short answer grading with word embedding-based semantic similarity using PySpark. In Proceedings of the 2024 IEEE Recent Advances in Intelligent Computational Systems (RAICS), Kothamangalam, Kerala, India, 16–18 May 2024; pp. 1–6. [Google Scholar] [CrossRef]
  29. Condor, A.; Litster, M.; Pardos, Z.A. Automatic short answer grading with SBERT on out-of-sample questions. In Proceedings of the 14th International Conference on Educational Data Mining (EDM), Paris, France, 29 June–2 July 2021. [Google Scholar]
  30. Jones, K.S. A statistical interpretation of term specificity and its application in retrieval. J. Doc. 1972, 28, 11–21. [Google Scholar] [CrossRef]
  31. Paik, J.H. A novel TF-IDF weighting scheme for effective ranking. In Proceedings of the 36th International ACM SIGIR Conference on Research and Development in Information Retrieval (SIGIR), Dublin, Ireland, 28 July–1 August 2013; pp. 343–352. [Google Scholar] [CrossRef]
  32. Raj, S.; Pandian, J.A. SRE-IDF; Zenodo: Geneva, Switzerland, 2026. [Google Scholar] [CrossRef]
Figure 1. Illustrative behavior of the proposed SRE-IDF function.
Information 17 00733 g001
Figure 2. Comparison of the exponential IDF family.
Information 17 00733 g002
Figure 3. Comparative weighting curves of the SRE-IDF with three baseline methods.
Information 17 00733 g003
Figure 4. Grading workflow of the SRE-IDF system.
Information 17 00733 g004
Figure 5. System architecture of the proposed SRE-IDF grading framework.
Information 17 00733 g005
Figure 6. Performance comparison on the Mohler dataset.
Information 17 00733 g006
Figure 7. Performance comparison under the strict mapping setting.
Information 17 00733 g007
Figure 8. Performance comparison under the lenient mapping setting.
Information 17 00733 g008
Figure 9. Performance comparison on the ASAG2024 dataset.
Information 17 00733 g009
Table 1. Statistical significance results on the Mohler dataset.
ComparisonMean Difference95% CIt-Statisticp-ValueCohen’s d
SRE-IDF vs. Traditional0.0147[0.0106, 0.0188]7.1022<0.0010.2830
SRE-IDF vs. Smoothed0.0050[0.0034, 0.0067]6.0194<0.0010.2398
SRE-IDF vs. BM250.0150[0.0109, 0.0191]7.2021<0.0010.2869
Table 2. Statistical significance results for strict mapping.
ComparisonMean Difference95% CIt-Statisticp-ValueCohen’s d
SRE-IDF vs. Traditional0.0083[0.0060, 0.0106]7.0773<0.0010.1004
SRE-IDF vs. Smoothed−0.0010[−0.0020, 0.0001]−1.82630.0678−0.0259
SRE-IDF vs. BM250.0085[0.0062, 0.0108]7.1712<0.0010.1017
Table 3. Statistical significance results for lenient mapping.
ComparisonMean Difference95% CIt-Statisticp-ValueCohen’s d
SRE-IDF vs. Traditional0.0043[0.0021, 0.0065]3.7946<0.0010.0538
SRE-IDF vs. Smoothed−0.0005[−0.0015, 0.0005]−0.98060.3268−0.0139
SRE-IDF vs. BM250.0043[0.0020, 0.0065]3.7264<0.0010.0529
Table 4. Statistical significance results on the ASAG2024 dataset.
ComparisonMean Difference95% CIt-Statisticp-ValueCohen’s d
SRE-IDF vs. Traditional0.0165[0.0127, 0.0203]8.4553<0.0010.2000
SRE-IDF vs. Smoothed−0.0017[−0.0033, −0.0001]−2.04480.0410−0.0484
SRE-IDF vs. BM250.0147[0.0110, 0.0184]7.7755<0.0010.1839
Table 5. Comparison on Mohler dataset.
MethodPearson CorrelationQWKAccuracyInference Time/Pair (ms)Pipeline Time/Question (ms)Memory Used (MB)
SRE-IDF0.45920.28330.40160.0367 ± 0.00291.1001 ± 0.08681.25 ± 0.20
Frozen SBERT0.47490.35930.419019.4133 ± 2.1984582.3991 ± 65.9520111.51 ± 29.47
Table 6. Comparison on SciEntsBank (strict setting).
MethodMacro F1Cohen’s KappaAccuracyInference Time/Pair (ms)Pipeline Time/Question (ms)Memory Used (MB)
SRE-IDF0.59170.21060.64600.0551 ± 0.00392.0297 ± 0.14362.29 ± 0.44
Frozen SBERT0.60590.22220.64186.7832 ± 0.7026249.6711 ± 25.862472.98 ± 28.39
Table 7. Comparison on SciEntsBank (lenient setting).
MethodMacro F1Cohen’s KappaAccuracyInference Time/Pair (ms)Pipeline Time/Question (ms)Memory Used (MB)
SRE-IDF0.61360.24030.63110.0551 ± 0.00392.0297 ± 0.14362.29 ± 0.44
Frozen SBERT0.64240.28850.66876.7832 ± 0.7026249.6711 ± 25.862472.98 ± 28.39
Table 8. Comparison on ASAG2024 dataset.
MethodQWKRMSEAccuracyInference Time/Pair (ms)Pipeline Time/Question (ms)Memory Used (MB)
SRE-IDF0.25560.35210.18220.1460 ± 0.03485.7035 ± 1.36050.59 ± 1.18
Frozen SBERT0.31450.33910.183130.4240 ± 0.37871188.6640 ± 14.7958153.41 ± 0.34
Disclaimer/Publisher’s Note: The statements, opinions and data contained in all publications are solely those of the individual author(s) and contributor(s) and not of MDPI and/or the editor(s). MDPI and/or the editor(s) disclaim responsibility for any injury to people or property resulting from any ideas, methods, instructions or products referred to in the content.