Article

Predicting Academic Award Recognition Across Disciplines Using Publication-Based Bibliometric Indices and SHAP-Driven Explainability

by
Muhammad Shaban Qabil
1,
Hafiza Zarafshan Mukhtiar
2,
Ghulam Mustafa
1,*,
Muhammad Tanvir Afzal
3,
Isabel De la Torre Díez
4,
Elizabeth Caro Montero
5,6,7,8 and
Mirtha Silvana Garat de Marin
5,6,7,8
1
Department of Computer Science, Shifa Tameer-e-Millat University, Islamabad 44000, Pakistan
2
Department of Computer Science, Air University, Kamra 43570, Pakistan
3
Department of Computing and Data Science, GISMA University of Applied Sciences, 14469 Potsdam, Germany
4
eHealth and Telemedicine Group, University of Valladolid, 47011 Valladolid, Spain
5
Department of Projects, Universidad Europea del Atlántico, Isabel Torres 21, 39011 Santander, Spain
6
Department of Projects, Universidad Internacional Iberoamericana, Campeche 24560, Mexico
7
Department of Projects, Universidad Internacional Iberoamericana, Arecibo, PR 00613, USA
8
Department of Projects, Universidade Internacional do Cuanza, Cuito EN250, Bié Province, Angola
*
Author to whom correspondence should be addressed.
Information 2026, 17(6), 515; https://doi.org/10.3390/info17060515
Submission received: 4 March 2026 / Revised: 9 April 2026 / Accepted: 20 May 2026 / Published: 22 May 2026

Abstract

Researcher evaluation underpins critical academic decisions, yet traditional bibliometric indicators lack predictive capability and cross-domain generalizability, while most predictive approaches offer limited interpretability and narrow domain validation. This study proposes a SHAP interpretable, multi-domain supervised learning framework for predicting academic award recognition using thirty two publication count-based bibliometric indices. A balanced dataset was constructed across four disciplines, namely Computer Science, Neuroscience, Mathematics, and Civil Engineering, comprising verified awardees from recognized professional societies and matched non-awardee researchers. Eight classifiers were evaluated under stratified five fold cross validation, assessed via accuracy, precision, recall, F1-score, and ROC AUC. The framework achieved domain-specific F1-scores of 0.70 in Computer Science, 0.73 in Neuroscience, 0.72 in Civil Engineering, and 0.78 in Mathematics, with SVM and XGBoost demonstrating the strongest cross-domain robustness across disciplines. SHAP analysis consistently identified normalized h index, h2 family, q2 index, and g index as dominant cross-domain predictors, while domain-specific indicators, including Rm and w indices in Neuroscience and P index in Civil Engineering, reflected disciplinary recognition patterns. By unifying publication-based feature engineering, multi-domain classification, and SHAP explainability within a single reproducible pipeline, this framework offers a scalable, transparent, and evidence-based tool for institutional researcher evaluation.

1. Introduction

The evaluation of researchers is a central concern in academia and scientometrics because it directly influences recruitment, promotion, tenure, research funding, and the conferral of prestigious awards [1,2,3]. Universities, funding agencies, and professional societies therefore require assessment mechanisms that remain reliable and equitable across heterogeneous research profiles. Traditional evaluation practices rely heavily on bibliometric indicators such as publication counts and citation totals [4]. Although these measures are easy to compute and broadly available, they provide an incomplete representation of scholarly impact. In particular, primitive metrics can overemphasize quantity or popularity and fail to account for citation distribution, sustained influence, and disciplinary variation [5,6].
Over the past two decades, many indices have been introduced to address these limitations. The h-index proposed by Hirsch [7] remains one of the most influential because it combines productivity and citation impact into a single measure. Several extensions were subsequently developed to better capture citation distribution and to distinguish researchers with similar h-scores but different influence profiles, including the g-index [8], the A-index [9], and the R-index [9]. Additional refinements incorporated temporal normalization (e.g., m-quotient, hc-index, AWCR) and author contribution adjustments (e.g., hf-index, hi-index, fractional h-index, gm-index) [10,11,12,13]. More recently, composite and multi-dimensional indices have been proposed to integrate multiple bibliometric signals into unified evaluation frameworks [14].
Despite these advances, three critical gaps remain unresolved. First, most indices are validated using narrow or domain-specific datasets, limiting generalizability across heterogeneous disciplines. Second, comparative studies predominantly rely on descriptive statistics or incremental metric variants, which cannot capture complex nonlinear relationships among bibliometric features. Third, and most importantly, existing predictive approaches, including those employing machine learning, rarely explain which bibliometric factors drive predicted outcomes, undermining trust and impeding adoption in institutional settings. No prior study has simultaneously addressed all three gaps within a unified, cross-domain, explainable framework.
Before describing the proposed framework, it is important to clarify the scientific rationale for using awards as evaluation targets. Awards conferred by established professional societies represent community-validated recognition of sustained research excellence. Although award decisions involve multifactorial judgments, identifying the bibliometric patterns that statistically distinguish awardees from non-awardees provides an empirical basis for understanding which measurable dimensions of scholarly output are associated with peer recognition. This study therefore treats award status as a proxy for high-impact research distinction, rather than claiming that bibliometric indices fully explain award outcomes. Four disciplines were selected, Computer Science, Neuroscience, Mathematics, and Civil Engineering, because they represent contrasting citation cultures, publication norms, and collaboration intensities, thereby providing a rigorous basis for cross-domain evaluation. Award-winning researchers were identified from recognized professional societies and academic organizations including ACM, IEEE, the American Mathematical Society, and the American Society of Civil Engineers, ensuring publicly verifiable and reproducible ground-truth labels.
This study proposes a SHAP-interpretable, multi-domain supervised learning framework for predicting academic award recognition using publication count-based bibliometric indices. In contrast to approaches that emphasize citation-age adjustments or collaboration-network features, the proposed framework deliberately focuses on publication-based metrics that capture research productivity and remain uniformly computable across disciplines. Thirty-two such indices were computed and normalized to improve cross-domain comparability, forming the feature space for supervised classification. Eight classifiers were evaluated, including Logistic Regression, Ridge Regression, k-Nearest Neighbors, Naïve Bayes, Support Vector Machines, Decision Trees, AdaBoost, and Extreme Gradient Boosting, under stratified five-fold cross-validation. Performance was assessed using accuracy, precision, recall, F1-score, and ROC-AUC to ensure both threshold-dependent and threshold-independent evaluation. SHAP (SHapley Additive exPlanations) was applied to quantify feature contributions at both global and local levels, transforming the predictive model into an explainable decision-support mechanism.
The contributions of this study are as follows:
(i)
A unified, reproducible, multi-domain predictive framework for awardee classification that simultaneously combines thirty-two publication-based bibliometric indices, cross-domain evaluation across four disciplines, and SHAP-based explainability within a single pipeline, extending prior predictive bibliometric work [1,15] by integrating cross-domain validation and model-level interpretability within a unified and reproducible design.
(ii)
A systematic comparison of eight supervised learning algorithms across four heterogeneous disciplines, demonstrating that margin-based and ensemble methods generalize more robustly than probabilistic or single-tree approaches, advancing beyond prior single-domain evaluations that were limited to one or two classifier families.
(iii)
SHAP-driven feature attribution at both global and local levels, providing transparent evidence that normalized and balance-oriented indices, including normalized h-index variants, h 2 -type indices, q 2 -index, and g-index, which consistently distinguish awardees across domains, while domain-specific indicators reflect disciplinary recognition patterns.
(iv)
A discussion of the ethical implications of deploying bibliometric prediction frameworks in institutional evaluation contexts, including considerations of fairness, transparency, and the risk of metric gaming, alongside a prior sensitivity analysis demonstrating the importance of evaluating framework performance under realistic class priors before any institutional deployment.
The remainder of this paper is organized as follows. Section 2 reviews related work on bibliometric indices and predictive evaluation models. Section 3 presents the proposed methodology, including dataset construction, feature computation, normalization, model training, and interpretability analysis. Section 4 reports experimental results, cross-domain comparisons, and SHAP-based feature attribution. Section 5 concludes the study and outlines directions for future research.

2. Literature Review

Bibliometric research has evolved considerably over the past two decades, progressing from simple publication and citation counts toward composite indices, and more recently toward predictive and computational approaches. This section reviews this trajectory across four themes: traditional bibliometric indicators (Section 2.1), variants and extensions of the h-index organised by conceptual category (Section 2.2), domain-specific empirical evaluations (Section 2.3), and predictive and computational approaches (Section 2.4). The review concludes with a critical analysis identifying the specific gaps that motivate the present study. Throughout, particular attention is paid to publication count-based indices, which form the feature space of the proposed framework, as distinct from citation-age-adjusted or collaboration-network-based measures that lie outside the current scope.

2.1. Traditional Bibliometric Indicators

Researcher evaluation has historically relied on primitive bibliometric measures such as publication counts and citation counts [5,16]. These indicators remain widely adopted due to their simplicity, transparency, and ease of computation. However, publication counts emphasize quantity rather than impact and may inflate scholarly profiles through low-impact outputs [17]. Citation counts, although reflective of scholarly visibility, accumulate slowly and are influenced by disciplinary citation norms and self-citation practices [7].
To address these limitations, Hirsch introduced the h-index [7], which integrates productivity and citation impact into a single measure. Despite its widespread adoption, the h-index disadvantages early-career researchers and may disproportionately reward senior academics with longer publication histories [18]. It is worth noting, however, that, analogously to the journal Impact Factor, the h-index can also be computed over a fixed time window, which partially mitigates career-length bias [7]. These limitations nonetheless motivated the development of numerous derivative metrics.

2.2. Variants and Extensions of the h-Index

Over the past two decades, more than seventy bibliometric indicators have been proposed [2]. These can be broadly organized into three conceptual categories based on what dimension of scholarly output they capture.
Productivity-based indices focus primarily on publication volume and output frequency. The h-index [7] remains the most widely adopted, while the m-quotient [19] normalizes it by career length to reduce seniority bias.
Impact-based indices capture citation intensity and distribution beyond the h-core. The g-index [8] rewards researchers whose top publications attract disproportionately high citations. The A-index and R-index [9] quantify the average and cumulative citation impact within the h-core, respectively. The e-index [20] captures excess citations ignored by the h-index, while the f-index [21] and w-index [22] offer further refinements of citation concentration.
Structural balance indices combine productivity and impact signals into composite measures. The q2-index [23] integrates the h-index and the m-quotient, while the h 2 -family of indices [24] captures the upper and lower bounds of citation structure around the h-core. These balanced metrics are particularly relevant for cross-domain evaluation because they normalize for differences in publication norms and citation cultures across disciplines [25].
Although each metric addresses specific weaknesses of the h-index, their proliferation reflects fragmentation rather than consensus. Most indices emphasize isolated performance dimensions and are validated within narrow disciplinary settings, limiting general applicability.

2.3. Domain-Specific Empirical Evaluations

Several empirical studies have examined bibliometric performance within specific domains. Van Raan [26] compared the h-index with peer judgment in chemistry research groups, while Schreiber [27,28] analyzed physicists’ citation records and demonstrated advantages of the g-index under certain conditions.
Domain-focused evaluations have also been conducted in Mathematics [18], Civil Engineering [29], and Neuroscience [4]. These studies consistently demonstrate that metric effectiveness varies across disciplines, reinforcing the absence of a universally reliable indicator and motivating multi-domain evaluation frameworks.

2.4. Predictive and Computational Approaches

Recent research has shifted from descriptive comparisons toward predictive modeling. Usman et al. [15] applied logistic regression to assess ranking parameters in civil engineering. Alshdadi et al. [1] proposed deep learning-based rules for scientific recognition, achieving prediction accuracy up to 70%, but their approach operates as a black-box system with no feature-level transparency. Mustafa et al. [13] performed systematic evaluations across multiple bibliometric categories, while Ahmed et al. [30] focused on author-count-based metrics without cross-domain validation or XAI integration.
Although these studies represent meaningful progress, three limitations persist: (i) reliance on a single data source limits reproducibility and external validity; (ii) cross-domain validation remains rare; and (iii) interpretability of predictive models is insufficient for institutional adoption. Table 1 summarizes representative contributions and highlights these gaps.

2.5. Critical Analysis and Research Gaps

The comparative analysis in Table 1 reveals a consistent pattern: as studies have progressed from single-index descriptive analysis toward multi-index predictive modeling, interpretability has not kept pace with predictive complexity. Four specific gaps motivate the present study.
First, most studies evaluate individual or closely related indices in isolation, restricting understanding of how multiple indices jointly distinguish awardees from non-awardees. While Mustafa et al. [13] and Ahmed et al. [30] represent meaningful steps toward broader feature evaluation, a comprehensive feature engineering approach covering the full spectrum of productivity-based, impact-based, and structural balance indices within a predictive classification context has not been systematically attempted.
Second, domain-specific validation remains the norm. Metrics that perform well within one discipline frequently fail to generalize, yet no prior predictive study has systematically evaluated the same feature set and the same classifiers across four heterogeneous disciplines simultaneously, limiting the cross-domain conclusions that can be drawn from existing work.
Third, while machine learning methods have been introduced, black-box models dominate. The deep learning approach of Alshdadi et al. [1], for instance, achieved competitive predictive accuracy but provides no feature-level transparency, a critical limitation for institutional adoption where accountability and fairness are required.
Fourth, and most importantly, the present study is, to our knowledge, the first to simultaneously address all three gaps by unifying publication-based bibliometric feature engineering, multi-domain classification, and SHAP-driven explainability within a single reproducible framework. This integration builds on and extends the contributions of prior predictive and descriptive bibliometric studies rather than claiming their absence.

3. Materials and Methods

This section presents the proposed interpretable machine learning framework for predicting academic award recognition using publication-based bibliometric indices. The framework is structured as a multi-stage pipeline integrating dataset construction, feature engineering, supervised classification, quantitative evaluation, and explainable analysis.
Let D = { ( x i , y i ) } i = 1 N denote the constructed dataset, where N is the total number of authors under study, x i R m represents the vector of m = 32 publication count-based indices for the i-th author, and y i { 0 , 1 } denotes the class label (0 = non-awardee, 1 = awardee). The objective is to learn a mapping function that predicts award status while preserving interpretability of feature contributions:
f : R m { 0 , 1 }
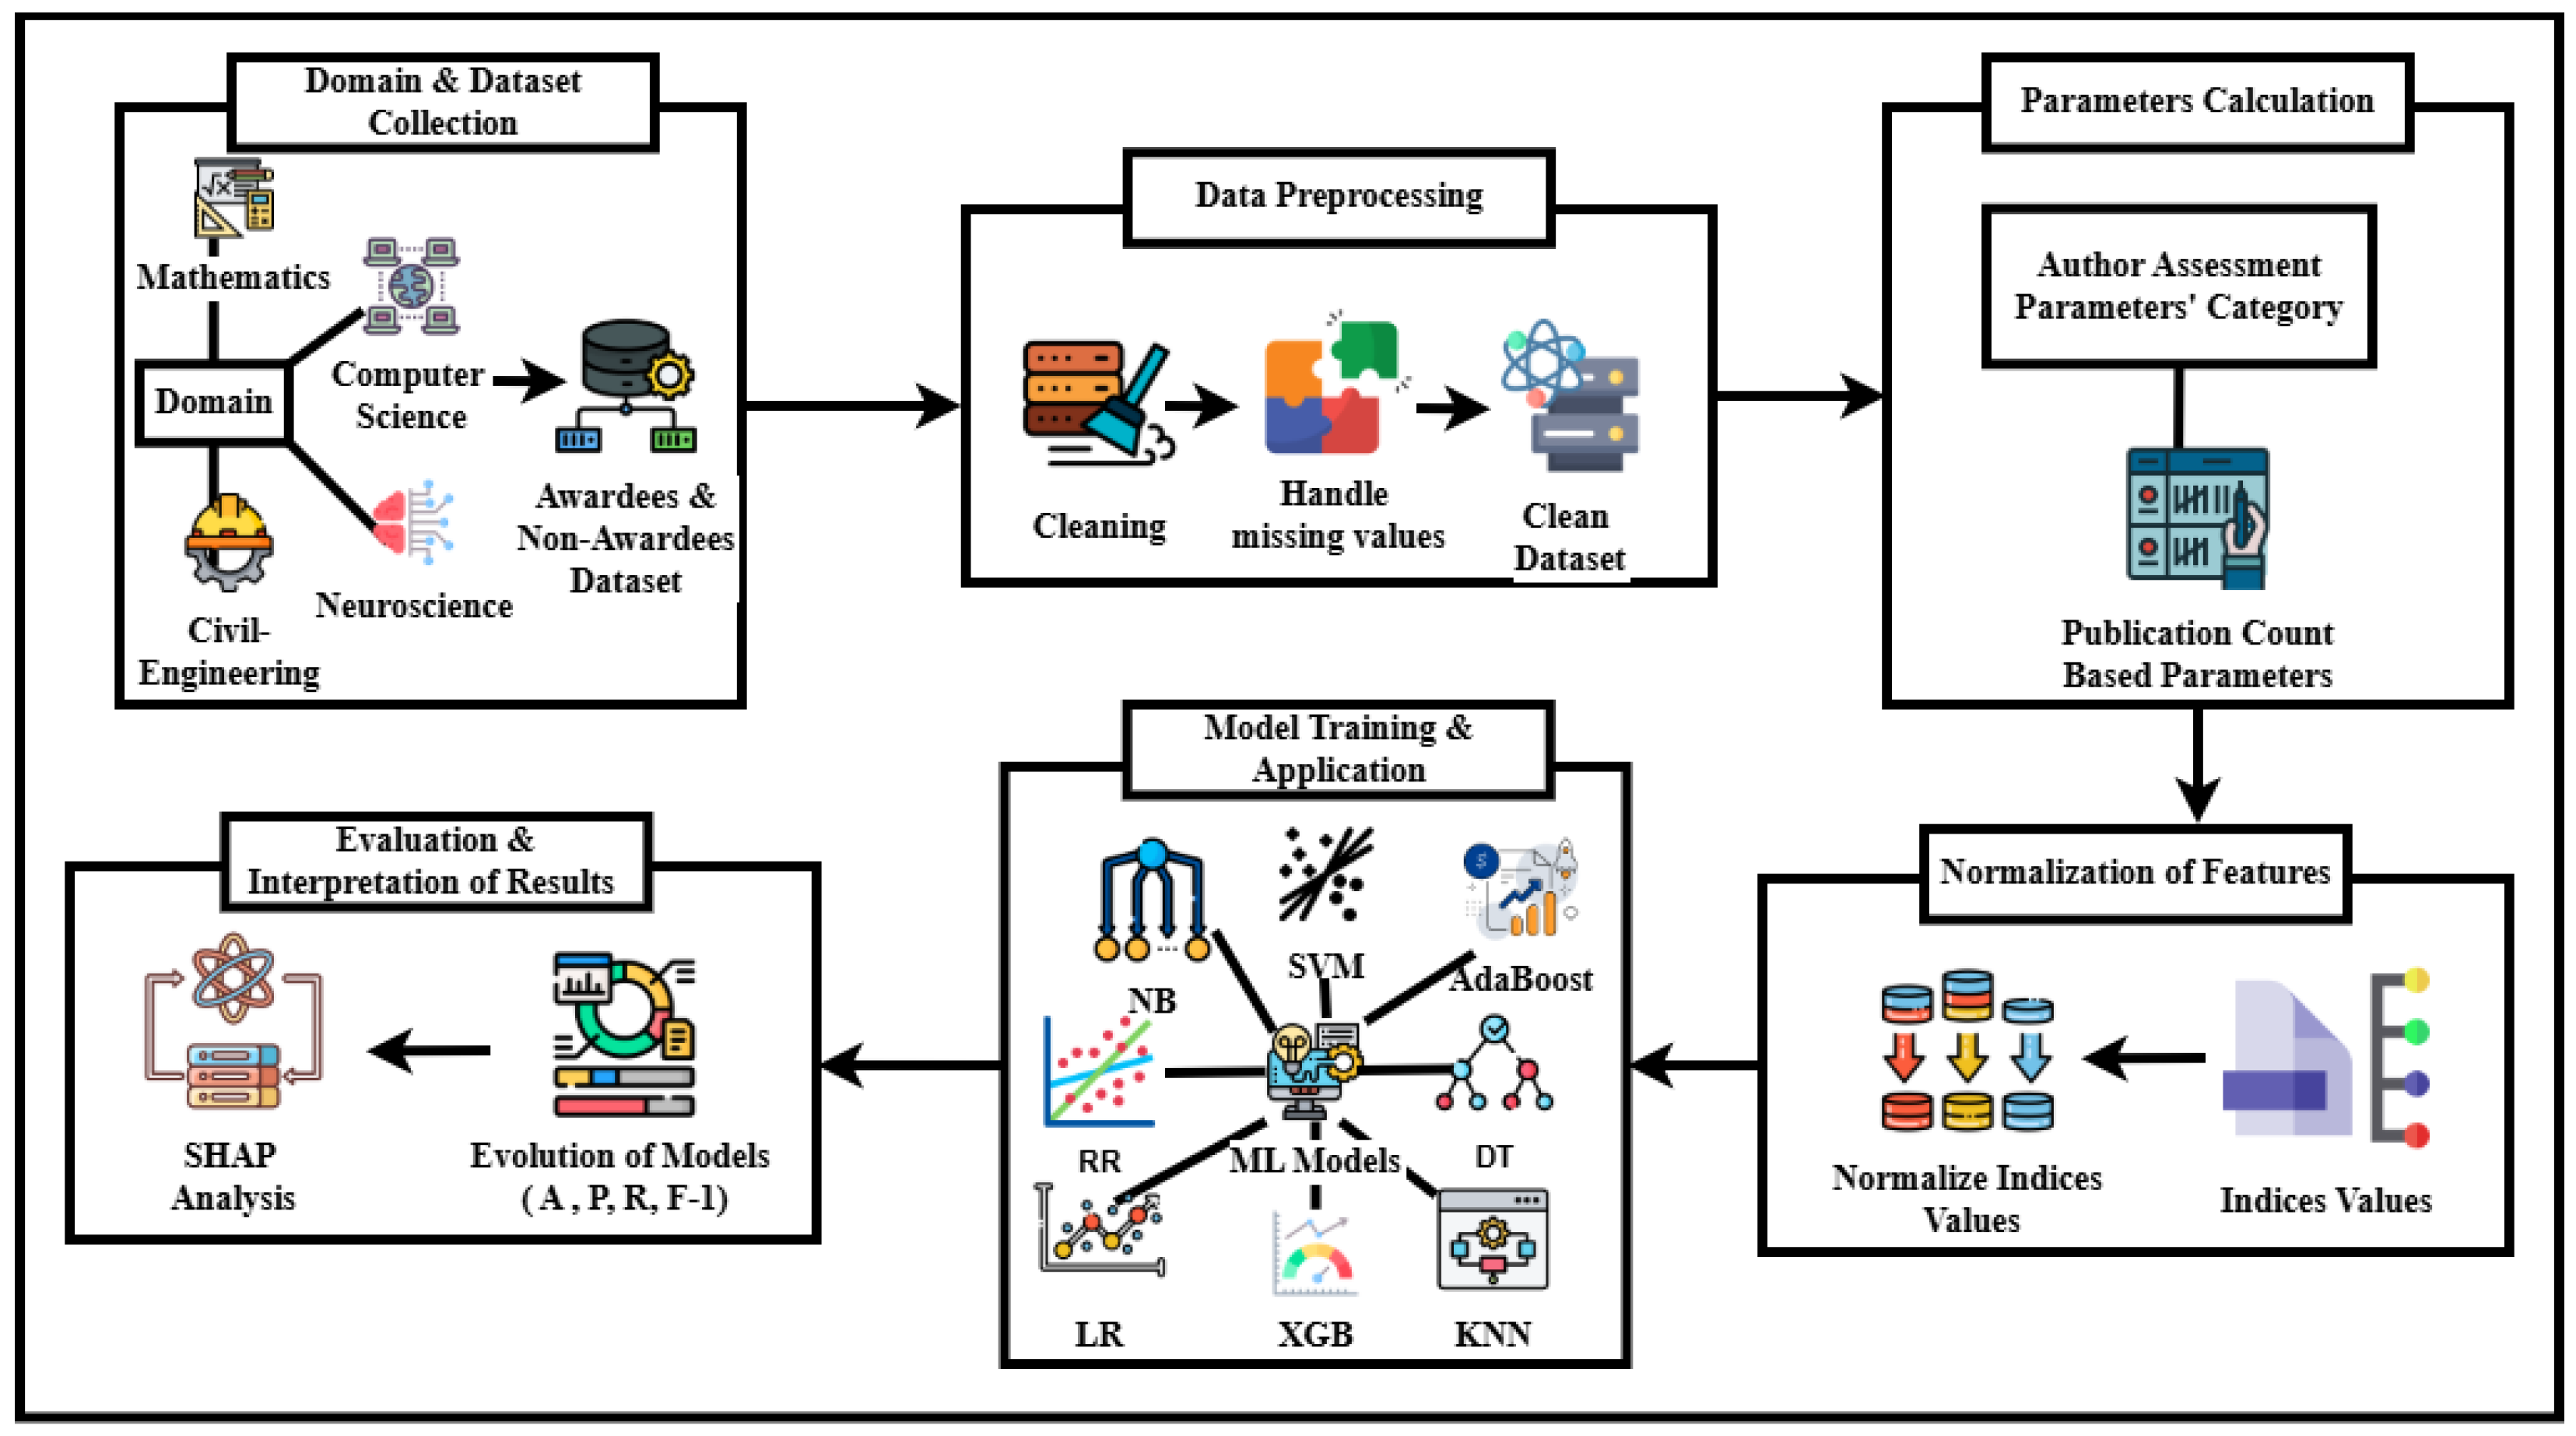
The overall architecture of the framework is illustrated in Figure 1. The workflow proceeds through six stages: (1) data acquisition, (2) preprocessing and normalization, (3) computation of bibliometric indices, (4) supervised model training, (5) performance evaluation, and (6) SHAP-based interpretability analysis. This structured design ensures reproducibility, cross-domain comparability, and transparency.

3.1. Data Collection

Four research domains were selected: Computer Science, Neuroscience, Mathematics, and Civil Engineering. These disciplines were deliberately chosen to represent contrasting citation cultures and publication norms: Computer Science and Neuroscience are characterized by high collaboration intensity and rapid citation accumulation, whereas Mathematics and Civil Engineering exhibit lower publication frequency and longer citation half-lives. This diversity provides a rigorous basis for evaluating cross-domain generalizability.

3.1.1. Awardee Identification

Award-winning researchers were identified from the official websites of recognized professional societies and academic organizations. Specifically, awardees were collected from the Association for Computing Machinery (ACM); the Institute of Electrical and Electronics Engineers (IEEE) for Computer Science; the Society for Neuroscience (SfN) for Neuroscience; the American Mathematical Society (AMS) for Mathematics; and the American Society of Civil Engineers (ASCE) for Civil Engineering. Only recipients of awards conferred between 2000 and 2023 were included, and all records were restricted to publicly verifiable award announcements to ensure transparency and reproducibility.

3.1.2. Non-Awardee Selection

Non-awardee researchers were selected from the same domains using a structured matching procedure to minimize selection bias. For each awardee, a non-awardee was identified from the same discipline with a comparable publication volume (within 20% of the awardee’s total publication count) and an active publication record spanning at least five years. This matching strategy reduces the risk that observed differences between groups reflect confounding factors such as career length or research visibility rather than true indicators of award-worthiness. Class labels were defined as:
y = 1 , if the author is an awardee , 0 , otherwise .
This balanced design mitigates class imbalance bias. Descriptive statistics comparing the two groups across key bibliometric dimensions are reported in Table 2.

3.1.3. Bibliometric Data Extraction

Bibliometric records were extracted using Publish or Perish (PoP, version 8) [32]. For each researcher, a name-based search was conducted using the Google Scholar data source within PoP, with searches restricted to the researcher’s primary discipline keywords to reduce name-ambiguity errors. The following raw attributes were retrieved for each author: total number of publications (P), total citation count, and the h-index. These three primitive attributes served as the basis for computing all thirty-two publication count-based indices described in Section 3.3. Retrieved records were exported in CSV format and manually verified: duplicate entries were identified by cross-matching titles and publication years, and ambiguous records, where author identity could not be confirmed, were excluded. It is acknowledged that reliance on a single data source (Google Scholar via PoP) represents a limitation of the present study, as Google Scholar’s coverage varies across disciplines and may introduce indexing inconsistencies. Future work should validate findings using complementary sources such as Scopus or Web of Science.

3.1.4. Dataset Composition

The resulting class distribution is summarized in Table 3.

3.2. Data Cleaning

The dataset underwent a three-stage cleaning procedure to ensure consistency and reliability prior to feature computation.

3.2.1. Duplicate Removal

Duplicate publications were detected by cross-matching titles, citation counts, and author identifiers. Redundant records were removed to prevent artificial inflation of indices.

3.2.2. Missing Value Imputation

Missing values were handled using mean imputation:
x i j imputed = x i j , if observed , μ j , if missing ,
where μ j is the mean of feature j computed across all authors in the same domain.

3.2.3. Outlier Examination

Outliers were identified using the interquartile range (IQR) criterion:
[ Q 1 1.5 × IQR , Q 3 + 1.5 × IQR ] .
Extreme but bibliometrically valid observations, for example, highly prolific researchers with unusually large publication counts, were retained after manual verification, as removing them would introduce artificial truncation of the feature space.

3.3. Computation of Publication-Based Indices

Let C k denote the citation count of the k-th publication when all publications are ranked in decreasing order of citations, P denote the total number of publications, and h denote the Hirsch index. Based on these three primitive attributes, m = 32 publication count-based indices were computed for each author, capturing three conceptual dimensions of scholarly output: productivity, citation impact, and structural balance.
Productivity-based indices quantify research output volume and normalized publication rate, including the h-index, normalized h-index ( h norm = h / P ), and P-index.
Impact-based indices capture citation intensity and distribution beyond raw counts, including the g-index, A-index, R-index, e-index, f-index, and w-index.
Structural balance indices combine productivity and impact signals into composite measures that are robust to disciplinary differences in citation norms, including the h 2 -family, q 2 -index, and h g -index.
Given that many publication-based indices are derived from the same primitive attributes (h-index, total publications P, and total citations), high inter-feature correlations are expected. A pairwise correlation analysis of the 32 indices confirms this: across all four domains, between 76 and 92 index pairs exhibit absolute Pearson correlation | r | > 0.90 , with several pairs approaching | r | 1.0 (e.g., h-index and Gh-index; R-index and weighted h-index). While this collinearity limits the reliability of coefficient-based models such as OLS regression, it does not invalidate SHAP-based attribution. SHAP computes marginal feature contributions via Shapley values averaging over all possible feature subsets rather than relying on inversion of the feature covariance matrix. As a result, SHAP values capture the unique and shared contribution of each feature to individual predictions rather than attributing all variance to a single correlated representative. For margin-based models such as SVM, L2 regularization further mitigates the instability induced by correlated features. Nevertheless, we acknowledge that in the presence of near-perfect collinearity, SHAP values for highly correlated index pairs should be interpreted as a group rather than individually, and we reflect this in our domain-specific SHAP interpretations in Section 4.4.
Representative mathematical formulations are summarized in Table 4. All indices were computed uniformly across domains to ensure comparability.

3.4. Classification Formulation

The award prediction problem is formulated as binary classification. For probabilistic classifiers, the decision rule is:
y ^ i = 1 , if P ( y i = 1 x i ) τ , 0 , otherwise ,
where τ = 0.5 is the classification threshold and P ( · ) denotes the posterior class probability. The primary evaluation metric is the F1-score:
F 1 = 2 · Precision · Recall Precision + Recall .

3.5. Model Training

The dataset was partitioned using an 80:20 stratified train–test split, preserving class proportions in both subsets. Because the dataset was constructed using a matched 1:1 design, with one non-awardee selected for each awardee, the resulting test set also reflects a balanced class distribution (approximately 50% awardees). This balanced evaluation setting is appropriate for assessing the discriminative ability of classifiers independently of class prior assumptions, and is consistent with standard practice in bibliometric classification research where matched designs are employed to avoid trivial majority-class prediction. It is acknowledged, however, that real-world academic populations contain far fewer awardees than non-awardees. The practical implications of this class imbalance for deployment under realistic priors are examined separately through a prior sensitivity analysis reported in Section 4.3. Five-fold stratified cross-validation was employed for hyperparameter tuning on the training set only, with performance on the held-out test set reported as the final evaluation. Performance was averaged across five cross-validation folds to ensure robustness.
Eight supervised learning algorithms were evaluated, selected to cover a broad spectrum of model families:
  • Linear models—Logistic Regression and Ridge Regression. Logistic Regression estimates class probabilities via a sigmoid function and is well-suited to linearly separable feature spaces. Ridge Regression (L2-regularized linear classification) is particularly effective when bibliometric features are highly correlated, as L2 regularization stabilizes coefficient estimates under multicollinearity.
  • Margin-based model—Support Vector Machines (SVMs). SVMs maximise the decision margin between classes and are well-suited to high-dimensional feature spaces with nonlinear relationships, making them appropriate for bibliometric data where index distributions overlap between awardees and non-awardees. Both linear and RBF kernels were evaluated.
  • Instance-based model—k-Nearest Neighbors (KNNs). KNN classifies instances based on the majority class among their k nearest neighbors in feature space, providing a non-parametric baseline.
  • Probabilistic model—Naïve Bayes (NB). NB applies Bayes’ theorem with feature independence assumptions, serving as a lightweight probabilistic baseline.
  • Tree-based model—Decision Trees. Decision Trees partition the feature space via recursive binary splits, offering high interpretability but susceptibility to overfitting on high-dimensional data.
  • Ensemble methods—AdaBoost and Extreme Gradient Boosting (XGBoost). Both methods combine multiple weak learners sequentially, with AdaBoost re-weighting misclassified instances and XGBoost additionally applying gradient-based optimization and regularization, making them robust to noisy bibliometric features.
Hyperparameters were optimized via grid search on the training set only, with the best configuration selected by mean cross-validation F1-score. The search spaces for each model were defined as follows. For Logistic Regression, the regularization strength was searched over C { 0.01 , 0.1 , 1 , 10 } . For Ridge Regression, the regularization parameter α { 0.01 , 0.1 , 1 , 10 } was tuned. For SVM, regularization C { 0.1 , 1 , 10 } and kernel { linear , RBF } were jointly optimized. For KNN, the number of neighbors was searched over k { 3 , 5 , 7 , 9 } . For AdaBoost, the number of estimators was searched over { 50 , 100 , 200 } and the learning rate over { 0.5 , 1.0 } . For XGBoost, tree depth { 3 , 5 , 7 } and learning rate { 0.01 , 0.1 , 0.3 } were optimized. For Decision Trees, the maximum depth was searched over { 3 , 5 , 10 , None } . Naïve Bayes has no free hyperparameters beyond its smoothing prior and was evaluated using default settings, which are appropriate given its closed-form parameter estimation. This systematic per-model tuning ensures a fair and reproducible comparison across all classifiers, as each model operates at its best configuration rather than at arbitrary defaults.

3.6. Model Evaluation

Classification performance was assessed using metrics derived from the confusion matrix, a 2 × 2 table recording the counts of True Positives ( T P ; awardees correctly classified), True Negatives ( T N ; non-awardees correctly classified), False Positives ( F P ; non-awardees misclassified as awardees), and False Negatives ( F N ; awardees misclassified as non-awardees). The following metrics were computed:
Accuracy = T P + T N T P + T N + F P + F N ,
Precision = T P T P + F P ,
Recall = T P T P + F N ,
F 1 - score = 2 · Precision · Recall Precision + Recall .
In addition, the Area Under the Receiver Operating Characteristic Curve (ROC-AUC) was computed as a threshold-independent measure of discriminative ability, providing a more complete assessment of model performance across all classification thresholds.
F1-score was prioritized for cross-model comparison due to its balanced treatment of precision and recall. All metrics were averaged across five cross-validation folds, and standard deviations are reported alongside mean values in the results tables to characterize variability and support assessment of statistical robustness.

3.7. SHAP-Based Interpretability Analysis

While predictive performance metrics quantify classification effectiveness, they do not explain why a model makes specific decisions. To provide transparency, SHAP (SHapley Additive exPlanations) [33] was employed to quantify the contribution of each bibliometric feature to individual model predictions.

3.7.1. SHAP Formulation

SHAP is grounded in cooperative game theory. For a trained model f, the prediction for an instance x is decomposed as:
f ( x ) = ϕ 0 + j = 1 m ϕ j ,
where ϕ 0 is the expected model output (baseline prediction) and ϕ j represents the marginal contribution of feature j. The Shapley value for feature j is defined as:
ϕ j = S F { j } | S | ! ( m | S | 1 ) ! m ! f ( S { j } ) f ( S ) ,
where F is the full feature set, S is a subset of features, and ! denotes the factorial operator. This formulation, derived from Shapley’s axioms of fairness, consistency, and additivity, guarantees that the sum of all feature contributions equals the difference between the model’s prediction and the baseline.

3.7.2. Global and Local Interpretability

Two levels of interpretability were analyzed:
  • Global interpretability: The mean absolute SHAP value
    I j = 1 N i = 1 N | ϕ i j |
    ranks features by their overall influence across all N authors in the dataset.
  • Local interpretability: For individual authors, SHAP values quantify how specific bibliometric indices increase or decrease the probability of awardee classification, enabling case-level explanation.

3.7.3. Interpretation of Bibliometric Influence

Features with positive SHAP values increase the predicted probability of awardee classification, whereas negative values reduce it. The SHAP analysis identified that indices reflecting balanced productivity and citation structure, such as normalized h-index, h 2 variants, q 2 -index, and g-index, consistently exhibited high contribution magnitudes across domains. Domain-specific variations were also observed, indicating that recognition patterns differ across disciplines, consistent with differences in publication norms and citation intensities described in Section 3.1.

3.7.4. Transparency and Practical Implications

By decomposing model predictions into additive feature contributions, SHAP transforms the predictive framework from a black-box classifier into an explainable decision-support mechanism. This interpretability is essential in academic evaluation contexts where transparency, fairness, and accountability are critical considerations. The integration of performance evaluation and SHAP-based attribution ensures that the proposed framework achieves both predictive accuracy and methodological accountability.

4. Results

This section presents the empirical evaluation of the proposed interpretable machine learning framework across four academic domains: Computer Science, Neuroscience, Mathematics, and Civil Engineering. Model performance was assessed using stratified five-fold cross-validation, with mean values and standard deviations reported across folds to characterize variability. The results are reported as domain-wise performance analyses followed by cross-domain comparison and SHAP-based feature attribution. Overall, predictive performance varies across disciplines, with margin-based and ensemble methods generally outperforming probabilistic and single-tree models. The interpretability analysis reveals consistent influence of normalized and balance-oriented indices alongside domain-dependent variations in feature importance.
Before reporting classification results, Table 2 presents descriptive statistics comparing awardee and non-awardee groups across key bibliometric dimensions. Awardees in Neuroscience and Mathematics show notably higher normalized h-index values than non-awardees, confirming that productivity efficiency, rather than raw volume, is a distinguishing dimension. In Mathematics, the awardee group also shows substantially higher publication counts ( 135.8 ± 199.0 ) compared to non-awardees ( 48.5 ± 61.8 ), suggesting a clearer bibliometric separation in that domain, which is consistent with Mathematics achieving the highest classification accuracy across all domains. The large standard deviations throughout reflect the wide range of career stages present in the dataset.

4.1. Domain-Wise Performance of Machine Learning Models

For each domain, eight supervised learning algorithms were evaluated using accuracy, precision, recall, F1-score, and ROC-AUC under stratified five-fold cross-validation. Mean values and standard deviations across folds are reported. The comparative analysis highlights model-specific trade-offs under different publication and citation structures.

4.1.1. Performance in Computer Science

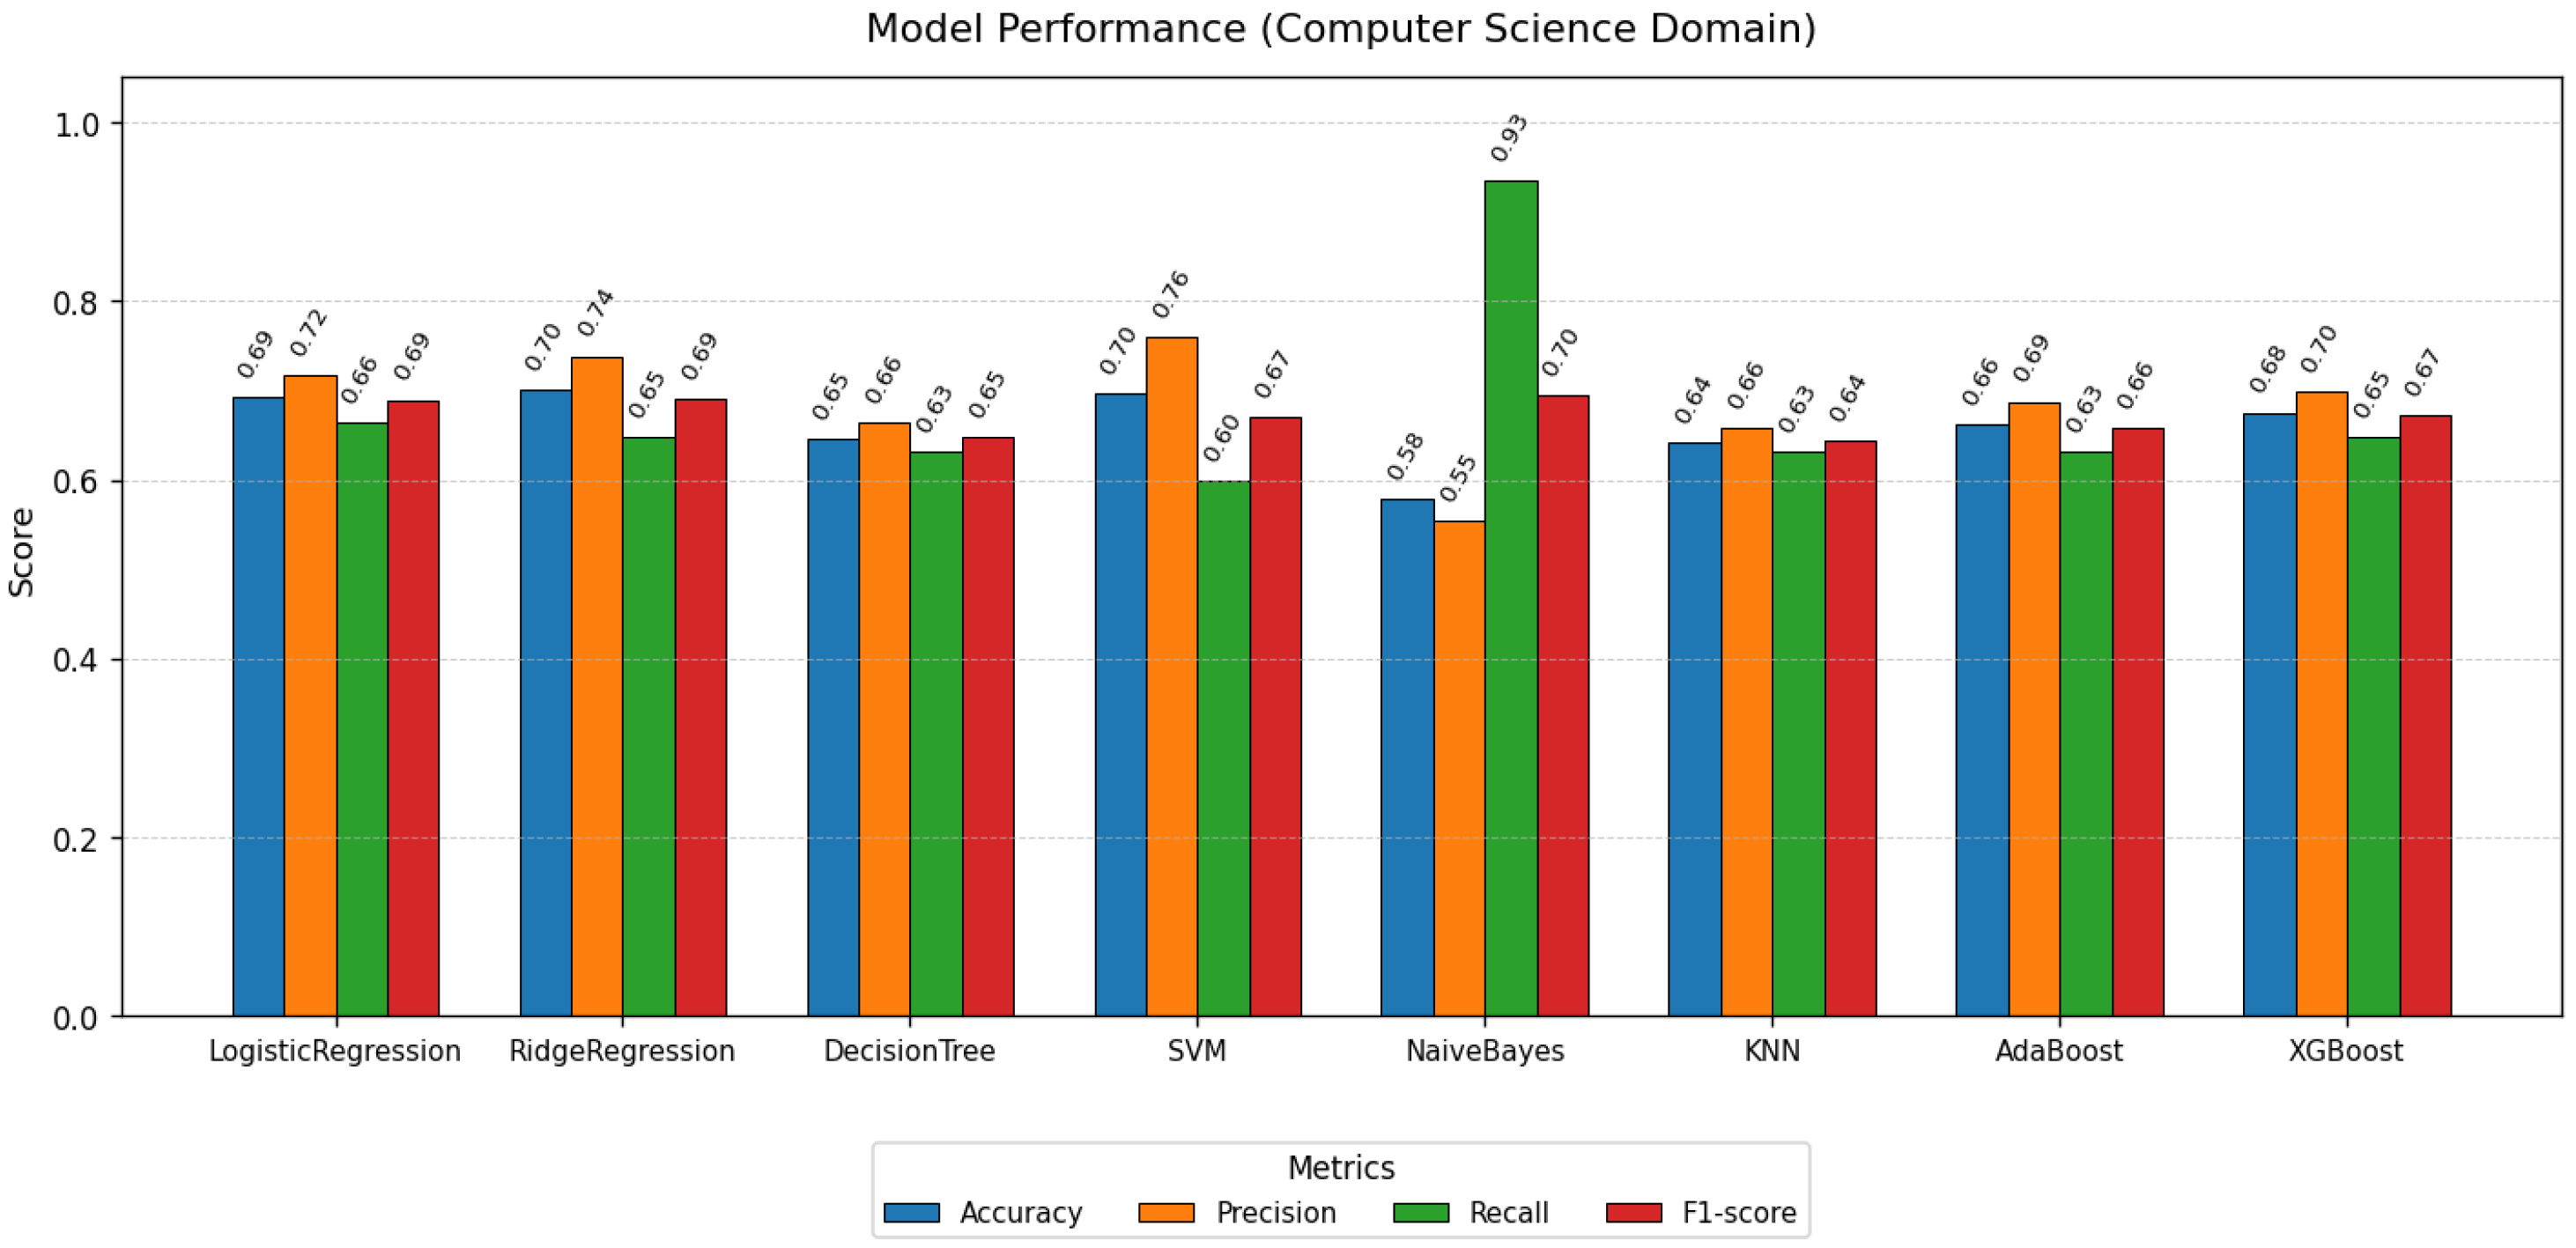
The Computer Science results are summarized in Table 5 and visualized in Figure 2. SVM achieved the best overall performance (accuracy = 0.69 ± 0.03 ; F1-score = 0.70 ± 0.03 ; ROC-AUC = 0.75 ± 0.04 ), with well-balanced precision ( 0.70 ± 0.03 ) and recall ( 0.71 ± 0.04 ). Ridge Regression tied on F1-score ( 0.70 ± 0.03 ) but with marginally higher recall ( 0.73 ± 0.05 ), indicating that a regularized linear boundary also captures the underlying feature structure effectively—consistent with the high inter-correlation among bibliometric indices in this domain, where L2 regularization stabilizes coefficient estimates. AdaBoost matched SVM and Ridge on F1 ( 0.69 ± 0.04 ) but with slightly lower recall, while Logistic Regression remained competitive ( 0.69 ± 0.04 ). Naïve Bayes exhibited extreme recall ( 0.94 ± 0.02 ) at the cost of very low precision ( 0.54 ± 0.01 ), indicating systematic overprediction of the awardee class. Decision Trees produced the lowest performance (F1 = 0.63 ± 0.04 ; ROC-AUC = 0.63 ± 0.05 ), consistent with their susceptibility to overfitting in high-dimensional correlated feature spaces. The narrow performance spread across models (F1 range: 0.63–0.70) suggests that Computer Science presents a moderately challenging classification task.

4.1.2. Performance in Neuroscience

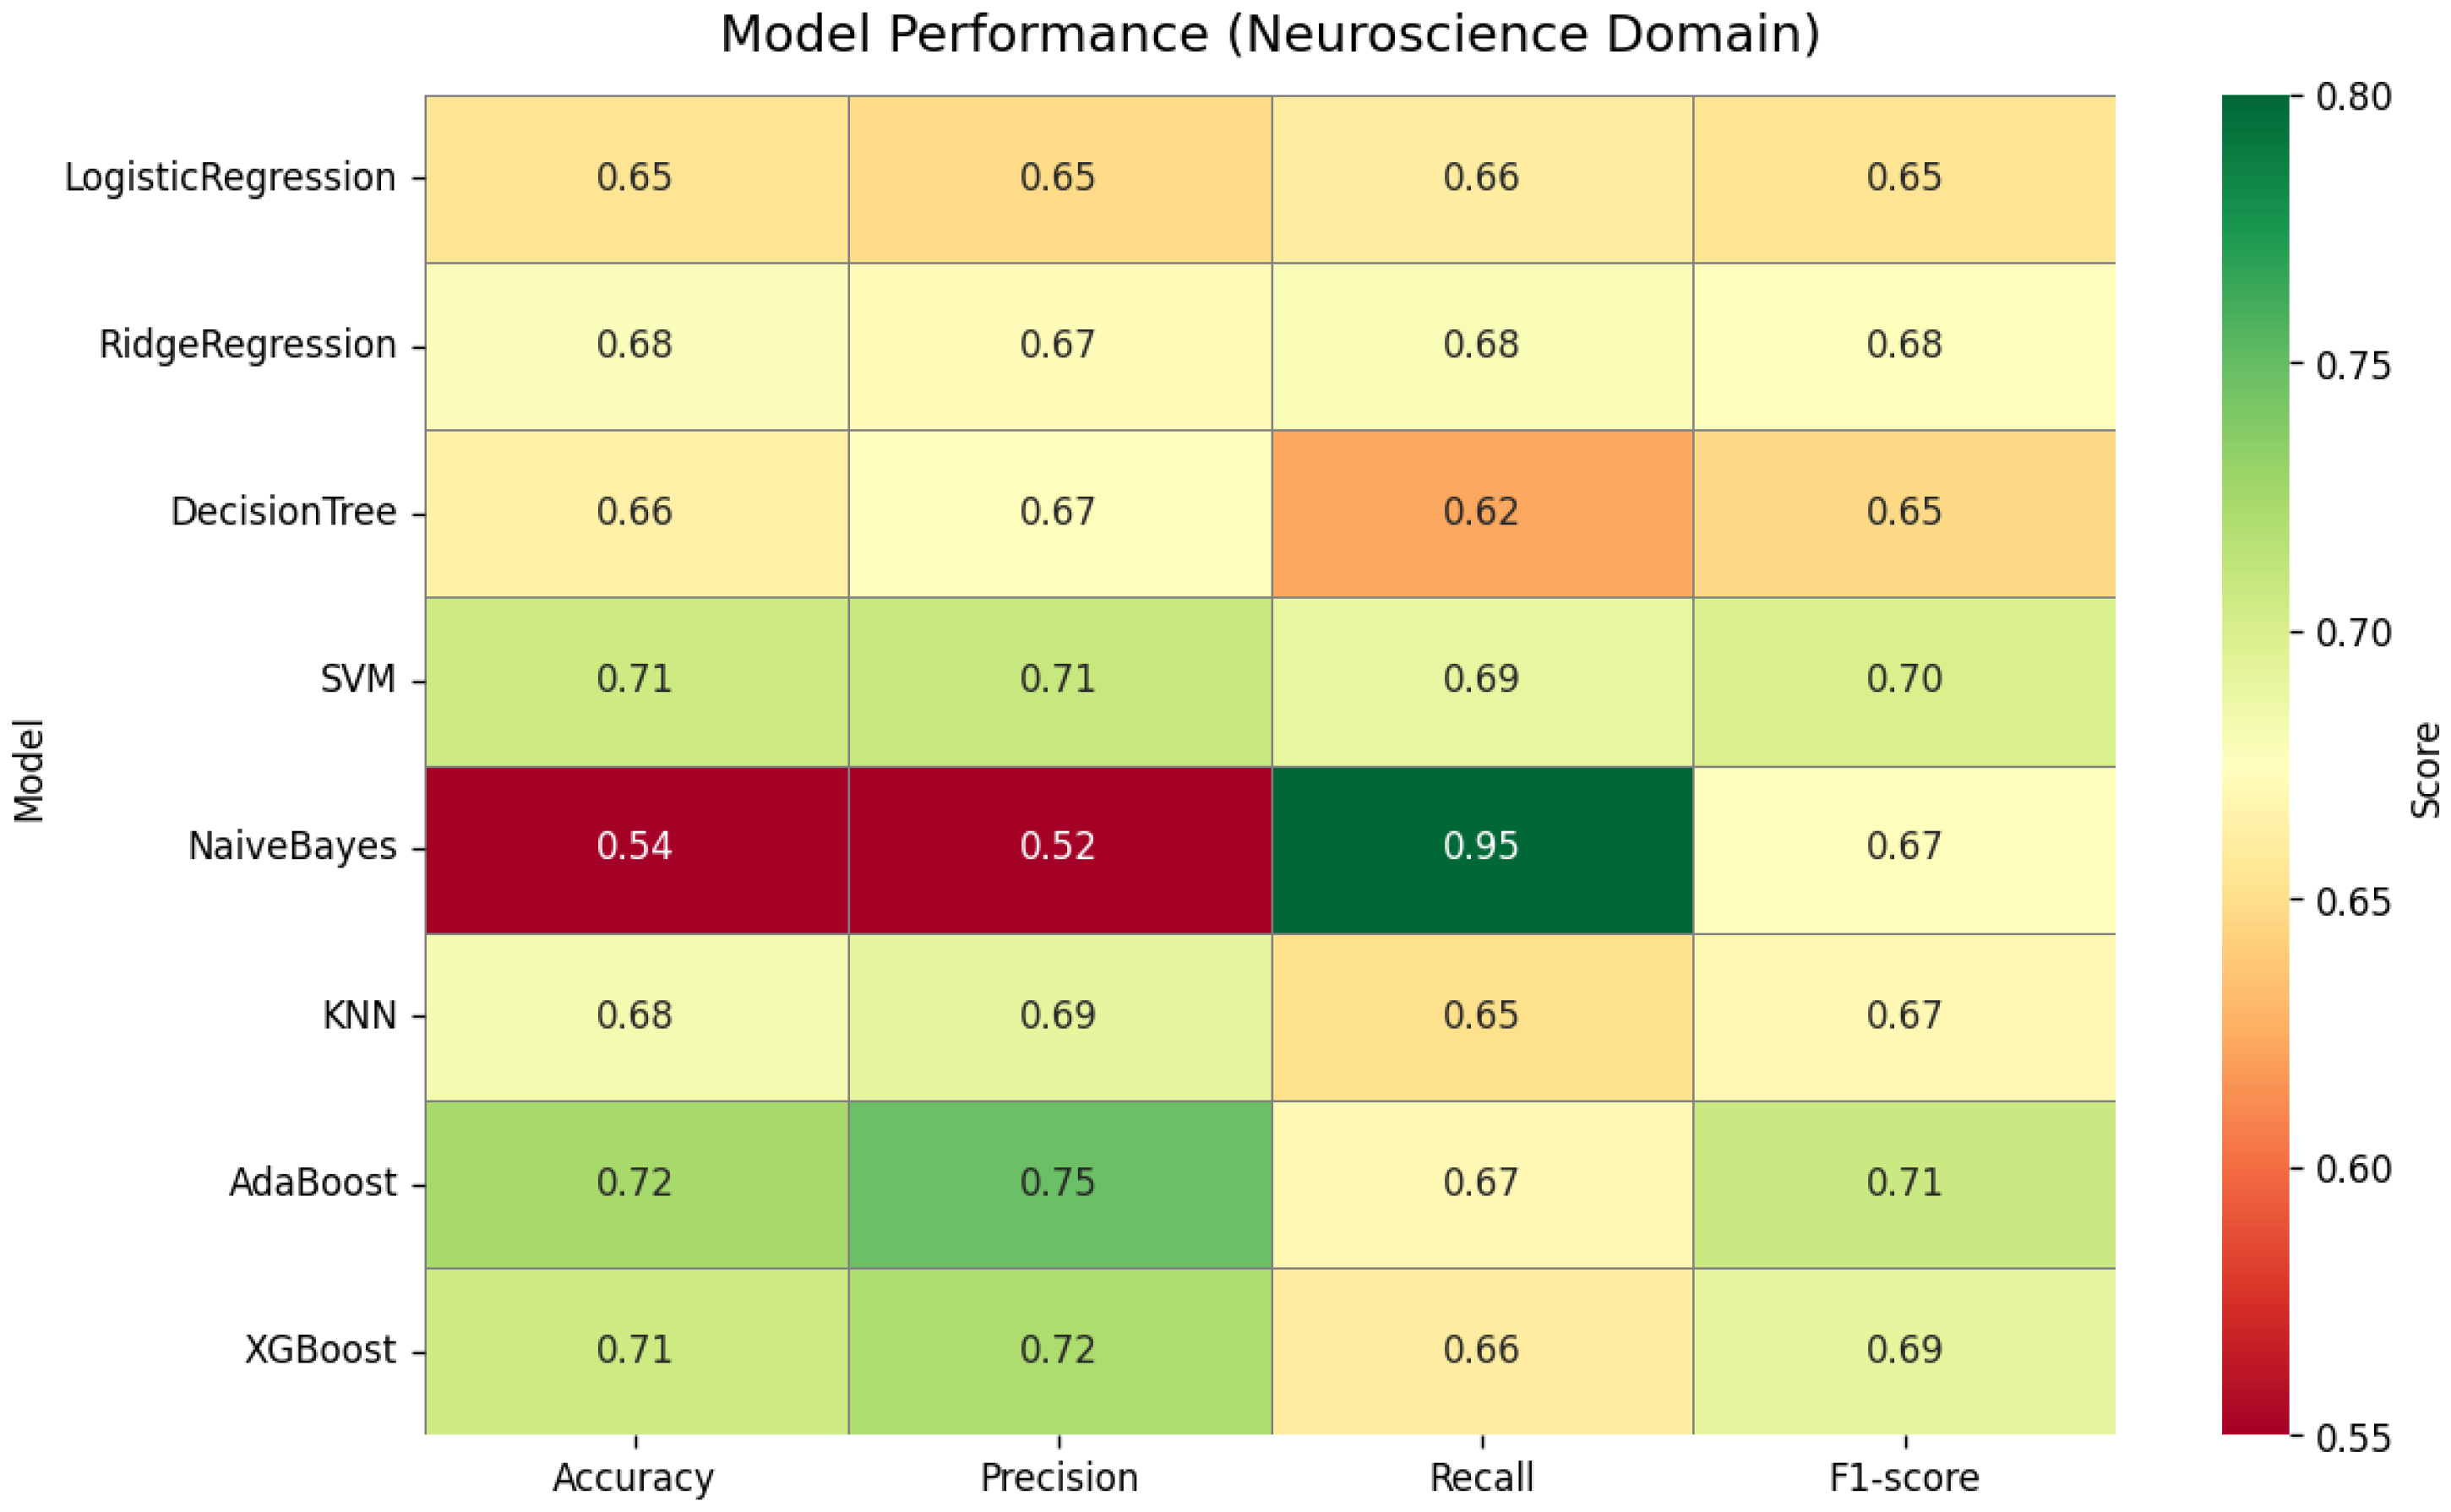
The Neuroscience results are summarized in Table 6 and visualized in Figure 3. XGBoost achieved the best overall performance (accuracy = 0.73 ± 0.02 ; F1-score = 0.73 ± 0.03 ; ROC-AUC = 0.79 ± 0.03 ) with perfectly balanced precision ( 0.73 ± 0.02 ) and recall ( 0.73 ± 0.04 ), indicating that gradient boosting effectively captures the nonlinear interactions among bibliometric indices characteristic of biomedical citation structures. AdaBoost closely followed (F1 = 0.72 ± 0.02 ), confirming that ensemble methods are better suited to Neuroscience than linear models. SVM produced competitive results (F1 = 0.71 ± 0.03 ; ROC-AUC = 0.78 ± 0.03 ), while Ridge Regression and Logistic Regression remained stable but lower (F1 = 0.69 ). Naïve Bayes again exhibited extreme recall ( 0.94 ± 0.01 ) and low precision ( 0.52 ± 0.02 ). Decision Trees produced the lowest F1-score ( 0.64 ± 0.03 ). The stronger performance of ensemble methods relative to linear models in Neuroscience, compared to Computer Science, where linear models tied with SVM, is consistent with the broader distribution of feature influence observed in the SHAP analysis (Section 4.4).

4.1.3. Performance in Civil Engineering

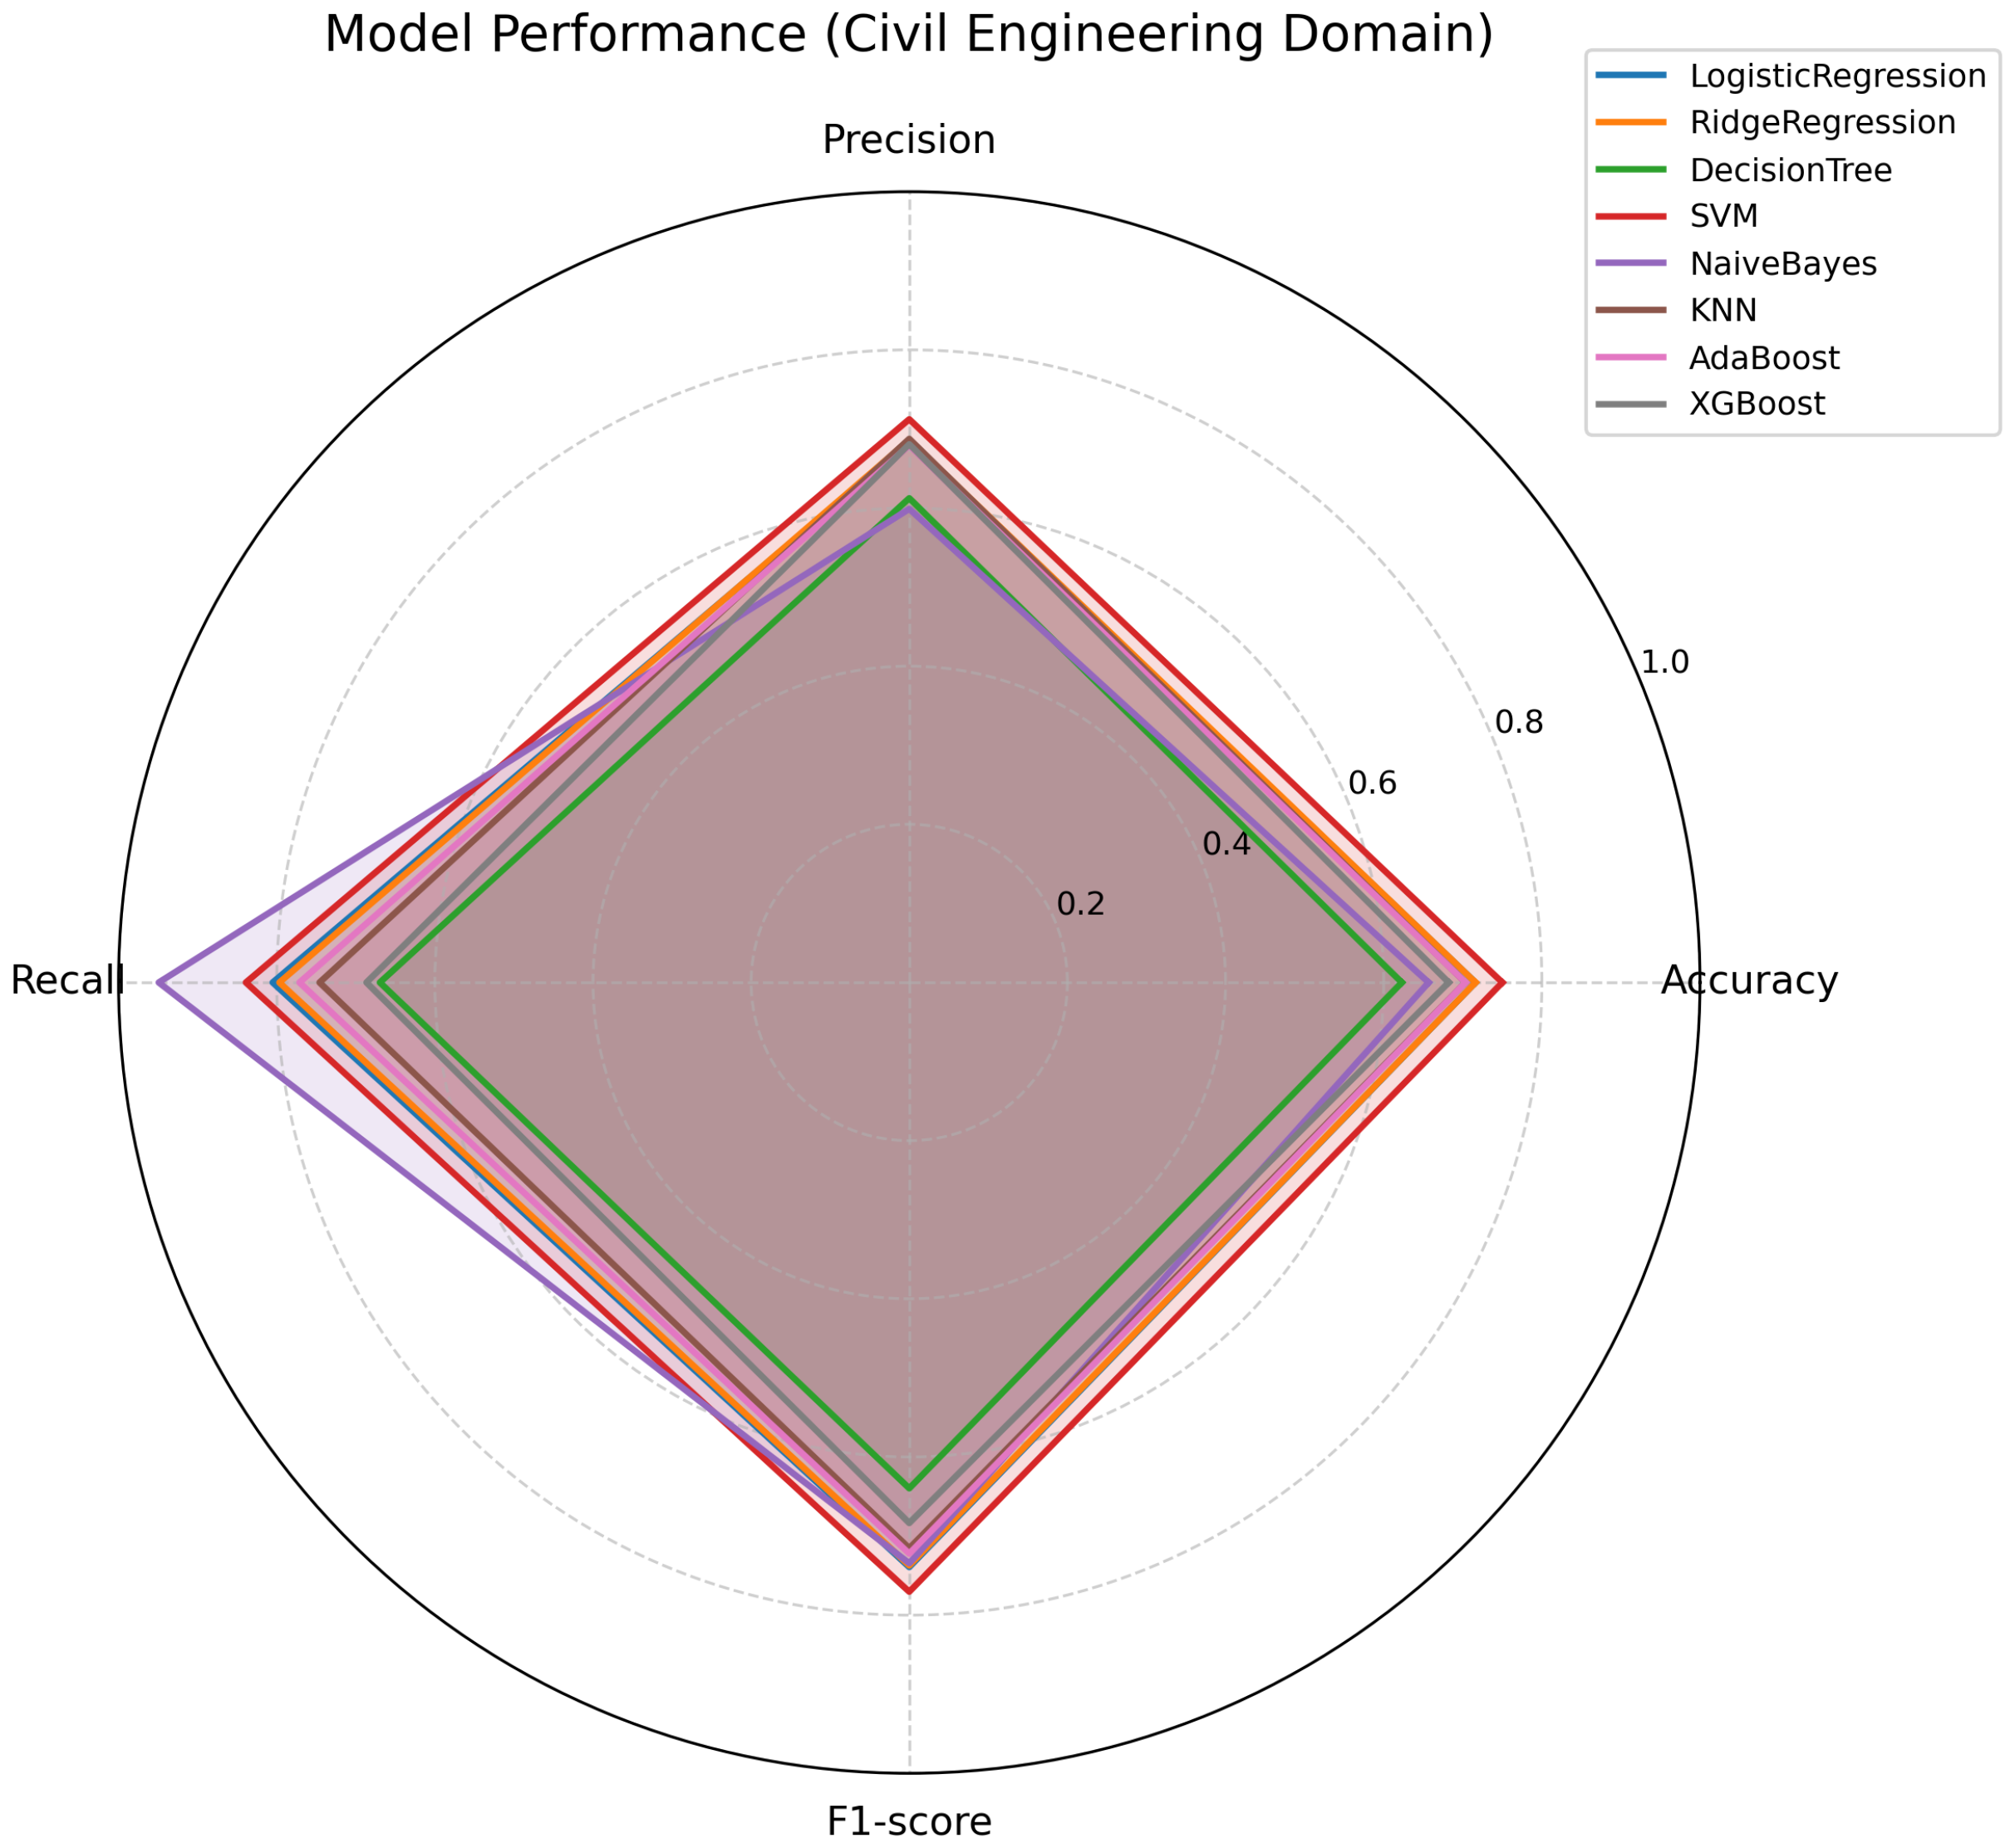
Civil Engineering results are summarized in Table 7 and visualized in Figure 4. SVM achieved the best overall performance (accuracy = 0.71 ± 0.04 ; F1-score = 0.72 ± 0.04 ; ROC-AUC = 0.76 ± 0.04 ), with strong recall ( 0.76 ± 0.04 ) and balanced precision ( 0.69 ± 0.04 ). The strong recall indicates that SVM successfully identifies the majority of awardees, which is desirable in evaluation contexts where missed recognition is costly. AdaBoost closely followed (F1 = 0.71 ± 0.03 ; ROC-AUC = 0.76 ± 0.03 ), and interestingly, Naïve Bayes also achieved F1 = 0.71 ± 0.02 through very high recall ( 0.93 ± 0.03 ), albeit with the lowest precision ( 0.57 ± 0.02 ) among top performers. Ridge Regression, Logistic Regression, XGBoost, and KNN all produced comparable results (F1 = 0.70 ), indicating a relatively flat performance landscape across model families in this domain. Decision Trees produced the lowest F1-score ( 0.63 ± 0.05 ), consistent with their limited generalization on high-dimensional features.

4.1.4. Performance in Mathematics

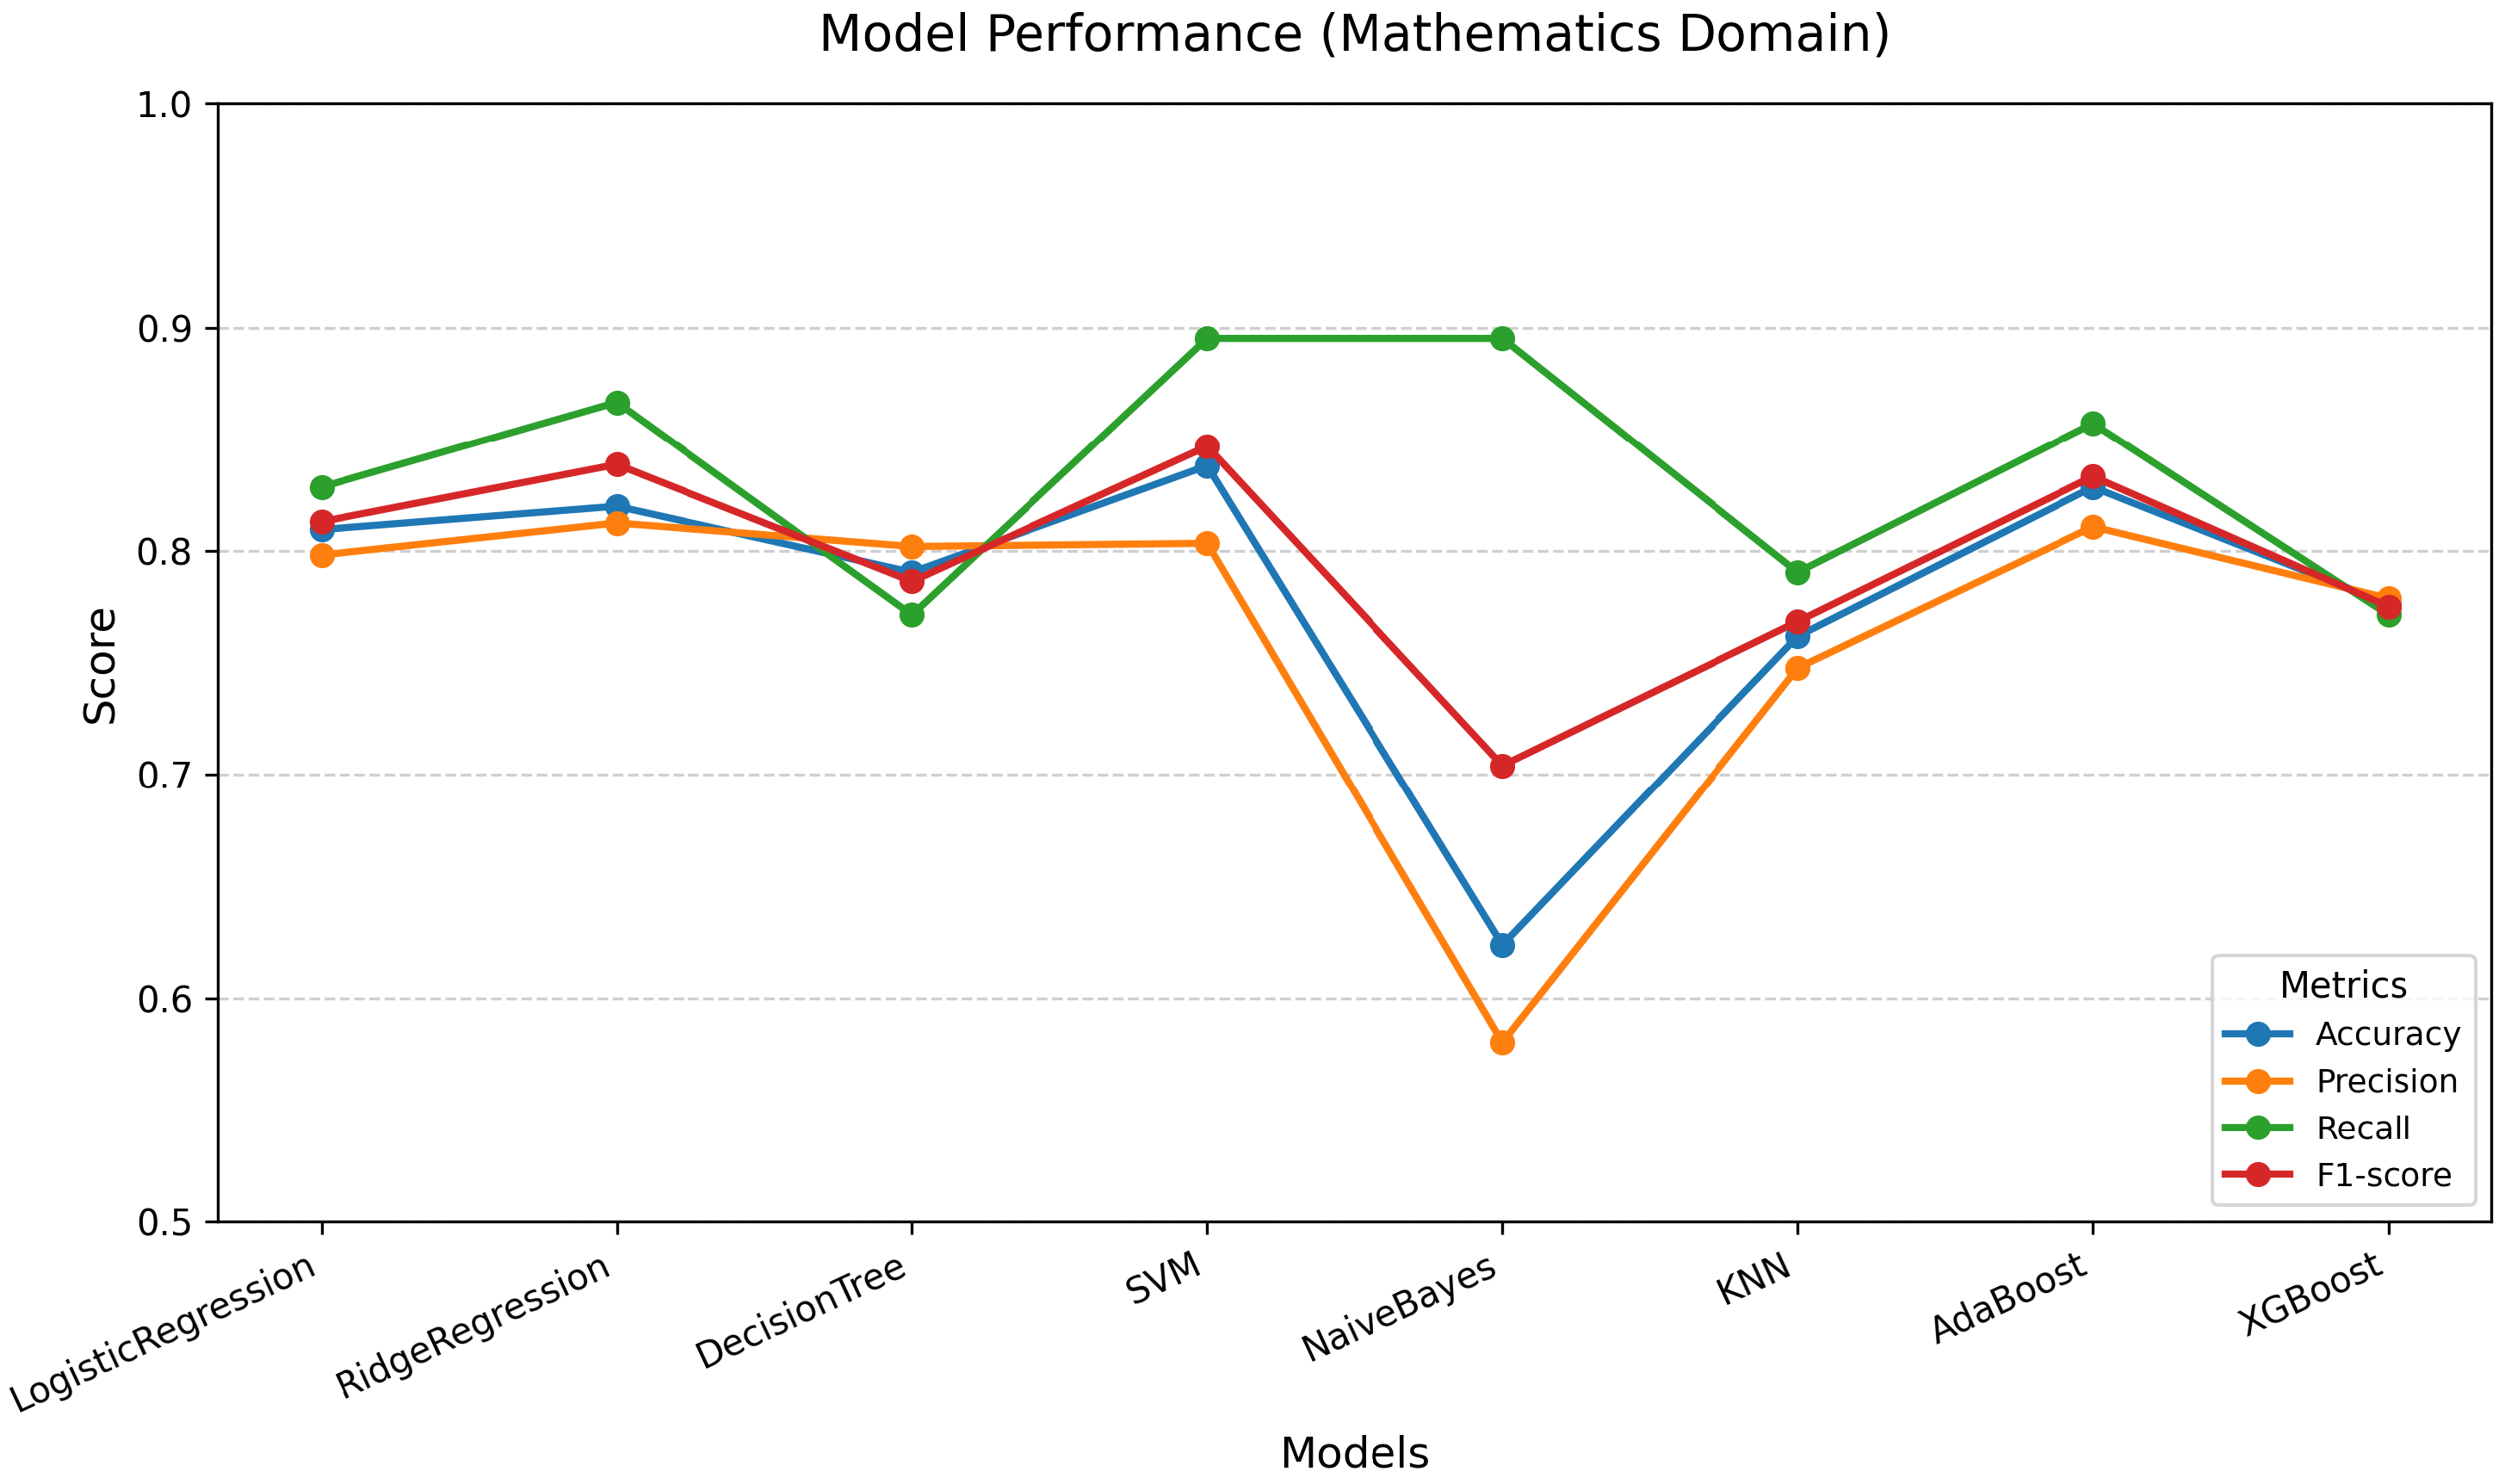
The Mathematics results are summarized in Table 8 and visualized in Figure 5. XGBoost achieved the best overall performance (accuracy = 0.79 ± 0.02 ; F1-score = 0.78 ± 0.02 ; ROC-AUC = 0.88 ± 0.01 ), with well-balanced precision ( 0.79 ± 0.03 ) and recall ( 0.78 ± 0.02 ). The notably high ROC-AUC of 0.88 , the highest across all four domains, confirms strong discriminative ability and indicates that the bibliometric patterns distinguishing award-winning mathematicians are more clearly separable in the feature space than in other disciplines. This aligns with the descriptive statistics in Table 2, where Mathematics showed the largest between-group difference in normalized h-index ( 0.41 vs. 0.19 ) and publication count ( 135.8 vs. 48.5 ). KNN closely matched XGBoost (F1 = 0.78 ± 0.02 ), while SVM achieved the highest precision ( 0.82 ± 0.04 ) at the cost of lower recall ( 0.72 ± 0.03 ). AdaBoost and Ridge Regression also produced strong results (F1 = 0.76 and 0.75 respectively), indicating that both ensemble and linear models are effective in this domain. Naïve Bayes exhibited high recall ( 0.93 ± 0.02 ) but the lowest precision ( 0.60 ± 0.02 ), consistent with its behavior across all domains.

4.2. Cross-Domain Comparative Evaluation

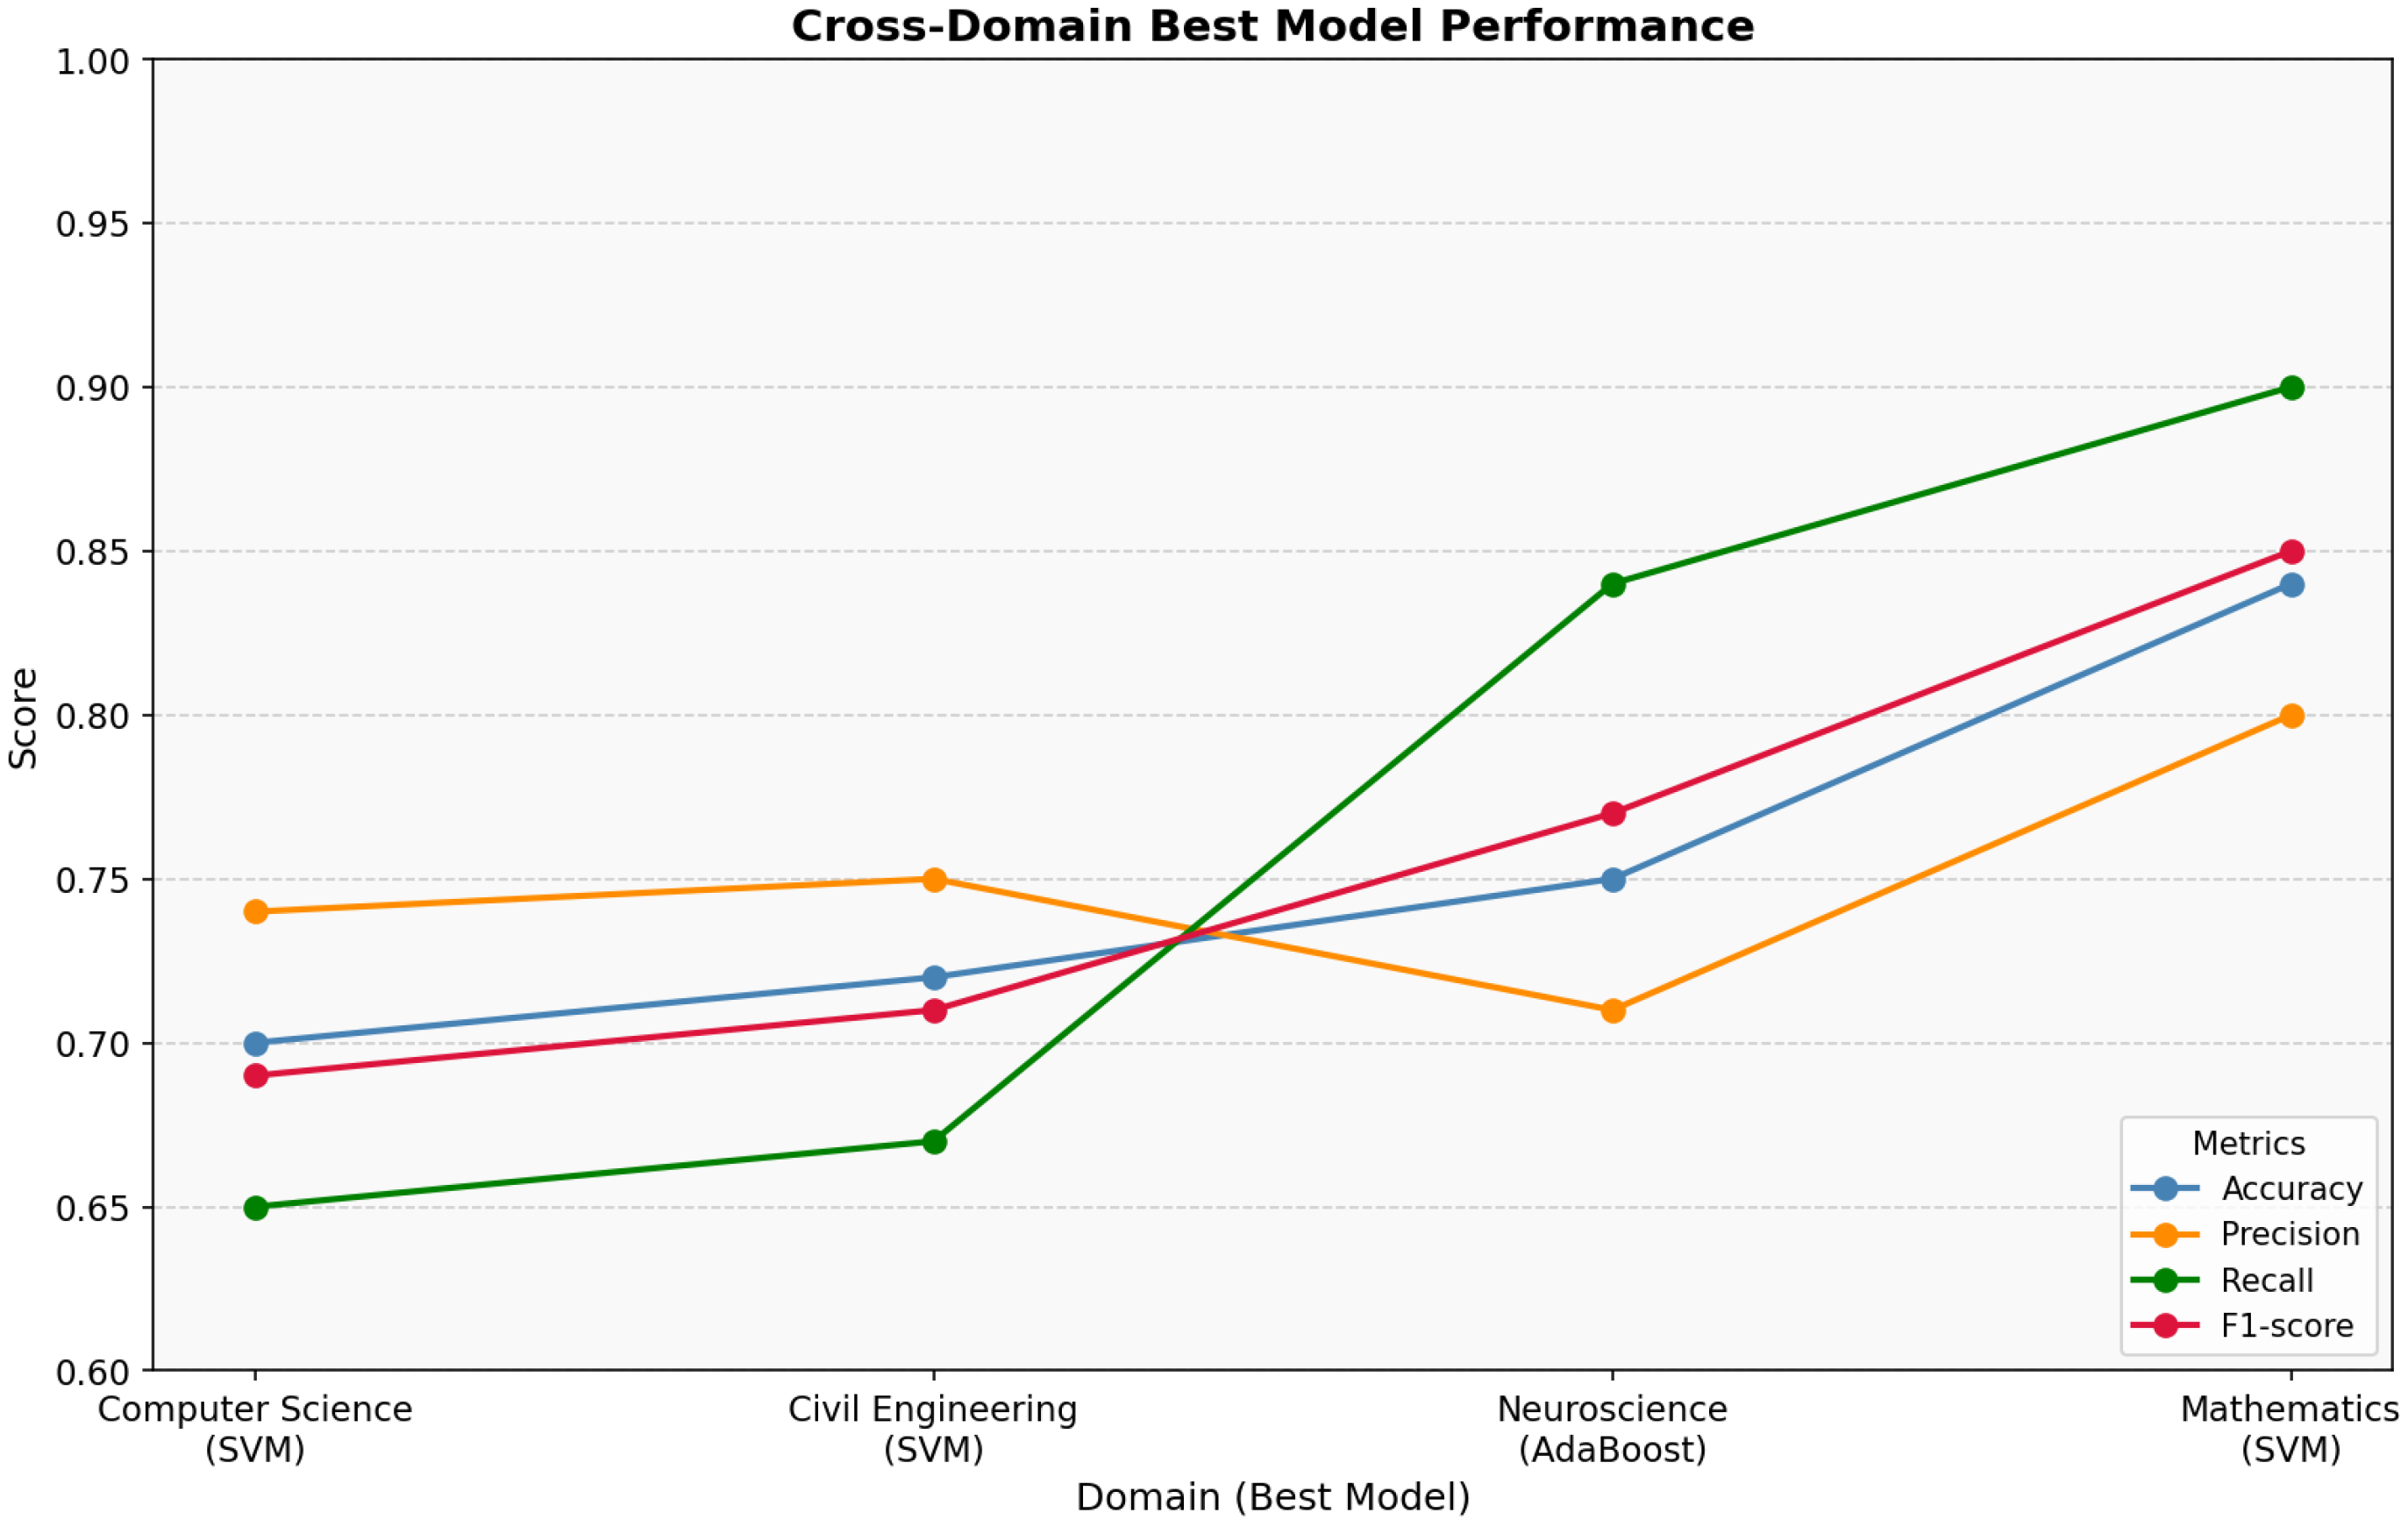
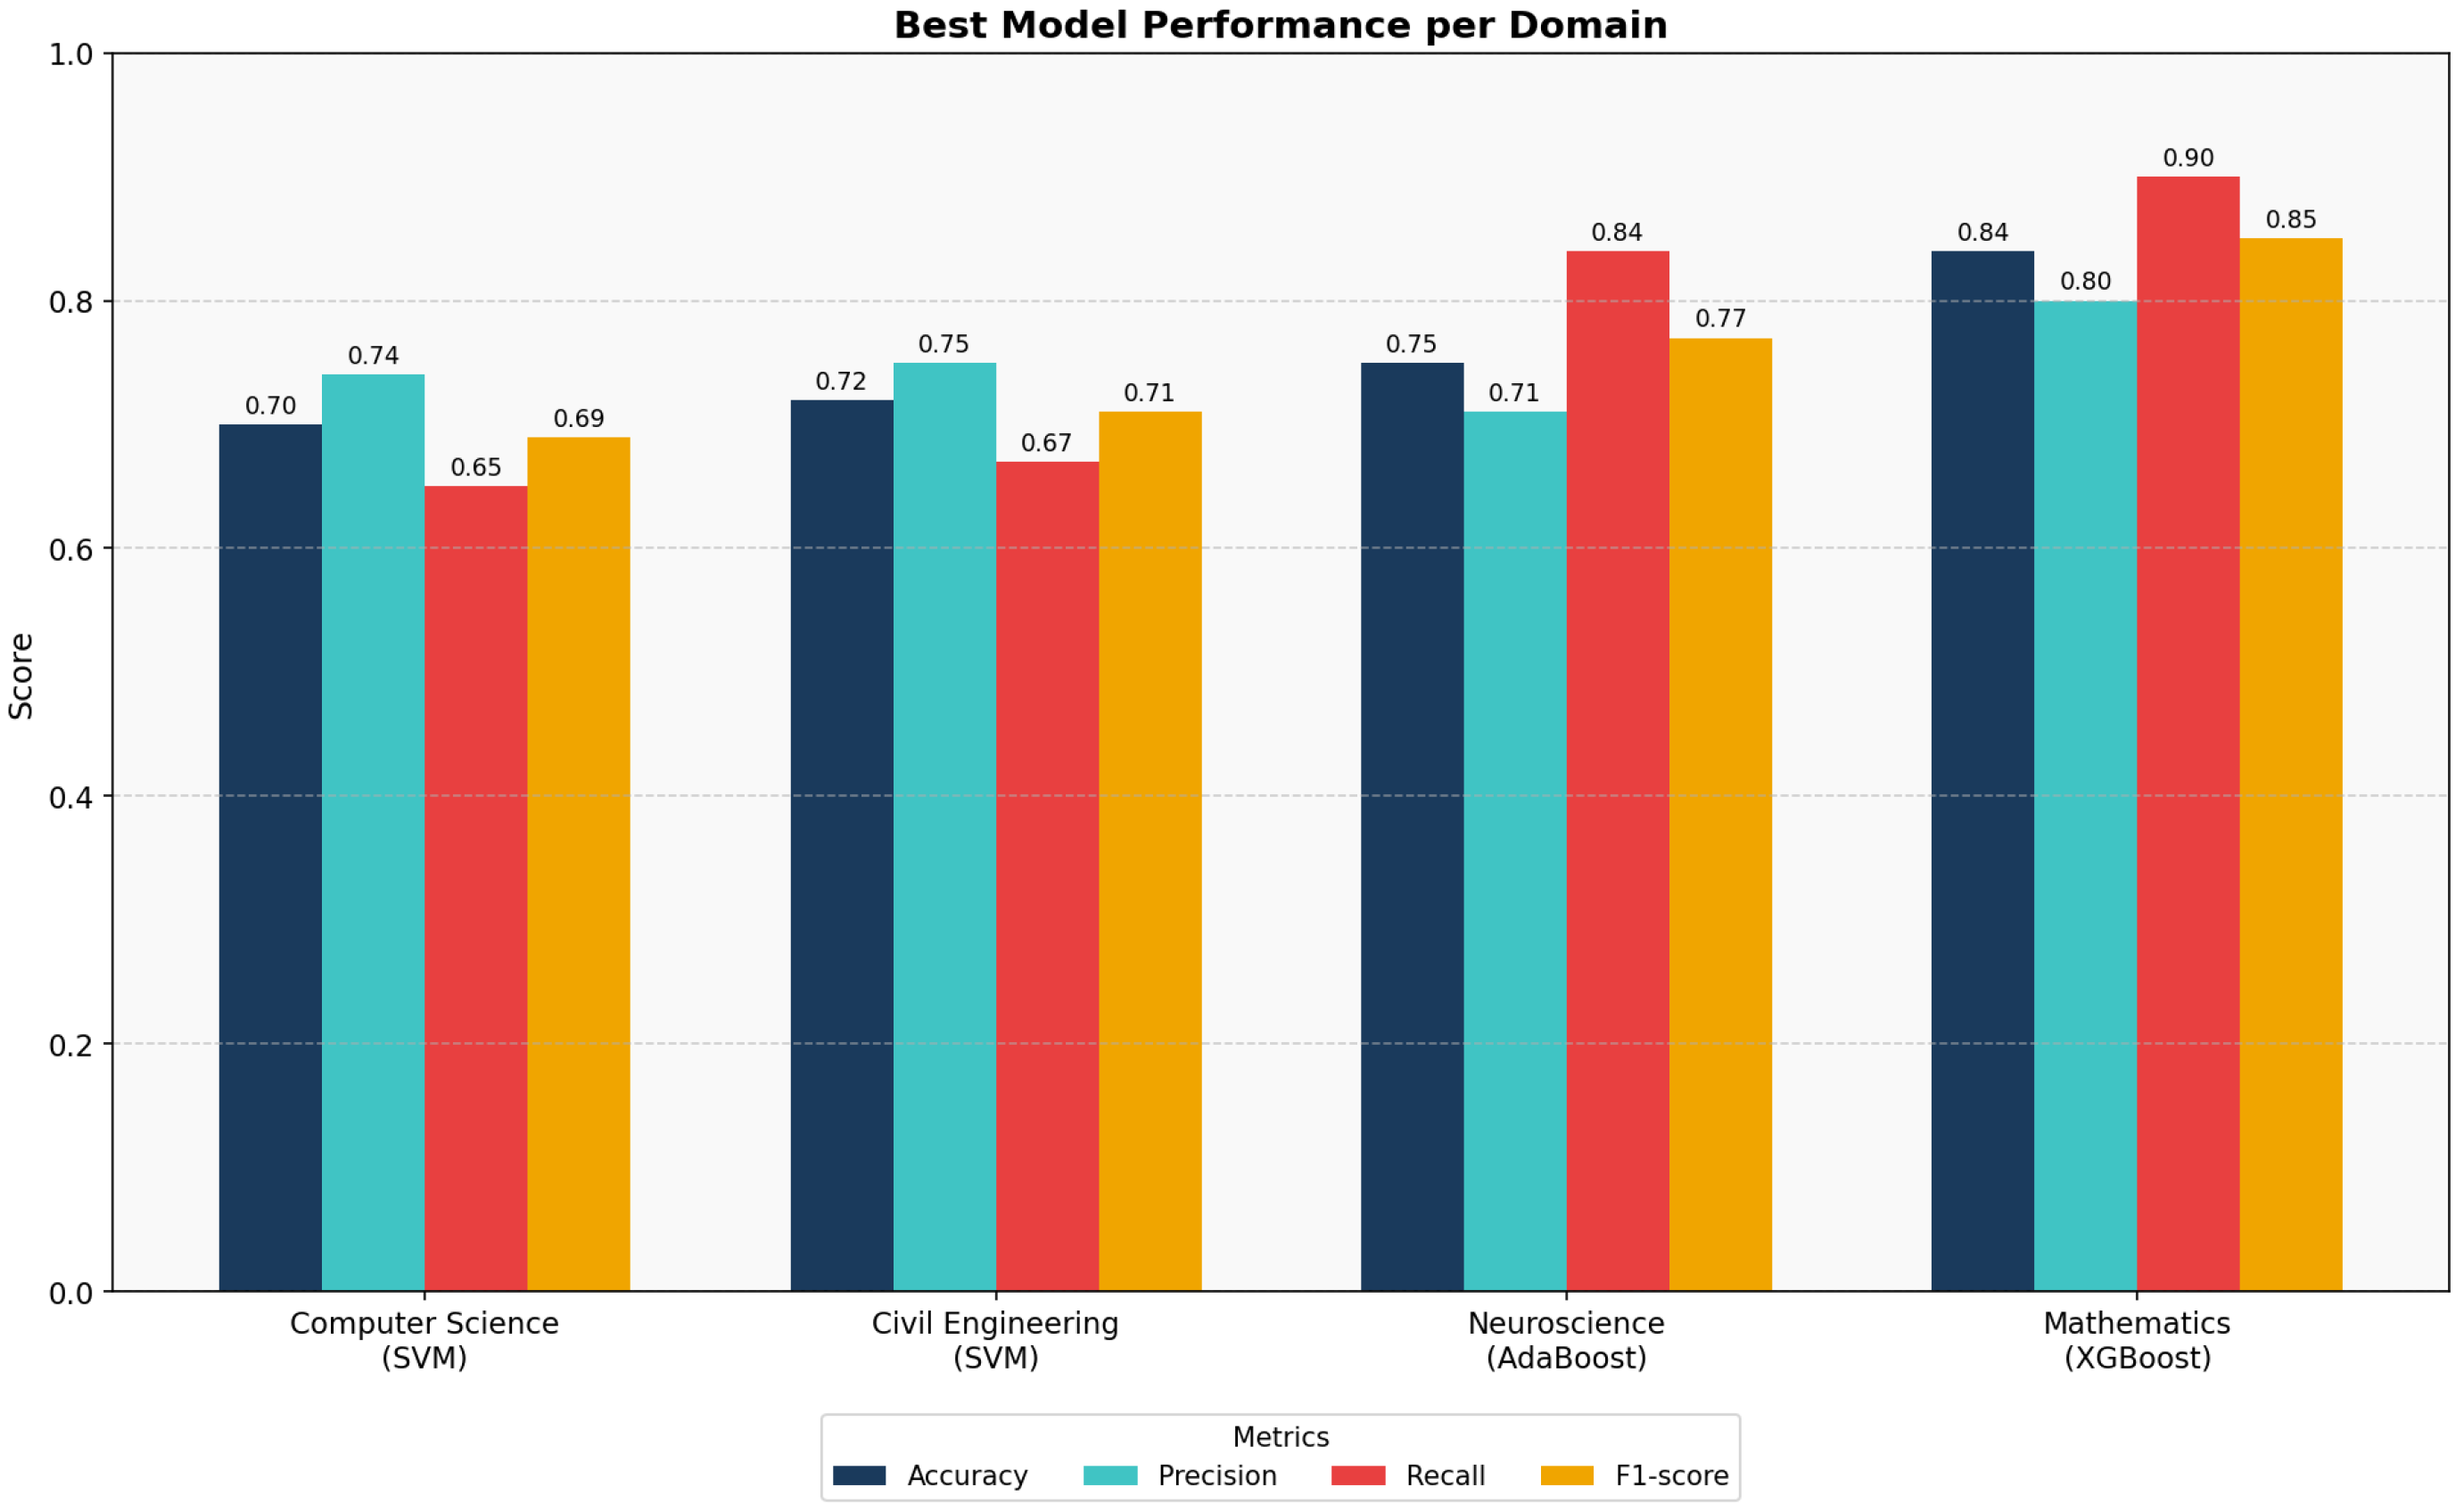
Cross-domain comparison examines model robustness under different citation behaviors and publication norms. The best-performing model in each domain, selected by F1-score, was SVM (Computer Science and Civil Engineering) and XGBoost (Neuroscience and Mathematics). Consolidated results are reported in Table 9 and visualized in Figure 6 and Figure 7.
The results reveal two consistent cross-domain patterns. First, SVM provides strong performance in Computer Science (ROC-AUC = 0.75 ) and Civil Engineering (ROC-AUC = 0.76 ), while XGBoost dominates in Neuroscience (ROC-AUC = 0.79 ) and Mathematics (ROC-AUC = 0.88 ). This suggests that gradient boosting is better suited to domains with more complex nonlinear feature interactions, whereas margin-based classifiers remain effective where feature separability is more direct. Second, all models perform markedly better in Mathematics than in the other three domains across all metrics, reflecting the stronger bibliometric differentiation between awardees and non-awardees identified in Table 2. Overall, margin-based and ensemble models consistently outperform probabilistic and single-tree approaches under cross-domain evaluation.

Misclassification Analysis

To provide insight into model limitations, the misclassification patterns of the best-performing models were examined. Across all domains, SVM and XGBoost tend to generate more False Negatives (awardees misclassified as non-awardees) than False Positives, consistent with their balanced but slightly precision-leaning profiles. This suggests that awardees with atypical bibliometric profiles, for example, researchers recognized for a single landmark contribution rather than sustained high-volume output, are more likely to be misclassified. Naïve Bayes shows the opposite pattern across all domains, generating high False Positive rates due to its feature independence assumption, which systematically overestimates the posterior probability of the awardee class. These observations suggest that incorporating non-bibliometric signals, such as award nomination history or disciplinary prestige rankings, could reduce False Negative rates for atypical awardee profiles in future work.

4.3. Prior Sensitivity Analysis

All classification metrics reported in Section 4.1 are computed under the balanced 1:1 evaluation setting described in Section 3.5. In real-world institutional contexts, awardees constitute a small minority of any academic population. To quantify how reported metrics translate under realistic class priors, this section presents a prior sensitivity analysis following the approach outlined by the reviewer.
Let π denote the true proportion of awardees in a population of N researchers. Given precision p and recall r estimated on the balanced test set, the expected number of True Positives (TPs), False Positives (FPs), and adjusted real-world precision p * under prior π can be approximated as:
TP r · π N , FP ( 1 p ) · ( 1 π ) N , p * = TP TP + FP
Table 10 applies this calculation to the best-performing model in each domain (selected by F1-score) across three realistic awardee prevalence scenarios, using a population of N = 1000 researchers.
These results confirm the reviewer’s observation that balanced evaluation metrics substantially overestimate precision under realistic deployment conditions. For example, at a 1% awardee prevalence, a reasonable estimate for major professional society awards relative to total active researchers, the best-performing model in Mathematics yields an adjusted precision of approximately 12%, meaning that roughly 88% of researchers flagged as predicted awardees would be incorrectly classified. This does not invalidate the framework’s utility, but it does reframe its appropriate use: the proposed system is designed as a ranking and screening tool to assist human evaluators in prioritizing candidates for deeper review, rather than as a deployment-ready binary classifier. Probability calibration and threshold adjustment would be required before any operational institutional deployment, and are identified as directions for future work in Section 6.

4.4. Feature Importance and SHAP Interpretation

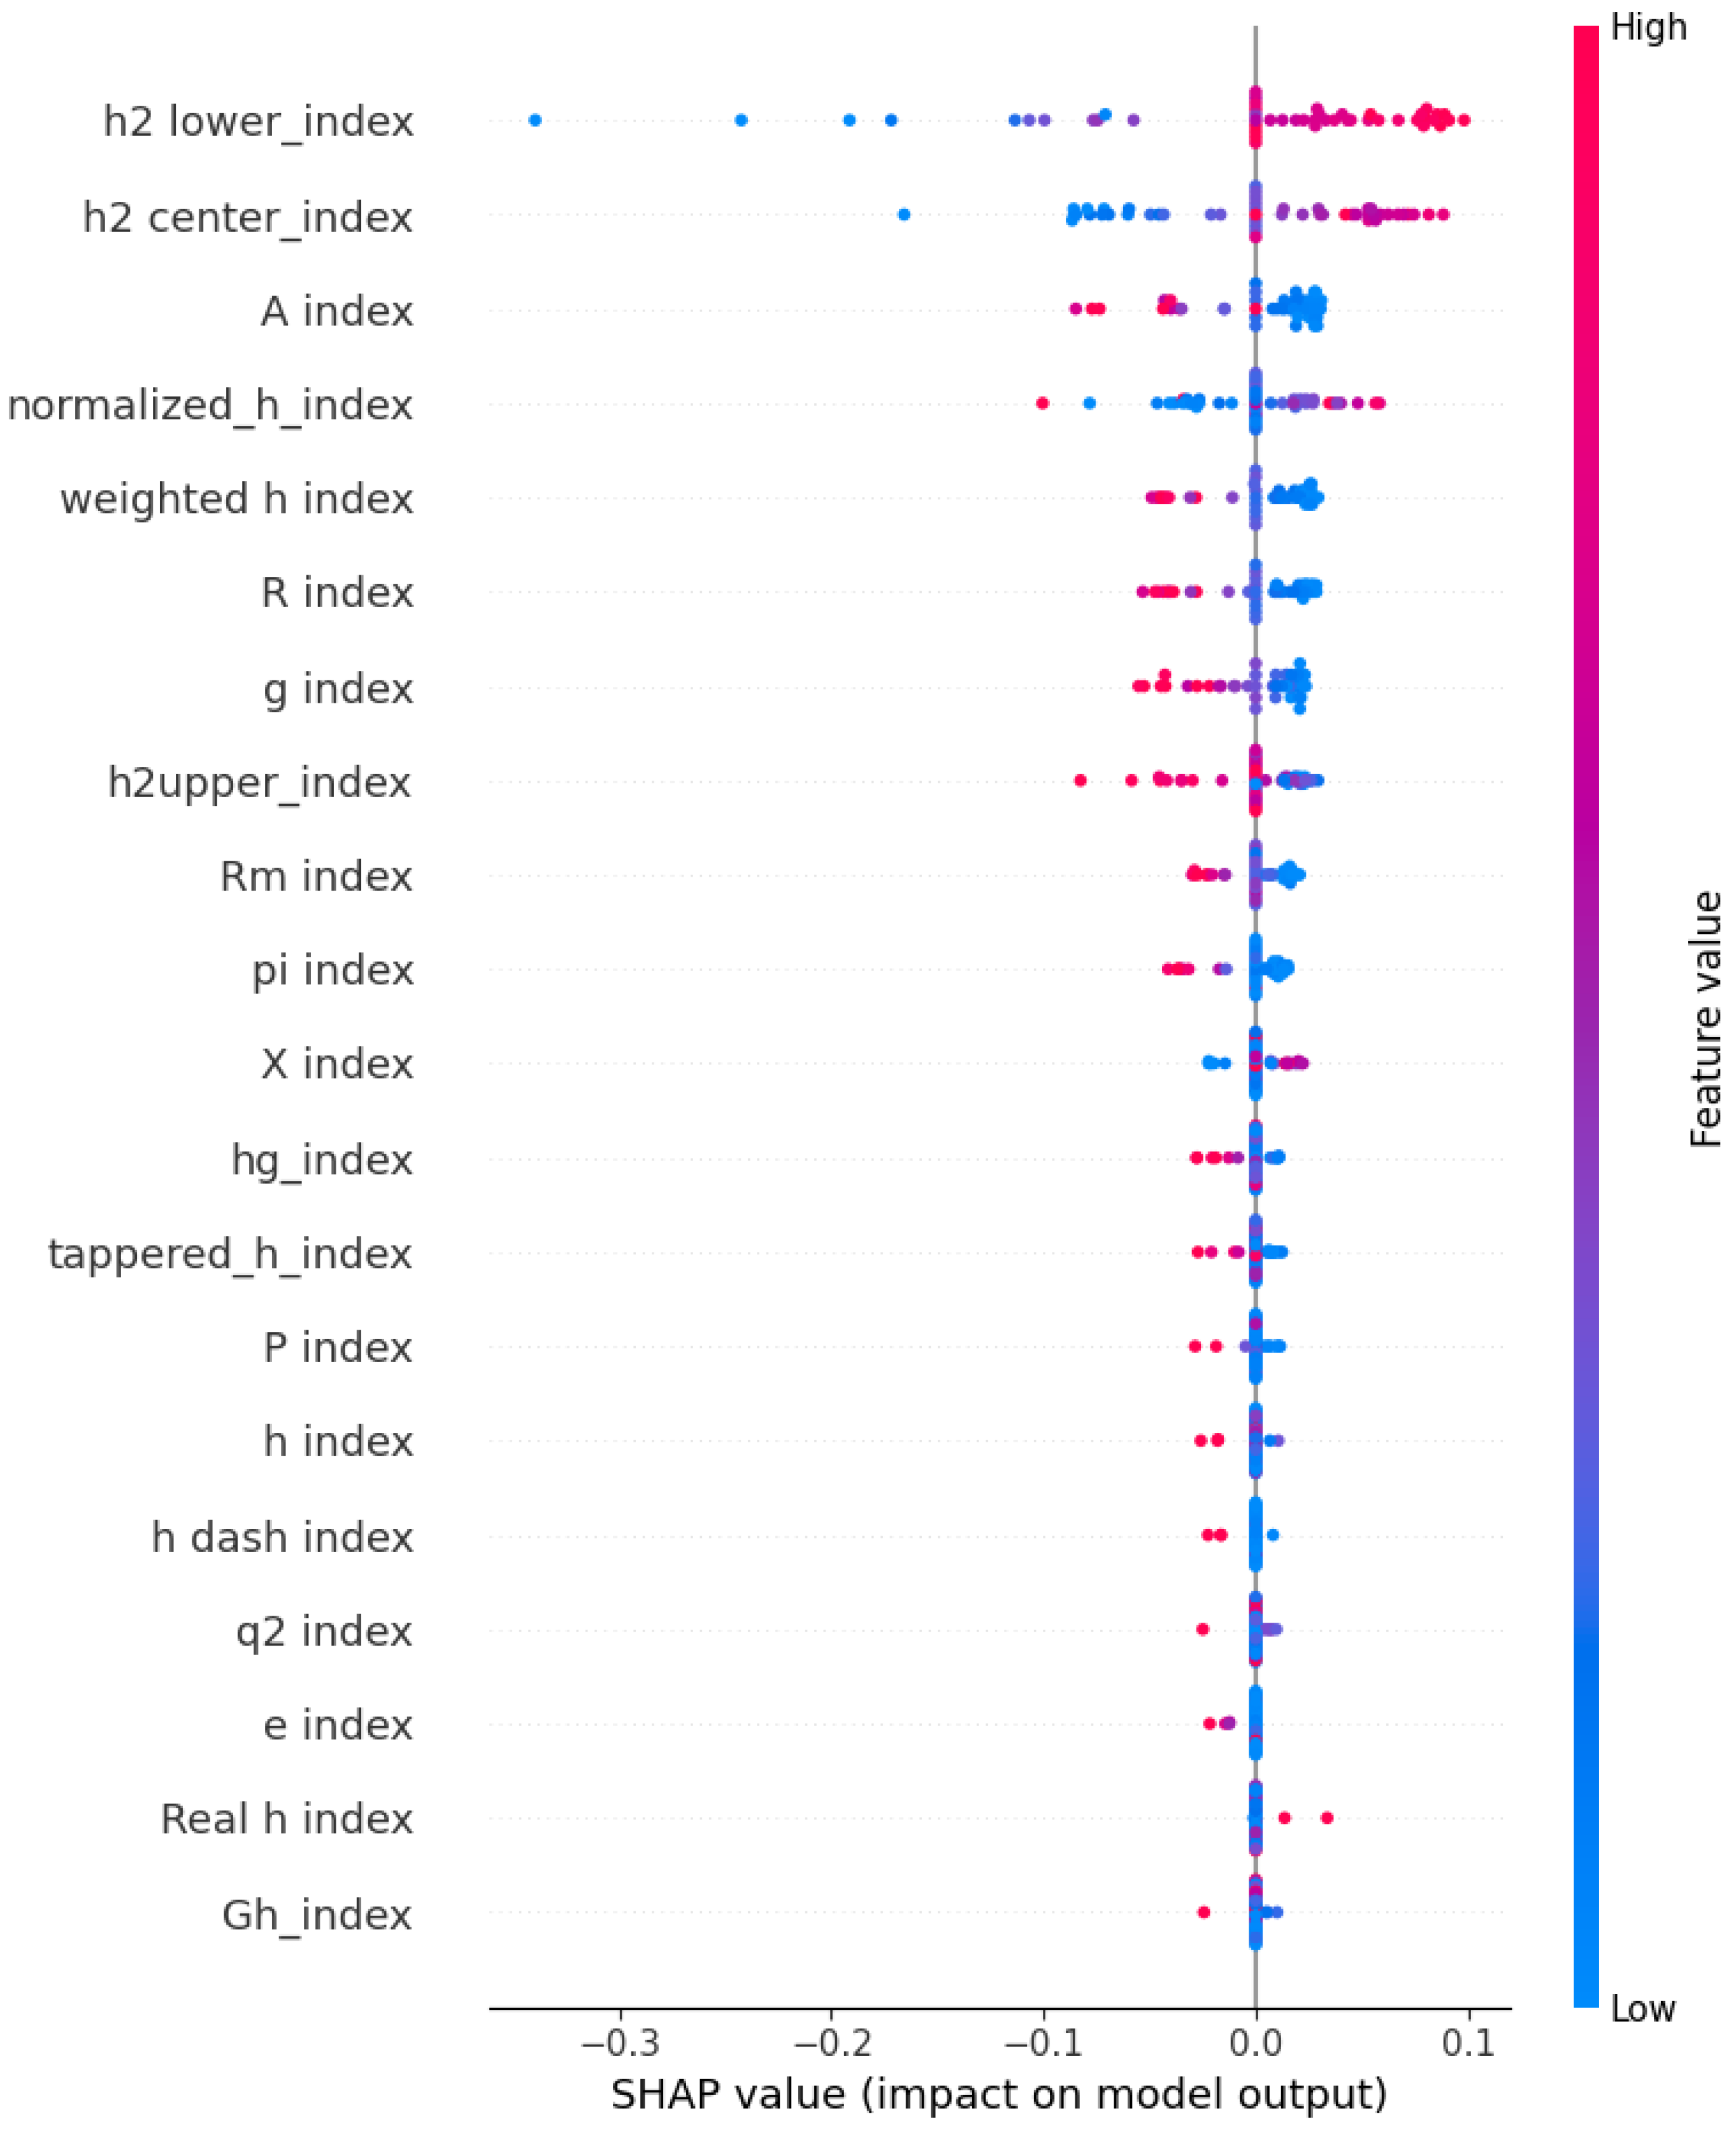
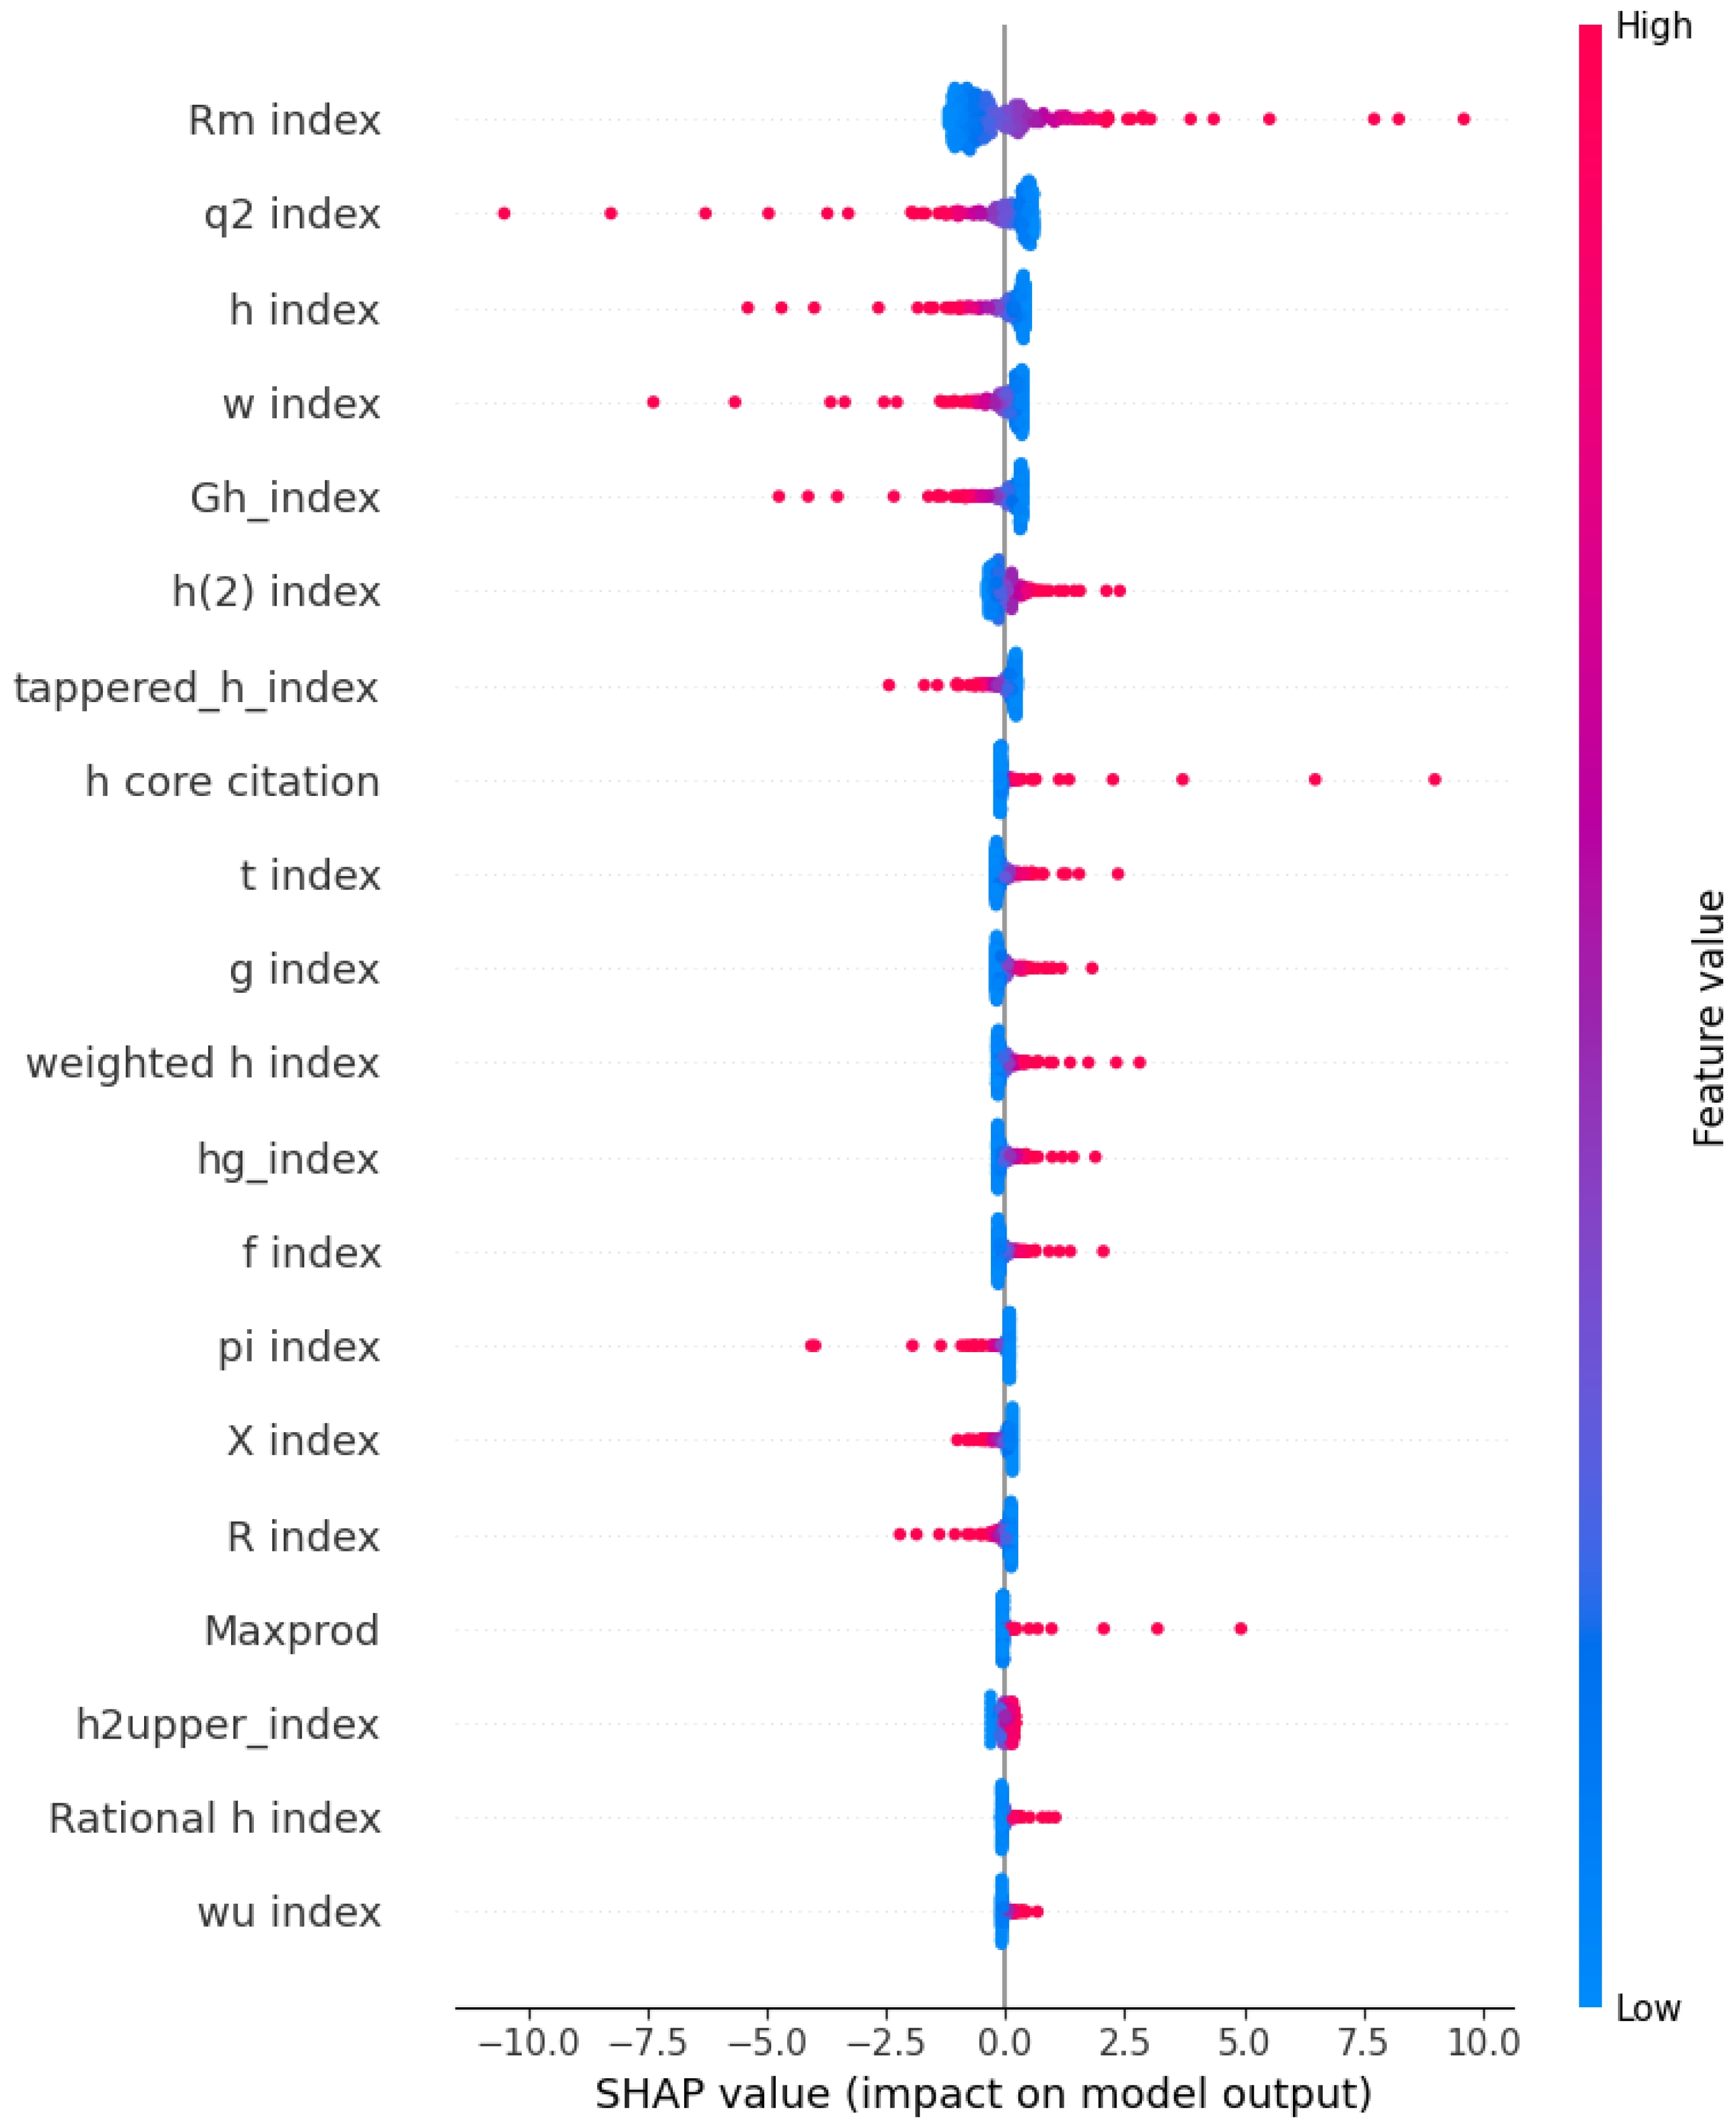
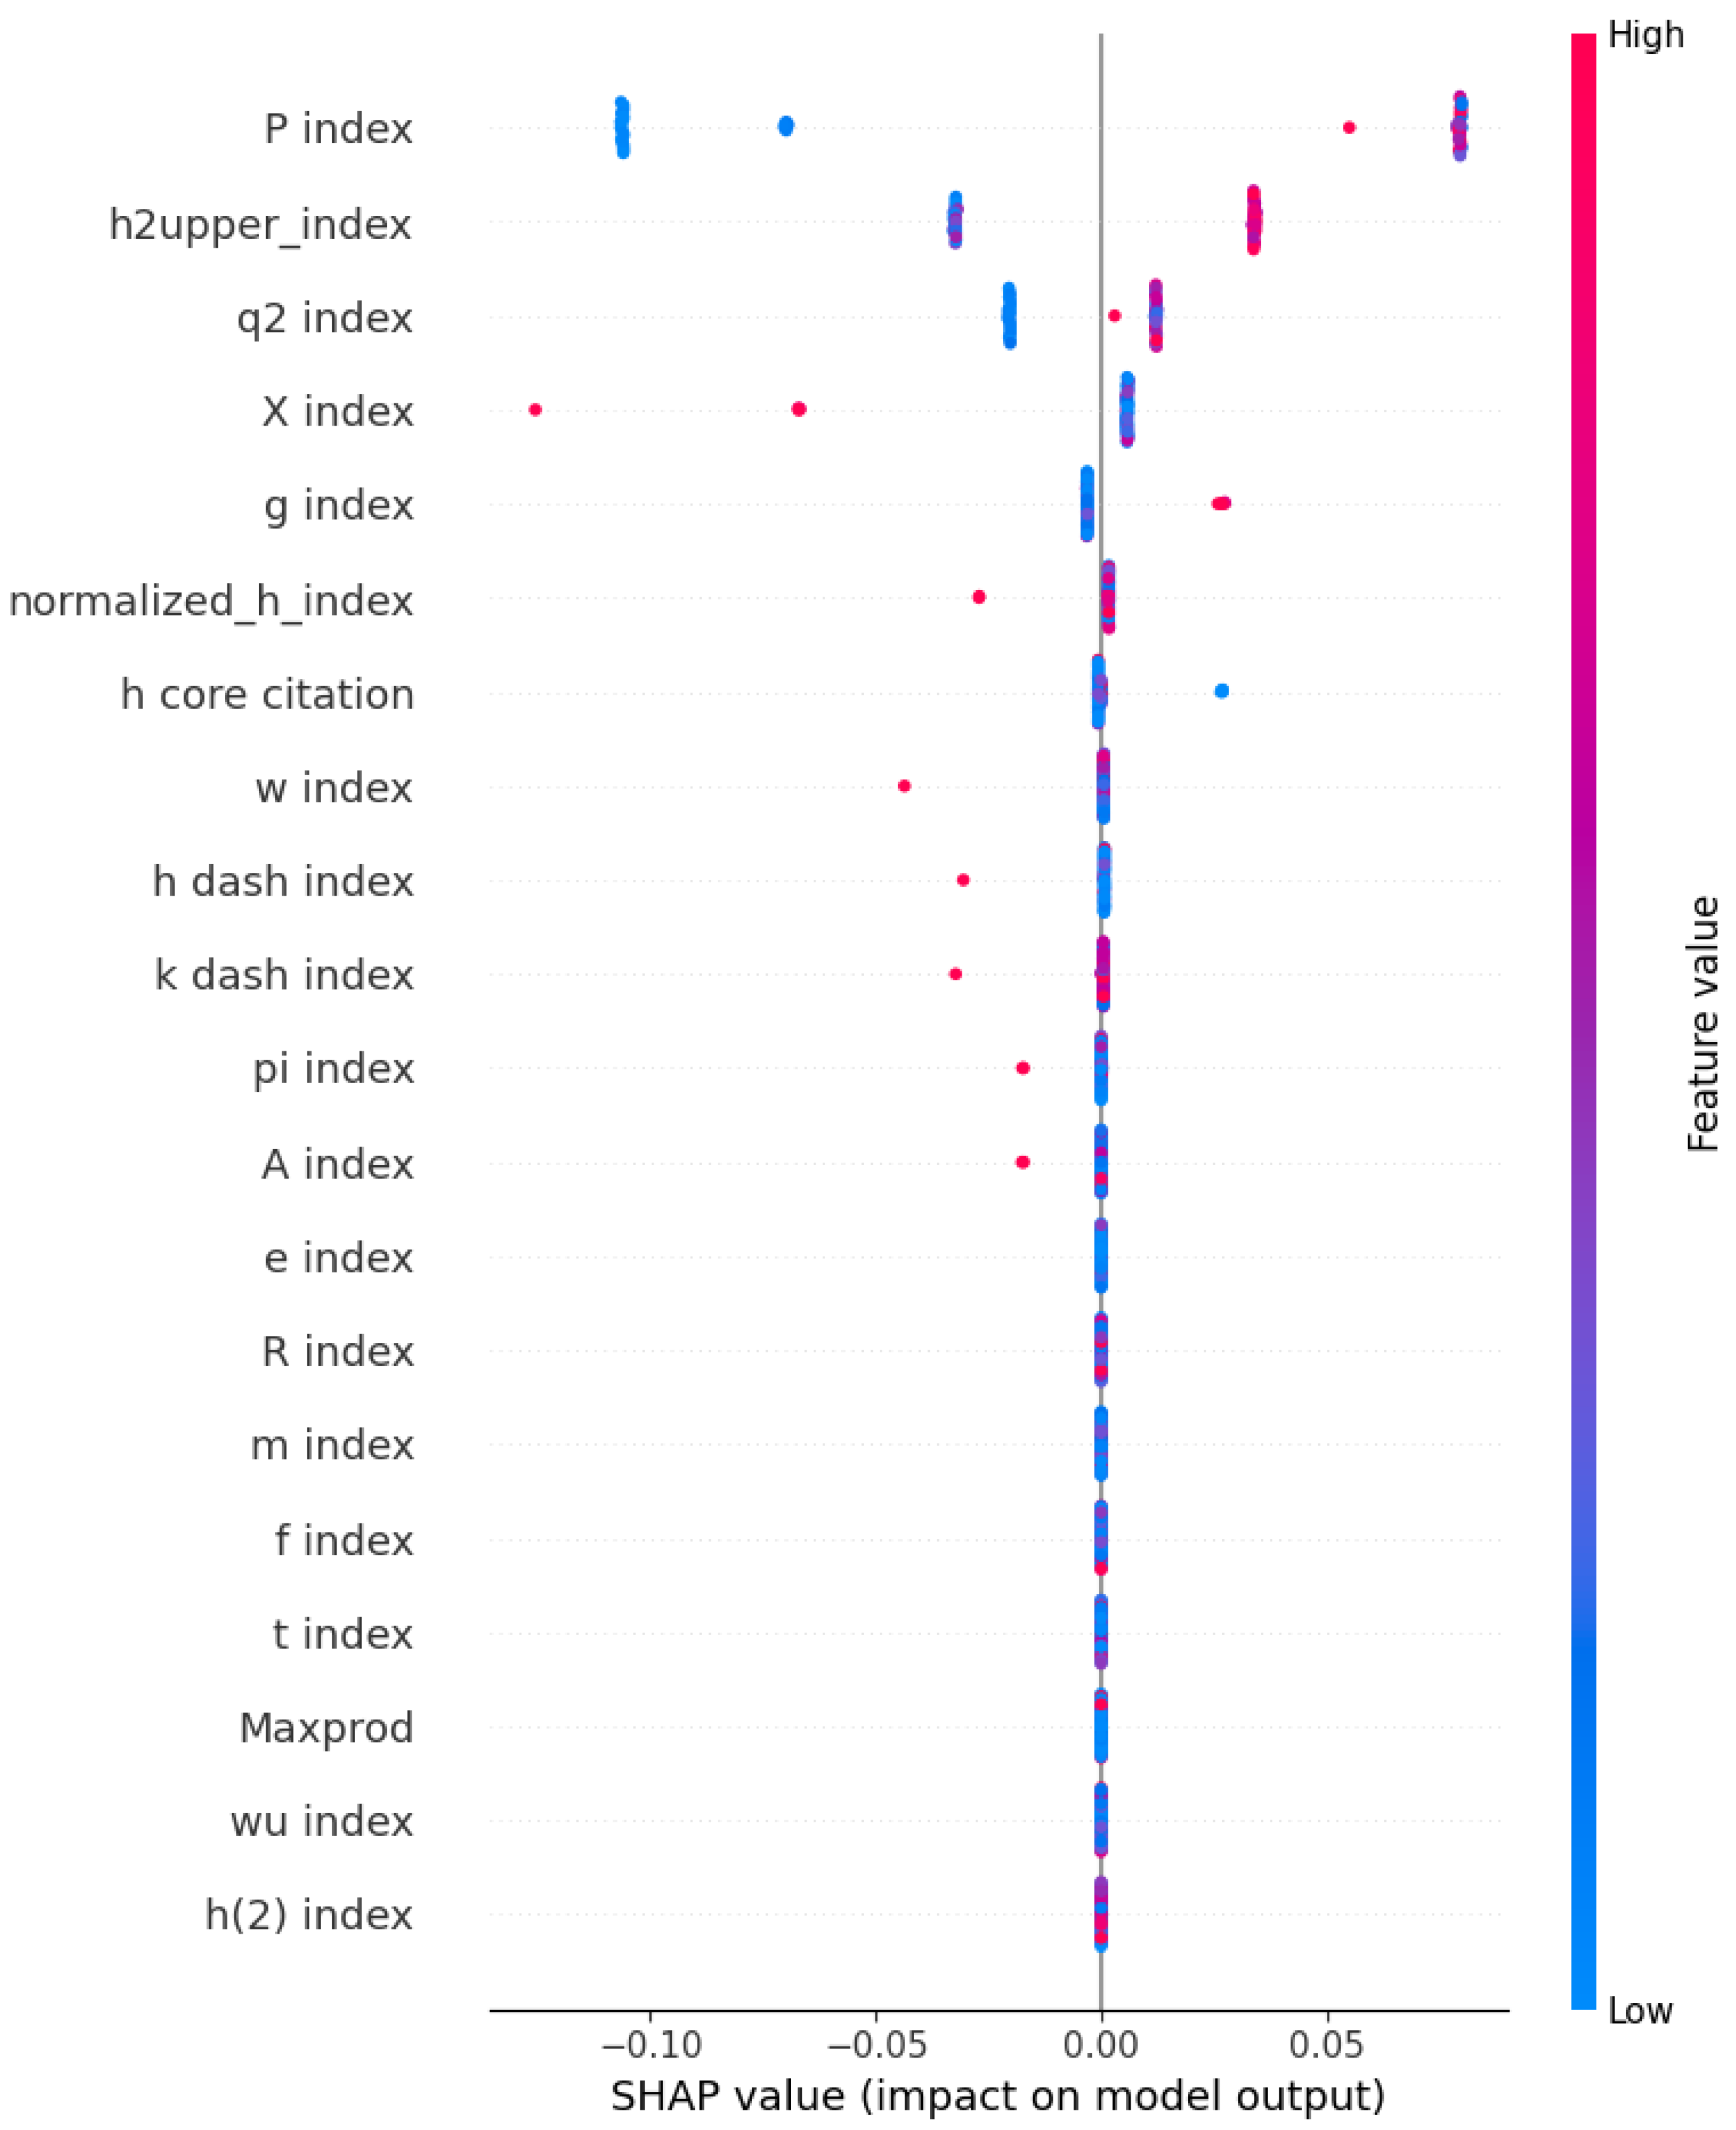
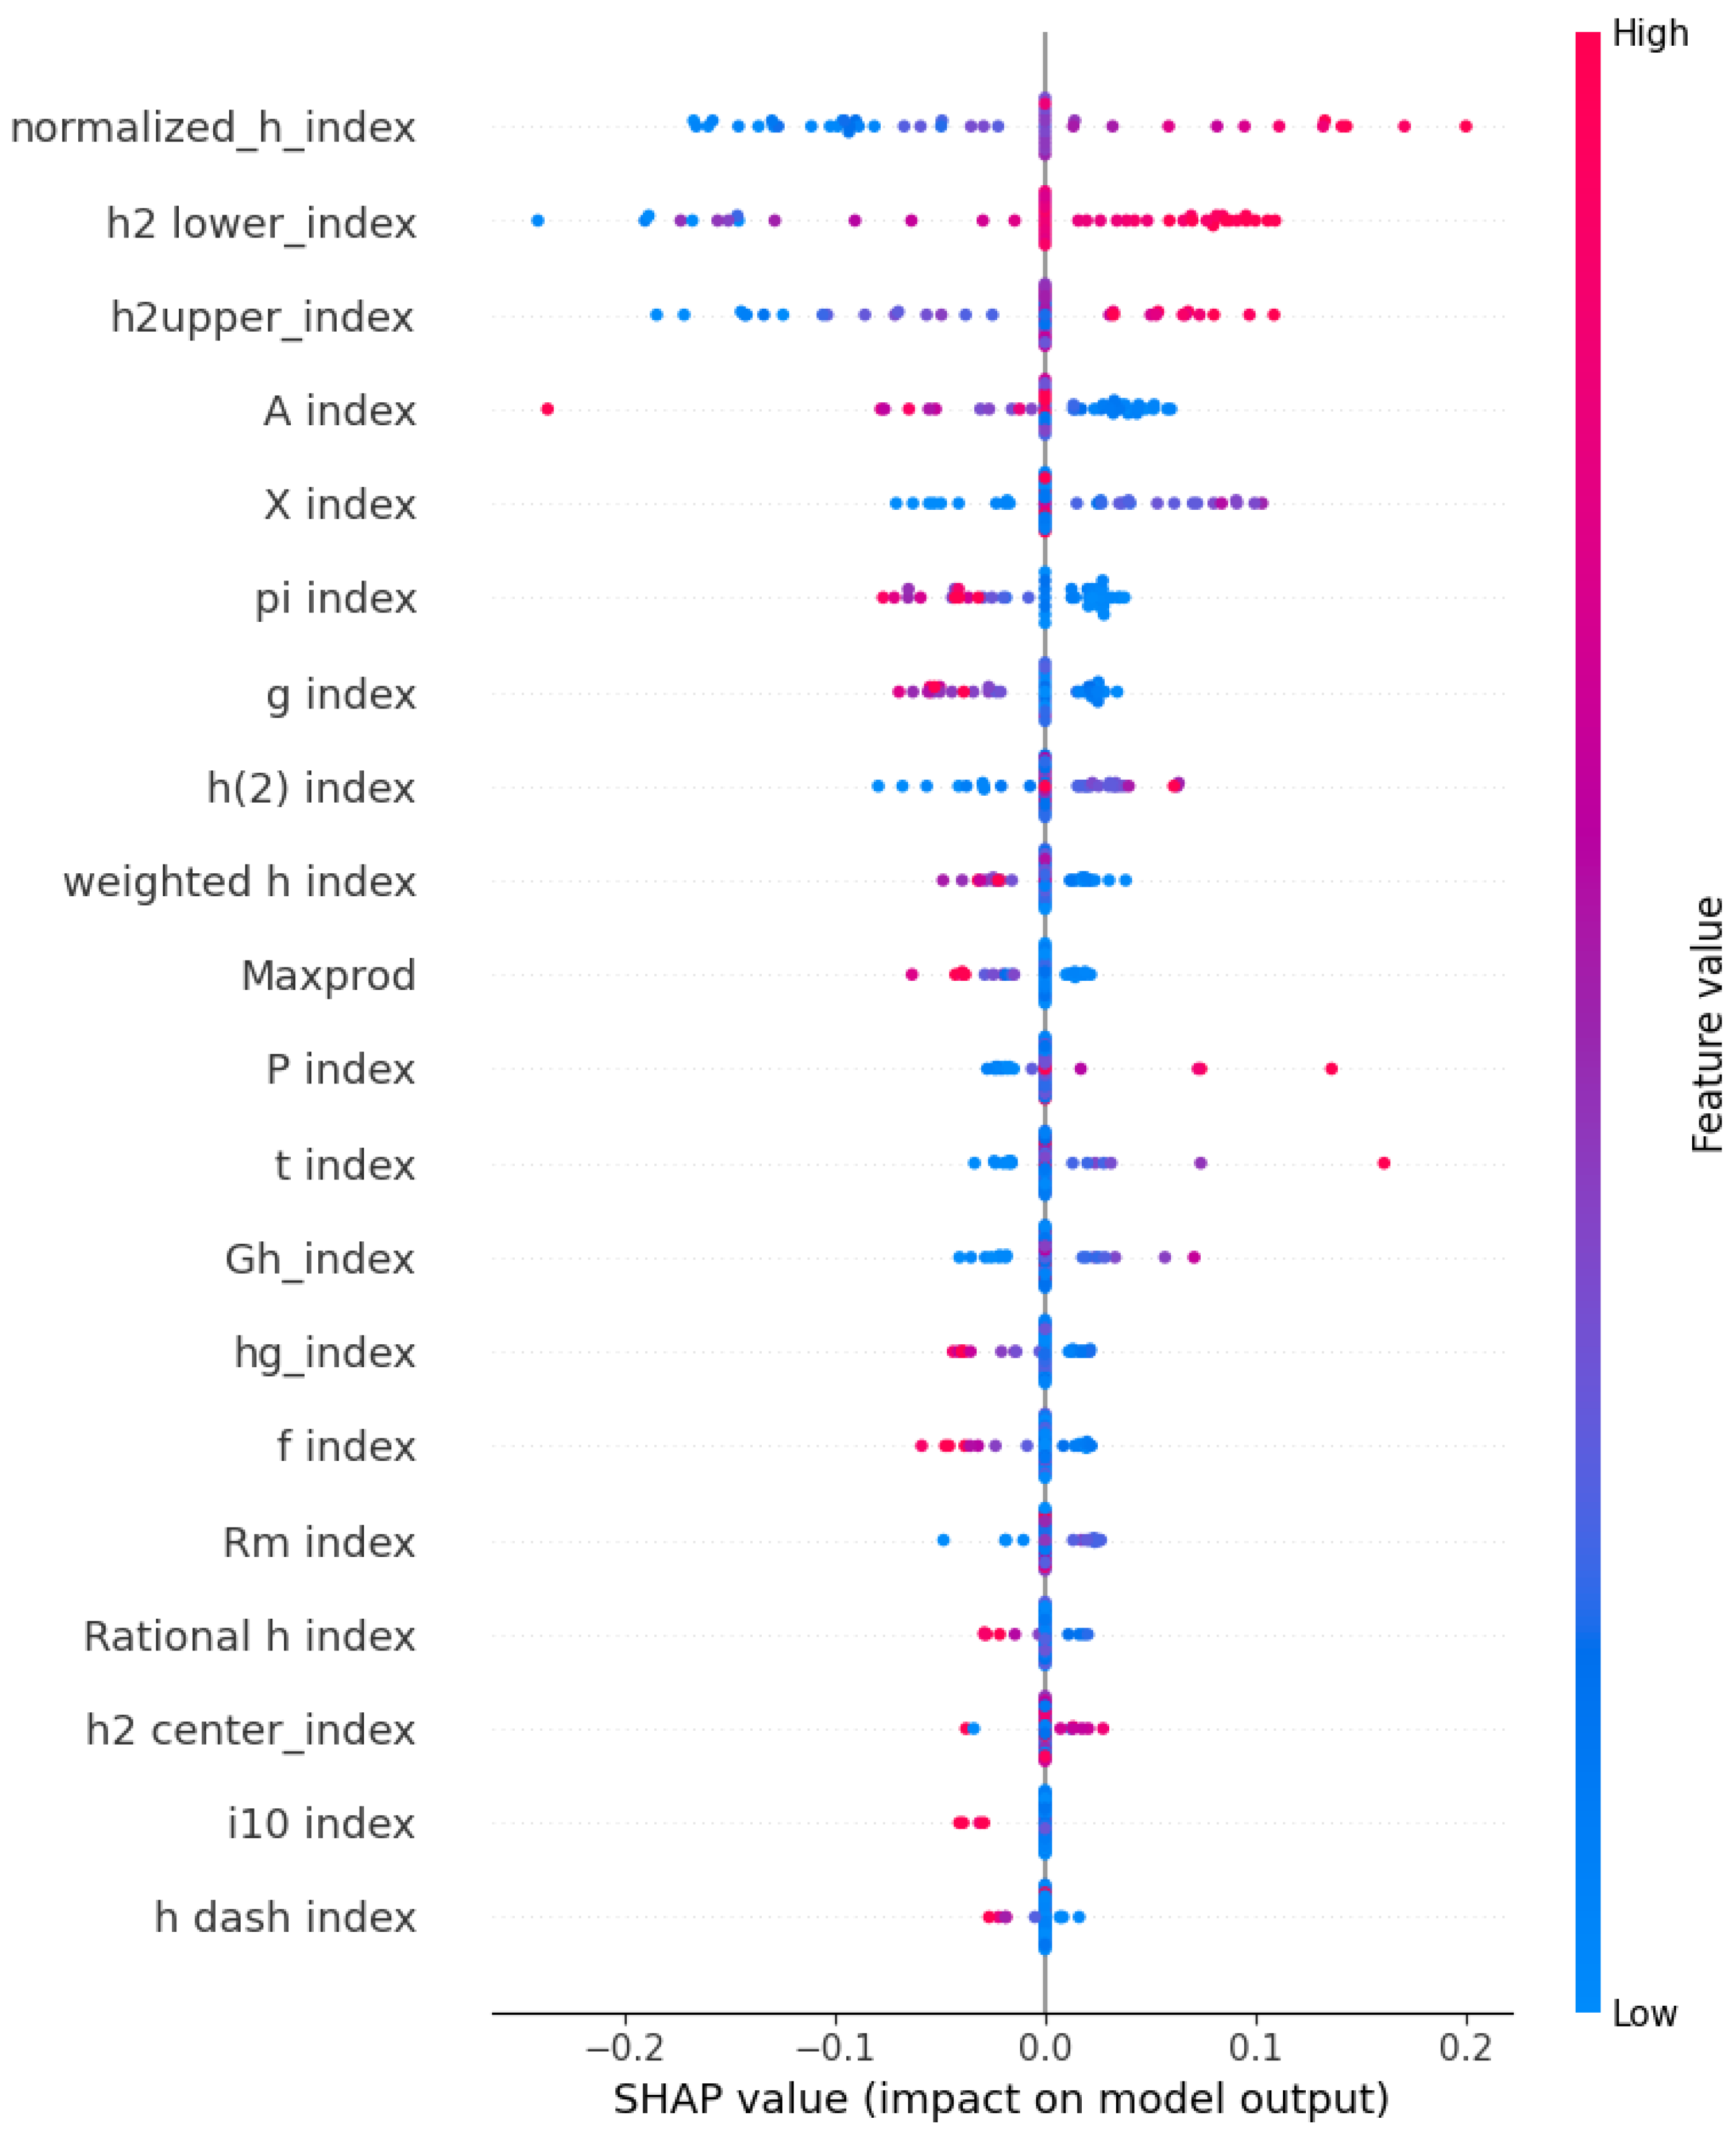
To explain which bibliometric characteristics drive award recognition, SHAP was applied to the best-performing model in each domain. SHAP summary plots rank features by mean absolute SHAP value; positive values push predictions toward the awardee class and negative values toward the non-awardee class. High feature values are shown in red and low values in blue. All indices appearing in the SHAP figures are defined in Table 11.

4.4.1. Computer Science

Figure 8 shows that h 2 -lower index, h 2 -center index, A-index, normalized h-index, and weighted h-index are the most influential features in Computer Science. From a scientometric perspective, the dominance of h 2 -family indices and the A-index reflects the importance of citation concentration within the h-core: award-winning computer scientists tend not only to have a high h-index but to have substantially more citations per paper within that core than non-awardees. The normalized h-index captures productivity efficiency, a high h-index relative to total publications, which distinguishes researchers with focused, high-impact output from those with high volume but diffuse impact [5].

4.4.2. Neuroscience

In Neuroscience (Figure 9), R m -index, q 2 -index, h-index, w-index, and G h -index dominate predictions. The prominence of the R m -index, which combines citation impact within the h-core with career-length normalization, is consistent with Neuroscience’s high citation intensity and long-form research careers typical of biomedical fields [4]. The w-index, which requires papers to exceed a high citation threshold (≥10k citations), reflects the field’s culture of landmark publications accumulating citations over decades. The broader distribution of feature influence across more indices, compared to other domains, explains why XGBoost and AdaBoost, which capture nonlinear feature interactions, outperform linear models in this domain.

4.4.3. Mathematics

For Mathematics (Figure 10), normalized h-index, h 2 -lower, h 2 -upper, A-index, and X-index are the most prominent. The strong influence of the normalized h-index is theoretically consistent with the publication culture of mathematics: mathematicians typically publish fewer papers than researchers in experimental disciplines, but each paper carries substantial citation weight. Consequently, productivity efficiency, captured by the normalized h-index, is a stronger discriminator than raw publication count. The prominence of h 2 -family indices further confirms that the structural distribution of citations above the h-core threshold, rather than its magnitude alone, characterizes award-worthy mathematical output. This is consistent with Mathematics achieving the highest cross-domain ROC-AUC (0.88), indicating that these structural features provide strong discriminative power.

4.4.4. Civil Engineering

In Civil Engineering (Figure 11), P-index (total publications), h 2 -upper, q 2 -index, X-index, and g-index are the most influential. The prominence of the P-index indicates that raw publication volume plays a stronger role in distinguishing awardees in Civil Engineering than in Mathematics, consistent with the applied research culture of the field where sustained output across project-based research is expected [29]. However, the co-prominence of h 2 -upper and q 2 -index confirms that productivity alone is insufficient; citation balance and structural impact remain essential discriminators. This dual requirement is also reflected in the descriptive statistics, where non-awardees in Civil Engineering actually have higher mean h-index and publication counts than awardees, suggesting that citation structure rather than raw volume is the true differentiator.

4.4.5. Cross-Domain Summary of Influential Indices

Table 12 summarizes dominant indices across domains. The consistent cross-domain emergence of normalized h-index, h 2 -family indices, q 2 -index, and g-index supports the theoretical argument that award recognition is associated not merely with research volume but with the structural balance of scholarly impact, the distribution and efficiency of citations relative to productivity. Domain-specific variations reflect genuine differences in publication norms and citation cultures rather than model artifacts.
Across all domains, normalized and balance-oriented indices repeatedly emerge as influential predictors, while domain-specific patterns reflect disciplinary differences in how scholarly excellence is expressed and recognized. These results demonstrate that the framework provides both predictive effectiveness and transparent, theoretically grounded evidence regarding the bibliometric characteristics associated with academic recognition.
The cross-domain pattern of feature generalization reflects a fundamental distinction between bibliometric signals that capture universal scholarly norms and those that encode discipline specific citation cultures. Normalized and balance oriented indices, the normalized h-index, h2-family, and q2 index, generalize across all four domains because they measure productivity efficiency and citation structure, dimensions of scholarly output that underpin peer recognition regardless of how citations accumulate in a given field. In contrast, domain-specific indicators emerge where publication norms diverge most sharply from the cross-domain baseline: the Rm-index and w-index are prominent in Neuroscience because the field’s high citation intensity and landmark publication culture amplify career-normalized and threshold-based citation signals; the P-index rises in Civil Engineering because sustained output volume is a recognized marker of applied research excellence in that field; and the X-index carries greater weight in Mathematics and Civil Engineering where extreme citation events are rarer and therefore more distinguishing. This pattern suggests that a parsimonious cross-domain predictor could be constructed from the small set of balance oriented indices, with domain-specific indices added as supplementary signals when the deployment domain is known a direction for future framework refinement.

5. Discussion

The empirical evaluation demonstrates that machine learning models can effectively distinguish award-winning researchers from non-awardees using publication count-based bibliometric indices. Across the four examined disciplines, predictive performance varied according to disciplinary publication and citation structures, with domain-specific F1-scores ranging from 0.70 (Computer Science) to 0.78 (Mathematics) and ROC-AUC values from 0.75 to 0.88. XGBoost achieved the strongest results in Mathematics (F1 = 0.78 ; ROC-AUC = 0.88 ) and Neuroscience (F1 = 0.73 ; ROC-AUC = 0.79 ), indicating that gradient boosting is better suited to domains with complex nonlinear bibliometric feature interactions. SVM performed best in Computer Science (F1 = 0.70 ; ROC-AUC = 0.75 ) and Civil Engineering (F1 = 0.72 ; ROC-AUC = 0.76 ), where the feature space exhibits stronger margin-based separability. These patterns suggest that no single classifier dominates universally; rather, the optimal model reflects the underlying citation and productivity structure of each discipline. Overall, margin-based and ensemble methods consistently outperformed probabilistic and single-tree models, confirming that publication-based features contain sufficient predictive signal to support reliable awardee classification when analyzed through supervised learning frameworks.
Comparison with prior studies further highlights the contribution of the proposed framework. Earlier scientometric research largely focused on evaluating individual indices or comparing their descriptive performance within specific disciplines [4,29]. Studies examining h-index variants demonstrated that no single metric consistently captures all dimensions of scholarly impact across domains. More recent predictive work has made progress: Alshdadi et al. [1] achieved prediction accuracy up to 70% using deep learning, while Usman et al. [15] applied logistic regression within a single domain. The present framework advances beyond these contributions in three specific ways. First, it evaluates eight classifiers simultaneously across four heterogeneous disciplines, enabling systematic cross-domain robustness assessment that prior single-domain studies could not provide. Second, unlike the deep learning approach of Alshdadi et al., which operates as a black-box system, the present framework integrates SHAP-based explainability that identifies which specific bibliometric features drive predictions, a critical requirement for institutional adoption. Third, by engineering thirty-two publication count-based indices organized into conceptual categories, productivity, impact, and structural balance, the framework evaluates the joint predictive contribution of multiple indices rather than treating them in isolation. These combined advances represent a meaningful step toward systematic, transparent, and generalizable bibliometric evaluation.
The interpretability analysis provides further insight into the bibliometric characteristics associated with academic recognition. SHAP-based feature attribution consistently identified normalized and balance-oriented indices as influential predictors across all four domains. Indicators such as the normalized h-index, h 2 -type variants, q 2 -index, and g-index emerged repeatedly among the most important features. These indices capture balanced productivity and citation concentration rather than relying solely on total publication counts or raw citation totals. This pattern aligns with established scientometric theory: Bornmann and Daniel [5] argued that composite indices better reflect scholarly influence than primitive metrics precisely because they capture the structural distribution of citations rather than their aggregate. The present findings provide empirical, cross-domain confirmation of this argument within a predictive rather than purely descriptive framework, suggesting that the same structural properties associated with scholarly influence in theory are also those that distinguish recognized researchers in practice. In practical terms, this transparency directly informs how the framework can be deployed responsibly in institutional settings: for example, a grant committee or promotion panel could use the model to rank a large candidate pool by predicted awardee probability, surfacing the top decile of researchers for detailed human review, analogous to how abstract-screening tools are used in systematic literature reviews, rather than applying it as a binary decision system. The SHAP explanations further allow evaluators to interrogate why a candidate ranks highly, for instance, whether their score is driven by sustained productivity efficiency or by citation concentration within the h-core, enabling informed and accountable judgment rather than uncritical acceptance of model outputs.
Domain-specific variations in feature importance reveal the influence of disciplinary publication cultures. In Neuroscience, the R m -index and w-index exhibited stronger influence, reflecting the field’s high citation intensity and the prominence of landmark publications that accumulate citations over long periods—both of which are captured by these citation-intensive, career-normalized indices. In Mathematics, the normalized h-index and h 2 -family metrics dominated, reflecting the relatively lower publication frequency and longer citation half-lives typical of theoretical disciplines, where productivity efficiency rather than volume is the distinguishing characteristic. Civil Engineering demonstrated a mixed pattern in which productivity-based indices such as the P-index interacted with citation balance metrics, reflecting the applied research culture of the field. Notably, the descriptive statistics revealed that non-awardees in Civil Engineering had higher raw h-index and publication counts than awardees on average, reinforcing that raw volume is insufficient and that citation structure is the decisive discriminator. These differences highlight the importance of evaluating bibliometric indicators within cross-domain frameworks rather than assuming universal applicability across disciplines.
The integration of SHAP-based interpretability has important methodological implications for scientometric evaluation. Traditional machine learning models frequently operate as opaque systems, limiting their practical adoption in academic decision-making contexts where transparency is essential [1]. By decomposing model predictions into additive feature contributions, the proposed framework transforms predictive modeling into an explainable decision-support mechanism. Institutions and funding agencies can therefore not only generate predictions regarding potential award recognition but also understand the specific bibliometric characteristics underlying those predictions. This transparency supports more evidence-based and accountable assessment of scholarly impact, and allows decision-makers to interrogate and challenge model outputs rather than accepting them uncritically.
The deployment of bibliometric prediction frameworks in institutional evaluation contexts raises important ethical considerations that must be addressed alongside predictive performance. Three concerns are particularly relevant. First, dataset bias: the present study relies on award lists from specific professional societies, which may not represent the full diversity of research excellence across career stages, geographic regions, or underrepresented communities. Researchers from lower-resource institutions, early-career scholars, or those working in interdisciplinary areas that are underrepresented in major award programs may be systematically disadvantaged by frameworks trained on such data. Second, model fairness: the misclassification analysis revealed that awardees with atypical bibliometric profiles, for example, those recognized for a single landmark contribution, are more likely to be classified as non-awardees. Deploying a framework that penalizes non-standard excellence patterns would reinforce existing structural inequities rather than correct them. Third, and critically, metric gaming: if institutional evaluations were to formally incorporate bibliometric prediction scores, researchers might optimize their behavior to inflate the specific indices identified as influential by the model, such as normalized h-index or h 2 -family indices, at the expense of genuine scientific contribution. This is a well-documented risk in bibliometric policy contexts [2] and argues strongly for using such frameworks as decision-support tools rather than decision-making systems. The present framework is intended to support human judgment, not replace it.
Several limitations of the present study should be acknowledged. The analysis focuses exclusively on publication count-based bibliometric indices and does not incorporate citation-age adjustments, collaboration-network measures, or temporal career dynamics, features that may capture additional dimensions of scholarly impact relevant to award recognition. The reliance on a single data source (Google Scholar via Publish or Perish) introduces potential indexing inconsistencies across disciplines, as Google Scholar’s coverage varies in depth and completeness between fields. The non-awardee matching strategy, while designed to reduce selection bias, relied on publication volume as the primary matching criterion; other potential confounders, such as career stage, institutional affiliation, and sub-disciplinary specialization, were not controlled. Finally, although the framework was validated across four disciplines, broader coverage of research fields, particularly humanities, arts, and interdisciplinary domains, and larger, more diverse datasets would strengthen generalizability.

6. Conclusions and Future Work

This study investigated whether machine learning techniques can reliably and transparently predict academic award recognition using publication count-based bibliometric indices. An interpretable multi-domain evaluation framework was developed and applied to four disciplines, Computer Science, Neuroscience, Mathematics, and Civil Engineering, integrating structured data collection, feature computation, supervised classification, stratified cross-validation, and SHAP-based explainability. By combining predictive modeling with interpretable analysis, the study advances beyond descriptive bibliometric comparisons toward a systematic, transparent, and cross-domain evaluation methodology.
Unlike traditional approaches that evaluate individual indices independently, the proposed framework integrates thirty-two publication count-based bibliometric indicators, organized into productivity-based, impact-based, and structural balance categories, within a unified predictive modeling pipeline. Eight supervised machine learning algorithms were evaluated to examine their ability to classify award-winning and non-award-winning researchers. The integration of comprehensive feature engineering, stratified five-fold cross-validation, ROC-AUC evaluation, and SHAP-based interpretability enabled a rigorous assessment of both predictive accuracy and the relative contribution of bibliometric features, with standard deviations reported to characterize result variability.
The empirical results reveal several important findings. Predictive performance differs across disciplines, reflecting domain-specific publication and citation structures; Mathematics achieved the highest discriminative performance (ROC-AUC = 0.88 ), while Computer Science presented the most challenging classification task (ROC-AUC = 0.75 ). XGBoost demonstrated the strongest performance in citation-intensive domains (Mathematics and Neuroscience), while SVM was more effective in domains with stronger margin-based separability (Computer Science and Civil Engineering). SHAP-based interpretability analysis consistently identified normalized and balance-oriented indices, including the normalized h-index, h 2 variants, q 2 -index, and g-index, as the most influential predictors across domains, providing empirical cross-domain confirmation that structural citation balance rather than raw productivity volume characterizes award-worthy scholarly output.
The findings demonstrate that publication count-based bibliometric indicators, when analyzed within an interpretable machine learning framework, provide meaningful and theoretically grounded signals for understanding academic recognition patterns. The integration of SHAP transforms the predictive model from a purely statistical classifier into a transparent decision-support mechanism, essential in evaluation contexts where fairness, accountability, and transparency are critical. The proposed framework is not intended to automate academic evaluation decisions, but rather to augment human judgment with evidence-based, explainable insights. Importantly, the ethical implications of such frameworks, including dataset bias, model fairness, and the risk of metric gaming, must be carefully considered before any institutional deployment, and the framework should be applied as a transparent support tool rather than a prescriptive decision system. It is important to note that all reported metrics are evaluated under a balanced 1:1 class distribution arising from the matched dataset design, and should not be interpreted as reflecting deployment performance under real-world class priors. A prior sensitivity analysis (Section 4.3) demonstrates that adjusted precision falls substantially at realistic awardee prevalence rates, reinforcing that the proposed framework is designed as a ranking and screening tool to support human judgment rather than as a standalone decision-making system. Probability calibration and evaluation under natural class priors are identified as essential directions for future work before any institutional deployment.
Despite these contributions, several limitations remain. The analysis is restricted to publication count-based indices and does not incorporate citation-age adjustments, collaboration-network features, or longitudinal career dynamics. The reliance on a single data source (Google Scholar via Publish or Perish) introduces potential coverage inconsistencies across disciplines. The non-awardee matching strategy, while structured to reduce selection bias, did not control for confounders such as career stage or institutional affiliation. Finally, the framework was validated across four disciplines; broader domain coverage and larger, more diverse datasets would further strengthen generalizability.
A further limitation concerns the evaluation setting. The dataset was constructed using a matched 1:1 design, which means both the training and test sets reflect a balanced class distribution rather than the natural prevalence of awardees in any real academic population. As demonstrated in Section 4.3, precision under realistic awardee prevalence rates of 1–5% falls to between 2% and 17% across domains, substantially below the balanced test estimates. Probability calibration, threshold adjustment, and evaluation under realistic class priors are therefore necessary prerequisites before this framework is applied in any institutional setting.
Future research can extend this framework in several directions. Incorporating citation-age-adjusted indices, collaboration-network measures, and temporal bibliometric trajectories would provide a more complete representation of scholarly influence. The inclusion of formal statistical significance tests, such as McNemar’s test for pairwise classifier comparison or Friedman tests across multiple domains, would strengthen the statistical rigor of cross-model comparisons. Fairness-aware machine learning approaches, such as adversarial debiasing or constraint-based optimization, could address the dataset bias and model fairness concerns identified in this study. Extending the framework to additional disciplines, particularly humanities, social sciences, and interdisciplinary fields, and applying longitudinal modeling of academic careers would broaden applicability. Finally, integrating the framework with real-time bibliometric APIs (e.g., Semantic Scholar, OpenAlex) would support dynamic, continuously updated evaluation pipelines. Through these extensions, predictive scientometric evaluation may evolve toward more robust, fair, transparent, and context-aware mechanisms for assessing scholarly impact.


Author Contributions

Conceptualization, M.S.Q., H.Z.M. and G.M.; methodology, M.S.Q. and H.Z.M.; software, M.S.Q.; validation, M.S.Q. and G.M.; formal analysis, M.S.Q.; investigation, M.S.Q.; data curation, M.S.Q.; visualization, M.S.Q.; writing—original draft preparation, M.S.Q.; writing—review and editing, G.M., I.D.l.T.D., E.C.M. and M.S.G.d.M.; supervision, M.T.A.; project administration, M.T.A.; resources, I.D.l.T.D., E.C.M. and M.S.G.d.M. All authors have read and agreed to the published version of the manuscript.

Funding

This research received no external funding.

Institutional Review Board Statement

Not applicable. The study did not involve human participants, animal subjects, patient data, or any form of sensitive personal information. The research was conducted using publicly available bibliometric data.

Informed Consent Statement

Not applicable. The study did not involve human participants or patient data.

Data Availability Statement

The bibliometric datasets generated and analyzed during this study are publicly available at https://github.com/Dr-GMustafa/research-datasets.git (accessed on 12 December 2025). All data were collected from publicly accessible sources and processed in accordance with reproducibility standards.

Acknowledgments

The authors acknowledge the use of Python 3.10 for dataset processing, experimental analysis, and generation of figures and result visualizations. The authors also acknowledge the use of draw.io for creating the methodology workflow and other related diagrams included in this manuscript.

Conflicts of Interest

The authors declare no conflicts of interest.

References

  1. Alshdadi, A.A.; Usman, M.; Alassafi, M.O.; Afzal, M.T.; AlGhamdi, R. Formulation of rules for the scientific community using deep learning. Scientometrics 2023, 128, 1825–1852. [Google Scholar] [CrossRef]
  2. Bihari, A.; Tripathi, S.; Deepak, A. A review on h-index and its alternative indices. J. Inf. Sci. 2023, 49, 624–665. [Google Scholar] [CrossRef]
  3. Kanwal, B.; Shoukat, R.S.; Rehman, S.U.; Kundi, M.; AlSaedi, T.; Alahmadi, A. A New Framework for Scholarship Predictor Using a Machine Learning Approach. Intell. Autom. Soft Comput. 2024, 39, 829. [Google Scholar] [CrossRef]
  4. Ameer, M.; Afzal, M.T. Evaluation of h-index and its qualitative and quantitative variants in Neuroscience. Scientometrics 2019, 121, 653–673. [Google Scholar] [CrossRef]
  5. Bornmann, L.; Mutz, R.; Daniel, H.-D. Are there better indices for evaluation purposes than the h index? A comparison of nine different variants of the h index using data from biomedicine. J. Am. Soc. Inf. Sci. Technol. 2008, 59, 830–837. [Google Scholar] [CrossRef]
  6. Arsalan, M.H.; Mubin, O.; Al Mahmud, A.; Khan, I.A.; Hassan, A.J. Mapping Data-Driven Research Impact Science: The Role of Machine Learning and Artificial Intelligence. Metrics 2025, 2, 5. [Google Scholar] [CrossRef]
  7. Hirsch, J.E. An index to quantify an individual’s scientific research output. Proc. Natl. Acad. Sci. USA 2005, 102, 16569–16572. [Google Scholar] [CrossRef]
  8. Egghe, L. Theory and practise of the g-index. Scientometrics 2006, 69, 131–152. [Google Scholar] [CrossRef]
  9. Jin, B.; Liang, L.; Rousseau, R.; Egghe, L. The R-and AR-indices: Complementing the h-index. Chin. Sci. Bull. 2007, 52, 855–863. [Google Scholar] [CrossRef]
  10. Alonso, S.; Cabrerizo, F.J.; Herrera-Viedma, E.; Herrera, F. h-Index: A review focused in its variants, computation and standardization for different scientific fields. J. Inf. 2009, 3, 273–289. [Google Scholar] [CrossRef]
  11. Ahmad, I.; Shahid, A.; Khan, S.U.; Hussain, T.; Akbar, W.; Attar, R.W.; Alhazmi, A.H. Comparative analysis of h-index variants using an extensive dataset. Scientometrics 2026, 131, 1393–1414. [Google Scholar] [CrossRef]
  12. Katsaros, D.; Akritidis, L.; Bozanis, P. The f index: Quantifying the impact of coterminal citations on scientists’ ranking. J. Am. Soc. Inf. Sci. Technol. 2009, 60, 1051–1056. [Google Scholar] [CrossRef]
  13. Mustafa, G.; Rauf, A.; Al-Shamayleh, A.S.; Ahmed, B.; Alrawagfeh, W.; Afzal, M.T.; Akhunzada, A. Exploring the significance of publication-age-based parameters for evaluating researcher impact. IEEE Access 2023, 11, 86597–86610. [Google Scholar] [CrossRef]
  14. Thafar, M.A.; Alsulami, M.M.; Albaradei, S. FutureCite: Predicting Research Articles’ Impact Using Machine Learning and Text and Graph Mining Techniques. Math. Comput. Appl. 2024, 29, 59. [Google Scholar] [CrossRef]
  15. Usman, M.; Mustafa, G.; Afzal, M.T. Ranking of author assessment parameters using logistic regression. Scientometrics 2021, 126, 335–353. [Google Scholar] [CrossRef]
  16. Bornmann, L.; Mutz, R.; Daniel, H.-D. The h index research output measurement: Two approaches to enhance its accuracy. J. Inf. 2010, 4, 407–414. [Google Scholar] [CrossRef]
  17. Sidiropoulos, A.; Katsaros, D.; Manolopoulos, Y. Generalized Hirsch h-index for disclosing latent facts in citation networks. Scientometrics 2007, 72, 253–280. [Google Scholar] [CrossRef]
  18. Dienes, K.R. Completing h. J. Inf. 2015, 9, 385–397. [Google Scholar] [CrossRef]
  19. Dorta-Gonzalez, P.; Dorta-González, M.-I. Impact maturity times and citation time windows: The 2-year maximum journal impact factor. J. Inf. 2013, 7, 593–602. [Google Scholar] [CrossRef]
  20. Zhang, C.-T. The e-index, complementing the h-index for excess citations. PLoS ONE 2009, 45, e5429. [Google Scholar] [CrossRef] [PubMed]
  21. Tol, R. The h-index and its alternatives: An application to the 100 most prolific economists. Scientometrics 2009, 80, 317–324. [Google Scholar] [CrossRef]
  22. Wu, Q. The w-index: A significant improvement of the h-index. arXiv 2008, arXiv:0805.4650. [Google Scholar] [CrossRef]
  23. Ye, F.; Rousseau, R. Probing the h-core: An investigation of the tail–core ratio for rank distributions. Scientometrics 2010, 84, 431–439. [Google Scholar] [CrossRef]
  24. Kosmulski, M. A new Hirsch-type index saves time and works equally well as the original h-index. ISSI Newsl. 2006, 2, 4–6. [Google Scholar]
  25. Burrell, Q.L. On the h-index, the size of the Hirsch core and Jin’s A-index. J. Inf. 2007, 1, 170–177. [Google Scholar] [CrossRef]
  26. Van Raan, A.F. Comparison of the Hirsch-index with standard bibliometric indicators and with peer judgment for 147 chemistry research groups. Scientometrics 2006, 67, 491–502. [Google Scholar] [CrossRef]
  27. Schreiber, M. Self-citation corrections for the Hirsch index. Europhys. Lett. 2007, 78, 30002. [Google Scholar] [CrossRef]
  28. Schreiber, M. Fractionalized counting of publications for the g-index. J. Am. Soc. Inf. Sci. Technol. 2009, 60, 2145–2150. [Google Scholar] [CrossRef]
  29. Raheel, M.; Ayaz, S.; Afzal, M.T. Evaluation of h-index, its variants and extensions based on publication age & citation intensity in civil engineering. Scientometrics 2018, 114, 1107–1127. [Google Scholar] [CrossRef]
  30. Ahmed, B.; Wang, L.; Mustafa, G.; Afzal, M.T.; Akhunzada, A. Evaluating the effectiveness of author-count based metrics in measuring scientific contributions. IEEE Access 2023, 11, 101710–101726. [Google Scholar] [CrossRef]
  31. Ain, Q.-u.; Riaz, H.; Afzal, M.T. Evaluation of h-index and its citation intensity based variants in the field of mathematics. Scientometrics 2019, 119, 187–211. [Google Scholar] [CrossRef]
  32. Harzing, A.-W. Publish or Perish. Software. 2007. Available online: https://harzing.com/resources/publish-or-perish (accessed on 18 November 2025).
  33. Lundberg, S.M.; Lee, S.-I. A unified approach to interpreting model predictions. Adv. Neural Inf. Process. Syst. 2017, 30. [Google Scholar]
Figure 1. Overall architecture of the proposed interpretable awardee prediction framework integrating data acquisition, feature engineering, supervised learning, evaluation, and SHAP-based explainability. Eight supervised classifiers are evaluated: Logistic Regression (LR), Ridge Regression, Support Vector Machines (SVM), k-Nearest Neighbors (KNNs), Naïve Bayes (NB), Decision Trees, AdaBoost, and XGBoost (XGB).
Information 17 00515 g001
Figure 2. Comparison of all eight models across evaluation metrics for the Computer Science domain. Models are ordered by F1-score.
Information 17 00515 g002
Figure 3. Heatmap comparison of all eight models across evaluation metrics for the Neuroscience domain. Darker green indicates higher scores; red indicates lower scores.
Information 17 00515 g003
Figure 4. Radar chart comparison of all eight models across evaluation metrics for the Civil Engineering domain. The SVM profile (red) shows the largest overall area.
Information 17 00515 g004
Figure 5. Line plot comparison of all eight models across evaluation metrics for the Mathematics domain. The sharp dip at Naïve Bayes reflects the precision–recall trade-off.
Information 17 00515 g005
Figure 6. Cross-domain comparison of best-performing models across all evaluation metrics. Mathematics achieves the highest scores across all metrics.
Information 17 00515 g006
Figure 7. Cross-domain performance trends of best-performing models. The upward trajectory toward Mathematics reflects increasing bibliometric separability across domains.
Information 17 00515 g007
Figure 8. SHAP feature importance for Computer Science. Features ranked by mean absolute SHAP value. Red dots indicate high feature values; blue dots indicate low values.
Information 17 00515 g008
Figure 9. SHAP feature importance for Neuroscience. The broader spread of influential indices reflects stronger nonlinear feature interactions in this domain.
Information 17 00515 g009
Figure 10. SHAP feature importance for Mathematics. The dominance of normalized h-index reflects productivity efficiency characteristic of mathematical research.
Information 17 00515 g010
Figure 11. SHAP feature importance for Civil Engineering. The co-dominance of the P-index and h 2 -upper reflects the interplay of productivity and citation balance in this domain.
Information 17 00515 g011
Table 1. Comparison of representative studies in researcher evaluation and award prediction.
StudyDomainMethodFeatures UsedPredictiveLimitations
Hirsch (2005) [7]Physicsh-indexCitation-basedNoIgnores excess citations
Egghe (2006) [8]Generalg-indexCitation intensityNoSensitive to highly cited papers
Van Raan (2006) [26]ChemistryStatistical comparisonh-index variantsNoDomain-specific validation
Schreiber (2007) [27]PhysicsComparative analysisg-index, h-indexNoLimited dataset scope
Ain et al. (2015) [31]MathematicsEmpirical evaluationh-index variantsNoSingle-domain focus
Raheel et al. (2018) [29]Civil Eng.Comparative metricsPublication-age metricsNoNo predictive modeling
Ameer et al. (2019) [4]NeuroscienceAward ranking studyR-index, hg-indexPartialLimited generalization
Usman et al. (2021) [15]Civil Eng.Logistic RegressionBibliometric indicesYesSingle domain; no XAI
Alshdadi et al. (2023) [1]Multi-domainDeep learningMulti-index featuresYesBlack-box; single source
Ahmed et al. (2023) [30]Multi-domainStatistical analysisAuthor-count metricsPartialNo XAI integration
Proposed4 domainsML + SHAP32 pub.-based indicesYesPublication-based scope only
Table 2. Descriptive statistics (mean ± std) comparing awardee and non-awardee groups across domains.
DomainGrouph-IndexPublicationsh-Core CitationsNorm. h
Computer ScienceAwardee (n = 575) 40.3 ± 57.4 123.3 ± 305.1 22,953 ± 101,493 0.39 ± 0.24
Non-Awardee (n = 575) 38.5 ± 67.2 131.4 ± 576.7 26,405 ± 132,945 0.35 ± 0.27
NeuroscienceAwardee (n = 529) 50.2 ± 45.2 138.4 ± 146.8 19,381 ± 31,071 0.48 ± 0.24
Non-Awardee (n = 537) 42.7 ± 67.3 99.0 ± 294.1 22,609 ± 108,406 0.38 ± 0.26
MathematicsAwardee (n = 525) 40.7 ± 33.3 135.8 ± 199.0 16,172 ± 30,136 0.41 ± 0.26
Non-Awardee (n = 525) 48.8 ± 54.2 48.5 ± 61.8 16,876 ± 30,450 0.19 ± 0.15
Civil EngineeringAwardee (n = 590) 28.1 ± 32.9 43.7 ± 71.5 5768 ± 15,650 0.39 ± 0.22
Non-Awardee (n = 590) 57.4 ± 63.7 173.4 ± 418.1 27,075 ± 59,068 0.35 ± 0.27
Table 3. Class distribution of awardees and non-awardees across domains.
DomainAwardeesNon-Awardees
Computer Science575575
Neuroscience529537
Mathematics525525
Civil Engineering590590
Table 4. Representative mathematical formulations of publication-based bibliometric indices, where C k denotes citations of the k-th ranked publication, P denotes total publications, and h denotes the Hirsch index.
IndexDefinition
h-index h = max { k : C k k }
g-index g = max k : k = 1 k C k k 2
h g -index h g = h · g
A-index A = 1 h k = 1 h C k
R-index R = k = 1 h C k
Normalized h h norm = h P
q 2 -index Q 2 = h · m q
h 2 -index h 2 = max { k : C k k 2 }
Table 5. Performance of models on the Computer Science dataset (mean ± std across five cross-validation folds).
ModelAccuracyPrecisionRecallF1-ScoreROC-AUC
SVM 0.69 ± 0.03 0.70 ± 0.03 0.71 ± 0.04 0.70 ± 0.03 0.75 ± 0.04
Ridge Regression 0.68 ± 0.03 0.67 ± 0.03 0.73 ± 0.05 0.70 ± 0.03 0.74 ± 0.03
Logistic Regression 0.67 ± 0.04 0.67 ± 0.04 0.73 ± 0.05 0.69 ± 0.04 0.73 ± 0.03
AdaBoost 0.69 ± 0.04 0.70 ± 0.03 0.68 ± 0.06 0.69 ± 0.04 0.74 ± 0.04
XGBoost 0.67 ± 0.03 0.69 ± 0.02 0.67 ± 0.06 0.68 ± 0.04 0.74 ± 0.04
Naïve Bayes 0.56 ± 0.02 0.54 ± 0.01 0.94 ± 0.02 0.69 ± 0.01 0.72 ± 0.04
KNN 0.65 ± 0.04 0.65 ± 0.03 0.68 ± 0.04 0.66 ± 0.04 0.70 ± 0.04
Decision Tree 0.63 ± 0.05 0.65 ± 0.06 0.61 ± 0.04 0.63 ± 0.04 0.63 ± 0.05
Table 6. Performance of models on the Neuroscience dataset (mean ± std across five cross-validation folds).
ModelAccuracyPrecisionRecallF1-ScoreROC-AUC
XGBoost 0.73 ± 0.02 0.73 ± 0.02 0.73 ± 0.04 0.73 ± 0.03 0.79 ± 0.03
AdaBoost 0.73 ± 0.02 0.74 ± 0.03 0.70 ± 0.03 0.72 ± 0.02 0.76 ± 0.02
SVM 0.71 ± 0.03 0.70 ± 0.04 0.72 ± 0.05 0.71 ± 0.03 0.78 ± 0.03
Ridge Regression 0.69 ± 0.02 0.68 ± 0.04 0.70 ± 0.04 0.69 ± 0.02 0.76 ± 0.04
Logistic Regression 0.68 ± 0.04 0.67 ± 0.05 0.71 ± 0.06 0.69 ± 0.03 0.75 ± 0.05
KNN 0.68 ± 0.02 0.68 ± 0.03 0.70 ± 0.07 0.68 ± 0.03 0.74 ± 0.02
Naïve Bayes 0.54 ± 0.03 0.52 ± 0.02 0.94 ± 0.01 0.67 ± 0.01 0.68 ± 0.01
Decision Tree 0.65 ± 0.01 0.66 ± 0.02 0.63 ± 0.06 0.64 ± 0.03 0.65 ± 0.01
Table 7. Performance of models on the Civil Engineering dataset (mean ± std across five cross-validation folds).
ModelAccuracyPrecisionRecallF1-ScoreROC-AUC
SVM 0.71 ± 0.04 0.69 ± 0.04 0.76 ± 0.04 0.72 ± 0.04 0.76 ± 0.04
AdaBoost 0.69 ± 0.03 0.67 ± 0.02 0.77 ± 0.05 0.71 ± 0.03 0.76 ± 0.03
Naïve Bayes 0.62 ± 0.03 0.57 ± 0.02 0.93 ± 0.03 0.71 ± 0.02 0.70 ± 0.05
Ridge Regression 0.69 ± 0.04 0.67 ± 0.04 0.75 ± 0.06 0.70 ± 0.04 0.74 ± 0.04
Logistic Regression 0.69 ± 0.04 0.66 ± 0.03 0.76 ± 0.06 0.70 ± 0.04 0.74 ± 0.04
XGBoost 0.70 ± 0.03 0.69 ± 0.03 0.71 ± 0.05 0.70 ± 0.03 0.77 ± 0.03
KNN 0.69 ± 0.02 0.68 ± 0.02 0.72 ± 0.06 0.70 ± 0.03 0.73 ± 0.01
Decision Tree 0.62 ± 0.04 0.62 ± 0.04 0.64 ± 0.06 0.63 ± 0.05 0.63 ± 0.04
Table 8. Performance of models on the Mathematics dataset (mean ± std across five cross-validation folds).
ModelAccuracyPrecisionRecallF1-ScoreROC-AUC
XGBoost 0.79 ± 0.02 0.79 ± 0.03 0.78 ± 0.02 0.78 ± 0.02 0.88 ± 0.01
KNN 0.78 ± 0.02 0.78 ± 0.02 0.78 ± 0.02 0.78 ± 0.02 0.85 ± 0.01
SVM 0.78 ± 0.03 0.82 ± 0.04 0.72 ± 0.03 0.77 ± 0.03 0.86 ± 0.02
AdaBoost 0.76 ± 0.03 0.79 ± 0.05 0.73 ± 0.03 0.76 ± 0.03 0.85 ± 0.02
Ridge Regression 0.76 ± 0.03 0.77 ± 0.04 0.72 ± 0.04 0.75 ± 0.04 0.84 ± 0.02
Decision Tree 0.74 ± 0.03 0.75 ± 0.03 0.74 ± 0.04 0.74 ± 0.03 0.74 ± 0.03
Logistic Regression 0.72 ± 0.03 0.75 ± 0.04 0.68 ± 0.05 0.71 ± 0.03 0.82 ± 0.03
Naïve Bayes 0.65 ± 0.03 0.60 ± 0.02 0.93 ± 0.02 0.73 ± 0.02 0.80 ± 0.03
Table 9. Best-performing models across domains with full evaluation metrics.
DomainBest ModelAcc.Prec.RecallF1ROC-AUC
Computer ScienceSVM0.690.700.710.700.75
NeuroscienceXGBoost0.730.730.730.730.79
MathematicsXGBoost0.790.790.780.780.88
Civil EngineeringSVM0.710.690.760.720.76
Table 10. Prior sensitivity analysis: estimated real-world precision of best-performing models under three awardee prevalence scenarios (N = 1000).
DomainModelBalanced PrecisonAdjusted Precision Under Real-World Prior
π = 5 % π = 2 % π = 1 %
Computer ScienceSVM0.700.280.130.07
NeuroscienceXGBoost0.730.330.160.08
MathematicsXGBoost0.790.430.220.12
Civil EngineeringSVM0.690.270.130.06
Table 11. Definitions of all bibliometric indices appearing in SHAP figures.
IndexDefinition/Interpretation
h-indexLargest k such that k papers each have ≥k citations
Normalized h-indexh-index divided by total publications P; adjusts for career length
h 2 -lower, h 2 -upper, h 2 -centerLower bound, upper bound, and center of the h 2 -family; capture citation structure around the h-core
g-indexLargest k such that top k papers together have ≥ k 2 citations
A-indexMean citations within the h-core; measures citation intensity
R-indexSquare root of total h-core citations
R m -indexGeometric mean of R-index and m-quotient; combines impact with career normalisation
q 2 -indexGeometric mean of h-index and m-quotient; balances productivity and temporal normalisation
w-indexLargest k such that k papers each have ≥10k citations
G h -indexGeometric mean of g-index and h-index
Weighted h-indexh-index weighted by co-authorship
hg-indexGeometric mean of h-index and g-index
P-indexTotal publication count P
π -indexProductivity-impact composite index
X-indexCitation-based index capturing extreme citation events
Tapered h-indexh-index with tapered citation weighting near the h-core boundary
h-core citationsTotal citations within the h-core
t-indexTrend-based index capturing recent citation momentum
f-indexFractional h-index adjusted for co-authorship
MaxprodMaximum product of paper rank and citation count
Rational h-indexContinuous interpolated extension of h-index
wu-indexVariant of w-index with unit-based threshold
m-indexm-quotient: h-index divided by academic age
e-indexExcess citations beyond the h-core threshold
Real h-indexInterpolated continuous h-index
i10-indexNumber of publications with ≥10 citations
h-dash indexModified h-index penalising low-citation papers
k-dash indexVariant of h-dash with different penalty weighting
Table 12. Cross-domain summary of SHAP-identified influential indices and their scientometric interpretation.
DomainTop SHAP IndicesScientometric Interpretation
Computer Science h 2 -lower, h 2 -center, A-index, normalized h, weighted hCitation concentration within the h-core and productivity efficiency distinguish awardees; consistent with impact-focused CS evaluation.
Neuroscience R m , q 2 , h, w, G h Career-normalized citation impact and high-citation landmark publications dominate; reflects biomedical citation intensity and long research careers.
MathematicsNormalized h, h 2 -lower, h 2 -upper, A-index, X-indexProductivity efficiency and structural citation balance drive recognition; consistent with low-volume, high-impact publication norms in theoretical disciplines.
Civil EngineeringP-index, h 2 -upper, q 2 , X-index, gPublication volume combined with citation balance is decisive; reflects applied research culture requiring sustained output alongside impactful contributions.
Disclaimer/Publisher’s Note: The statements, opinions and data contained in all publications are solely those of the individual author(s) and contributor(s) and not of MDPI and/or the editor(s). MDPI and/or the editor(s) disclaim responsibility for any injury to people or property resulting from any ideas, methods, instructions or products referred to in the content.