Article

CPB-YOLOv8: An Enhanced Multi-Scale Traffic Sign Detector for Complex Road Environment

School of Vehicle and Traffic Engineering, Henan University of Science and Technology, Luoyang 471003, China
*
Author to whom correspondence should be addressed.
Information 2025, 16(9), 798; https://doi.org/10.3390/info16090798
Submission received: 28 July 2025 / Revised: 1 September 2025 / Accepted: 10 September 2025 / Published: 15 September 2025

Abstract

Traffic sign detection is critically important for intelligent transportation systems, yet persistent challenges like multi-scale variation and complex background interference severely degrade detection accuracy and real-time performance. To address these limitations, this study presents CPB-YOLOv8, an advanced multi-scale detection framework based on the YOLOv8 architecture. A Cross-Stage Partial-Partitioned Transformer Block (CSP-PTB) is incorporated into the feature extraction stage to preserve semantic information during downsampling while enhancing global feature representation. For feature fusion, a four-level bidirectional feature pyramid BiFPN integrated with a P2 detection layer significantly improves small-target detection capability. Further enhancement is achieved via an optimized loss function that balances multi-scale objective localization. Comprehensive evaluations were conducted on the TT100K, the CCTSDB, and a custom multi-scenario road image dataset capturing urban and suburban environments at 1920 × 1080 resolution. Results demonstrate compelling performance: On TT100K, CPB-YOLOv8 achieved 90.73% mAP@0.5 with a 12.5 MB model size, exceeding the YOLOv8s baseline by 3.94 percentage points and achieving 6.43% higher small-target recall. On CCTSDB, it attained a near-saturation performance of 99.21% mAP@0.5. Crucially, the model demonstrated exceptional robustness across diverse environmental conditions. Rigorous analysis on partitioned CCTSDB subsets based on weather and illumination, alongside validation using a separate self-collected dataset reserved solely for inference, confirmed strong adaptability to real-world distribution shifts and low-visibility scenarios. Cross-dataset validation and visual comparisons further substantiated the model’s robustness and its effective suppression of background interference.

Graphical Abstract

1. Introduction

The rapid advancement of autonomous driving technology and Intelligent Transportation Systems (ITSs) has established traffic sign detection as a critical component for ensuring the safety and regulatory compliance of autonomous vehicles. Consequently, enabling accurate and real-time traffic sign detection and recognition has become a fundamental requirement for enhancing road safety [1,2]. As the primary medium conveying road traffic information, traffic signs communicate essential directives—including warnings, prohibitions, and speed limits—through standardized shapes, colors, and symbols. Consequently, the reliability of intelligent driving systems is directly contingent upon the accuracy of traffic sign detection [3,4,5]. However, real-world road environments introduce significant complexities, such as variations in illumination, multi-scale differences in sign dimensions, and transient obstructions, which substantially impede detection and recognition performance. Therefore, the development of robust and adaptive traffic sign detection algorithms presents considerable research value and practical significance.
Recent advances in deep learning have substantially propelled the development of traffic sign detection algorithms. Contemporary target detection frameworks predominantly employ convolutional neural networks (CNNs) for feature extraction, which are broadly categorized into two-stage and one-stage detectors. Two-stage algorithms, exemplified by the R-CNN [6] series (including Faster R-CNN [7], Cascade R-CNN [8], and Sparse R-CNN [9]), utilize a region proposal network (RPN) to generate candidate regions. Subsequently, a CNN extracts features from each proposal for classification and bounding box regression. While offering design flexibility and high detection accuracy in complex scenes due to refined region proposal screening, these methods suffer from computationally intensive dense proposal generation, hindering real-time performance. To overcome the inference speed bottleneck, one-stage detectors emerged, eliminating the explicit region proposal step and enabling end-to-end prediction of target locations and categories directly on feature maps. Algorithms such as SSD [10], RetinaNet [11], and the YOLO [12] series have become mainstream solutions for real-time applications. By optimizing network architectures and feature fusion strategies, these methods achieve substantial acceleration in processing speed while preserving high detection accuracy, particularly in critical domains such as intelligent driving and traffic sign detection. Among these, YOLOv8s, a lightweight variant of YOLOv8, achieves an enhanced balance between computational efficiency and parameter count through techniques including Cross-Stage Partial (CSP) networks [13] and dynamic label assignment. Notwithstanding its efficient inference capability, the YOLOv8s backbone network exhibits limitations in extracting fine-grained details from small traffic signs. The inherent constraints of traditional convolution operations, characterized by limited local receptive fields, impede effective modeling of long-range dependencies and semantic associations within residual features. This deficiency contributes to an elevated missed detection rate. Furthermore, the model demonstrates suboptimal performance in handling multi-scale signs and occlusion challenges prevalent in complex real-world environments. Consequently, enhancing multi-scale feature extraction capability and optimizing the cross-scale feature fusion mechanism represent critical research avenues for improving traffic sign detection accuracy.
To address the limitations of existing methods regarding robustness to occlusion, multi-scale feature extraction capability, and adaptation to complex backgrounds, we propose an enhanced model based on the YOLOv8s detection framework. The proposed model aims to improve traffic sign detection performance through targeted mechanism optimization and novel structural components. Specifically, a CSP-PTB hybrid module is incorporated into the backbone network to enhance feature extraction. This module, combined with a BiFPN [14] and an auxiliary P2 detection head, forms a multi-scale feature collaborative extraction framework. Furthermore, the Wise-IoU v3 [15] loss function is introduced to refine bounding box regression. The key innovations of this work are detailed as follows:
Synergistic Feature Learning with CSP-PTB: To preserve crucial semantic information for small and occluded targets during downsampling, we introduce the CSP-PTB module into the backbone. This design uniquely combines the local feature extraction strengths of CNNs with the global context modeling capabilities of Transformers through a cross-stage partial connection strategy. This synergistic combination, rather than either alone, is key to enhancing the model’s representation power for challenging TSD scenarios.
Enhanced Multi-Scale Fusion with P2-BiFPN: Moving beyond standard feature pyramids, we construct a four-level BiFPN integrated with an auxiliary P2 detection layer. This design is explicitly targeted at capturing fine-grained spatial details from early layers that are vital for detecting tiny traffic signs (often < 1% of image pixels), which are typically lost in deeper networks. The bi-directional fusion pathway ensures that both high-semantic and high-resolution information is effectively utilized across all scales.
Optimized Training for Real-World Robustness: To improve localization accuracy under common real-world conditions like partial occlusion, we adopt the Wise-IoU v3 loss function. Its adaptive focusing mechanism is strategically chosen to penalize low-quality examples and balance the learning of targets across different scales, leading to a more robust and generalizable detector.
Extensive and Rigorous Validation: We provide a thorough evaluation not just on standard benchmarks but also on a custom dataset and under partitioned scenarios (weather and illumination). This comprehensive validation strategy rigorously demonstrates the model’s superior robustness and practical utility in dealing with distribution shifts and low-visibility environments, which is a critical step towards real-world deployment.

2. Related Works

This section reviews the existing literature on Traffic Sign Detection (TSD), encompassing both early traditional methodologies and recent advanced research grounded in deep learning. Furthermore, to establish a foundation for subsequent investigations, the structure and key architectural innovations of the YOLOv8 network are delineated.

2.1. Traffic Sign Detection

TSD constitutes a critical task within Intelligent Transportation Systems (ITS). Its objective is the accurate localization and recognition of traffic signs within complex road environments, thereby providing essential information for subsequent decision-making. Traditional TSD methodologies primarily rely on exploiting the distinct physical characteristics of traffic signs—namely, color and shape—to segment them from the background, followed by classification using trained models [16,17]. The color-based detection method segments targets by applying thresholds within specific color spaces, such as RGB (Red, Green, and Blue) and HSV (Hue, Saturation, and Value). However, these methods exhibit significant sensitivity to illumination variations and environmental interference, resulting in unstable detection performance [18,19]. The shape-based detection method enhances localization accuracy by identifying geometric features (e.g., triangles, circles, rectangles, and polygons) characteristic of traffic signs. Nevertheless, both categories of traditional algorithms demonstrate high vulnerability to external factors, including scale variations in the signs themselves and partial occlusion, which substantially degrade their detection efficacy [20].
Traditional methodologies are constrained by the limited scene adaptability inherent in handcrafted feature engineering. This reliance often results in missed and false detections due to insufficient feature generalization capability, thereby forming a significant bottleneck for achieving higher detection accuracy [21]. In recent years, deep learning-based approaches for TSD have gained significant traction. CNNs have subsequently emerged as the dominant paradigm within the TSD field, largely displacing traditional techniques by demonstrating outstanding performance on publicly available benchmark datasets. Crucially, CNN-based methods autonomously learn hierarchical visual features directly from data, endowing them with superior representational capacity for traffic signs under varying environmental conditions [22,23]. To address the challenge of low detection accuracy in real road scenes, Liang et al. [24] proposed an enhanced Sparse R-CNN framework. This framework integrates the Coordinate Attention Block (CAB) module within the ResNeSt backbone, reinforces multi-scale feature representation through a feature pyramid network (FPN), and employs a SAA-DTA joint enhancement mechanism. These enhancements collectively improve the model’s adaptability to complex scenes at both training and inference stages, significantly boosting detection performance. Concurrently, aiming to enhance multi-scale traffic sign detection accuracy, Wang et al. [25] developed an AF-FPN based on YOLOv5. AF-FPN incorporates an Adaptive Attention Module (AAM) and a Feature Enhancement Module (FEM) to mitigate information loss during feature map generation and strengthen the representational capacity of the feature pyramid, thereby improving the YOLOv5 network’s performance on multi-scale targets. Addressing the specific issue of small-target traffic sign missed detection, Wei et al. [26] innovatively implemented a single-layer feature fusion architecture. They designed a Feature Fusion Module (FFM) to fuse multi-scale contextual information within a single feature layer, circumventing the computational redundancy of traditional FPNs, and developed a Corner Dilated Encoder (CDE) that utilizes dilated convolution to enhance corner features and localization accuracy, offering a promising approach for lightweight deployment. Further tackling small target leakage detection in complex environments, Wang et al. [27] proposed the VATSD adaptive detector. Key innovations include the Dense Cross-Stage Partial (DCSP) feature tight fusion module, which enhances small-target feature representation with only a 0.8% parameter increase, and the Image Enhancement Network (IENet) dynamic filtering enhancement network, enabling adaptive optimization for images under varying conditions to improve detection robustness in dynamic environments. Finally, focusing on the bottleneck of dense small target detection, Wang et al. [28] introduced the BANet. BANet incorporates the Multi-Channel Attention block (MCA)to strengthen fundamental semantics via joint encoding of multi-level features, innovates the α-EIoU dynamic loss function optimized for small target localization, and constructs a Multiple Attention Fusion (MAF) mechanism to suppress information attenuation, collectively achieving effective improvement in small target detection accuracy.

2.2. YOLO Series and Baseline Justification

The YOLO series has evolved rapidly since the release of YOLOv8. Subsequent versions like YOLOv9 [29], which introduced Programmable Gradient Information (PGI) and GELAN, and YOLOv10 [30], which emphasized non-suppression end-to-end deployment, have further advanced the state-of-the-art. More recent iterations, including those up to YOLOv12 from the community, continue to explore enhanced architectures and training strategies. This study employs YOLOv8s as its baseline due to its proven efficiency-accuracy balance, modular transparency, and widespread adoption as a benchmark, which provides a stable foundation for fairly evaluating our proposed CSP-PTB and BiFPN-P2 modules.
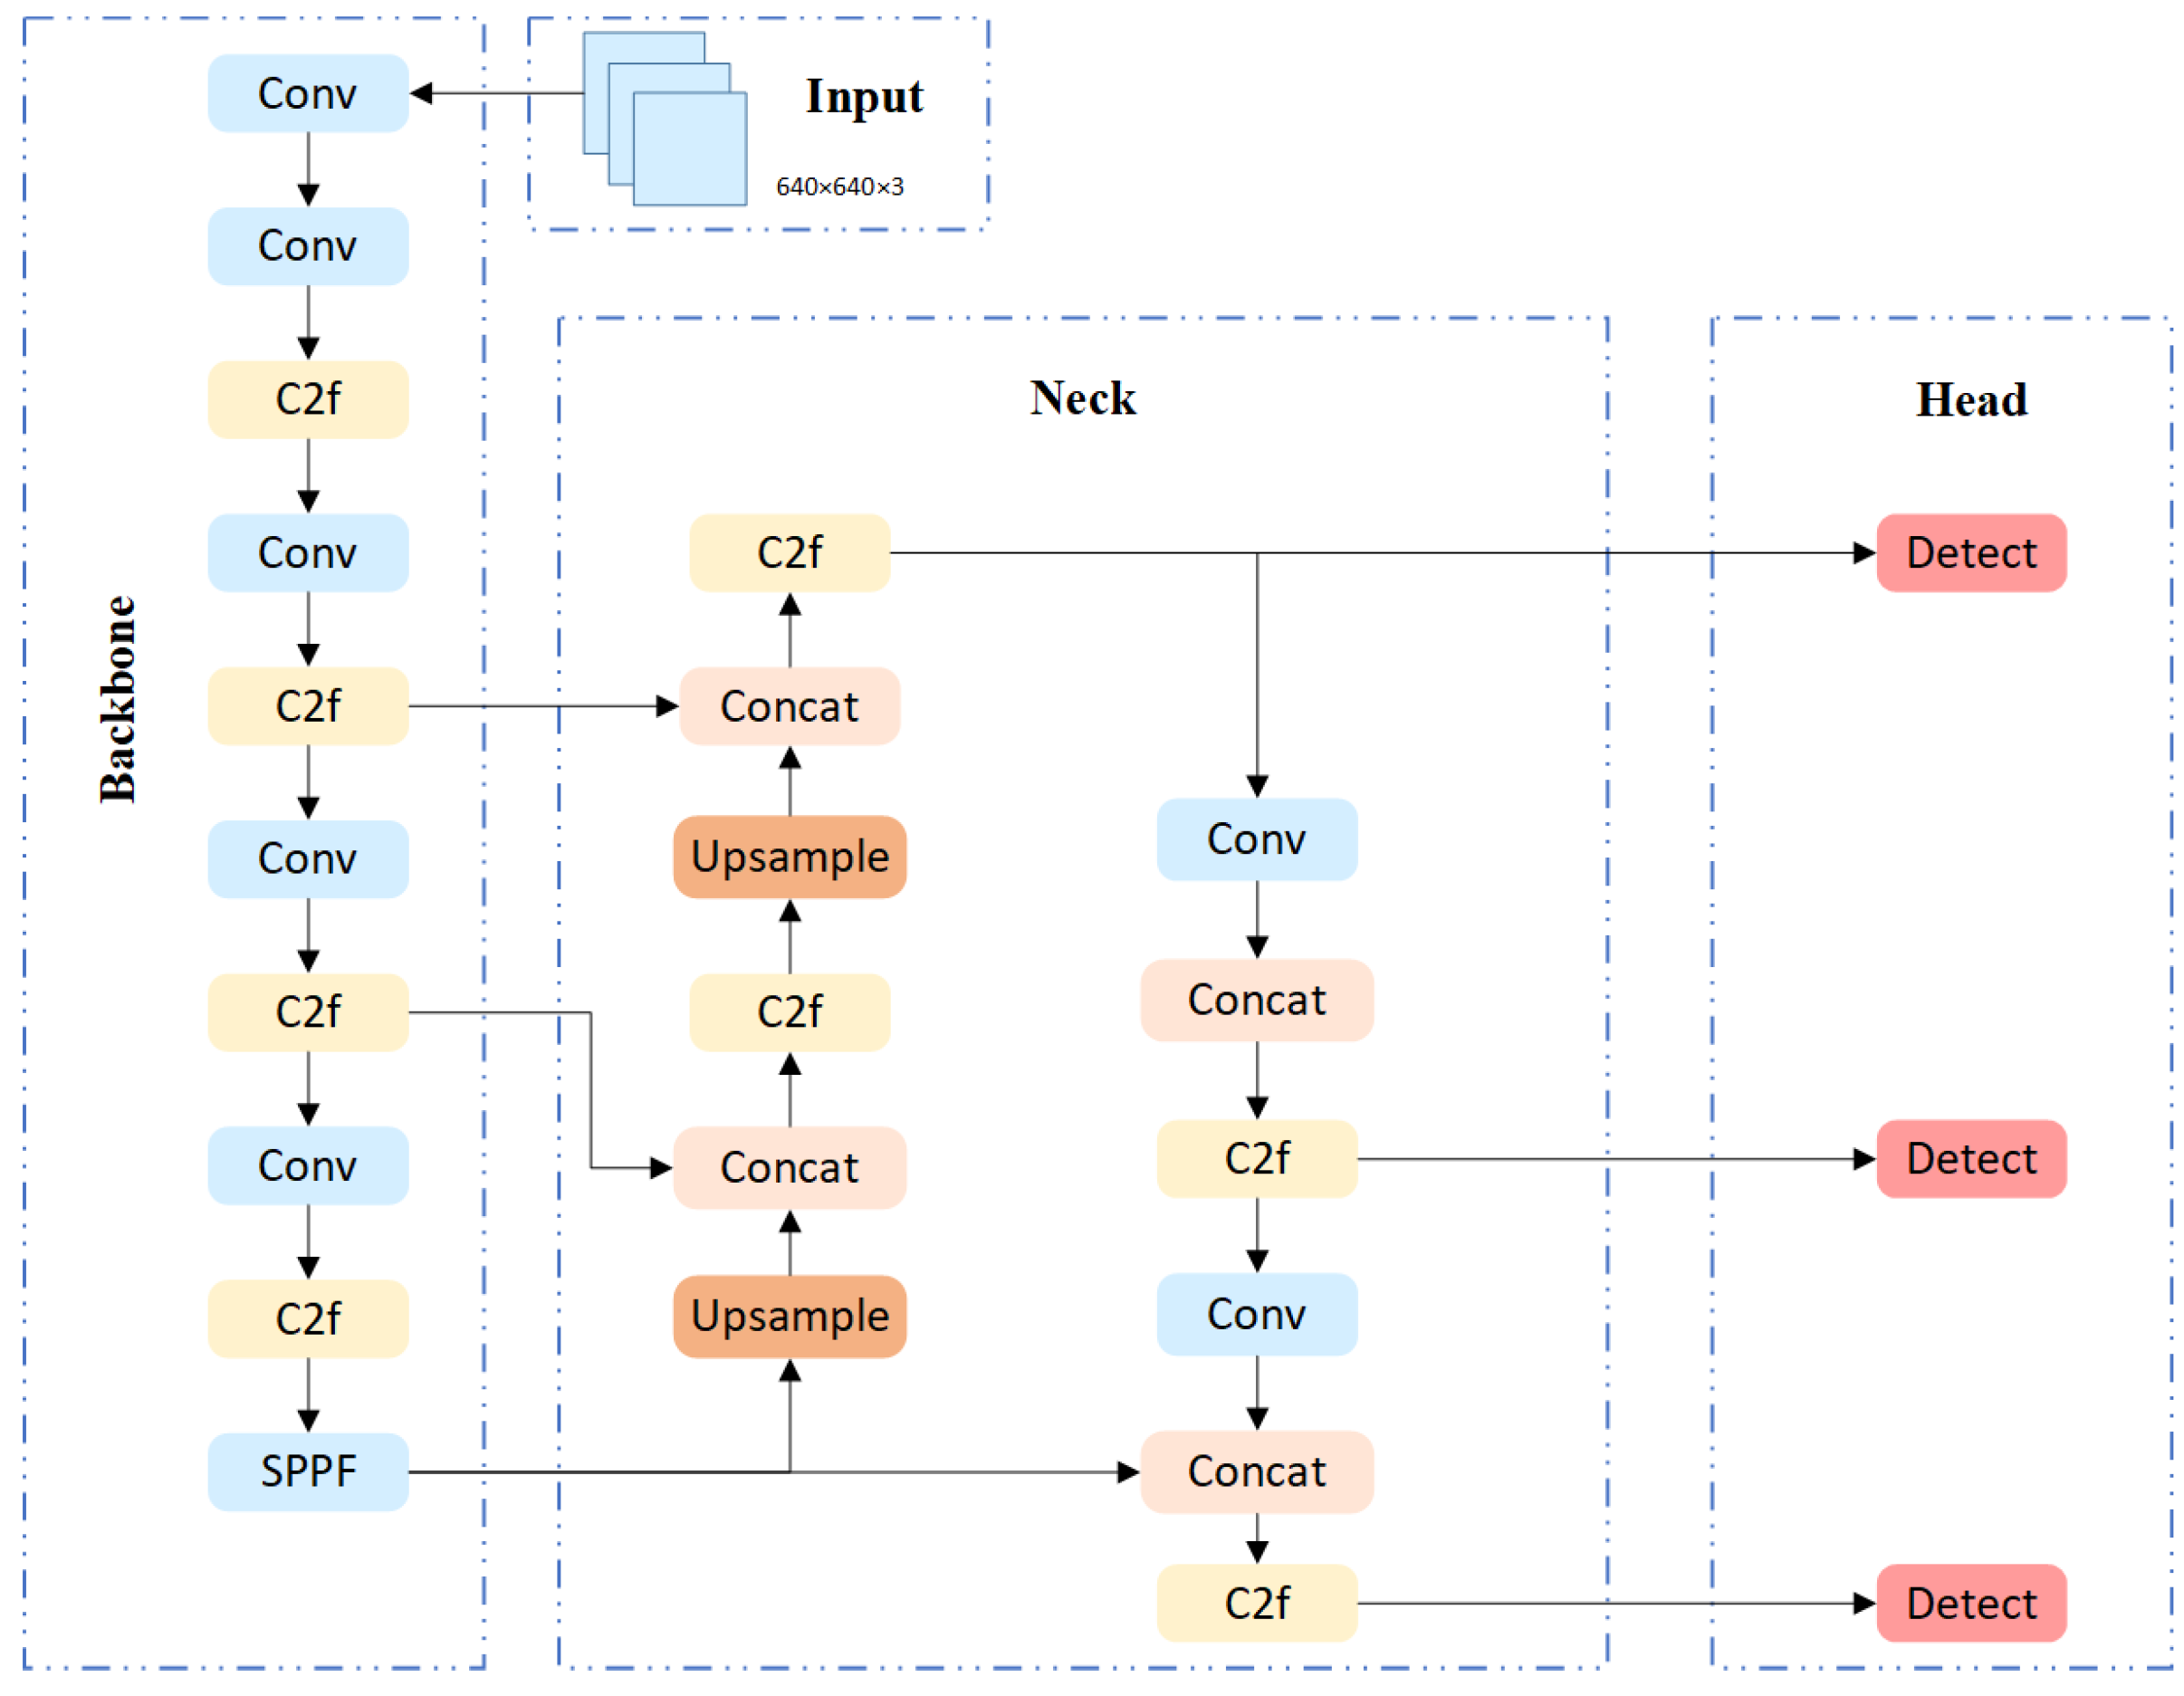
YOLOv8, an exemplary single-stage object detection architecture, employs an end-to-end design comprising four core components: input, backbone, neck, and head. Based on model size and inference speed requirements, YOLOv8 is categorized into variants denoted as YOLOv8n, YOLOv8s, YOLOv8m, YOLOv8l, and YOLOv8x. Considering the specific demands of the present research task, YOLOv8s was selected as the benchmark model; its network architecture is depicted in Figure 1.
The input layer employs adaptive image scaling and Mosaic augmentation to preprocess input images, balancing computational efficiency with enhanced sample diversity. The backbone utilizes an enhanced CSPDarknet architecture based on the CSP structure. This incorporates the C2f module as a replacement for the conventional C3 module and integrates a Spatial Pyramid Pooling Fast (SPPF) structure to achieve efficient multi-scale feature extraction. For feature fusion, the neck adopts a bidirectional Path Aggregation Network—Feature Pyramid Network (PAN-FPN) strategy, facilitating superior feature interaction and strengthening the representation of multi-scale targets. The head employs an Anchor-Free design, decoupling the target classification and bounding box regression tasks. It directly predicts target coordinates and category probabilities, and incorporates the Complete Intersection over Union (CIoU) loss function to optimize localization accuracy. This architectural configuration collectively underpins YOLOv8’s exceptional detection performance in conventional scenarios, establishing the infrastructure and comparative benchmark for the subsequent development of CPB-YOLOv8.

3. Research Method

This section introduces the architectural enhancements of CPB-YOLOv8. The proposed model incorporates a dual-branch structure within the feature layers to enhance semantic expressiveness. It further employs a quad-tiered BiFPN within the fusion stage to orchestrate efficient cross-scale feature integration. Additionally, the Wise-IoU v3 loss function is adopted to bolster classification robustness. Collectively, these modifications significantly improve the model’s overall detection performance. Subsequent sections elaborate on the detailed framework design, parameter configuration, and implementation specifics of the constituent modules.

3.1. Overall Architecture

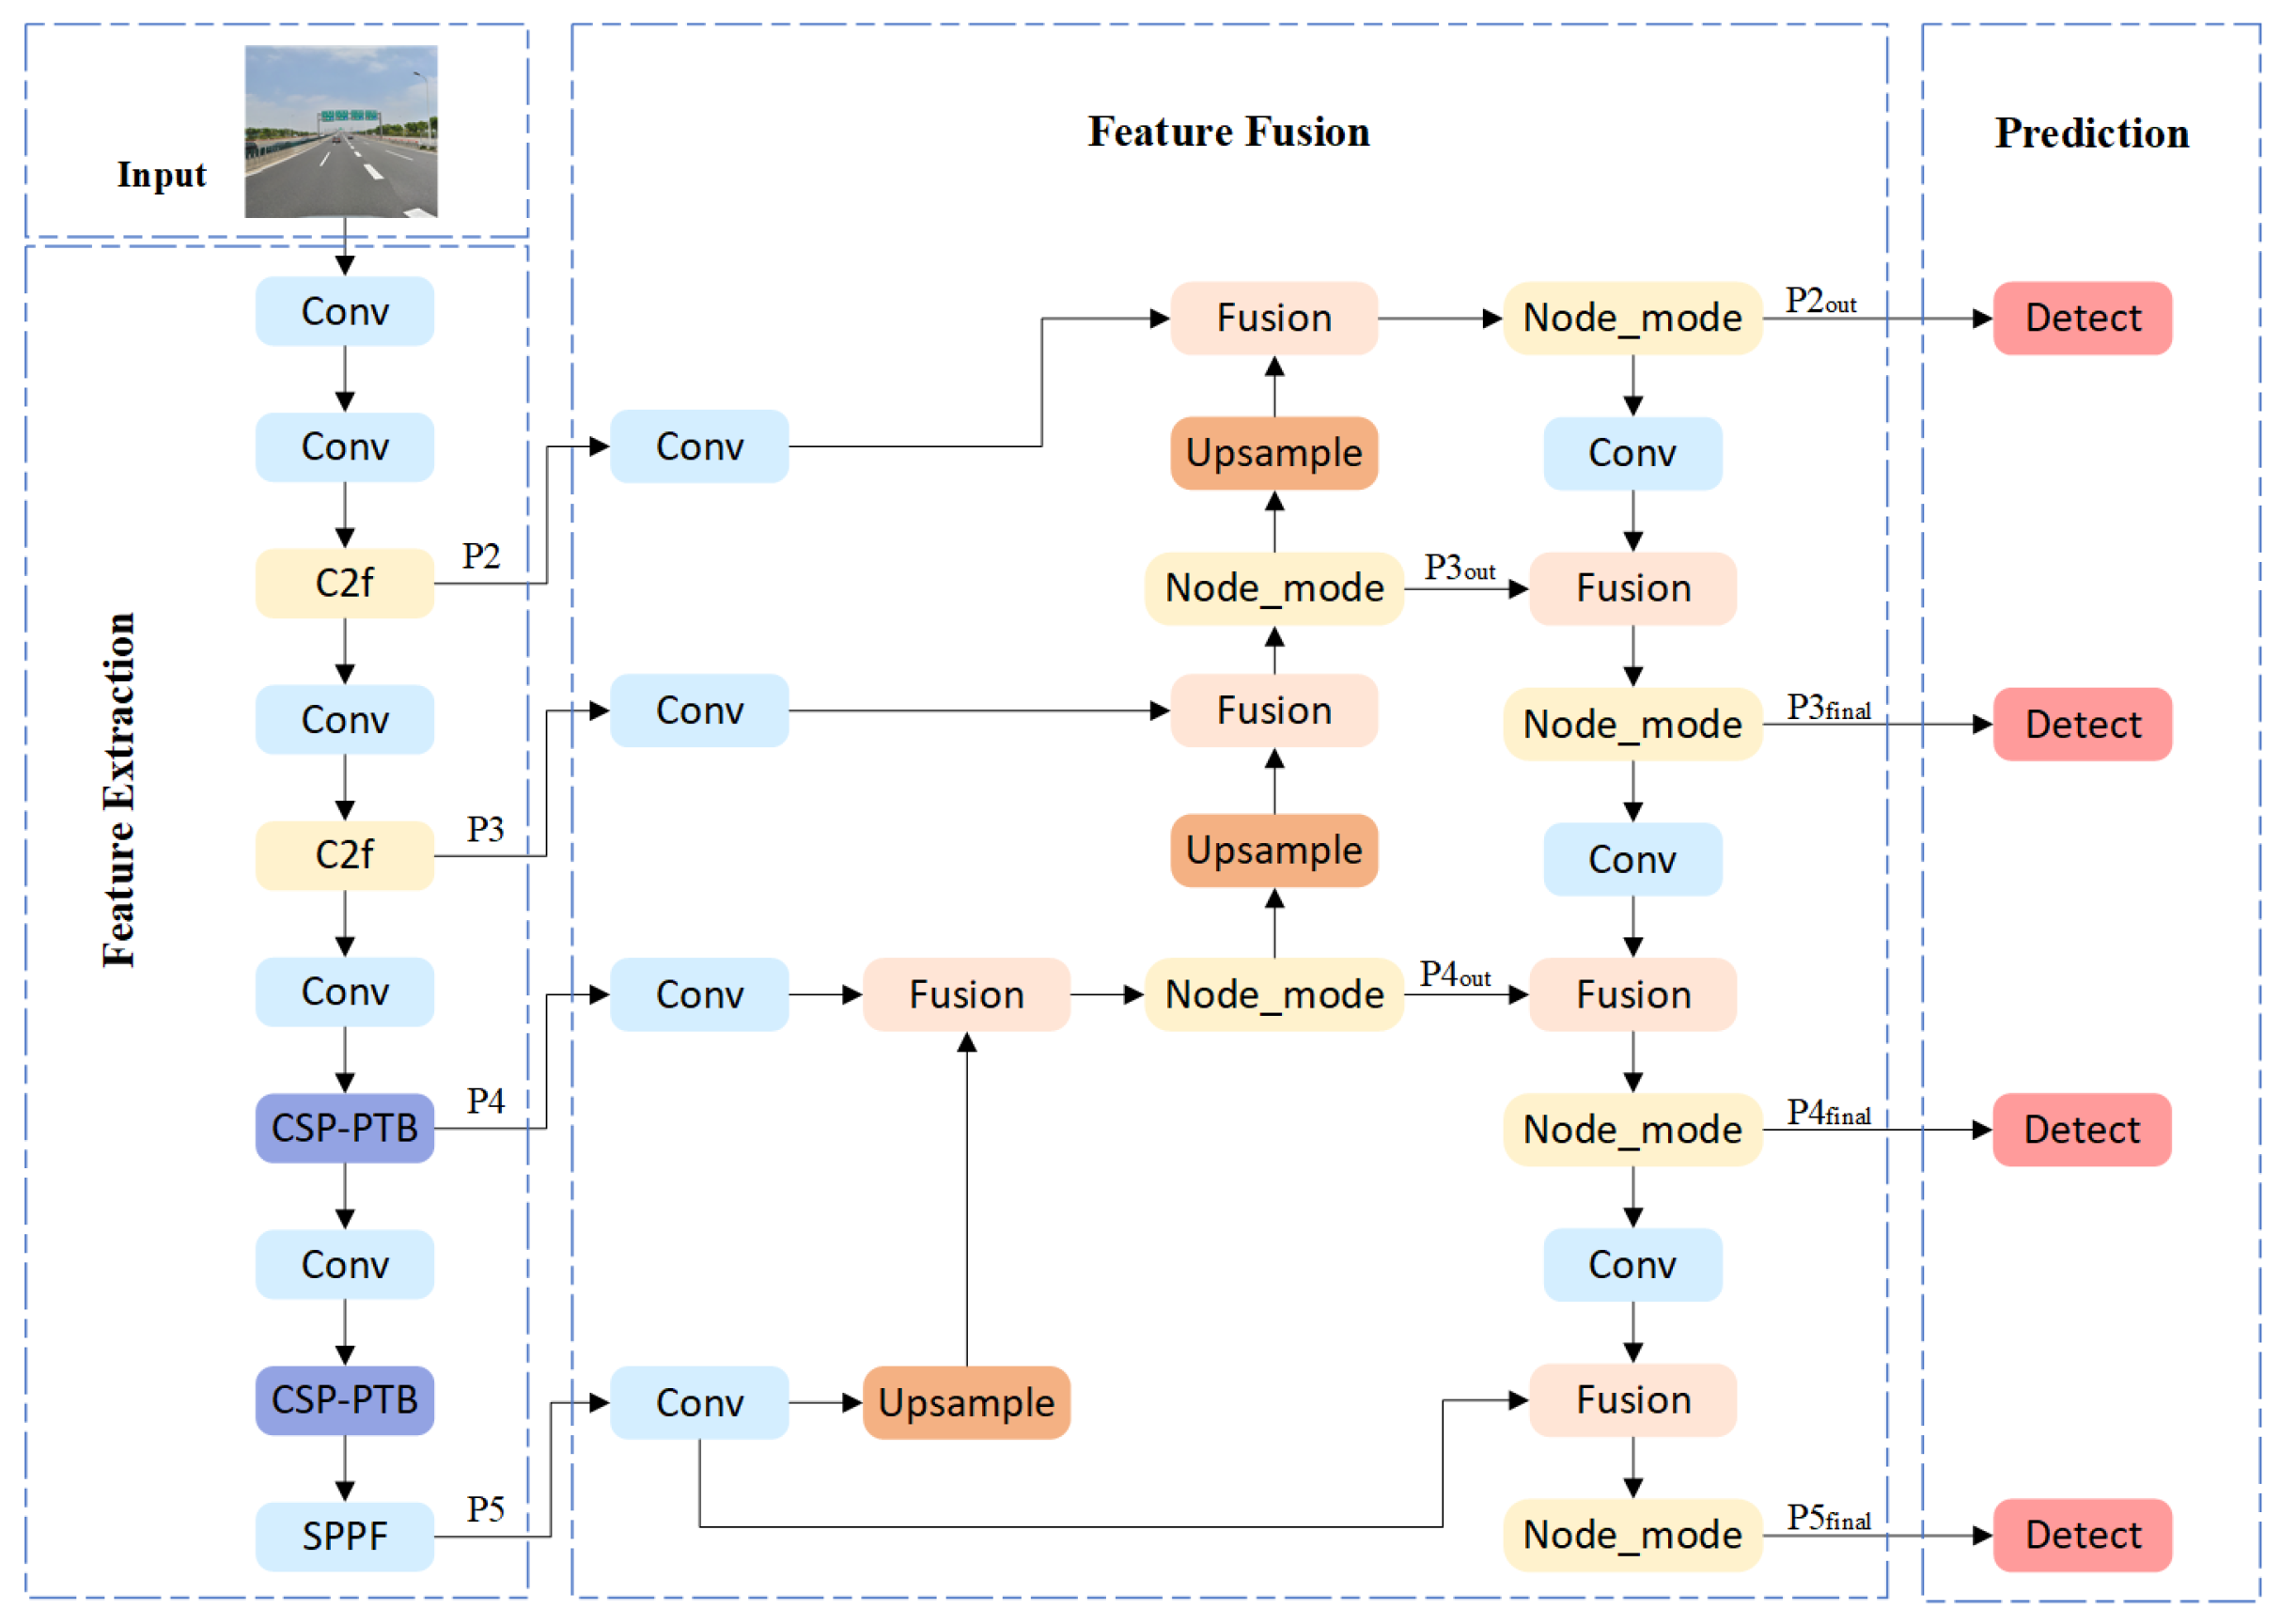
Figure 2 depicts the overall architecture of the proposed CPB-YOLOv8 framework. To enhance feature map resolution, CPB-YOLOv8 incorporates an additional P2 layer, quadrupling the resolution compared to the original YOLOv8 model. Within the backbone network, the original C2f structure at the P4 and P5 layers is substituted with the enhanced CSP-PTB module to strengthen feature extraction capability. The SPPF module is retained for processing high-level semantic features. Furthermore, the neck network utilizes a BiFPN architecture. This BiFPN employs efficient feature fusion operations to augment the model’s cross-scale feature interaction. Specifically designed for small-target traffic sign detection in complex scenarios, CPB-YOLOv8 effectively enhances detection performance for small targets while maintaining the computational efficiency inherent to the YOLOv8 architecture.

3.2. The Dual-Branch CSP-PTB Module

The detection of traffic signs poses unique challenges, such as tiny object sizes, complex backgrounds, and frequent occlusions. Standard convolutional backbones, like the C2f module in YOLOv8, excel at local feature extraction but struggle with modeling long-range global context, leading to false alarms from background clutter. While Vision Transformers offer powerful global modeling, their quadratic computational complexity often renders them unsuitable for real-time applications. To holistically address these competing demands, we propose the CSP-PTB. Its design philosophy is to achieve a synergistic balance between computational efficiency and representational power by integrating the complementary strengths of CNNs and Transformers through a novel dual-branch architecture with cross-stage partial connections. This module is specifically engineered to enhance the model’s capability to discern small traffic signs against distracting backgrounds.
The C2f module within the original YOLOv8 backbone network, as illustrated in Figure 3a, the C2f structure employs three convolutional modules and n Bottleneck modules. Input features are divided equally, with one portion routed directly to subsequent stages while the other undergoes transformation and integration via bottleneck convolutional layers. While effective, C2f relies primarily on convolutional operations with a limited receptive field, inherently lacking robust global context modeling capabilities. In contrast, the Transformer architecture has demonstrated remarkable success in computer vision due to its powerful global context modeling [31]. However, its substantial computational cost often precludes its use in real-time detection systems. To address these limitations, we propose the CSP-PTB. This module integrates the local feature extraction strengths of CNNs with the global context modeling advantages of Transformers via a channel allocation strategy. CSP-PTB enhances model performance and feature extraction capability while maintaining computational efficiency suitable for lightweight deployment.
As illustrated in Figure 3, the CSP-PTB module processes input feature maps X C × H × W from preceding stages. A channel partitioning strategy splits X into two components: X c n n C 1 × H × W and X t r a n s C 2 × H × W , where C 1 + C 2 = C . The channel allocation ratio is governed by hyperparameter α α = C 2 C . Within the CNN branch, stacked bottleneck convolutional layers consisting of sequential 3 × 3 and 1 × 1 convolution process X c n n to generate output features F c n n . This design preserves local structural information with minimal computational overhead. Simultaneously, the Transformer branch applies our novel PTB to X t r a n s , leveraging Multi-Head Self-Attention [32] with Complex Gated Linear Units (MHSA-CGLU) to capture global contextual relationships, yielding output features F t r a n s .
The normalized outputs from both branches undergo channel-wise concatenation:
F = Concat F c n n , F t r a n s  
This fused representation combines CNN’s local features and PTB’s global contexts. Through cross-stage partial connections, the CSP mechanism enables efficient propagation of complementary information to subsequent network layers, optimizing feature transmission efficacy.
Implemented through the MHSA-CGLU module shown in Figure 3, the PTB branch core combines an MHSA mechanism and CGLU. The MHSA mechanism, fundamental to Transformer architectures, enables each sequence element to dynamically integrate information from all other elements via weighted aggregation. Implementation occurs via parallel attention heads using scaled dot-product attention to capture multidimensional sequence dependencies, as illustrated structurally in Figure 4. The input tensor X t r a n s   C 2 × H × W is first reshaped into sequence form X seq   N × C 2 where N = H × W denotes sequence length. Linear transformations then generate Query (Q), Key (K), and Value (V) matrices:
Q = X s e q W Q , W Q C 2 × d k
K = X s e q W K , W K C 2 × d k
V = X s e q W V , W V C 2 × d k
with dimension constraints d k = d v = C 2 / h ( h = number of attention heads). For each group of Q/K/V matrices, scaled dot-product attention computation is performed per head. Within an individual attention head, the Q and K matrices first undergo matrix multiplication. The resultant product is scaled by d k to mitigate gradient vanishing in SoftMax, optionally followed by masking. Attention weights are then derived via SoftMax normalization, and the V matrix is weighted and summed using these weights to generate the single-head output. Finally, multi-head outputs are concatenated and linearly transformed, fusing multi-perspective correlation information to capture complex sequence dependencies.
The Scaled Dot-Product Attention calculation and multi-head fusion process are as follows:
h e a d i = S o f t m a x Q i K i T d k V i
F a t t n = C o n c a t     h e a d 1 , ,   h e a d h W O , W O h d v × C 2
where   h e a d i is the head output, Q i K i T d k is the attention score matrix of each head, and F attn   is the output features. Within each attention head, the scaled dot-product operation quantifies elemental association strengths as “attention scores” in the Q i and K i subspaces. Following normalization via the Softmax function, the value vectors V i are weighted using these normalized attention scores. This enables a single attention head to selectively capture dependencies manifested through local and global feature interactions within the image’s feature sequence. Distinct attention heads derive independent sets of Q, K, and V vectors via parallel, independent linear transformations—implicitly projecting the input into distinct subspaces. This enables concurrent modeling of multi-dimensional sequence associations. Following the concatenation of these multi-head features, a linear projection W O reduces dimensionality. This integration of multi-view representations overcomes the representational bottleneck inherent to single-head attention, enabling the final output F a t t n to more comprehensively characterize sequence dependencies. The core MHSA architecture—single-head subspace association followed by multi-head feature fusion—thus efficiently captures complex, multi-dimensional sequence dependencies without substantially increasing computational overhead. Building upon this principle, we propose the MHSA-CGLU module and will experimentally evaluate its efficacy for feature extraction in traffic sign detection tasks.
The traditional transformer structure uses an FFN feed-forward network with a two-layer linear transformation plus nonlinear activation, which is mathematically expressed as:
F F N ( x ) = σ x W 1 + b 1 W 2 + b 2
where σ is usually a GELU function, W 1 d z × d f f , W 2 d f f × d z . Although computationally efficient, standard MHSA operations neglect spatial locality, leading to suboptimal modeling of local features critical for traffic sign recognition. To address this limitation, we integrate TransNeXt’s CGLU [33], which performs joint spatial-channel modeling via a dual-branch architecture shown in Figure 5. The linear branch processes MHSA output features F a t t n via channel-preserving linear transformation F lin   =   L i n e a r F attn   without activation functions, thereby retaining original feature integrity. Simultaneously, the gating branch employs depthwise convolution D W C o n v 3 × 3 to capture local structural details (e.g., sign edges), followed by a sigmoid activation that generates spatially sensitive weighting coefficient G = σ D W C o n v 3 × 3 F a t t n where each element G ( i , j ) [ 0 , 1 ] corresponds to positional significance within the feature map. The final output F out   = F lin   G , dynamically enhances critical regions (e.g., sign contours/text with G ≈ 1) while suppressing background interference (e.g., tree occlusion with G ≈ 0).
This design is a strategic choice for TSD. The depthwise convolution introduces a much-needed spatial prior, helping the model focus on localized structures like sign boundaries. The gating mechanism provides adaptive, content-dependent feature refinement, significantly enhancing robustness to noise and complex backgrounds. Compared to a standard FFN, the CGLU offers a more powerful and efficient nonlinear transformation that is acutely aware of spatial details, which is paramount for accurately locating small objects. This improvement is quantitatively validated through ablation studies in Section 4.
3.3. The BiFPN Architecture

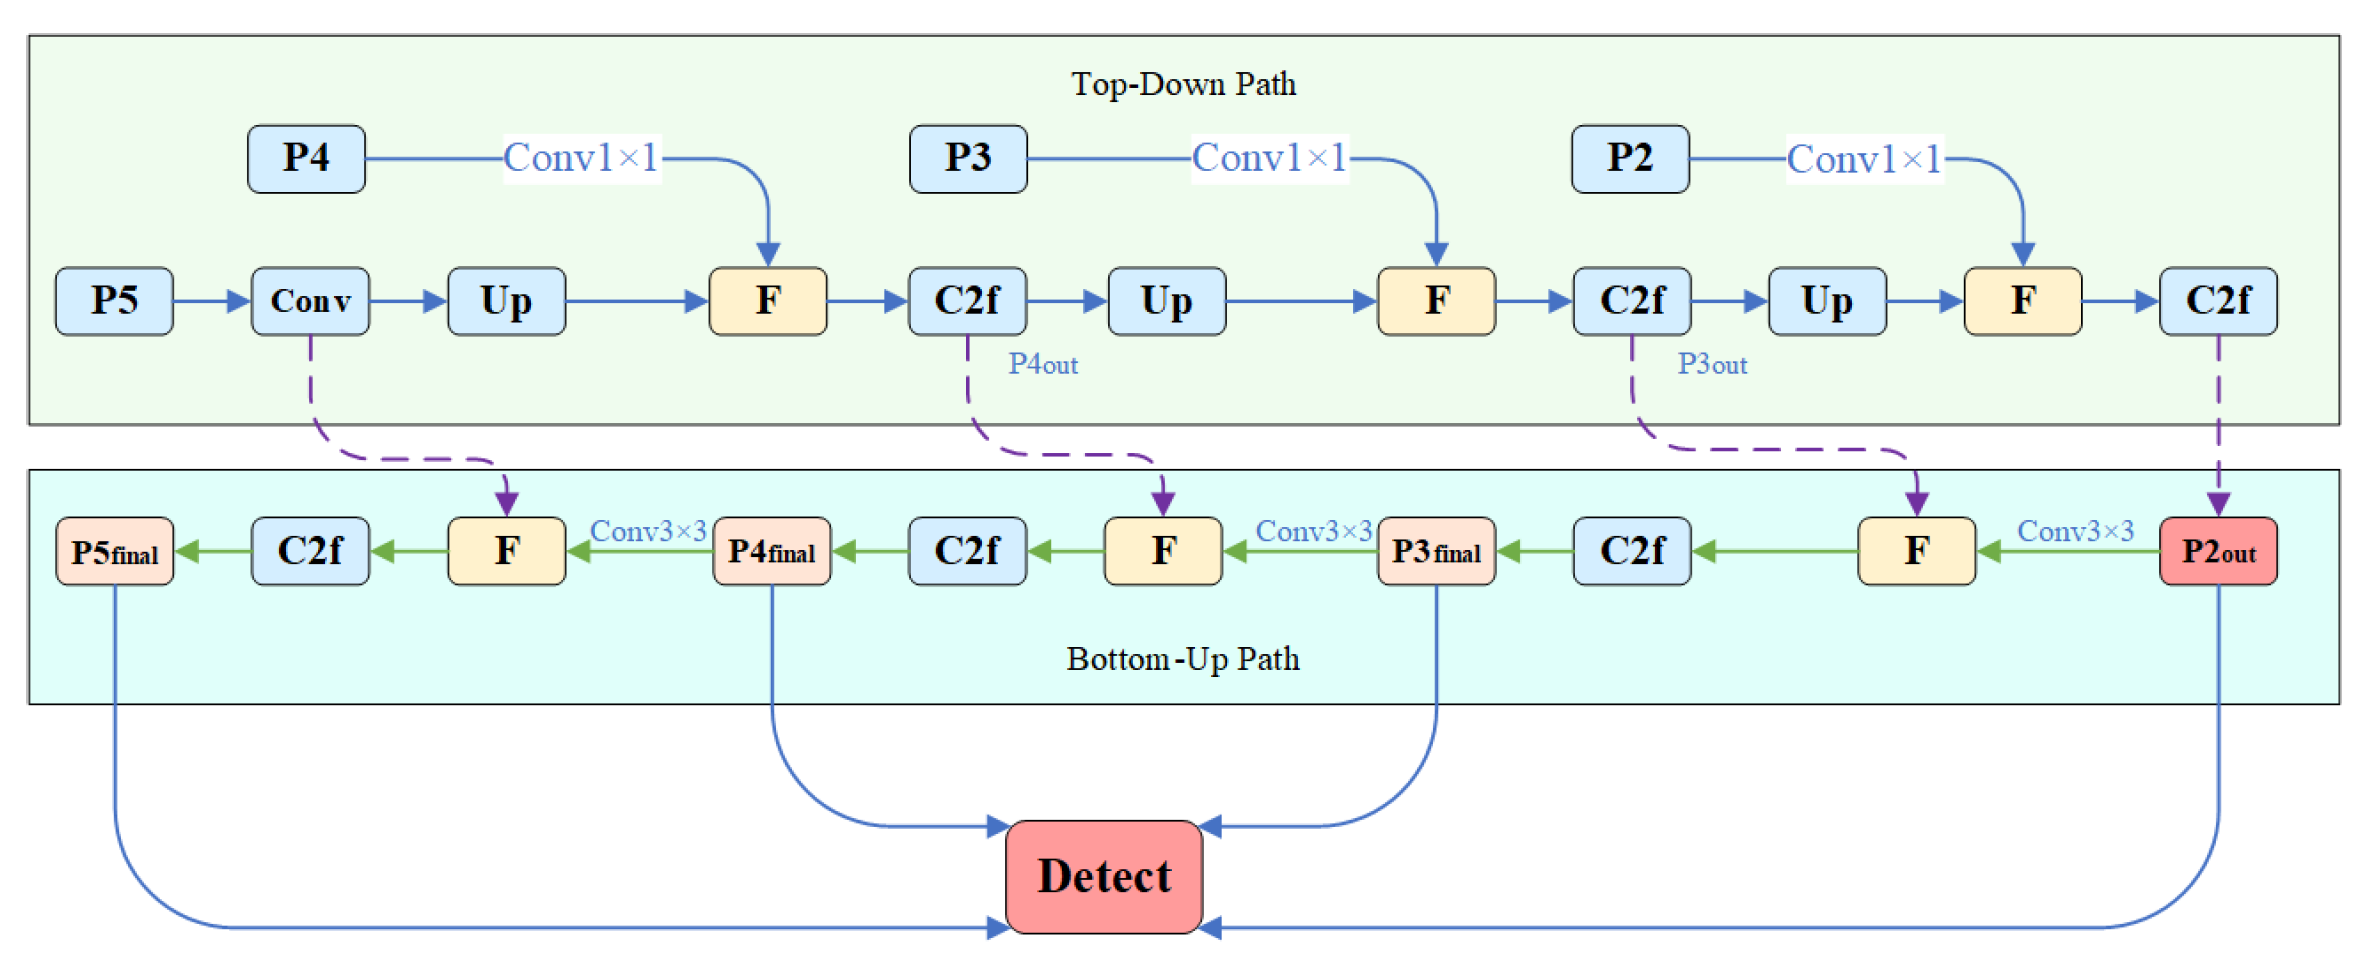
While the CSP-PTB module significantly enhances feature extraction—particularly for semantic representations of small-scale and partially occluded targets—the feature pyramid network remains a critical nexus between the backbone and detection heads. Its information fusion efficacy directly governs overall detection performance. Conventional unidirectional Feature Pyramid Networks (FPNs) [33] exhibit limited cross-layer interaction capabilities, constraining small-target detection accuracy. To overcome this bottleneck, we develop a four-level bidirectional feature pyramid fusion pathway shown in Figure 6, which establishes a cross-scale feature enhancement mechanism. This architecture integrates a high-resolution P2 detection layer to enable efficient multi-scale feature interaction and synergistic reinforcement.
The proposed bidirectional BiFPN architecture utilizes a four-level feature hierarchy. It integrates a novel P2 detection layer, operating at quarter-resolution relative to the input image, with the backbone-derived P3–P5 features. These layers constitute dual propagation pathways: a top-down path initiates semantic enrichment from high-level P5 features, while a bottom-up path propagates spatial details from lower-level features. The top-down process undergoes iterative refinement: P5 features undergo upsampling and adaptive weighted fusion with backbone-output P4 features, followed by C2f-enhanced refinement to yield P 4 out . This sequence progresses stepwise to the P2 layer. Illustrating the P5 → P4 fusion:
P 4 out = w 1 ϵ + w 1 + w 2 × U p S a m p l e ( P 5 ) + w 2 ϵ + w 1 + w 2 × P 4
where w 1 and w 2 are learnable weights, ϵ = 0.0001 is a small value to avoid numerical instability.
This top-down propagation progressively transfers high-level semantic information to higher-resolution feature layers, significantly enhancing localization precision for small-scale traffic signs while enriching their semantic representations. Conversely, the bottom-up pathway initiates at the highest-resolution P 2 out layer (enhanced by top-down processing) and executes inverse feature transfer through sequential 3 × 3 convolutions (stride = 2, output channels = 224). This process generates refined feature maps P 3 final   , P 4 final   , and P 5 final   for subsequent detection. The P2 → P3 fusion exemplifies this mechanism:
P 3 final   = w 1 ϵ + w 1 + w 2 × C o n v ( P 2 ) + w 2 ϵ + w 1 + w 2 × P 3 out  
This bottom-up propagation transfers spatially rich details from the enhanced P 2 out layer to higher semantic levels, substantially improving semantic discriminability and robustness for large-scale traffic signs in complex environments. Our fusion mechanism employs a bidirectional weighted strategy within the BiFPN framework, adaptively optimizing feature contributions through learnable parameters ω i = e λ i j e λ j . This enables complementary enhancement of spatial and semantic representations. Implementation-wise, we standardize feature channels to 224 dimensions and deploy C2f modules for convolutional refinement at each fusion node. Inheriting YOLOv8’s lightweight design philosophy through Cross-Stage Partial connections, C2f balances computational efficiency with representational capacity. Within the bidirectional pipeline, these modules optimize integrated features after every weighted fusion operation.
The P2 detection layer constitutes a core innovation, extracting high-resolution (1/4 input size) features from shallow backbone layers to preserve critical spatial details for tiny traffic signs. Integrated within the bidirectional BiFPN architecture, it serves dual roles: as the top-down endpoint fusing high-level semantics and the bottom-up origin transmitting fine-grained details. This deep integration supplements high-resolution features while enabling cross-scale interactions with BiFPN/C2f modules, significantly enhancing tiny-object detection and complex-scene robustness. Synergizing with the backbone’s CSP-PTB, it fully leverages multi-scale features to amplify detection head efficacy. These innovations collectively boost comprehensive detection performance, with empirical validation provided in ablation studies.

3.4. Loss Function

Bounding box regression loss quantifies positional discrepancies between predicted and ground-truth boxes, driving model optimization for precise localization. While evolving from L1/L2 to IoU-based variants (GIoU, DIoU, CIoU) [34,35], YOLOv8’s default CIoU loss exhibits limitations for occluded targets:
L C I o U = 1 I o U + ρ 2 ( b , b g t ) c 2 + α v
where I o U denotes intersection-over-union, ρ measures centroid distance, c is the minimal enclosing rectangle diagonal, and α v penalizes aspect ratio inconsistency. In traffic sign detection, CIoU’s sensitivity to positional deviations amplifies training instability under occlusion—low-quality samples dominate gradients, inducing bounding box regression bias.
Although our CSP-PTB and BiFPN enhance feature representation, specialized optimization for occlusion remains essential. Thus, we adopt Wise-IoU v3:
L W I o U = 1 γ I o U I o U + ρ 2 ( b , b g t ) c 2 + β v
Its dynamic non-monotonic focusing mechanism γ I o U adaptively modulates gradients: suppressing high-quality anchors to prevent overfitting while amplifying low-quality samples to mitigate harmful gradients. This prioritizes common high-quality samples and reduces low-quality interference, significantly improving localization robustness in occlusion scenarios.

4. Experiments and Results

This section details the experimental datasets, evaluation metrics, implementation protocols, and comprehensive analysis of results for the proposed model.

4.1. Dataset

This study employed two benchmark traffic sign datasets widely adopted in traffic sign detection and recognition research: TT100K (Tsinghua-Tencent 100K) and CCTSDB (Chinese Traffic Sign Detection Benchmark). To comprehensively evaluate model generalization capabilities in complex real-world road environments, a supplementary multi-scenario road image dataset was acquired. Data collection was conducted using an on-board camera (1920 × 1080 resolution) across urban and suburban roadways, yielding 322 raw images subsequently resized uniformly to 640 × 640 resolution. This custom dataset was utilized exclusively for model inference without participation in training procedures, serving to assess model adaptability to real-world distribution shifts and validate robustness under low-visibility conditions.
TT100K Dataset [36]: The Tsinghua-Tencent 100K dataset provides >100,000 high-resolution Chinese road scene images spanning 232 traffic sign categories (e.g., speed limits, prohibitions, instructions). It encompasses diverse illumination and weather conditions (day/night, rain/fog, sunny/cloudy). To mitigate class imbalance, we retained only categories with ≥50 instances, resulting in a curated set of 9738 images across 45 classes. Although this filtering alleviates the long-tail distribution, significant inter-class imbalance remains (Figure 7). To address this, we employed a class-balanced loss function, where weighting coefficients were automatically computed inversely proportional to class frequencies in the training set. Furthermore, Mosaic data augmentation was applied during training, which inherently promotes exposure to rare classes by compositing multiple images. All images were resized to 640 × 640 RGB format and partitioned into training (6793), validation (1949), and test (996) sets at a 7:2:1 ratio. The specific distribution of its categories is shown in Figure 7.
CCTSDB Dataset [37]: The Chinese Traffic Sign Detection Benchmark comprises ≈ 20,000 real-world road images covering urban, highway, and suburban environments. Focusing on three primary categories (Prohibitory: 18,392; Warning: 9947; Mandatory: 15,422), it contains 43,761 finely annotated instances. Images were standardized to 640 × 640 RGB and include challenging scenarios (day-night transitions, rain/fog, variable lighting) for robustness validation. After class-balancing, the dataset was divided into training (12,499), validation (3571), and test (1786) sets following a 7:2:1 split. To quantitatively analyze performance variations across different scenarios, we partitioned the test set into six distinct categories based on weather and illumination conditions, as detailed in Table 1. This categorization facilitates cross-environment performance comparisons and establishes an evaluation benchmark for subsequent robustness assessment.

4.2. Evaluation Metrics

This section formally defines the core evaluation metrics employed for model assessment. We utilize Precision (P), Recall (R), F1 Score, mAP@0.5, mAP@0.5:0.95, and Model Size to comprehensively quantify performance, with formal definitions provided below.
Precision quantifies the proportion of correctly identified positive instances among all predicted positives, serving as a measure of prediction accuracy. Recall measures the proportion of actual positives successfully detected by the model, reflecting its capability to capture targets of interest. The corresponding formal expressions are:
  P r e c i s i o n = T P T P + F P   R e c a l l   = T P T P + F N
where T P (True Positives) denotes the correctly predicted positive instances; F P (False Positives) denotes the negative instances erroneously predicted as positive; and F N (False Negatives) denotes the positive instances incorrectly predicted as negative.
The F1 Score, representing the harmonic mean of precision and recall, integrates prediction accuracy and completeness. As a pivotal classification metric, it is mathematically defined as:
  F 1 S c o r e = 2 × P r e c i s i o n × R e c a l l P r e c i s i o n + R e c a l l
Mean Average Precision ( m A P ) quantifies overall detection precision across all categories as follows:
A P = 0 1 P ( R ) d R m A P = i = 1 N c l s A P N c l s
where Average Precision ( A P ) measures per-category detection accuracy.
Enhanced precision and recall values positively correlate with improved model detection accuracy. The mean Average Precision ( m A P ) serves as the primary holistic performance metric, with two critical variants: mAP@0.5 evaluates performance at IoU threshold 0.5, while mAP@0.5:0.95 represents the mean m A P across IoU thresholds 0.5 to 0.95 (in 0.05 increments), providing a more rigorous assessment due to stricter localization requirements. Model Size, quantified as memory footprint in megabytes (MB), serves as an essential efficiency indicator. Furthermore, inference speed is measured in Frames Per Second (FPS), which is a crucial metric for evaluating the model’s practicality and feasibility in real-time applications, particularly on resource-constrained or embedded devices.

4.3. Experimental Environment

The experimental setup utilized Python 3.10 with PyTorch 2.2.2 and CUDA 12.1. Hardware configuration comprised an 18-core CPU (2.6 GHz), 90 GB RAM, and a GeForce RTX 4090D GPU (24 GB VRAM), with 50 GB system storage. We adopted YOLOv8s as the baseline framework, initializing with official pre-trained weights. Training executed over 300 epochs with batch size 16, learning rate decaying from 0.01 to 0.0001, while maintaining default hyperparameters including optimizer configuration and weight decay settings.

4.4. Ablation Experiment

To rigorously evaluate performance gains and synergistic interactions across improvement strategies, we conduct comprehensive ablation studies. Comparative assessments were performed on TT100K and CCTSDB datasets using six progressively enhanced configurations (M2–M6) relative to the YOLOv8s baseline (M1), as detailed in Table 2. This experimental design: (1) isolates performance contributions of core innovations (M2–M3); (2) quantifies synergistic benefits from strategic combinations (M4–M5); and (3) validates the complete optimized framework (M6).
Table 3 presents experimental results on the TT100K dataset, comparing M1-M6 across precision, recall, F1 Score, mAP@0.5, model size and FPS. Key findings reveal: M2 achieves a 3.94 percentage point (pp) recall improvement over M1, demonstrating CSP-PTB’s capacity to enhance feature extraction and reduce missed detections. Concurrently, it reduces model size by 9.8% (from 21.5 MB to 19.4 MB), while slightly increasing inference speed to 269.05 FPS, confirming the parametric efficiency of its dual-branch design. M3 attains 87.93% mAP@0.5, evidencing BiFPN’s robustness enhancement through bi-directional feature interactions. Its 33% size reduction is accompanied by a significant boost in FPS to 424.31, indicating effective parameter optimization in the four-stage architecture. M4 (CSP-PTB + BiFPN) exhibits synergistic effects: an 11.9 MB model size with 88.54% mAP@0.5, and a maintained high speed of 301.79 FPS, outperforming the individual module improvements. M5 shows significant gains in small-target detection: 82.96% recall and 85.82% F1 Score (3.19 pp and 2.40 pp improvements over the M1 baseline, respectively), validating the high-resolution P2 layer’s efficacy, though introducing an expected decrease in FPS to 204.92 due to increased computational load from the higher-resolution feature map. M6 achieves optimal performance at 90.73% mAP@0.5, a gain of +1.40 pp over M5. The 0.40 pp recall increase, despite a marginal 0.94 pp precision decrease, confirms Wise-IoU v3’s dynamic weighting mechanism successfully balances precision-recall trade-offs in complex scenarios. Notably, M6 maintains a real-time capable speed of 201.46 FPS. The comprehensive superiority of M6 establishes the strategic value of integrated enhancements in achieving an optimal balance between accuracy, model size, and inference speed.
Table 4 presents ablation results on the CCTSDB dataset. While the baseline (M1) achieves strong performance (97.23% mAP@0.5), at a high inference speed of 707.14 FPS, our enhancements further demonstrate significant gains: M6 elevates recall by 4.26 percentage points versus M1, confirming strategy generalization to high-quality data. Notably, M6 reaches 99.21% mAP@0.5—approaching theoretical saturation—indicating exceptional detection capability in simple scenarios, while still maintaining a real-time speed of 493.48 FPS. Critical component analysis reveals: M5 attains 97.38% recall (a 2.14 pp improvement over M4), underscoring the P2 layer’s pivotal role in small-target detection, though with an expected speed reduction to 511.29 FPS due to higher-resolution processing. It is worth noting that M3 achieves an excellent balance by significantly improving mAP@0.5:0.95 to 78.39% while recovering much of the speed decreased in M2, reaching 687.92 FPS. M6 maintains this recall while achieving 99.21% mAP@0.5, demonstrating Wise-IoU v3’s efficacy in precision-recall optimization without substantial compromise to operational efficiency.

4.5. Comparative Experiment

To rigorously assess the comprehensive performance of our proposed CPB-YOLOv8 framework, we conducted comparative experiments against state-of-the-art object detection models. Benchmark evaluations on the TT100K and CCTSDB datasets are presented in Table 5.
In complex traffic sign detection tasks on the TT100K dataset, the proposed CPB-YOLOv8 framework demonstrates significant comprehensive advantages. As summarized in Table 5, CPB-YOLOv8 achieves 90.73% mAP@0.5, exceeding the homologous YOLOv8 baseline by 3.94 percentage points and surpassing the high-performance Hyper-YOLO by 3.51 percentage points. It also significantly outperforms newer counterparts such as YOLOv11 (86.26% mAP) and YOLOv12 (80.80% mAP), while competing favorably with the transformer-based RT-DETR (86.96% mAP) in accuracy. Furthermore, its recall rate of 83.45% represents a 6.43-percentage-point improvement over the baseline YOLOv8 (77.02%), with this enhancement primarily attributable to the P2 detection layer’s superior small-scale object perception capability. Crucially, performance gains are achieved without model bloat: at 12.5 MB, the model size constitutes merely 43.6% of Hyper-YOLO’s footprint and is notably more compact than YOLOv11 (18.3 MB), YOLOv12 (17.8 MB), and significantly smaller than RT-DETR (77.2 MB). Compared to the lightweight YOLOv10, CPB-YOLOv8 attains a 5.07-percentage-point higher mAP@0.5 while reducing model size by 20.9%. Moreover, with an inference speed of 201.46 FPS, the proposed model offers a superior balance between accuracy and operational efficiency, substantially exceeding RT-DETR (58.76 FPS) and being highly competitive among real-time detectors. These results confirm the framework’s synergistic optimization of accuracy and efficiency, validating the efficacy of its dual-branch structure and bidirectional feature fusion module. Table 6 details the per-category mAP of evaluated algorithms on the TT100K dataset, demonstrating CPB-YOLOv8’s superior detection performance across most of the 45 categories.
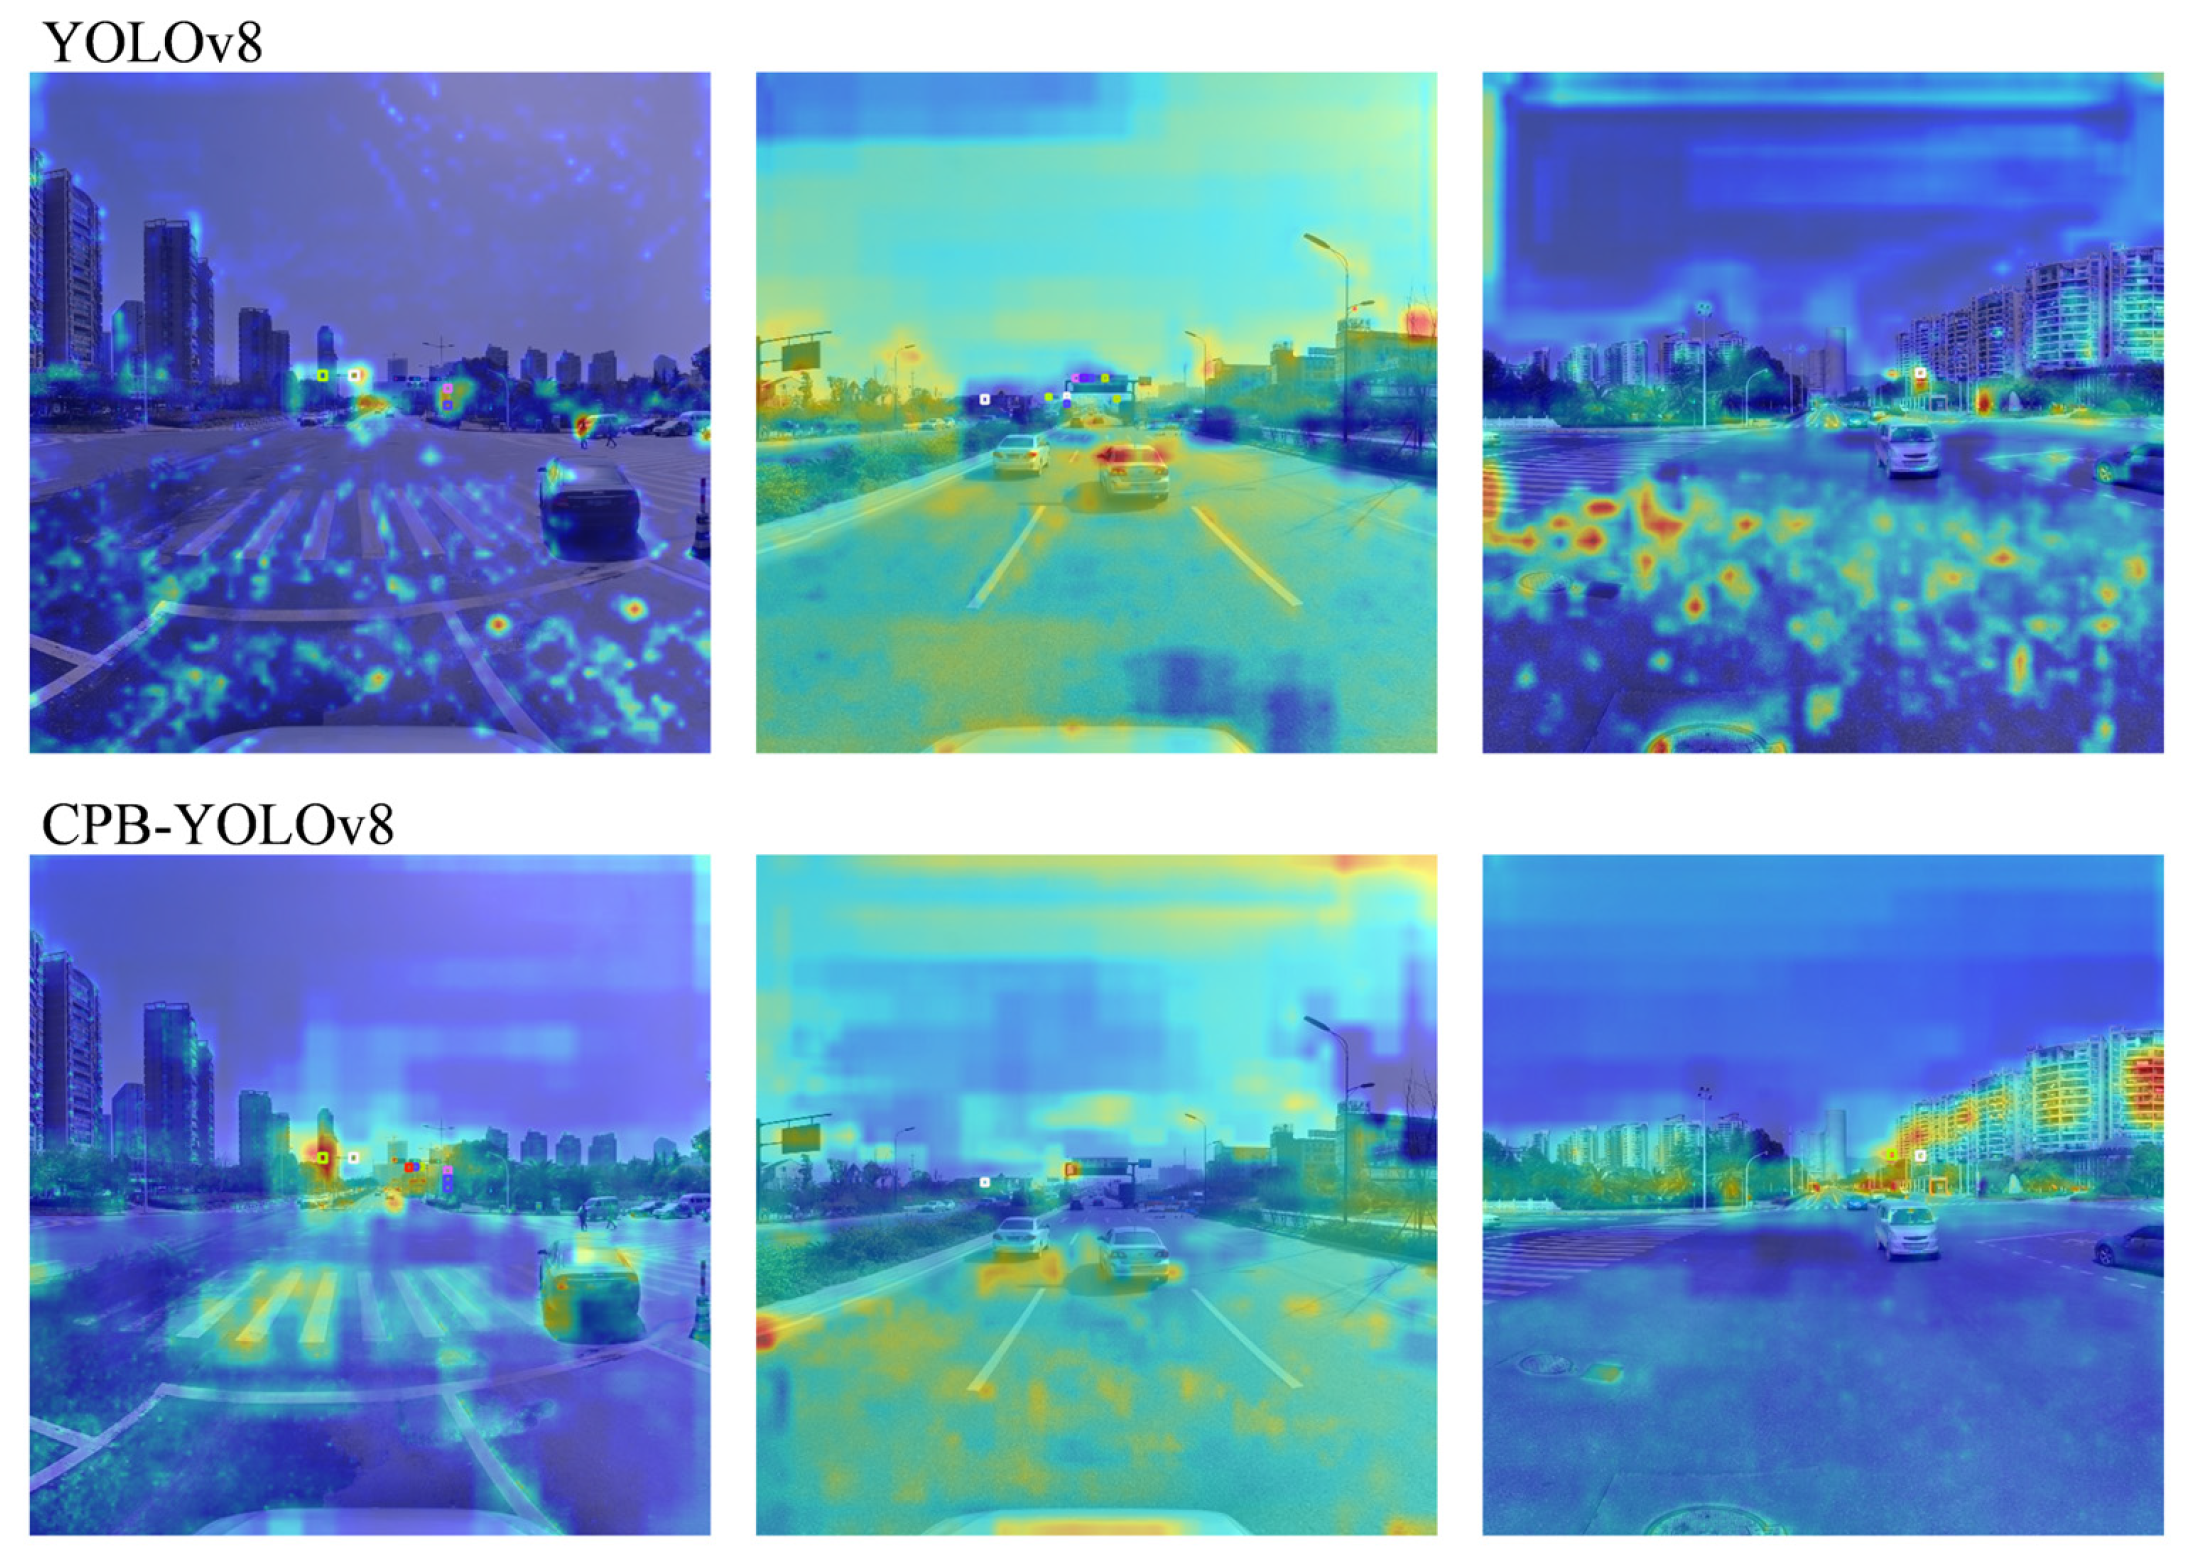
Figure 8 contrasts activation heatmaps of YOLOv8 and CPB-YOLOv8. Significantly stronger activation focused on target regions with higher contrast against backgrounds is observed in CPB-YOLOv8, confirming its robustness in suppressing complex environmental interference. This capability is critical for practical applications such as autonomous driving. Figure 9 presents detection visualizations comparing the baseline and proposed CPB-YOLOv8 on TT100K. The enhanced model demonstrates superior detection capability across diverse scenarios, effectively reducing missed detection rates for distant small-scale traffic signs while improving multi-scale detection accuracy.
Evaluation results on the standard CCTSDB benchmark (Table 5) demonstrate that CPB-YOLOv8 achieves near-saturation performance with 99.21% mAP@0.5, exceeding the suboptimal YOLOv10 by 1.05 percentage points and outperforming all other YOLO variants as well as RT-DETR. Concurrently, the model attains 97.76% recall—a 2.31% percentage points improvement over YOLOv10—further evidencing its enhanced adaptability to heterogeneous data quality. Moreover, the efficiency advantage becomes more pronounced in this scenario: with a model size of merely 12.3 MB, it not only undercuts YOLOv5/YOLOv8 but also reduces SSD’s footprint by 6.1%. Notably, its inference speed of 493.48 FPS on this dataset greatly surpasses that of RT-DETR and is highly competitive, especially considering its minimal size and maximal accuracy. These results collectively validate the improved model’s capability to optimally balance accuracy and efficiency, establishing comprehensive performance superiority.

4.6. Environmental Robustness Analysis

4.6.1. CCTSDB Subset Benchmark

This section presents comparative visualizations of traffic sign detection results generated by YOLOv8 and the proposed CPB-YOLOv8 across six partitioned scenarios, with target regions magnified for detailed analysis. Figure 10 demonstrates the comparison under sunny conditions.
Analysis reveals CPB-YOLOv8’s superior detection performance in sunny environments. In Figure 10a, detection accuracies for prohibition signs reach 84% and 45% for YOLOv8s, while CPB-YOLOv8 achieves 81% and 63%, respectively. Notably, YOLOv8s misidentifies a lamppost as a “Prohibitory” sign, whereas CPB-YOLOv8 successfully distinguishes traffic signs from complex backgrounds without false positives. These results demonstrate the model’s significant performance enhancement in daylight conditions. Comparative results under night and rainy conditions are presented in Figure 11.
Analysis of Figure 11 reveals superior performance of CPB-YOLOv8 over baseline YOLOv8 in nocturnal environments. In Figure 11(b1), the proposed model achieves 80% detection accuracy for warning signs—a 45-percentage-point improvement versus YOLOv8. Long-range indicative sign detection accuracy also surges from 27% to 77%. These results demonstrate CPB-YOLOv8’s enhanced long-range detection capability under low-light conditions. During rainy scenarios, while YOLOv8 misidentifies specular reflections as warning signs, CPB-YOLOv8 significantly improves distant indicative sign detection (accuracy: +62%) without generating false alarms. This further validates the model’s robustness in suboptimal illumination.
Comparative results under foggy, snowy, and cloudy conditions are presented in Figure 12. Analysis of Figure 12(b1) indicates significantly enhanced detection accuracy of indicative signs by CPB-YOLOv8 in foggy environments, achieving 79% accuracy for distant signs while eliminating false positives. Under snowy conditions, CPB-YOLOv8 successfully detects all traffic signs within the target area, resolving omission errors present in baseline YOLOv8. The proposed model also demonstrates improved detection performance over the original YOLOv8 in cloudy scenarios.

4.6.2. Self-Collected Data Validation

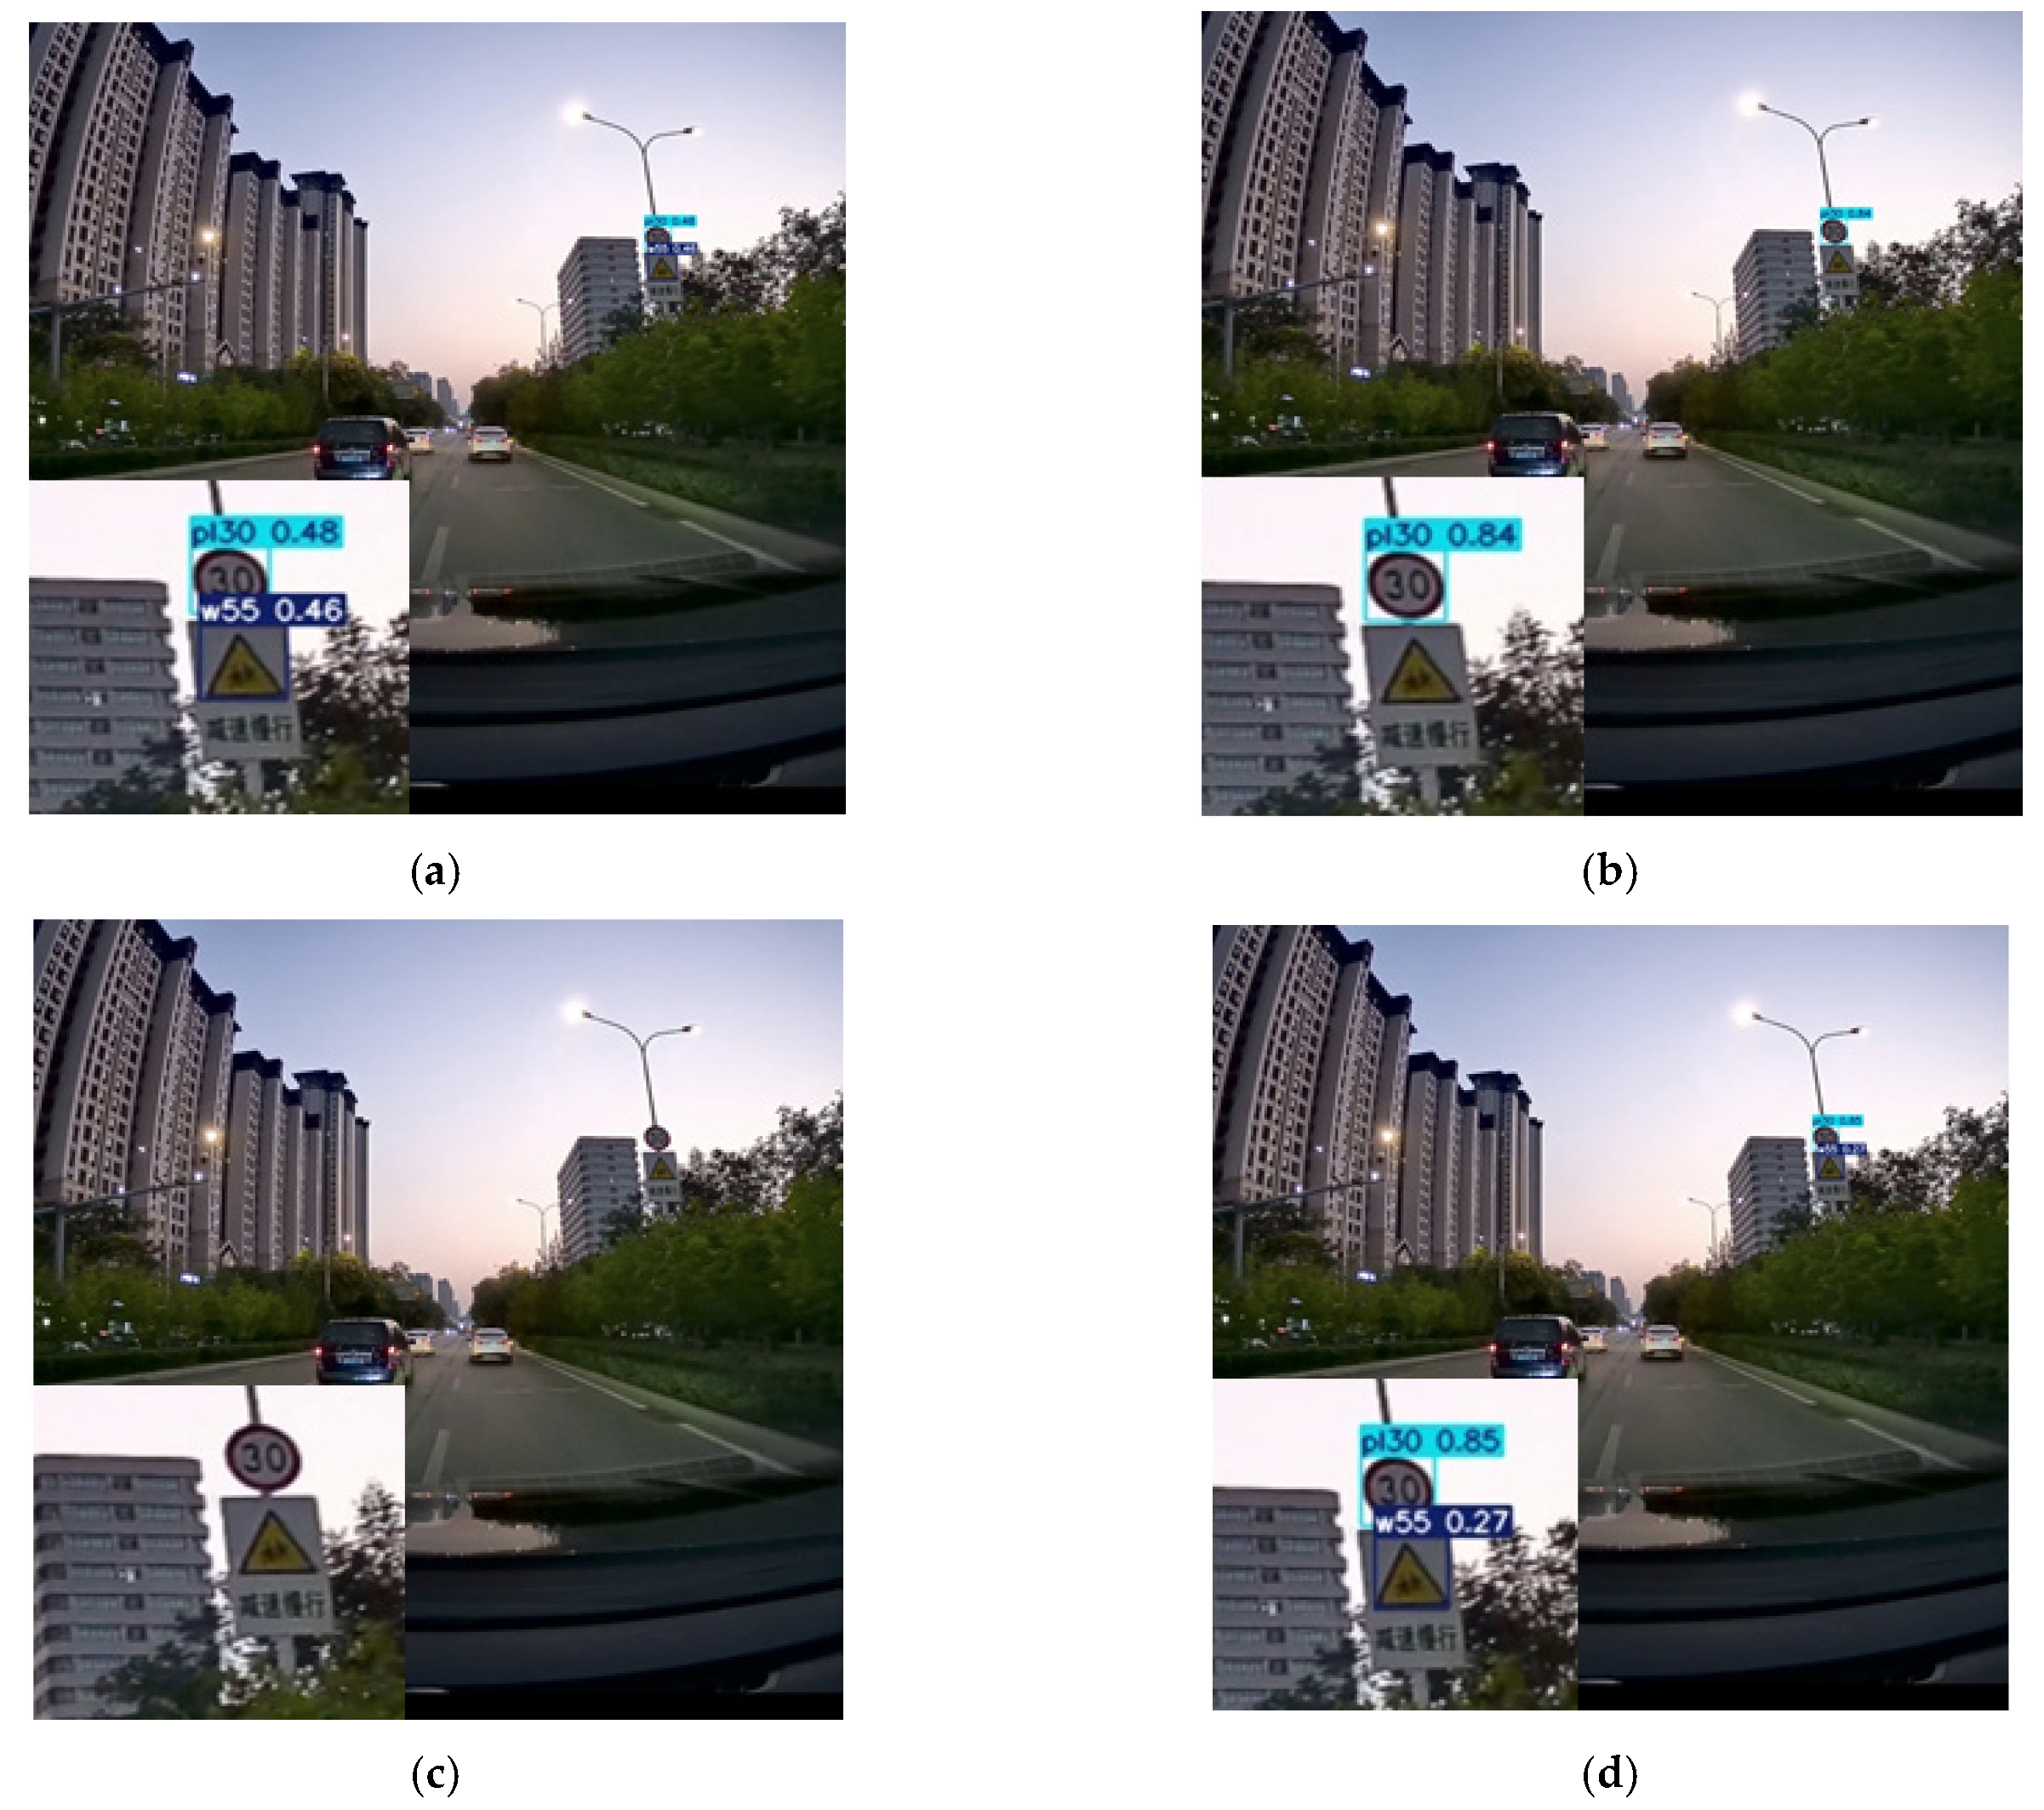
To validate the model’s generalization capability in real-world dynamic environments, inference verification was conducted on our custom dataset. This dataset encompasses three challenging scenarios: low-illumination conditions, overcast-rainy environments, and high-glare scenarios. All evaluations employed identical default inference parameters (conf = 0.25, iou = 0.7), with comparative visualization of results featuring magnified regions of interest for detailed inspection.
Comparative results under low-illumination conditions are presented in Figure 13. Analysis reveals baseline detectors YOLOv8s and YOLOv10s exhibit sign omission during twilight scenarios. YOLOv5s shows competent detection, accurately identifying “pl30” and “w55” signs with 48% and 46% detection rates, respectively. The proposed CPB-YOLOv8 achieves significantly improved accuracies of 85% and 27% for these sign categories. These results demonstrate CPB-YOLOv8’s enhanced detection capability in low-light environments.
Figure 14 shows rainy condition comparisons. Compared (a) to (d), it is obvious that YOLOv5s misclassifies “p12” (no motorcycles) as “p5” (no U-turns) and misidentifies “pl80” as “pl60”. YOLOv10s commits identical “pl80” misidentification while missing “p12”. YOLOv8s correctly detects “pl80” but fails to identify “p12”. Conversely, CPB-YOLOv8 accurately recognizes both signs with 88% and 37% accuracy rates. These results demonstrate its enhanced capability in resolving omission and false positive errors under rainy conditions.
Figure 15 shows strong-glare comparison results. YOLOv5s fails to detect the “p26” sign (no trucks). Both YOLOv8s and YOLOv10s correctly identify this sign at 51% and 84% accuracy. CPB-YOLOv8 achieves 90% accuracy, which is a 39% improvement over YOLOv8s and 6% higher than YOLOv10s. These results demonstrate CPB-YOLOv8’s robust detection capability under intense illumination.

5. Conclusions and Future Work

This study proposes CPB-YOLOv8, an enhanced detector based on the YOLOv8 framework designed to address multi-scale and complex background challenges in traffic sign detection. The proposed architecture mitigates feature information loss during downsampling through the CSP-PTB module and enhances multi-scale feature representation, especially for small objects, via a BiFPN integrated with a P2 detection layer. Extensive evaluations demonstrate the model’s strong performance: on the TT100K and CCTSDB benchmarks, it achieved mAP@0.5 improvements of 3.94% and 1.98%, respectively, over the baseline, while maintaining a compact model size of only 12.5 MB. Crucially, the model exhibits remarkable generalization ability across diverse conditions. Rigorous testing on partitioned CCTSDB subsets (e.g., rain, snow, and night) and validation on a reserved custom dataset capturing dynamic real-road scenarios (dusk, rain, and glare) confirmed its robustness to environmental variations and strong anti-interference capability against complex backgrounds.
However, the study has certain limitations. Recognition stability under extreme occlusion (>70% coverage) requires further enhancement, and performance in exceptionally harsh conditions (e.g., torrential rain and sandstorms) remains to be thoroughly investigated. Furthermore, while the model’s compact size and high computational efficiency (201.46 FPS on a standard GPU) indicate its strong potential for resource-constrained platforms, on-device benchmarking on mobile or embedded systems was not included in the current scope. Future work will pursue two main directions: first, to develop more advanced feature enhancement mechanisms tailored for extreme weather and occlusion scenarios, further advancing the model’s real-road generalization; second, to conduct comprehensive deployment and evaluation on mobile devices and other edge computing platforms, rigorously quantifying its latency and power efficiency to fully validate its applicability in practical intelligent transportation systems.

Author Contributions

Conceptualization, W.Z. and L.L.; methodology, W.Z. and L.L.; software, L.L. and X.G.; validation, W.Z. and X.G.; formal analysis, L.L. and X.G.; investigation, W.Z., L.L. and X.G.; resources, W.Z. and X.G.; data curation, W.Z. and L.L.; writing—original draft preparation, W.Z. and L.L.; writing—review and editing, L.L. and X.G.; visualization, L.L. and X.G.; supervision, W.Z., L.L. and X.G.; project administration, W.Z., L.L. and X.G.; funding acquisition, W.Z. and L.L. All authors have read and agreed to the published version of the manuscript.

Funding

This research received no external funding.

Institutional Review Board Statement

Not applicable.

Informed Consent Statement

Not applicable.

Data Availability Statement

The data used to support the findings of this study are available from the corresponding author upon request.

Conflicts of Interest

The authors declare no conflicts of interest.

Appendix A

Table A1. Mapping of TT100K dataset class codes to their semantic descriptions.
Class CodeSemantic Description
pl80Speed Limit 80 km/h
p6No Bicycles
p5No U-Turn
pm55Weight Limit 55 t
pl60Speed Limit 60 km/h
ipPedestrian Crossing
p11No Honking
i2rNon-motor Vehicle Lane
p23No Left Turn
pgYield
il80Minimum Speed 80 km/h
ph4Height Limit 4 m
i4Motor Vehicles Only
pl70Speed Limit 70 km/h
pneNo Entry
ph4.5Height Limit 4.5 m
p12No Motorcycles
p3No Large Buses
pl5No Hand Carts
w13Crossroads
i4lMotor Vehicle Lane
pl30Speed Limit 30 km/h
p10No Motor Vehicles
pnNo Parking
w55Children Crossing
p26No Trucks
p13No Two Types of Vehicles
pr40End of Speed Limit 40
pl20Speed Limit 20 km/h
pm30Weight Limit 30 t
pl40Speed Limit 40 km/h
i2Non-motor Vehicles Only
pl120Speed Limit 120 km/h
w32Roadwork
ph5Height Limit 5 m
il60Minimum Speed 60 km/h
w57Pedestrians
pl100Speed Limit 100 km/h
w59Lane Merge
il100Minimum Speed 100 km/h
p19No Right Turn
pm20Weight Limit 20 t
i5Keep Right
p27No Dangerous Goods Vehicles
pl50Speed Limit 50 km/h

References

  1. Zhang, J.; Wang, F.; Wang, K.; Lin, W.; Xu, X.; Chen, C. Data-Driven Intelligent Transportation Systems: A Survey. IEEE Trans. Intell. Transp. Syst. 2011, 12, 1624–1639. [Google Scholar] [CrossRef]
  2. Alam, A.; Jaffery, Z.A. Indian traffic sign detection and recognition. Int. J. Intell. Transp. Syst. Res. 2020, 18, 98–112. [Google Scholar] [CrossRef]
  3. Stallkamp, J.; Schlipsing, M.; Salmen, J.; Igel, C. The German Traffic Sign Recognition Benchmark: A multi-class classification competition. In Proceedings of the International Joint Conference on Neural Networks (IJCNN), San Jose, CA, USA, 31 July–5 August 2011; pp. 1453–1460. [Google Scholar]
  4. Fernández, R.; Caraballo, S.; López, F. A probabilistic approach for determining the influence of urban traffic management policies on energy consumption and greenhouse gas emissions from a battery electric vehicle. J. Clean. Prod. 2019, 236, 14. [Google Scholar] [CrossRef]
  5. Yao, J.; Huang, B.; Yang, S.; Xiang, X.; Lu, Z. Traffic sign detection and recognition under low illumination. Mach. Vis. Appl. 2023, 34, 19. [Google Scholar] [CrossRef]
  6. Girshick, R.; Donahue, J.; Darrell, T.; Malik, J. Rich feature hierarchies for accurate object detection and semantic segmentation. In Proceedings of the 27th IEEE Conference on Computer Vision and Pattern Recognition (CVPR), Columbus, OH, USA, 23–28 June 2014; pp. 580–587. [Google Scholar]
  7. Ren, S.; He, K.; Girshick, R.; Sun, J. Faster R-CNN: Towards Real-Time Object Detection with Region Proposal Networks. IEEE Trans. Pattern Anal. Mach. Intell. 2017, 39, 1137–1149. [Google Scholar] [CrossRef]
  8. Cai, Z.; Vasconcelos, N. Cascade R-CNN: Delving into High Quality Object Detection. In Proceedings of the 31st IEEE/CVF Conference on Computer Vision and Pattern Recognition (CVPR), Salt Lake City, UT, USA, 18–23 June 2018; pp. 6154–6162. [Google Scholar]
  9. Sun, P.; Zhang, R.; Jiang, Y.; Kong, T.; Xu, C.; Zhan, W.; Tomizuka, M.; Li, L.; Yuan, Z.; Wang, C.; et al. Sparse R-CNN: End-to-End Object Detection with Learnable Proposals. In Proceedings of the IEEE/CVF Conference on Computer Vision and Pattern Recognition (CVPR), Electr Network, Seattle, WA, USA, 19–25 June 2021; pp. 14449–14458. [Google Scholar]
  10. Liu, W.; Anguelov, D.; Erhan, D.; Szegedy, C.; Reed, S.; Fu, C.; Berg, A. SSD: Single Shot MultiBox Detector. In Proceedings of the 14th European Conference on Computer Vision (ECCV), Amsterdam, The Netherlands, 8–16 October 2016; pp. 21–37. [Google Scholar]
  11. Lin, T.; Goyal, P.; Girshick, R.; He, K.; Dollár, P. Focal Loss for Dense Object Detection. IEEE Trans. Pattern Anal. Mach. Intell. 2020, 42, 318–327. [Google Scholar] [CrossRef] [PubMed]
  12. Redmon, J.; Divvala, S.; Girshick, R.; Farhadi, A. You Only Look Once: Unified, Real-Time Object Detection. In Proceedings of the 2016 IEEE Conference on Computer Vision and Pattern Recognition (CVPR), Seattle, WA, USA, 27–30 June 2016; pp. 779–788. [Google Scholar]
  13. Wang, C.; Liao, H.; Wu, Y.; Chen, P.; Hsieh, J.; Yeh, I. CSPNet: A New Backbone that can Enhance Learning Capability of CNN. In Proceedings of the IEEE/CVF Conference on Computer Vision and Pattern Recognition (CVPR), Electr Network, Seattle, WA, USA, 14–19 June 2020; pp. 1571–1580. [Google Scholar]
  14. Tan, M.; Pang, R.; Le, Q. EfficientDet: Scalable and Efficient Object Detection. In Proceedings of the IEEE/CVF Conference on Computer Vision and Pattern Recognition (CVPR), Electr Network, Seattle, WA, USA, 14–19 June 2020; pp. 10778–10787. [Google Scholar]
  15. Tong, Z.; Chen, Y.; Xu, Z.; Yu, R. Wise-IoU: Bounding box regression loss with dynamic focusing mechanism. arXiv 2023, arXiv:2301.10051. [Google Scholar]
  16. Deng, C.; Wang, M.; Liu, L.; Liu, Y.; Jiang, Y. Extended Feature Pyramid Network for Small Object Detection. IEEE Trans. Multimed. 2022, 24, 1968–1979. [Google Scholar] [CrossRef]
  17. Liu, C.; Li, S.; Chang, F.; Wang, Y. Machine Vision Based Traffic Sign Detection Methods: Review, Analyses and Perspectives. IEEE Access 2019, 7, 86578–86596. [Google Scholar] [CrossRef]
  18. Jenifer, A.M.; Balamanigandan, R. Automated Traffic Sign Detection Using HSV Filtering and ROI based SVM Classification. In Proceedings of the 2024 International Conference on Sustainable Communication Networks and Application (ICSCNA), Theni, India, 11–13 December 2024; pp. 1481–1486. [Google Scholar]
  19. Hu, L.; Lu, Y.; Fu, S. Empirical study of the salience attribute of symbols in HSL colour space. In Proceedings of the 2024 4th International Conference on Artificial Intelligence, Automation and High Performance Computing, New York, NY, USA, 19–21 July 2024; pp. 96–100. [Google Scholar]
  20. Fontana, M.; García-Fernández, A.; Maskell, S. Notch power detector for multiple vehicle trajectory estimation with distributed acoustic sensing. Signal Process. 2025, 232, 14. [Google Scholar] [CrossRef]
  21. Huang, K. Traditional methods and machine learning-based methods for traffic sign detection. In Proceedings of the Third International Conference on Intelligent Computing and Human-Computer Interaction (ICHCI 2022), Qingdao, China, 12 January 2023; pp. 539–544. [Google Scholar]
  22. Yu, J.; Ye, X.; Tu, Q. Traffic Sign Detection and Recognition in Multiimages Using a Fusion Model With YOLO and VGG Network. IEEE Trans. Intell. Transp. Syst. 2022, 23, 16632–16642. [Google Scholar] [CrossRef]
  23. Ellahyani, A.; El Jaafari, I.; Charfi, S. Traffic sign detection for intelligent transportation systems: A survey. In Proceedings of the E3S Web of Conferences, Les Ulis, France, 5–7 May 2021; p. 1006. [Google Scholar]
  24. Liang, T.; Bao, H.; Pan, W.; Pan, F. Traffic Sign Detection via Improved Sparse R-CNN for Autonomous Vehicles. J. Adv. Transp. 2022, 2022, 3825532. [Google Scholar] [CrossRef]
  25. Wang, J.; Chen, Y.; Dong, Z.; Gao, M. Improved YOLOv5 network for real-time multi-scale traffic sign detection. Neural Comput. Appl. 2023, 35, 7853–7865. [Google Scholar] [CrossRef]
  26. Wei, H.; Zhang, Q.; Qin, Y.; Li, X.; Qian, Y. YOLOF-F: You only look one-level feature fusion for traffic sign detection. Vis. Comput. 2024, 40, 747–760. [Google Scholar] [CrossRef]
  27. Wang, J.; Chen, Y.; Ji, X.; Dong, Z.; Gao, M.; Lai, C. Vehicle-Mounted Adaptive Traffic Sign Detector for Small-Sized Signs in Multiple Working Conditions. IEEE Trans. Intell. Transp. Syst. 2024, 25, 710–724. [Google Scholar] [CrossRef]
  28. Wang, S.; Qu, Z.; Li, C.; Gao, L. BANet: Small and multi-object detection with a bidirectional attention network for traffic scenes. Eng. Appl. Artif. Intell. 2023, 117, 105504. [Google Scholar] [CrossRef]
  29. Wang, C.Y.; Yeh, I.H.; Mark Liao, H.Y. YOLOv9: Learning What You Want toLearn Using Programmable Gradient Information. In Proceedings of the European Conference on Computer Vision, Dublin, Ireland, 17–18 September 2025. [Google Scholar]
  30. Wang, A.; Chen, H.; Liu, L.; Chen, K.; Lin, Z.; Han, J.; Ding, G. YOLOv10: Real-Time End-to-End Object Detection. Adv. Neural Inf. Process. Syst. 2024, 37, 107984–108011. [Google Scholar]
  31. Han, K.; Wang, Y.; Chen, H.; Chen, X.; Guo, J.; Liu, Z.; Tang, Y.; Xiao, A.; Xu, C.; Xu, Y.; et al. A Survey on Vision Transformer. IEEE Trans. Pattern Anal. Mach. Intell. 2023, 45, 87–110. [Google Scholar] [CrossRef]
  32. Voita, E.; Talbot, D.; Moiseev, F.; Sennrich, R.; Titov, I. Analyzing Multi-Head Self-Attention: Specialized Heads Do the Heavy Lifting, the Rest Can Be Pruned. In Proceedings of the 57th Annual Meeting of the Association-for-Computational-Linguistics (ACL), Florence, Italy, 28 July–2 August 2019; pp. 5797–5808. [Google Scholar]
  33. Kirillov, A.; Girshick, R.; He, K.; Dollár, P.; Soc, I.C. Panoptic Feature Pyramid Networks. In Proceedings of the 32nd IEEE/CVF Conference on Computer Vision and Pattern Recognition (CVPR), Long Beach, CA, USA, 16–20 June 2019; pp. 6392–6401. [Google Scholar]
  34. Qian, X.; Zhang, N.; Wang, W. Smooth GIoU Loss for Oriented Object Detection in Remote Sensing Images. Remote Sens. 2023, 15, 1259. [Google Scholar] [CrossRef]
  35. Wang, Q.; Ma, Y.; Zhao, K.; Tian, Y. A comprehensive survey of loss functions in machine learning. Ann. Data Sci. 2022, 9, 187–212. [Google Scholar] [CrossRef]
  36. Zhu, Z.; Liang, D.; Zhang, S.; Huang, X.; Li, B.; Hu, S. Traffic-Sign Detection and Classification in the Wild. In Proceedings of the 2016 IEEE Conference on Computer Vision and Pattern Recognition (CVPR), Seattle, WA, USA, 27–30 June 2016; pp. 2110–2118. [Google Scholar]
  37. Zhang, J.; Zou, X.; Kuang, L.; Wang, J.; Sherratt, R.; Yu, X. CCTSDB 2021: A More Comprehensive Traffic Sign Detection Benchmark. Hum.-Centric Comput. Inf. Sci. 2022, 12, 19. [Google Scholar] [CrossRef]
Figure 1. Schematic of the YOLOv8 network architecture, comprising Backbone, Neck, and Head components.
Information 16 00798 g001
Figure 2. Schematic of the proposed CPB-YOLOv8 framework. The feature fusion component employs a BiFPN for feature integration. The node operations are performed by the C2f module, preceded by 1 × 1 convolutional layers that project all input features to a uniform channel size of 224 (a hyperparameter chosen to balance computational cost and representational power).
Information 16 00798 g002
Figure 3. Comparison of the structure diagrams of the C2f module and CSP-PTB implementation. X c n n and X t r a n s represent feature maps partitioned to the CNN and Transformer branches, respectively. The processed feature maps F c n n and F t r a n s undergo channel-wise concatenation followed by a convolutional layer for feature integration before propagation to subsequent layers. (a) C2f modules. (b) CSP-PTB modules.
Information 16 00798 g003
Figure 4. Structure of the MHSA model. MatMul: Matrix multiplication. Softmax: Normalizes scores to yield attention weights. Mask (opt.): Optional masking operation.
Information 16 00798 g004
Figure 5. Architecture of the MHSA-CGLU module. Norm denotes Layer Normalization (LN), Droppath applies stochastic depth regularization to residual connections for overfitting mitigation.
Information 16 00798 g005
Figure 6. Four-level BiFPN incorporating the P2 layer. Up: 2× bilinear upsampling, F (Fusion): adaptive feature fusion with learnable weights.
Information 16 00798 g006
Figure 7. Distribution of the selected 45 traffic sign classes from the TT100K dataset. The horizontal axis shows the official class codes from the dataset. The specific meaning of these codes is provided in Appendix A, Table A1.
Information 16 00798 g007
Figure 8. Heatmap comparison of detection results: YOLOv8 vs. CPB-YOLOv8. In the heatmaps, warmer colors (such as red, orange, and yellow) indicate regions with higher attention or confidence in object detection, while cooler colors (like blue and purple) represent regions with lower attention or confidence.
Information 16 00798 g008
Figure 9. Visual comparison between the proposed model and benchmark detectors on TT100K: (a) Original road scene; (b) Detection results of YOLOv8s; (c) Detection results of CPB-YOLOv8.
Information 16 00798 g009
Figure 10. Visual detection comparison under sunny conditions: (a) YOLOv8s test results. (b) CPB-YOLOv8 test results.
Information 16 00798 g010
Figure 11. Visual detection comparison under night and rain conditions (1: night; 2: rain). (a1,a2) YOLOv8s test results. (b1,b2) CPB-YOLOv8 test results.
Information 16 00798 g011aInformation 16 00798 g011b
Figure 12. Visual detection comparison across foggy, snowy, and cloudy conditions (1: foggy; 2: snowy; 3: cloudy). (a1a3) YOLOv8s test results. (b1b3) CPB-YOLOv8 test results.
Information 16 00798 g012aInformation 16 00798 g012b
Figure 13. Visual comparison chart under low-illumination conditions. (a) YOLOv5s test results. (b) YOLOv8s test results. (c) YOLOv10s test results. (d) CPB-YOLOv8 test results.
Information 16 00798 g013
Figure 14. Visual comparison chart under rainy conditions. (a) YOLOv5s test results. (b) YOLOv8s test results. (c) YOLOv10s test results. (d) CPB-YOLOv8 test results.
Information 16 00798 g014aInformation 16 00798 g014b
Figure 15. Visual comparison chart under strong-glare conditions. (a) YOLOv5s test results. (b) YOLOv8s test results. (c) YOLOv10s test results. (d) CPB-YOLOv8 test results.
Information 16 00798 g015
Table 1. Sample distribution by category in the CCTSDB test set under varying weather and illumination conditions.
EnvironmentSample Count
rain192
sunny434
cloud321
night533
snow134
foggy172
Table 2. Combination of different improvement strategies with YOLOv8 infrastructure. (“-”: not included; “√”: included).
ModelBase ModelCSP-PTBBIFPNP2Wise-IoU v3
M1YOLOv8s----
M2YOLOv8s---
M3YOLOv8s---
M4YOLOv8s--
M5YOLOv8s-
M6YOLOv8s
Table 3. Validation results of different improvement strategies on TT100K.
ModelPrecisionRecallF1 ScoremAP@0.5mAP@0.5:0.95Model SizeFPS
M188.10%77.02%81.82%86.79%67.72%21.5 MB264.13
M286.00%80.96%83.12%88.06%68.88%19.4 MB269.05
M388.32%78.62%82.95%87.93%69.38%14.4 MB424.31
M488.10%79.77%83.46%88.54%69.59%11.9 MB301.79
M589.70%82.96%85.86%89.59%69.78%12.5 MB204.92
M688.76%83.45%85.82%90.73%70.54%12.5 MB201.46
Table 4. Validation results of different improvement strategies on CCTSDB.
ModelPrecisionRecallF1_scoremAP@0.5mAP@0.5:0.95Model-SizeFPS
M195.67%93.50%94.57%97.23%75.04%21.5 MB707.14
M296.73%94.66%95.68%98.15%77.77%19.3 MB551.97
M396.83%95.74%96.28%98.21%78.39%14.3 MB687.92
M496.32%95.24%95.77%98.04%78.14%11.8 MB561.92
M597.22%97.38%97.30%99.00%78.62%12.3 MB511.29
M697.14%97.76%97.45%99.21%78.92%12.3 MB493.48
Table 5. Comparison of validation results of different models on the TT100K and CCTSDB datasets.
DatasetModelPrecisionRecallF1_ScoremAP@0.5Model-SizeFPS
TT100K SSD70.41%76.05%73.12%75.11%13.1 MB80.21
YOLOv586.78%77.40%81.42%86.78%17.7 MB503.72
YOLOv888.10%77.02%81.82%86.79%21.5 MB264.13
YOLOv1083.77%77.32%80.18%85.66%15.8 MB563.21
YOLOv1183.43%79.74%81.18%86.26%18.3 MB457.23
YOLOv1281.17%72.05%75.86%80.80%17.8 MB435.13
Hyper-YOLO85.63%78.39%81.20%87.22%28.7 MB199.09
RT-DETR89.22%83.94%86.18%86.96%77.2 MB58.76
CPB-YOLOv8(ours)88.76%83.45%85.82%90.73%12.5 MB201.46
CCTSDBSSD86.30%82.10%84.15%84.60%13.1 MB92.30
YOLOv596.07%94.20%95.12%97.80%17.6 MB759.90
YOLOv895.67%93.50%94.57%97.23%21.5 MB707.14
YOLOv1095.80%95.45%95.63%98.16%15.7 MB915.09
YOLOv1195.80%94.58%95.18%97.78%18.3 MB704.49
YOLOv1296.02%92.34%94.14%97.16%17.8 MB607.55
Hyper-YOLO95.77%94.75%95.26%97.95%28.6 MB390.27
RT-DETR96.09%96.24%96.16%98.64%76.9 MB99.4
CPB-YOLOv8(ours)97.14%97.76%97.45%99.21%12.3 MB493.48
Table 6. Detailed mAP values of each class on TT100K dataset (%).
MethodAllpl80p6p5pm55pl60ipp11i2rp23pgil80
YOLOv586.7886.8673.7390.7992.8983.7593.0689.4887.0487.5395.0395.14
YOLOv886.7989.6477.2890.8593.7383.1593.0587.5988.7386.6893.0794.77
YOLOv1085.6686.56 77.56 90.8590.7981.4893.8587.4187.1486.3995.5691.83
Hyper-YOLO87.2288.9870.3692.5593.4384.6494.1290.6388.3583.8095.0297.54
CPB-YOLOv890.7389.7374.2595.7693.7989.6395.6493.1886.3192.9892.5096.13
Methodph4i4pl70pneph4.5p12p3pl5w13i4lpl30p10
YOLOv581.7088.4485.2992.6786.2084.1692.4084.3674.5691.8082.4279.86
YOLOv880.6489.5386.1793.6482.6888.9889.7083.6673.2991.9779.6875.83
YOLOv1080.4390.4481.7193.0886.1676.4292.9283.5568.0092.3681.1672.72
Hyper-YOLO81.8089.7079.9295.1583.6183.7782.8387.1677.4693.3287.2480.71
CPB-YOLOv884.3693.5190.0997.3787.0191.9094.3688.7781.2295.9788.7485.25
Methodpnw55p26p13pr40pl20pm30pl40i2pl120w32ph5
YOLOv592.1481.4192.0288.1594.2859.6783.3185.8284.7991.9772.7370.01
YOLOv892.2880.7791.2684.3994.5763.7883.3884.7786.8792.7468.7179.76
YOLOv1092.9982.0190.6784.4692.2562.8076.1985.1287.7691.9179.7670.32
Hyper-YOLO95.0679.1892.7887.3299.1162.4590.2486.8887.7497.3882.8868.25
CPB-YOLOv896.6291.1894.2486.8197.0972.9988.2890.7988.8596.1785.3177.14
Methodil60w57pl100w59il100p19pm20i5p27 pl50   
YOLOv596.7990.8795.8793.0695.6082.8288.1591.9996.8377.69  
YOLOv897.2294.1596.6789.3795.8677.5687.4692.2597.9579.61  
YOLOv1096.1192.7094.9290.7390.9175.8980.6092.4895.9679.99  
Hyper-YOLO97.7691.0995.3186.0494.4871.5591.0594.5792.6478.85  
CPB-YOLOv898.6197.3697.5790.7195.2393.7784.5397.0395.1988.74  
Disclaimer/Publisher’s Note: The statements, opinions and data contained in all publications are solely those of the individual author(s) and contributor(s) and not of MDPI and/or the editor(s). MDPI and/or the editor(s) disclaim responsibility for any injury to people or property resulting from any ideas, methods, instructions or products referred to in the content.