Article

Identifying Individual Information Processing Styles During Advertisement Viewing Through EEG-Driven Classifiers

by
Antiopi Panteli
1,2,*,
Eirini Kalaitzi
1 and
Christos A. Fidas
1,2
1
Interactive Technologies Laboratory, Department of Electrical and Computer Engineering, University of Patras, 26504 Patras, Greece
2
Neuroengineering & Brain-Computer Interfaces Research Infrastructure, University of Patras, 26504 Patras, Greece
*
Author to whom correspondence should be addressed.
Information 2025, 16(9), 757; https://doi.org/10.3390/info16090757
Submission received: 17 July 2025 / Revised: 22 August 2025 / Accepted: 26 August 2025 / Published: 1 September 2025

Abstract

Neuromarketing studies the brain function as a response to marketing stimuli. A large amount of neuromarketing research uses data from electroencephalography (EEG) recordings as a response of individuals’ brains to marketing stimuli, aiming to identify the factors that influence consumer behaviour that they cannot articulate or are reluctant to reveal. Evidence suggests that individuals’ processing styles affect their reaction to marketing stimuli. In this study, we propose and evaluate a predictive model that classifies consumers as verbalizers or visualizers based on EEG signals recorded during exposure to verbal, visual, and mixed advertisements. Participants (N = 22) were categorized into verbalizers and visualizers using the Style of Processing (SOP) scale and underwent EEG recording while viewing ads. The EEG signals were preprocessed and the five EEG frequency bands were extracted. We employed three classification models for every set of ads: SVM, Decision Tree, and kNN. While all three classifiers performed around the same, with accuracy between 86 and 93%, during cross-validation SVM proved to be the more effective model, with kNN and Decision Tree showing sensitivity to data imbalances. Additionally, we conducted independent t-tests to look for statistically significant differences between the two classes. The t-tests implicated the Theta frequency band. Therefore, these findings highlight the potential of leveraging EEG-based technology to effectively predict a consumer’s processing style for advertisements and offers practical applications in fields such as interactive content designs and user-experience personalization.

1. Introduction

The advancement of technology has resulted in the development of new opportunities in the marketing industry and is opening up avenues for innovative approaches such as neuromarketing. Neuromarketing is the study of how a consumer’s brain responds to advertising stimuli; this is achieved by analysing various neurophysiological responses such as brainwave activity and eye tracking. The results obtained by neuromarketing studies are then used by marketers to design targeted marketing campaigns and enhance consumer experience. Various neurophysiological techniques have been employed by researchers over the years, such as eye tracking, functional magnetic resonance imaging (fMRI), electroencephalogram (EEG), heart rate variability (HRV), and galvanic skin response (GSR), to collect additional information about the consumer experience that the consumers themselves cannot articulate or do not recognize. In particular, a large amount of neuromarketing research uses data from EEG recordings, as it is often easier and cheaper to obtain. EEG is a non-invasive method of measuring the electrical signals that travel between neurons of the brain in real time and with high temporal resolution. By recording the brain’s electrical activity, it is possible to obtain information about human behaviour and emotions. It has been proved that EEG is the most popular neuroimaging tool in neuromarketing research [1]. Despite the growing popularity of EEG in consumer research, limited efforts have been made to directly translate these neural insights into predictive frameworks capable of supporting real-time adaptation of content to individual preferences.
Many researchers have attempted to study—through EEG-signal evaluation—how diverse factors such as emotions [2], personal beliefs [3], and demographics [4] can influence consumer behaviour and purchasing decisions. The works published in the literature so far evaluating the impact of diverse factors on consumer decisions through EEG have been classified in a recent review [5]. An important gap highlighted therein was the limited investigation of a consumer’s processing style as a personal factor influencing consumer behaviour and information evaluation, despite the existence of a preliminary study [6] in this direction. Statistical analysis of EEG data was employed to validate the Style of Processing (SOP) scale—originally presented in [7]—and to study the differences in affective processing of picture stimuli of subjects belonging to different cognitive style categories. Advanced analytical techniques, such as classification algorithms, were not employed to classify subjects into visualizers or verbalizers according to extracted patterns of EEG signals, and solely images were utilized as the triggering marketing stimuli.
From a communication standpoint, the effectiveness of personalized advertising depends on aligning message modality with the receiver’s information-processing preferences, often characterized along a visualizer–verbalizer continuum [8,9,10,11]. EEG is widely used in neuromarketing to index attention, memory, and affect at millisecond resolution, with consistent links between frontal theta/alpha dynamics and ad evaluation/encoding [1,12,13]. However, the literature has predominantly employed hypothesis-driven statistical contrasts (means testing/regression) instead of supervised learning with out-of-sample evaluation to predict processing-style labels from EEG features.
Building on this literature, we analyse frequency-domain features (delta–gamma) recorded while participants view verbal, visual, and mixed advertisements. This choice is motivated by the well-established role of oscillatory power as a compact, robust summary of cognitive state in advertising contexts [12,13], and by communication theories—Dual Coding and the Cognitive Theory of Multimedia Learning—which posit partly separable verbal and pictorial processing channels with distinct benefits for persuasion and recall [14,15,16,17].
Despite these early findings, no previous study has attempted to automatically classify consumers into processing style categories based on EEG responses to marketing stimuli. Existing works have primarily focused on identifying neural correlates through statistical comparisons, without leveraging the predictive capabilities of machine learning. In this paper, we address this gap by proposing a supervised classification framework that predicts whether a consumer is a Verbalizer or a Visualizer based on EEG frequency-domain features elicited during advertisement viewing. This approach aims to connect psychometric assessment with real-time neurophysiological profiling, offering novel avenues for personalized content delivery in neuromarketing. To operationalize this aim, we articulate the following research question.
RQ1 (Main Research Question). 
Can EEG frequency-domain features recorded during advertisement viewing be used to classify viewers into verbalizers versus visualizers?
  • The main contributions of this research can be summarized as follows:
    • The provision of empirical evidence that the analysis of a subject’s EEG signals during advertisement exposure can predict their classification as either a verbalizer or a visualizer. As a result, our model can assist marketers in tailoring the content of advertisement campaigns according to the consumer’s processing style, aiming to enhance emotional engagement and improve conversion outcomes.
    • A comparative evaluation of widely used machine learning classifiers—Support Vector Machine (SVM), Decision Tree, and k-Nearest Neighbors (kNN)—for the task of predicting cognitive processing style from EEG frequency-domain features recorded during exposure to different types of advertisements. Also, we test which frequency bands act as neural markers of cognitive processing style across different advertising types, with a priori emphasis on theta based on the prior literature.
The rest of the paper is organized as follows. In Section 2, the related works of this research domain are presented and in Section 3 we analyse the methodological approach that we followed during the study. In Section 4 the corresponding experimental results are presented, and in Section 5 they are discussed. Finally, we draw some conclusions in Section 6.

2. Related Work

2.1. Individual Differences Affecting Consumer Behaviour

It is a current trend to use advanced digital technologies to generate individually tailored advertisements based on consumer profiles. Consumers respond differently to marketing stimuli depending on a variety of individual-level characteristics. These include psychological traits, demographic factors, technology readiness, motivational disposition, learning preferences, and cognitive orientation. Understanding these differences is essential for designing personalized and effective marketing strategies.
Learning styles have been shown to influence decision making across consumer touchpoints. Based on Kolb’s experiential learning theory [18], researchers demonstrated that individual learning preferences shape online purchasing behaviour [19]. Additional psychographic traits, such as locus of control [20], openness to experience [21], and materialism, as factors determining how individuals engage with social media influencers’ content [22] have also been linked to consumers’ different reactions to marketing messages.
Socio-demographic characteristics similarly moderate advertising effectiveness. For example, age, gender, and education influence how consumers perceive promotional campaigns [23,24]. Gender-based processing differences have been examined [25], and revealed that women are more receptive to transparent message framing, while men rely more on pre-existing brand schemas—a result consistent with schema congruity theory [26]. Political beliefs [27] and cognitive busyness [28] have also been shown to affect preference for rational versus affective appeals.
Individual readiness for technology adoption plays a growing role in moderating advertising response. Dispositions toward innovation or resistance affect consumer behaviour in digital environments [29,30], while AI-predicted personality traits have recently been proposed as effective segmentation criteria [31].
Among these dimensions, one particularly relevant to marketing communication is consumer information processing style, often conceptualized as a stable individual preference for visual or verbal information. This variable is further analysed in the following dedicated subsection.

Information Processing Style and Consumer Response

The visualizer–verbalizer hypothesis [8,9] proposes that individuals differ in how they preferentially process information: some favour visual representation (visualizers), while others rely more heavily on verbal or linguistic strategies (verbalizers). Consumers with high visual aesthetics centrality demonstrate greater sensitivity to product imagery [32]. In other words, visualizers generate richer mental imagery from images, whereas verbalizers respond more to detailed textual descriptions [33].
The alignment between message modality and processing preference has been consistently linked to improved advertising outcomes. Congruence between advertisement format and cognitive style enhances message fluency and persuasion [10,11,34]. Several studies further expanded this notion to cultural cognition and motivational orientation [35,36]. More specifically, the adaptation of interface design in mass customization platforms to cultural orientation (analytic vs. holistic) boosted satisfaction and spending. Similarly, consumers motivated by promotions respond more favourably to emotional appeals, while prevention-focused ones respond to rational appeals in a better way.
The effects of processing congruence in digital and immersive contexts have also been explored and it was reported that analytic versus holistic processing modulates moral judgments in endorsement scenarios [37]. Augmented reality (AR) experiences elicit stronger affective responses when matched with a consumer’s processing preference [38]. Another study demonstrated that the effectiveness of destination logos—whether physimorphic or typographic—is moderated by consumers’ visual or verbal style and familiarity with the location [39].
These findings suggest that information processing style is a crucial moderator of consumer behaviour, particularly in the context of high-engagement and media-rich advertising formats. Yet, most prior work has relied on self-report or behavioural methods to assess processing style. The following section discusses how EEG, a neurophysiological technique widely used in neuromarketing, can provide novel insights into this construct.

2.2. EEG in Neuromarketing

2.2.1. General Overview
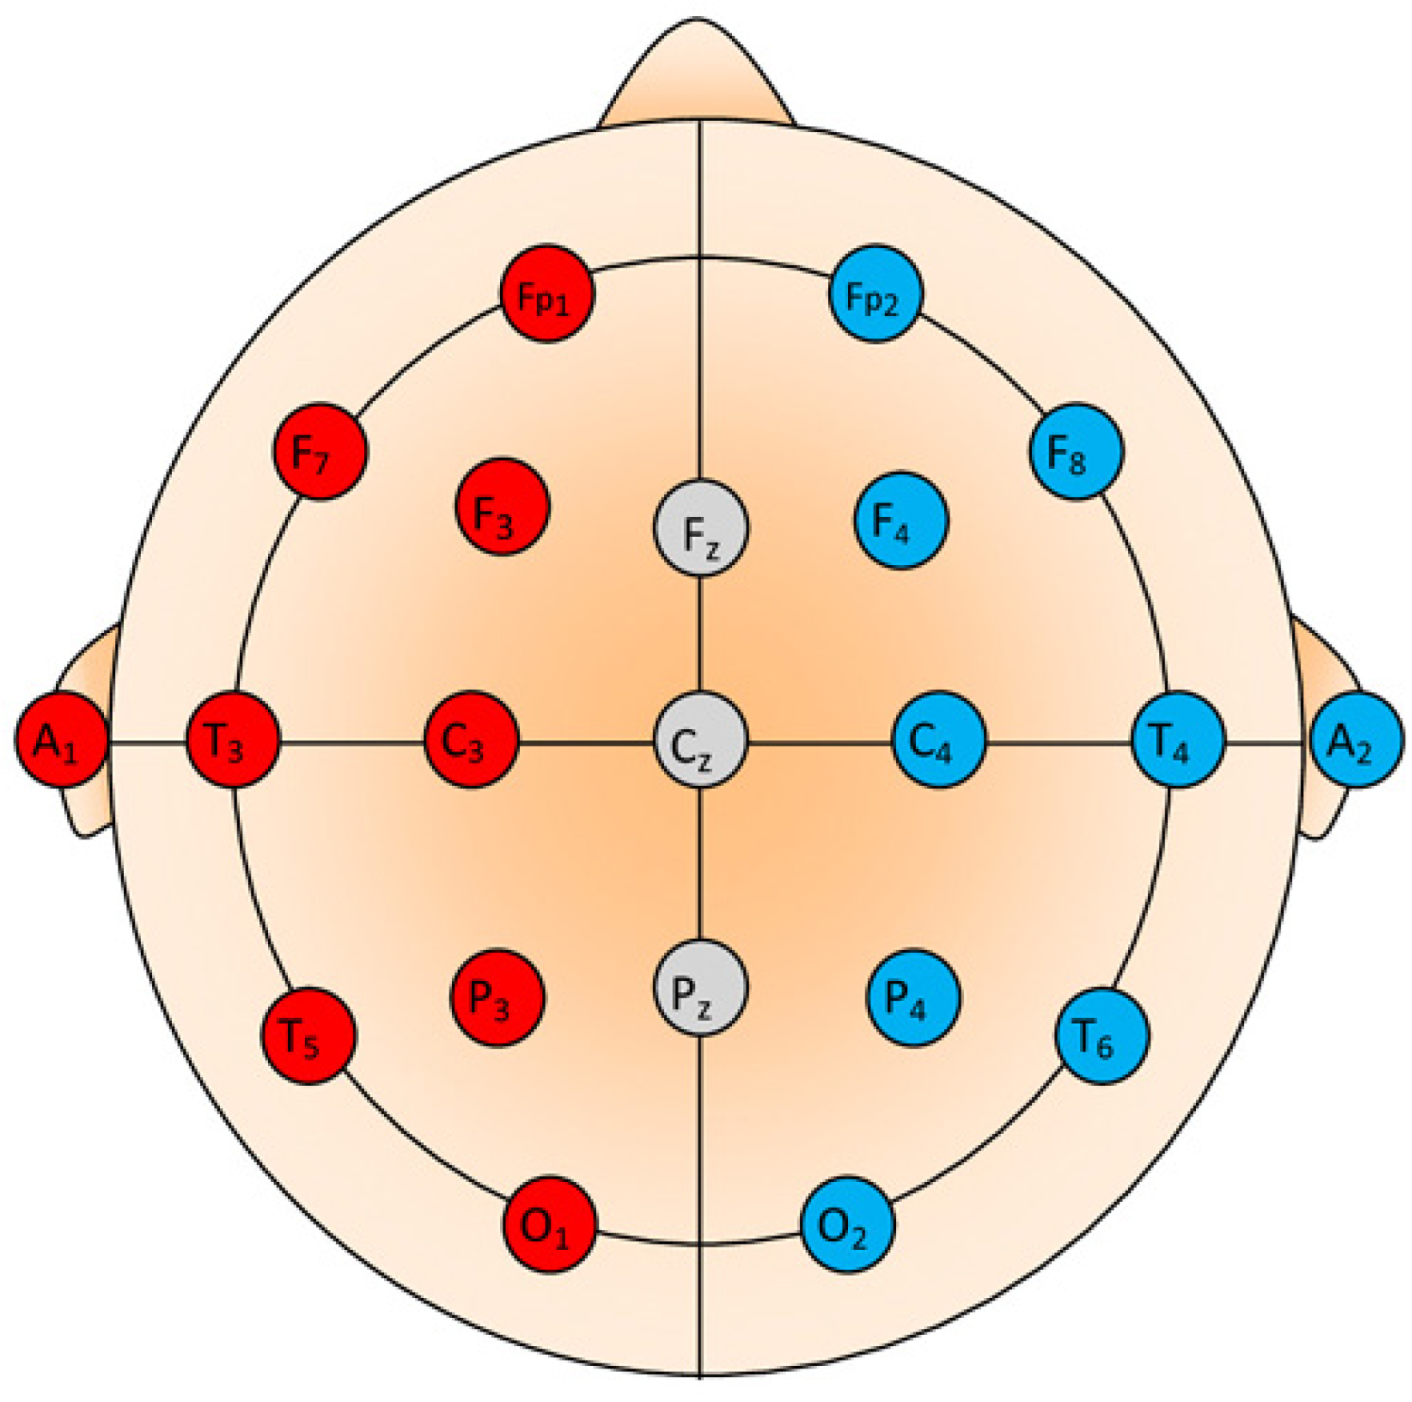
Electroencephalography (EEG) measures electrical activity in the brain via scalp electrodes, offering millisecond-level temporal resolution. Among the various neurophysiological tools used in neuromarketing—such as fMRI, eye tracking, and GSR—EEG is especially popular due to its cost-efficiency, portability, and capacity to capture fast cognitive responses to advertisements, products, or decision-making scenarios [1]. Recordings are typically conducted using the 10–20 or 10–10 international electrode placement systems, which ensure consistent spatial coverage of the scalp [40] (see Figure 1).
However, EEG signals are prone to internal and external artifacts, which can obscure meaningful patterns. Internal artifacts originate from physiological sources such as eye blinks, heartbeats, and muscle activity, while external artifacts may arise from wireless interference, poor electrode contact, or mechanical disturbances [41]. To mitigate such artifacts, EEG studies—including those in neuromarketing—commonly adopt multistage preprocessing pipelines involving bandpass filtering, re-referencing, artifact correction, and component decomposition techniques [42] such as independent component analysis (ICA) [43] and artifact subspace reconstruction (ASR) [44]. These steps are crucial to enhancing signal quality and ensuring the reliability of subsequent analyses.
Figure 1. The 10–20 electrode placement standard [45].
Information 16 00757 g001

2.2.2. EEG-Based Consumer Research

EEG has been widely applied to assess consumer responses to advertisements and branding stimuli. Particular emphasis is often placed on the alpha and theta bands due to their association with attention, cognitive workload, and affective engagement [13]. For example, increased activity in the theta band—particularly in the left frontal areas—has been associated with successful memory encoding and positive affective evaluation of commercials [12]. Similarly, activity in the alpha band has shown associations with attentional states and the degree of engagement, although the observed effects were less robust than in theta. Moreover, a widespread increase in gamma activity over frontal and prefrontal areas has been reported in response to ads that were later recalled or rated as enjoyable, highlighting its role in sensory integration and higher-order cognitive processing [12]. Numerous studies have utilized EEG to predict consumer preferences, identify emotional responses, or evaluate cognitive load in response to marketing stimuli [2,3,4,5].
Recent works have also explored the application of deep learning for personalized advertisement response prediction using EEG signals, such as convolutional neural networks (CNNs) for decoding engagement levels or classifying consumer intent [46,47]. These approaches highlight the potential of combining EEG-based features with advanced machine learning to personalize marketing efforts.
Despite these advances, most EEG-based studies focus on short-term, state-dependent variables (e.g., engagement, affect), rather than stable cognitive traits. Yet, EEG’s temporal granularity and sensitivity to mental workload make it a suitable tool for assessing trait-level differences such as cognitive processing style.
EEG and Cognitive Processing Style
Lin et al. [6] used EEG to detect group-level differences in affective processing between SOP-typed visualizers and verbalizers during static image evaluation. Glass et al. [48] similarly found hemispheric asymmetries based on verbal-imager categorization. However, these efforts did not involve dynamic or marketing-relevant stimuli, and relied on statistical testing rather than predictive modelling.
To the best of our knowledge, no existing work has attempted to classify consumers as visualizers or verbalizers using EEG recordings obtained during exposure to real advertisements. This gap motivates the present study, which combines SOP-based labelling with EEG feature extraction and supervised machine learning to classify cognitive style in the context of marketing stimuli.
Building on the above literature, we expect band-specific, modality-dependent differentiation between processing styles during advertisement viewing. First, theta power—repeatedly linked to successful memory encoding and positive evaluative responses to commercials—should show robust style-sensitive differences during viewing [12]. Second, alpha modulation—associated with attentional engagement and cognitive effort—should vary with the visual load of the stimulus, implying stronger alpha differences under image-led (visual) advertisements [12,13]. Grounded in the visualizer–verbalizer literature and message–style congruence effects [8,9,10,11,33], we further expect clearer differentiation when the ad modality matches the receiver’s dominant processing route. Based on this evidence, we next derive a secondary hypothesis that explicitly links frequency bands and modality.
H2 (Secondary Hypothesis). 
Specific EEG frequency bands may serve as neural markers of cognitive processing style, depending on the modality of the advertisement stimuli (i.e., visual, verbal, mixed).

3. Materials and Methods

Several psychometric instruments have been developed to assess individual differences in information processing style. Among the most notable are Riding’s (1991) Cognitive Style Analysis (CSA) [49], Richardson’s (1977) Verbalizer–Visualizer Questionnaire (VVQ) [50], and Childers’ (1985) Style of Processing (SOP) scale [7]. The SOP scale, in particular, was developed to offer improved internal consistency over the VVQ and to assess the degree to which individuals rely on visual imagery or verbal analytic strategies when interpreting stimuli. It consists of self-descriptive items rated on a Likert scale, producing two separate scores—one for verbal and one for visual preference—allowing participants to be classified along a continuum.
In the context of our study, the SOP scale is used to establish ground truth labels of cognitive style, which are then linked to neurophysiological responses captured during exposure to verbal, visual, and mixed advertising stimuli. This approach is further motivated by previous EEG-based studies of cognitive style. Glass et al. (1999) [48], using Riding’s CSA test, identified hemispheric differences in EEG power between verbalizers and imagers during categorization tasks. Lin et al. (2024) [6] also employed EEG to examine affective processing of static stimuli in SOP-typed participants. Yet, these efforts have not extended to the neuromarketing context, nor have they leveraged EEG data for machine learning classification of processing style.
To the best of our knowledge, no prior study has attempted to predict cognitive processing style (verbalizer vs. visualizer) based on EEG responses elicited by real-world marketing content. Our work addresses this gap by combining validated psychometric assessment with EEG feature extraction and supervised machine learning.

3.1. Stimulus Material

The advertising material used in this study was developed in three distinct formats, tailored to the dominant cognitive processing style of participants: verbal, visual, and mixed. Each advertising stimulus was based on the same underlying product or service but was adapted to emphasize a specific modality.
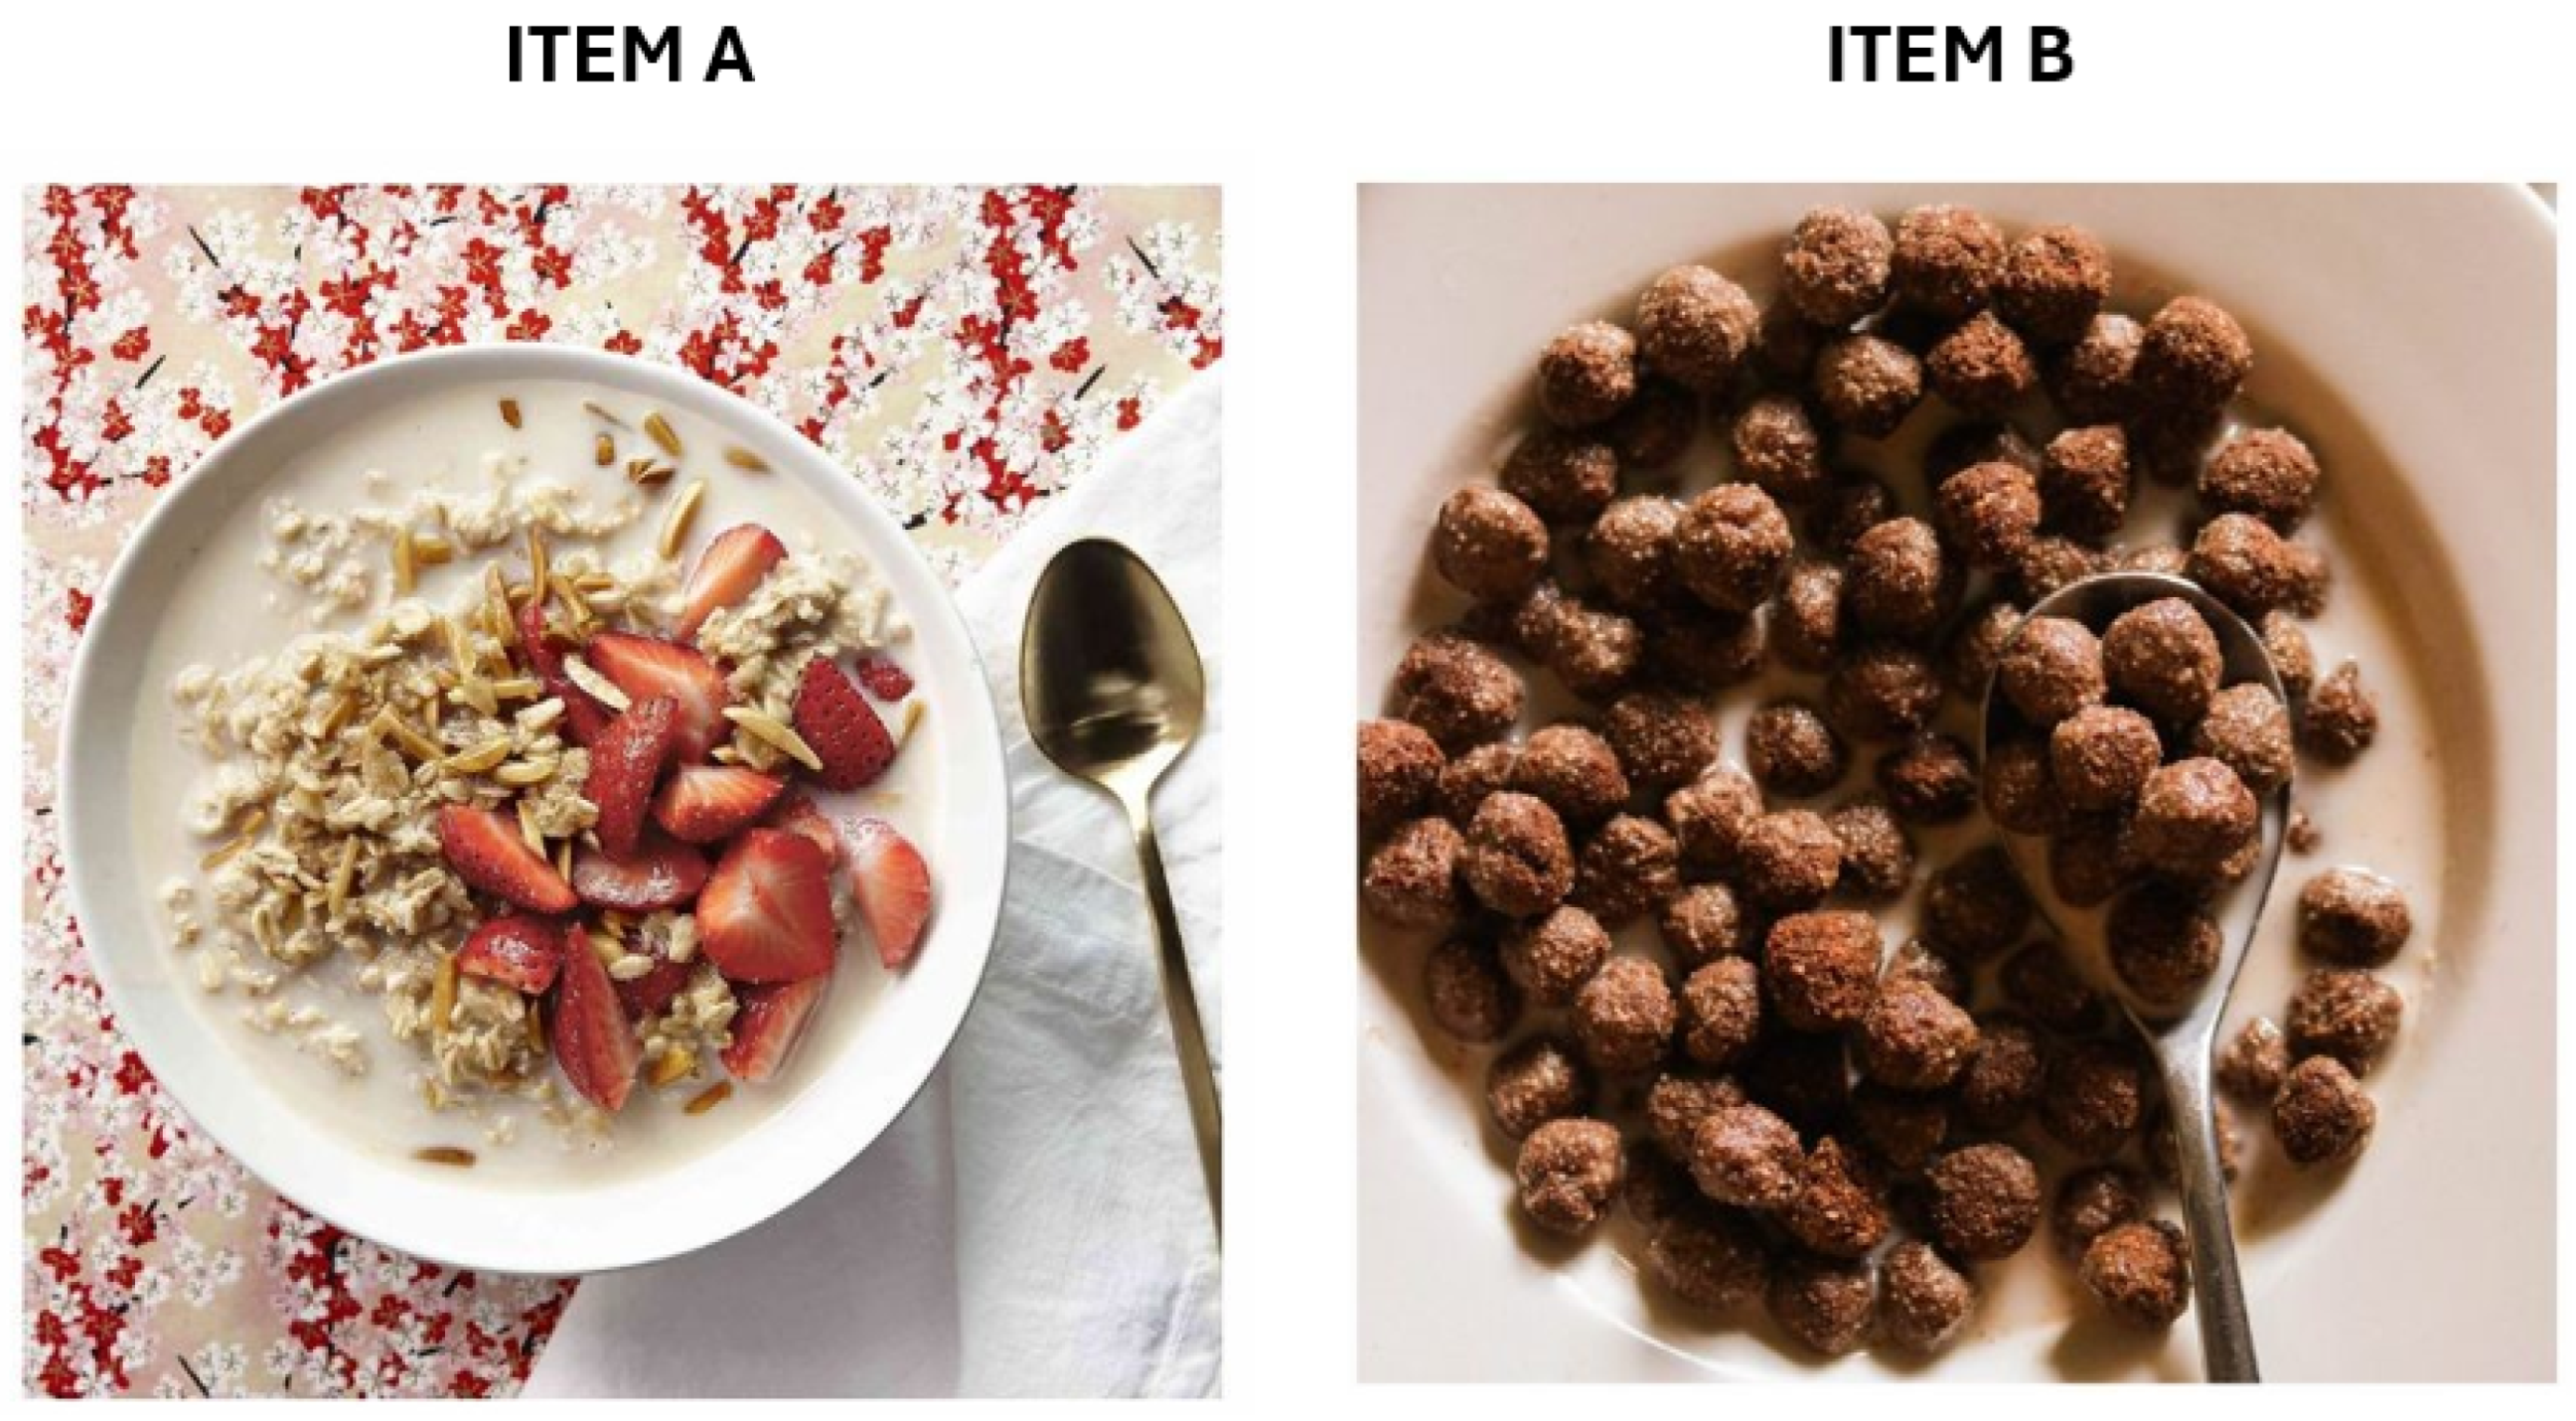
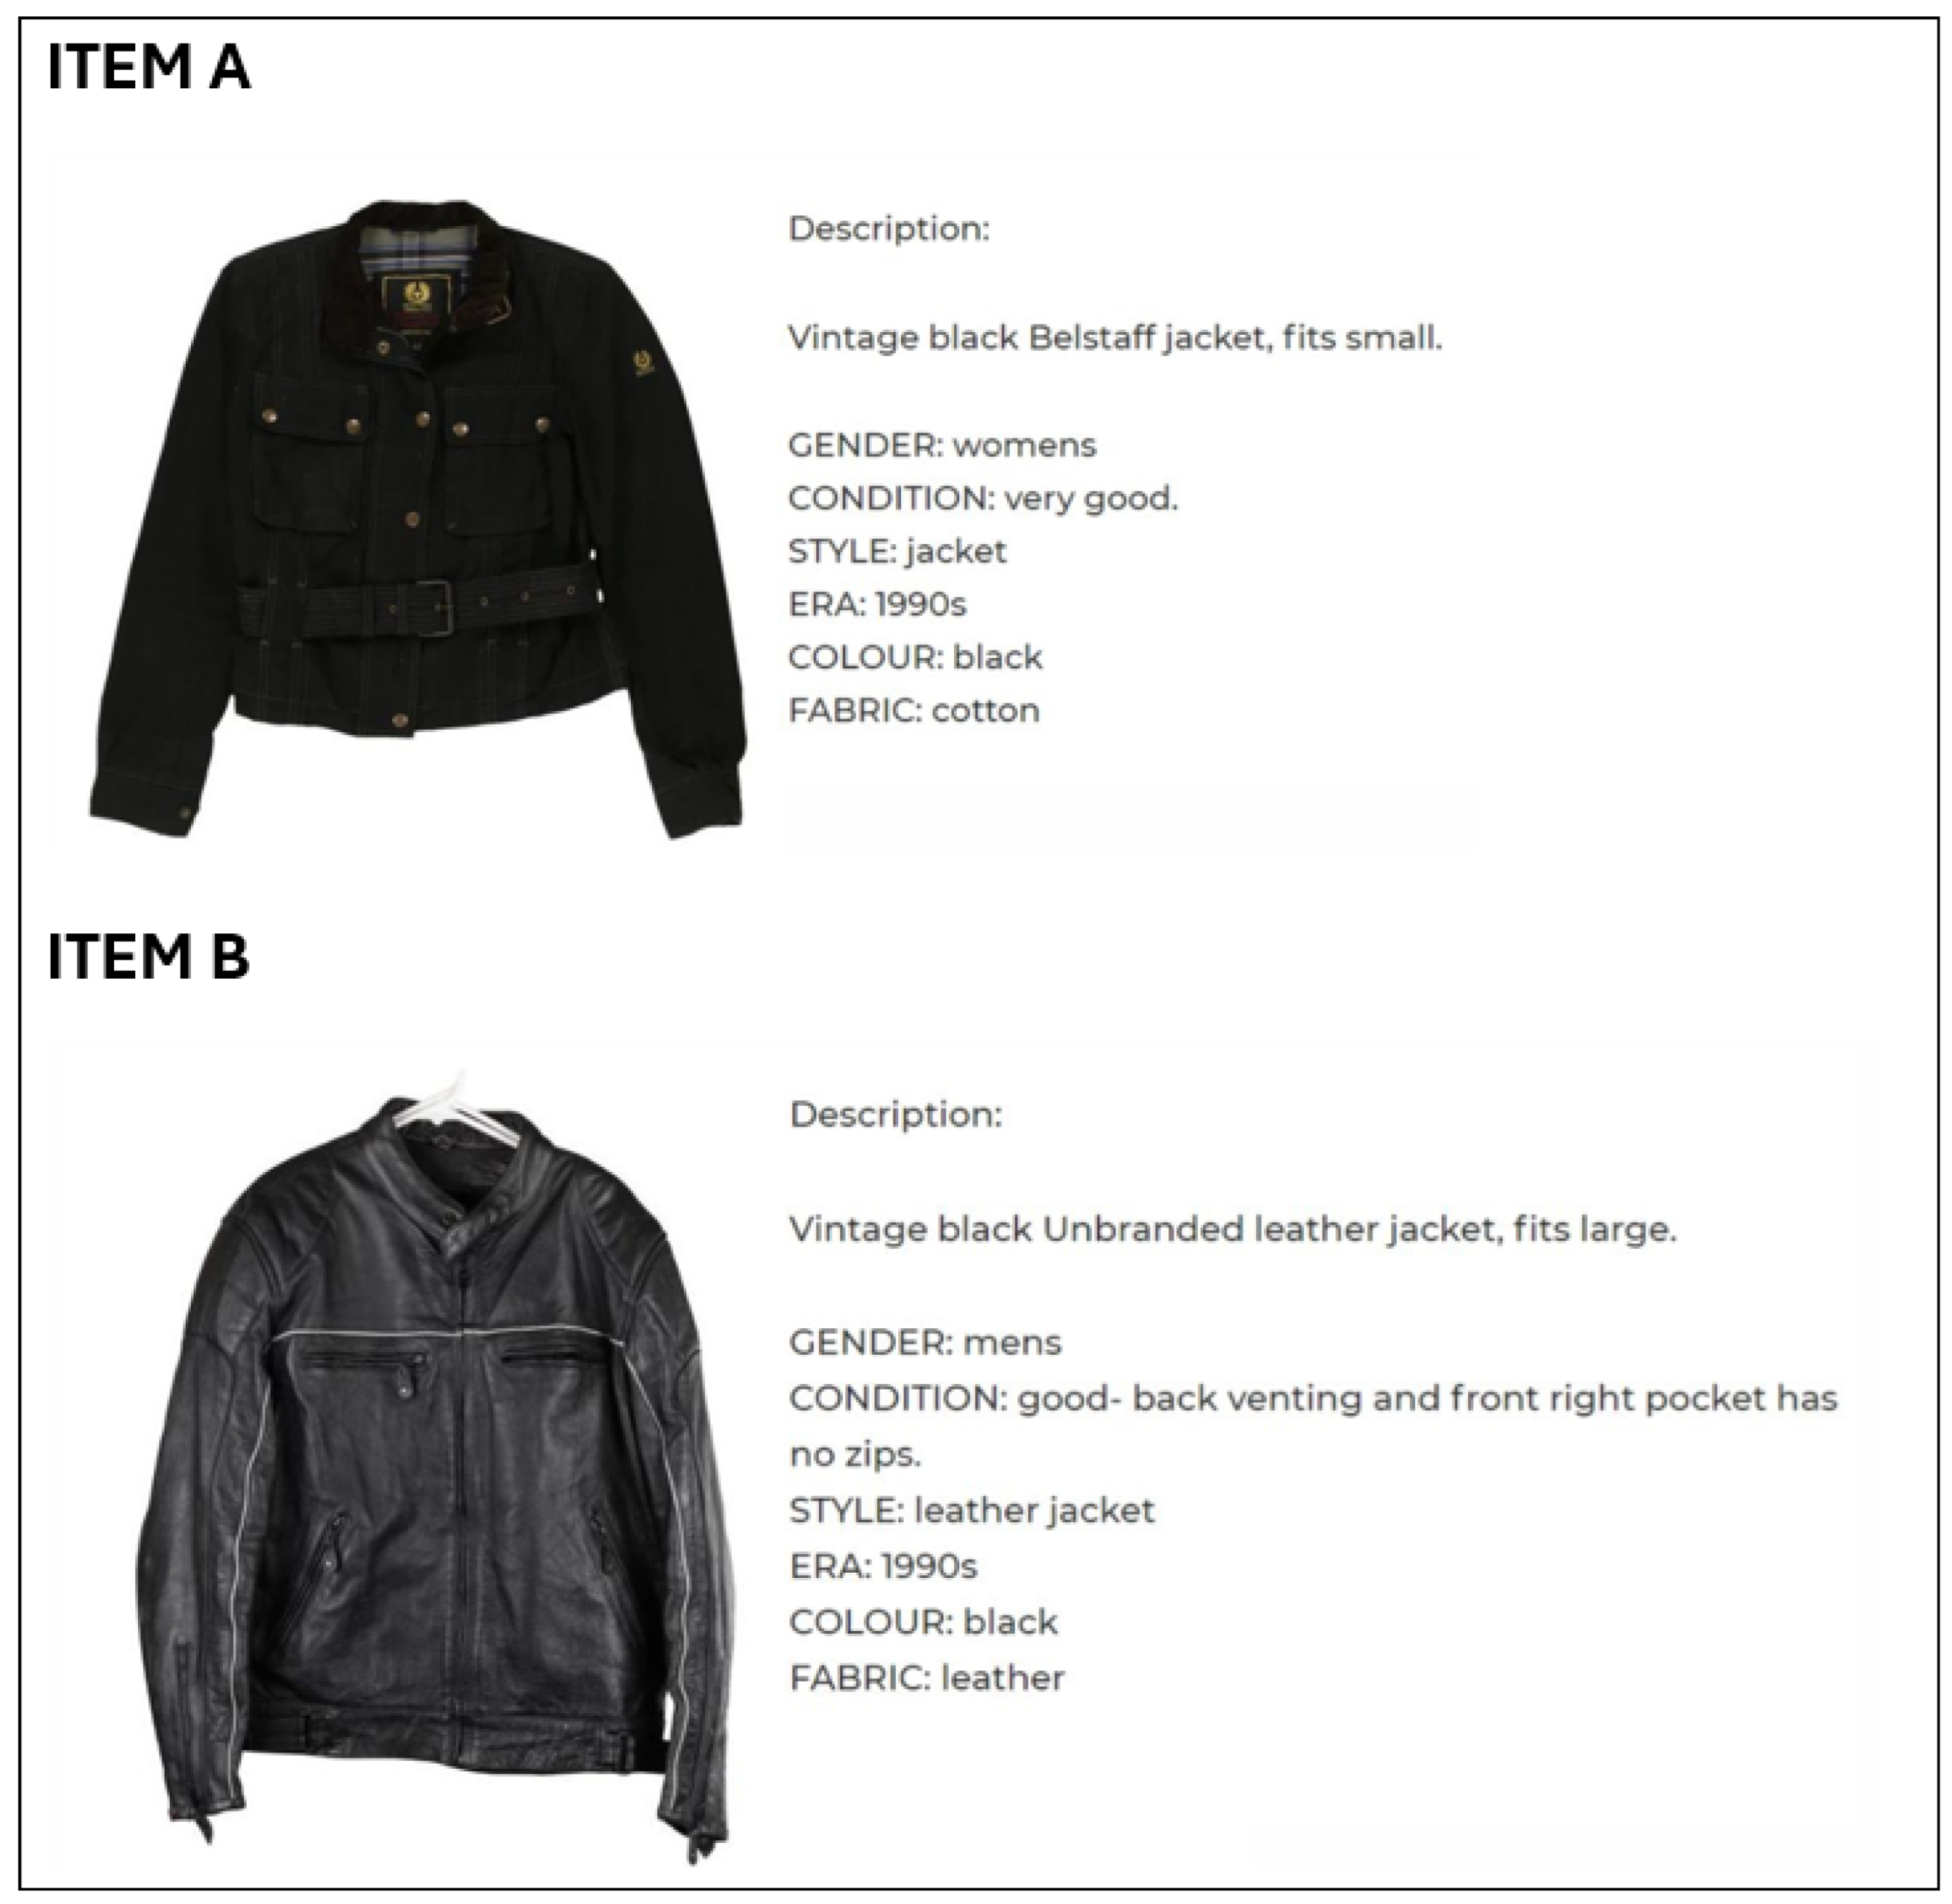
Stimuli were assigned to verbal, visual, or mixed categories based on the dominant information modality. Verbal stimuli consisted exclusively of written copy describing product attributes or benefits without accompanying imagery. Visual stimuli contained only pictorial content (e.g., product photos, icons, layout) with no text, and mixed stimuli combined images and concise text within a single layout.
This operationalization follows established distinctions between verbal and pictorial processing proposed by Dual Coding Theory [14] and the Cognitive Theory of Multimedia Learning [15], which jointly argue that words and pictures constitute separable channels with different processing constraints and benefits.
In advertising research, pictorial and textual elements are likewise modelled as distinct components that differently capture attention and shape memory and persuasion—e.g., pictorial brand elements (logos) often yield stronger memory than textual elements (names) [51], while verbal copy can “anchor”/disambiguate image meaning and support elaboration [16,17,52]. Accordingly, our categorization follows theory- and evidence-based boundaries rather than ad hoc rules.
  • The verbal version consisted of marketing-oriented text only (e.g., features, benefits, usage scenarios), presented without accompanying images. An example of a verbal stimulus is shown in Figure 2.
  • The visual version included only visual content, such as product photos, icons, and layout designs, without textual information. A sample visual stimulus is presented in Figure 3.
  • The mixed version combined both visual and textual elements in a balanced layout. An example of this format is shown in Figure 4.
These stimuli were designed to elicit different cognitive engagement depending on the participants’ information processing style. The full set of advertising stimuli is openly available at the following repository: Advertising Stimuli (https://drive.google.com/drive/folders/1incfzIIc46IW_Yxr7D679CpzU8flMfXN?usp=drive_link, accessed on 21 August 2025).

3.2. Presentation of Stimulus Material to Users

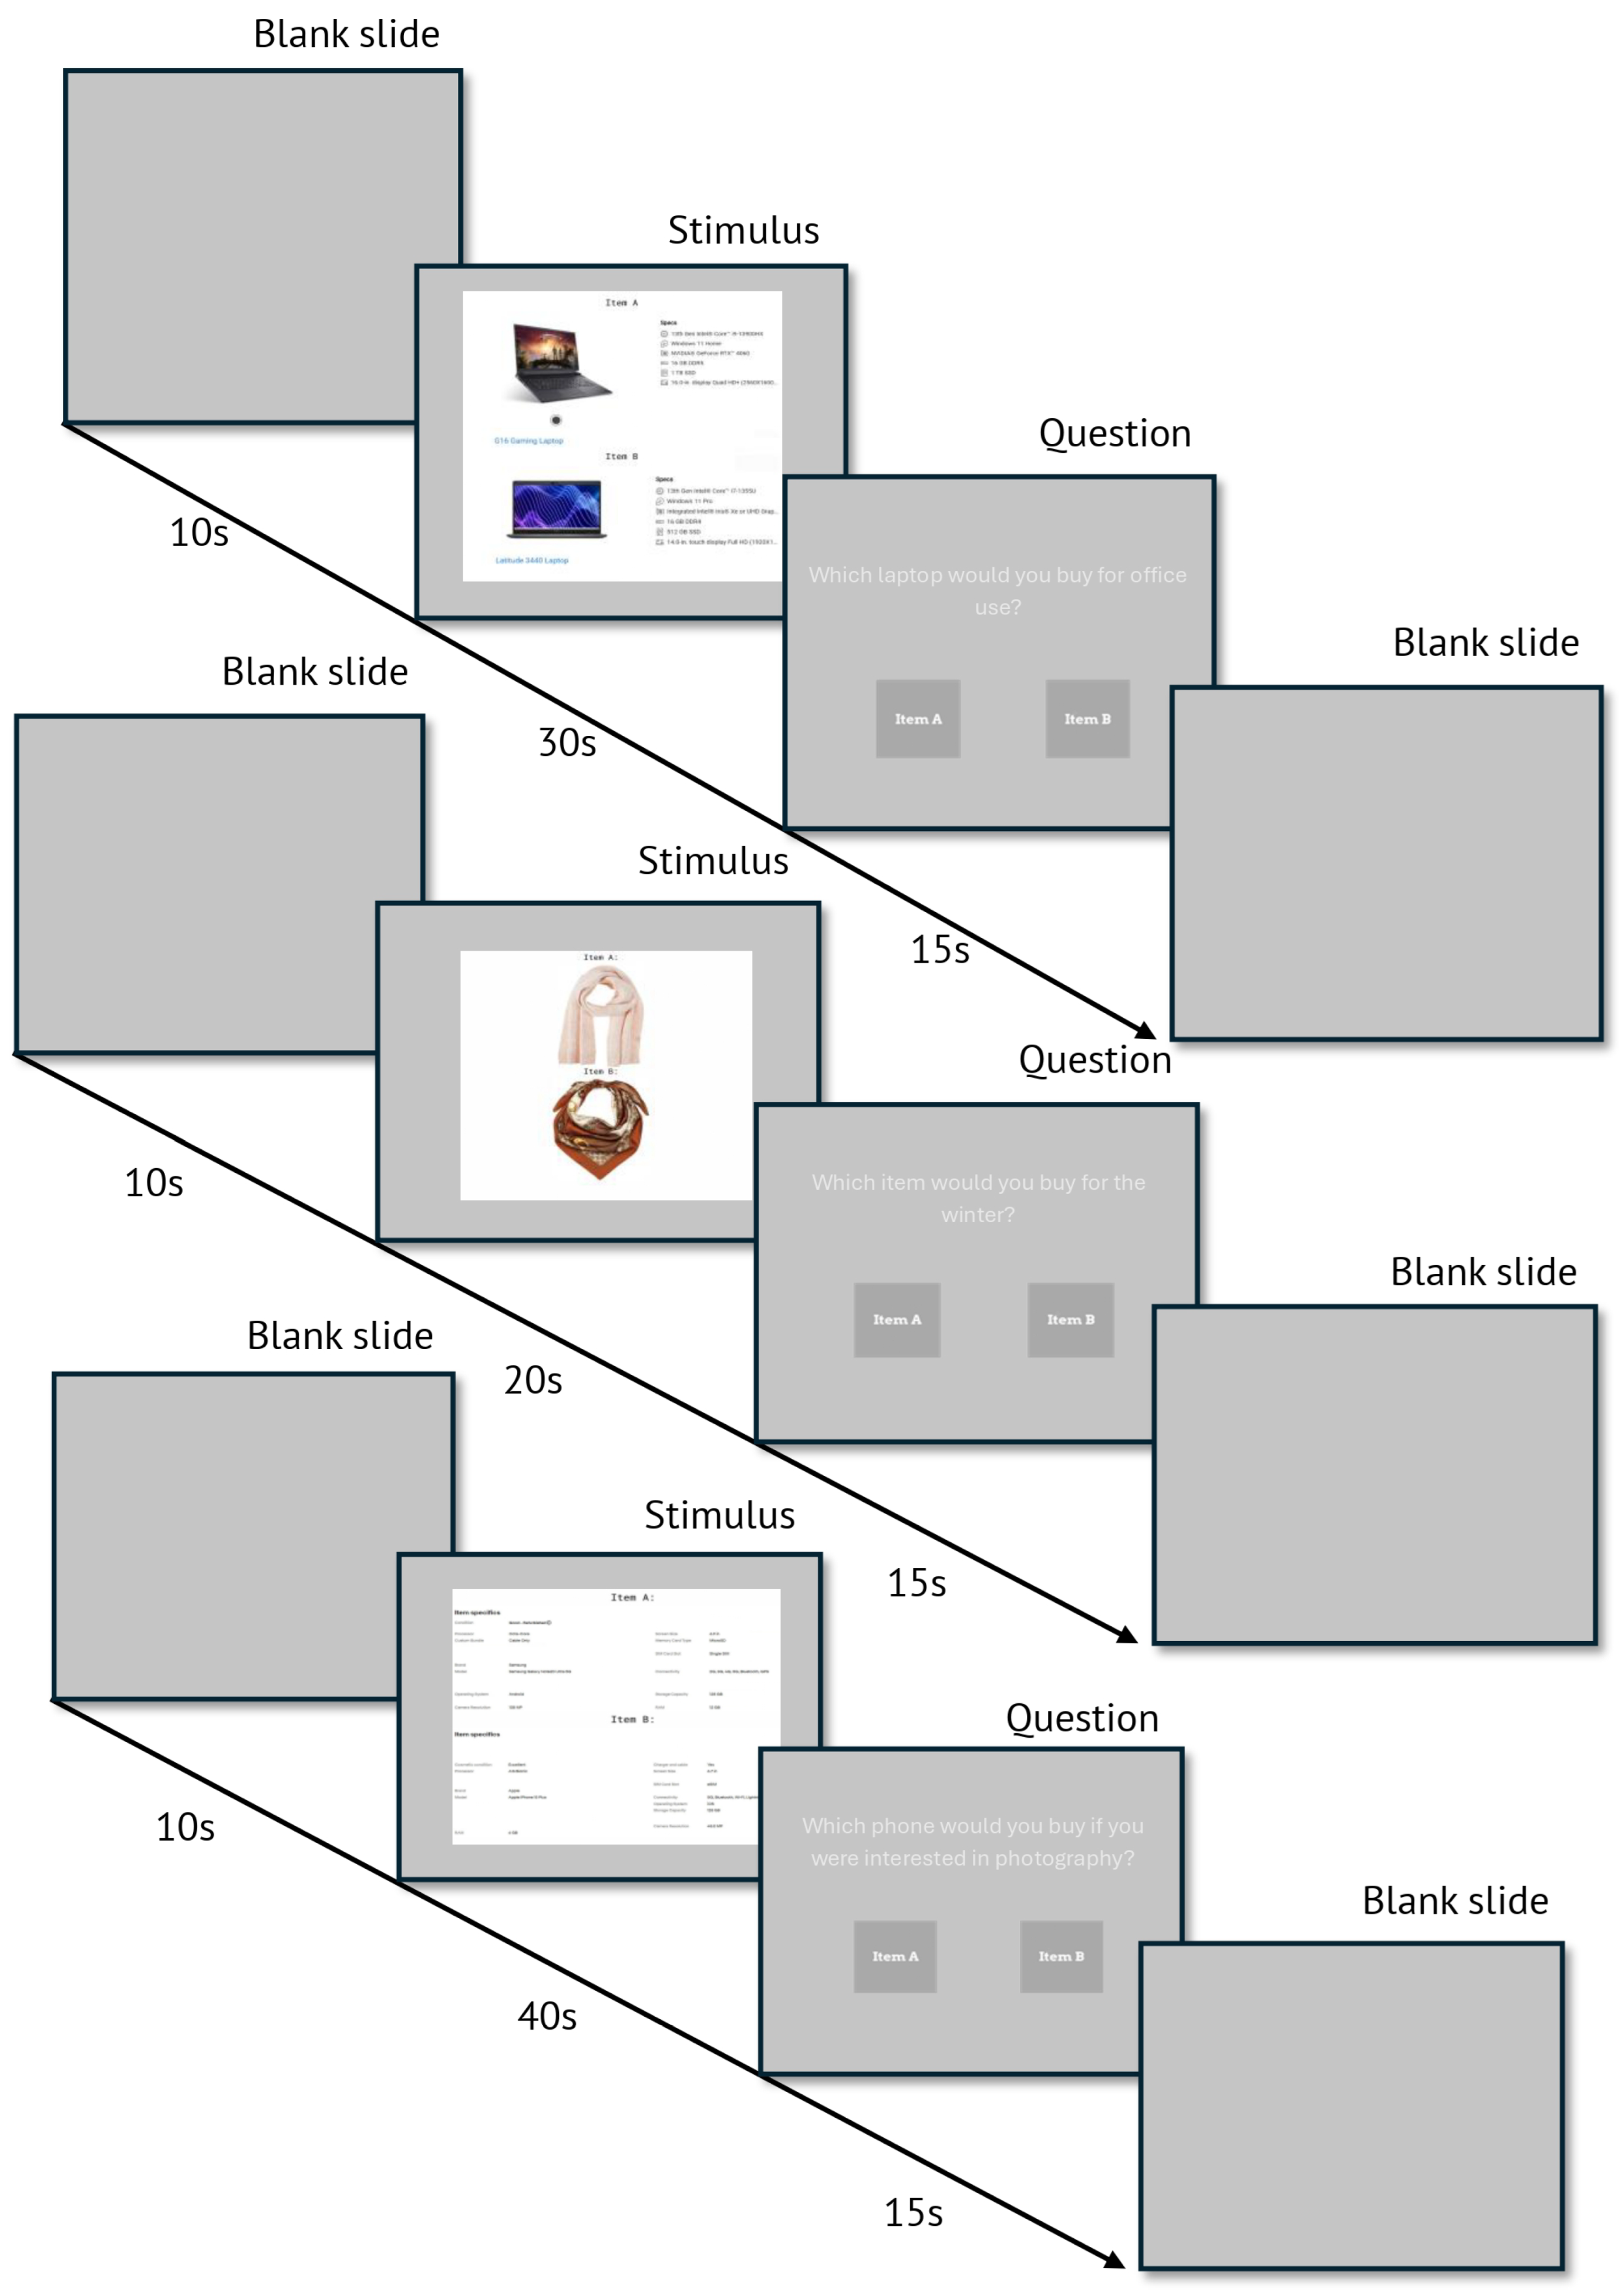
Each trial was designed to simulate an online shopping decision and followed a consistent sequence (see Figure 5).
The trial began with a 10 s blank gray screen to reset attention, followed by a side-by-side presentation of two advertisements (Item A and Item B). The duration of the stimulus presentation depended on the type of advertisement:
  • 40 s for verbal-only ads (text descriptions);
  • 30 s for mixed ads (text and image);
  • 20 s for visual-only ads (images only).
These durations were purposefully differentiated to allow sufficient cognitive processing time based on the nature of each stimulus type. Verbal advertisements require longer exposure to enable participants to read and comprehend the text content [53,54]. By contrast, visual stimuli demand less time because the visual system can extract the gist of an image extremely rapidly [55,56]. Mixed (text–image) stimuli were allocated an intermediate duration to reflect their dual-channel nature and to mitigate split-attention/limited-capacity constraints posited by Dual Coding and the Cognitive Theory of Multimedia Learning [14,15,57]. This temporal allocation therefore aimed to equalize cognitive load across conditions and ensure comparability in decision-making readiness. Next, a 15 s decision screen appeared, prompting participants to select between the two options based on a predefined scenario (e.g., “Which product would you prefer if you were on a budget?”). Responses were collected via labelled buttons on screen.
Participants were instructed to remain focused and respond intuitively. The stimuli within each set were presented in a random order to mitigate order effects. This structure allowed for the systematic collection of EEG signals during passive viewing and the controlled assessment of decision making based on each stimulus type.

3.3. Equipment

To capture the EEG data from our subjects, we used the Biosemi’s ActiveTwo system with 32 wet electrodes + 2 electrodes that were used as ground. The brain signals were recorded at a sampling frequency of 2 kHz (2048 Hz) per channel. For the viewing of the stimuli, a stationary computer was used.

3.4. Participants

Twenty-two volunteers without any neurological conditions were recruited to participate in this experiment (ages ranging from 20 to 30 years; female = 14, male = 8). The participants, predominantly undergraduate students or individuals affiliated with our university campus, were recruited through email invitations and word-of-mouth communication and had no relationship to the researchers. In terms of demographics, the participant pool included a diverse range of backgrounds, with varying levels of academic experience and fields of study, such as engineering, computer science, business administration, and economics. Factors such as gender and age were not controlled. This was intentional, as we believed that a diverse participant pool would capture a broad range of perspectives and experiences, enhancing the generalizability of our results.
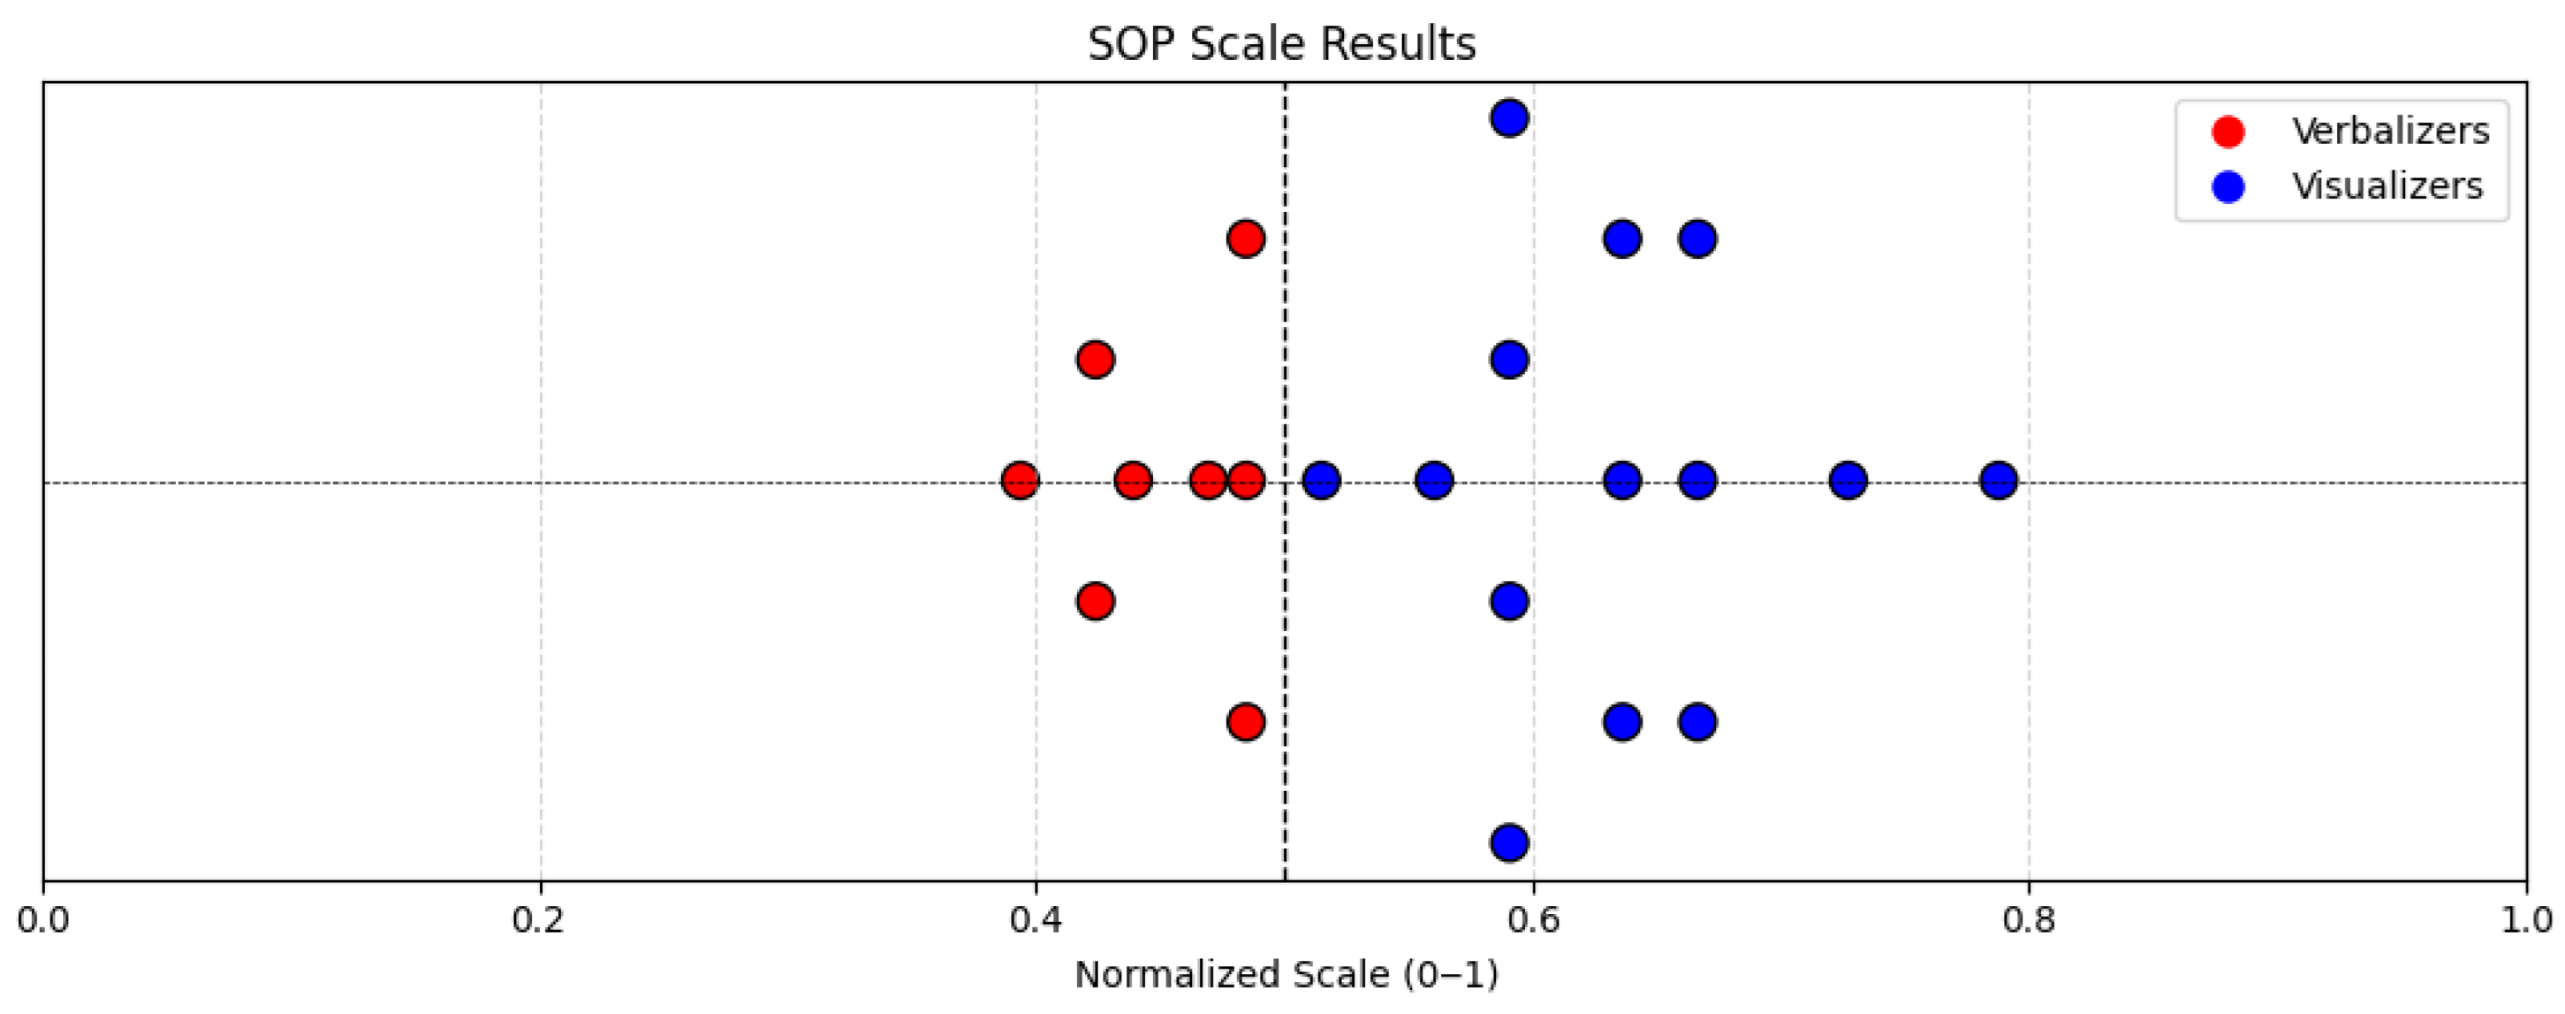
Based on their scores on the Style of Processing (SOP) scale, participants were classified into two cognitive style groups: visualizers (n = 14) and verbalizers (n = 8), as shown in Figure 6. Verbalizers tend to prefer and process textual information more effectively, whereas visualizers rely more on imagery and spatial representations. These categories were used throughout the analysis to assess differences in neural responses and classification accuracy between the two cognitive styles.

3.5. Ethical Considerations

We adopted the University’s human research protocols in our study and we adhered to the ethical standards set forth by the University’s Research Ethics Committee (R.E.C.) (https://ehde.upatras.gr/) for user’s privacy, confidentiality and anonymity. To ensure adherence to data collection protocols, all data collected during the study were assigned code names, effectively removing any identifying information before the analysis phase. This process was implemented to protect participant privacy and maintain the confidentiality of their responses, in accordance with the University’s research protocols. The recorded EEG signals were securely stored in encrypted databases, which are designed to prevent unauthorized access. Only the researchers directly involved in this study were granted access to these databases, ensuring a controlled environment for data handling. Before the start of each experiment, in order to minimize any bias, participants were briefed about the experiment without disclosing any information about the aim of the study. They were given a consent form to sign, which authorized the use of their biometric data. The form also informed participants that data collection is anonymous, clarifying the potential risks associated with participation and highlighting that they could withdraw from the procedure at any time.

3.6. Experimental Design and Procedure

After providing informed consent and agreeing to EEG data collection, participants completed the Style of Processing (SOP) scale [7], a validated psychometric tool to assess individual information processing preferences. Based on their scores, participants were classified as visualizers (high SOP scores) or verbalizers (low SOP scores).
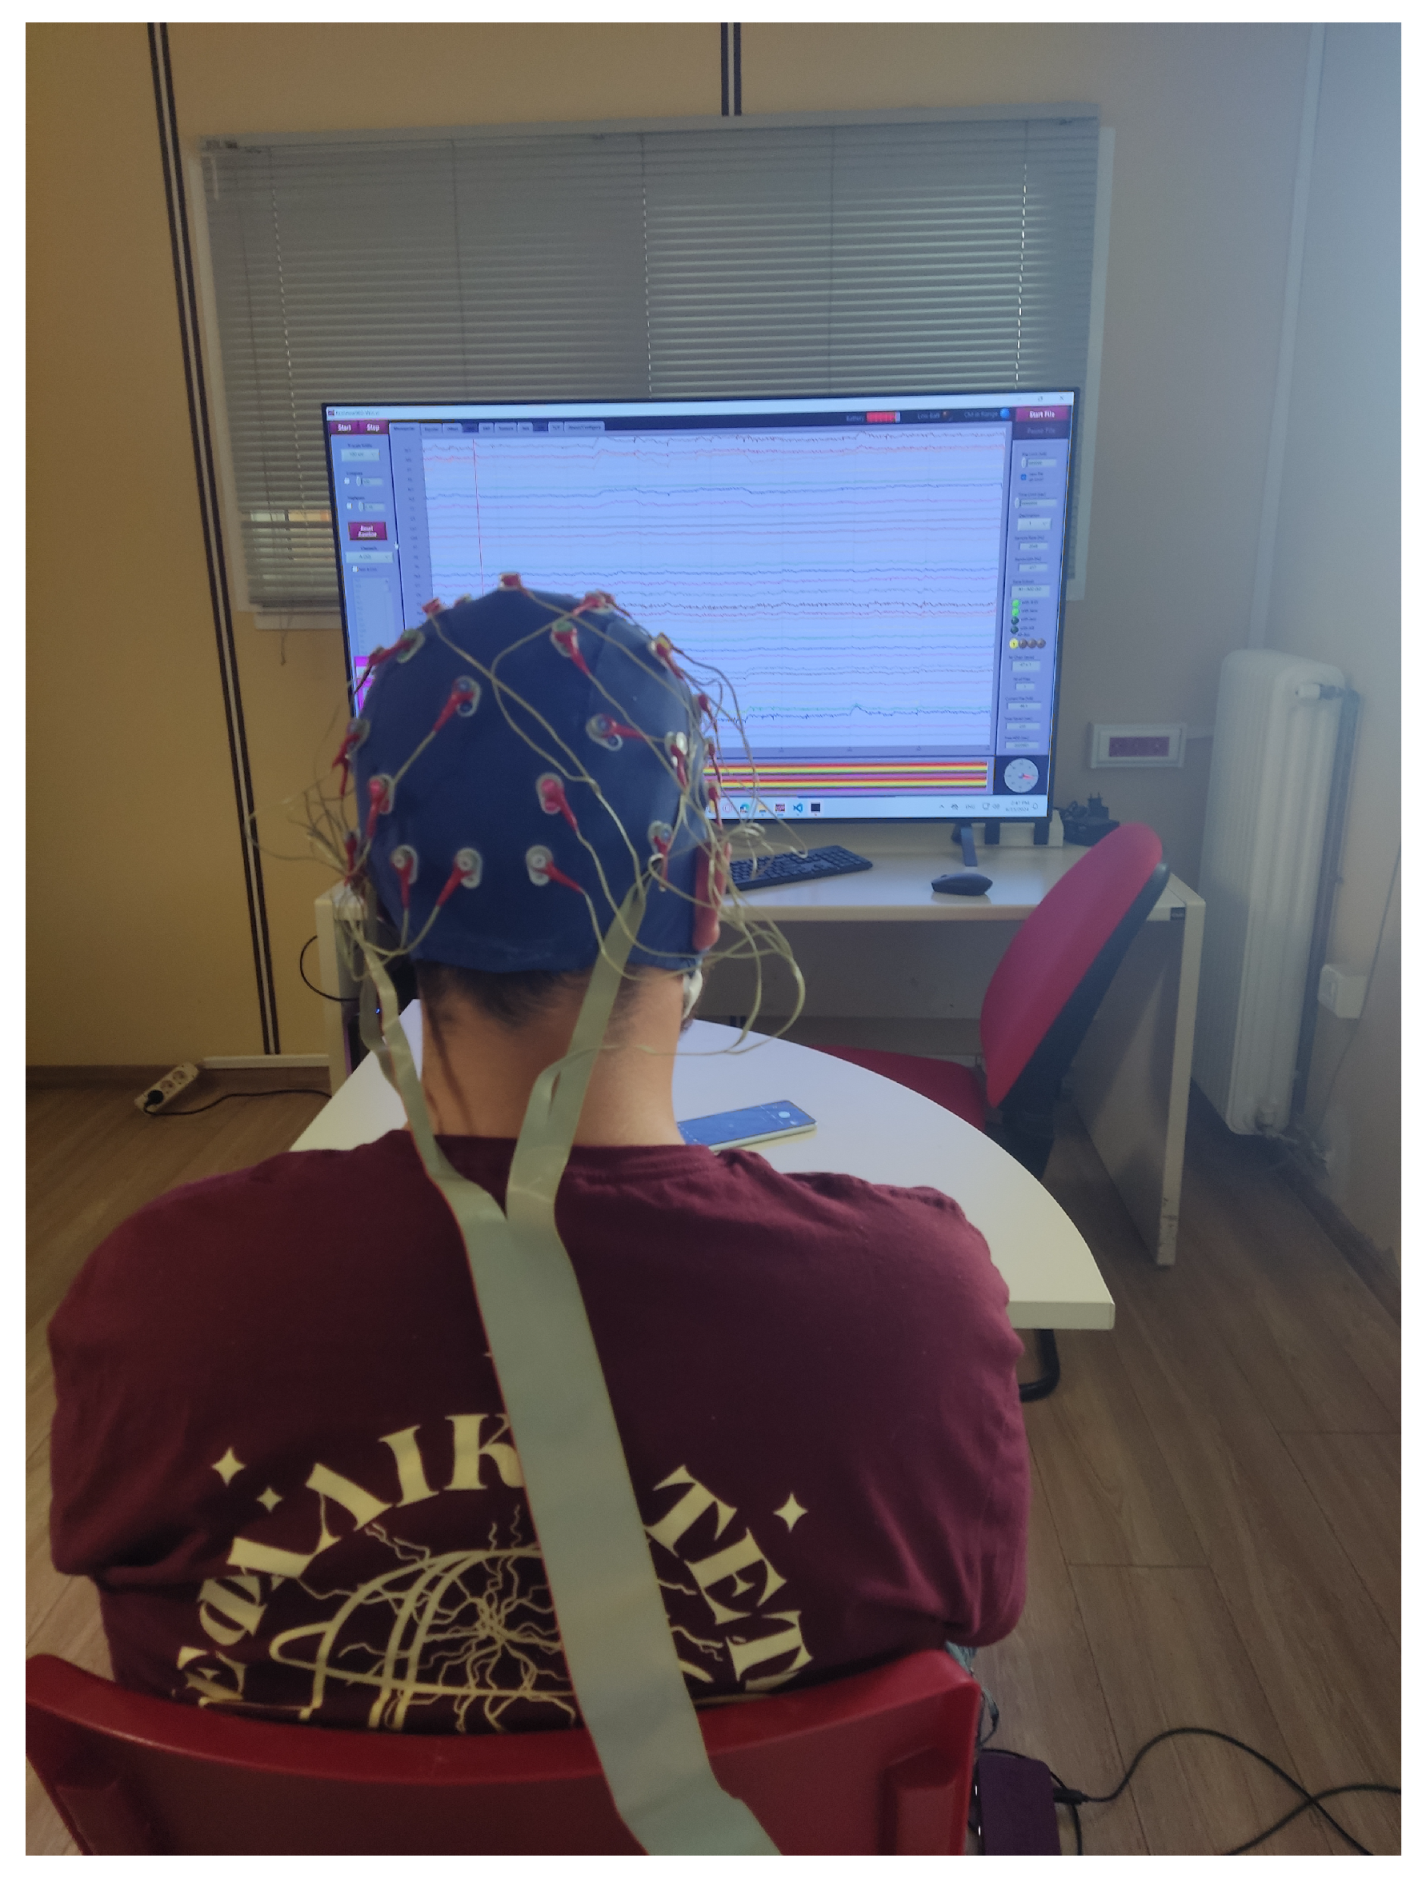
Each participant was then guided into the experimental room and fitted with a 32-channel EEG headset. The setup is depicted in Figure 7. Participants were seated approximately 60 cm from a large monitor in a quiet, dimly lit room to minimize distraction. They were instructed to remain still and focused throughout the session.
The experiment comprised three stimulus sets: verbal, visual, and mixed advertisements (see Table 1). Each participant was randomly assigned a viewing order for these sets, and the ad pairs within each set were also presented in a random order to reduce potential bias.
EEG data were recorded during each trial. To isolate neural responses to the stimulus material, segments corresponding to motor response and decision making (the decision screen) were excluded from analysis. Furthermore, a 15 s post-trial blank screen was included to allow the EEG signal to return to baseline, ensuring clean segmentation between trials.
This protocol ensured reliable EEG recordings aligned with participants’ cognitive styles, and supported our goal of investigating different neural responses during exposure to distinct advertisement formats.

3.7. EEG Analysis Pipeline

3.7.1. EEG Signal Pre-Processing

EEG signals often contain noise and artifacts originating from non-neural sources, such as eye blinks, muscle activity, and environmental electrical interference. Effective preprocessing is therefore crucial, as residual artifacts can significantly impact the reliability of the extracted features and the performance of machine learning models.
In this experiment, we adopted the preprocessing pipeline proposed by Khondakar et al. [58], which was specifically developed for neuromarketing EEG data. This pipeline builds on a comparative analysis of existing approaches and introduces an optimized sequence of steps tailored to EEG signals elicited by advertising stimuli. The key stages of the preprocessing pipeline are outlined below.
  • Bandpass filtering (0.5–45 Hz): An FIR filter was applied to retain frequencies relevant to cognitive processing while eliminating slow drifts and high-frequency noise.
  • Line noise removal: A 50 Hz notch filter was used to suppress power line interference.
  • Common average referencing (CAR): EEG recordings were re-referenced using the average potential across all electrodes, to reduce spatial bias and improve signal-to-noise ratio.
  • Bad channel interpolation: Noisy or malfunctioning channels were detected based on deviation metrics such as low correlation with neighbouring electrodes, high-amplitude artifacts, or signal dropout [59]. Only non-frontal bad channels were interpolated to avoid distortion in neuromarketing relevant regions.
  • Artifact subspace reconstruction (ASR): Transient high-amplitude artifacts were suppressed using ASR, a method that reconstructs corrupted signal components by comparing them to a clean baseline covariance [60]. ASR is particularly effective at handling high-amplitude transient artifacts, such as sudden movements or muscle contractions, which are difficult to isolate through ICA alone. In contrast, ICA excels at separating spatially stable sources such as eye blinks and sustained muscle activity, making the combination of both techniques highly complementary in cleaning EEG data collected in naturalistic tasks like advertisement viewing.
  • Independent component analysis (ICA): ICA was used to decompose the EEG signal into independent components. Artifacts related to eye movements and muscle activity were identified and removed through automated and visual inspection.
In addition to the steps above, an EEG montage compatible with the BioSemi device used in the experiment was imported [61], providing information about electrode placements. The data were then downsampled to 256 Hz to reduce computational load while preserving temporal resolution.
Finally, the continuous EEG recordings were segmented into epochs corresponding to stimulus presentation periods. Each epoch began at the onset of a product pair and ended with the appearance of the decision screen. Resting periods and response intervals were excluded from the analysis. Each participant completed three trials for each of the three stimulus sets, resulting in a total of 66 epochs across all subjects.

3.7.2. Feature Extraction

Following signal preprocessing, the next critical step was feature extraction, aimed at reducing the dimensionality of the EEG data while preserving information relevant to cognitive activity. Depending on the nature of the analysis, features may be extracted in the time domain, frequency domain, or time–frequency domain. For this study, we focused on frequency-domain features, specifically the power spectral density (PSD), one of the most widely adopted measures in EEG research.
PSD quantifies how the power of a signal is distributed across different frequency components, offering insight into brain activity across well-established EEG bands. To compute the PSD, we employed the Welch method [62], a non-parametric spectral estimation technique known for its robustness in handling noisy physiological signals. The method divides each EEG epoch into overlapping segments, applies a window function, computes the periodogram of each segment using the discrete Fourier transform (DFT), and averages the results to yield a smoother estimate of spectral power.
Prior to PSD calculation, the EEG signal was decomposed into the five standard frequency bands: delta (0.5–4 Hz), theta (4–8 Hz), alpha (8–13 Hz), beta (13–30 Hz), and gamma (30–45 Hz). PSD values were computed for each of the 32 channels and then averaged per channel within each epoch. This process yielded a compact yet informative representation of spectral brain dynamics for every trial, forming the basis for subsequent classification and statistical analyses.

3.7.3. Classification

The final stage of the EEG analysis pipeline was classification, where the goal was to predict cognitive style group membership (visualizer vs. verbalizer) based on extracted EEG features. Classification involves identifying decision boundaries that best separate distinct classes and assigning new data points to these classes based on learned patterns [63].
In this study, we evaluated the performance of three widely used supervised learning algorithms in neuromarketing research: Support Vector Machine (SVM), Decision Tree, and k-Nearest Neighbors (kNN) [64]. These classifiers were selected due to their proven effectiveness in EEG-based consumer behaviour analysis and their ability to model both linear and non-linear relationships.
For each stimulus set (verbal, visual, mixed), we conducted a binary classification task aiming to distinguish between verbalizers and visualizers. The dataset was split into training and testing subsets using an 80/20 ratio. The training set was used to fit the model parameters by associating extracted features with corresponding cognitive style labels. The held-out testing set was used to evaluate model generalization on previously unseen data.
Performance was assessed separately for each classifier and stimulus set, allowing for a comparative evaluation of classifier robustness across different types of advertising content. The classification pipeline was implemented in Python (version 3.12) using the scikit-learn library.

4. Experimental Results

4.1. Classification Results

To assess the performance of the classification models, we computed four key evaluation metrics: accuracy, precision, recall, and F1-score. These metrics provide a comprehensive picture of each model’s ability to correctly distinguish between visualizers and verbalizers, particularly in the context of a moderately imbalanced dataset (14 visualizers vs. 8 verbalizers). Accuracy measures the proportion of correctly predicted instances over the total predictions. While useful as a general indicator, it can be misleading when dealing with imbalanced data. Precision reflects the proportion of true positive predictions among all positive predictions made by the model. High precision indicates that when the model predicts a sample as belonging to a class (e.g., visualizer), it is usually correct. Recall (or sensitivity) represents the proportion of true positives that were correctly identified. A high recall means the model successfully detects most of the samples of the target class. F1-score is the harmonic mean of precision and recall. It provides a balanced measure when there is a trade-off between the two, and is particularly useful in imbalanced classification scenarios.
In our case, precision ensures that visualizers and verbalizers are not frequently misclassified, while recall captures the model’s ability to detect them reliably. The F1-score gives a single value that balances these concerns, making it one of the most informative metrics in our evaluation.
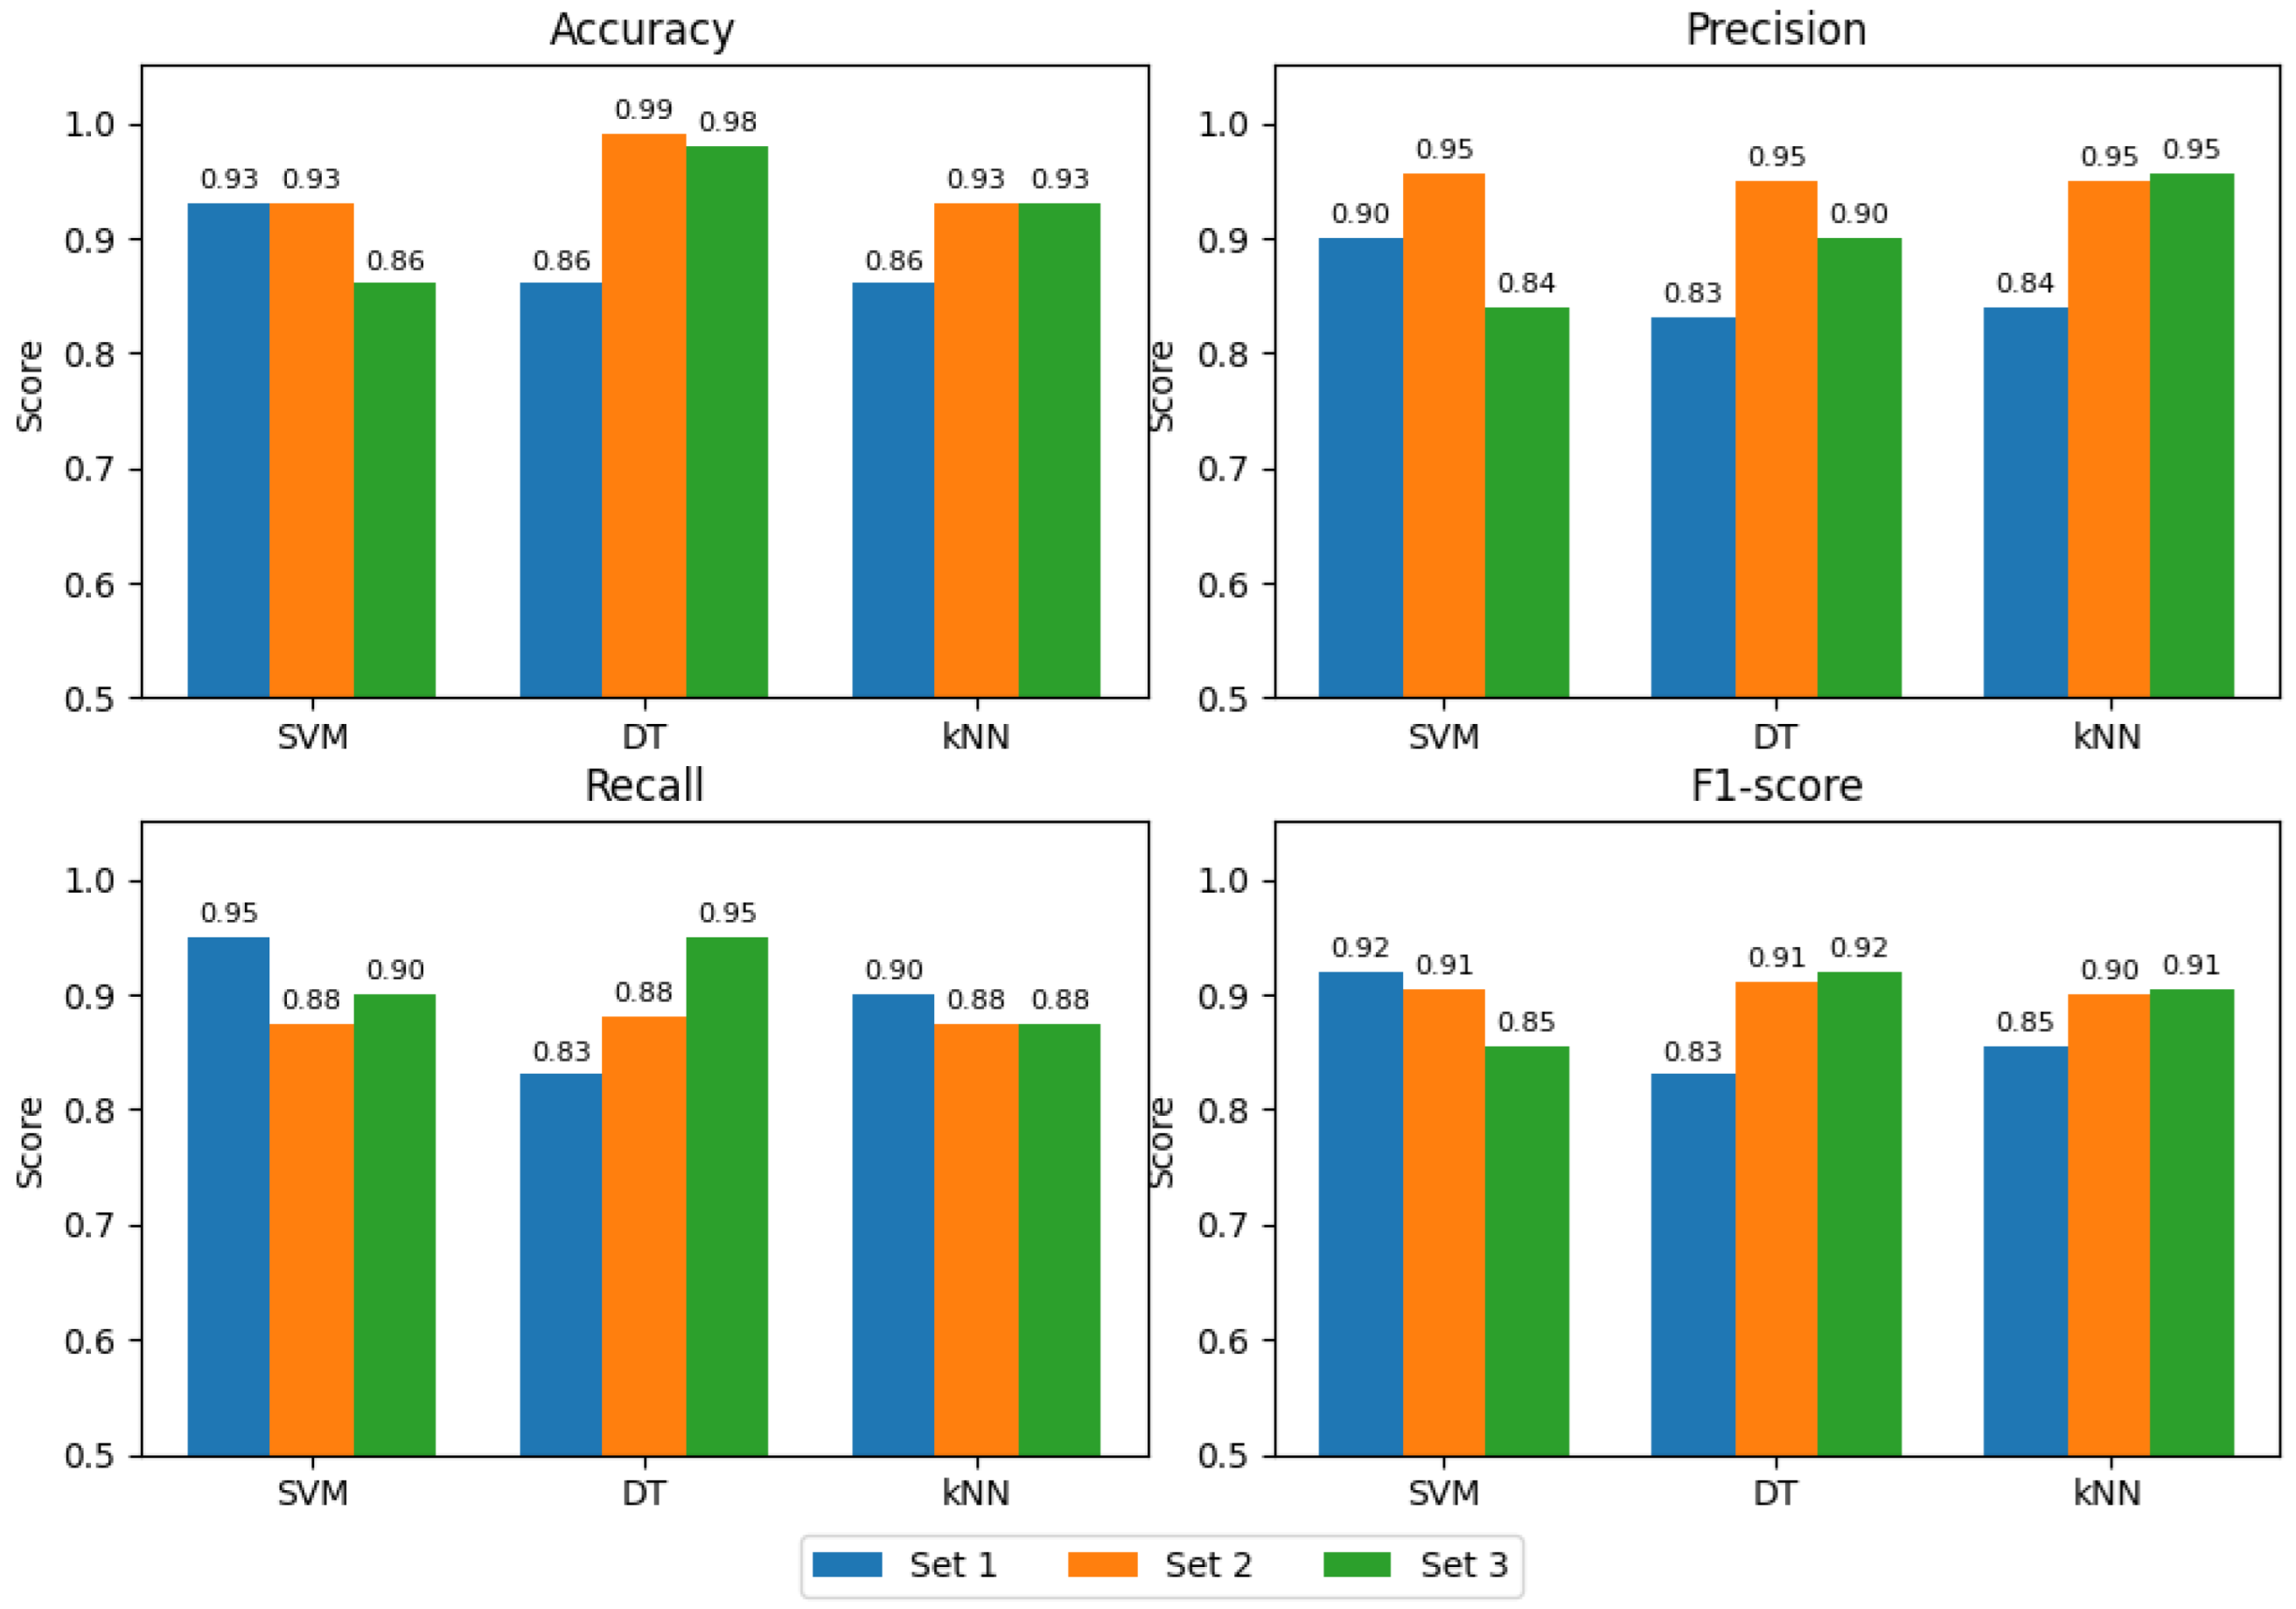
Figure 8 visualizes the key performance metrics (accuracy, precision, recall, and F1-score) for all classifiers and advertisement sets, allowing direct comparison of model behaviour across conditions.
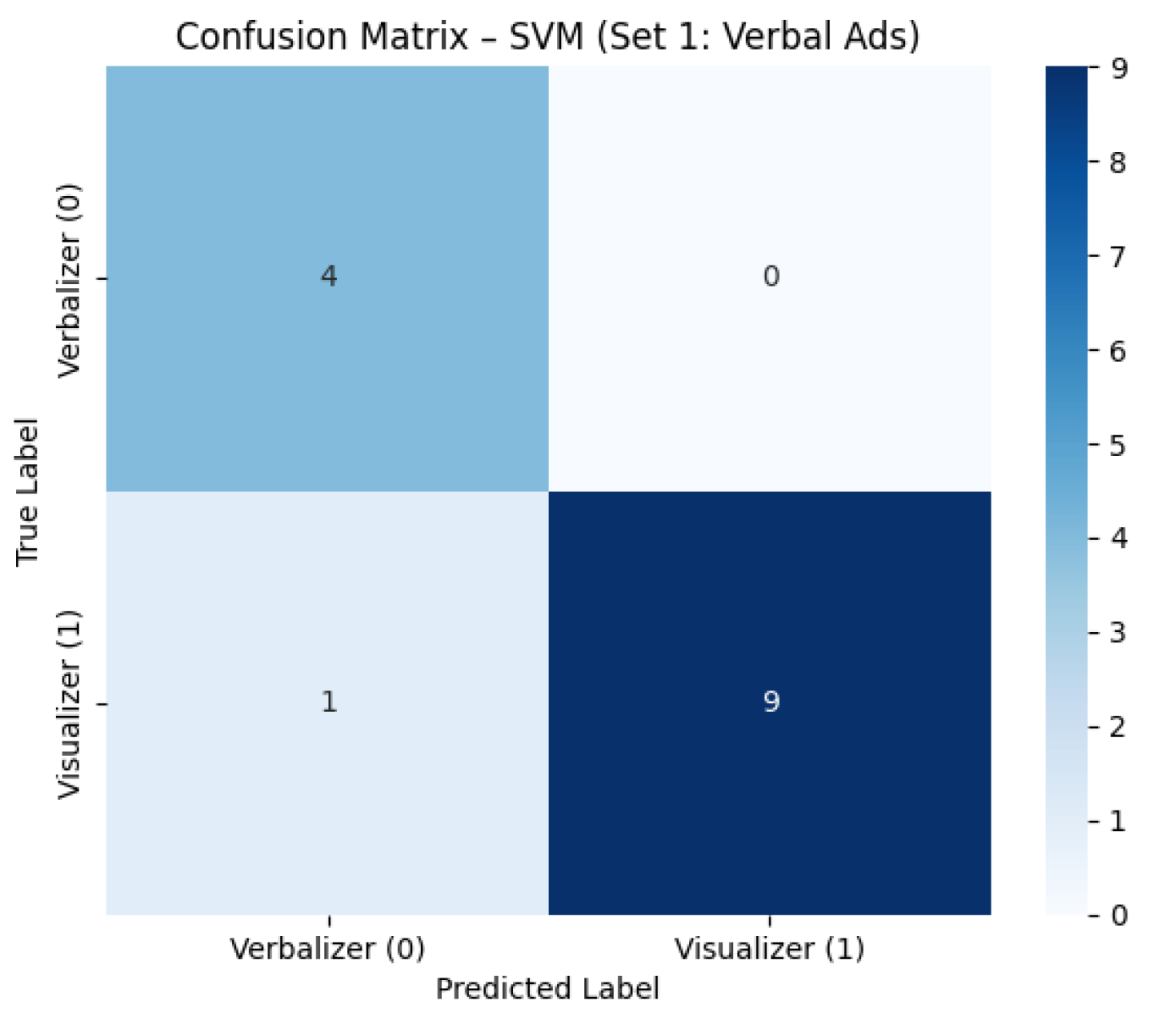
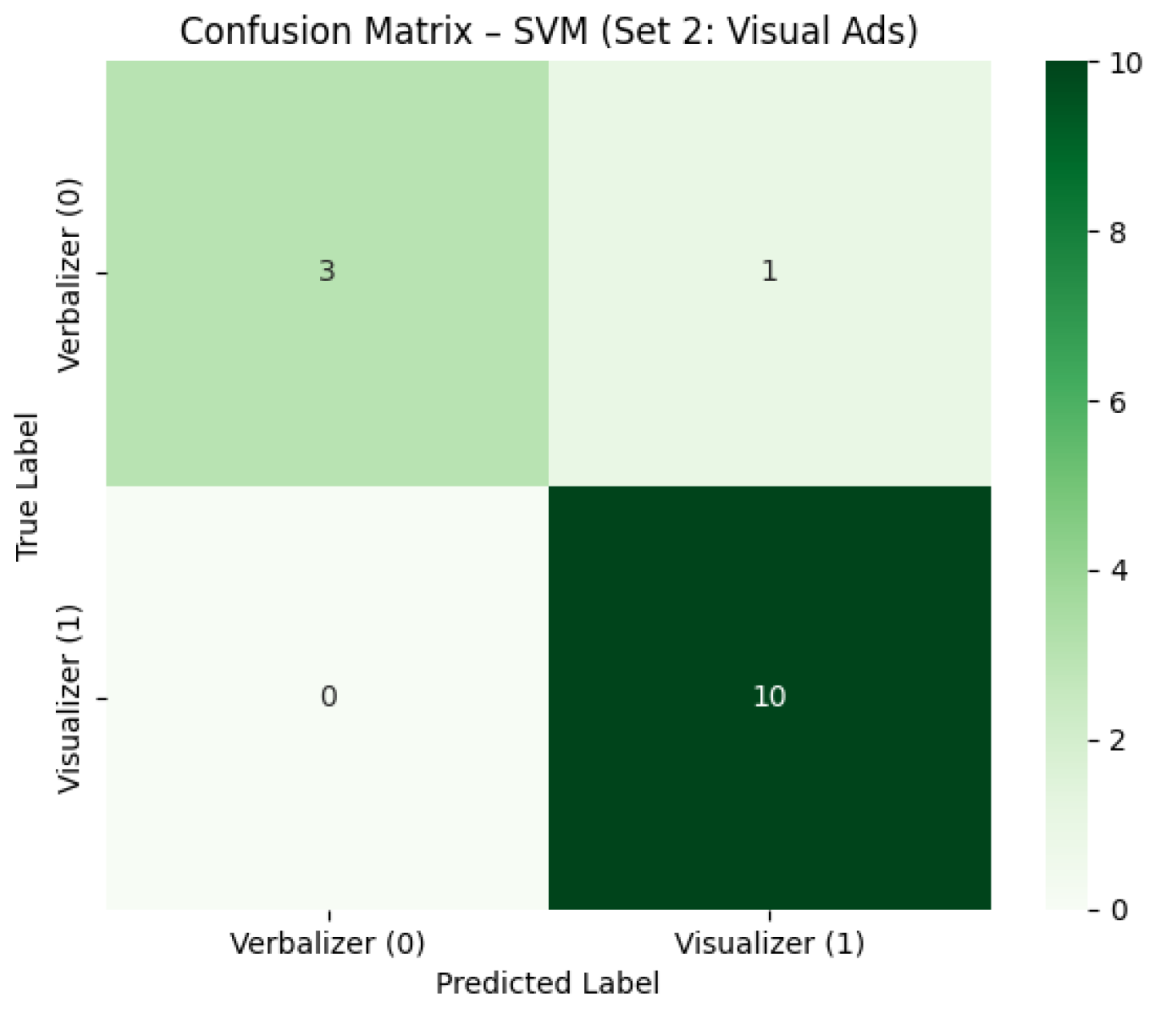
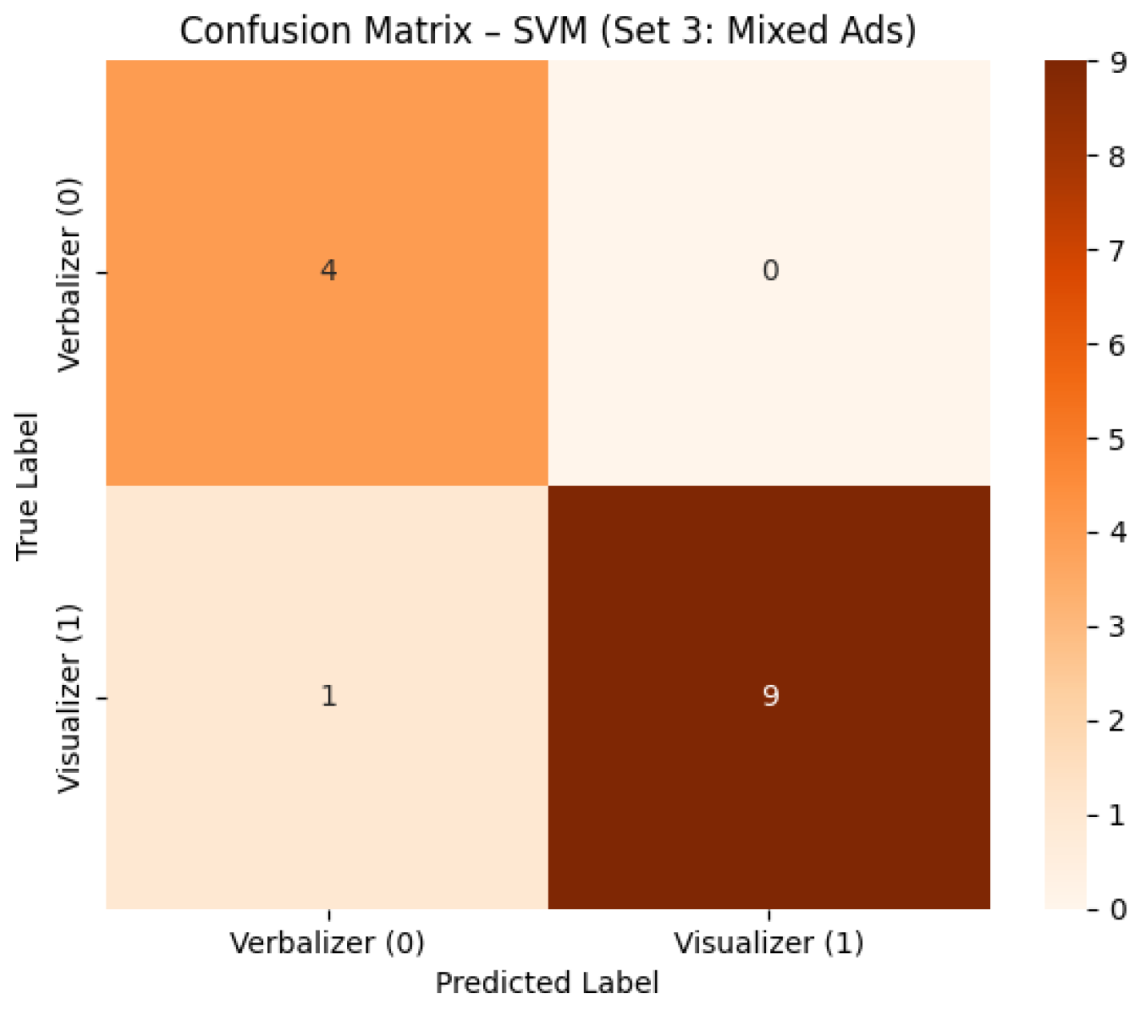
To better visualize model performance and error distribution, we present the confusion matrices for the SVM classifier across all advertisement sets (See Table 2). The SVM was selected for detailed inspection due to its superior and most stable performance among the tested models. Therefore, Figure 9, Figure 10 and Figure 11, illustrate the classifier’s ability to correctly distinguish between verbalizers and visualizers, as well as the nature of misclassifications.
Based on the confusion matrices of the SVM classifier across all three advertisement sets, presented in Figure 9, Figure 10 and Figure 11, the model achieves consistently high classification performance. In all cases, the model correctly identified the majority of both verbalizers and visualizers, with minimal misclassifications. In fact, no verbalizer was erroneously classified as a visualizer in either of those sets, whereas visualizers were slightly more prone to being misclassified as verbalizers, especially in the verbal and mixed advertisement conditions. The visual-only condition (Set 2) yielded the most balanced outcome, achieving perfect classification of visualizers and only one misclassified verbalizer. These results support the model’s robustness and predictive power in using EEG frequency-domain features to distinguish cognitive processing styles.
We further employed 5-fold cross-validation to estimate generalizability and calculate the mean and standard deviation of classification performance across folds. In order to address class imbalance and improve learning stability, we applied the Synthetic Minority Oversampling Technique (SMOTE) [65], which synthetically generates samples for the minority class (verbalizers). This helped reduce variance in model evaluation and improve robustness.
  • Set 1—Verbal Advertisements
Among the three classifiers tested on the verbal advertisement set, the Support Vector Machine (SVM) model achieved the strongest results, with a test accuracy of 92.86% and an F1-score of 91.81%. The confusion matrix revealed only one misclassification, underscoring the model’s effectiveness in identifying processing styles based on verbal input. The Decision Tree (DT) also performed well on the test set (85.71%), but with signs of overfitting, as indicated by its perfect training accuracy. The k-Nearest Neighbors (kNN) classifier had equivalent test accuracy (85.71%) but displayed the highest variance in cross-validation scores, suggesting sensitivity to training data fluctuations. Overall, EEG features derived from verbal ads provided strong discriminative signals for cognitive style classification.
  • Set 2—Visual Advertisements
Performance in the visual-only condition was the most robust across all classifiers. SVM again achieved a high test accuracy (92.86%) and a macro F1-score of 90.48%, while Decision Tree reached 92.86% with slightly better recall and F1. kNN matched their accuracy and had strong precision and recall, despite greater variance in cross-validation (standard deviation = 0.20). These results align with the statistical analysis findings that visual stimuli produced some of the largest SOP scale EEG feature differences between visualizers and verbalizers. The SVM confusion matrix showed clear separation between the two classes, confirming that processing style strongly influences neural responses to visual stimuli.
  • Set 3—Mixed Advertisements
This condition, which combined text and images, yielded slightly lower and more variable results. SVM achieved a test accuracy of 85.71% and an F1-score of 84.44%, with slightly higher recall than precision. DT and kNN, on the other hand, both reached a test accuracy of 92.86% and higher F1-scores (91.81% and 90.48%, respectively), but showed greater inconsistency across folds. The mixed nature of the stimuli likely triggered both processing modes simultaneously, resulting in less distinct EEG patterns between the two cognitive styles. This hypothesis is supported by the fact that Set 3 yielded the fewest statistically significant features in our earlier analysis.
Table 2 summarizes the performance metrics across all three advertisement sets. Overall, SVM consistently delivered the most balanced and stable performance, particularly in conditions where the stimuli were aligned with a single processing modality (i.e., Set 1 and Set 2). This supports the hypothesis that EEG-based classification of cognitive style is most effective when participants are exposed to stimuli congruent with their dominant processing preference. SMOTE improved classification stability in cross-validation but had limited impact on the test set scores, reinforcing the view that class imbalance primarily affects model robustness rather than raw predictive power.
  • Receiver Operating Characteristic (ROC) Curves
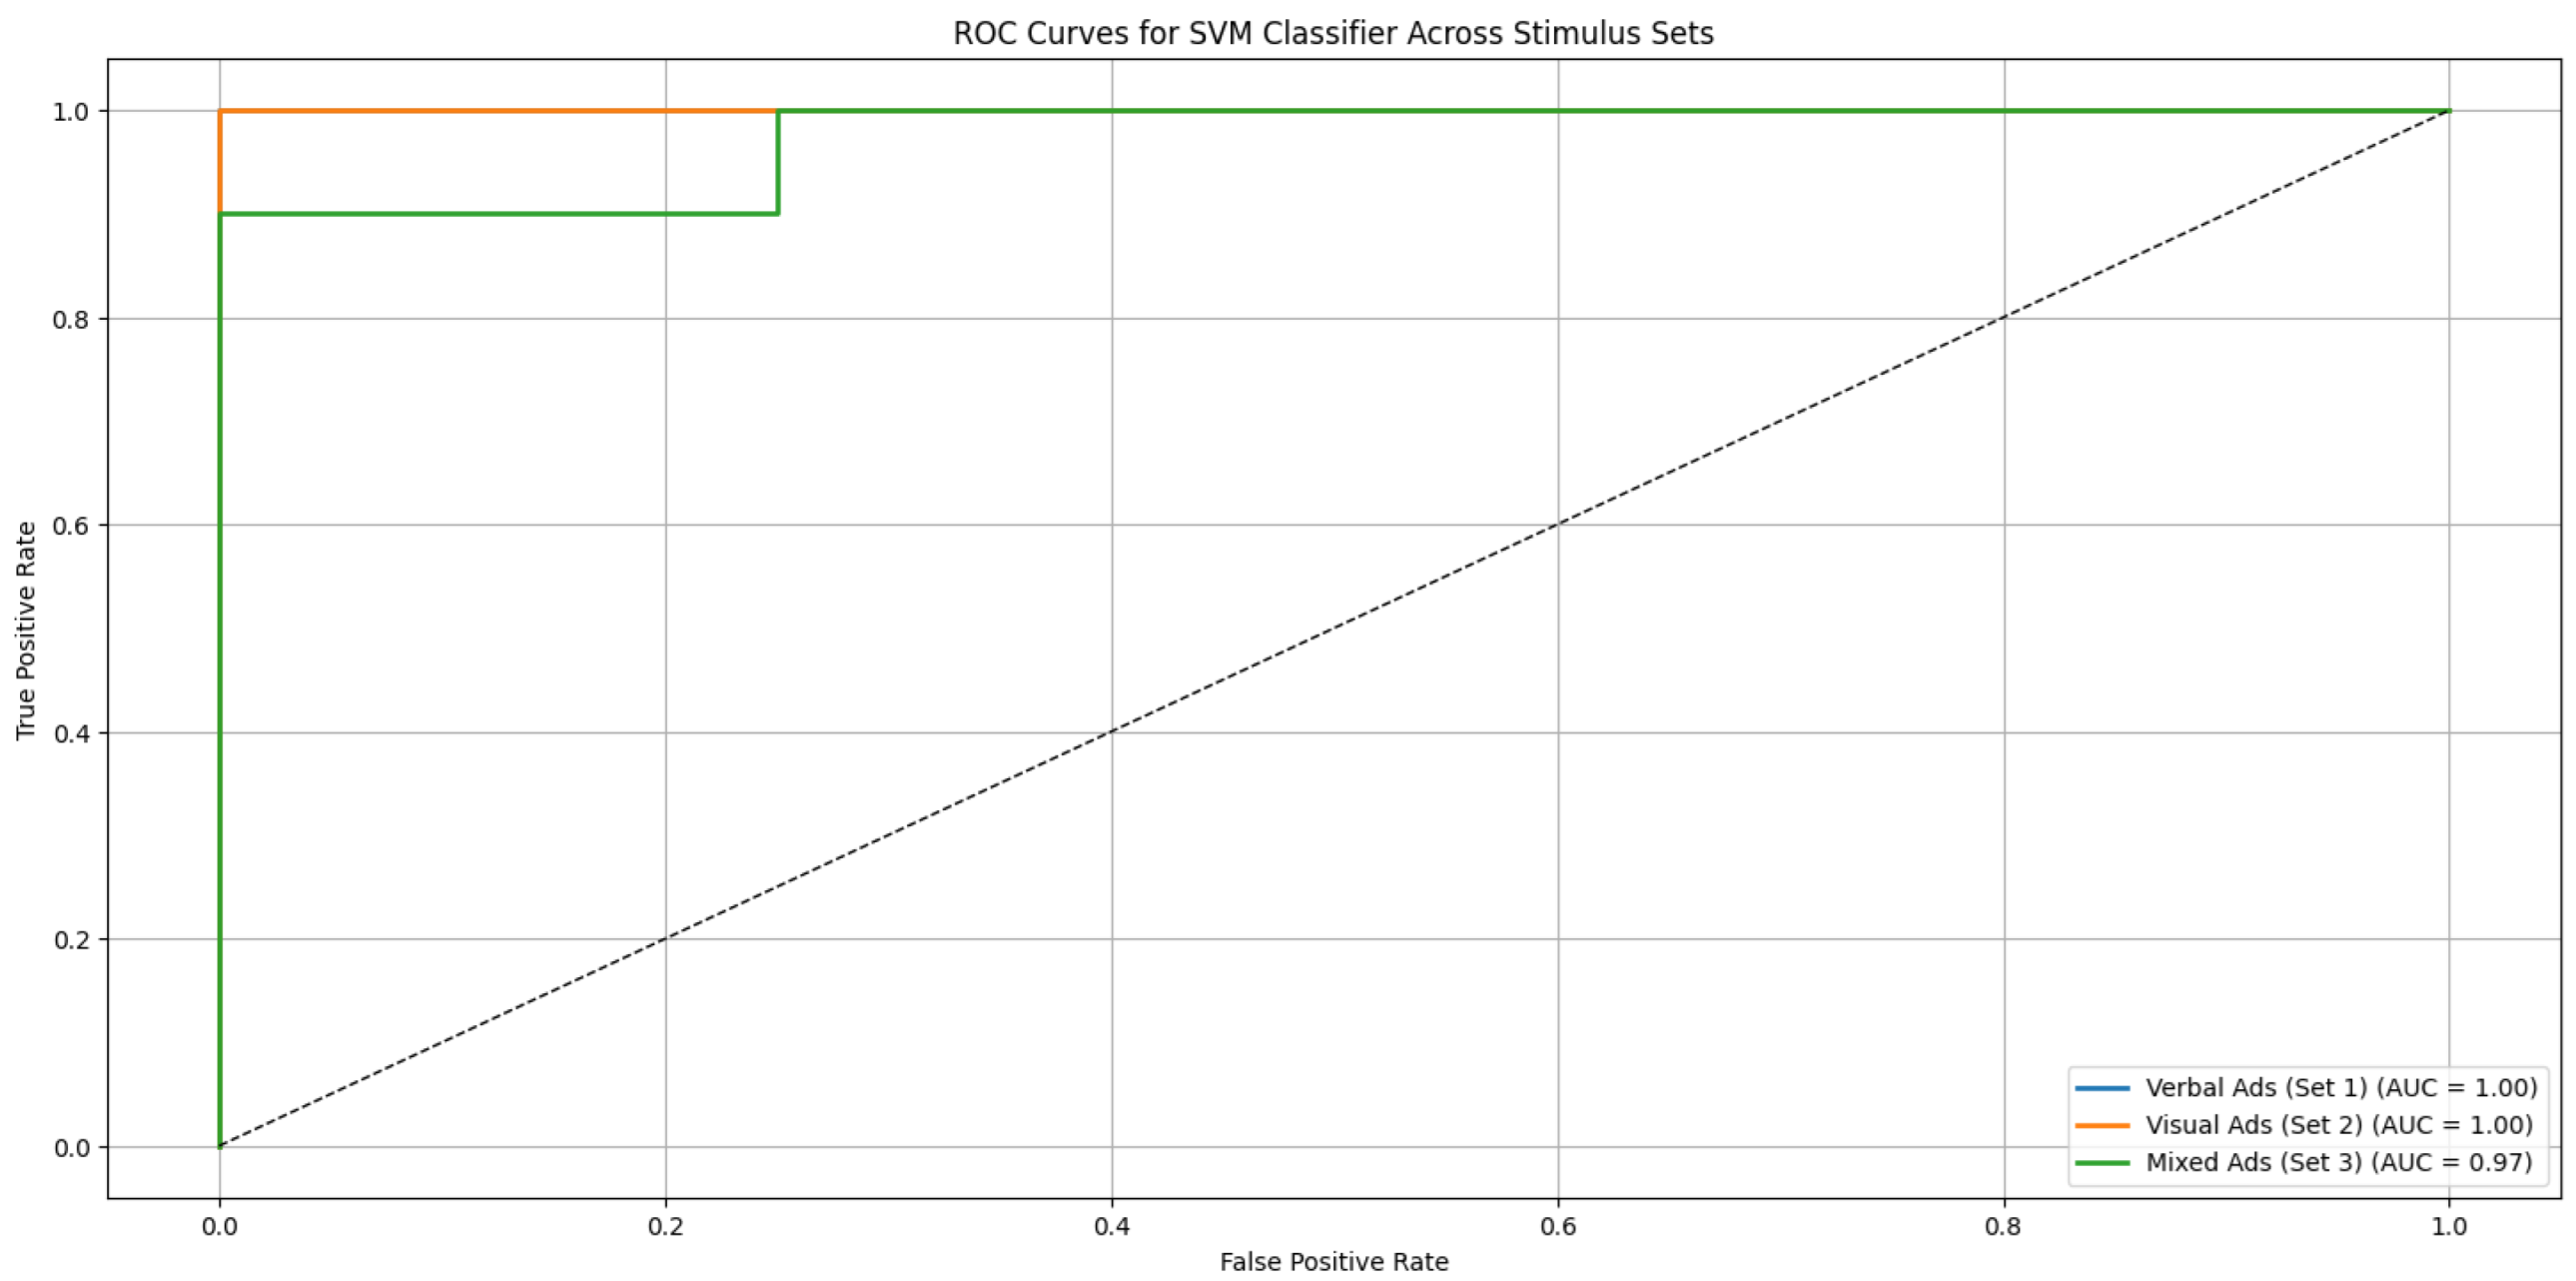
To evaluate the discriminative performance of the proposed SVM classifier across different types of advertising stimuli, receiver operating characteristic (ROC) curves were generated for each dataset (verbal, visual, and mixed). As illustrated in Figure 12, the area under the curve (AUC) values were consistently above chance level, with the mixed stimuli condition yielding the highest AUC. This finding suggests that combining verbal and visual content may enhance the classifier’s ability to distinguish between visualizers and verbalizers. The ROC analysis confirms the robustness of the SVM model across varied cognitive processing contexts and complements the accuracy-based evaluation with a probabilistic perspective on classification reliability.

4.2. Statistical Analysis of EEG Frequency Bands

To explore the neurophysiological basis of the classification results, we conducted a statistical analysis of the mean EEG band power for each participant group across five standard frequency bands (delta, theta, alpha, beta, gamma). Independent two-sample t-tests were computed between verbalizers and visualizers for each set. The results are summarized in Table 3.
  • Set 1—Verbal Advertisements
Significant differences emerged in the delta, theta, and beta bands ( p < 0.05 ), suggesting distinct neural activation patterns for language processing and working memory. No significant effects were observed in the alpha or gamma bands.
  • Set 2—Visual Advertisements
All five bands showed significant group-level differences, with the strongest effects observed in the theta band and additional contributions from alpha and gamma. These findings suggest that purely visual content elicits broad cognitive engagement, aligning with the high classification accuracy and indicating strong discriminability of neural patterns under modality-congruent conditions.
  • Set 3—Mixed Advertisements
This condition produced significant differences in the delta, theta, and beta bands, while alpha and gamma remained non-significant. The overlap of verbal and visual input may lead to a less distinct neural pattern relative to modality-congruent stimuli, which is consistent with the more moderate classification outcomes observed in this condition.

4.3. Depth Analysis of the Viewing Phase Among Participants

We followed the international 10–20-electrode position system, the classic standard for scalp EEG placement widely adopted in clinical and research practice [66,67].
For analysis, channels were grouped into five regions of interest (ROIs) according to their standard 10–20 letter–lobe correspondence: Frontal (Fp1, Fp2, F3, F4, F7, F8, Fz), central (C3, C4, Cz), parietal (P3, P4, P7, P8, Pz), occipital (O1, O2), and temporal (T7, T8). Midline sites (Fz, Cz, Pz) were assigned to their corresponding lobar ROI.
This 10–20 framework is the de facto international standard for scalp EEG positioning, and its spatial validity—together with higher-density extensions—has been evaluated extensively in the literature [66,67].
To characterize where group differences concentrate during advertisement viewing, we computed effect sizes (Cohen’s d) on channeland ROI×band features, averaged per participant across the three ad pairs. We define d = mean ( Visualizers ) mean ( Verbalizers ) ; thus, negative values indicate lower power in visualizers relative to verbalizers.
The largest effects per condition, with Cohen’s d values for representative channels, are summarized in Table 4.
  • Verbal ads (Set 1). The largest effects appeared over the parietal theta and posterior sites (with negative d values indicating higher power in verbalizers). For example, P4–Theta ( d = 1.31 ), P8–Theta ( d = 1.17 ), Pz–Theta ( d = 1.11 ), and Parietal–Theta ( d = 1.19 ).
  • Visual ads (Set 2). Differences peaked occipitally/parieto-occipitally, especially in theta and delta: O2–Theta ( d = 1.15 ), Occipital–Theta ( d = 1.12 ), and Pz–Theta ( d = 1.19 ).
  • Mixed ads (Set 3). A similar occipital/parietal pattern emerged, notably in delta and theta: P4–Theta ( d = 1.21 ), Oz–Delta ( d = 1.09 ), Occipital–Delta ( d = 1.07 ), O1–Delta ( d = 1.05 ).
We also assessed within-participant stability across the three viewing epochs using the coefficient of variation (CoV) on a small set of summary features (Occipital–Theta, Occipital–Delta, Parietal–Theta). Stability aligned with modality congruency: in Set 1 (verbal), verbalizers were more stable than visualizers (Occipital–Theta median CoV = 0.055 vs. 0.085 ), whereas in Set 2 (visual) and Set 3 (mixed), visualizers were more stable (e.g., Set 2: Occipital–Theta 0.097 vs. 0.150 ; Parietal–Theta 0.120 vs. 0.148 ; Set 3: Occipital–Theta 0.094 vs. 0.183 ; Parietal–Theta 0.094 vs. 0.103 ) (See Table 5).

Interpretation

Modality congruency during viewing was expressed primarily through response stability (lower CoV) and parietal–occipital topography, rather than uniformly higher absolute power in the congruent group. In visual ads (Set 2), occipital theta/delta effects yielded negative d, indicating higher mean power in verbalizers, while visualizers nonetheless showed lower CoV (greater within-participant consistency), consistent with more efficient processing of visual stimuli. Elevated theta/delta in the incongruent group is compatible with increased processing effort.
In line with the prior EEG literature [68,69,70], increases in theta power track higher mental workload and cognitive control demands, while delta synchronization has been linked to attentional control and interference suppression. Thus, the higher occipital/parietal theta–delta observed in the incongruent group likely indexes greater processing effort rather than more efficient processing, consistent with our finding that modality congruency chiefly manifested as higher response stability in the congruent group.

4.4. Feature Importance Analysis

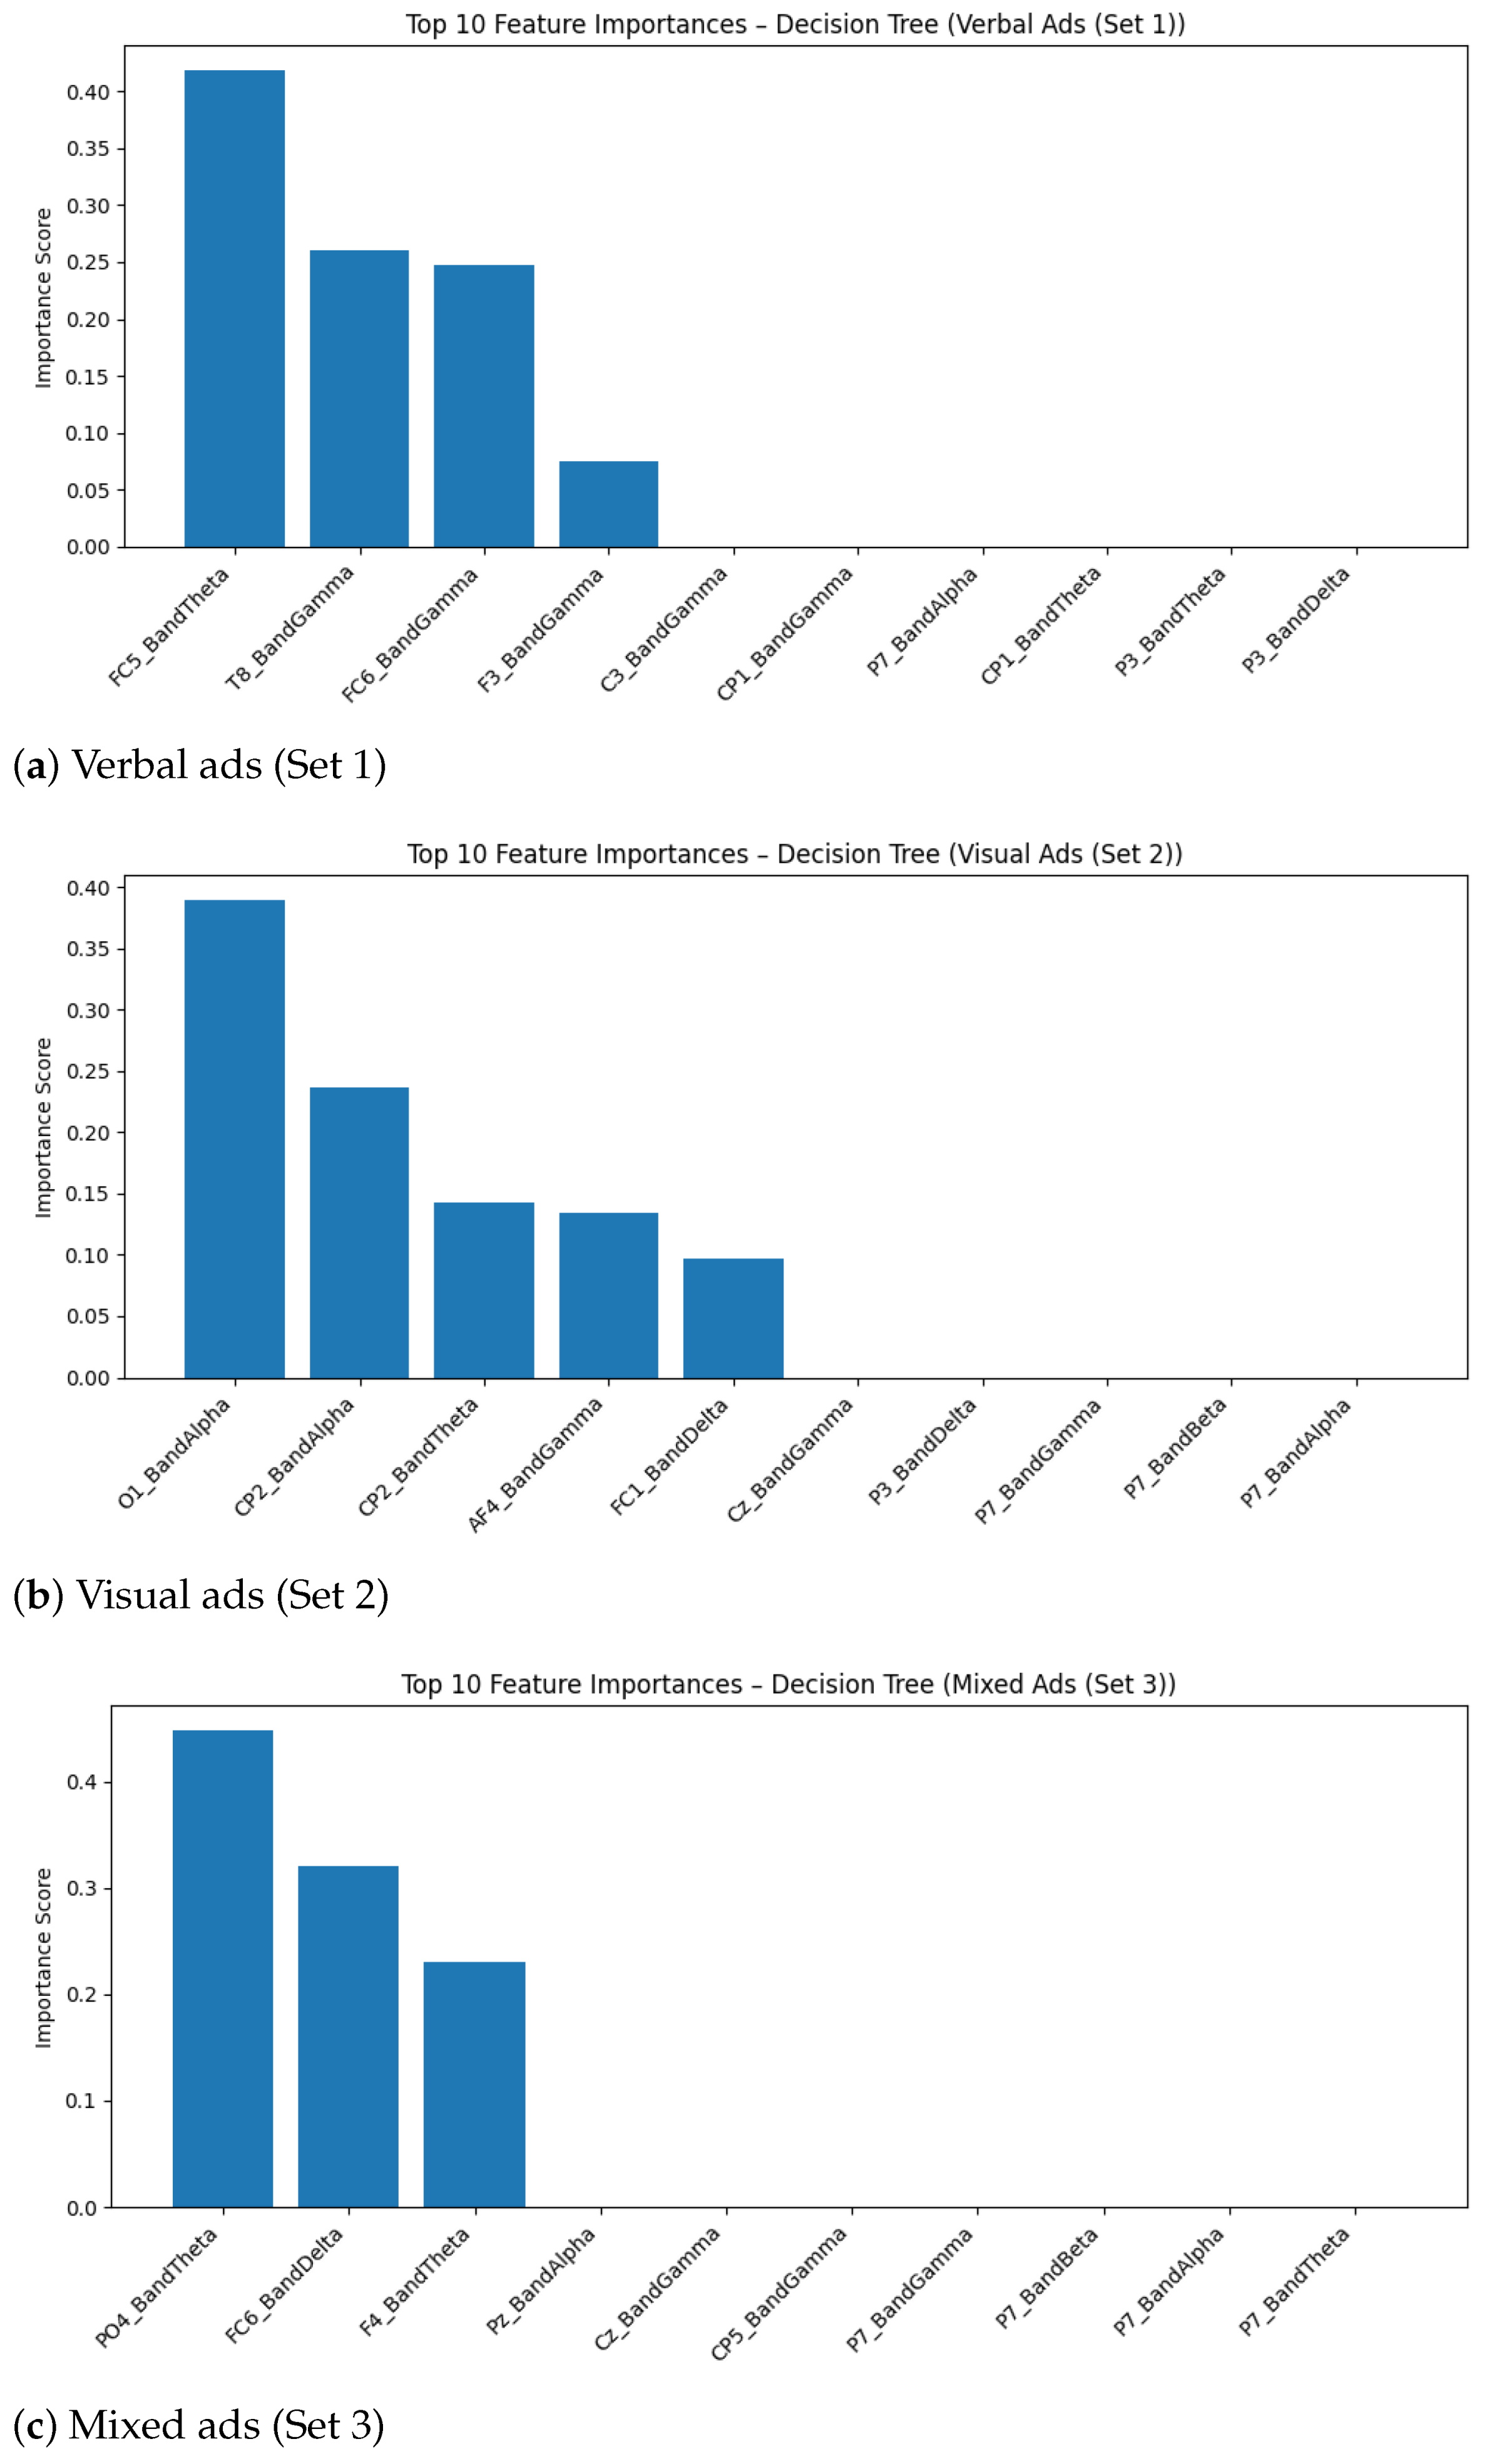
The feature importance analysis revealed distinct EEG patterns associated with each type of stimulus(see Figure 13). In the case of verbal advertisements (Set 1), theta activity in the left frontal region (FC5) emerged as the most influential feature, consistent with neural correlates of verbal processing and attention (see Table 6 for the association of each feature to its corresponding interpretation based on known neurocognitive functions). Visual stimuli (Set 2), on the other hand, elicited discriminative alpha responses predominantly in occipital and parietal sites (O1, CP2), aligning with the literature on visual information encoding. For mixed advertisements (Set 3), the classifier relied on a broader set of features, with theta activity in the parieto-occipital area (PO4) and delta power in frontal regions (FC6) indicating multi-source cognitive engagement. This variation in spatial and spectral patterns across conditions suggests that the nature of the stimulus modulates the neural substrates that distinguish individual processing styles.

4.5. Summary and Interpretation

Across all three advertisement conditions, the theta frequency band consistently demonstrated significant differences between Verbalizers and Visualizers, highlighting its sensitivity to individual cognitive processing preferences. This finding supports existing literature associating theta activity—particularly in frontal regions—with memory encoding, attention, and affective evaluation [12], all of which are highly relevant during ad viewing. The beta band also showed stable significance across conditions, suggesting its involvement in task engagement and working memory processes.
In contrast, the alpha band was only significant under visual conditions. This is consistent with previous work suggesting that alpha desynchronization reflects enhanced attentional engagement during visual processing tasks [12,79]. The gamma band yielded weaker and less consistent effects, likely due to its susceptibility to noise and its role in more complex cognitive integration processes. Overall, these results confirm that EEG frequency bands—especially theta and beta—can serve as effective neural markers for differentiating processing styles, and their expression is modulated by the nature of the advertising stimuli.
These findings support our secondary hypothesis that specific EEG frequency bands—particularly theta and beta—act as reliable neural markers of cognitive processing style, and their expression is modulated by the modality of the advertisement stimuli.

5. Discussion

5.1. Advancing Prior Research

Our results align with EEG-based advertising evidence that links spectral activity to attention, memory encoding, and evaluative processing during commercials. In particular, the robust theta differentiation we observe across conditions converges with reports of frontal/theta involvement in cognitive control [12,68] and successful evaluation of advertising content, while alpha modulation is consistent with sustained attentional engagement during viewing [73]. In broader cognitive terms, classic work also links alpha/theta dynamics to memory performance, which coheres with our style-sensitive effects under sustained exposure [79].
From a communication standpoint, our modality manipulation mirrors the established distinction between verbal and pictorial ad elements. Verbal copy can anchor or disambiguate image meaning and facilitate linguistic elaboration [17,52], whereas pictorial content and logos often capture attention and enjoy mnemonic advantages [16,51]. Framed by Dual Coding Theory [14] and the Cognitive Theory of Multimedia Learning [15,15], the clearer group differentiation under modality-congruent stimuli fits the notion of partly separable verbal and visual processing channels with distinct benefits for persuasion and recall (and known constraints under increased cognitive load).
Relative to earlier SOP-based EEG studies that reported group-level differences without predictive modelling or with less ecologically valid materials, our contribution is twofold: (i) we use realistic advertising stimuli and (ii) we demonstrate trait-sensitive classification with conventional frequency-domain features—positioning processing-style classification as a practical neuromarketing tool rather than a purely correlational finding [6,48]. Finally, spectral/style effects may interact with properties of the surrounding ad environment (e.g., page-background complexity, host–content congruity, colour/contrast) [80,81].

5.2. Main Findings

This study demonstrated that EEG signals recorded during advertisement exposure can effectively differentiate individuals according to their cognitive processing style—specifically, whether they are verbalizers or visualizers. This finding directly addresses our main research question and confirms that a predictive model can classify viewers into cognitive style groups based on brain responses to marketing stimuli.
Among the three classifiers evaluated, the Support Vector Machine (SVM) consistently achieved the highest and most stable performance across verbal and visual ad conditions, corroborating previous findings in EEG-based classification tasks that highlight the strength of SVM in handling high-dimensional and non-linear neural data. Notably, the consistency of classification across verbal and visual ad sets underscores the robustness of the extracted EEG frequency-domain features in capturing trait-like processing characteristics.
Statistical analyses further revealed significant differences in theta and beta band power between the two groups across all ad sets. Theta activity—typically associated with working memory, sustained attention, and semantic integration—emerged as the most reliable discriminative marker. The dominance of theta activity among visualizers and verbalizers aligns with Paivio’s Dual Coding Theory [14], which posits that verbal and visual systems are processed in parallel but involve distinct neural substrates. Our findings support the idea that these systems not only coexist but also exhibit measurable spectral divergence under EEG during stimulus-congruent exposure. Similarly, beta activity is often linked with sustained attention and task engagement, reinforcing the view that information processing styles manifest in neural responses related to cognitive control.
These outcomes confirm that neural responses to advertisement content vary in a style-specific manner and can be detected through EEG signals. Moreover, the results offer empirical support for our secondary hypothesis, demonstrating that specific EEG frequency bands—particularly theta and beta—can serve as neural markers of cognitive processing style, with their expression modulated by the modality of the advertisement stimuli. This offers valuable neurophysiological support for tailoring advertisement formats to match consumer cognitive preferences, enhancing message fluency and recall.

5.3. Empirical and Practical Implications

From an empirical perspective, the present study advances the growing body of literature encouraging the use of EEG as a reliable and non-invasive tool to assess stable consumer characteristics, such as the information processing style. Most prior neuromarketing research studies have studied state-dependent constructs—such as attention, emotion, or engagement. Conversely, this study demonstrates that EEG features, particularly in the theta band, can indicate substantial cognitive style preferences. This supports that the incorporation of neural data into psychographic segmentation models is feasible and can provide more valuable results for adapting personalized marketing strategies than traditional self-report-based profiling methods, which are often biased or incomplete.
Particular bands (e.g., theta band) can serve as trait-level biomarkers due to their consistent discriminative power across ad types, thus offering researchers and practitioners a robust feature set for information processing style classification. Given that the interest in hybrid AI–human modelling systems that require physiological inputs to enhance personalization engines is increasing, this result is highly important.
From a practical standpoint, these findings contribute to the innovative design of consumer-facing digital systems. For example,
  • Dynamic ad personalization: Wearable or BCI (brain–computer interface) environments can integrate EEG-driven classifiers in order to adapt advertisements’ content or type (visual vs. verbal) in real time according to consumer’s processing style preference. Such systems can lead to better fluency of advertisement messages, emotional engagement, and ultimately conversion rates.
  • E-commerce and recommendation systems: Online platforms, especially in mobile-based shopping contexts, where screen space is limited, can adapt product presentations (e.g., image-dominant or text-rich formats) according to inferred user style, thereby enhancing decision satisfaction and reducing cognitive load.
  • e-Learning and educational content: In digital education platforms, instructional materials can be adapted according to learners’ dominant processing modes. In this way, factors such as retention, comprehension and motivation can be improved.
  • Healthcare and mental wellness applications: Personalized therapeutic content (e.g., cognitive-behavioural interventions, mental health messaging) can be adapted to patients’ cognitive preferences, possibly leading to increased adherence and emotional engagement.
  • User interface (UI) and experience (UX) design: EEG-based style classifications can be used by designers to customize interface layouts, menu structures, or onboarding sequences. For example, visualizers may prefer icon-heavy dashboards, while verbalizers may prefer instructional tooltips and detailed menus.
Furthermore, consumer-facing platforms can integrate EEG-informed personalization systems since brain–computer interface technologies are evolving toward more accessible and discreet forms (e.g., ear-EEG, wearable dry sensors). This could enhance the development of next-generation adaptive environments where content is not only targeted based on past behaviour or demographic data, but also on the real-time cognitive tendencies of the individual.
Lastly, the findings of this study demonstrate that neurophysiological data alone can be used for meaningful consumer segmentation, thus support a broader transition in marketing science—from reactive profiling to proactive, neuro-driven personalization—and contribute toward a more nuanced, human-centred approach to digital engagement.

6. Conclusions

This study introduced a novel EEG-based classification framework for identifying individual consumer information processing styles—specifically, visualizers and verbalizers—during advertisement exposure. The Style of Processing (SOP) psychometric scale insights were compared to the analysis of frequency-domain EEG features by supervised machine learning algorithms. The findings demonstrated that the cognitive style can accurately be predicted from neural responses to verbal, visual, and mixed advertisements.
The experimental results showed that the theta frequency band served as a robust neural marker across all ad types. The Support Vector Machine (SVM) classifier consistently outperformed other models in terms of accuracy and stability. Notably, this study represents the first attempt to use EEG-driven machine learning to classify processing style in an ecologically valid marketing context, moving beyond traditional statistical comparisons and static stimuli.
These findings have important implications for both theory and practice. From a theoretical standpoint, the results deepen our understanding of the neurophysiological underpinnings of information processing preferences and validate the role of EEG as a predictive tool in neuromarketing research. Practically, this approach offers a foundation for developing adaptive marketing systems that align message format with consumer cognitive style in real time—enhancing user engagement, content personalization, and potentially conversion outcomes.
Looking ahead, future studies should aim to expand the dataset, explore real-time classification in dynamic environments, and examine the integration of EEG data with other physiological or behavioural signals. Such advancements could unlock the potential for fully responsive neuromarketing platforms tailored to the cognitive preferences of individual users.
While the results are promising, the relatively small and demographically homogeneous sample (N = 22) remains a key limitation. Although SMOTE was employed to address class imbalance, future studies should aim to validate findings across more diverse and larger populations. Moreover, the current design focused on static images and brief decision-making tasks. Increasing ecological validity—e.g., via dynamic multimedia ads, real-time social media feeds, or immersive environments—may yield even more nuanced insights into how cognitive styles influence attention, emotion, and decision making in naturalistic settings.
Our design did not manipulate properties of the advertising environment that are known to shape attention and attitudes—such as web-page background complexity, the congruity between the advertiser’s product focus and the surrounding page content, or banner colour and colour–text contrast. Consequently, observed EEG/style effects may partly reflect interactions with these design variables (e.g., [80,81]). Future work should orthogonally vary ad modality with such layout factors (e.g., low vs. high background complexity; congruent vs. incongruent host content; calibrated colour/contrast levels), pretest perceived complexity and congruity, and combine EEG with eye tracking to model how these variables jointly shape viewing behaviour and neural markers of processing style.
Additionally, in this work, the PSD features that were used provided strong discriminatory power. However, the incorporation of connectivity metrics (e.g., coherence, phase-locking) or spatiotemporal dynamics may advance the performance of the model. Real-time classification pipelines could also be explored to support adaptive ad delivery. Lastly, other approaches such as eye tracking, galvanic skin response, heart rate, and so on, could operate as complementary techniques, which, combined with EEG, could offer a richer understanding of the interrelation between cognitive style, emotion, and attention. Future research should also explore source localization and region-specific EEG analyses to better understand the neural substrates underlying cognitive style.

Author Contributions

Conceptualization, C.A.F.; Methodology, E.K. and C.A.F.; Software, A.P., E.K. and C.A.F.; Validation, A.P.; Formal analysis, A.P. and E.K.; Investigation, A.P.; Resources, A.P.; Data curation, A.P. and E.K.; Writing– original draft, A.P. and E.K.; Writing–review and editing, A.P. and C.A.F.; Visualization, A.P.; Supervision, C.A.F.; Project administration, C.A.F. All authors have read and agreed to the published version of the manuscript.

Funding

This research received no external funding.

Data Availability Statement

The data presented in this study are available on request from the corresponding author.

Acknowledgments

The authors acknowledge the Neuroengineering & Brain-Computer Interfaces Research Infrastructure, which is implemented and supported by the University of Patras, Greece. This infrastructure is part of the National Recovery and Resilience Plan ‘Greece 2.0’ and has received funding from the European Union—NextGenerationEU.

Conflicts of Interest

The authors declare no conflicts of interest.

References

  1. Alsharif, A.H.; Salleh, N.Z.M.; Baharun, R.; Rami Hashem, E.A. Neuromarketing research in the last five years: A bibliometric analysis. Cogent Bus. Manag. 2021, 8, 1978620. [Google Scholar] [CrossRef]
  2. Damião de Paula, A.L.; Lourenção, M.; de Moura Engracia Giraldi, J.; Caldeira de Oliveira, J.H. Effect of emotion induction on potential consumers’ visual attention in beer advertisements: A neuroscience study. Eur. J. Mark. 2023, 57, 202–225. [Google Scholar] [CrossRef]
  3. Camarrone, F.; Van Hulle, M.M. Measuring brand association strength with EEG: A single-trial N400 ERP study. PLoS ONE 2019, 14, e0217125. [Google Scholar] [CrossRef]
  4. Chiang, M.C.; Yen, C.; Chen, H.L. Does Age Matter? Using Neuroscience Approaches to Understand Consumers’ Behavior towards Purchasing the Sustainable Product Online. Sustainability 2022, 14, 11352. [Google Scholar] [CrossRef]
  5. Panteli, A.; Kalaitzi, E.; Fidas, C.A. A review on the use of eeg for the investigation of the factors that affect Consumer’s behavior. Physiol. Behav. 2024, 278, 114509. [Google Scholar] [CrossRef]
  6. Lin, M.H.J.; Jones, W.; Childers, T.L. Neuromarketing as a scale validation tool: Understanding individual differences based on the style of processing scale in affective judgements. J. Consum. Behav. 2024, 23, 171–185. [Google Scholar] [CrossRef]
  7. Childers, T.L.; Houston, M.J.; Heckler, S.E. Measurement of Individual Differences in Visual Versus Verbal Information Processing. J. Consum. Res. 1985, 12, 125–134. [Google Scholar] [CrossRef]
  8. Riding, R.; Burton, D.; Rees, G.; Sharratt, M. Cognitive style and personality in 12-year-old children. Br. J. Educ. Psychol. 1995, 65, 113–124. [Google Scholar] [CrossRef] [PubMed]
  9. Mayer, R.E.; Massa, L.J. Three facets of visual and verbal learners: Cognitive ability, cognitive style, and learning preference. J. Educ. Psychol. 2003, 95, 833. [Google Scholar] [CrossRef]
  10. LaBarbera, P.A.; Weingard, P.; Yorkston, E.A. Matching the message to the mind: Advertising imagery and consumer processing styles. J. Advert. Res. 1998, 38, 29–30. [Google Scholar] [CrossRef]
  11. Ruiz, S.; Sicilia, M. The impact of cognitive and/or affective processing styles on consumer response to advertising appeals. J. Bus. Res. 2004, 57, 657–664. [Google Scholar] [CrossRef]
  12. Vecchiato, G.; Astolfi, L.; De Vico Fallani, F.; Cincotti, F.; Mattia, D.; Salinari, S.; Soranzo, R.; Babiloni, F. Changes in brain activity during the observation of TV commercials by using EEG, GSR and HR measurements. Brain Topogr. 2010, 23, 165–179. [Google Scholar] [CrossRef]
  13. Abo-Zahhad, M.; Ahmed, S.M.; Abbas, S.N. A new EEG acquisition protocol for biometric identification using eye blinking signals. Int. J. Intell. Syst. Appl. 2015, 7, 48. [Google Scholar] [CrossRef]
  14. Paivio, A. Mind and Its Evolution: A Dual Coding Theoretical Approach; Psychology Press: East Sussex, UK, 2014. [Google Scholar] [CrossRef]
  15. Mayer, R.E. Multimedia Learning, 3rd ed.; Cambridge University Press: Cambridge, UK, 2020. [Google Scholar]
  16. Pieters, R.; Wedel, M. Attention Capture and Transfer in Advertising: Brand, Pictorial, and Text-Size Effects. J. Mark. 2004, 68, 36–50. [Google Scholar] [CrossRef]
  17. Mitchell, A.A. The Effect of Verbal and Visual Components of Advertisements on Brand Attitudes and Attitude Toward the Advertisement. J. Consum. Res. 1986, 13, 12–24. [Google Scholar] [CrossRef]
  18. Kolb, D.A. Learning-Style Inventory: Self-Scoring Inventory and Interpretation Booklet; TRG Hay/McBer: Boston, MA, USA, 1985. [Google Scholar]
  19. Emami, A.; Taheri, Z.; Zuferi, R. The interplay between framing effects, cognitive biases, and learning styles in online purchasing decision: Lessons for Iranian enterprising communities. J. Enterprising Communities People Places Glob. Econ. 2024, 18, 347–371. [Google Scholar] [CrossRef]
  20. Sadikoglu, G.; Dovlatova, K.J.; Akyurek, S. The Effect of Locus of Control and Thinking Style on Impulse Buying Behaviour from the Perspectives on Gender Differences. In Proceedings of the 12th World Conference “Intelligent System for Industrial Automation” (WCIS-2022); Aliev, R.A., Yusupbekov, N.R., Kacprzyk, J., Pedrycz, W., Babanli, M.B., Sadikoglu, F.M., Turabdjanov, S.M., Eds.; Spinger: Cham, Switzerland, 2024; pp. 229–236. [Google Scholar]
  21. Lavoie, R.; Main, K. Optimizing product trials by eliciting flow states: The enabling roles of curiosity, openness and information valence. Eur. J. Mark. 2022, 56, 50–77. [Google Scholar] [CrossRef]
  22. Lee, J.A.; Sudarshan, S.; Sussman, K.L.; Bright, L.F.; Eastin, M.S. Why are consumers following social media influencers on Instagram? Exploration of consumers’ motives for following influencers and the role of materialism. Int. J. Advert. 2022, 41, 78–100. [Google Scholar] [CrossRef]
  23. Defta, N.; Barbu, A.; Ion, V.A.; Pogurschi, E.N.; Osman, A.; Cune, L.C.; Bădulescu, L.A. Exploring the Relationship Between Socio-Demographic Factors and Consumers’ Perception of Food Promotions in Romania. Foods 2025, 14, 599. [Google Scholar] [CrossRef]
  24. Juanim, J.; Alghifari, E.S.; Setia, B.I. Exploring advertising stimulus, hedonic motives, and impulse buying behavior in Indonesia’s digital context: Demographics implications. Cogent Bus. Manag. 2024, 11, 2428779. [Google Scholar] [CrossRef]
  25. Bhaduri, G.; Ha-Brookshire, J. Gender differences in information processing and transparency: Cases of apparel brands’ social responsibility claims. J. Prod. Brand Manag. 2015, 24, 504–517. [Google Scholar] [CrossRef]
  26. Mandler, G. The Structure of Value: Accounting for Taste; CHIP Report; Center for Human Information Processing, Department of Psychology, University of California: San Diego, CA, USA, 1981. [Google Scholar]
  27. Pruysers, S. Supermarket politics: Personality and political consumerism. Int. Political Sci. Rev. 2025, 2025, 01925121241308213. [Google Scholar] [CrossRef]
  28. Wang, X.; Han, X.; Wu, Z.; Du, J.; Zhu, L. The busier, the more outcome-oriented? How perceived busyness shapes preference for advertising appeals. J. Retail. Consum. Serv. 2025, 84, 104172. [Google Scholar] [CrossRef]
  29. Handrich, M. Alexa, you freak me out-Identifying drivers of innovation resistance and adoption of Intelligent Personal Assistants. In Proceedings of the 2021 IEEE/ACIS 19th International Conference on Computer and Information Science (ICIS), Shanghai, China, 23–25 June 2021. [Google Scholar]
  30. Ramírez-Correa, P.E.; Grandón, E.E.; Arenas-Gaitán, J. Assessing differences in customers’ personal disposition to e-commerce. Ind. Manag. Data Syst. 2019, 119, 792–820. [Google Scholar] [CrossRef]
  31. Shumanov, M.; Cooper, H.; Ewing, M. Using AI predicted personality to enhance advertising effectiveness. Eur. J. Mark. 2022, 56, 1590–1609. [Google Scholar] [CrossRef]
  32. Park, J.; Gunn, F. The Impact of Image Dimensions toward Online Consumers’ Perceptions of Product Aesthetics. Hum. Factors Ergon. Manuf. Serv. Ind. 2016, 26, 595–607. [Google Scholar] [CrossRef]
  33. Yoo, J.; Kim, M. The effects of online product presentation on consumer responses: A mental imagery perspective. J. Bus. Res. 2014, 67, 2464–2472. [Google Scholar] [CrossRef]
  34. Burns, A.C.; Biswas, A.; Babin, L.A. The operation of visual imagery as a mediator of advertising effects. J. Advert. 1993, 22, 71–85. [Google Scholar] [CrossRef]
  35. de Bellis, E.; Hildebrand, C.; Ito, K.; Herrmann, A.; Schmitt, B. Personalizing the customization experience: A matching theory of mass customization interfaces and cultural information processing. J. Mark. Res. 2019, 56, 1050–1065. [Google Scholar] [CrossRef]
  36. Shao, W.; Grace, D.; Ross, M. Self-regulatory focus and advertising effectiveness. Mark. Intell. Plan. 2015, 33, 612–632. [Google Scholar] [CrossRef]
  37. Lee, J.S.; Kwak, D.H.; Bagozzi, R.P. Cultural cognition and endorser scandal: Impact of consumer information processing mode on moral judgment in the endorsement context. J. Bus. Res. 2021, 132, 906–917. [Google Scholar] [CrossRef]
  38. Pandey, P.K.; Pandey, P.K. Examining the potential effects of augmented reality on the retail customer experience: A systematic literature analysis. Int. J. Netw. Virtual Organ. 2024, 31, 191–223. [Google Scholar] [CrossRef]
  39. Roy, S.; Attri, R. Physimorphic vs. Typographic logos in destination marketing: Integrating destination familiarity and consumer characteristics. Tour. Manag. 2022, 92, 104544. [Google Scholar] [CrossRef]
  40. Acharya, J.N.; Hani, A.J.; Cheek, J.; Thirumala, P.; Tsuchida, T.N. American Clinical Neurophysiology Society Guideline 2: Guidelines for Standard Electrode Position Nomenclature. Neurodiagnostic J. 2016, 56, 245–252. [Google Scholar] [CrossRef]
  41. Kim, S.P. Preprocessing of EEG: Methods and Applications; Springer: Berlin/Heidelberg, Germany, 2018; pp. 15–33. [Google Scholar] [CrossRef]
  42. Jiang, X.; Bian, G.B.; Tian, Z. Removal of Artifacts from EEG Signals: A Review. Sensors 2019, 19, 987. [Google Scholar] [CrossRef]
  43. Sun, L.; Liu, Y.; Beadle, P. Independent component analysis of EEG signals. In Proceedings of the 2005 IEEE International Workshop on VLSI Design and Video Technology, Suzhou, China, 28–30 May 2005; pp. 219–222. [Google Scholar] [CrossRef]
  44. Chang, C.Y.; Hsu, S.H.; Pion-Tonachini, L.; Jung, T.P. Evaluation of Artifact Subspace Reconstruction for Automatic EEG Artifact Removal. In Proceedings of the 2018 40th Annual International Conference of the IEEE Engineering in Medicine and Biology Society (EMBC), Honolulu, HI, USA, 17–21 July 2018; pp. 1242–1245. [Google Scholar] [CrossRef]
  45. EBME. Introduction to EEG; EBME: Bedford, UK, 2024. [Google Scholar]
  46. Aldayel, M.; Ykhlef, M.; Al-Nafjan, A. Deep Learning for EEG-Based Preference Classification in Neuromarketing. Appl. Sci. 2020, 10, 1525. [Google Scholar] [CrossRef]
  47. Vyas, S.; Seal, A. A Deep Convolution Neural Networks Framework for Analyzing Electroencephalography Signals in Neuromarketing. In Proceedings of the International Conference on Frontiers in Computing and Systems, IIT Mandi, Mandi, India, 16–17 October 2023; Basu, S., Kole, D.K., Maji, A.K., Plewczynski, D., Bhattacharjee, D., Eds.; pp. 119–127. [Google Scholar]
  48. Glass, A.; Riding, R.J. EEG differences and cognitive style. Biol. Psychol. 1999, 51, 23–41. [Google Scholar] [CrossRef]
  49. Riding, R.; Cheema, I. Cognitive styles—An overview and integration. Educ. Psychol. 1991, 11, 193–215. [Google Scholar] [CrossRef]
  50. Richardson, A. Verbalizer-visualizer: A cognitive style dimension. J. Ment. Imag. 1977, 1, 109–125. [Google Scholar]
  51. Ghosh, T.; Sreejesh, S.; Dwivedi, Y.K. Brand logos versus brand names: A comparison of the memory effects of textual and pictorial brand elements placed in computer games. J. Bus. Res. 2022, 147, 222–235. [Google Scholar] [CrossRef]
  52. Bünzli, F.; Eppler, M.J. How verbal text guides the interpretation of advertisement images: A predictive typology of verbal anchoring. Commun. Theory 2024, 34, 191–204. [Google Scholar] [CrossRef]
  53. Rayner, K.; Schotter, E.R.; Masson, M.E.J.; Potter, M.C.; Treiman, R. So Much to Read, So Little Time: How Do We Read, and Can Speed Reading Help? Psychol. Sci. Public Interest A J. Am. Psychol. Soc. 2016, 17, 4–34. [Google Scholar] [CrossRef]
  54. Brysbaert, M. How many words do we read per minute? A review and meta-analysis of reading rate. J. Mem. Lang. 2019, 109, 104047. [Google Scholar] [CrossRef]
  55. Thorpe, S.; Fize, D.; Marlot, C. Speed of processing in the human visual system. Nature 1996, 381, 520–522. [Google Scholar] [CrossRef]
  56. Potter, M.C.; Wyble, B.; Hagmann, C.E.; McCourt, E.S. Detecting meaning in RSVP at 13 ms per picture. Atten. Percept. Psychophys 2014, 76, 270–279. [Google Scholar] [CrossRef] [PubMed]
  57. Sweller, J.; Ayres, P.; Kalyuga, S. Altering Element Interactivity and Intrinsic Cognitive load. In Cognitive Load Theory; Springer: New York, NY, USA, 2011; pp. 203–218. [Google Scholar] [CrossRef]
  58. Khondakar, M.F.K.; Trovee, T.G.; Hasan, M.; Sarowar, M.H.; Chowdhury, M.H.; Hossain, Q.D. A Comparative Analysis of Different Pre-Processing Pipelines for EEG-Based Preference Prediction in Neuromarketing. In Proceedings of the 2023 IEEE Pune Section International Conference (PuneCon), Pune, India, 14–16 December 2023; pp. 1–7. [Google Scholar] [CrossRef]
  59. Bigdely-Shamlo, N.; Mullen, T.; Kothe, C.; Su, K.M.; Robbins, K.A. The PREP pipeline: Standardized preprocessing for large-scale EEG analysis. Front. Neuroinform. 2015, 9, 16. [Google Scholar] [CrossRef]
  60. Blum, S.; Jacobsen, N.S.; Bleichner, M.G.; Debener, S. A Riemannian modification of artifact subspace reconstruction for EEG artifact handling. Front. Hum. Neurosci. 2019, 13, 141. [Google Scholar] [CrossRef]
  61. BioSemi. ActiveTwo System: Technical Manual. 2025. Available online: https://www.biosemi.com (accessed on 11 April 2025).
  62. Welch, P. The use of fast Fourier transform for the estimation of power spectra: A method based on time averaging over short, modified periodograms. IEEE Trans. Audio Electroacoust. 1967, 15, 70–73. [Google Scholar] [CrossRef]
  63. Dhiman, R. Machine learning techniques for electroencephalogram based brain-computer interface: A systematic literature review. Meas. Sens. 2023, 28, 100823. [Google Scholar] [CrossRef]
  64. Khondakar, M.F.K.; Sarowar, M.H.; Chowdhury, M.H.; Majumder, S.; Hossain, M.A.; Dewan, M.A.A.; Hossain, Q.D. A systematic review on EEG-based neuromarketing: Recent trends and analyzing techniques. Brain Inform. 2024, 11, 17. [Google Scholar] [CrossRef]
  65. Brownlee, J. SMOTE for Imbalanced Classification with Python. Anal. Vidhya 2025, 17. [Google Scholar]
  66. Klem, G.H.; Lüders, H.O.; Jasper, H.H.; Elger, C. The ten-twenty electrode system of the International Federation. The International Federation of Clinical Neurophysiology. Electroencephalogr. Clin. Neurophysiol. Suppl. 1999, 52, 3–6. [Google Scholar]
  67. Jurcak, V.; Tsuzuki, D.; Dan, I. 10/20, 10/10, and 10/5 systems revisited: Their validity as relative head-surface-based positioning systems. NeuroImage 2007, 34, 1600–1611. [Google Scholar] [CrossRef] [PubMed]
  68. Cavanagh, J.F.; Frank, M.J. Frontal theta as a mechanism for cognitive control. Trends Cogn. Sci. 2014, 18, 414–421. [Google Scholar] [CrossRef] [PubMed]
  69. Harmony, T. The functional significance of delta oscillations in cognitive processing. Front. Integr. Neurosci. 2013, 7, 83. [Google Scholar] [CrossRef]
  70. Chikhi, S.; Matton, N.; Blanchet, S. EEG power spectral measures of cognitive workload: A meta-analysis. Psychophysiology 2022, 59, e14009. [Google Scholar] [CrossRef] [PubMed]
  71. Santarnecchi, E.; Sprugnoli, G.; Bricolo, E.; Costantini, G.; Liew, S.L.; Musaeus, C.S.; Salvi, C.; Pascual-Leone, A.; Rossi, A.; Rossi, S. Gamma tACS over the temporal lobe increases the occurrence of Eureka! moments. Sci. Rep. 2019, 9, 5778. [Google Scholar] [CrossRef]
  72. Thompson, L.; Khuc, J.; Saccani, M.S.; Zokaei, N.; Cappelletti, M. Gamma oscillations modulate working memory recall precision. Exp. Brain Res. 2021, 239, 2711–2724. [Google Scholar] [CrossRef]
  73. Bacigalupo, F.; Luck, S.J. Alpha-band EEG suppression as a neural marker of sustained attentional engagement to conditioned threat stimuli. Soc. Cogn. Affect. Neurosci. 2022, 17, 1101–1117. [Google Scholar] [CrossRef]
  74. Hong, X.; Sun, J.; Bengson, J.J.; Mangun, G.R.; Tong, S. Normal aging selectively diminishes alpha lateralization in visual spatial attention. NeuroImage 2015, 106, 353–363. [Google Scholar] [CrossRef]
  75. Alamia, A.; Terral, L.; D’ambra, M.R.; VanRullen, R. Distinct roles of forward and backward alpha-band waves in spatial visual attention. bioRxiv 2022. [Google Scholar] [CrossRef] [PubMed]
  76. Deng, Y.; Reinhart, R.M.G.; Choi, I.; Shinn-Cunningham, B. Causal links between parietal alpha activity and spatial auditory attention. bioRxiv 2019. [Google Scholar] [CrossRef]
  77. Jaiswal, N.; Ray, W.; Slobounov, S. Encoding of visual-spatial information in working memory requires more cerebral efforts than retrieval: Evidence from an EEG and virtual reality study. Brain Res. 2010, 1347, 80–89. [Google Scholar] [CrossRef]
  78. Thornberry, C.; Commins, S. Frontal delta and theta power reflect strategy changes during human spatial memory retrieval in a virtual water maze task: An exploratory analysis. Front. Cogn. 2024, 3, 1393202. [Google Scholar] [CrossRef]
  79. Klimesch, W. EEG alpha and theta oscillations reflect cognitive and memory performance: A review and analysis. Brain Res. Rev. 1999, 29, 169–195. [Google Scholar] [CrossRef]
  80. Stevenson, J.S., II; Bruner, G.C.; Kumar, A. Webpage Background and Viewer Attitudes. J. Advert. Res. 2000, 40, 1–6. [Google Scholar] [CrossRef]
  81. Moore, R.S.; Stammerjohan, C.A.; Coulter, R.A. Banner advertiser-web site context congruity and color effects on attention and attitudes. J. Advert. 2005, 34, 71–84. [Google Scholar] [CrossRef]
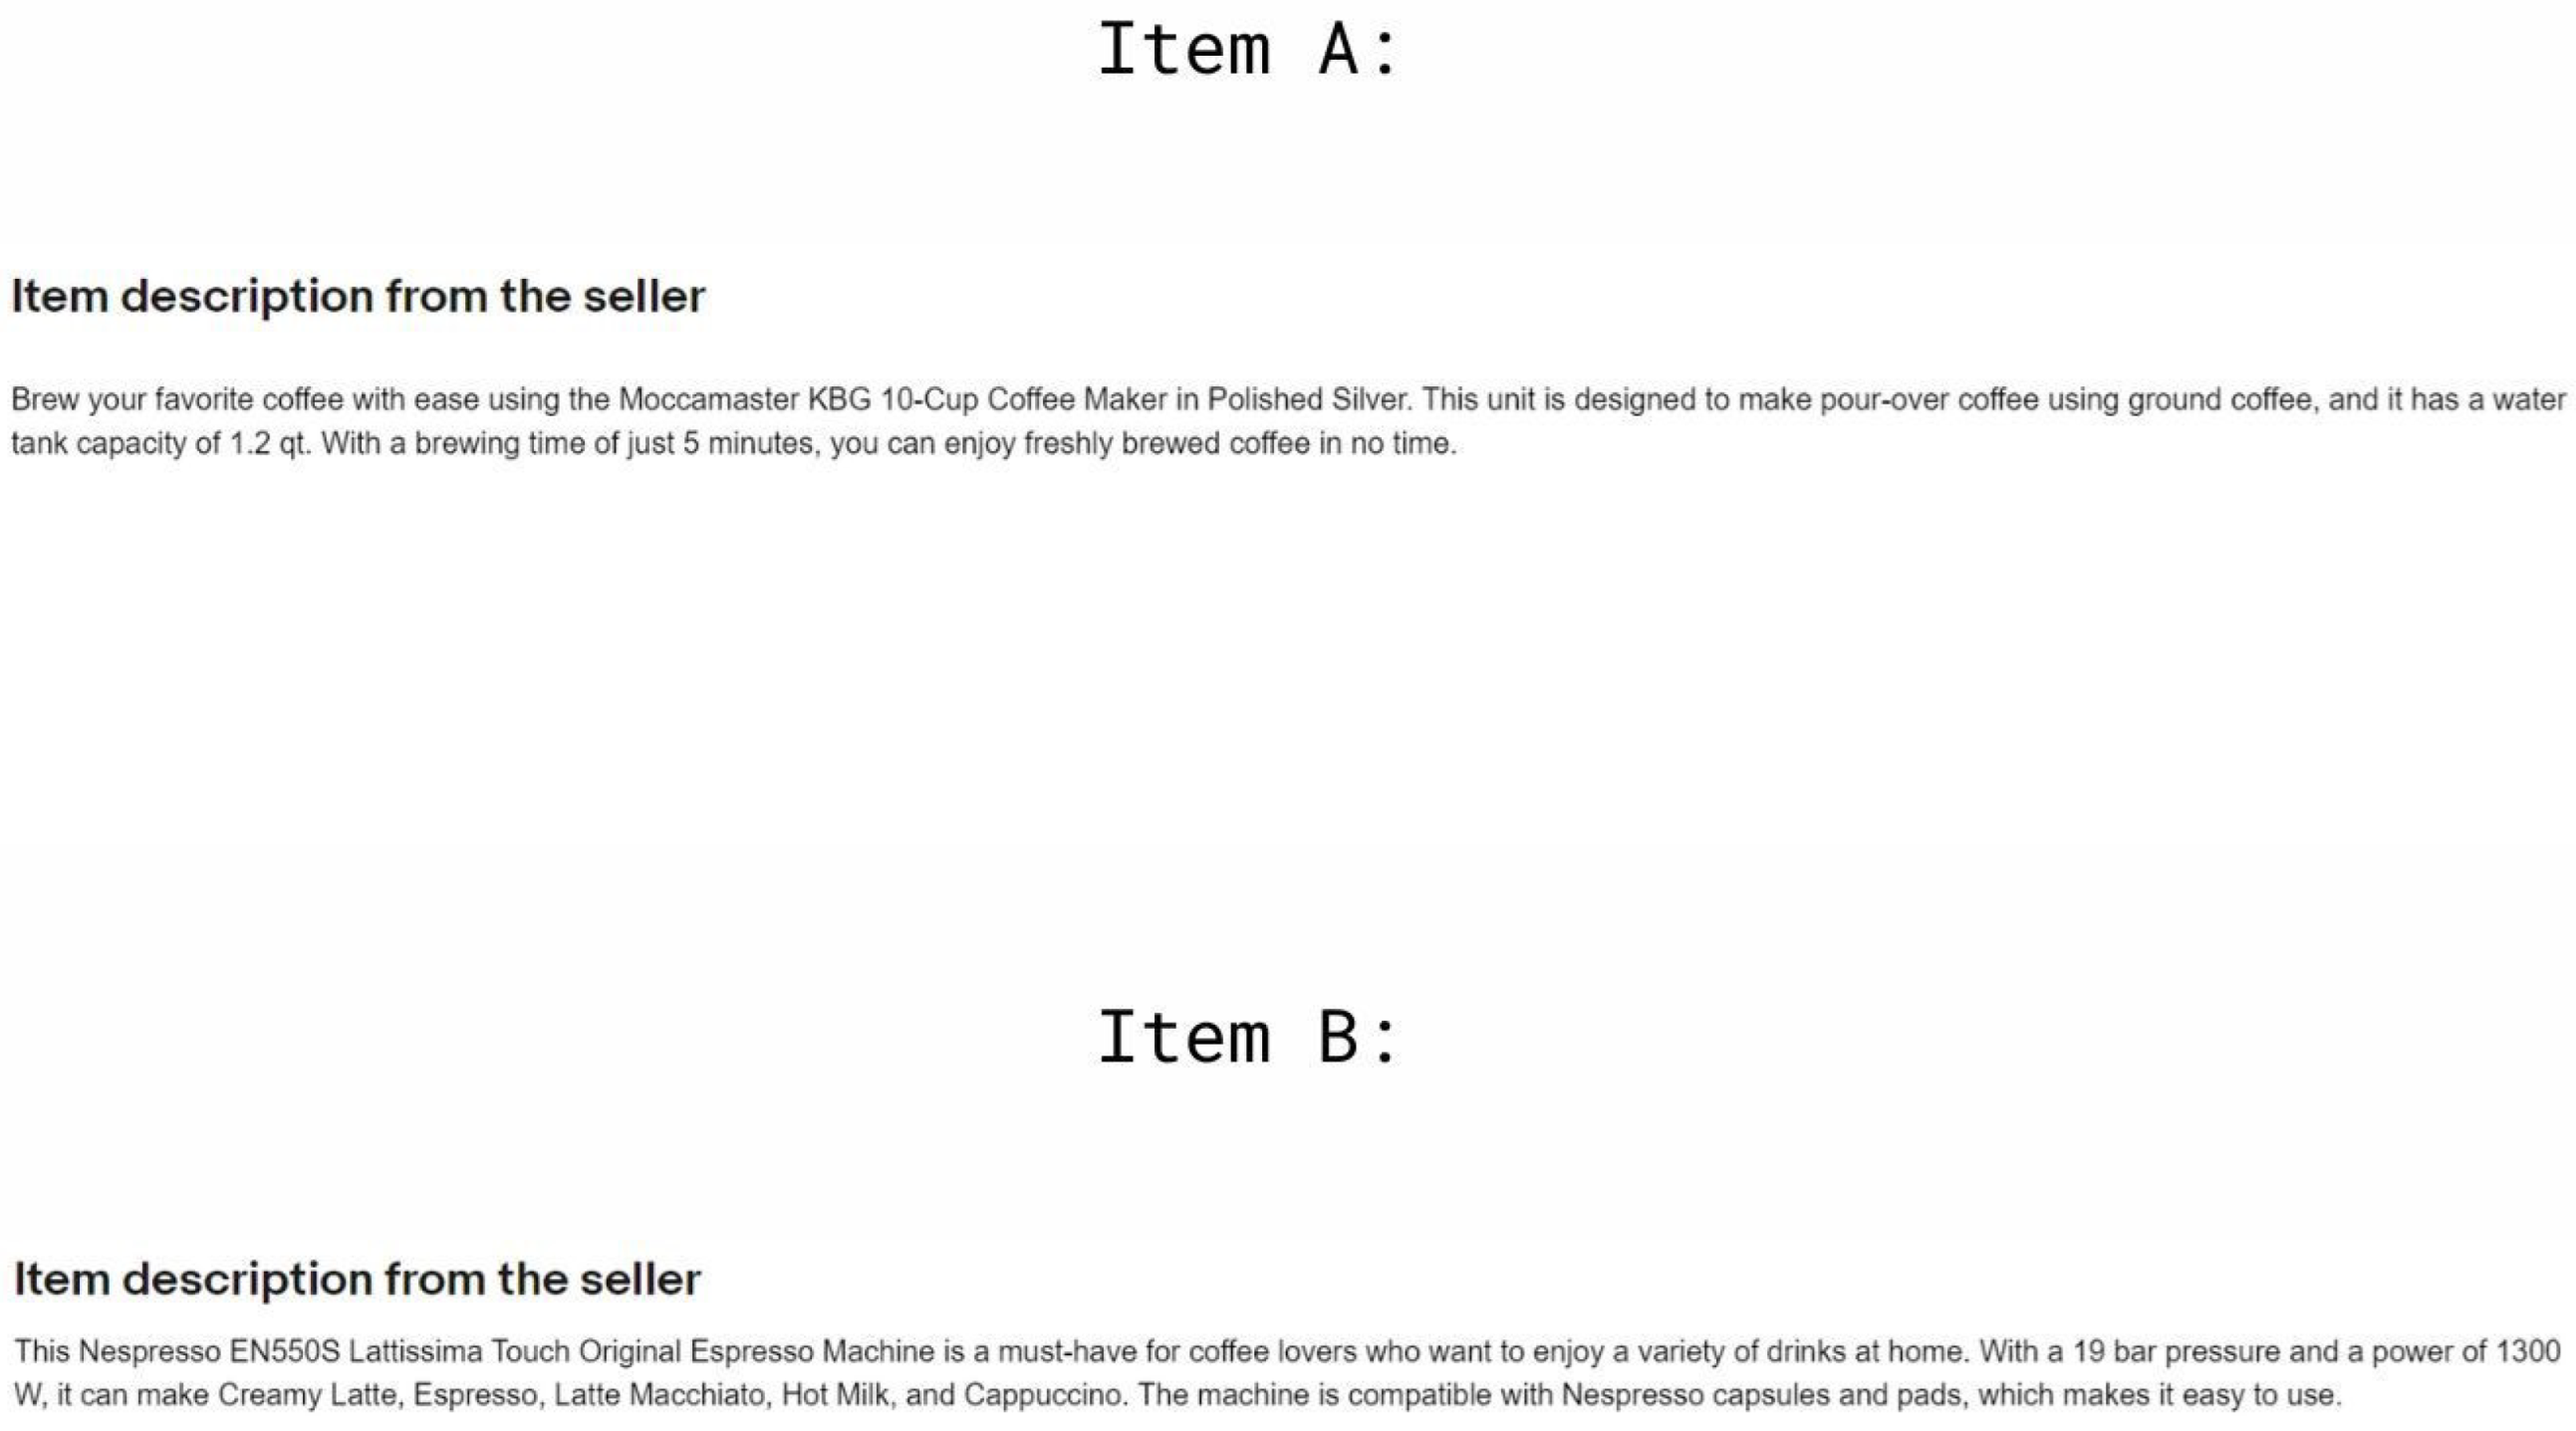
Figure 2. Verbal stimulus; text only.
Information 16 00757 g002
Figure 3. Visual stimulus; image only.
Information 16 00757 g003
Figure 4. Mixed stimuli.
Information 16 00757 g004
Figure 5. Stimulus flow structure for each trial.
Information 16 00757 g005
Figure 6. SOP scale results of participants.
Information 16 00757 g006
Figure 7. Experimental setup during EEG recording.
Information 16 00757 g007
Figure 8. Classification metrics (accuracy, precision, recall, and F1-score) for all models across the three advertisement sets.
Information 16 00757 g008
Figure 9. Confusion matrix of SVM classifier on Set 1 (verbal ads).
Information 16 00757 g009
Figure 10. Confusion matrix of SVM classifier on Set 2 (visual ads).
Information 16 00757 g010
Figure 11. Confusion matrix of SVM classifier on Set 3 (mixed ads).
Information 16 00757 g011
Figure 12. ROC curves of the SVM classifier for the three stimulus sets. The area under the curve (AUC) values indicate that the classifier performs above chance in all cases, with the mixed condition exhibiting the highest discriminative power.
Information 16 00757 g012
Figure 13. Top 10 EEG features by importance as determined by the Decision Tree classifier for each stimulus condition: (a) verbal, (b) visual, and (c) mixed. Each bar represents a frequency-based EEG feature contributing to the classification of visualizers versus verbalizers.
Information 16 00757 g013
Table 1. Description of stimuli.
SetStimulus TypeDescription
Set 1Verbal AdvertisementsText-based ads describing product features.
Set 2Product ImagesVisual-only stimuli showing product images.
Set 3Images with Text DescriptionsProduct images combined with short textual descriptions.
Table 2. Performance metrics for different classification models across the three advertisement sets.
ModelAccuracyPrecisionRecallF1-Score5-Fold CVSMOTE (CV)
Mean Std Mean Std
Set 1—Verbal Ads
SVM93%90%95%92%0.800.130.890.04
DT86%83%83%83%0.790.120.800.06
kNN86%84%90%85.5%0.650.180.840.10
Set 2—Visual Ads
SVM93%95.5%87.5%90.5%0.840.080.860.03
DT99%95%88%91%0.770.160.860.03
kNN93%95%87.5%90%0.780.200.800.11
Set 3—Mixed Ads
SVM86%84%90%85.5%0.830.070.840.05
DT98%90%95%92%0.790.130.880.07
kNN93%95.5%87.5%90.5%0.770.140.880.04
Table 3. Statistical results of EEG band power differences between visualizers and verbalizers.
Frequency BandSetMean (Verbalizers)Mean (Visualizers)T-Statisticp-ValueSignificant ( α = 0.05 )
Set 10.00000.00002.27120.0268Yes
DeltaSet 20.00000.00003.52020.0012Yes
Set 30.00000.00002.60640.0116Yes
Set 10.00000.00003.91450.0002Yes
ThetaSet 20.00000.00004.12940.0001Yes
Set 30.00000.00002.63340.0106Yes
Set 10.00000.00001.63090.1079No
AlphaSet 20.00000.00002.16950.0338Yes
Set 30.00000.00001.24460.2183No
Set 10.00000.00002.12120.0409Yes
BetaSet 20.00000.00002.67340.0118Yes
Set 30.00000.00002.08670.0432Yes
Set 10.00000.00001.36550.1792No
GammaSet 20.00000.00002.04170.0467Yes
Set 30.00000.00001.26560.2103No
Table 4. Largest channel/ROI×band effects (Cohen’s d; d = mean(Visualizers)−mean(Verbalizers)) and median within-participant stability (CoV) during viewing. Negative d indicates lower power in visualizers.
SetFeatured
Set 1 (Verbal)P4_BandTheta 1.31
Parietal_Theta 1.19
P8_BandTheta 1.17
Pz_BandTheta 1.11
Set 2 (Visual)Pz_BandTheta 1.19
P4_BandTheta 1.17
O2_BandTheta 1.15
Set 3 (Mixed)P4_BandTheta 1.21
Oz_BandDelta 1.09
O1_BandDelta 1.05
Table 5. Within-participant stability (coefficient of variation, CoV) of EEG band power across verbal, visual, and mixed advertisement conditions, separately for verbalizers and visualizers.
SetFeatureVerbalizers (CoV)Visualizers (CoV)
Set 1 (Verbal)Occipital_Delta0.0820.114
Occipital_Theta0.0550.085
Parietal_Theta0.0460.091
Set 2 (Visual)Occipital_Delta0.1200.123
Occipital_Theta0.1500.097
Parietal_Theta0.1480.120
Set 3 (Mixed)Occipital_Delta0.1170.103
Occipital_Theta0.1830.094
Parietal_Theta0.1030.094
Table 6. Top 3 most important EEG features for processing style classification per stimulus set, as identified by the Decision Tree model.
Stimulus SetTop EEG FeaturesNeurocognitive Interpretation
Set 1—Verbal AdsFC5_BandThetaVerbal processing and attention (left frontal)
T8_BandGammaRight temporal gamma—cognitive effort [71]
FC6_BandGammaRight frontal gamma—working memory [72]
Set 2—Visual AdsO1_BandAlphaVisual cortex—alpha suppression (visual attention) [73,74,75]
CP2_BandAlphaRight parietal alpha—spatial attention processing [76]
CP2_BandThetaTheta—integrative visual encoding [77]
Set 3—Mixed AdsPO4_BandThetaParieto-occipital theta—multimodal engagement
FC6_BandDeltaFrontal delta—attentional shift or integration [78]
F4_BandThetaRight frontal theta—cognitive control and attention [68]
Disclaimer/Publisher’s Note: The statements, opinions and data contained in all publications are solely those of the individual author(s) and contributor(s) and not of MDPI and/or the editor(s). MDPI and/or the editor(s) disclaim responsibility for any injury to people or property resulting from any ideas, methods, instructions or products referred to in the content.