Article

Mobile Platform for Continuous Screening of Clear Water Quality Using Colorimetric Plasmonic Sensing

by
Rima Mansour
1,2,3,4,
Caterina Serafinelli
2,3,5,
Rui Jesus
2,4 and
Alessandro Fantoni
2,3,*
1
Department of the Computer Science, Nova School of Science and Technology, 2829-516 Caparica, Portugal
2
Lisbon School of Engineering (ISEL)/IPL, Rua Conselheiro Emídio Navarro, nº1, 1959-007 Lisboa, Portugal
3
CTS—Centre of Technology and Systems and Associated Lab of Intelligent Systems (LASI), 2829-516 Caparica, Portugal
4
NOVA LINCS (NOVA Laboratory for Computer Science and Informatics), Nova School of Science and Technology, 2829-516 Caparica, Portugal
5
Department of Electrical and Computer Engineering, Nova School of Science and Technology, 2829-516 Caparica, Portugal
*
Author to whom correspondence should be addressed.
Information 2025, 16(8), 683; https://doi.org/10.3390/info16080683 (registering DOI)
Submission received: 30 June 2025 / Revised: 7 August 2025 / Accepted: 8 August 2025 / Published: 10 August 2025
(This article belongs to the Special Issue Optimization Algorithms and Their Applications)

Abstract

Effective water quality monitoring is very important for detecting pollution and protecting public health. However, traditional methods are slow, relying on costly equipment, central laboratories, and expert staffing, which delays real-time measurements. At the same time, significant advancements have been made in the field of plasmonic sensing technologies, making them ideal for environmental monitoring. However, their reliance on large, expensive spectrometers limits accessibility. This work aims to bridge the gap between advanced plasmonic sensing and practical water monitoring needs, by integrating plasmonic sensors with mobile technology. We present BioColor, a mobile platform that consists of a plasmonic sensor setup, mobile application, and cloud services. The platform processes captured colorimetric sensor images in real-time using optimized image processing algorithms, including region-of-interest segmentation, color extraction (mean and dominant), and comparison via the CIEDE2000 metric. The results are visualized within the mobile app, providing instant and automated access to the sensing outcome. In our validation experiments, the system consistently measured color differences in various sensor images captured under media with different refractive indices. A user experience test with 12 participants demonstrated excellent usability, resulting in a System Usability Scale (SUS) score of 93. The BioColor platform brings advanced sensing capabilities from hardware into software, making environmental monitoring more accessible, efficient, and continuous.

1. Introduction

The growing pollution levels in freshwater are raising global concern, as they put ecosystems and public health at risk [1]. Therefore, continuous water quality monitoring is crucial to identify sources of pollution and implement the necessary treatment measures [2]. Traditional water testing methods rely on laboratory equipment, which is expensive, time-consuming to use, and requires expert staffing. These limitations can slow down the process of taking necessary actions to address problems with water pollution [3]. To overcome these challenges, recent research has focused on integrating mobile technologies, cloud computing, and image processing into environmental monitoring systems, making them more accessible to everyone [4,5]. Mobile technologies, particularly smartphones, have significantly transformed environmental monitoring by connecting with sensor networks. They can collect, display, and transmit sensor data efficiently, allowing for real-time data analysis. Cloud computing enhances this process by providing scalable storage and remote access to measurements, eliminating the delays typically associated with laboratory workflows [6,7,8]. Additionally, Digital Image Colorimetry (DIC) has emerged as a powerful tool for analyzing visual data from the environment. By assessing color changes in images, DIC can evaluate crucial quality indicators, such as water clarity and air quality [9,10,11].
For example, recent studies showed that smartphone-based DIC systems successfully detect pollutants in water through colorimetric reactions. One such system detects total nitrogen (TN) levels by adding specific reagents to the water sample to convert total nitrogen into a colored compound. A smartphone captures the intensity of this generated color, and RGB values are extracted to establish a calibration curve showing the relationship between nitrogen concentration and decrease in the blue channel value [12]. Another study used a smartphone camera to capture images of water samples, with software analyzing the images to measure pollutants like nitrite, ammonia nitrogen, and total phosphorus. The analysis relies on color changes and a calibration curve linking colors to pollutant concentrations [13].
In environmental sensing, DIC has also been applied beyond water analysis. For instance, a study by Zamora showed that polluted air scatters more blue light, making the skies appear whiter. This effect can be quantified using smartphone images to classify the atmosphere as either clean or polluted [14]. Similarly, Sarikonda and Kanchi demonstrated similar techniques in healthcare diagnostics [15,16].
The reliability of environmental monitoring systems largely depends on the accuracy of the sensor data. Therefore, there has been growing interest in plasmonic colorimetric sensors which utilize noble metal nanoparticles, such as gold and silver [17]. These materials exhibit excellent sensitivity to changes in their surrounding medium when functionalized to bind with specific analytes [18,19]. When binding happens, the substrates experience a shift in the localized surface plasmon resonance (LSPR), acting as a band-stop color filter on the spectrum of the incident light. This leads to a visible color change in the transmitted light when the target analyte is present [20,21,22,23]. Traditionally, such LSPR shifts are observed using spectrometers to measure the spectrum and track the peak wavelength change, which limits field applicability [24].
Recent research has demonstrated the effectiveness of smartphone-based colorimetric systems for detecting heavy metals in water using nanoparticles [25,26]. Firdaus et al. developed a paper-based device using silver nanoparticles (AgNPs) to detect mercury (Hg2+), analyzed via smartphone and mobile app. This portable system demonstrated good sensitivity, achieving a low detection limit of 0.86 ppb [27]. Also, Aqillah et al. used gold nanoparticles (AuNPs) to detect copper ions (Cu2+), where color changes were captured by smartphone and analyzed with ImageJ software (version 1.52a), achieving 97.6% accuracy compared to UV–vis spectrophotometry [28]. Furthermore, Gan et al. introduced a method for cadmium (Cd2+) detection using aptamer-functionalized AuNPs and a smartphone-based system that analyzed red-to-blue pixel intensity ratios for rapid, on-site measurement within 10 min [29].
Previous works often relied on offline image analysis tools (such as ImageJ, MATLAB, or manual ratio checks) and manual calibration. To enhance this process, we propose a general purpose app and cloud pipeline integrated within the BioColor platform. This new system is compatible with any plasmonic substrate functionalized with ions such as mercury, copper, cadmium, and others that produce a color shift.
BioColor aims to bridge the gap between advanced plasmonic sensing and the practical demands of environmental monitoring. It combines AuNP-based plasmonic papers fabricated as described in [30,31], cloud-based data storage, and image processing. It features an intuitive app for results visualization and data management. The platform analyzes captured sensor images in real-time using optimized image processing algorithms, including region-of-interest segmentation, color extraction (mean and dominant), and comparison using the CIEDE2000 metric.
In a previous publication [32], we detailed the BioColor image processing techniques and color comparison methods, eliminating the need for spectrometers and desktop software. In a following work [33], we used the BioColor approach to analyze the color of light transmitted through plasmonic papers of gold nanoparticles in different solutions (water, ethanol, glycerol) with varying refractive indices. The results demonstrated a direct correlation between color changes and refractive index variations.
In this article, we now focus on the BioColor system from a computer science perspective, presenting its system architecture, cloud connectivity, and the development of the mobile app, showing how components work together to deliver a user-friendly, low-cost plasmonic sensor readout system. Section 3 summarizes the experimental study that used different sensor images, as well as a usability test conducted with 12 participants to evaluate their experience with the BioColor app.

2. Materials and Methods

2.1. System Architecture

The BioColor system is designed to read and interpret colorimetric changes in plasmonic papers using a smartphone and cloud-based processing. The sensing process and system architecture are illustrated in Figure 1a,b, respectively.
Figure 1a demonstrates the LSPR sensing principle. When a beam of incident light in the UV-Vis range passes through the gold nanoparticles (AuNPs) plasmonic paper, certain wavelengths are filtered out depending on the surrounding refractive index. This filtering effect, known as LSPR, creates a unique colorimetric signature in the transmitted light. When specific analytes bind to the AuNPs, they change the surrounding refractive index, causing a shift in the LSPR peak and a visible color change in the transmitted light. Traditionally, such spectral changes are measured using laboratory spectrometers, as shown in the inset on the bottom right.
The BioColor system simplifies this process by employing smartphone-based image processing techniques to analyze the color shift in the transmitted light, eliminating the need for expensive spectrometers. An overview of the system architecture is presented in Figure 1b, which consists of four main components:
  • Experimental setup, including LSPR samples made from AuNPs plasmonic papers, a halogen lamp positioned directly above the samples, and a CMOS camera placed below to capture the transmitted light. This top-down lighting and bottom-up imaging configuration minimizes external light variability.
  • Hosting database that securely stores the captured images using Firebase cloud service.
  • Mobile application that displays the images of the samples along with the corresponding sensing results.
  • API server that handles the image processing algorithms.
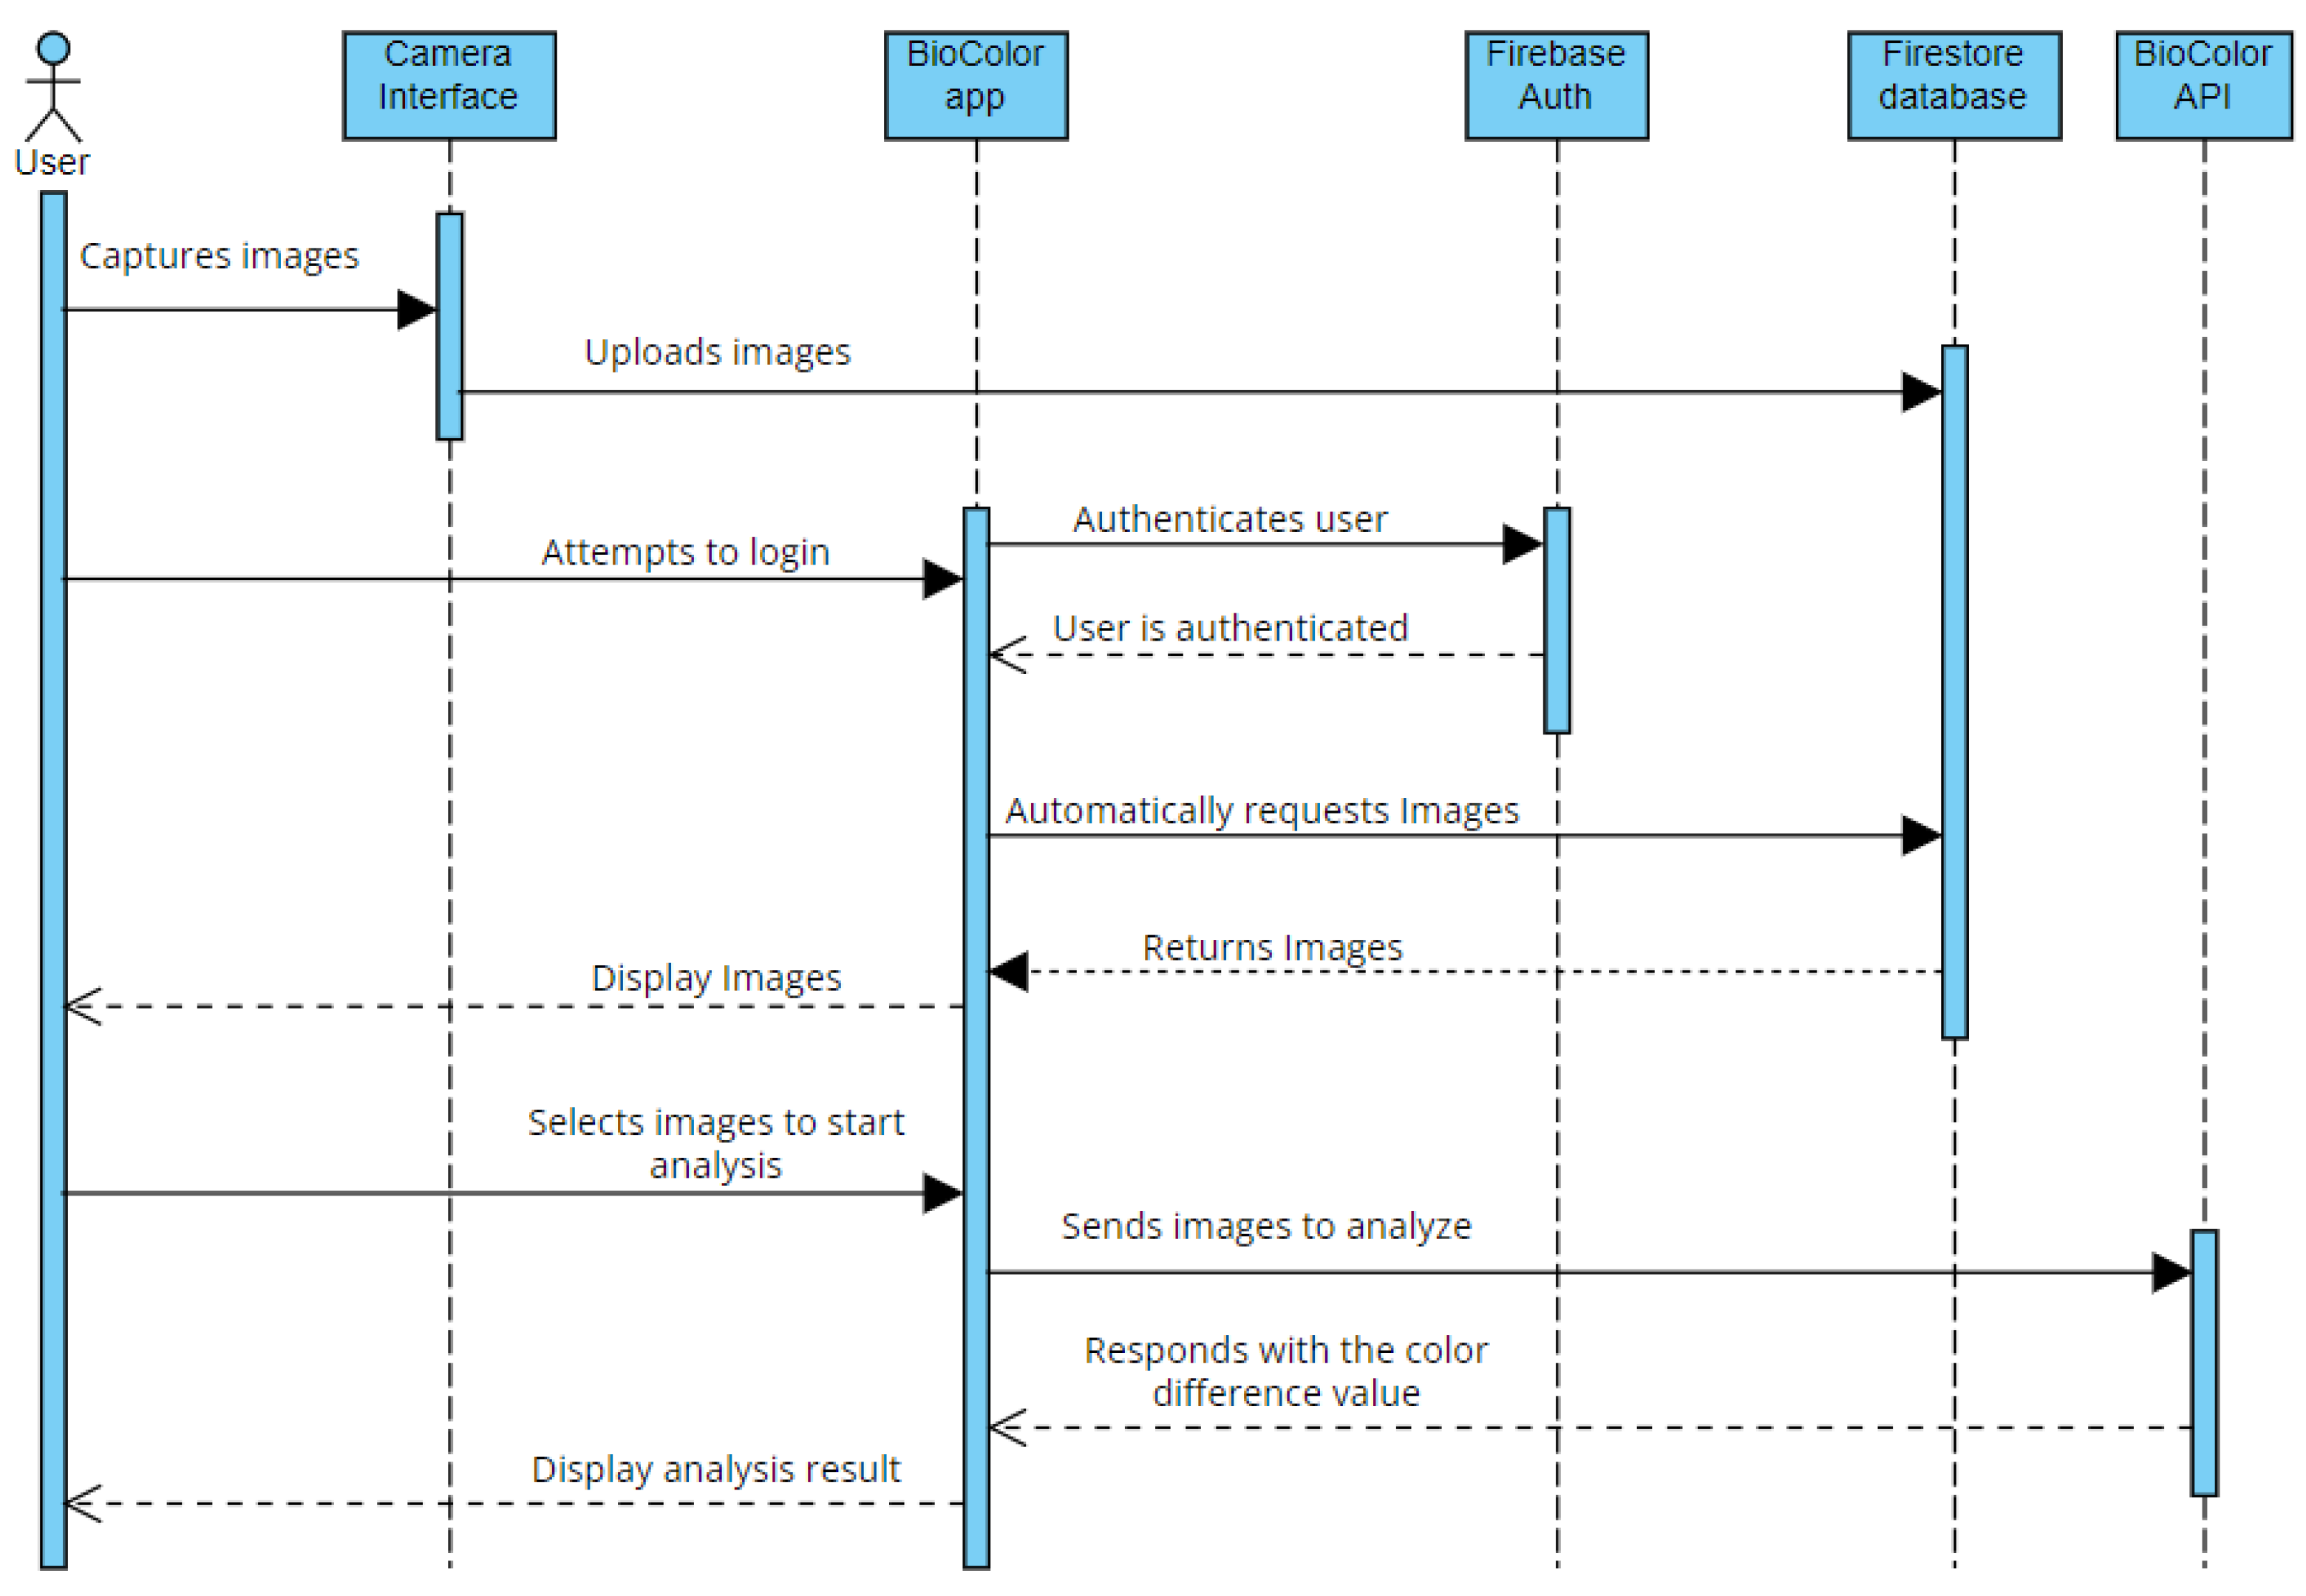
The user’s interaction with the platform is illustrated as a sequence diagram in Figure 2. The user runs the CMOS camera interface to capture images of samples by manually choosing the exposure and RGB gains to prevent automatic adjustments between samples. Once an image is captured, the user has the option to upload it to the Firebase database. In the mobile app, authenticated users can view the uploaded images, select them for analysis, and send them to the API server for processing. The server returns the analysis results to the mobile app, showing the detected color differences of the compared samples.

2.2. Firebase Database

Firebase is a development platform that provides developers with various tools and services for deploying web and mobile applications [34]. In this work, the services utilized include Firestore database, Storage, and Authentication.
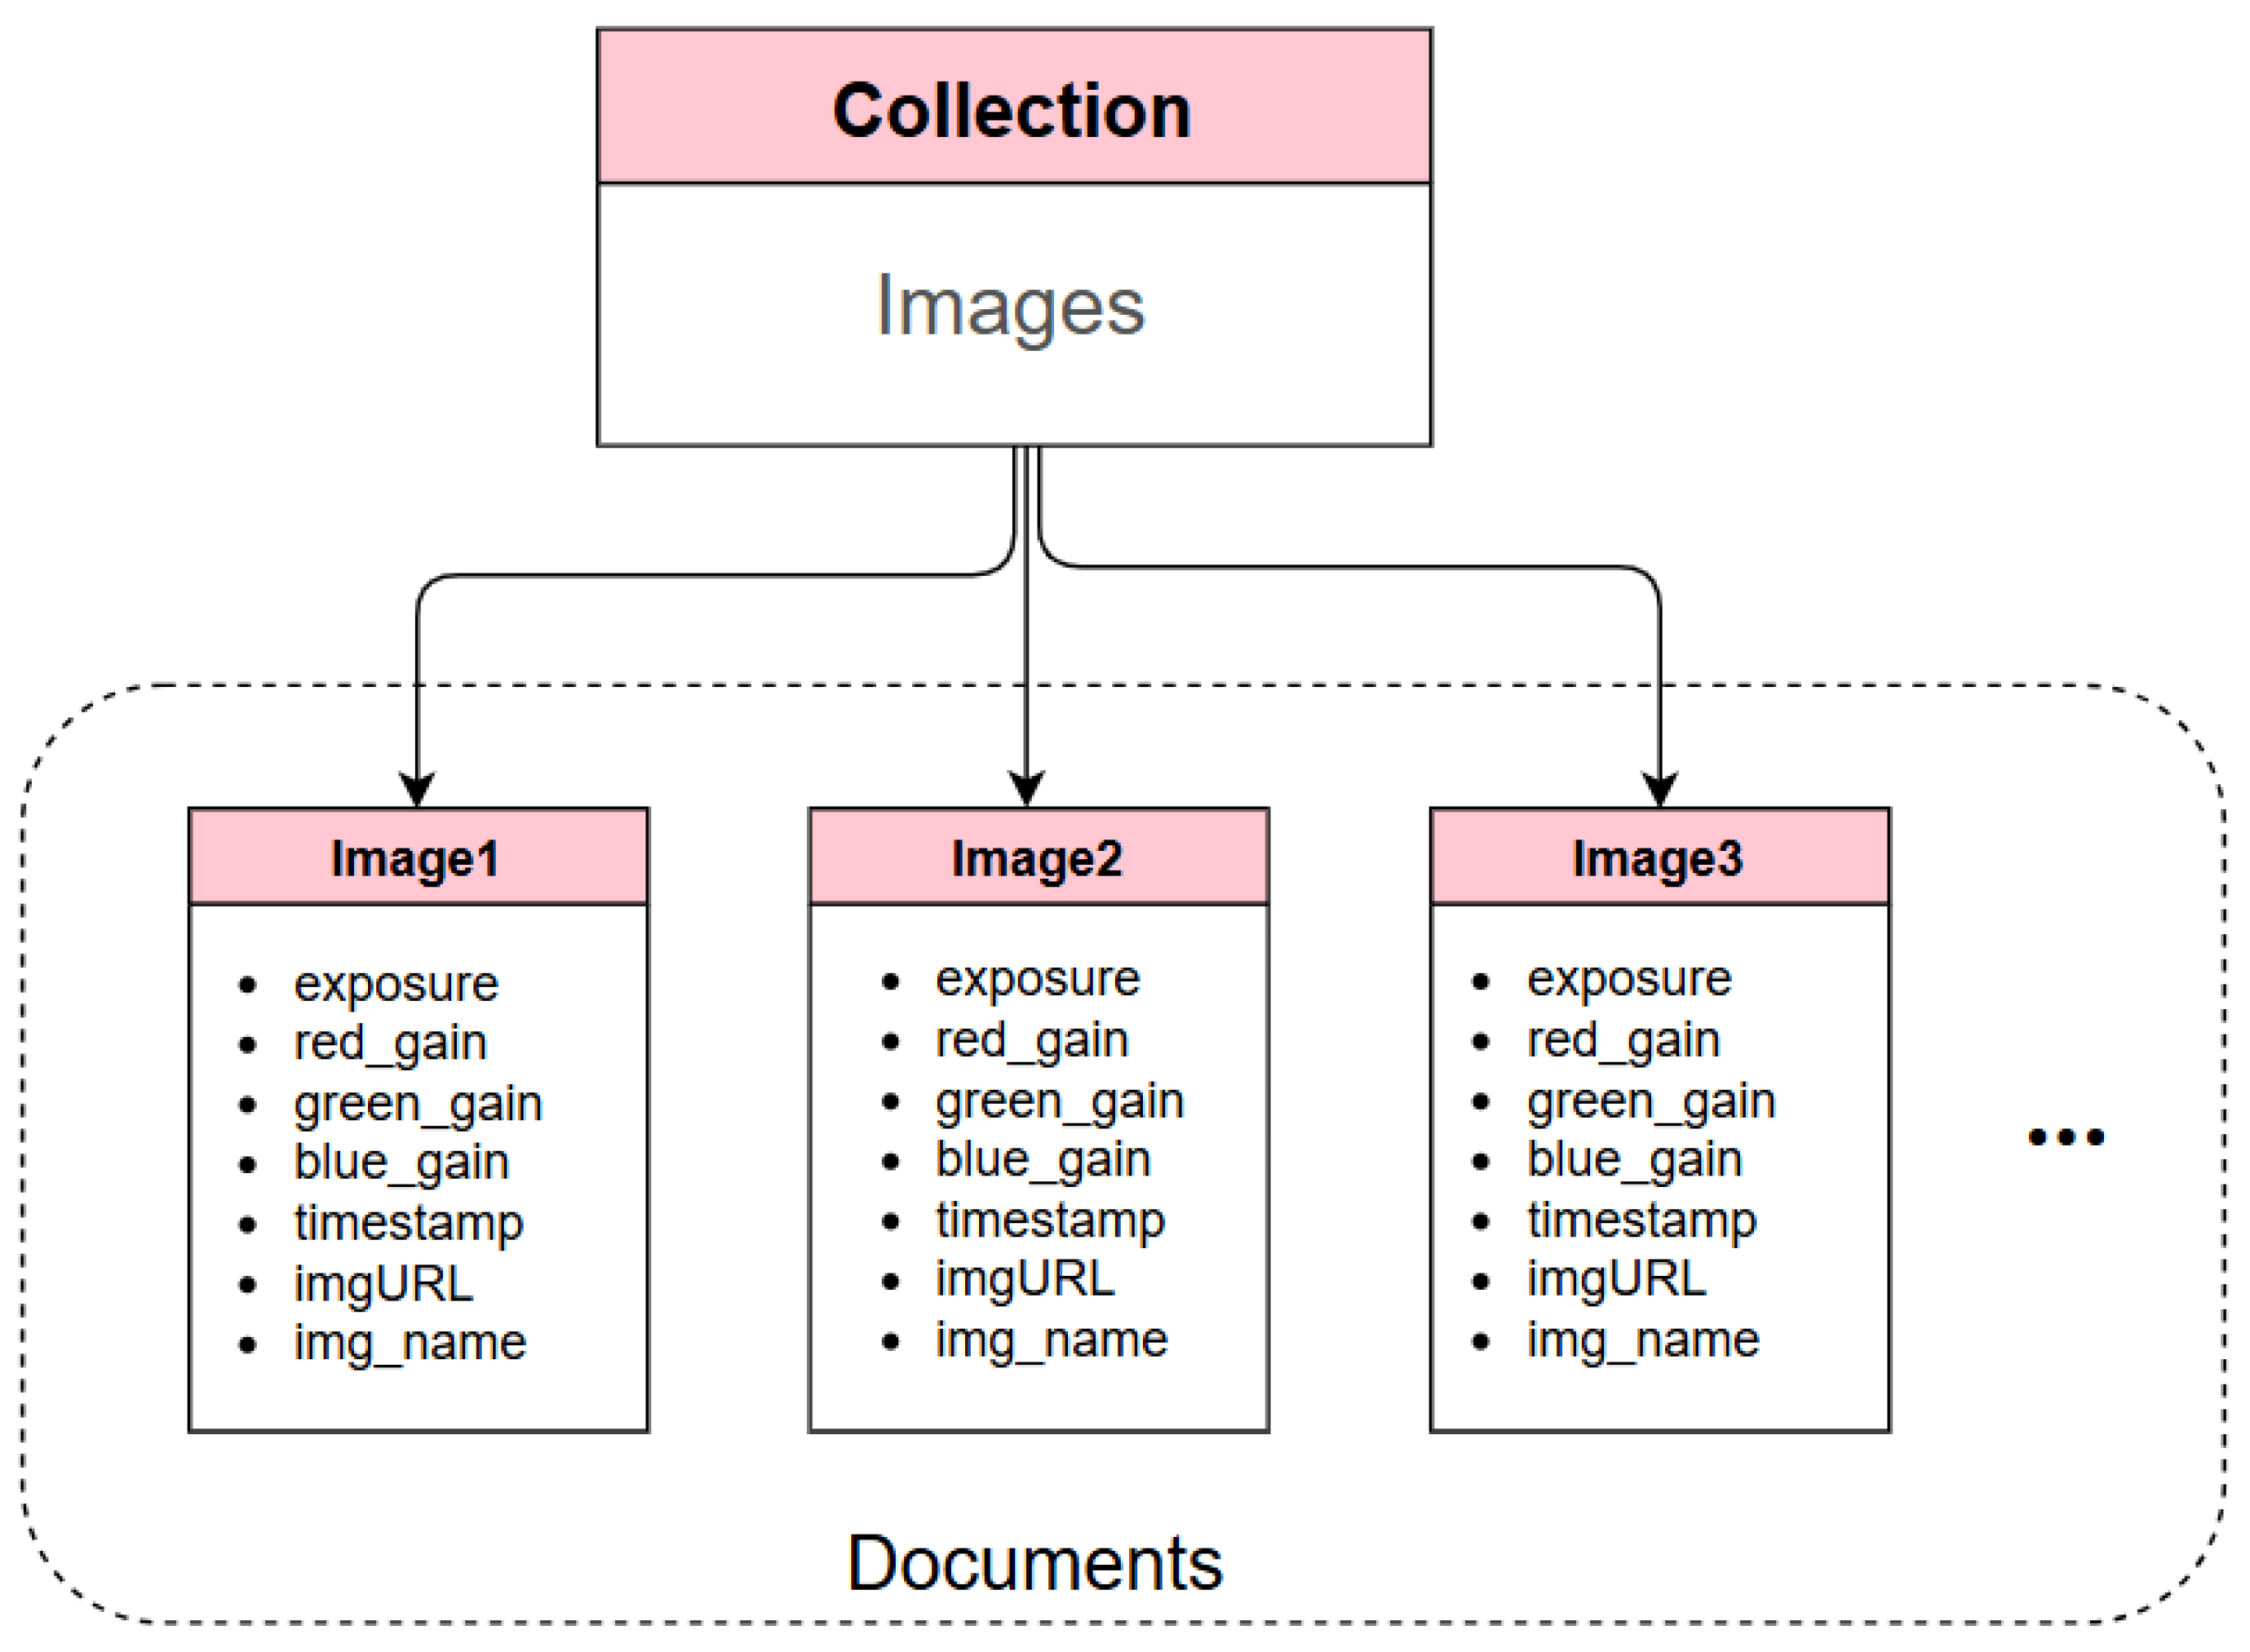
Cloud Firestore is a NoSQL database that stores data in documents organized into collections. Each document contains metadata fields that are mapped to specific values. Figure 3 shows the “images” collection, where each document represents a sample image and its associated metadata.
Firebase Storage is designed to securely store and serve various types of files, including images, videos, audio, and documents, in a scalable manner. When the user captures an image using the camera interface, the image is uploaded to Firebase Storage. Firebase then generates a URL of the file location which is stored in the “imgURL” field along with the image metadata (camera settings and timestamp) in a new document within the “images” collection. This information is also displayed in the BioColor app, allowing users to verify the acquisition conditions and ensure transparency and repeatability. Each time a new image is captured and added to the Firestore database, the mobile app is automatically updated using Firestore’s real-time listeners. This feature is very valuable as it ensures efficiency and flexibility by delivering a data snapshot only when a document is added, modified, or removed, eliminating the need to fetch the entire database for every change.
Firebase Authentication is a token-based authorization system that allows users to authenticate using popular platforms like Twitter, Facebook, and Google, as well as using their email addresses and passwords. In this work, we use the email/password method for user registration and login to the BioColor mobile app.

2.3. Mobile App

BioColor is a mobile application designed to help users, including healthcare providers and environmental scientists, interact with a biosensor system and visualize results related to the materials being sensed. The app represents an adaptable structure that allows for continuous refinements and the integration of future inventions.
BioColor offers two approaches for comparing sample colors: (1) Analyzing three different samples displayed as a stripe within a single image or (2) comparing a single sample from one image to a single sample from another image. In the future, the number of samples and the way they are presented in the captured image may be adjusted based on the user’s needs.
The BioColor app is built using the Flutter framework. We chose Flutter because it is a complete software development kit (SDK) that includes everything needed to create applications for multiple platforms, such as libraries, documentation, APIs, and frameworks [35]. In Flutter, everything is a widget; these widgets are organized in a tree structure. Each widget has access to its own context (location) and that of its parent in the tree using the ‘BuildContext’ object from the ‘build()’ method. This is important for state management in Flutter applications.

Flutter BLoC State Management

BLoC (Business Logic Component) is a design pattern developed by Google to separate business logic from the presentation (UI) layer, making it easier to reuse code efficiently as it expands [36]. While the pattern is named after the BLoC itself, it is typically part of a larger three-layer architecture:
  • The User Interface (UI) layer contains all widget files.
  • The Business Logic Component layer contains all BLoCs.
  • The Repository layer (or data layer) handles the communication with external databases and APIs.
Figure 4 represents the overall layered architecture of the BioColor app.
The UI layer contains the widget tree of the application. It can only communicate with the Business Logic layer through streams of events and states. The widgets are grouped in pages (screens) which are described in Table 1 and visualized in Figure 5.
The Business Logic layer serves as an intermediary between the UI and the Repositories. The app implements three BLoCs: (1) Sample for the Home page, (2) Analysis for the Analysis page, and (3) Result for the Result page. The BloCs and their responsibilities are detailed in Table 2.
The Repository layer acts as the intermediary between the data sources (such as Firebase and APIs) and the BLoCs. The repository’s main role is to fetch, cache, and manage data, keeping the business logic separate from the data source. The app implements two repositories: (1) Sample, which handles the communication with the Firebase data source, and (2) Result, which communicates with the API server. The repositories and their responsibilities are detailed in Table 3.

2.4. BioColor Flask API

The BioColor backend server is a RESTful API built using the Flask framework in Python (version 3.12.4). RESTful APIs follow a set of rules for efficient web communication, and Flask is a lightweight and flexible framework that simplifies the development of web applications and APIs in Python [37]. The BioColor Flask API is hosted on the PythonAnywhere cloud-based platform [38]. It provides a hosting solution for Python web applications and scripts. We chose PythonAnywhere because it manages the server infrastructure, allowing us to focus on developing the API without the need to handle server setup, maintenance, or deployment.
The BioColor API allows the BioColor mobile app to access and utilize its image analysis resources. These resources are accessed through specific endpoints, each corresponding to a unique URL. The API utilizes routing to direct incoming HTTP requests from the mobile app to the appropriate processing functions and modules. The functionality and the structure of the BioColor API are illustrated in Figure 6.
For single-image analysis, such as comparing three samples within one image, the request body includes the image’s Firebase storage location (imgURL) and the chosen color comparison method (“mean” or “dominant”). The API retrieves the image, processes it using the (compareOneImage()) function from the (image_processing_one_image.py) module, and returns the analysis results in the HTTP response body, along with a status code in the header indicating success or failure.
When comparing two separate images, the request body contains the Firebase Storage locations of both images (imgURL1, imgURL2) and the selected comparison method. The API obtains these images, performs the comparison using the (compareTwoImages()) function from the (image_processing_two_images.py) module, and similarly returns the analysis results and status code in the HTTP response.

2.5. Image Processing and Color Analysis

The image processing algorithms are run on the Flask server hosted on the PythonAnywhere platform. As mentioned earlier, the algorithms were detailed in our previous publication [32]. The images captured by the CMOS camera are not ready to perform color comparison directly; that is, they contain an uninteresting black area surrounding the samples. Hence, image preprocessing is needed to detect the sample region in the image. The preprocessing comprises: (1) Region of interest (ROI) detection and cropping, followed by (2) ROI segmentation to identify the rectangular samples, and (3) sample color calculation to represent the sample in a single color, mean, or dominant. Figure 7 shows a captured image of three rectangular samples with the outcome of each processing step to prepare the image for color comparison. The algorithms are implemented using the scikit-image library in Python [39].
In Appendix A, for the first step, the ROI detection and Cropping algorithm flowchart is illustrated in Figure A1. Then, for the second step, the ROI segmentation algorithm flowchart is displayed in Figure A2. Finally, the sample color is calculated using two methods, the mean color is shown in Figure A3 and the dominant color is shown in Figure A4.

3. Results

To evaluate the BioColor platform, two types of assessments were performed. The first assessment focused on the image processing algorithms, testing them with various sample images captured in different surrounding mediums. The second assessment is the user experience evaluation to test the system’s usability.

3.1. Image Processing Evaluation

This section introduces a summary of the experimental study results reported in [33]. The study examined the BioColor image processing algorithms to detect changes in the color of the transmitted light through substrates made of AuNP plasmonic papers, which were exposed to mediums with increasing refractive index. A halogen lamp served as the light source, and the following conditions were tested:
  • A dry substrate with a refractive index of 1.0.
  • A substrate moistened with water, which has a refractive index of 1.33
  • A substrate moistened with a mixture of glycerol and ethanol, referred to as sol.4, with a refractive index of 1.44.
  • A substrate moistened with glycerol, having a refractive index of 1.47.
The images of the substrates are analyzed, and the color difference is calculated between each pair of samples, as shown in Table 4. The color comparison is performed using the mean and the dominant color methods.
The results of the mean color method outperform the dominant color method by showing a bigger color difference when there is a greater variation in the refractive index, and smaller when the variation is minimal. These findings are consistent with the work reported by Serafinelli et al., who measured spectral shifts using spectrometers. In their study [31], Figure 7a shows how the transmittance spectra of plasmonic papers change when immersed in solutions of different refractive indices, while Figure 7b shows the link between the lowest transmittance wavelength and the refractive index, supporting the observed color changes.
The mean color method considers all colors in the image, capturing small pixel color changes, while the dominant color ignores minor differences by focusing only on the most prevalent color.
This experiment is important for detecting analytes, as changes in refractive index are commonly induced by analyte binding events in functionalized LSPR systems. For instance, if a substrate is functionalized to detect specific analytes, such as heavy metal ions, these analytes can induce a change in the refractive index. In such cases, BioColor can accurately measure the resulting color shift. This feauture makes BioColor broadly compatible with functional LSPR biosensors.
Building on these outcomes, our goal is to implement the BioColor approach for monitoring water quality. While we have not yet performed specific tests to detect contaminants in water, upcoming experiments will include AuNP plasmonic paper substrates functionalized with selective reagents designed to detect heavy metal ions, which will allow us to measure pollution levels in water samples. There have been successful applications reported for detecting copper and mercury in various water samples using paper-based noble metal nanoparticles [40,41].

3.2. User Experience Evaluation

The user experience evaluation test is performed to collect users’ feedback regarding their experiences using the BioColor mobile app. It aims to evaluate usability, functionality, and user satisfaction to improve the BioColor interface. After a briefing on the objectives, the users received a questionnaire to guide them through the testing process. This questionnaire outlines the tasks to be completed and includes questions to answer after each task. All participants had their first experience with the application during the test and used it under similar conditions. The tests were supervised to enable notetaking on how users performed and to document any issues or feedback they shared.
This questionnaire was divided into four sections. The first section collected information about participants, including age, job role, and experience with similar analytical applications. In the second section, participants were guided through a series of seven tasks designed to explore the application’s interface. These tasks were as follows:
  • User registration process using email and password;
  • Understanding the types of captured sample images;
  • Viewing image camera settings;
  • Performing color comparison (three samples displayed in one image);
  • Understanding analysis results (three samples displayed in one image);
  • Performing color comparison (one sample image compared to one sample image);
  • Understanding analysis results (one sample image compared to one sample image).
Following each task, participants rated the difficulty of completing it using a 5-point Likert scale, where 1 indicated ‘Strongly Disagree’ and 5 indicated ‘Strongly Agree.’ The third section of the questionnaire included the System Usability Scale (SUS), a standard 10-question tool used to assess system usability. The fourth section featured an open-ended question, encouraging participants to share their overall opinion of the interface and suggest potential improvements. The results from each section are presented and discussed in the following sections.

3.3. Participant Information

The tests were conducted anonymously with 12 voluntary participants. According to Jakob Nielsen [42], qualitative usability studies require 5 to 7 users to identify major issues. Therefore, our group of 12 is within the recommended range of 5 to 15 for preliminary evaluations. The participants were carefully selected from relevant fields, including Ph.D., Master’s, and undergraduate students, professors, and professionals, primarily from the fields of electronics, computer science, chemistry, and biomedical engineering. The data show that:
  • 25% (3) of participants were under 21 years old;
  • 33.3% (4) were between 22 and 31 years;
  • 8.3% (1) were between 32 and 41 years;
  • 16.7% (2) were between 42 and 51 years;
  • 16.7% (2) were between 52 and 61 years.
This indicates the participants represented a wide range of ages. They were asked about their familiarity with similar analytical mobile applications. The responses indicated the following: (5) 41.7% reported being ‘Not Familiar,’ (1) 8.3% were ‘Somewhat Familiar,’ (4) 33.3% were ‘Neutral,’ (1) 8.3% were ‘Familiar,’ and (1) 8.3% indicated they were ‘Very Familiar’ with such applications.

3.4. Task Testing

Participants were asked to complete seven tasks exploring the BioColor app and evaluate how easily they found each task on a scale from 1 (Strongly Disagree) to 5 (Strongly Agree). Table 5 summarizes task responses by mean, standard deviation, and mode.
  • Mean: Indicates if users found tasks easy or difficult. For example, a mean of 4.2 suggests tasks were generally easy.
  • Standard Deviation: Shows variation in responses. For instance, a value of 0.34 indicates similar opinions, while a value of 1.10 represents mixed opinions, with some users finding the task easy and others finding it difficult.
  • Mode: Represents the most frequently chosen response.

3.5. System Usability Scale (SUS) Responses

The System Usability Scale questionnaire was created by John Brooke in 1986 [43]. It is used to evaluate the usability of products, services, websites, applications, and any other type of interface. The evaluation is measured using the SUS score, which is a single number between 0 and 100. Scores above 80.3 indicate excellent usability, while scores below 51 suggest poor usability.
The SUS questionnaire consists of 10 questions, with users rating each question on a scale from 1 (Strongly Disagree) to 5 (Strongly Agree):
  • I think that I would like to use this system frequently.
  • I found the system unnecessarily complex.
  • I thought the system was easy to use.
  • I think that I would need technical support to use this system.
  • I found the various functions in this system well integrated.
  • I thought there was too much inconsistency in this system.
  • I would imagine that most people would learn to use this system quickly.
  • I found the system very cumbersome to use.
  • I felt very confident using the system.
  • I needed to learn a lot of things before I could start using the system.
Table 6 summarizes the SUS responses obtained from the participants.
BioColor registered an SUS score of 93, which is excellent. This indicates that users had a highly positive experience, indicating good usability and satisfaction with the system. The calculation method is explained in [44].

4. Discussion

4.1. Analysis of Task Testing and Usability Results

Most participants found the app simple and easy to use. Looking at Table 5, in particular, the registration process (task 1), viewing image details (task 3), and performing analyses for three samples in one image (task 4), had standard deviations (SDs) less than 1, indicating consistent user opinions.
However, there were mixed opinions on the other tasks. For instance, task 2, understanding the image types on the Home page, had an SD of 1.11. This variation is due to the inconsistencies in the number of samples per image. This originates from the sample testing experiences we performed; however, image standardization is planned for future versions of the app. Task 5, registered an SD of 1.04 as few participants were confused by the color difference graph on the result page (see Figure 5f). The graph illustrates the color differences between samples 1 and 2, as well as between samples 1 and 3, but it does not show the difference between samples 2 and 3. It was clarified that sample 1 serves as a reference for comparison.
In task 6, the standard deviation (SD) was 1.05, indicating that some users faced difficulties while comparing colors between two sample images. The issue was the absence of workflow guidance. Therefore, it was suggested that the selection of images containing one sample must be simplified by prompting the user to select a second image by automatically returning to the Home page.
Regarding the system usability in Table 6, question 1 had an SD of 1.35, as many users reported they would not use the app frequently, which is understandable given the app’s technical focus.
Also, some users felt that they might need technical support to use the app effectively, and this explains the SD of 1.22 in question 4. Question 6 registered an SD of 1.10, referring to system inconsistency; this is likely caused by the two different image types and their displayed comparison results. To address this, users recommended verifying the image type before processing and using larger font sizes for results labels to improve readability.
Additionally, a few users noted that the analysis process was slow and suggested introducing percentage progress bars to inform users about ongoing background analysis.
Finally, during the assistance of participants in completing tasks, it was observed that older users faced more difficulties when using the BioColor app compared to younger users. Several factors contribute to this difference. Generally, younger users adapt quickly to new user interface (UI) designs due to their familiarity with technology, while older users may require more time to understand workflows and navigation.

4.2. Limitations and Future Considerations

The BioColor system shows good results in controlled tests; however, some limitations need to be addressed before application in real-world scenarios. First, field conditions like rain, wind, and changing light conditions can interfere with image capture and sensor accuracy. One solution is to create a compact sensing setup inside a lightproof box. For instance, the current CMOS camera could be replaced with a smaller, portable camera, such as Arducam integrated with an Arduino board. This new setup might introduce compromises in image quality and power consumption, which could impact long-term or frequent monitoring.
Second, paper-based plasmonic substrates are cost-effective and easy to produce, but they are typically designed for single use, necessitating frequent replacement. In practical applications, many substrates could be pre-functionalized and packaged with the device and accompanied by clear replacement instructions. Another important consideration is that the substrates will come into contact with water samples. Therefore, the box design must allow easy access, such as having a removable side panel.
Finally, practical issues such as mobile connectivity (like 4G/5G) and occasional internet access for cloud services should also be considered.

5. Conclusions

This paper introduced BioColor, an innovative system that integrates several key technologies to create a complete and accessible solution for environmental monitoring. The core innovation of BioColor lies in connecting advanced plasmonic LSPR sensing with the accessibility of smartphones and the power of cloud computing.
This work focused on the computer science aspects of the system, including system architecture, cloud connectivity, and the development of the mobile app. The system was successfully validated by consistently detecting changes in transmitted light color related to the LSPR effect when analyzing images of substrates exposed to media with different refractive indices. We consider these results to be a proof-of-concept demonstration of BioColor’s ability to convert complex sensor data into simple color readouts on a phone, without the need for costly spectrometers that are often impractical for field use.
Additionally, a questionnaire assessing user experience was conducted with 12 participants to evaluate the system’s usability and functionality. Overall, the BioColor app received generally positive feedback in terms of usability and user experience. The overall SUS score of 93 showed that the app is easy to use. However, some areas need improvement, such as processing speed, app-server connectivity, and workflow for processing multiple images.
Although current testing focused on simple refractive index changes, the platform is designed to be compatible with more advanced, functionalized plasmonic substrates for detecting specific pollutants such as heavy metals. Future work will involve integrating analyte-specific reagents that induce visible color changes, allowing BioColor to measure these changes and estimate concentrations directly in the field, scaling on a TRL5 prototype.

Author Contributions

R.M. was responsible for the conceptualization, methodology, software development, investigation, data collection, formal analysis, and writing of the original draft; C.S. contributed to writing the introduction and assisted in refining the background section; R.J. and A.F. provided supervision and validation, and contributed to reviewing and editing the manuscript. All authors read and approved the final manuscript.

Funding

This work was supported by Portuguese national funds through the Fundação para a Ciência e a Tecnologia (FCT), under the grants 2022.13579.BD (https://doi.org/10.54499/2022.13579.BD), NOVA Laboratory for Computer Science and Informatics (NOVA LINCS), UIDB/04516/2020, and 2021.09347.BD, Center of Technology and Systems (CTS), UIDB/00066/2020 and UIDP/00066/2020. It was also supported by project IPL/IDI&CA2023/LUMINA, ISEL.

Institutional Review Board Statement

All participants provided informed consent. Ethical review and approval were waived for this study due to the fact that participants were only asked to use a mobile application and give their opinion anonymously. All participants agreed to take part on a voluntary basis.

Informed Consent Statement

The survey did not involve identifiable personal data, and all responses were collected anonymously. Informed consent was obtained from all subjects involved in the study and participation in the study was voluntary. By agreeing to take part in the study, the participants gave their consent. The data were collected through an anonymous questionnaire and only a few statistics on the anonymous data are presented in the article.

Data Availability Statement

The raw data supporting the conclusions of this article will be made available by the authors on request.

Conflicts of Interest

The authors declare no conflicts of interest.

Abbreviations

The following abbreviations are used in this manuscript:
PPBParts Per Billion
DICDigital Image Colorimetry
LSPRLocalized Surface Plasmon Resonance
AuNPsGold Nanoparticles
APIApplication Programming Interface
CMOSComplementary Metal-Oxide-Semiconductor
URLUniform Resource Locator
NoSQLNon-Structured Query Language
SDKSoftware Development kit
BLoCBusiness Logic Component
UIUser Interface
RESTfulfull-Representational State Transfer
HTTPHyper-text Transfer Protocol

Appendix A. Image Processing Techniques

Appendix A.1. ROI Detection and Cropping
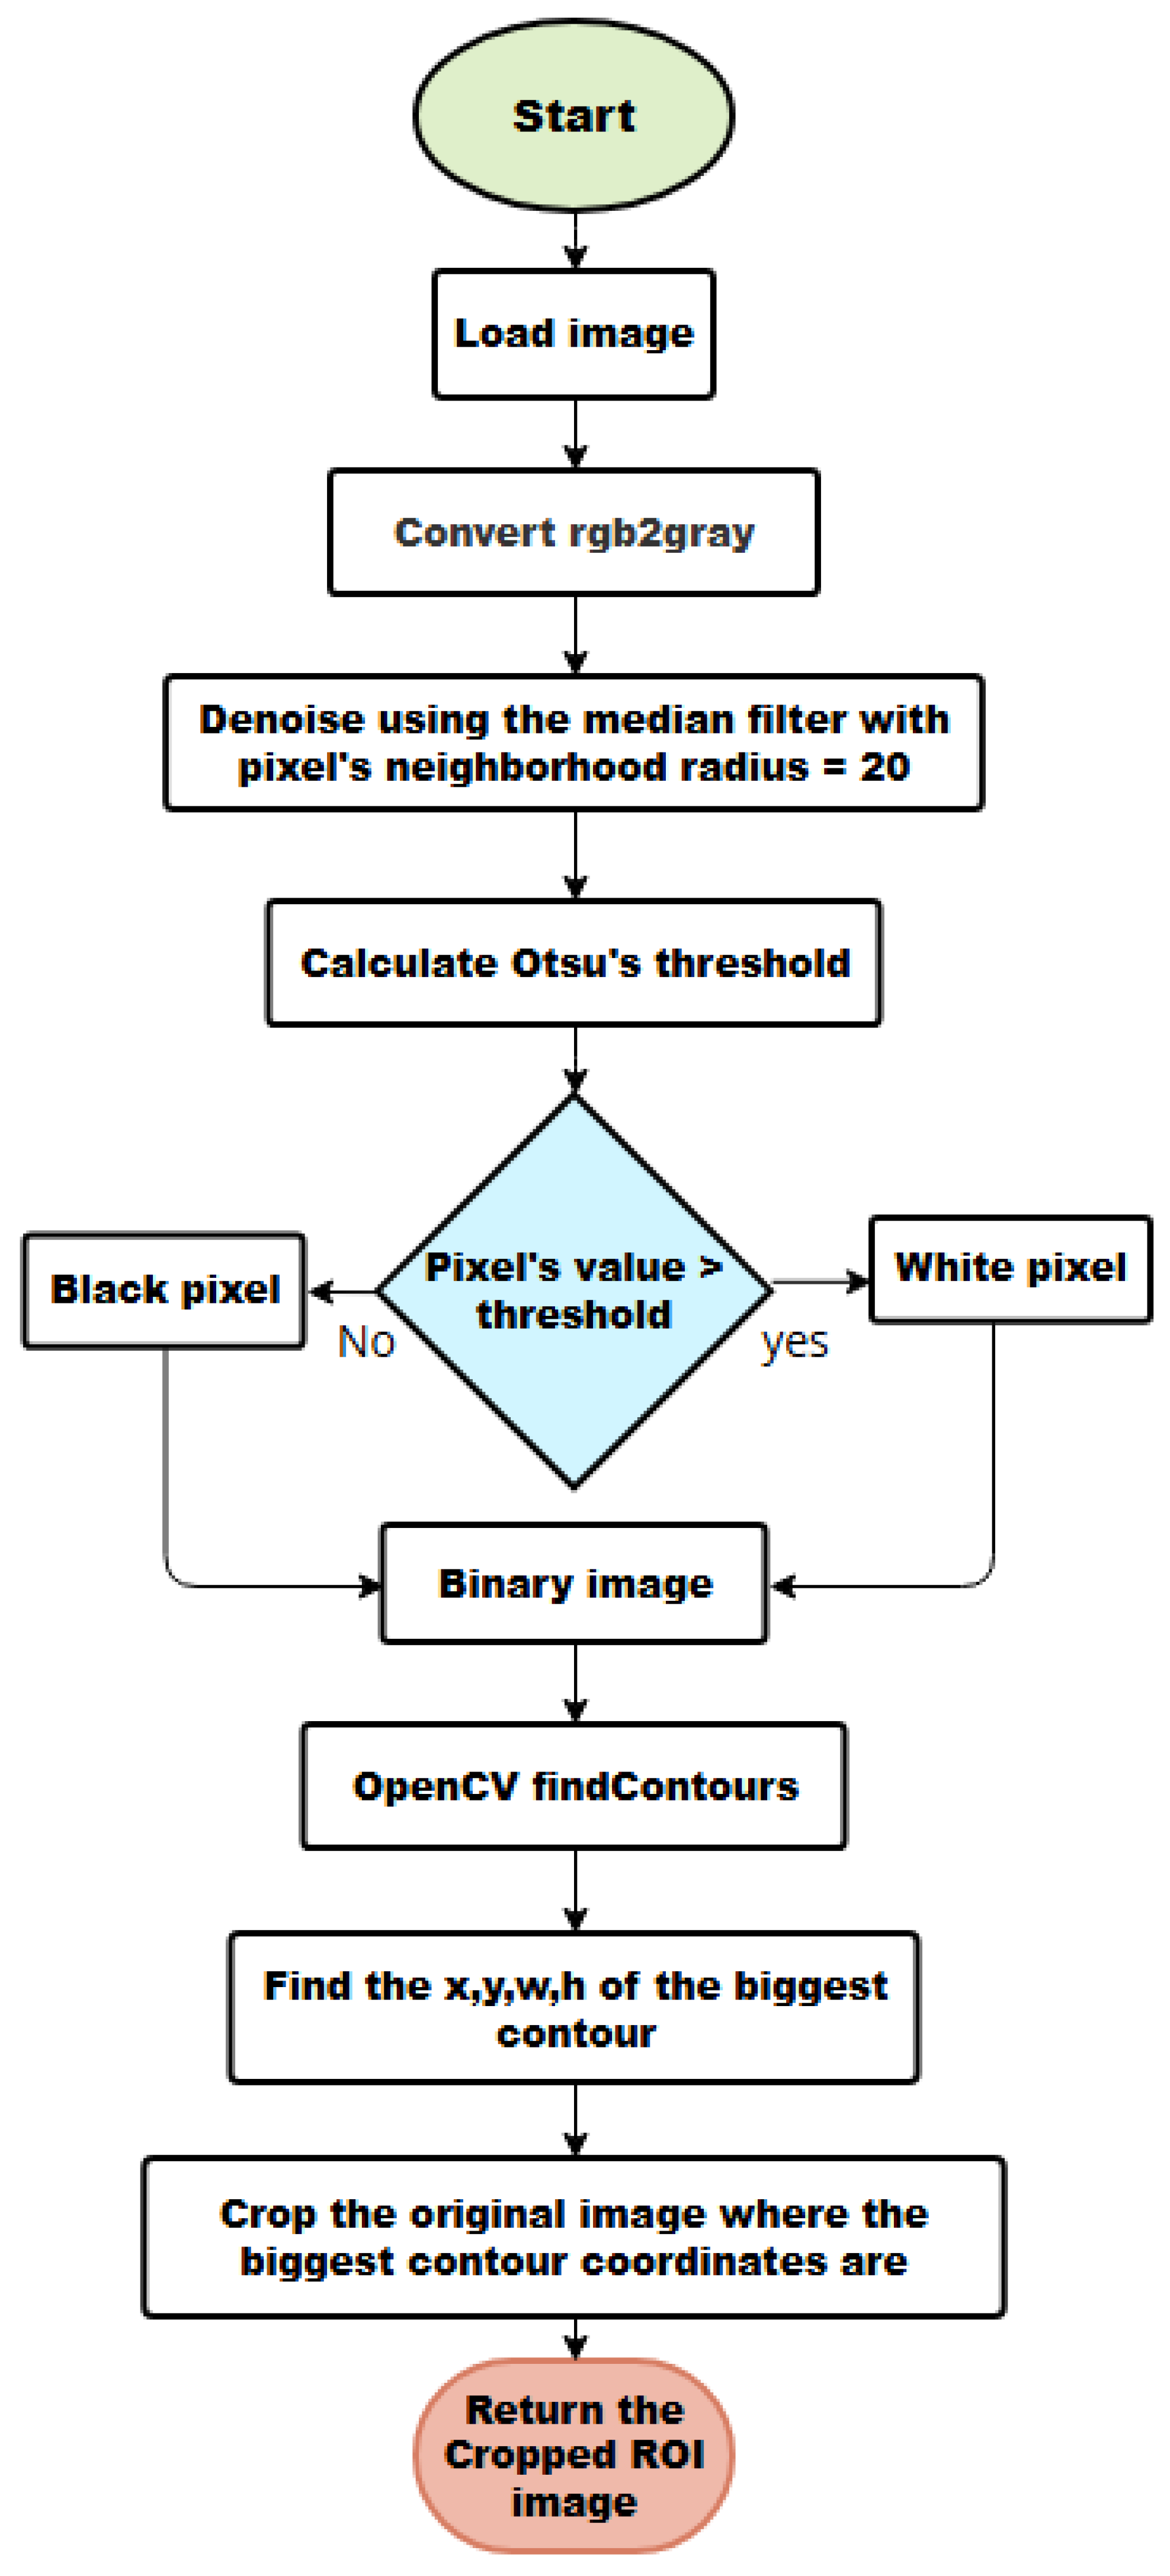
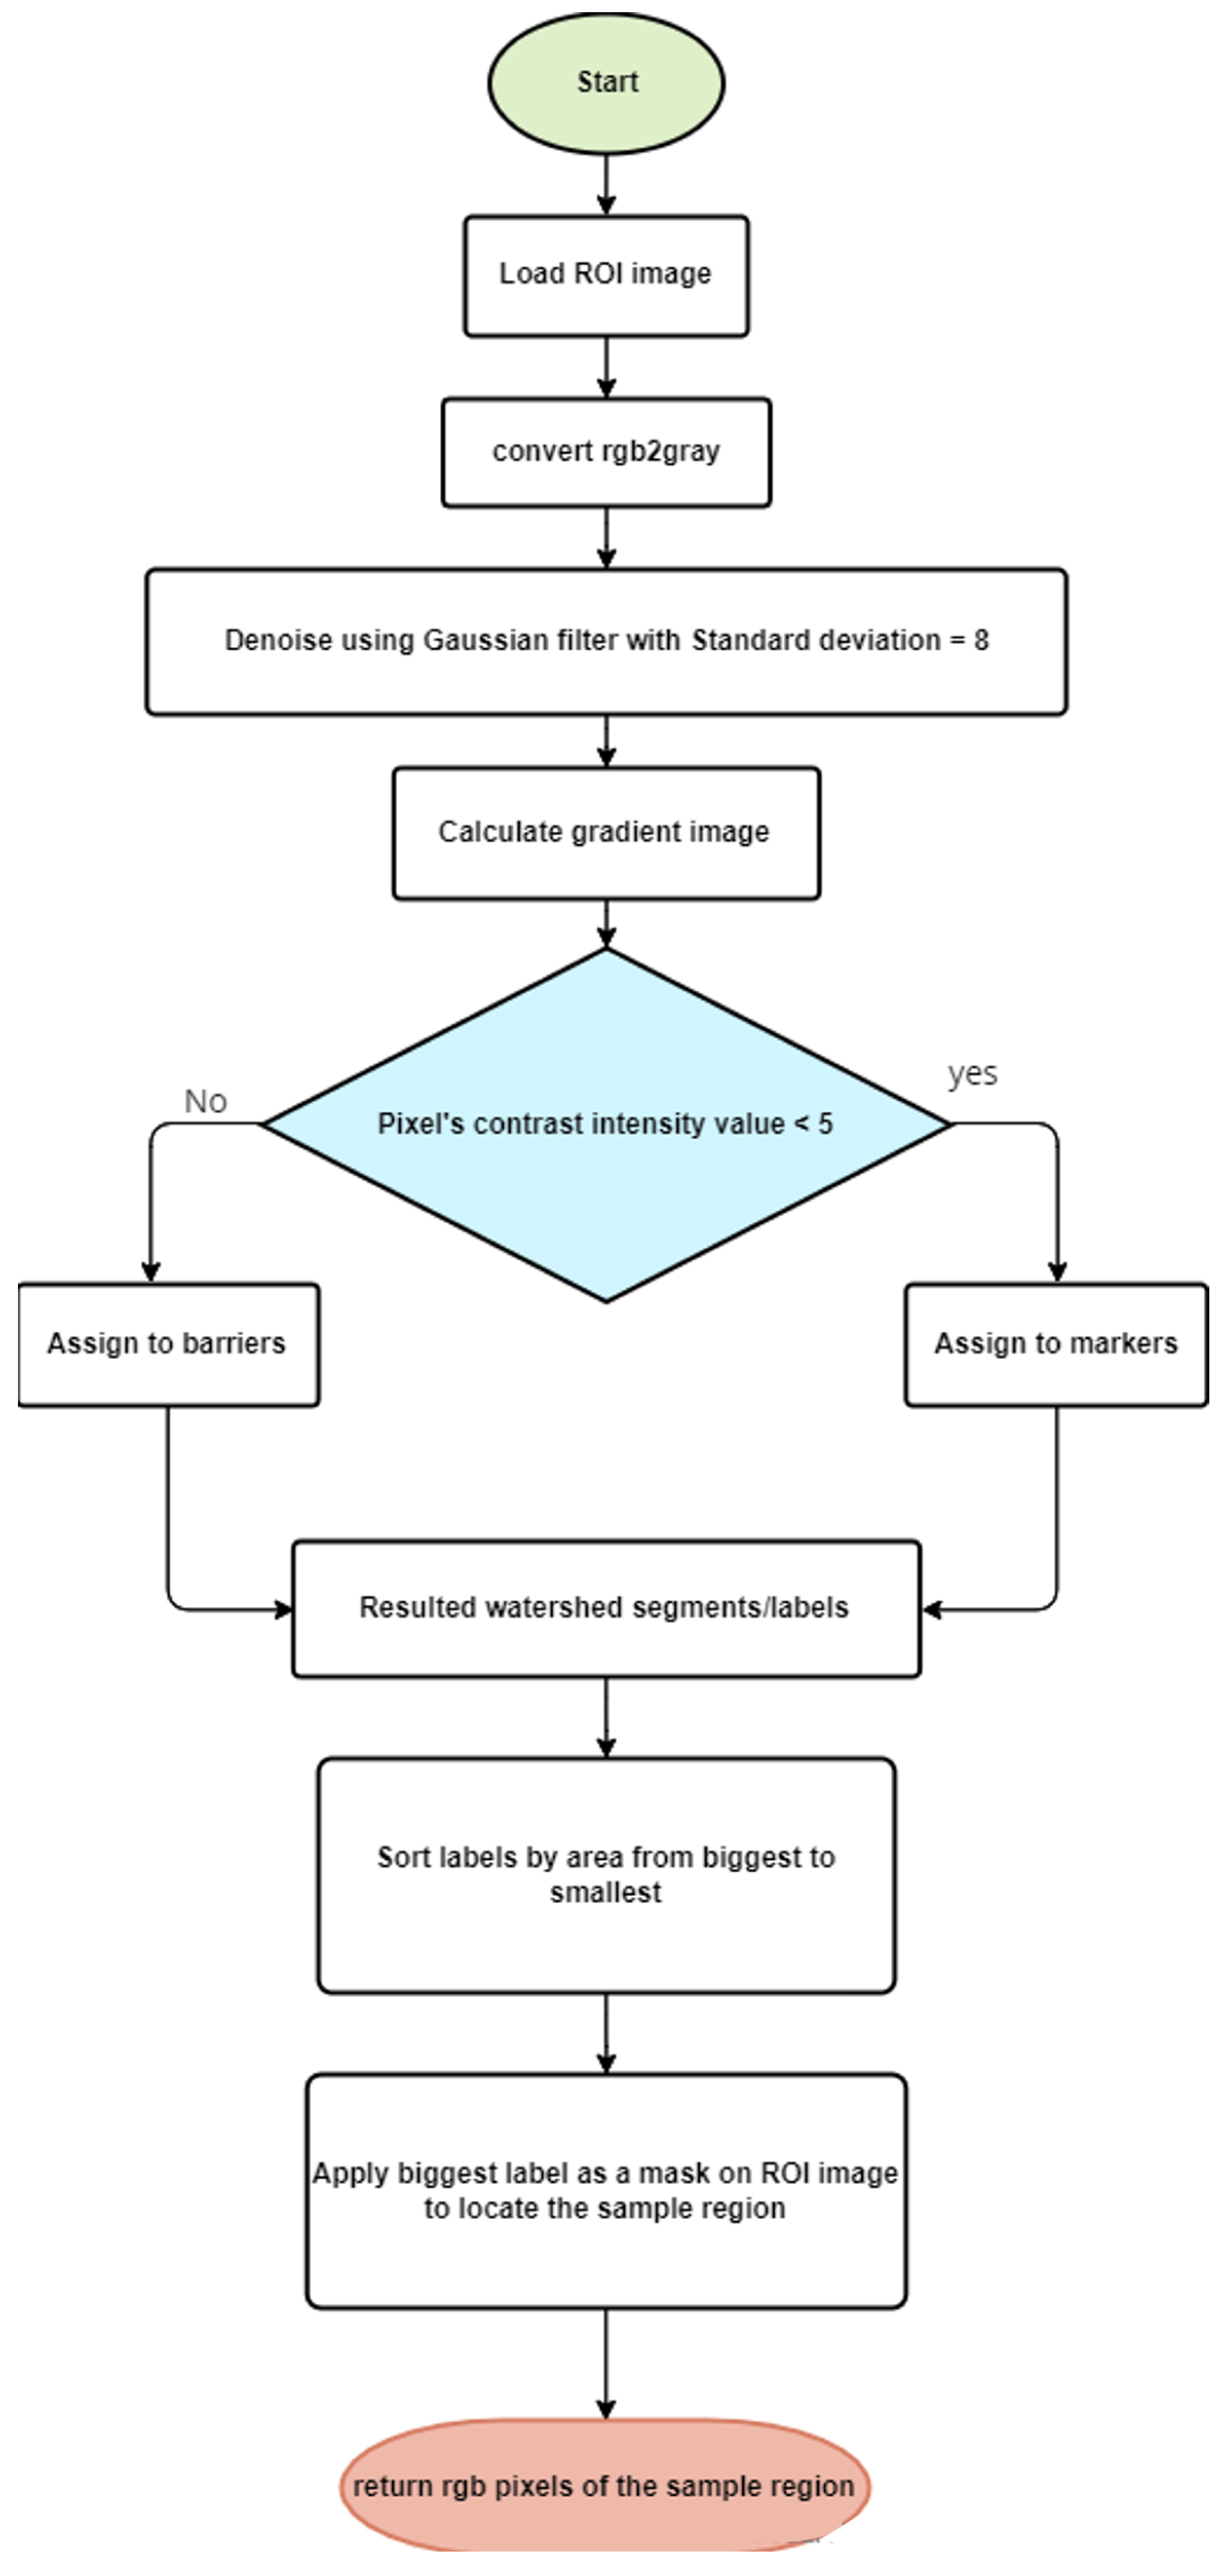
Region of interest detection is the initial step in the image processing algorithm. The goal is to remove the uninteresting black area surrounding the samples by using a cropping algorithm with the steps shown in Figure A1.
Figure A1. ROI detection and cropping algorithm flowchart.
Information 16 00683 g0a1

Appendix A.2. ROI Segmentation

Image segmentation is the second step in the image processing algorithm. It plays a key role in the automatic interpretation of images to identify the sample region in any captured image, preparing it for final color comparison. The segmentation algorithm implemented using the Scikit-image library is the Watershed method proposed by Vincent and Soille [45]. Figure A2 shows a step-by-step flowchart of the implemented algorithm.
Figure A2. ROI segmentation algorithm flowchart.
Information 16 00683 g0a2

Appendix A.3. Sample Color Calculation
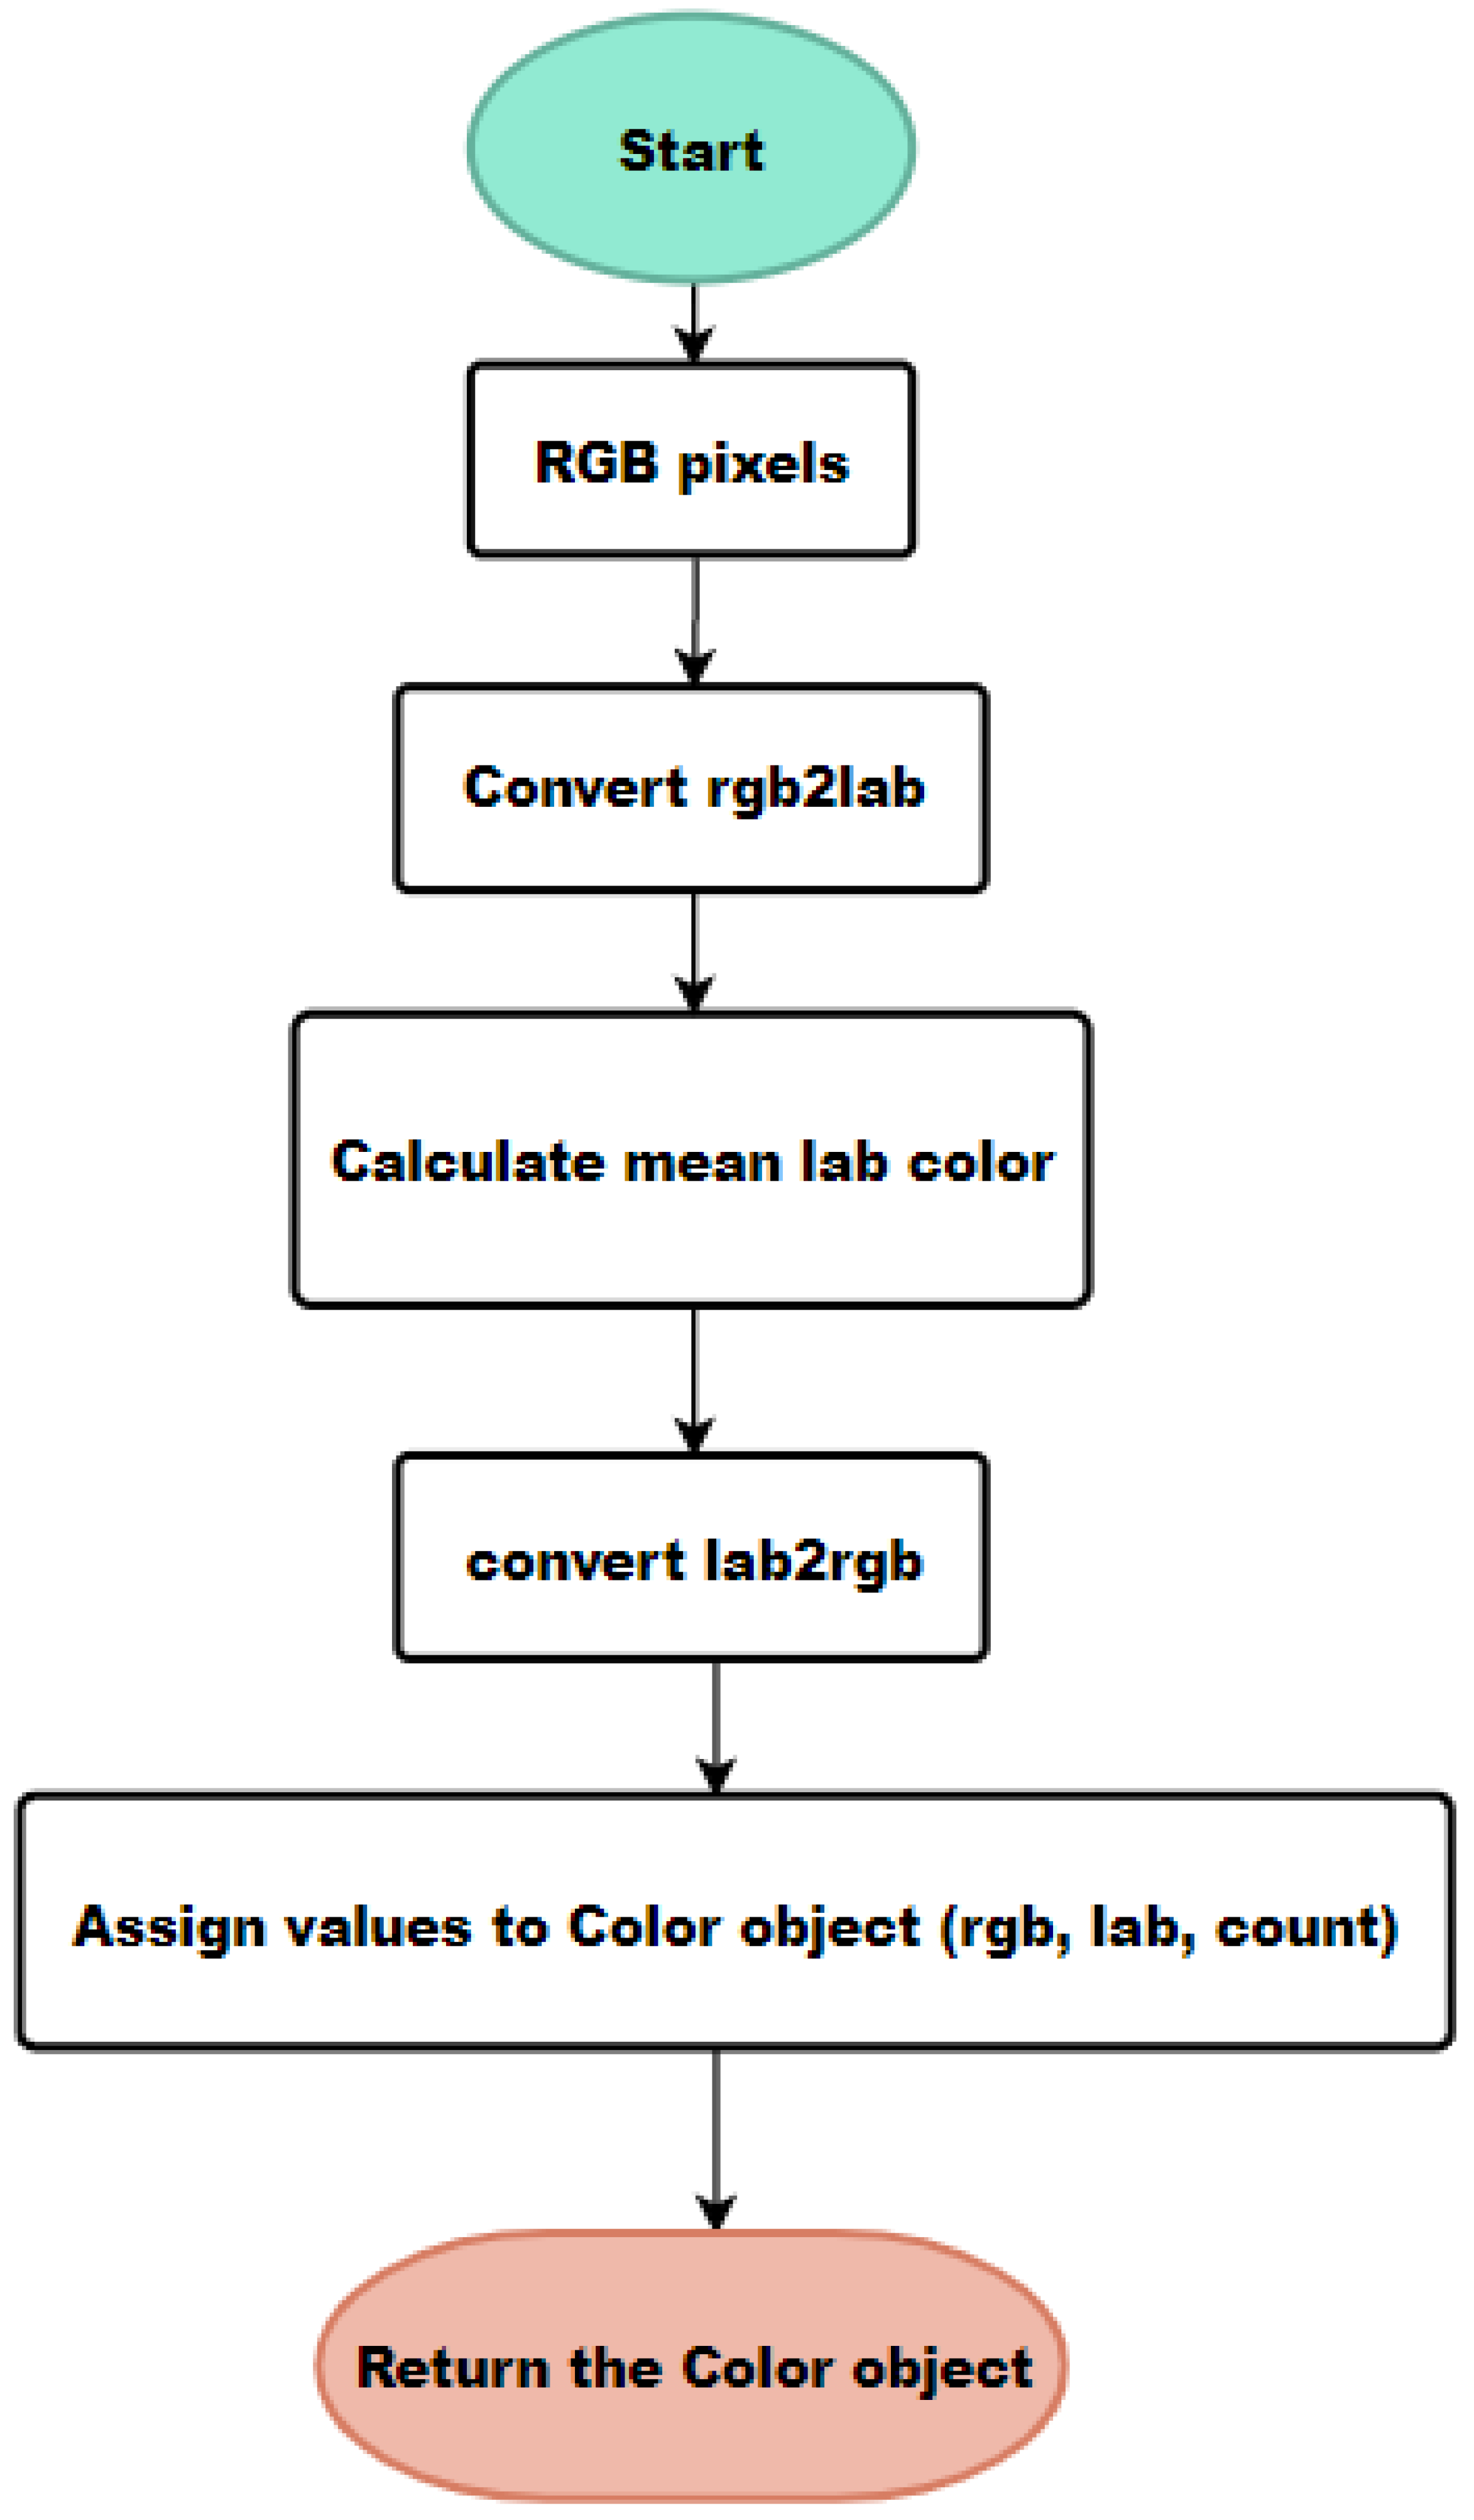
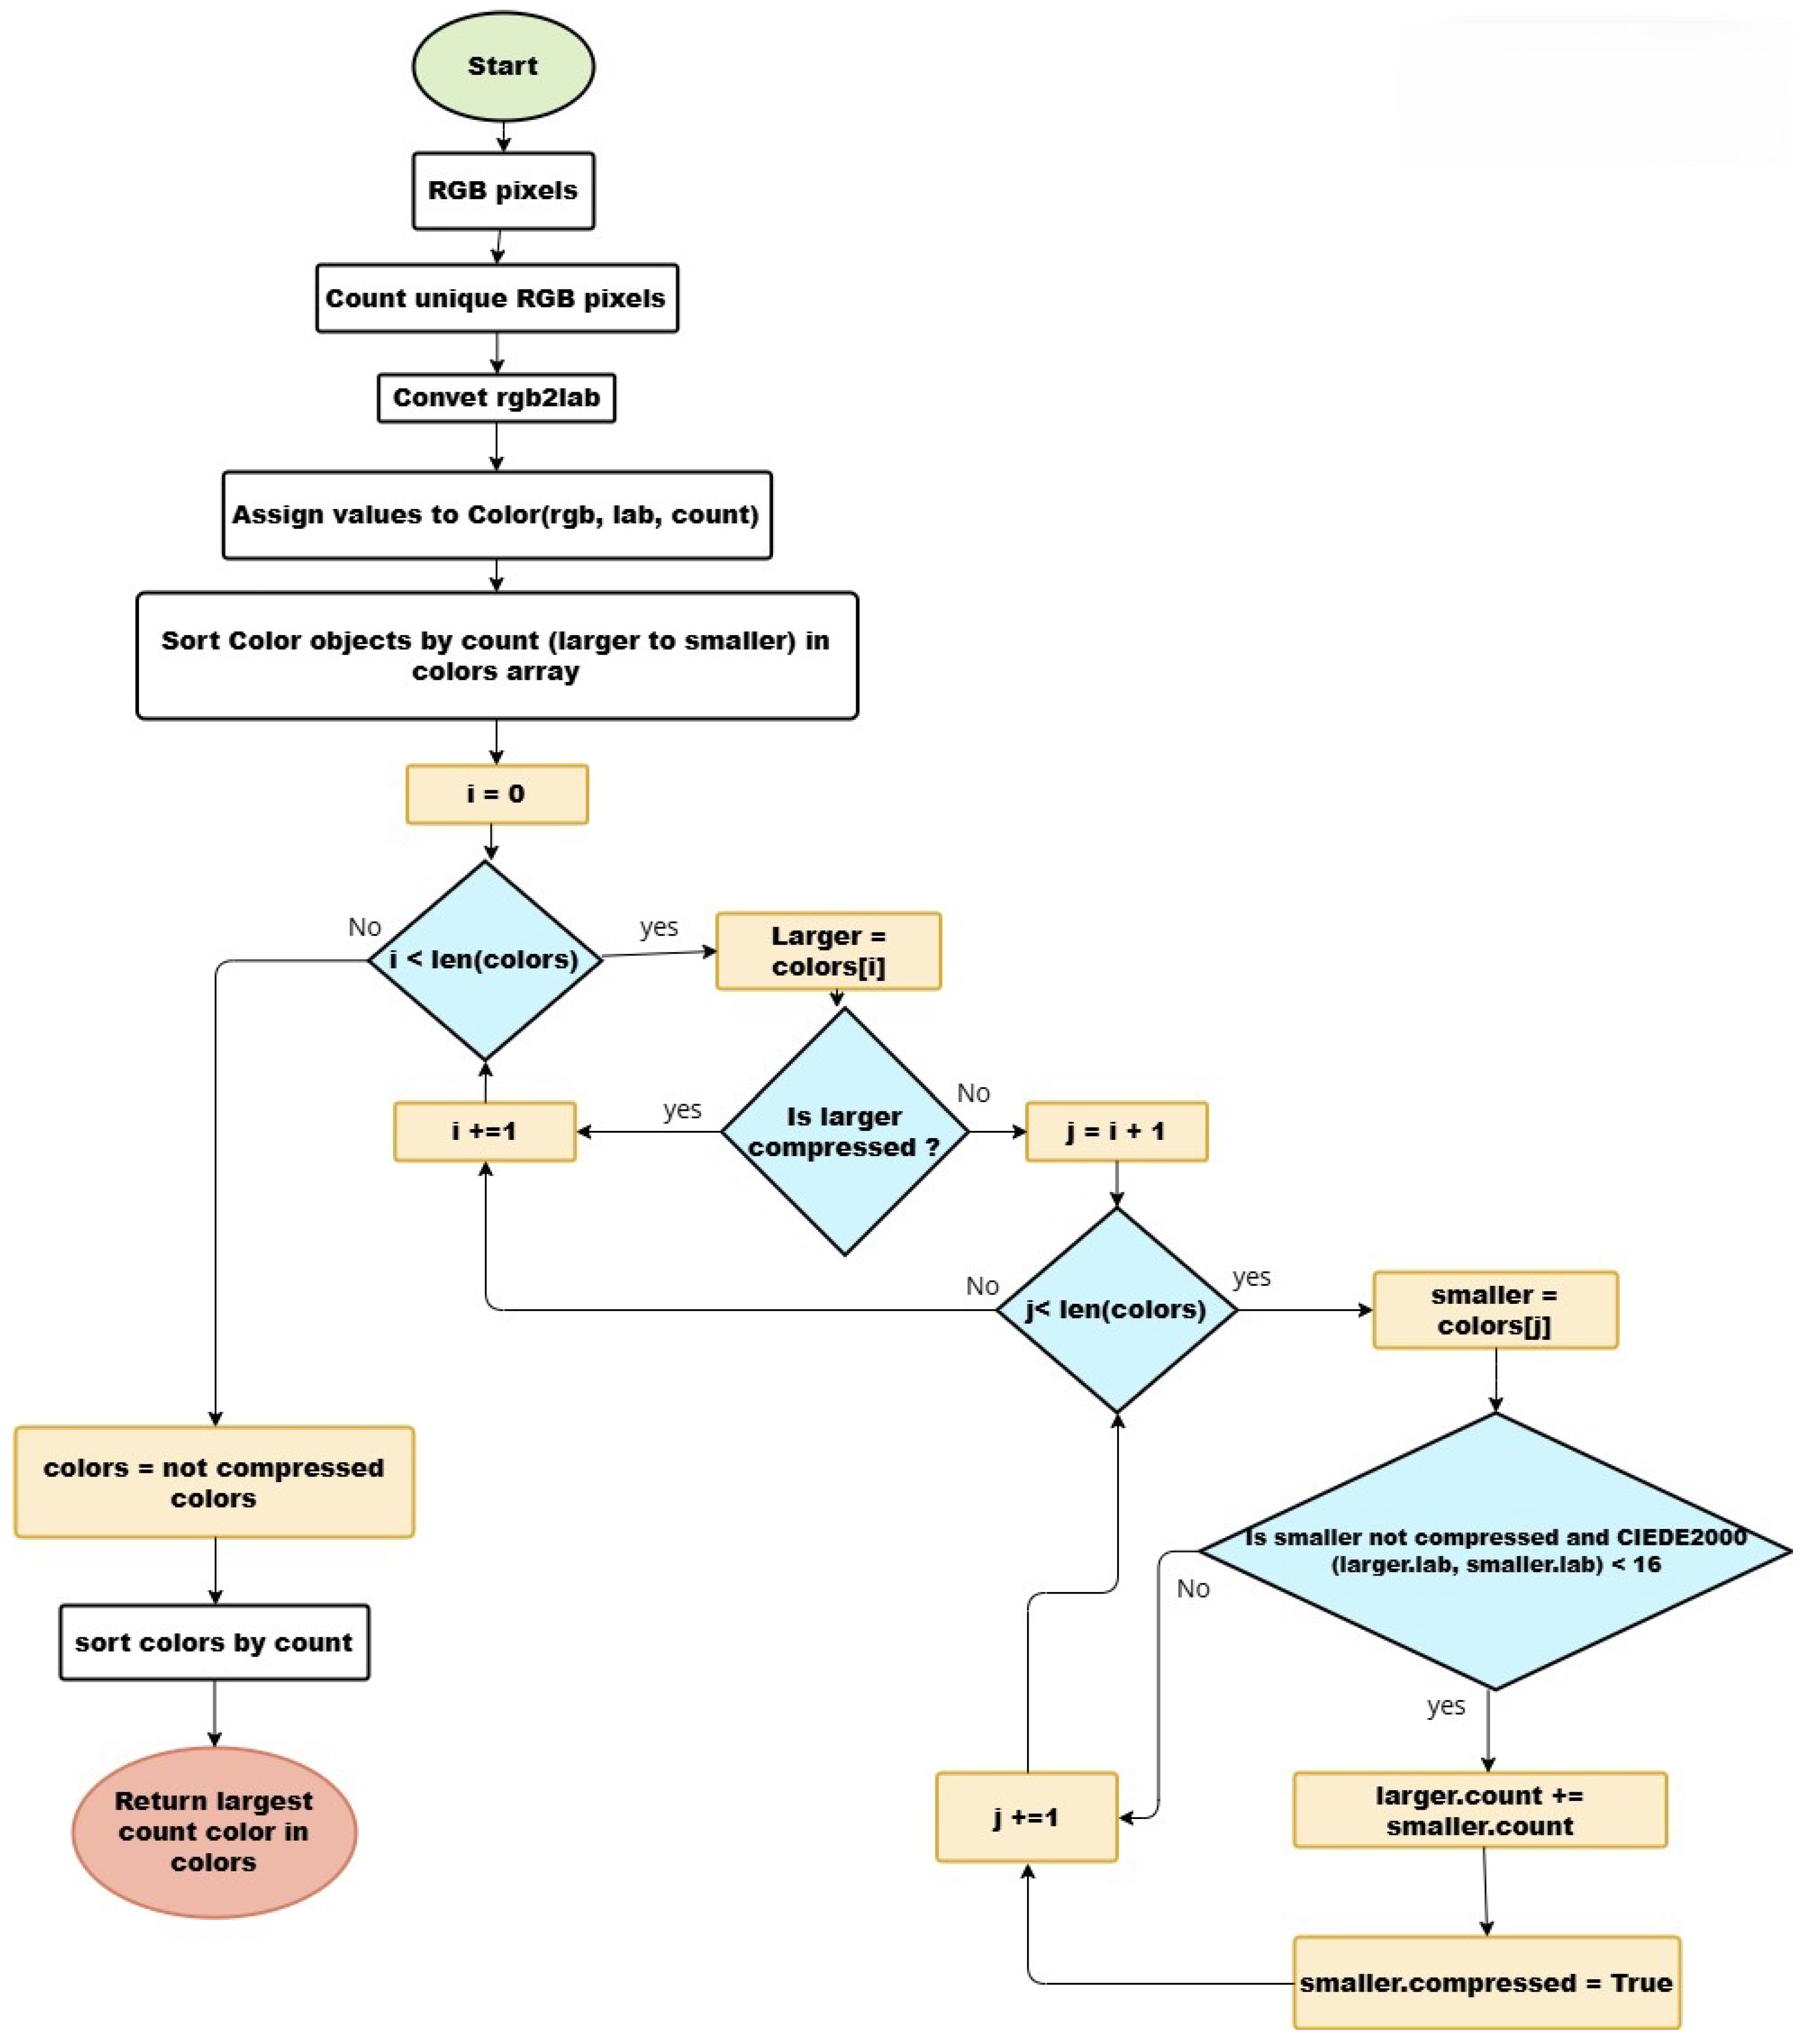
This step is required to describe the sample image in one color either with its mean LAB or dominant LAB color, since the standard color distance measurement, CIEDE2000, only compares one LAB color with another [46]. The step-by-step implementation flowchart is illustrated in Figure A3 for the mean color comparison method and Figure A4 for the dominant color comparison method.
Figure A3. Mean color comparison method.
Information 16 00683 g0a3
Figure A4. Dominant color comparison method.
Information 16 00683 g0a4

References

  1. Bline, A.P.; DeWitt, J.C.; Kwiatkowski, C.F.; Pelch, K.E.; Reade, A.; Varshavsky, J.R. Public Health Risks of PFAS-Related Immunotoxicity Are Real. Curr. Environ. Health Rep. 2024, 11, 118. [Google Scholar] [CrossRef]
  2. Reeve, R.N. Introduction. In Introduction to Environmental Analysis; John Wiley and Sons Ltd.: Chichester, UK, 2002; pp. 2–4. [Google Scholar]
  3. Alberti, G.; Zanoni, C.; Magnaghi, L.R.; Biesuz, R. Disposable and Low-Cost Colorimetric Sensors for Environmental Analysis. Int. J. Environ. Res. Public Health 2020, 17, 8331. [Google Scholar] [CrossRef] [PubMed]
  4. Chen, J.; Chen, S.; Fu, R.; Li, D.; Jiang, H.; Wang, C.; Peng, Y.; Jia, K.; Hicks, B.J. Remote Sensing Big Data for Water Environment Monitoring: Current Status, Challenges, and Future Prospects. Earth’s Future 2022, 10, e2021EF002289. [Google Scholar] [CrossRef]
  5. Dharshani, J.; Annamalai, S. Cloud-Based Effective Environmental Monitoring of Temperature, Humidity and Air Quality Using IoT Sensors. In Proceedings of the 5th International Conference on Information Management & Machine Intelligence (ICIMMI 2023), New York, NY, USA, 23–25 November 2023; Association for Computing Machinery: New York, NY, USA, 2024; pp. 1–6. [Google Scholar] [CrossRef]
  6. Dharshani, J.; Annamalai, S. Data Collection and Analysis Using the Mobile Application for Environmental Monitoring. Procedia Comput. Sci. 2015, 56, 532–537. [Google Scholar] [CrossRef]
  7. Zhang, Y.; Wang, X.; Li, J.; Liu, Y.; Zhang, Z.; Li, L.; Li, Y.; Wang, Y. Recent Advancements of Smartphone-Based Sensing Technology for Environmental Monitoring. Trends Environ. Anal. Chem. 2024, 31, e00136. [Google Scholar] [CrossRef]
  8. Feng, L.; You, Y.; Liao, W.; Pang, J.; Hu, R.; Feng, L. Multi-Scale Change Monitoring of Water Environment Using Cloud Computing in Optimal Resolution Remote Sensing Images. Energy Rep. 2022, 8, 13610–13620. [Google Scholar] [CrossRef]
  9. Velasco, A.; Ferrero, R.; Gandino, F.; Montrucchio, B.; Rebaudengo, M. A Mobile and Low-Cost System for Environmental Monitoring: A Case Study. Sensors 2016, 16, 710. [Google Scholar] [CrossRef] [PubMed]
  10. Adjovu, G.E.; Stephen, H.; James, D.; Ahmad, S. Overview of the Application of Remote Sensing in Effective Monitoring of Water Quality Parameters. Remote Sens. 2023, 15, 1938. [Google Scholar] [CrossRef]
  11. Fan, Y.; Li, J.; Guo, Y.; Xie, L.; Zhang, G. Digital Image Colorimetry on Smartphone for Chemical Analysis: A Review. Measurement 2021, 171, 108829. [Google Scholar] [CrossRef]
  12. Polat, F. Simple, Accurate, and Precise Detection of Total Nitrogen in Surface Waters Using a Smartphone-Based Analytical Method. Anal. Sci. 2025, 41, 281–287. [Google Scholar] [CrossRef]
  13. Zhang, H.-Y.; Zhang, Y.; Lai, D.; Chen, L.-Q.; Zhou, L.-Q.; Tao, C.-L.; Fang, Z.; Zhu, R.-R.; Long, W.-Q.; Liu, J.-W.; et al. Real-Time Smartphone-Based Multi-Parameter Detection of Nitrite, Ammonia Nitrogen, and Total Phosphorus in Water. Anal. Methods 2025, 17, 5683–5696. [Google Scholar] [CrossRef]
  14. Zamora, E. Using Image Processing Techniques to Estimate the Air Quality. McNair J. 2012, 5, 1–10. Available online: https://oasis.library.unlv.edu/mcnair_posters/20/ (accessed on 9 August 2025).
  15. Sarikonda, A.; Rafi, R.; Schuessler, C.; Mouchtouris, N.; Bray, D.P.; Farrell, C.J.; Evans, J.J. Smartphone Applications for Remote Monitoring of Patients After Transsphenoidal Pituitary Surgery: A Narrative Review of Emerging Technologies. World Neurosurg. 2024, 191, 213–224. [Google Scholar] [CrossRef] [PubMed]
  16. Kanchi, S.; Sabela, M.I.; Mdluli, P.S.; Inamuddin; Bisetty, K. Smartphone-Based Bioanalytical and Diagnosis Applications: A Review. Biosens. Bioelectron. 2018, 102, 136–149. [Google Scholar] [CrossRef]
  17. Piriya, V.S.A.; Joseph, P.; Daniel, S.C.G.K.; Lakshmanan, S.; Kinoshita, T.; Muthusamy, S. Colorimetric Sensors for Rapid Detection of Various Analytes. Mater. Sci. Eng. C Mater. Biol. Appl. 2017, 78, 1231–1245. [Google Scholar] [CrossRef] [PubMed]
  18. Khurana, K.; Jaggi, N. Localized Surface Plasmonic Properties of Au and Ag Nanoparticles for Sensors: A Review. Plasmonics 2021, 16, 981–999. [Google Scholar] [CrossRef]
  19. Csáki, A.; Stranik, O.; Fritzsche, W. Localized Surface Plasmon Resonance Based Biosensing. Expert Rev. Mol. Diagn. 2018, 18, 279–296. [Google Scholar] [CrossRef]
  20. Alberti, G.; Zanoni, C.; Magnaghi, L.R.; Biesuz, R. Gold and Silver Nanoparticle-Based Colorimetric Sensors: New Trends and Applications. Chemosensors 2021, 9, 305. [Google Scholar] [CrossRef]
  21. Serafinelli, C.; Fantoni, A.; Alegria, E.C.; Vieira, M. Hybrid Nanocomposites of Plasmonic Metal Nanostructures and 2D Nanomaterials for Improved Colorimetric Detection. Chemosensors 2022, 10, 237. [Google Scholar] [CrossRef]
  22. Wang, L.; Hasanzadeh Kafshgari, M.; Meunier, M. Optical Properties and Applications of Plasmonic-Metal Nanoparticles. Adv. Funct. Mater. 2020, 30, 2005400. [Google Scholar] [CrossRef]
  23. Serafinelli, C.; Fantoni, A.; Alegria, E.; Vieira, M. Recent Progresses in Plasmonic Biosensors for Point-of-Care (POC) Devices: A Critical Review. Chemosensors 2023, 11, 303. [Google Scholar] [CrossRef]
  24. Ramirez-Priego, P.; Mauriz, E.; Giarola, J.F.; Lechuga, L.M. Overcoming Challenges in Plasmonic Biosensors Deployment for Clinical and Biomedical Applications: A Systematic Review and Meta-Analysis. Sens. Bio-Sens. Res. 2024, 46, 100717. [Google Scholar] [CrossRef]
  25. Priyadarshini, E.; Pradhan, N. Gold Nanoparticles as Efficient Sensors in Colorimetric Detection of Toxic Metal Ions: A Review. Sens. Actuators B Chem. 2017, 238, 888–902. [Google Scholar] [CrossRef]
  26. Bendicho, C.; Lavilla, I.; La Calle, I.D.; Romero, V. Paper-Based Analytical Devices for Colorimetric and Luminescent Detection of Mercury in Waters: An Overview. Sensors 2021, 21, 7571. [Google Scholar] [CrossRef] [PubMed]
  27. Firdaus, M.L.; Aprian, A.; Meileza, N.; Hitsmi, M.; Elvia, R.; Rahmidar, L.; Khaydarov, R. Smartphone Coupled with a Paper-Based Colorimetric Device for Sensitive and Portable Mercury Ion Sensing. Chemosensors 2019, 7, 25. [Google Scholar] [CrossRef]
  28. Aqillah, F.; Permana, M.D.; Eddy, D.R.; Firdaus, M.L.; Takei, T.; Rahayu, I. Detection and Quantification of Cu2+ Ion Using Gold Nanoparticles via Smartphone-Based Digital Imaging Colorimetry Technique. Results Chem. 2024, 7, 101418. [Google Scholar] [CrossRef]
  29. Gan, Y.; Liang, T.; Hu, Q.; Zhong, L.; Wang, X.; Wan, H.; Wang, P. In-Situ Detection of Cadmium with Aptamer Functionalized Gold Nanoparticles Based on Smartphone-Based Colorimetric System. Talanta 2020, 208, 120231. [Google Scholar] [CrossRef]
  30. Mekonnen, M.L.; Workie, Y.A.; Su, W.; Hwang, B.J. Plasmonic Paper Substrates for Point-of-Need Applications: Recent Developments and Fabrication Methods. Sens. Actuators B Chem. 2021, 345, 130401. [Google Scholar] [CrossRef]
  31. Serafinelli, C.; Fantoni, A.; Alegria, E.C.B.A.; Vieira, M. Colorimetric Analysis of Transmitted Light Through Plasmonic Paper for Next-Generation Point-of-Care (PoC) Devices. Biosensors 2025, 15, 144. [Google Scholar] [CrossRef]
  32. Mansour, R.; Stojkovic, V.; Vygranenko, Y.; Lourenço, P.; Jesus, R.; Fantoni, A. Colour and Image Processing for Output Extraction of a LSPR Sensor. In Proceedings of the Optics and Biophotonics in Low-Resource Settings VIII, San Francisco, CA, USA, 22 January–28 February 2022; Volume 35. [Google Scholar] [CrossRef]
  33. Mansour, R.; Serafinelli, C.; Fantoni, A.; Jesus, R. An Affordable Optical Detection Scheme for LSPR Sensors. EPJ Web Conf. 2024, 305, 00025. [Google Scholar] [CrossRef]
  34. Firebase. Available online: https://firebase.google.com/ (accessed on 12 February 2025).
  35. Flutter. Available online: https://flutter.dev/ (accessed on 12 February 2025).
  36. BLoC Library Documentation. Available online: https://bloclibrary.dev/why-bloc/ (accessed on 12 February 2025).
  37. Flask Documentation. Available online: https://flask.palletsprojects.com/en/stable/ (accessed on 12 February 2025).
  38. PythonAnywhere. Available online: https://www.pythonanywhere.com/ (accessed on 12 February 2025).
  39. van der Walt, S.; Schönberger, J.L.; Nunez-Iglesias, J.; Boulogne, F.; Warner, J.D.; Yager, N.; Gouillart, E.; Yu, T.; The scikit-image contributors. scikit-image: Image Processing in Python. PeerJ 2014, 2, e453. [Google Scholar] [CrossRef] [PubMed]
  40. Ratnarathorn, N.; Chailapakul, O.; Henry, C.S.; Dungchai, W. Simple Silver Nanoparticle Colorimetric Sensing for Copper by Paper-Based Devices. Talanta 2012, 99, 552–557. [Google Scholar] [CrossRef] [PubMed]
  41. Apilux, A.; Siangproh, W.; Praphairaksit, N.; Chailapakul, O. Simple and Rapid Colorimetric Detection of Hg(II) by a Paper-Based Device Using Silver Nanoplates. Talanta 2012, 97, 388–394. [Google Scholar] [CrossRef]
  42. Nielsen, J. Why You Only Need to Test with 5 Users. Nielsen Norman Group. 18 March 2000. Available online: https://www.nngroup.com/articles/why-you-only-need-to-test-with-5-users/ (accessed on 29 July 2025).
  43. Brooke, J. SUS—A Quick and Dirty Usability Scale. Usability Eval. Ind. 1996, 189, 4–7. [Google Scholar]
  44. MeasuringU. System Usability Scale (SUS). Available online: https://measuringu.com/sus/ (accessed on 12 February 2025).
  45. Vincent, L.; Soille, P. Watersheds in Digital Spaces: An Efficient Algorithm Based on Immersion Simulations. IEEE Trans. Pattern Anal. Mach. Intell. 1991, 13, 583–598. [Google Scholar] [CrossRef]
  46. Sharma, G.; Wu, W.; Dalal, E.N. The CIEDE2000 Color-Difference Formula: Implementation Notes, Supplementary Test Data, and Mathematical Observations. Color Res. Appl. 2005, 30, 21–30. [Google Scholar] [CrossRef]
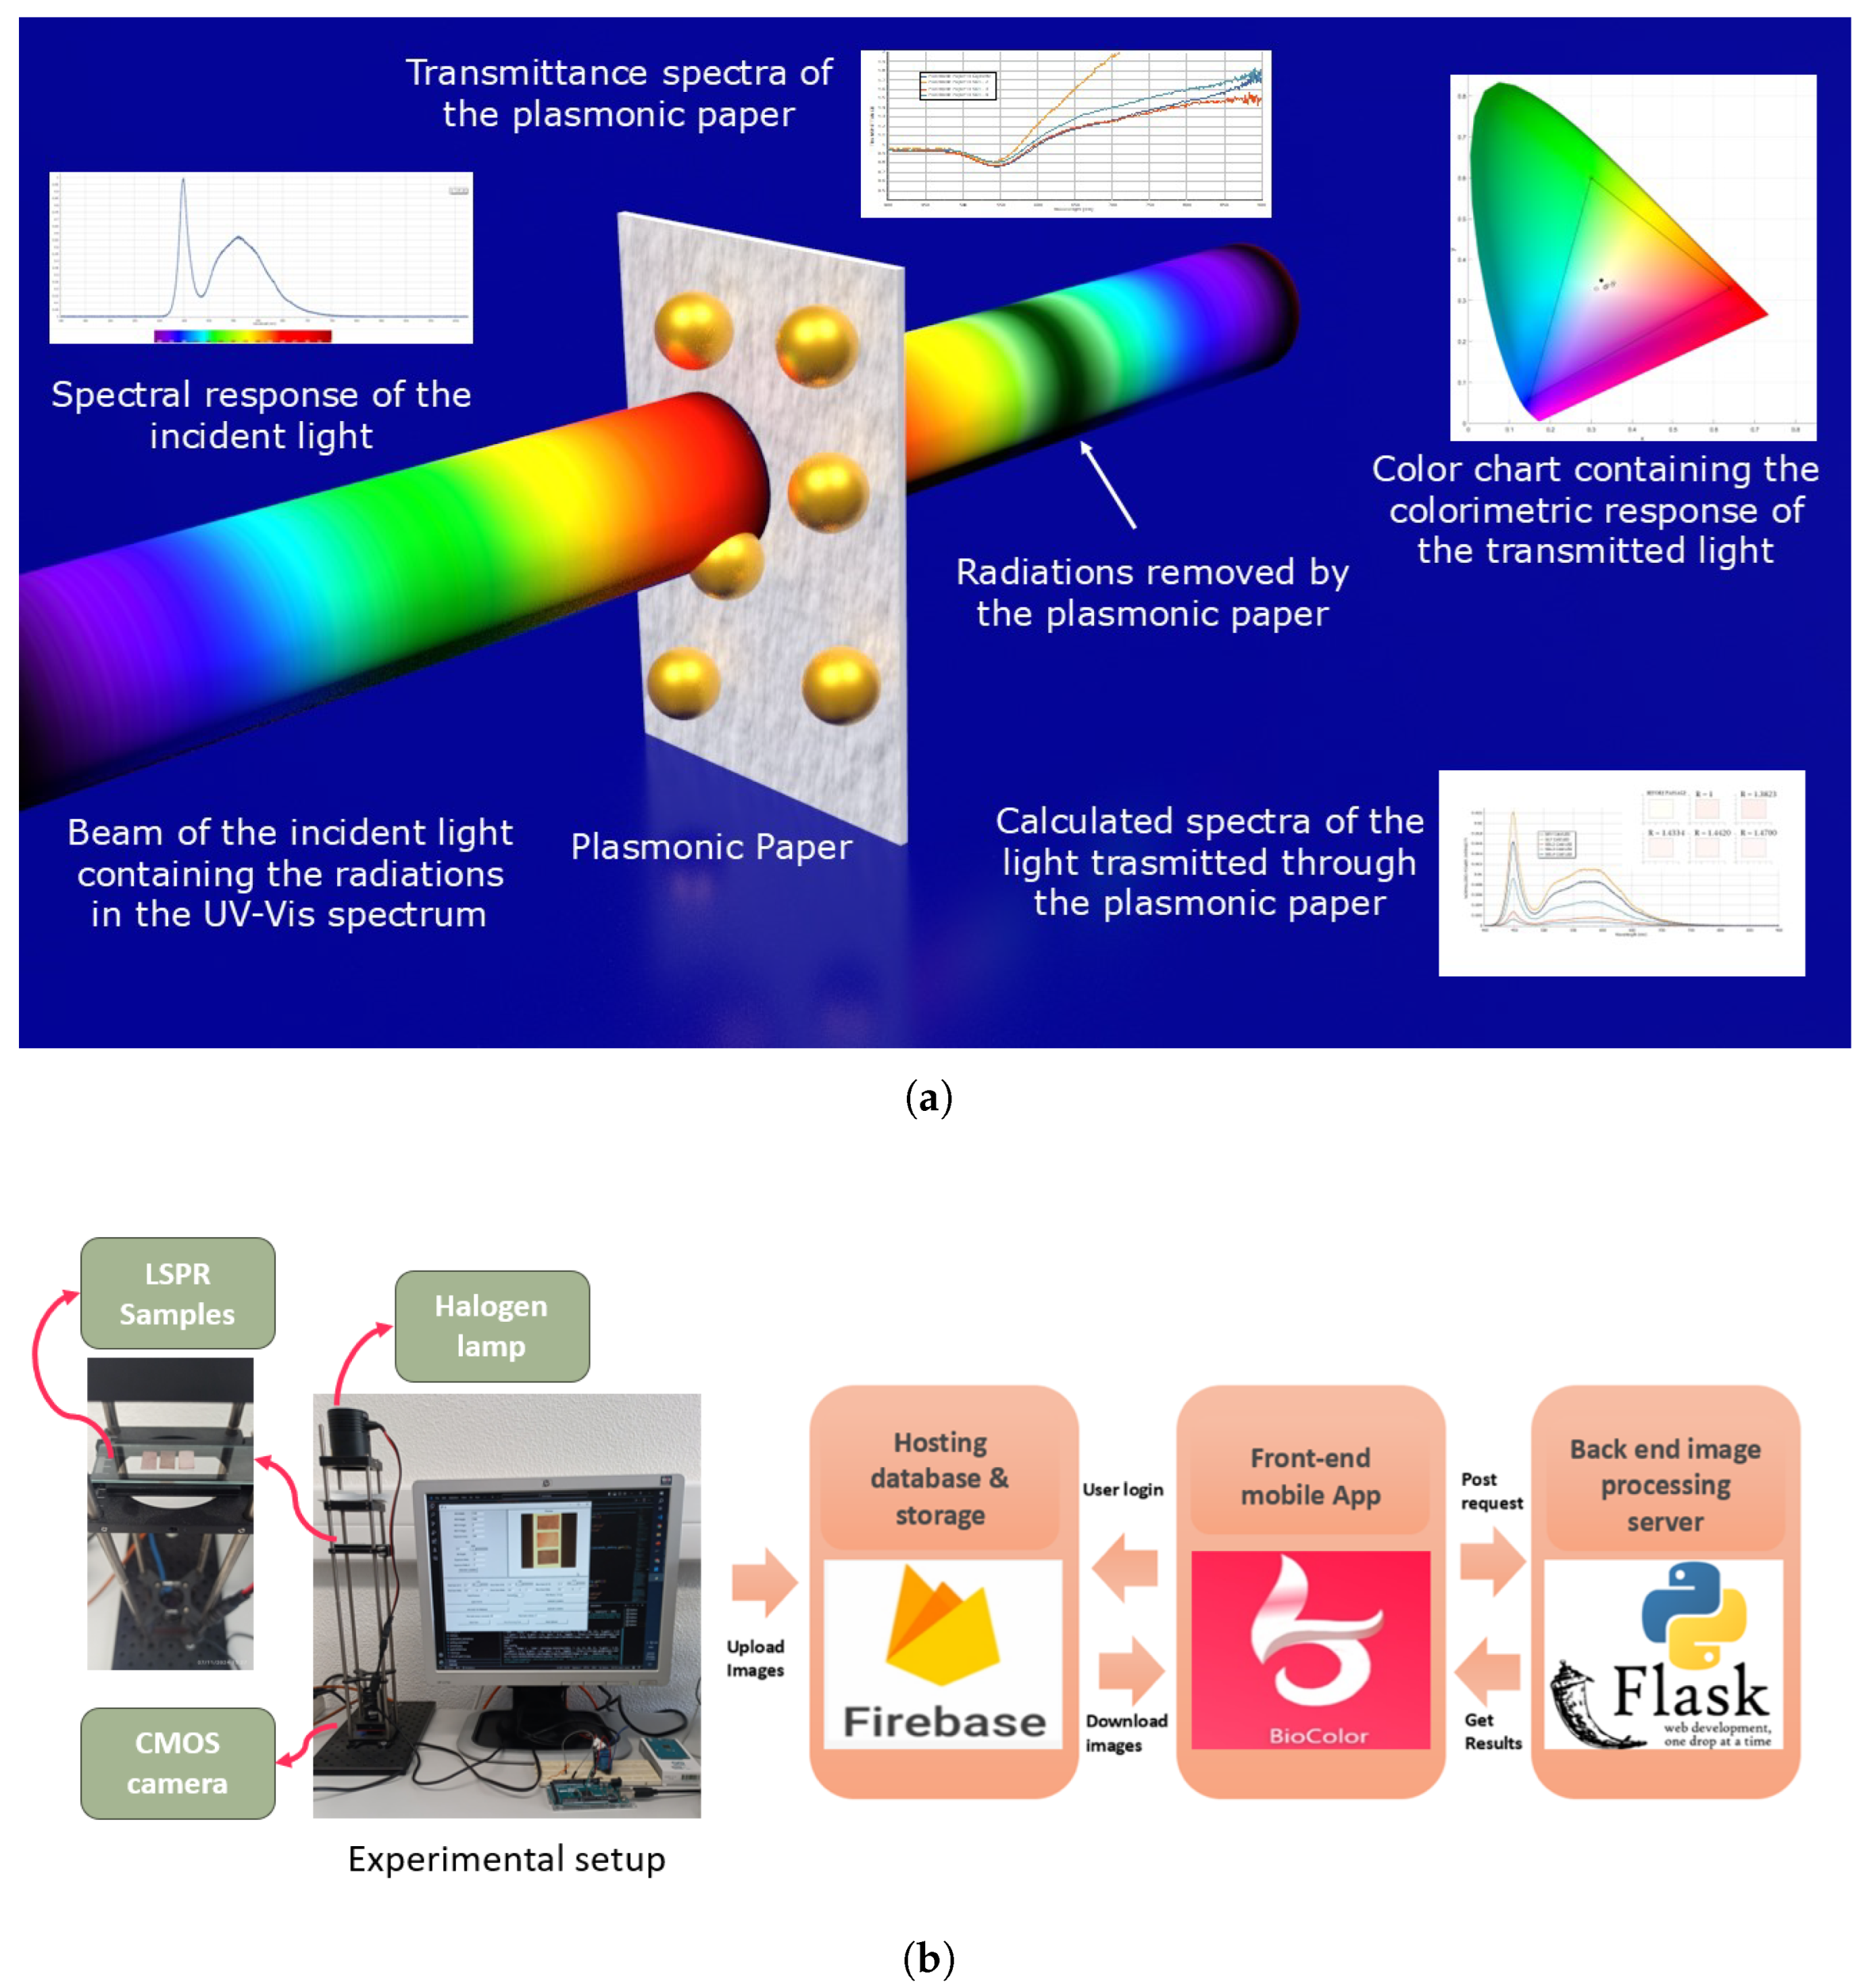
Figure 1. (a) LSPR-based colorimetric sensing mechanism. Adapted from Serafinelli et al. [31] (b) BioColor system architecture.
Information 16 00683 g001
Figure 2. User interaction with the BioColor system.
Information 16 00683 g002
Figure 3. Firestore database structure.
Information 16 00683 g003
Figure 4. BioColor layered bloc architecture.
Information 16 00683 g004
Figure 5. BioColor screens: (a) Signup page; (b) Login page; (c) Home page; (d) Sample page; (e) Analysis page for single image; (f) Result page for single image, three samples comparison; (g) Analysis page for two images; (h) Result page for two images, one sample to one sample comparison.
Information 16 00683 g005
Figure 6. BioColor API data structure.
Information 16 00683 g006
Figure 7. Image processing technique.
Information 16 00683 g007
Table 1. Description of the application screens.
PageDescription
SignupRegisters users in the Firestore database using email and password (Figure 5a).
LoginAuthenticates users with their email and password (Figure 5b).
HomeShows captured images from the camera. Tapping an image opens the Sample page (Figure 5c).
SampleDisplays image details and camera settings. Allows adding the image to the Analysis page (Figure 5d).
AnalysisAllows users to select and remove images for analysis. It provides two options for analysis: three samples in single image (Figure 5e) or one sample image compared with another sample image (Figure 5g). Users can choose a comparison method (mean or dominant) and initiate the analysis.
ResultShows color comparison results. For a single image containing three samples, the output includes the original image on the left with the mean or dominant color of each sample on the right, and a color difference graph below (Figure 5f). In the case of one-sample images, each sample is presented alongside its mean or dominant color and the corresponding color difference value (Figure 5h).
Table 2. BioColor BLoCs responsibilities.
BLoCResponsibility
SampleReceives a list of Sample objects from the Sample Repository and updates the Home page to display the images.
AnalysisAdds, removes, or checkboxes images on the Analysis page. Selects a color comparison method to start the analysis.
ResultReceives checkboxed images and the comparison method from the Analysis page. Sends them to the Result Repository for posting to the API. Receives the Result object from the Result Repository and updates the Result page with the analysis results.
Table 3. BioColor Repositories responsibilities.
RepositoryResponsibility
SampleFetches sample images from the Firestore collection (‘images/’) as a Stream. The Sample BLoC subscribes to the stream to be updated whenever new images are added to the Firestore collection.
ResultSends analysis data as an HTTP POST request to the API endpoint and delivers the received analysis results to the Result BloC.
Table 4. The color difference results using a halogen lamp.
SubstrateMean ColorDominant Color
Dry vs. glycerol17.5818.98
Dry vs. sol.417.4420.81
Dry vs. water11.9211.07
Water vs. glycerol5.182.39
Water vs. sol.45.374.3
Sol.4 vs. glycerol0.734.08
Table 5. Task testing responses.
Task NameMeanStandard DeviationMode
1. BioColor App Registration Ease4.830.375
2. Understanding Sample Images on Home Page4.331.115
3. Checking Image Details Ease4.920.285
4. Performing Color Comparison (three samples in one image)4.670.625
5. Understanding Analysis Results (three samples displayed in one image)3.921.044
6. Performing Color Comparison (one sample image compared to another)4.081.055
7. Understanding Analysis Results (one sample image compared to another)4.170.995
Table 6. System Usability Scale responses.
QuestionMeanStandard DeviationMode
13.51.354
21.670.622
34.330.624
421.221
54.080.514
62.331.102
74.420.855
81.670.632
94.080.884
101.750.721 & 2
Disclaimer/Publisher’s Note: The statements, opinions and data contained in all publications are solely those of the individual author(s) and contributor(s) and not of MDPI and/or the editor(s). MDPI and/or the editor(s) disclaim responsibility for any injury to people or property resulting from any ideas, methods, instructions or products referred to in the content.