1. Introduction
Retinal vein occlusion (RVO) is the second most prevalent retinal vascular condition after diabetic retinopathy (DR) and is a leading cause of vision loss and impairment. This condition arises when a blockage in the retinal venous system leads to thrombus formation, increasing capillary pressure and causing fluid leakage and macular edema—both of which contribute significantly to visual impairment [
1,
2].
Globally, RVO affects approximately 16 million individuals, with its occurrence influenced by factors such as age, gender, and underlying health conditions. The risk of developing RVO increases with age, particularly in individuals over 60 [
3].
RVO is classified into two main types: branch retinal vein occlusion (BRVO) and central retinal vein occlusion (CRVO), depending on the location of the blockage. BRVO typically develops at arteriovenous crossings, whereas CRVO occurs near or at the lamina cribrosa of the optic nerve. The most common cause is the compression of retinal veins by adjacent atherosclerotic arteries. CRVO is associated with features such as optic disc swelling, dilated and tortuous retinal veins, widespread hemorrhages, cotton wool spots, macular edema, and capillary non-perfusion throughout the retina. In contrast, BRVO shares similar characteristics but is limited to the region served by the affected vein. Vision loss in RVO is mainly due to macular edema but can also result from macular ischemia or complications like neovascular glaucoma and vitreous hemorrhage [
1]. While RVO can be classified in two subtypes, in many image diagnosis workflows, they are considered as RVO-associated edema due to shared features observable in OCT images.
Diabetic macular edema (DME) is also a major cause of vision loss that is characterized by retinal thickening and intraretinal fluid accumulation. It remains a leading complication of diabetic retinopathy and is a critical diagnosis in OCT-based diagnosis.
The use of artificial intelligence (AI) in medical imaging for diagnostic support has shown promising results across various medical fields such as ophthalmology. AI can assist in screening optical coherence tomography (OCT) images for disease detection, helping to reduce challenges such as human fatigue, bias, and cognitive limitations [
4].
Early approaches to computer-assisted diagnosis (CAD) relied on extracting relevant features, which required domain expertise and varied depending on the dataset. These features often included texture or structural information from the images [
5]. More recently, deep learning (DL) techniques have been employed to classify OCT images, with the development of convolutional neural networks (CNNs) significantly enhancing image classification performance [
6,
7].
CNNs use convolutional operators to extract features directly from image pixels, making them highly effective for image classification tasks. Convolutional, pooling, and activation layers process the images to identify key features, which are then passed through a fully connected network for classification [
8]. These networks have been used to classify multiple diseases simultaneously, making them highly practical for real-world disease screening applications. An example of this is the work developed by Kermany et al. [
9], where a DL model was developed that was capable of classifying four distinct types of classes using OCT scans, with them being normal eyes, eyes with choroidal neovascularization (CNV), eyes with diabetic macular edema (DME), and eyes with drusen. Extensive research has been conducted using the Kermany dataset with study’s reaching an accuracy of 98.6% using the VGG-16 network [
10].
However, a notable research gap remains in distinguishing retinal vein occlusion (RVO) from diabetic macular edema (DME). Most existing studies that classify these two retinal conditions primarily utilize fundus images. For instance, Choi et al. [
11] applied random forest transfer learning (TL) using the VGG-19 architecture for fundus image classification, achieving an accuracy of 74.7% in differentiating background diabetic retinopathy (DR) from RVO. Similarly, Abitbol et al. [
12] developed a deep learning model for classifying widefield color fundus images, achieving an accuracy of 85.2% for DR and 88.4% for RVO. Other studies have concentrated solely on distinguishing various types of RVO from healthy eyes using fundus images [
13,
14]. There is limited research on using OCT images for diagnosing patients with RVO, despite this imaging modality being the preferred non-invasive diagnostic tool. Consequently, developing a model that can accurately diagnose RVO using OCT has significant potential for clinical application.
A model developed by Pin et al. [
15] composed of an ensemble of two TL models, MobileNetV3Large and ResNet50, to classify OCT images into four distinct categories, RVO, age-related macular degeneration (AMD), central serous chorioretinopathy (CSCR), and diabetic macular edema (DME), achieving an overall accuracy of 91.69%. Similarly, Khan et al. [
16] modified three models and extracted the features using TL. The best features were selected using ant colony optimization. These features were then classified using k-nearest neighbors and support vector machines, reaching accuracies of 99.1% and 97.4% with and without feature optimization, respectively. More recently, Kulyabin et al. [
17] evaluated the performance of VGG-16 and ResNet50 on a publicly available OCT dataset [
17], which includes conditions such as AMD, DME, RVO, epiretinal membrane, retinal artery occlusion, and vitreomacular interface disease. The VGG-16 network achieved the highest accuracy at 89.5%.
This study proposes a DL approach based on an ensemble technique known as stacking for the automated diagnosis of retinal diseases, namely DME, RVO-associated edema, and other generic retinal pathologies, using OCT images. These pathologies can be observed in
Figure 1. The model is specifically evaluated for its ability to differentiate RVO-associated edema from DME, a critical distinction for guiding appropriate treatment strategies.
4. Discussion
The usage of AI in the medical field, specifically, in retinal disease diagnosis, can significantly increase the capabilities of healthcare professionals, enabling them to deliver fast and accurate diagnosis. This improved efficiency leads to better patient outcomes through earlier detection and disease treatment, as well as allowing healthcare personnel to manage a higher volume of cases, thereby expanding their reach and overall impact.
The results from the public dataset by Kermany et al. [
9] are not presented, as this dataset was used solely for pretraining the convolutional layers of the models applied to the OCT images.
Regarding the results from the private ULS São João dataset, the three models performed similarly, achieving an accuracy of 85% and an -score of 88%. Analysis of the confusion matrices and ROC curves reveals that the models were most effective at classifying normal eyes, while also demonstrating strong performance in identifying other ocular pathologies.
The confusion matrices reveal misclassifications between DME and RVO pathologies. Given the limited research on classifying RVO using OCT images, and the existing gap in distinguishing RVO from DME, such misclassifications are to be expected. There is also a recurring pattern of misclassifying pathological cases as normal. This can be attributed to the nature of the OCT images used, as not all scans from a patient with a given pathology visibly exhibit signs of the disease—leading to some being mistaken for images of healthy eyes.
Building on the previous observations, the SNNs used in this study show that combining two models, when one of the models is the ResNet50 model, yields results similar to those of a single-model approach. The recurring issue of misclassifying DME and RVO is also evident in these SNNs. Notably, the SNN that combines the VGG16 and VGG19 models demonstrates improved performance, with accuracy rising to 90% and the -score increasing to 91%, compared to single-model usage. It also has a better performance of classifying DME and RVO pathologies, although there are still multiple misclassifications. The SNN incorporating all three models achieves comparable results to the VGG16 and VGG19 combination, with slightly enhanced metrics.
A possible explanation for the similar performance between the SNNs using the ResNet50 model and single models, as well as between the SNNs combining VGG16 and VGG19 and that of using all three models, lies in the number of features fed into the classifier. The convolutional layers of ResNet50 extract 2048 features—significantly fewer than the 25,088 features extracted by both VGG16 and VGG19. As a result, incorporating the ResNet50 features does not substantially increase the total feature set, which may explain the lack of significant improvement in performance in both cases. This can be better perceived in
Figure 9. It can also be perceived by observing the grad-CAM images from
Figure 4. The grad-CAM images from the VGG-16 and VGG-19 networks show that these networks see a broader area of the map comparing with the grad-CAM images from the ResNet50 architecture.
The performance metrics were calculated using a weighted average across all categories to ensure a balanced evaluation. For consistency and comparability with existing literature, the metrics from previous studies were inferred from their respective confusion matrices as reported. It is important to note that discrepancies may exist between the figures reported here and those in the original publications due to differing methods used for computing average values. The top-performing model in this study demonstrated superior overall accuracy compared to the results of Abitbol et al. [
12], achieved comparable accuracy to that of Pin et al. [
15] and Kulyabin et al. [
17], and performed slightly below the models proposed by Khan et al. [
16] and Barbosa et al. [
23]. In terms of individual class performance, particularly for RVO, the proposed model attained higher accuracy and recall than all referenced studies except for those by Khan and Barbosa, although, in the case of Barbosa et al., the model had more inputs than the OCT images, such as infrared images and clinical data from the patients.
This model provides a viable clinical tool for differentiating between RVO and DME and reinforces the importance of incorporating multimodal imaging data and patient-specific clinical information in the development of AI-based diagnostic systems. The use of stacked neural networks enhances the model’s ability to distinguish between OCT images of DME and RVO pathologies more effectively.
This study has several limitations. Notably, no image preprocessing was applied to the OCT scans used for training the model. Introducing preprocessing techniques—such as contrast enhancement—could potentially improve the model’s performance by highlighting relevant features more clearly. Additionally, while the model is capable of classifying patients into four categories, i.e., normal, DME, RVO, or other pathologies, it does not specify the nature of the “other” conditions. In such cases, clinical expertise is still required to determine the exact diagnosis. Future work should aim to expand the number of diagnostic categories included in the training process to enable more comprehensive and precise classification. Future studies should also think about removing the ResNet50 model form the SNN and add a fundus image classification, like the multimodal algorithm developed by Barbosa et al. [
23], with hyperspectral imaging, like in the work performed by Wang et al. [
24]. To improve the model’s generalization, future training with a dataset containing OCT images taken from different devices should be performed.
Author Contributions
Conceptualization, P.R. and M.P.; methodology, P.R., M.P., G.B. and E.C.; software, P.R.; validation, G.B., E.C., S.T.-C. and M.F.; writing—original draft preparation, P.R.; writing—review and editing, G.B., E.C., B.A., A.G., S.T.-C., N.R., M.F. and M.P.; Supervision, A.G., N.R., M.F. and M.P. All authors have read and agreed to the published version of the manuscript.
Funding
This research received no external funding.
Institutional Review Board Statement
The study was conducted in accordance with the Declaration of Helsinki and approved by the Ethics Committee of the Centro Hospitalar Universitário of São João (protocol code number 329/2023, approval date 29 February 2024).
Informed Consent Statement
Due to the retrospective nature of this study and the use of deidentified data, the requirement for written informed consent was waived.
Data Availability Statement
The datasets presented in this article are not readily available because the data are part of an ongoing study.
Acknowledgments
The authors would like to acknowledge the support from LAETA.
Conflicts of Interest
The authors declare no conflicts of interest.
Abbreviations
The following abbreviations are used in this manuscript:
| AI | Artificial Intelligence |
| AUC | Area Under Curve |
| CAD | Computer-Assisted Diagnosis |
| CAM | Class Activation Map |
| CNN | Convolutional Neural Network |
| CNV | Choroidal Neovascularization |
| DL | Deep Learning |
| DME | Diabetic Macular Edema |
| DR | Diabetic Retinopathy |
| OCT | Optical Coherence Tomography |
| ROC | Receiving Operating Curve |
| RVO | Retinal Vein Occlusion |
| SNN | Stacked Neural Network |
| TL | Transfer Learning |
References
- Nicholson, L.; Talks, S.J.; Amoaku, W.; Talks, K.; Sivaprasad, S. Retinal vein occlusion (RVO) guideline: Executive summary. Eye 2022, 36, 909–912. [Google Scholar] [CrossRef]
- Rogers, S.; McIntosh, R.L.; Cheung, N.; Lim, L.; Wang, J.J.; Mitchell, P.; Kowalski, J.W.; Nguyen, H.; Wong, T.Y. The prevalence of retinal vein occlusion: Pooled data from population studies from the United States, Europe, Asia, and Australia. Ophthalmology 2010, 117, 313–319.e1. [Google Scholar] [CrossRef]
- Khayat, M.; Williams, M.; Lois, N. Ischemic retinal vein occlusion: Characterizing the more severe spectrum of retinal vein occlusion. Surv. Ophthalmol. 2018, 63, 816–850. [Google Scholar] [CrossRef]
- Schmitz-Valckenberg, S.; Göbel, A.P.; Saur, S.C.; Steinberg, J.S.; Thiele, S.; Wojek, C.; Russmann, C.; Holz, F.G.; For The Modiamd-Study, G. Automated Retinal Image Analysis for Evaluation of Focal Hyperpigmentary Changes in Intermediate Age-Related Macular Degeneration. Transl. Vis. Sci. Technol. 2016, 5, 3. [Google Scholar] [CrossRef]
- Hussain, M.A.; Bhuiyan, A.; C, D.L.; Theodore Smith, R.; R, H.G.; Ishikawa, H.; J, S.S.; Ramamohanarao, K. Classification of healthy and diseased retina using SD-OCT imaging and Random Forest algorithm. PLoS ONE 2018, 13, e0198281. [Google Scholar] [CrossRef]
- Lee, C.S.; Baughman, D.M.; Lee, A.Y. Deep learning is effective for the classification of OCT images of normal versus Age-related Macular Degeneration. Ophthalmol. Retin. 2017, 1, 322–327. [Google Scholar] [CrossRef]
- Wang, D.; Wang, L. On OCT Image Classification via Deep Learning. IEEE Photonics J. 2019, 11, 1–14. [Google Scholar] [CrossRef]
- LeCun, Y.; Bengio, Y.; Hinton, G. Deep learning. Nature 2015, 521, 436–444. [Google Scholar] [CrossRef] [PubMed]
- Kermany, D.S.; Goldbaum, M.; Cai, W.; Valentim, C.C.S.; Liang, H.; Baxter, S.L.; McKeown, A.; Yang, G.; Wu, X.; Yan, F.; et al. Identifying Medical Diagnoses and Treatable Diseases by Image-Based Deep Learning. Cell 2018, 172, 1122–1131.e9. [Google Scholar] [CrossRef] [PubMed]
- Li, F.; Chen, H.; Liu, Z.; Zhang, X.; Wu, Z. Fully automated detection of retinal disorders by image-based deep learning. Graefes Arch. Clin. Exp. Ophthalmol. 2019, 257, 495–505. [Google Scholar] [CrossRef] [PubMed]
- Choi, J.Y.; Yoo, T.K.; Seo, J.G.; Kwak, J.; Um, T.T.; Rim, T.H. Multi-categorical deep learning neural network to classify retinal images: A pilot study employing small database. PLoS ONE 2017, 12, e0187336. [Google Scholar] [CrossRef] [PubMed]
- Abitbol, E.; Miere, A.; Excoffier, J.B.; Mehanna, C.J.; Amoroso, F.; Kerr, S.; Ortala, M.; Souied, E.H. Deep learning-based classification of retinal vascular diseases using ultra-widefield colour fundus photographs. BMJ Open Ophthalmol. 2022, 7, e000924. [Google Scholar] [CrossRef] [PubMed]
- Zhang, G.; Sun, B.; Zhang, Z.; Wu, S.; Zhuo, G.; Rong, H.; Liu, Y.; Yang, W. Hypermixed Convolutional Neural Network for Retinal Vein Occlusion Classification. Dis. Markers 2022, 2022, 1730501. [Google Scholar] [CrossRef]
- Xu, W.; Yan, Z.; Chen, N.; Luo, Y.; Ji, Y.; Wang, M.; Zhang, Z. Development and Application of an Intelligent Diagnosis System for Retinal Vein Occlusion Based on Deep Learning. Dis. Markers 2022, 2022, 4988256. [Google Scholar] [CrossRef] [PubMed]
- Pin, K.; Nam, Y.; Ha, S.; Han, J. Deep Learning Based on Ensemble to Diagnose of Retinal Disease using Optical Coherence Tomography. In Proceedings of the 2021 International Conference on Computational Science and Computational Intelligence (CSCI), Las Vegas, NV, USA, 15–17 December 2021; pp. 661–664. [Google Scholar] [CrossRef]
- Khan, A.; Pin, K.; Aziz, A.; Han, J.W.; Nam, Y. Optical Coherence Tomography Image Classification Using Hybrid Deep Learning and Ant Colony Optimization. Sensors 2023, 23, 6706. [Google Scholar] [CrossRef]
- Kulyabin, M.; Zhdanov, A.; Nikiforova, A.; Stepichev, A.; Kuznetsova, A.; Ronkin, M.; Borisov, V.; Bogachev, A.; Korotkich, S.; Constable, P.A.; et al. OCTDL: Optical Coherence Tomography Dataset for Image-Based Deep Learning Methods. Sci. Data 2024, 11, 365. [Google Scholar] [CrossRef]
- Arisholm, E.; Briand, L.C.; Johannessen, E.B. A systematic and comprehensive investigation of methods to build and evaluate fault prediction models. J. Syst. Softw. 2010, 83, 2–17. [Google Scholar] [CrossRef]
- Lin, T.L.; Lu, C.T.; Karmakar, R.; Nampalley, K.; Mukundan, A.; Hsiao, Y.P.; Hsieh, S.C.; Wang, H.C. Assessing the Efficacy of the Spectrum-Aided Vision Enhancer (SAVE) to Detect Acral Lentiginous Melanoma, Melanoma In Situ, Nodular Melanoma, and Superficial Spreading Melanoma. Diagnostics 2024, 14, 1672. [Google Scholar] [CrossRef]
- Gray, D.; Bowes, D.; Davey, N.; Sun, Y.; Christianson, B. Further thoughts on precision. In Proceedings of the 15th Annual Conference on Evaluation & Assessment in Software Engineering (EASE 2011), Durham, UK, 11–12 April 2011; IET: Hertfordshire, UK, 2011; pp. 129–133. [Google Scholar]
- Saito, T.; Rehmsmeier, M. The precision-recall plot is more informative than the ROC plot when evaluating binary classifiers on imbalanced datasets. PLoS ONE 2015, 10, e0118432. [Google Scholar] [CrossRef]
- Sasaki, Y. The truth of the F-measure. Teach Tutor Mater 2007, 1, 1–5. [Google Scholar]
- Barbosa, G.; Carvalho, E.; Guerra, A.; Torres-Costa, S.; Ramião, N.; Parente, M.L.P.; Falcão, M. Deep Learning to Distinguish Edema Secondary to Retinal Vein Occlusion and Diabetic Macular Edema: A Multimodal Approach Using OCT and Infrared Imaging. J. Clin. Med. 2025, 14, 1008. [Google Scholar] [CrossRef] [PubMed]
- Wang, C.Y.; Mukundan, A.; Liu, Y.S.; Tsao, Y.M.; Lin, F.C.; Fan, W.S.; Wang, H.C. Optical Identification of Diabetic Retinopathy Using Hyperspectral Imaging. J. Pers. Med. 2023, 13, 939. [Google Scholar] [CrossRef] [PubMed]
Figure 1.
Example of OCT images of (a) a healthy patient, (b) a patient with DME, (c) a patient with RVO, and (d) a patient with other pathology.
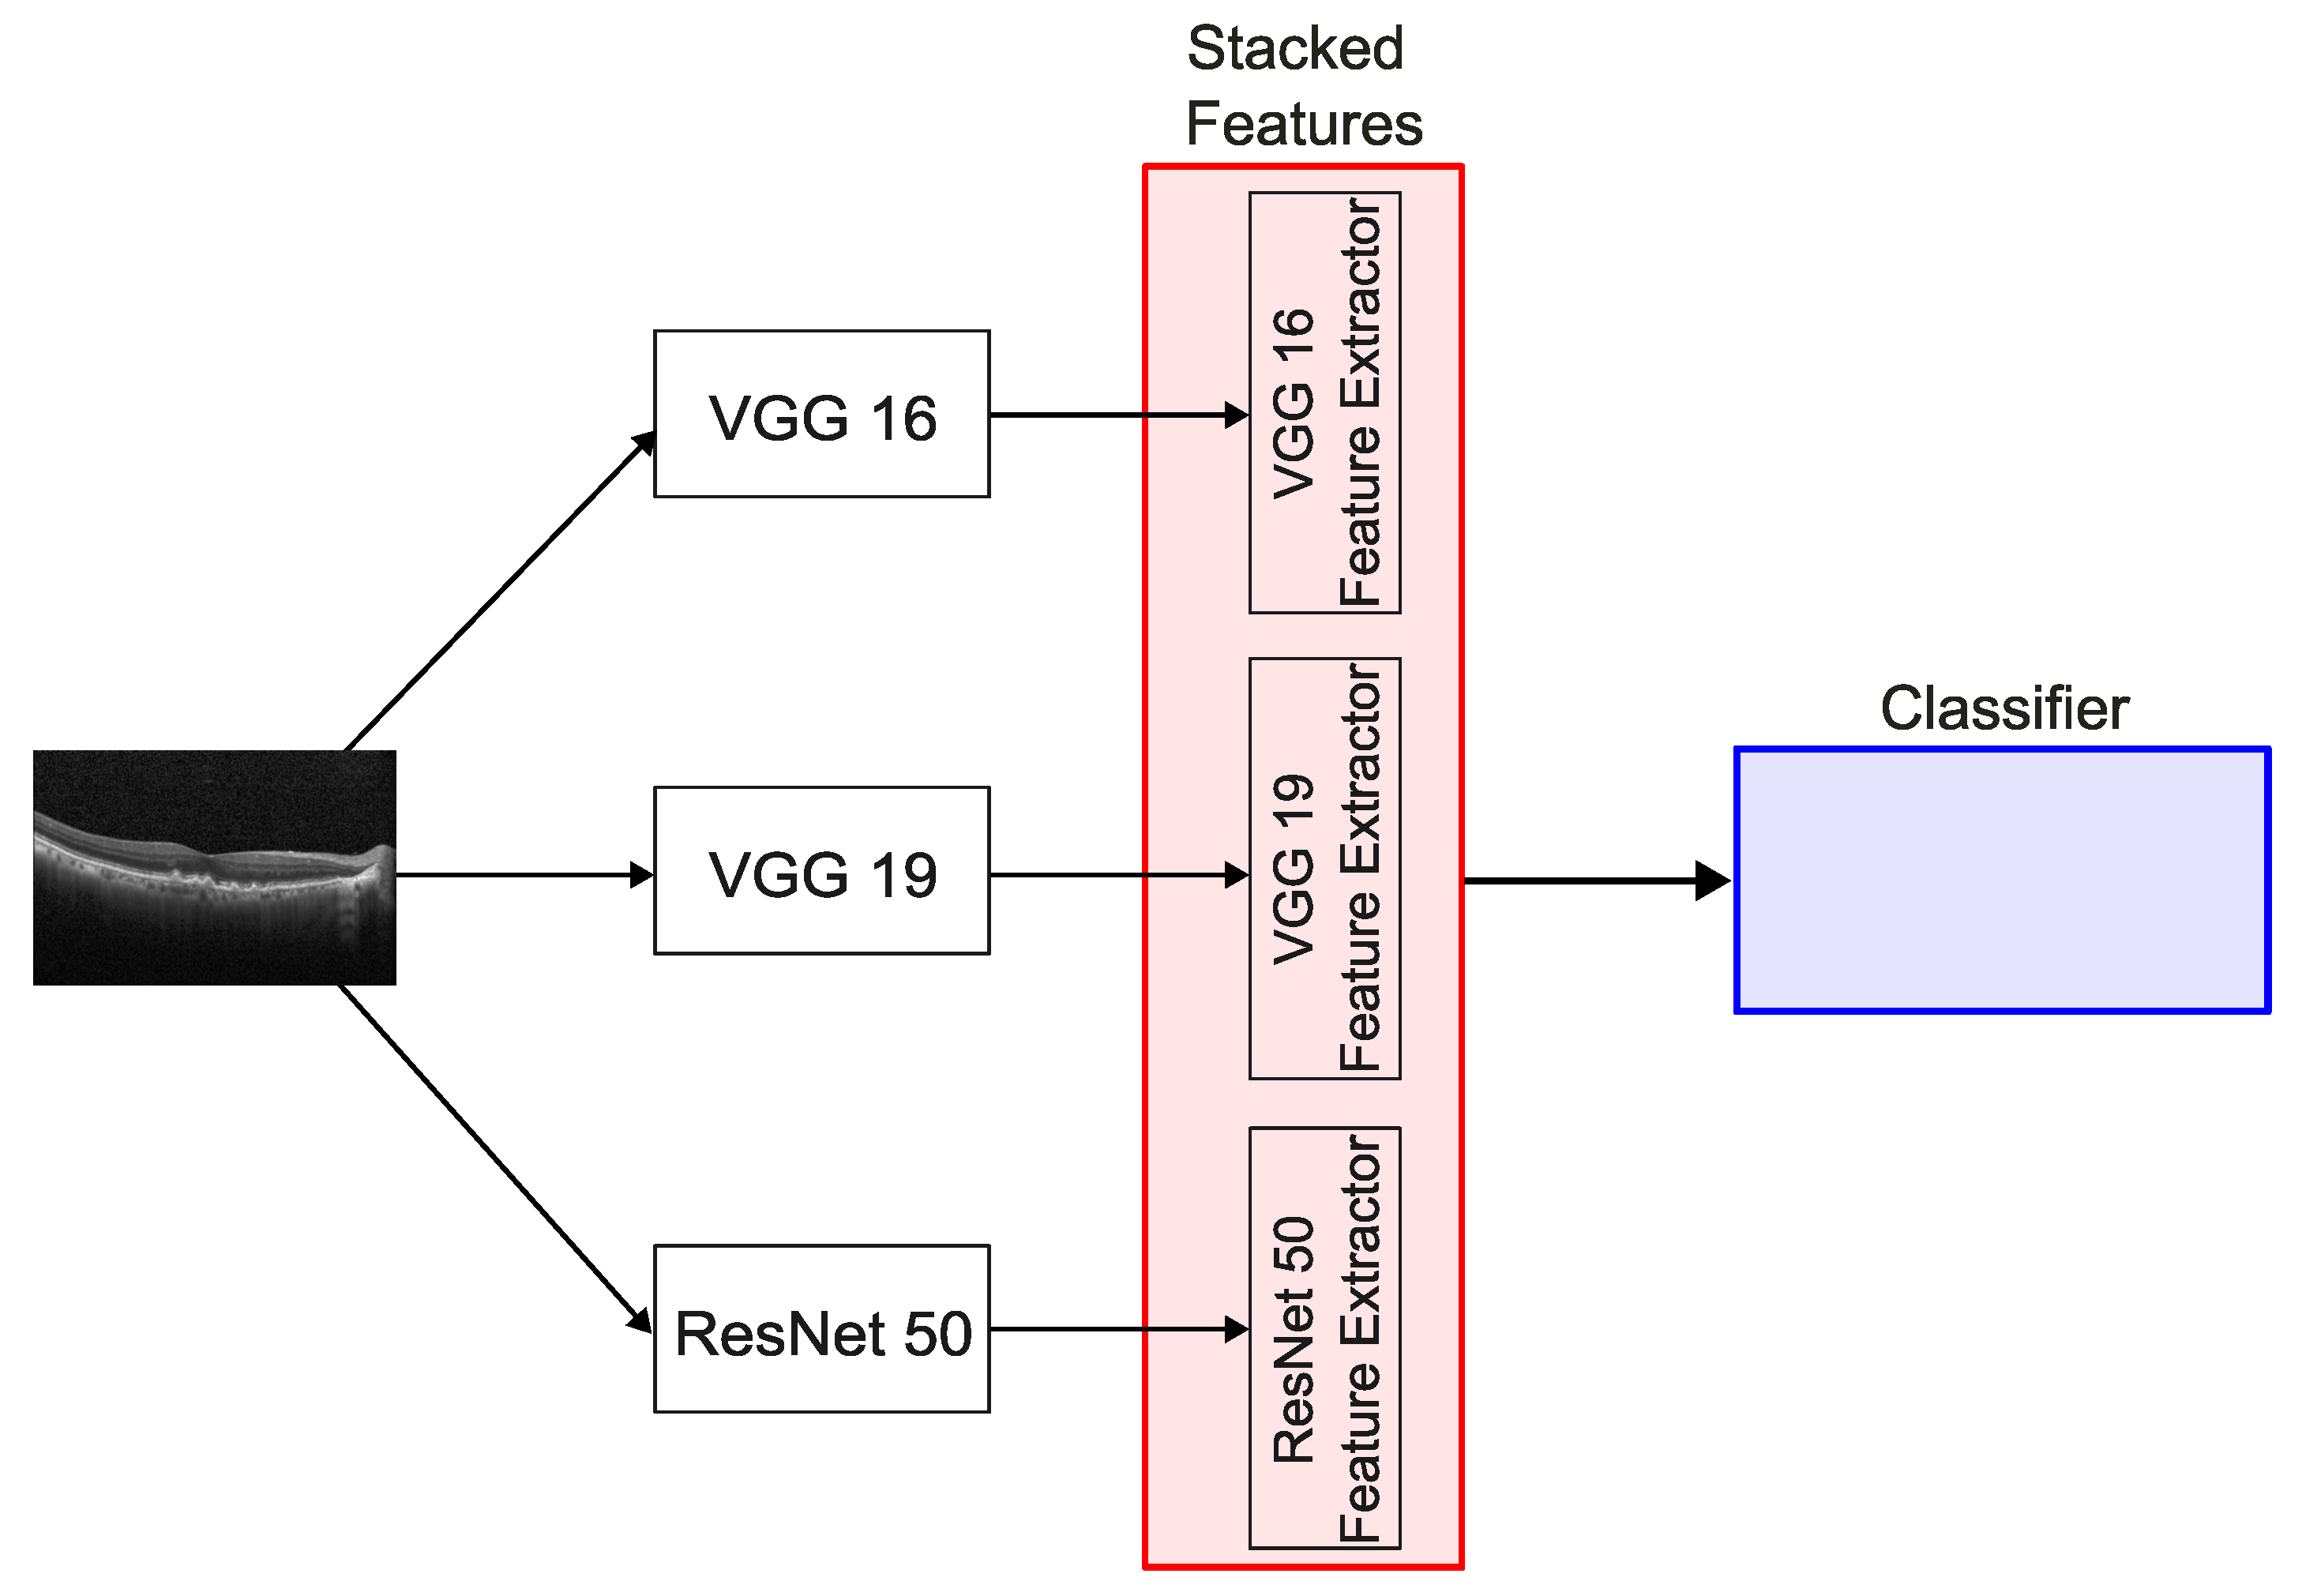
Figure 2.
Overview of the stacked model architecture.
Figure 3.
Overview of the classifier used for the stacked model.
Figure 4.
Grad-CAM heatmaps overlaid on OCT images, highlighting the regions of interest used by each model for prediction. From left to right: VGG16, VGG19, and ResNet50.
Figure 5.
Confusion matrices for the three models used: (a) VGG16; (b) VGG19; (c) ResNet50 (DME—diabetic macular edema; RVO—retinal vein occlusion).
Figure 6.
ROC curves for the three models used: (a) VGG16; (b) VGG19; (c) ResNet50 (0: Normal; 1: DME—diabetic macular edema; 2: RVO—retinal vein occlusion; 3: other).
Figure 7.
Confusion matrices for the three stacked model networks: (a) VGG16 & ResNet50; (b) VGG19 & ResNet50; (c) VGG16 & VGG19; (d) VGG16 & VGG19 & ResNet50 (DME—diabetic macular edema; RVO—retinal vein occlusion).
Figure 8.
ROC curves for the three stacked model networks: (a) VGG16 & ResNet50; (b) VGG19 & ResNet50; (c) VGG16 & VGG19; (d) VGG16 & VGG19 & ResNet50 (0: Normal; 1: DME—diabetic macular edema; 2: RVO—retinal vein occlusion; 3: other).
Figure 9.
Number of features extracted in the different combinations.
Table 1.
Number of images by class of the Kermany dataset.
| DME | Drusen | CNV | Normal |
|---|
| 11,171 | 8118 | 31,838 | 50,317 |
Table 2.
Added hidden layer parameters.
| Parameter | VGG16 & VGG19 | ResNet50 |
|---|
| Neurons | 2048 | 1024 |
| Activation Function | ReLU | ReLU |
| Dropout | 0.5 | 0.5 |
Table 3.
Number of images by class of the ULS São João dataset.
| | DME | RVO | Normal | Other |
|---|
| Training set | 980 | 948 | 968 | 992 |
| Validation set | 245 | 237 | 242 | 248 |
| Age (years) | 65.14 ± 11.41 | 70.13 ± 11.60 | 56.16 ± 17.14 | 59.93 ± 20.77 |
| Gender, n (%) | | | | |
| Male | 120 (55.05) | 104 (50.24) | 85 (41.67) | 101 (50.50) |
| Female | 98 (44.96) | 103 (49.76) | 119 (58.33) | 99 (49.50) |
Table 4.
Number of features of the different combinations.
| Combination | Number of Features |
|---|
| VGG16 & VGG19 | 50,176 |
| VGG16 & ResNet50 | 27,136 |
| VGG19 & ResNet50 | 27,136 |
| VGG16 & VGG19 & ResNet50 | 52,224 |
Table 5.
Average and best metrics for selected models using the ULS São João dataset.
| | VGG16 | VGG19 | ResNet50 |
|---|
| Metric (%) |
Average
|
Maximum
|
Average
|
Maximum
|
Average
|
Maximum
|
|---|
| Accuracy | 84.57 ± 0.72 | 85.63 | 84.87 ± 0.73 | 85.54 | 85.71 ± 4.19 | 88.90 |
| Precision | 98.82 ± 0.39 | 98.35 | 99.04 ± 0.58 | 98.61 | 99.00 ± 0.73 | 99.72 |
| Recall | 84.57 ± 0.72 | 85.63 | 84.87 ± 0.73 | 85.54 | 85.71 ± 4.19 | 88.90 |
| 87.08 ± 0.56 | 87.90 | 87.37 ± 0.62 | 87.87 | 88.05 ± 3.65 | 90.70 |
Table 6.
Average and best metrics for the stacked models using the ULS São João dataset.
| Metric (%) | SNN 1 | SNN 2 | SNN 3 | SNN 4 |
|---|
| Accuracy | 86.5 | 85.7 | 89.6 | 90.7 |
| Precision | 99.4 | 98.3 | 98.6 | 99.2 |
| Recall | 86.5 | 85.7 | 89.6 | 90.7 |
| 88.8 | 88.0 | 91.3 | 92.3 |
| Disclaimer/Publisher’s Note: The statements, opinions and data contained in all publications are solely those of the individual author(s) and contributor(s) and not of MDPI and/or the editor(s). MDPI and/or the editor(s) disclaim responsibility for any injury to people or property resulting from any ideas, methods, instructions or products referred to in the content. |
© 2025 by the authors. Licensee MDPI, Basel, Switzerland. This article is an open access article distributed under the terms and conditions of the Creative Commons Attribution (CC BY) license (https://creativecommons.org/licenses/by/4.0/).


 ,
, 


