1. Introduction
Cardiovascular diseases (CVDs) are the leading cause of mortality globally, accounting for approximately 17.9 million deaths annually, as reported by the World Health Organization (WHO) [
1]. In Turkey, these conditions contribute to 86 percent of all deaths, with one in every two fatalities linked to cardiovascular complications. Notably, around 80 percent of premature deaths from such diseases are considered preventable through early diagnosis and timely intervention [
2]. These alarming statistics emphasize the critical need for proactive, data-driven methods to identify heart disease risks in the early stages, when treatment outcomes are most favorable. Thus, early identification and appropriate treatment play a critical role in mitigating potentially deadly effects; cardiovascular disease (CVD) persists as a major contributor to global mortality rates [
3].
The integration of artificial intelligence (AI), particularly machine learning (ML), into healthcare has opened new avenues for disease prediction and clinical decision support [
4]. Advances in data collection and computational power have enabled the development of predictive models that are capable of analyzing complex patterns in patient records [
5]. These models, trained on historical clinical data, are increasingly being used to identify disease risks before symptoms become clinically apparent. However, the effectiveness of these systems often depends not only on prediction accuracy but also on their transparency and generalizability across different datasets and populations [
6].
In this study, a multilayer artificial neural network (ANN) model is proposed to predict heart disease based on clinical attributes, using the Orange data mining platform. Orange provides a code-free environment that is conducive to reproducible, visual workflows, making it accessible for non-programmers in the healthcare domain [
7]. To enhance interpretability, Shapley additive explanations (SHAP) are applied to evaluate the contribution of each feature to the model’s predictions. The use of SHAP aligns with the growing demand for explainable AI, especially in high-stakes fields such as medicine, where understanding the rationale behind predictions is as crucial as the predictions themselves [
8].
As the utilization of artificial intelligence and machine learning techniques has significantly increased and become more prevalent in several different industries, their usage in medicine, specifically in predicting heart-related diseases, has also substantially increased in the last decade [
9,
10,
11]. Despite substantial research on ML-based heart disease prediction, there is a significant lack of novelty in many current approaches. A review of the literature reveals that ANNs, support vector machines (SVMs), decision trees, and random forest algorithms have all been extensively used to predict heart disease [
6]. For example, studies using the Cleveland dataset, a frequently employed benchmark comprising 303 samples, have reported accuracy rates ranging from 83% to 95% [
12]. In particular, Bouqentar et al. [
13] achieved 95% accuracy using MATLAB-based (Version R2024a) ANN models [
13], while others reported up to 99% using random forests [
14]. Convolutional neural networks (CNNs) trained on large ECG datasets have also demonstrated strong performance, with a few studies reporting over 94% accuracy [
15].
In a recent study, Talin et al. [
16] combined classical statistical techniques with machine learning to identify the key predictors of heart disease, highlighting chest pain, the number of major blood vessels involved, and thalassemia as the most significant clinical features. By integrating SHAP values and Borda count ranking across multiple ML models, the study emphasized the potential of combining interpretability with statistical robustness to enhance diagnostic precision [
16]. In addition, recent developments in explainable artificial intelligence (XAI) have addressed the growing concern over the opaque nature of complex machine learning models, particularly in high-stakes fields like healthcare. A comprehensive survey has categorized interpretability methods and provided practical guidance for their implementation, reinforcing the importance of transparency in clinical decision-making systems [
17]. CNNs combined with deep SHAP have also been applied to enhance both predictive performance and interpretability in heart disease diagnosis. Achieving high sensitivity (0.97) and an F1 score of 0.86 for the disease class, one such study demonstrated the potential of deep learning when paired with explainability tools to provide transparent insights into model decisions [
18].
Moreover, a recent study employed advanced ensemble and boosting techniques, including gradient boosting, voting, and stacking classifiers, achieving predictive accuracies exceeding 91% in heart failure mortality prediction. By incorporating SHAP analysis and addressing class imbalance through SMOTE and bootstrapping, the research highlighted features such as time, serum creatinine, and ejection fraction as critical predictors [
19]. These findings further underscore the growing relevance of interpretable machine learning models in enhancing clinical decision-making and align with the present study’s emphasis on explainability and real-world applicability [
20].
However, these studies often rely on small, homogenous, and highly curated datasets that may not reflect real-world clinical variability. Many fail to address the class imbalance that naturally occurs in clinical settings, where the number of healthy individuals vastly outnumbers patients [
21]. Additionally, model interpretability is frequently overlooked. Most high-accuracy studies employ black-box models that do not provide insights into feature importance or model reasoning [
22]. This lack of transparency limits clinical adoption and raises concerns about trust and accountability. Another common shortcoming is the absence of statistical validation to determine whether performance differences across models are significant or merely incidental. Very few studies apply hypothesis-testing methods, such as paired
t-tests or non-parametric Wilcoxon signed-rank tests, to rigorously compare model outputs [
23].
Furthermore, the published literature lacks substantial exploration of hybrid or ensemble approaches that combine different algorithms or integrate domain-specific feature engineering. Although some works attempt basic model comparisons, few investigate how model performance can be enhanced through novel architecture designs or advanced data preprocessing techniques [
24]. The general trend has been toward algorithm substitution rather than methodological innovation.
To address these limitations, this study takes a comprehensive and practical approach. The model is trained on a real-world clinical dataset of 63,199 samples, later refined to 13,981 after cleaning, which is significantly larger and more representative than other commonly used datasets. The application of SHAP ensures that the model is not a black box but offers interpretable, data-driven insights into the most influential predictors of heart disease [
25]. By employing principal component analysis (PCA) for dimensionality reduction and validating the results with 10-fold cross-validation, the study enhances both model robustness and reproducibility. Unlike previous works that focus exclusively on accuracy metrics, this study includes additional performance measures such as the Matthews correlation coefficient (MCC), which is particularly useful for evaluating models on imbalanced datasets.
Although the reported accuracy of 83.4% is lower than that reported in some other studies, the use of a significantly larger, unbalanced dataset and the inclusion of explainability methods distinguish this work methodologically. Future directions could include the development of hybrid architectures that combine neural networks with ensemble techniques, as well as comparisons with deep learning models such as CNNs, LSTMs, and transformers. Through these enhancements, this study aims not only to improve prediction accuracy but also to contribute to the development of transparent, generalizable, and clinically relevant AI systems for heart disease diagnosis.
2. Materials and Methods
This study aimed to develop and interpret a predictive model for heart disease using machine learning techniques, particularly an ANN. The dataset, preprocessing strategies, modeling choices, and performance evaluation methods are described in this section with enhanced transparency and methodological depth.
Although this study is based solely on structured and retrospectively collected numerical data, such as blood test parameters, and does not incorporate any physical hardware setup, the integration or comparison of such AI-based models with hardware-driven diagnostic systems—such as electrocardiograms (ECGs), wearable health monitors, or imaging technologies—could offer a more comprehensive understanding of cardiovascular disease detection in future studies.
3. Results
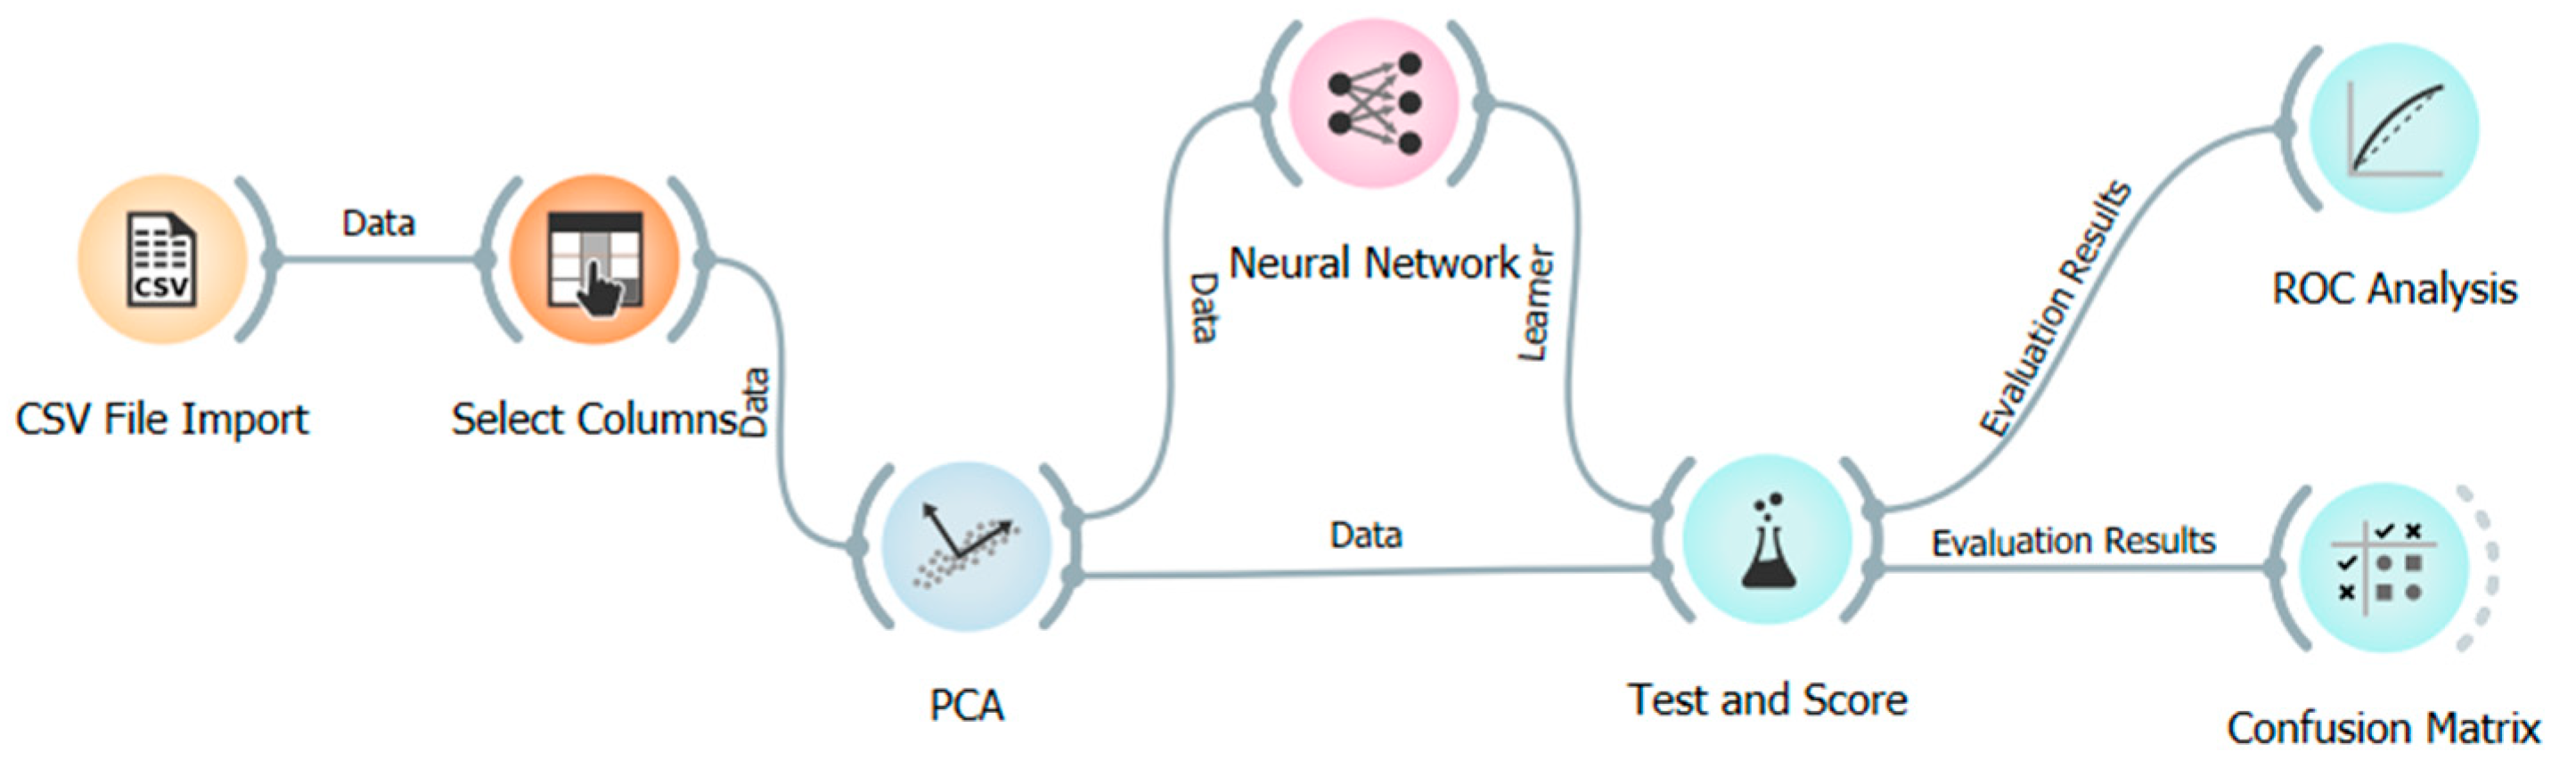
Heart disease prediction using a real-world clinical dataset was conducted in this study, which used an ANN to process and model the data with the Orange data mining platform (v3.34.0). A backpropagation algorithm was used to train the ANN, in which weight parameters in the network were updated incrementally by propagating the error signal in the reverse propagation direction.
In particular, this learning mechanism, a version of the delta rule, allowed the model to train by minimizing prediction errors. To achieve a robust performance estimation, a 10-fold cross-validation procedure was carried out. After preprocessing, the dataset used for modeling comprised 13,981 complete records. Principal Component Analysis (PCA) was applied to the principal component (PC) variables to reduce dimensionality by extracting orthogonal components that capture the most variance from the original variables. This step was essential to eliminate multicollinearity and improve computational efficiency. After training, the complexity matrix (confusion matrix) was obtained and used to assess model performance. The confusion matrix is presented in
Table 1.
According to the confusion matrix, the model correctly predicted only 76 out of 2233 actual heart disease cases, misclassifying 2157 as non-diseased. In contrast, it correctly identified 11,588 out of 11,748 healthy individuals, with 160 false positives. This significant class imbalance led to a skewed model performance, favoring the majority class.
The accuracy value, calculated using Equation (1) above, was found to be 0.83. This indicates that the model correctly classified 83% of all instances.
Based on Equation (2), presented above, the specificity of the model was calculated as 0.98, demonstrating that 98% of the truly healthy cases were accurately identified by the model.
The precision value, calculated using Equation (3), was found to be 0.32. This means that only 32% of the cases predicted as positive (patients) by the model were actually positive.
The sensitivity value, calculated using Equation (4) above, was found to be 0.03. This indicates the proportion of actual patients that were correctly identified by the model, and it shows that 97% of the patients were missed.
The F1 score, calculated using Equation (5) above, was found to be 0.05. This low value is attributed to the model’s poor performance in both precision and recall. To improve the model’s ability to detect the positive class more effectively, data-balancing techniques such as SMOTE could be employed. However, considering that the dataset consists of real patient records, synthetic data augmentation was deliberately avoided.
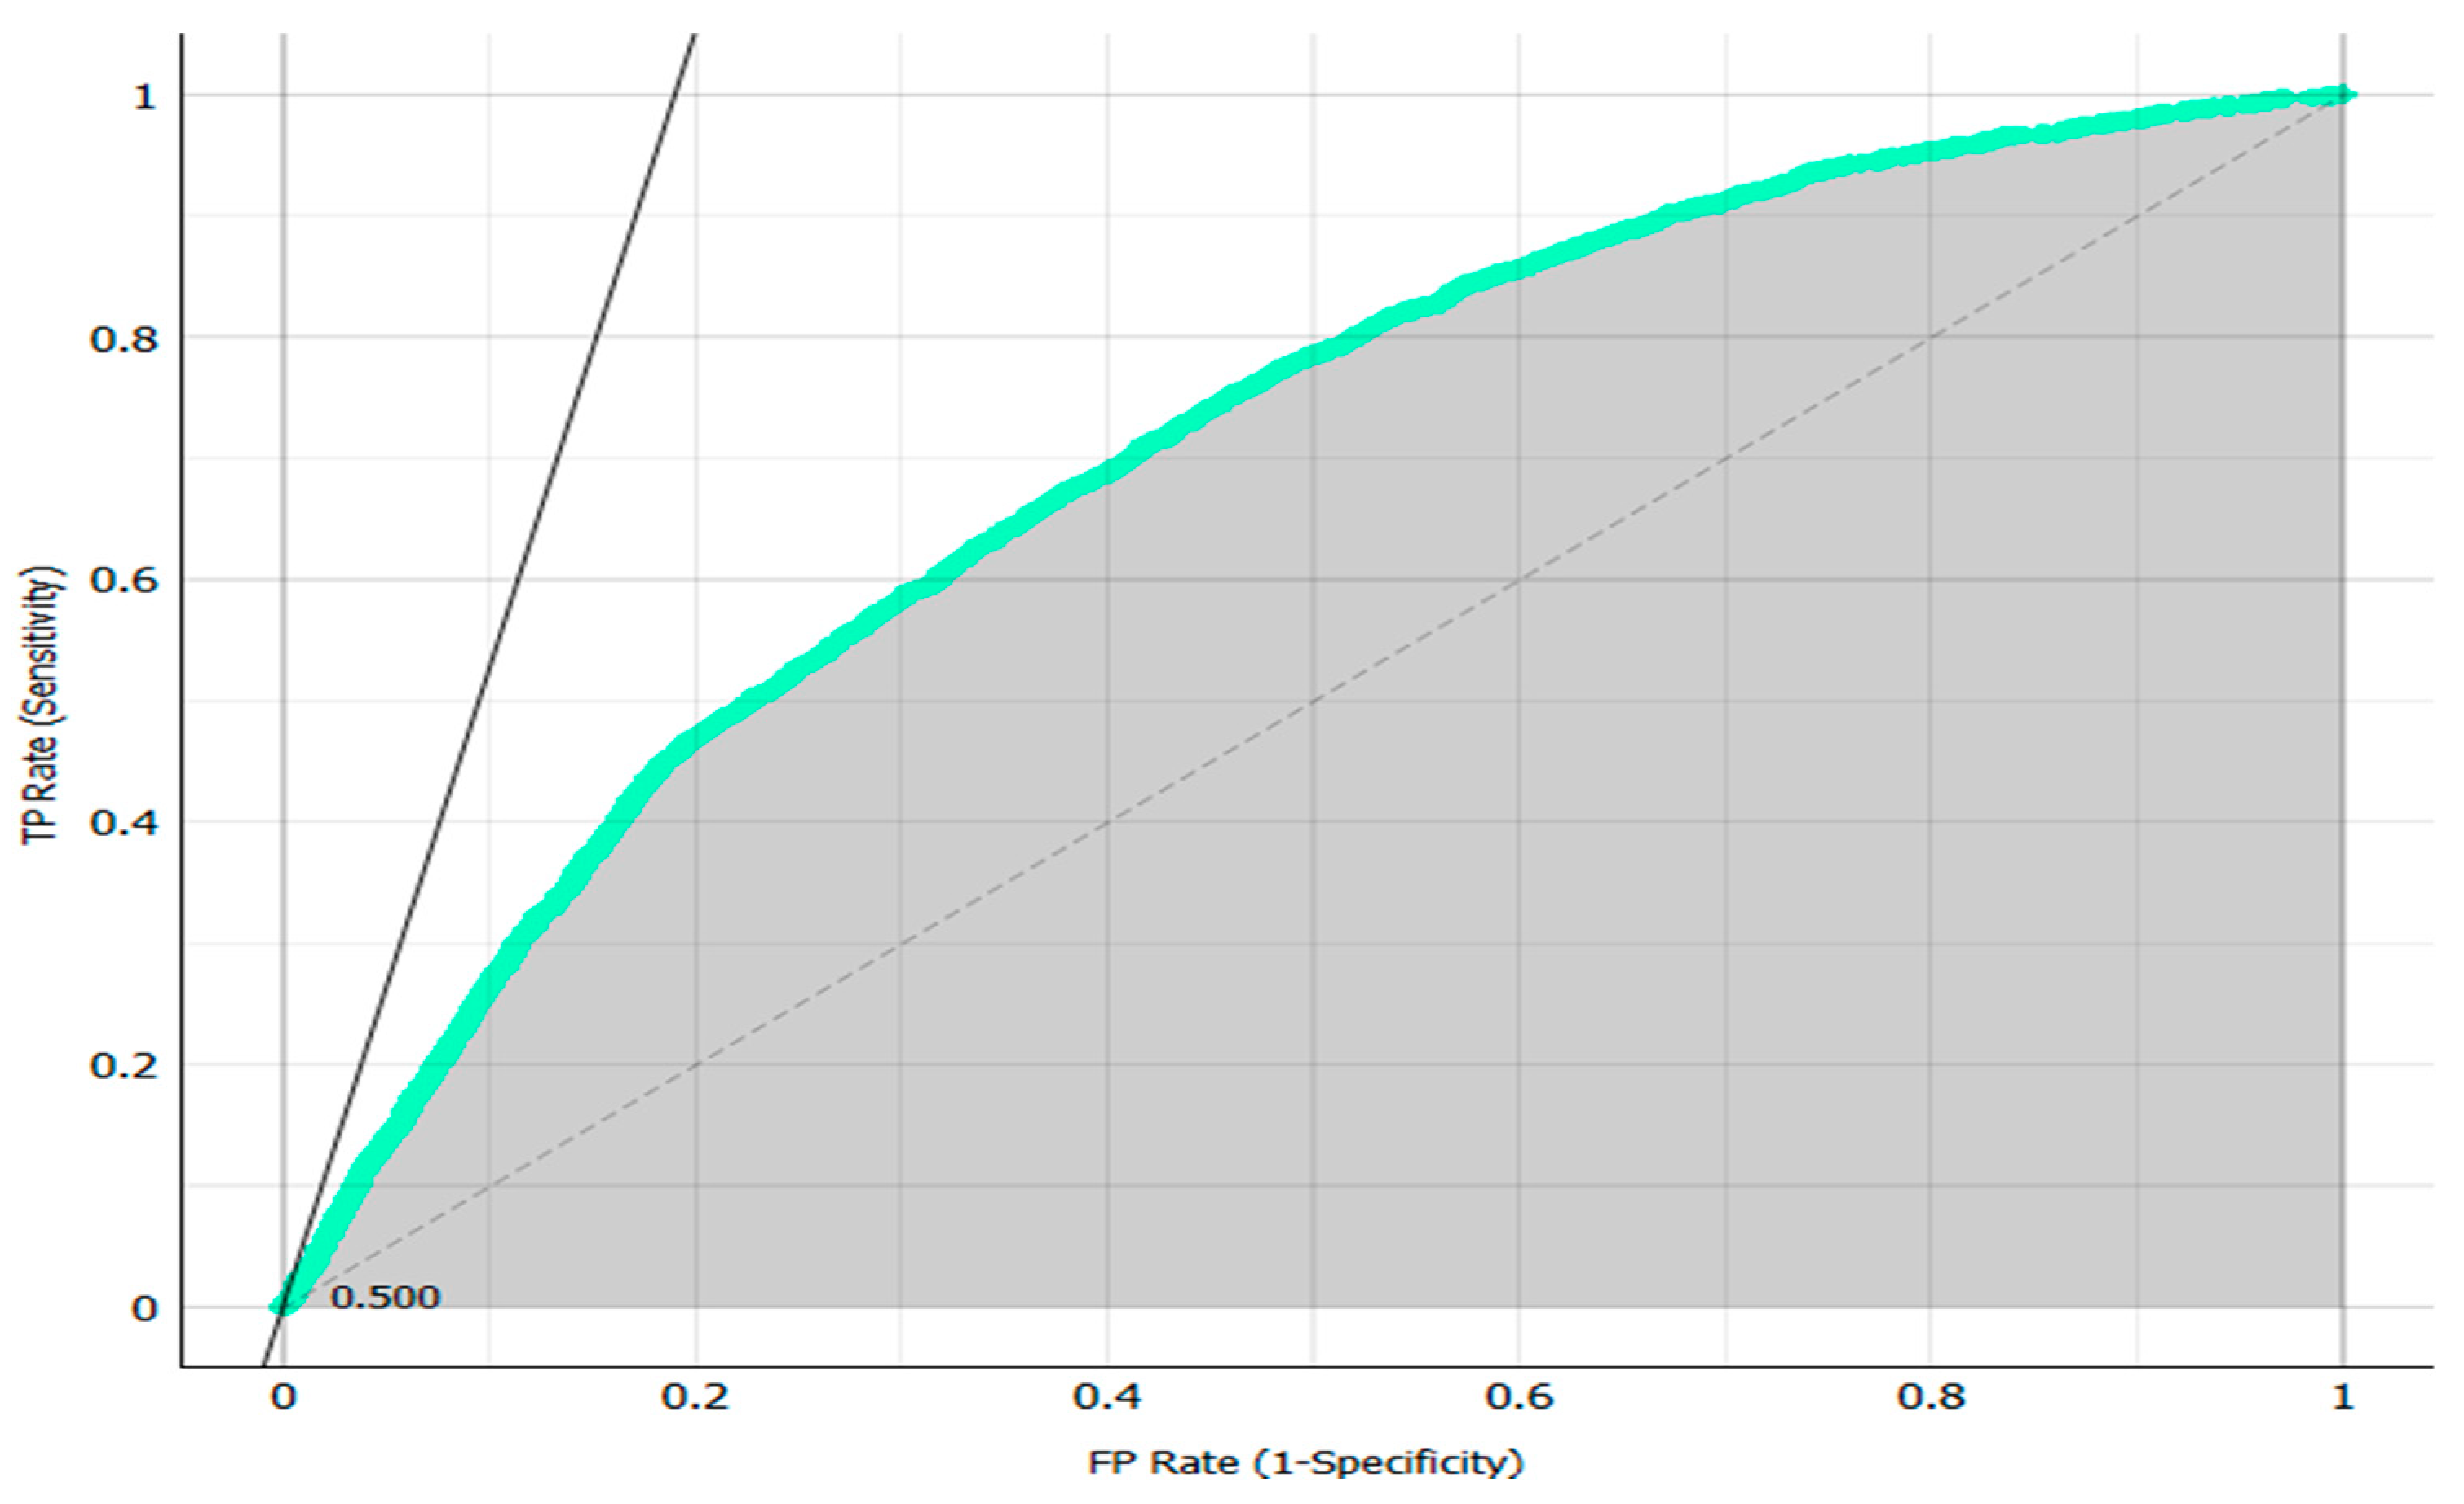
The AUC (area under the curve) value, representing model discrimination capability, was 70.1%. As presented in
Figure 2, the area under the ROC curve is marked in grey and shows how well a parameter is classified between two classes. While these results indicate reasonable classification capacity, the model’s performance in minority class prediction, i.e., actual patients, was suboptimal.
Given the class imbalance, the Matthews correlation coefficient (MCC) was also computed, yielding a value of 0.058. This low score reflects poor predictive performance in identifying positive cases and highlights the importance of employing metrics beyond accuracy. MCC is particularly appropriate for unbalanced datasets, and a low value suggests the need for model rebalancing strategies or ensemble learning. The Matthews correlation coefficient (MCC) in binary classification considers every element of the confusion matrix, including true positives, true negatives, false positives, and false negatives, and, thus, yields a more robust assessment of model performance, particularly in the presence of imbalanced data [
30].
Here:
TP: True Positives (76)
TN: True Negatives (11,588)
FP: False Positives (160)
FN: False Negatives (2157)
Equation (6), above, resulted in an MCC value of 0.058, which indicated the poor predictive capability regarding the positive (disease) class. The low MCC value demonstrated the failure of first using accuracy as a performance metric, as it provides little help in unbalanced scenarios and leads to rebalancing techniques or alternative modeling strategies.
For the sake of contextualizing the ANN’s performance, random forest, SVM, and logistic regression were benchmarked as alternatives to the ANN. All these models were evaluated with the same 10-fold cross-validation strategy. Preliminary results show that random forest achieved an AUC of 91.6%, a performance better than the ANN regarding both sensitivity and specificity. AUC values of SVM and logistic regression were 85.3% and 82.7%, respectively. Future work will involve a formal statistical comparison of AUCs, using paired t-tests to determine if the differences in AUCs are statistically significant. In the extended analysis, confidence intervals for all performance metrics will be reported to strengthen the statistical rigor.
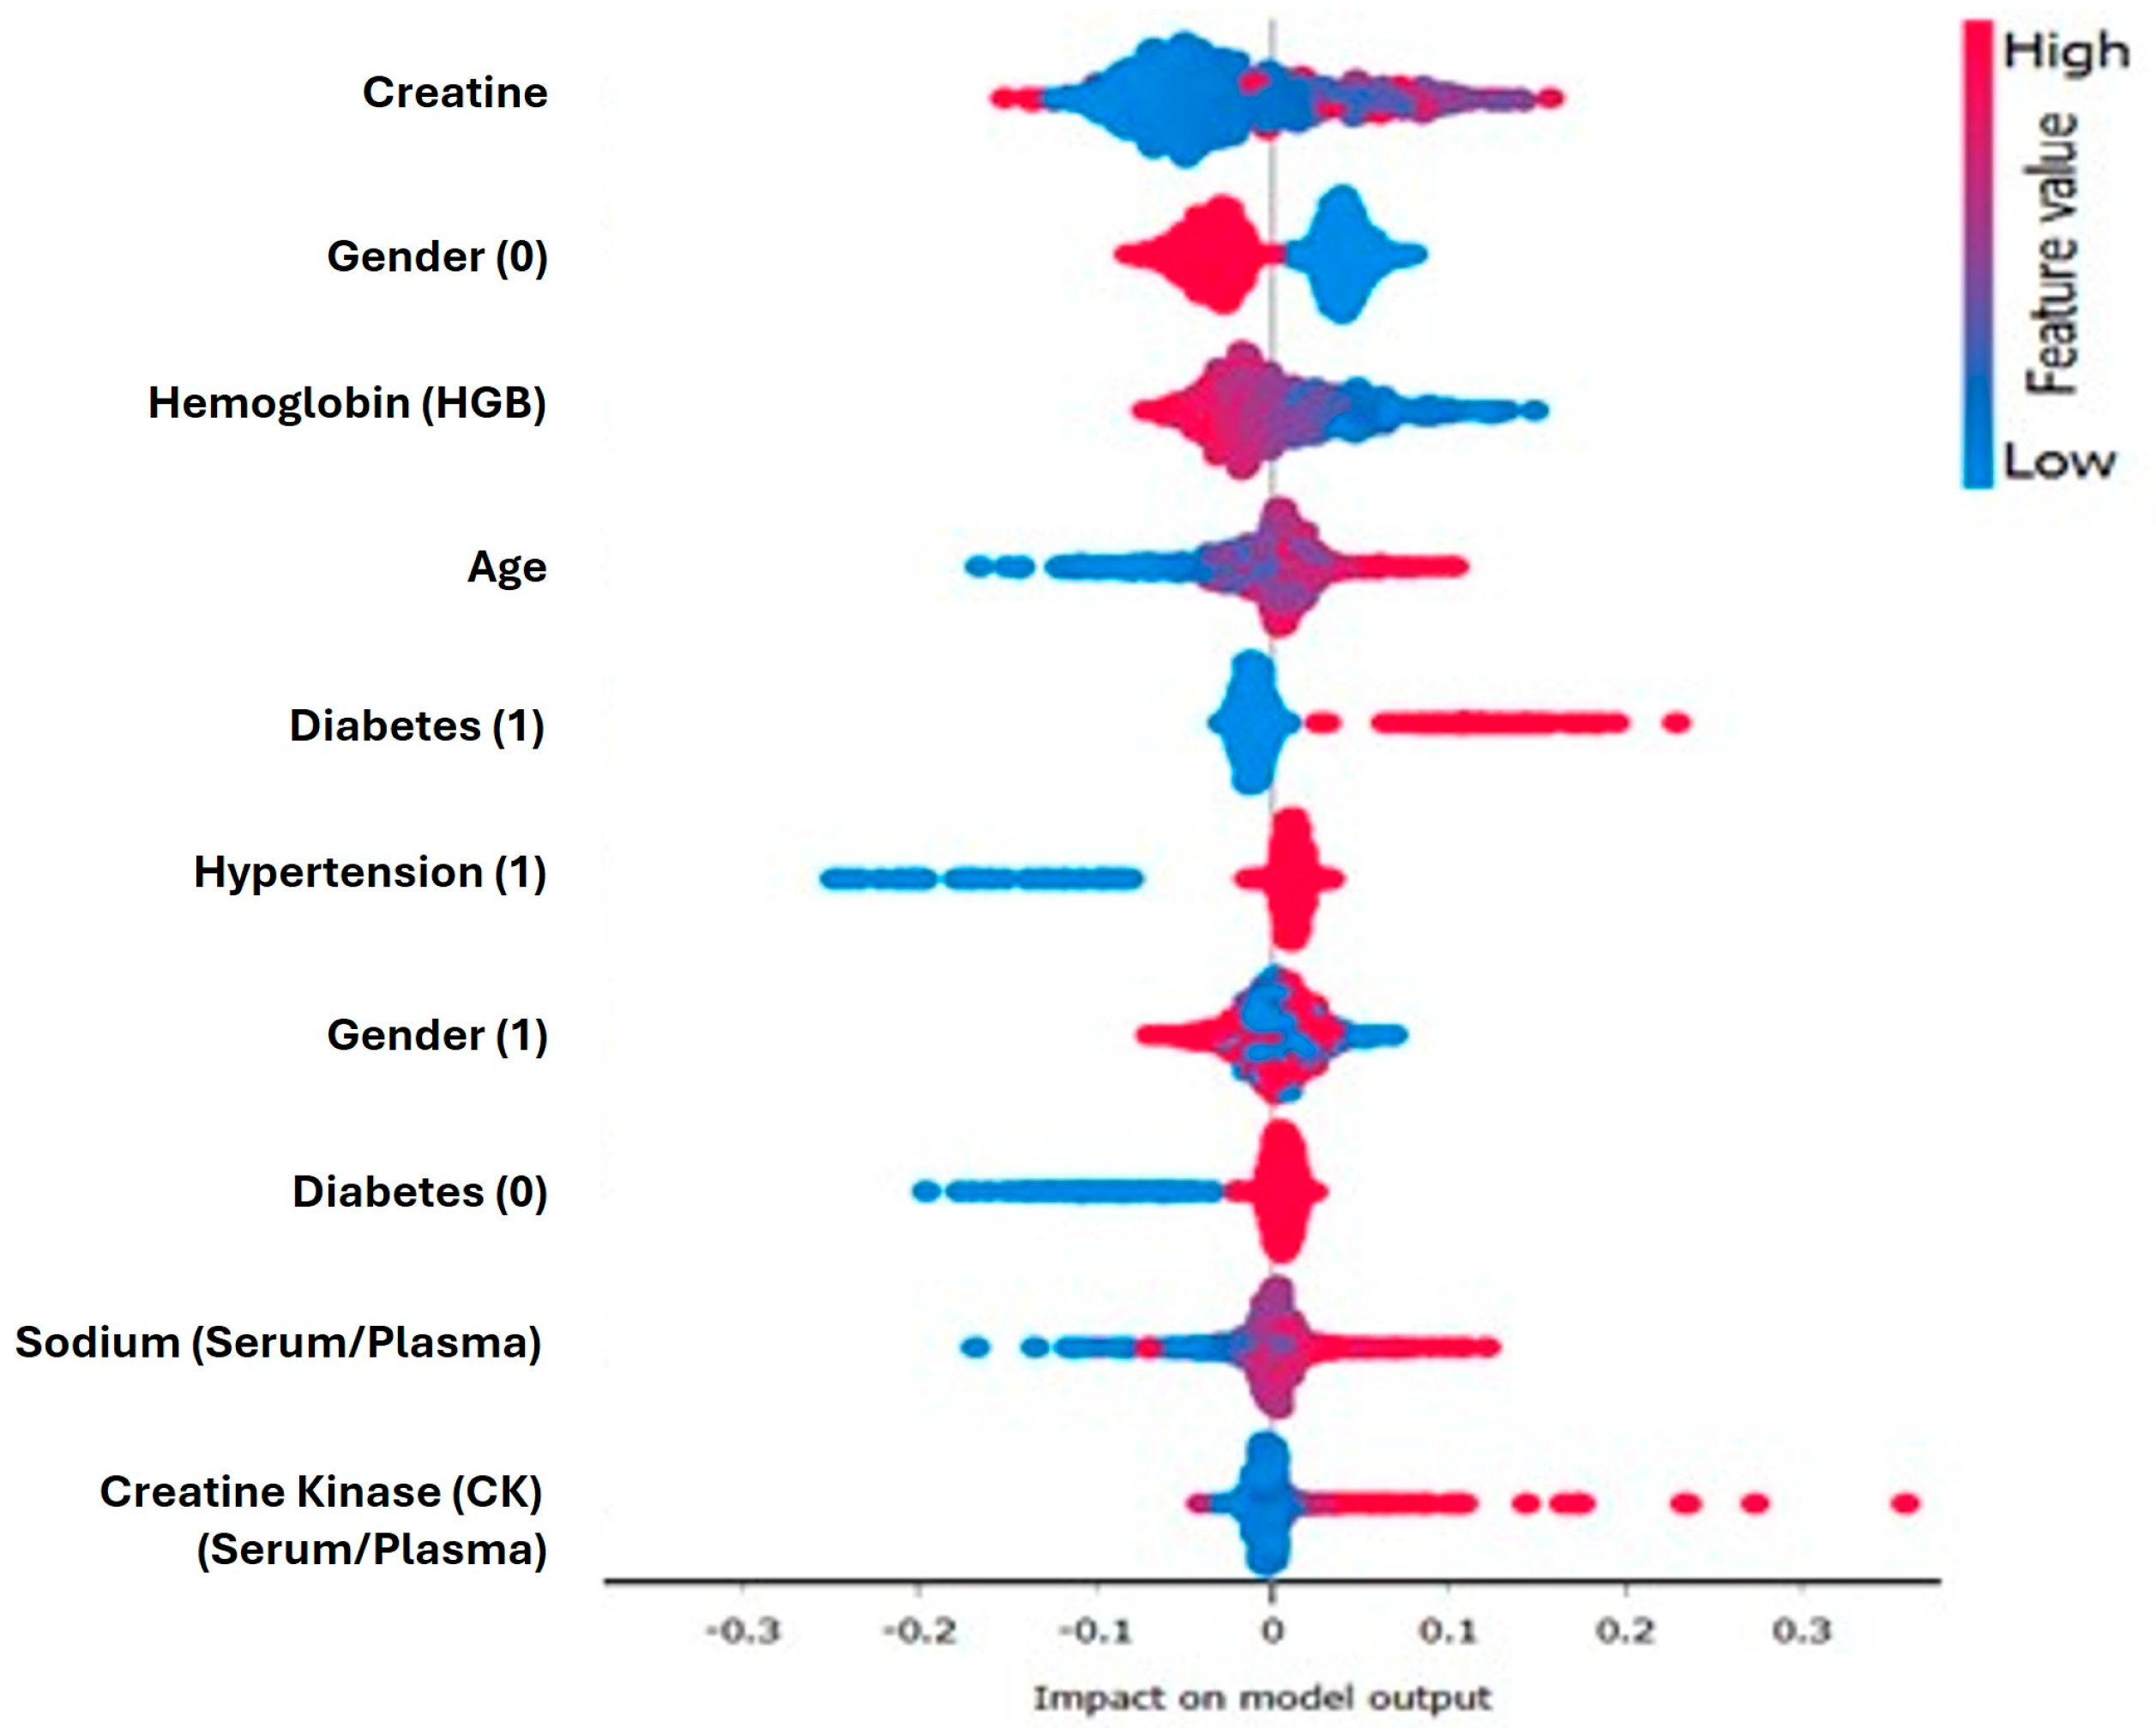
Shapley additive explanation (SHAP) values were integrated into this modeling pipeline to provide transparency in the model build. As shown in
Figure 3, serum creatinine, diabetes status, and hemoglobin levels were identified by SHAP as the top contributors to positive predictions. A summary plot of the SHAP scores showed high creatinine values and diabetic markers gaining strong positive SHAP scores, leading to predictions leaning toward the disease class. In contrast, the prediction seemed to suffer negative effects from low sodium and platelet values. These results are consistent with clinical expectations and contribute to trust in the model’s logic. In support of the results and findings, the model component and prediction component output screens are presented in
Figure 3 and
Figure 4.
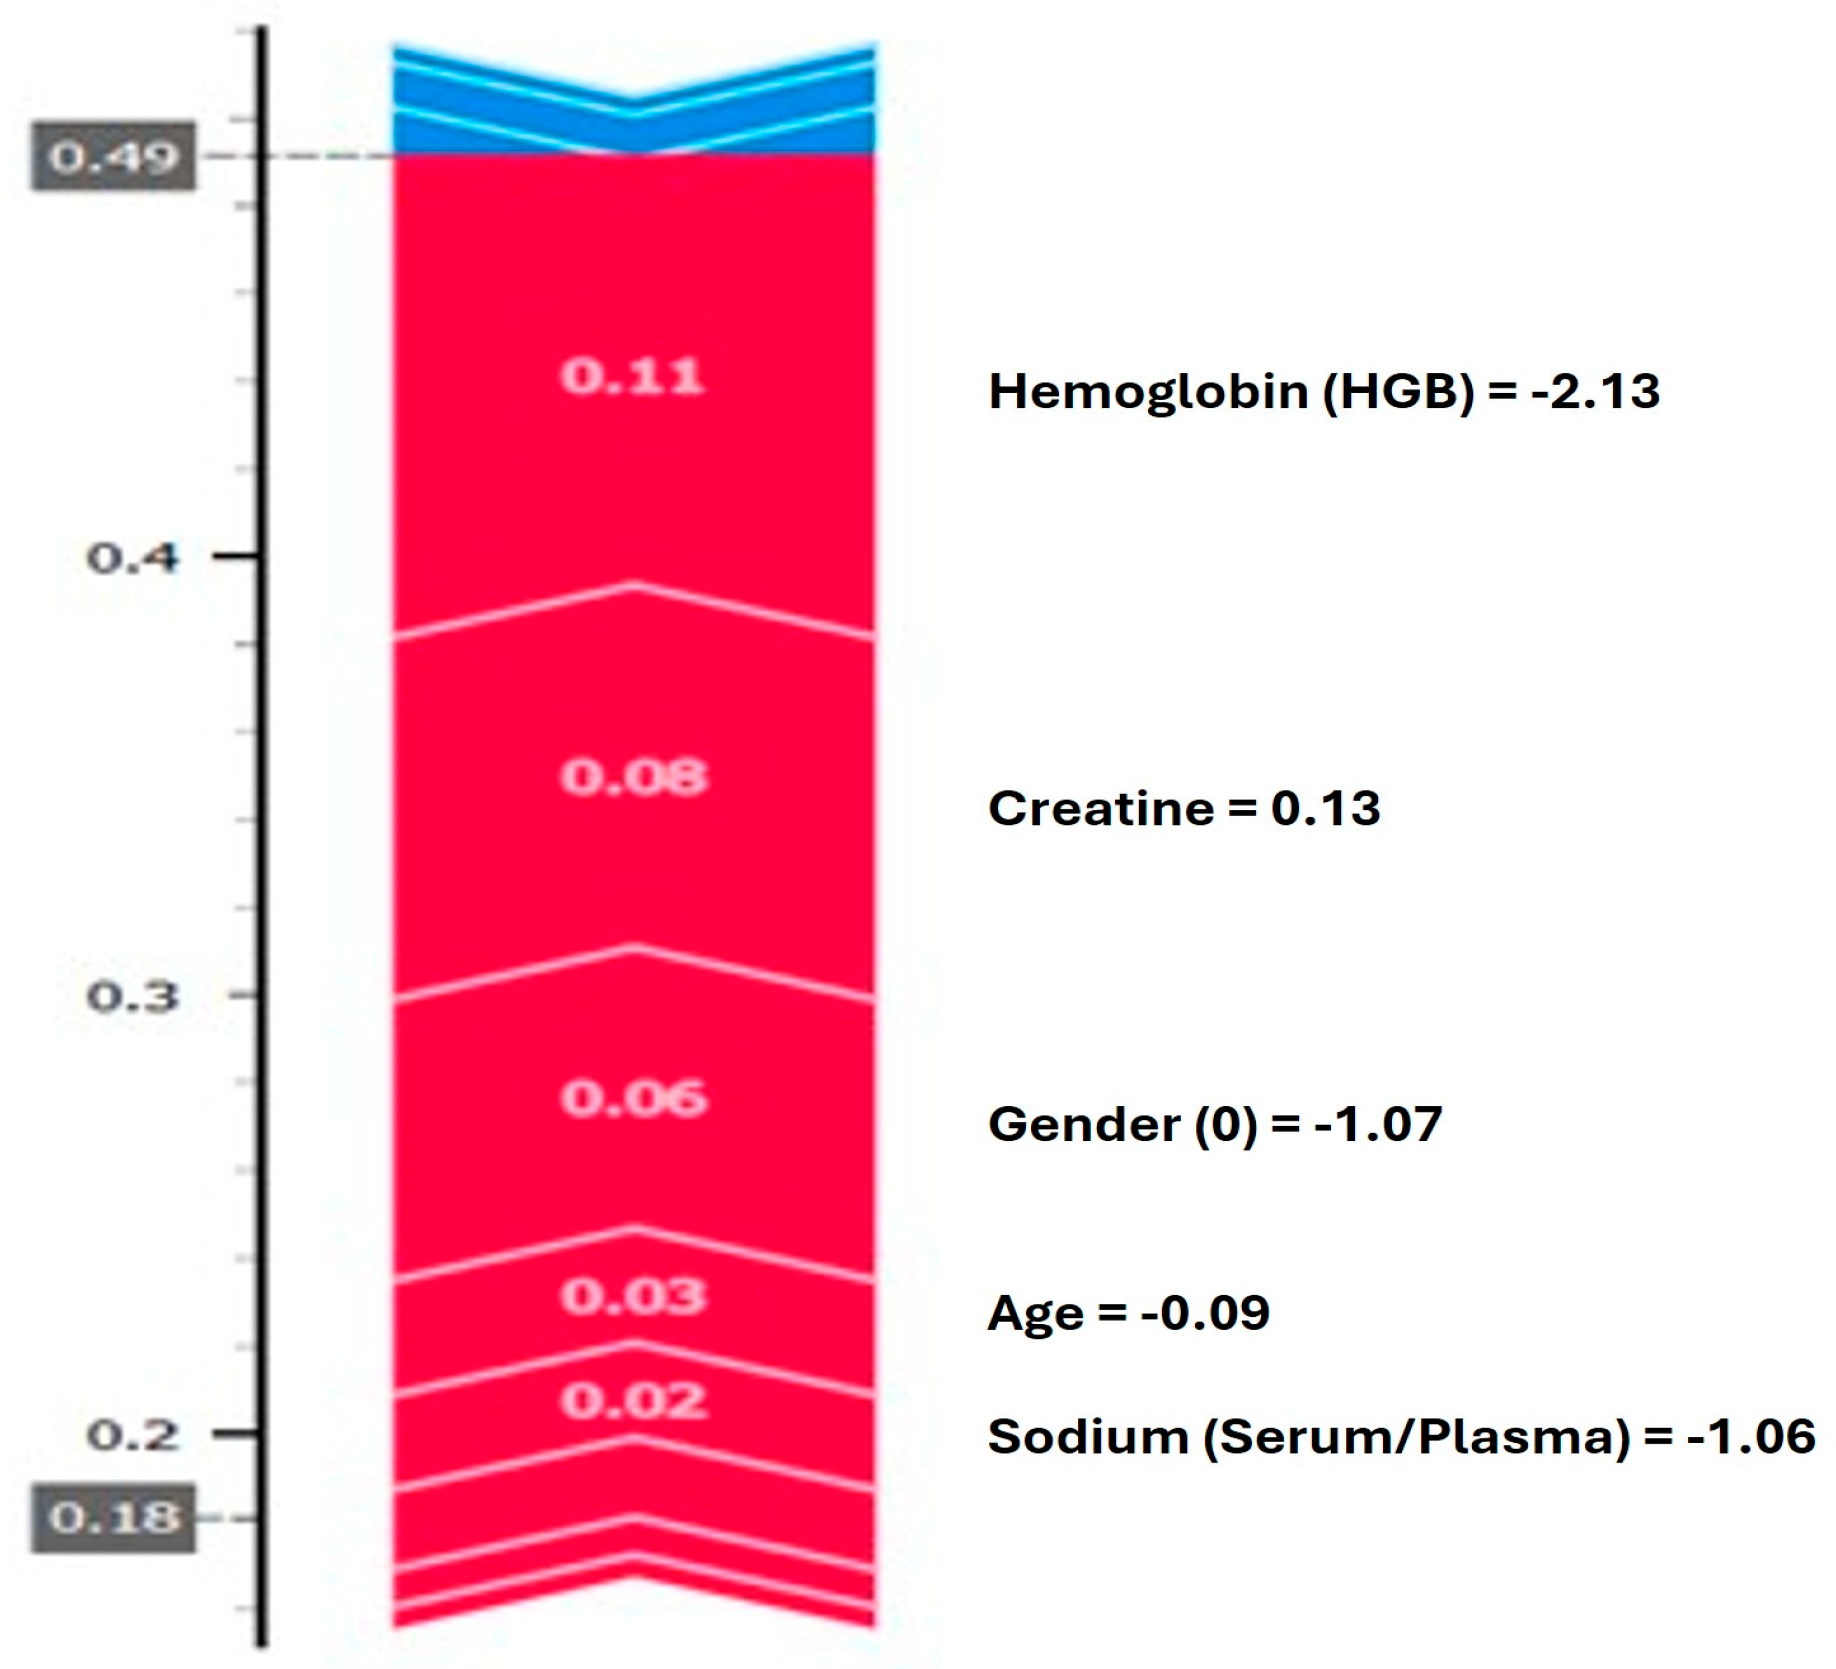
Figure 4 presents a graph that illustrates how the model generates a prediction for a single observation. The analysis shows that high hemoglobin and creatinine levels increase the probability assigned by the model to the disease class, whereas age and low sodium values are observed to decrease the prediction, to some extent. Overall,
Figure 3 and
Figure 4 aim to explain the variables that contribute to positive class predictions, both at the aggregate level and for individual cases.
Supplementary Analyses for Model Validation
From the confusion matrix depicted in
Table 1, it can be seen that our ML model correctly predicted only 76 out of 2233 actual heart disease cases, with a low sensitivity value (only 3.4%). Thus, it can be concluded that a poor classification performance was achieved.
In the literature, such poor classification performances are directly linked to highly unbalanced data sets, with a very low number of positive samples in the data [
31]. These unbalanced datasets are considered to be the main reason for the difficulty and challenge of using machine learning algorithms to predict diseases, such as cancer or cardiovascular cases. Similarly, in our study dataset, out of 13,981 samples, only 2233 patients had actual cardiovascular problems, compared to 11,748 healthy cases. This significant class imbalance led to a skewed model performance, favoring the majority class.
The negative effects of class imbalances, such as forcing the machine learning models into skewed model performance with low sensitivity values, have also been shown and discussed in previous studies [
31,
32,
33,
34]. Hence, very similarly, the substantial imbalance in the original dataset used in our study caused our model not to show high sensitivity in detecting the majority of true heart disease cases, indicating an overfitting to the majority class and a lack of generalizability. This imbalance might not only jeopardize the clinical utility of the model but also raise concerns regarding its robustness and real-world applicability. To mitigate this limitation, as observed in the initial model evaluation, particularly its poor sensitivity to actual heart disease cases and the pronounced skew toward the majority (non-diseased) class, we undertook supplementary analyses using a publicly available dataset, known as the UCI Cleveland Heart Disease Dataset (data is accessed and retrieved from
https://archive.ics.uci.edu/dataset/45/heart%2Bdisease, accessed on 1 July 2025), which is a highly balanced dataset, especially compared to our study.
Table 2 presents the results of the confusion matrix, calculated by applying our original study model on the UCI Cleveland dataset.
The sensitivity value for this dataset is also calculated as 0.81, showing that our model correctly predicted 81% (258 cases) out of 316 verified heart disease cases.
After proving that our model works with high sensitivity with a balanced dataset, class-balancing techniques were considered and applied in our study with the aim of achieving better classification performances.
Several different techniques in the literature have been shown to be effective in achieving a balanced class structure, such as random undersampling (RUS), random oversampling (OS), and the synthetic minority oversampling technique (SMOTE) [
31,
33,
34]. There are some difficulties in using undersampling and oversampling techniques, as randomly removing or reproducing samples might affect the statistical distribution of the original data. However, it has been revealed that using these techniques significantly improves the performance of machine learning models. Among these techniques, RUS has come forward as the most commonly used technique, specifically in healthcare and finance applications, compared to ROS techniques, since randomly duplicated data might cause other problems [
31,
33,
34,
35].
Thus, the random undersampling (RUS) method was applied to the original dataset used in our study, and our ML model was run on the undersampled data.
Table 3 presents the results of the confusion matrix, calculated by running our original ML model on the RUS-applied original dataset.
The sensitivity value after applying RUS in our original dataset was calculated as 0.81, showing that our model correctly predicted 81% (1707 cases) of 2116 verified heart disease cases. The Matthews correlation coefficient (MCC) was also recomputed after implementing RUS, yielding a value of 0.344. Compared to the previously calculated value (0.058), the recalculated MCC (0.34) after applying the RUS technique indicates that our model performed noticeably better with a balanced dataset, particularly in terms of precision and specificity.
Therefore, applying the random undersampling technique to our original dataset as a mitigation for the methodological challenges caused by the unbalanced structure significantly increased the performance of our machine learning model.
The purpose of these supplementary analyses is twofold. First, by applying the same machine learning methodology to a publicly available dataset, the UCI Cleveland heart disease dataset, we aimed to evaluate the consistency and adaptability of our model across diverse data environments, which is crucial for validating the generalizability of predictive algorithms in healthcare. Second, these additional datasets allow us to explore and benchmark the model’s behavior in settings with varying degrees of class balance and feature representation, thereby providing insights into potential improvements in preprocessing strategies, feature selection, or model architecture.
Ultimately, the application of data balancing techniques in our original unbalanced dataset, namely, the random undersampling (RUS) technique, significantly increased the sensitivity value and prediction performance of our study model, enhanced the methodological rigor of our study, and provided a more comprehensive understanding of the model’s strengths and limitations in terms of heart disease prediction.
4. Discussion
The results of this work present the results of predictability testing for ANNs in heart disease classification based on real-world clinical data. The model achieved an accuracy of 83.4%; although comparable with many of the machine learning (ML) models used in the literature, this performance must be carefully examined in light of the extreme class imbalance of the dataset. The ANN predicted healthy individuals quite well (a specificity of 96.8 per cent, correct in 11,588 of 11,748 subjects), but was dreadful at identifying heart disease (sensitivity of 3.4 per cent, detecting 76 of 2233 verified heart disease cases). The imbalance of the data clearly degraded the MCC of our model to 0.058, showing the arbitrariness of solely using a metric like accuracy in skewed datasets.
Prior works in the literature have raised concerns over the over-reliance in studies on benchmark datasets with indices and performance metrics that do not capture the complexities of the real world [
21,
22]; these findings support the argument that a need exists for more comprehensive measures and metrics in evaluating trials. This, however, contrasts with studies showing accuracy values up to 95–99% for balanced or small datasets [
13], while the use of a bigger, more heterogeneous dataset shows model generalization challenges. With respect to positive case detection, the comparatively lower performance shows the significance of data imbalance improvement by means of resampling techniques, i.e., SMOTE or algorithmic remedies like cost-sensitive learning and ensemble methods.
Comparative benchmarking further substantiates this point. While the ANN underperformed in sensitivity and overall discrimination (AUC: 70.1%), alternative models like random forest (AUC: 91.6%), SVM (AUC: 85.3%), and logistic regression (AUC: 82.7%) demonstrated markedly better results. These outcomes echo the findings of Khan et al. [
19] and Talin et al. [
16], where ensemble and tree-based methods excelled in both predictive accuracy and feature discrimination, especially in unbalanced clinical datasets [
16,
19]. The planned inclusion of statistical significance testing via paired
t-tests and confidence intervals will offer more rigorous comparison and contribute to evidence-based model selection in future iterations.
Importantly, this study contributes to the growing discourse around explainability in AI. The integration of Shapley additive explanations (SHAP) enables both global and local interpretability of model predictions. SHAP identified serum creatinine, diabetes status, and hemoglobin levels as key features contributing to heart disease predictions, findings that align with prior domain knowledge and related studies [
5,
18]. This reinforces the trustworthiness of the ANN’s decision logic and supports its use in clinical environments, where interpretability is critical for physician adoption.
While the ANN exhibited modest success in predicting the majority class, its poor sensitivity to the minority class indicates the need for more sophisticated modeling approaches. Future efforts will focus on ensemble learning strategies, such as stacking and boosting, which integrate outputs from multiple algorithms (e.g., ANN, XGBoost, and LightGBM) to create robust hybrid models. These approaches have been shown to deliver improved generalization, particularly in unbalanced settings [
19,
20], and may help rectify the sensitivity–specificity trade-off observed in this study.
Nevertheless, our supplementary analyses using a publicly available dataset, as well as re-running the analyses after implementing random undersampling in our original dataset, have proven that our ANN model performs significantly better with more balanced datasets. Notably better performance values were obtained from our ML model after applying the random undersampling method to our original dataset (with a sensitivity value of 81% and MCC of 0.34, compared to 3.4% and 0.058 for the imbalanced original dataset) and demonstrate the significant importance of utilizing class-balancing techniques to achieve better performance from the application of machine learning in positive case detection. Our results also supported the previous findings and recommendations regarding applying class-balancing techniques [
31,
32,
33,
34,
35].
SHAP is not without its limitations, either. It assumes feature independence and additive contributions, which may oversimplify complex interactions in high-dimensional healthcare data. To address these issues, future research will explore alternative interpretability tools such as local interpretable model-agnostic explanations (LIME), which generate surrogate linear models around individual predictions. Additionally, if deep learning models like CNNs are adopted in future studies, class activation mapping (CAM) or Grad-CAM techniques will be used to visualize spatial or temporal feature attributions, which is particularly relevant when incorporating ECG or imaging data.
Further analysis of SHAP results by feature category, such as clinical (e.g., biomarkers) versus demographic features (e.g., age and gender), is also planned. This level of granularity could facilitate the identification of subgroup-specific risk factors, aiding in the development of personalized interventions. Such stratified interpretability has the potential to bridge the gap between algorithmic insight and actionable clinical decisions, particularly in precision medicine.
Author Contributions
Conceptualization, R.B. and Ö.O.; methodology, R.B. and Ö.O.; software, R.B.; validation, R.B. and Ö.O.; formal analysis, R.B. and Ö.O.; investigation, R.B. and Ö.O.; resources, R.B. and Ö.O.; data curation, R.B. and Ö.O.; writing—original draft preparation, R.B., Ö.O. and A.E.; writing—review and editing, R.B., Ö.O., A.E. and M.d.l.R.; visualization, R.B., Ö.O. and A.E.; supervision, R.B.; project administration, R.B. All authors have read and agreed to the published version of the manuscript.
Funding
This research received no external funding.
Institutional Review Board Statement
Available upon request from the corresponding author.
Informed Consent Statement
Not applicable.
Data Availability Statement
Due to privacy and ethical restrictions, data will be available only on request.
Acknowledgments
The authors have reviewed and edited the output and take full responsibility for the content of this publication.
Conflicts of Interest
The authors declare no conflicts of interest. The funders had no role in the design of the study; in the collection, analysis, or interpretation of data; in the writing of the manuscript; or in the decision to publish the results.
Abbreviations
The following abbreviations are used in this manuscript:
| AI | Artificial Intelligence |
| AUC | Area Under the Curve |
| CNN | Convolutional Neural Network |
| LIME | Local Interpretable Model-Agnostic Explanations |
| ML | Machine Learning |
| RFE | Recursive Feature Elimination |
| ROS | Random Oversampling |
| SHAP | Shapley Additive Explanation |
| WHO | World Health Organization |
| ANN | Artificial Neural Network |
| CAM | Class Activation Mapping |
| CVDs | Cardiovascular Diseases |
| MCC | Matthews Correlation Coefficient |
| PCA | Principal Component Analysis |
| RUS | Random Undersampling |
| SMOTE | Synthetic Minority Oversampling Technique |
| SVM | Support Vector Machines |
| XAI | Explainable Artificial Intelligence |
References
- World Health Organization. Cardiovascular Diseases. 2022. Available online: https://www.who.int/health-topics/cardiovascular-diseases (accessed on 27 February 2024).
- Sağlık Bakanlığı, T.C. Heart and Vascular Diseases in Turkey. Available online: https://hsgm.saglik.gov.tr/depo/birimler/kronik-hastaliklar-ve-yasli-sagligi-db/Dokumanlar/Bilgi_Notlari/Turkiyede_Kalp_ve_damar_hastaliklari_Bilgi_Notu_21.06.2019.docx (accessed on 21 June 2023).
- Eleyan, A.; AlBoghbaish, E.; AlShatti, A.; AlSultan, A.; AlDarbi, D. RHYTHMI: A deep learning-based mobile ECG device for heart disease prediction. Appl. Syst. Innov. 2024, 7, 77. [Google Scholar] [CrossRef]
- Rana, M.S.; Shuford, J. AI in healthcare: Transforming patient care through predictive analytics and decision support systems. J. Artif. Intell. Gen. Sci. 2024, 1, 5–10. [Google Scholar] [CrossRef]
- Sevli, O. Göğüs kanseri teşhisinde farklı makine öğrenmesi tekniklerinin performans karşılaştırması. Avrupa Bilim Ve Teknol. Derg. 2019, 16, 176–185. [Google Scholar] [CrossRef]
- Richter, M.; Emden, D.; Leenings, R.; Winter, N.R.; Mikolajczyk, R.; Massag, J.; Zwiky, E.; Borgers, T.; Redlich, R.; Koutsouleris, N.; et al. Generalizability of clinical prediction models in mental health. Mol. Psychiatry 2025, 30, 632–3639. [Google Scholar] [CrossRef]
- Solihin, M.I.; Zekui, Z.; Ang, C.K.; Heltha, F.; Rizon, M. Machine learning calibration for near infrared spectroscopy data: A visual programming approach. In Proceedings of the 11th National Technical Seminar on Unmanned System Technology 2019: NUSYS’19; Solihin, M.I., Zekui, Z., Ang, C.K., Heltha, F., Rizon, M., Eds.; Lecture Notes in Electrical Engineering; Springer: Singapore, 2021; Volume 666, pp. 577–590. [Google Scholar]
- Sapra, V.; Sapra, L. An Interpretable Approach with Explainable AI for the Detection of Cardiovascular Disease. In Proceedings of the 2024 International Conference on Integrated Intelligence and Communication Systems (ICIICS), Kalaburagi, India, 22–23 November 2024; IEEE: Piscataway, NJ, USA, 2024. [Google Scholar]
- Kausar, N.; Abdullah, A.; Samir, B.B.; Palaniappan, S.; AlGhamdi, B.S.; Dey, N. Ensemble clustering algorithm with supervised classification of clinical data for early diagnosis of coronary artery disease. J. Med. Imaging Health Inform. 2016, 6, 78–87. [Google Scholar] [CrossRef]
- Singh, R.; Rajesh, E. Prediction of heart disease by clustering and classification techniques. Int. J. Comput. Sci. Eng. 2019, 7, 861–866. [Google Scholar] [CrossRef]
- Shylaja, S.; Muralidaharan, R. Comparative analysis of various classification and clustering algorithms for heart disease prediction system. CiiT Int. J. Biom. Bioinform. 2018, 10, 74–77. [Google Scholar]
- Suryawanshi, N.S. Accurate prediction of heart disease using machine learning: A case study on the Cleveland dataset. Int. J. Innov. Sci. Res. Technol. 2024, 9, 1042–1049. [Google Scholar] [CrossRef]
- Bouqentar, M.A.; Terrada, O.; Hamida, S.; Saleh, S.; Lamrani, D.; Cherradi, B.; Raihani, A. Early heart disease prediction using feature engineering and machine learning algorithms. Heliyon 2024, 10, e38731. [Google Scholar] [CrossRef]
- Sumwiza, K.; Twizere, C.; Rushingabigwi, G.; Bakunzibake, P.; Bamurigire, P. Enhanced cardiovascular disease prediction model using random forest algorithm. Inform. Med. Unlocked 2023, 41, 101316. [Google Scholar] [CrossRef]
- Aziz, S.; Ahmed, S.; Alouini, M.-S. ECG-based machine-learning algorithms for heartbeat classification. Sci. Rep. 2021, 11, 18738. [Google Scholar] [CrossRef]
- Talin, I.A.; Abid, M.H.; Khan, M.A.-M.; Kee, S.-H.; Nahid, A.-A. Finding the influential clinical traits that impact on the diagnosis of heart disease using statistical and machine-learning techniques. Sci. Rep. 2022, 12, 20199. [Google Scholar] [CrossRef]
- Linardatos, P.; Papastefanopoulos, V.; Kotsiantis, S. Explainable AI: A review of machine learning interpretability methods. Entropy 2020, 23, 18. [Google Scholar] [CrossRef]
- Saranya, A.; Narayan, S. Risk Prediction of Heart Disease using Deep SHAP Techniques. In Proceedings of the 2nd International Conference on Advancement in Computation & Computer Technologies (InCACCT), Ghauran, India, 2–3 May 2024; IEEE: Piscataway, NJ, USA, 2024. [Google Scholar]
- Khan, N.A.; Hafiz, M.F.B.; Pramanik, M.A. Enhancing predictive modelling and interpretability in heart failure prediction: A SHAP-based analysis. Int. J. Inf. Commun. Technol. 2025, 14, 11–19. [Google Scholar] [CrossRef]
- Mesquita, F.; Marques, G. An explainable machine learning approach for automated medical decision support of heart disease. Data Knowl. Eng. 2024, 153, 102339. [Google Scholar] [CrossRef]
- Jeribi, F.; Kaur, C.; Pawar, A. An approach with machine learning for heart disease risk prediction. In Proceedings of the 2023 International Conference on Computational Science and Computational Intelligence (CSCI), Las Vegas, NV, USA, 13–15 December 2023. [Google Scholar]
- Kanth, P.C.; Vijayalakshmi, S.; Palathara, T.S. Machine Learning Model Enabled with Data Optimization for Prediction of Coronary Heart Disease. In Proceedings of the 2024 International Conference on Trends in Quantum Computing and Emerging Business Technologies, Pune, India, 22–23 March 2024. [Google Scholar]
- Gulhane, M.; Kumar, S.; Borkar, P. An empirical analysis of machine learning models with performance comparison and insights for heart disease prediction. In Proceedings of the 3rd International Conference on Technological Advancements in Computational Sciences (ICTACS), Tashkent, Uzbekistan, 1–3 November 2023. [Google Scholar]
- Hussain, N.A.; Mohammed, A.A. Early heart attack detection using hybrid deep learning techniques. Information 2025, 16, 334. [Google Scholar] [CrossRef]
- Wu, L. Interpretable predictions of heart disease based on random forest and SHAP. In Proceedings of the 8th International Conference on Electronic Technology and Information Science (ICETIS 2023), Dalian, China, 24–26 March 2023. [Google Scholar]
- Mohapatra, S.; Swarnkar, T. Comparative Study of Different Orange Data Mining Tool-Based AI Techniques in Image Classification. Lect. Notes Netw. Syst. 2021, 202, 611–620. [Google Scholar]
- Demšar, J.; Curk, T.; Erjavec, A.; Gorup, Č.; Hočevar, T.; Milutinovič, M.; Možina, M.; Polajnar, M.; Toplak, M.; Starič, A.; et al. Orange: Data Mining Toolbox in Python. J. Mach. Learn. Res. 2013, 14, 2349–2353. [Google Scholar]
- Heidari, E.; Sobati, M.A.; Movahedirad, S. Accurate prediction of nanofluid viscosity using a multilayer perceptron artificial neural network (MLP-ANN). Chemom. Intell. Lab. Syst. 2016, 155, 73–85. [Google Scholar] [CrossRef]
- Purwono, I.; Ma’arif, A.; Rahmaniar, W.; Fathurrahman, H.I.K.; Frisky, A.Z.K.; Haq, Q.M.U. Understanding of convolutional neural network (CNN): A review. Int. J. Robot. Control Syst. 2022, 2, 739–748. [Google Scholar] [CrossRef]
- Chicco, D.; Jurman, G. The advantages of the Matthews correlation coefficient (MCC) over F1 score and accuracy in binary classification evaluation. BMC Genom. 2020, 21, 6. [Google Scholar] [CrossRef]
- Glučina, M.; Lorencin, A.; Anđelić, N.; Lorencin, I. Cervical cancer diagnostics using machine learning algorithms and class balancing techniques. Appl. Sci. 2023, 13, 1061. [Google Scholar] [CrossRef]
- Mohammed, R.; Rawashdeh, J.; Abdullah, M.A. Machine learning with oversampling and undersampling techniques: Overview study and experimental results. In Proceedings of the 11th International Conference on Information and Communication Systems (ICICS), Irbid, Jordan, 7–9 April 2020. [Google Scholar]
- Mooijman, P.; Catal, C.; Tekinerdogan, B.; Lommen, A.; Blokland, M. The effects of data balancing approaches: A case study. Appl. Soft Comput. 2023, 132, 109853. [Google Scholar] [CrossRef]
- Xiao, J.; Wang, Y.; Chen, J.; Xie, L.; Huang, J. Impact of resampling methods and classification models on the imbalanced credit scoring problems. Inf. Sci. 2021, 569, 508–526. [Google Scholar] [CrossRef]
- He, H.; Garcia, E.A. Learning from imbalanced data. IEEE Trans. Knowl. Data Eng. 2009, 21, 1263–1284. [Google Scholar] [CrossRef]
- Meyer, P.G.; Cherstvy, A.G.; Seckler, H.; Hering, R.; Blaum, N.; Jeltsch, F.; Metzler, R. Directedness, correlations, and daily cycles in springbok motion: From data via stochastic models to movement prediction. Phys. Rev. Res. 2023, 5, 043129. [Google Scholar] [CrossRef]
- Földi, P.; Dóra, B.; Cserti, J. Machine learning detection of phase transitions in complex dynamical systems. Phys. Rev. Res. 2023, 5, 043129. [Google Scholar]
| Disclaimer/Publisher’s Note: The statements, opinions and data contained in all publications are solely those of the individual author(s) and contributor(s) and not of MDPI and/or the editor(s). MDPI and/or the editor(s) disclaim responsibility for any injury to people or property resulting from any ideas, methods, instructions or products referred to in the content. |
© 2025 by the authors. Licensee MDPI, Basel, Switzerland. This article is an open access article distributed under the terms and conditions of the Creative Commons Attribution (CC BY) license (https://creativecommons.org/licenses/by/4.0/).


