Article

Indoor Positioning and Tracking System in a Multi-Level Residential Building Using WiFi

by
Elmer Magsino
1,*,
Joshua Kenichi Sim
2,
Rica Rizabel Tagabuhin
2 and
Jan Jayson Tirados
2
1
Physics and Engineering Department, Faculty of Applied and Technical Studies, University of the Fraser Valley, 33844 King Rd., Abbotsford, BC V2S 7M7, Canada
2
Department of Electronics and Computer Engineering, Gokongwei College of Engineering, De La Salle University, 2401 Taft Ave., Malate, Manila 1004, Metro Manila, Philippines
*
Author to whom correspondence should be addressed.
Information 2025, 16(8), 633; https://doi.org/10.3390/info16080633
Submission received: 21 June 2025 / Revised: 21 July 2025 / Accepted: 23 July 2025 / Published: 24 July 2025

Abstract

The implementation of an Indoor Positioning System (IPS) in a three-storey residential building employing WiFi signals that can also be used to track indoor movements is presented in this study. The movement of inhabitants is monitored through an Android smartphone by detecting the Received Signal Strength Indicator (RSSI) signals from WiFi Anchor Points (APs).Indoor movement is detected through a successive estimation of a target’s multiple positions. Using the K-Nearest Neighbors (KNN) and Particle Swarm Optimization (PSO) algorithms, these RSSI measurements are trained for estimating the position of an indoor target. Additionally, the Density-based Spatial Clustering of Applications with Noise (DBSCAN) has been integrated into the PSO method for removing RSSI-estimated position outliers of the mobile device to further improve indoor position detection and monitoring accuracy. We also employed Time Reversal Resonating Strength (TRRS) as a correlation technique as the third method of localization. Our extensive and rigorous experimentation covers the influence of various weather conditions in indoor detection. Our proposed localization methods have maximum accuracies of 92%, 80%, and 75% for TRRS, KNN, and PSO + DBSCAN, respectively. Each method also has an approximate one-meter deviation, which is a short distance from our targets.

Graphical Abstract

1. Introduction

The advent and rise of the Internet of Things (IoT) has enabled the interconnectivity of varying technologies in an indoor setup that allow for the data and signal analyses of target localization. Since Global Positioning System (GPS) technology is unable to track movements beyond satellite reach, the demand for Indoor Positioning System (IPS) technology has been increasing in recent decades to localize movements and perform object tracking in commercial establishments [1], hospitals [2], office buildings [3], and campuses [4].
Unlike GPS technology, IPS tracking and monitoring operations vary depending on the wireless technologies and characteristics of the environment where it will be deployed. There will be various Access Points (APs) placed in strategic positions that emit wireless signals that can be analyzed and synthesized for indoor target localization. Infrared light and Bluetooth Low-Energy (BLE) beacons, as an example, require line-of-sight (LOS) tracking, but are inexpensive to integrate into an indoor area [5]. On the other hand, WiFi technology can be exploited because of its ubiquity and the ability of its signals to penetrate walls [6].
One method that is mostly used in IPS technology to determine target location is the fingerprinting technique, which involves two procedures, namely (1) initial gathering and storage of the surrounding wireless features of a targeted region, and (2) comparison of real-time obtained features with those that were stored. These steps are referred to as the training and testing phases, respectively [7]. To determine the location of an object, it simply needs to have a high correlation in both the testing and training phases of an indoor target.
In IPS technology employing WiFi routers as Access Points (APs), the location of mobile devices in proximity is determined from the superposition of measured Received Signal Strength Indicators (RSSIs) sampled from available APs. In general, the RSSI value decreases as the distance between the AP and target indoor location increases [8]. Using only one AP would present multiple possibilities of an indoor location; therefore, we will need multiple APs with unique RSSI signatures and trilateration to pinpoint an indoor location or even actively track the position of a mobile device. Inevitably, WiFi-based IPS technology still poses as the most viable solution for indoor positioning because of its widespread deployment and available software applications to sense RSSIs. In addition, WiFi routers have the economical edge, as most WiFi-based hardware is cheaper and more accessible in the commercial market.
In [9], both RSSIs and Channel State Information (CSI) were used to determine regional and precise locations in an environment with high-load APs. They presented these values with respect to a reference AP; the varying granularity between RSSIs and CSI can improve indoor location detection. The work by [10] proposed a fusion of WiFi and ultra-wideband (UWB) RSSI measurements, UWB time-of-flight, and 433-MHz RSSIs to create an indoor fingerprint. Reference [11] utilized clustering techniques to improve RSSI measurement, therefore minimizing RSSI observation error and grouping readings based on the strongest Access Point. One common characteristic among these published works is the incorporation of machine learning techniques to improve accuracy. Aside from indoor tracking and positioning, the work by [12] proposed WiFi-based systems to extract human activity logs from channel state information time-series data, while the work by [13] presented a self-quarantine monitoring and room occupancy system using WiFi. WiFi CSI signals were to represent human activity features.
In this work, indoor environments are represented dynamically by their corresponding RSSI readings obtained from various APs. The indoor dynamics are due to the presence of obstacles creating non-line-of-sight (NLOS) measurements and measurements of the inhabitants’ predictable movements. This non-linear relationship between distance and RSSI readings often makes the detection prone to errors. An indoor target’s position or movement is represented by a mobile device capable of reading available AP RSSIs. After collection, to process different AP RSSI readings and minimize localization errors, in this work, we incorporated the Particle Swarm Optimization (PSO) + Density-Based Spatial Clustering of Applications with Noise (DBSCAN), K-Nearest Neighbor (KNN), and Time Reversal Resonating Strength algorithms, which are viable methods to solve positions. We tested our IPS inside a three-story residential building, which is an extension of our previous work  [14]. The work by [15] experimented on a three-story commercial building with 39 available APs and with 80 reference points where RSSIs were recorded. The authors grouped the RSSIs according to the APs, previous user location, and knowledge of the environment map. In commercial buildings, WiFi APs are installed on the ceilings to maximize line-of-sight connections, and are deployed in a uniformly spaced formation to maximize coverage for customer satisfaction. Different from this approach, our work focuses on residential multi-story houses where APs are typically deployed near outlets and with the presence of obstacles. Also, the number of deployed APs is limited and flexible, compared to commercial establishments.
The major contributions of this study are summarized below.
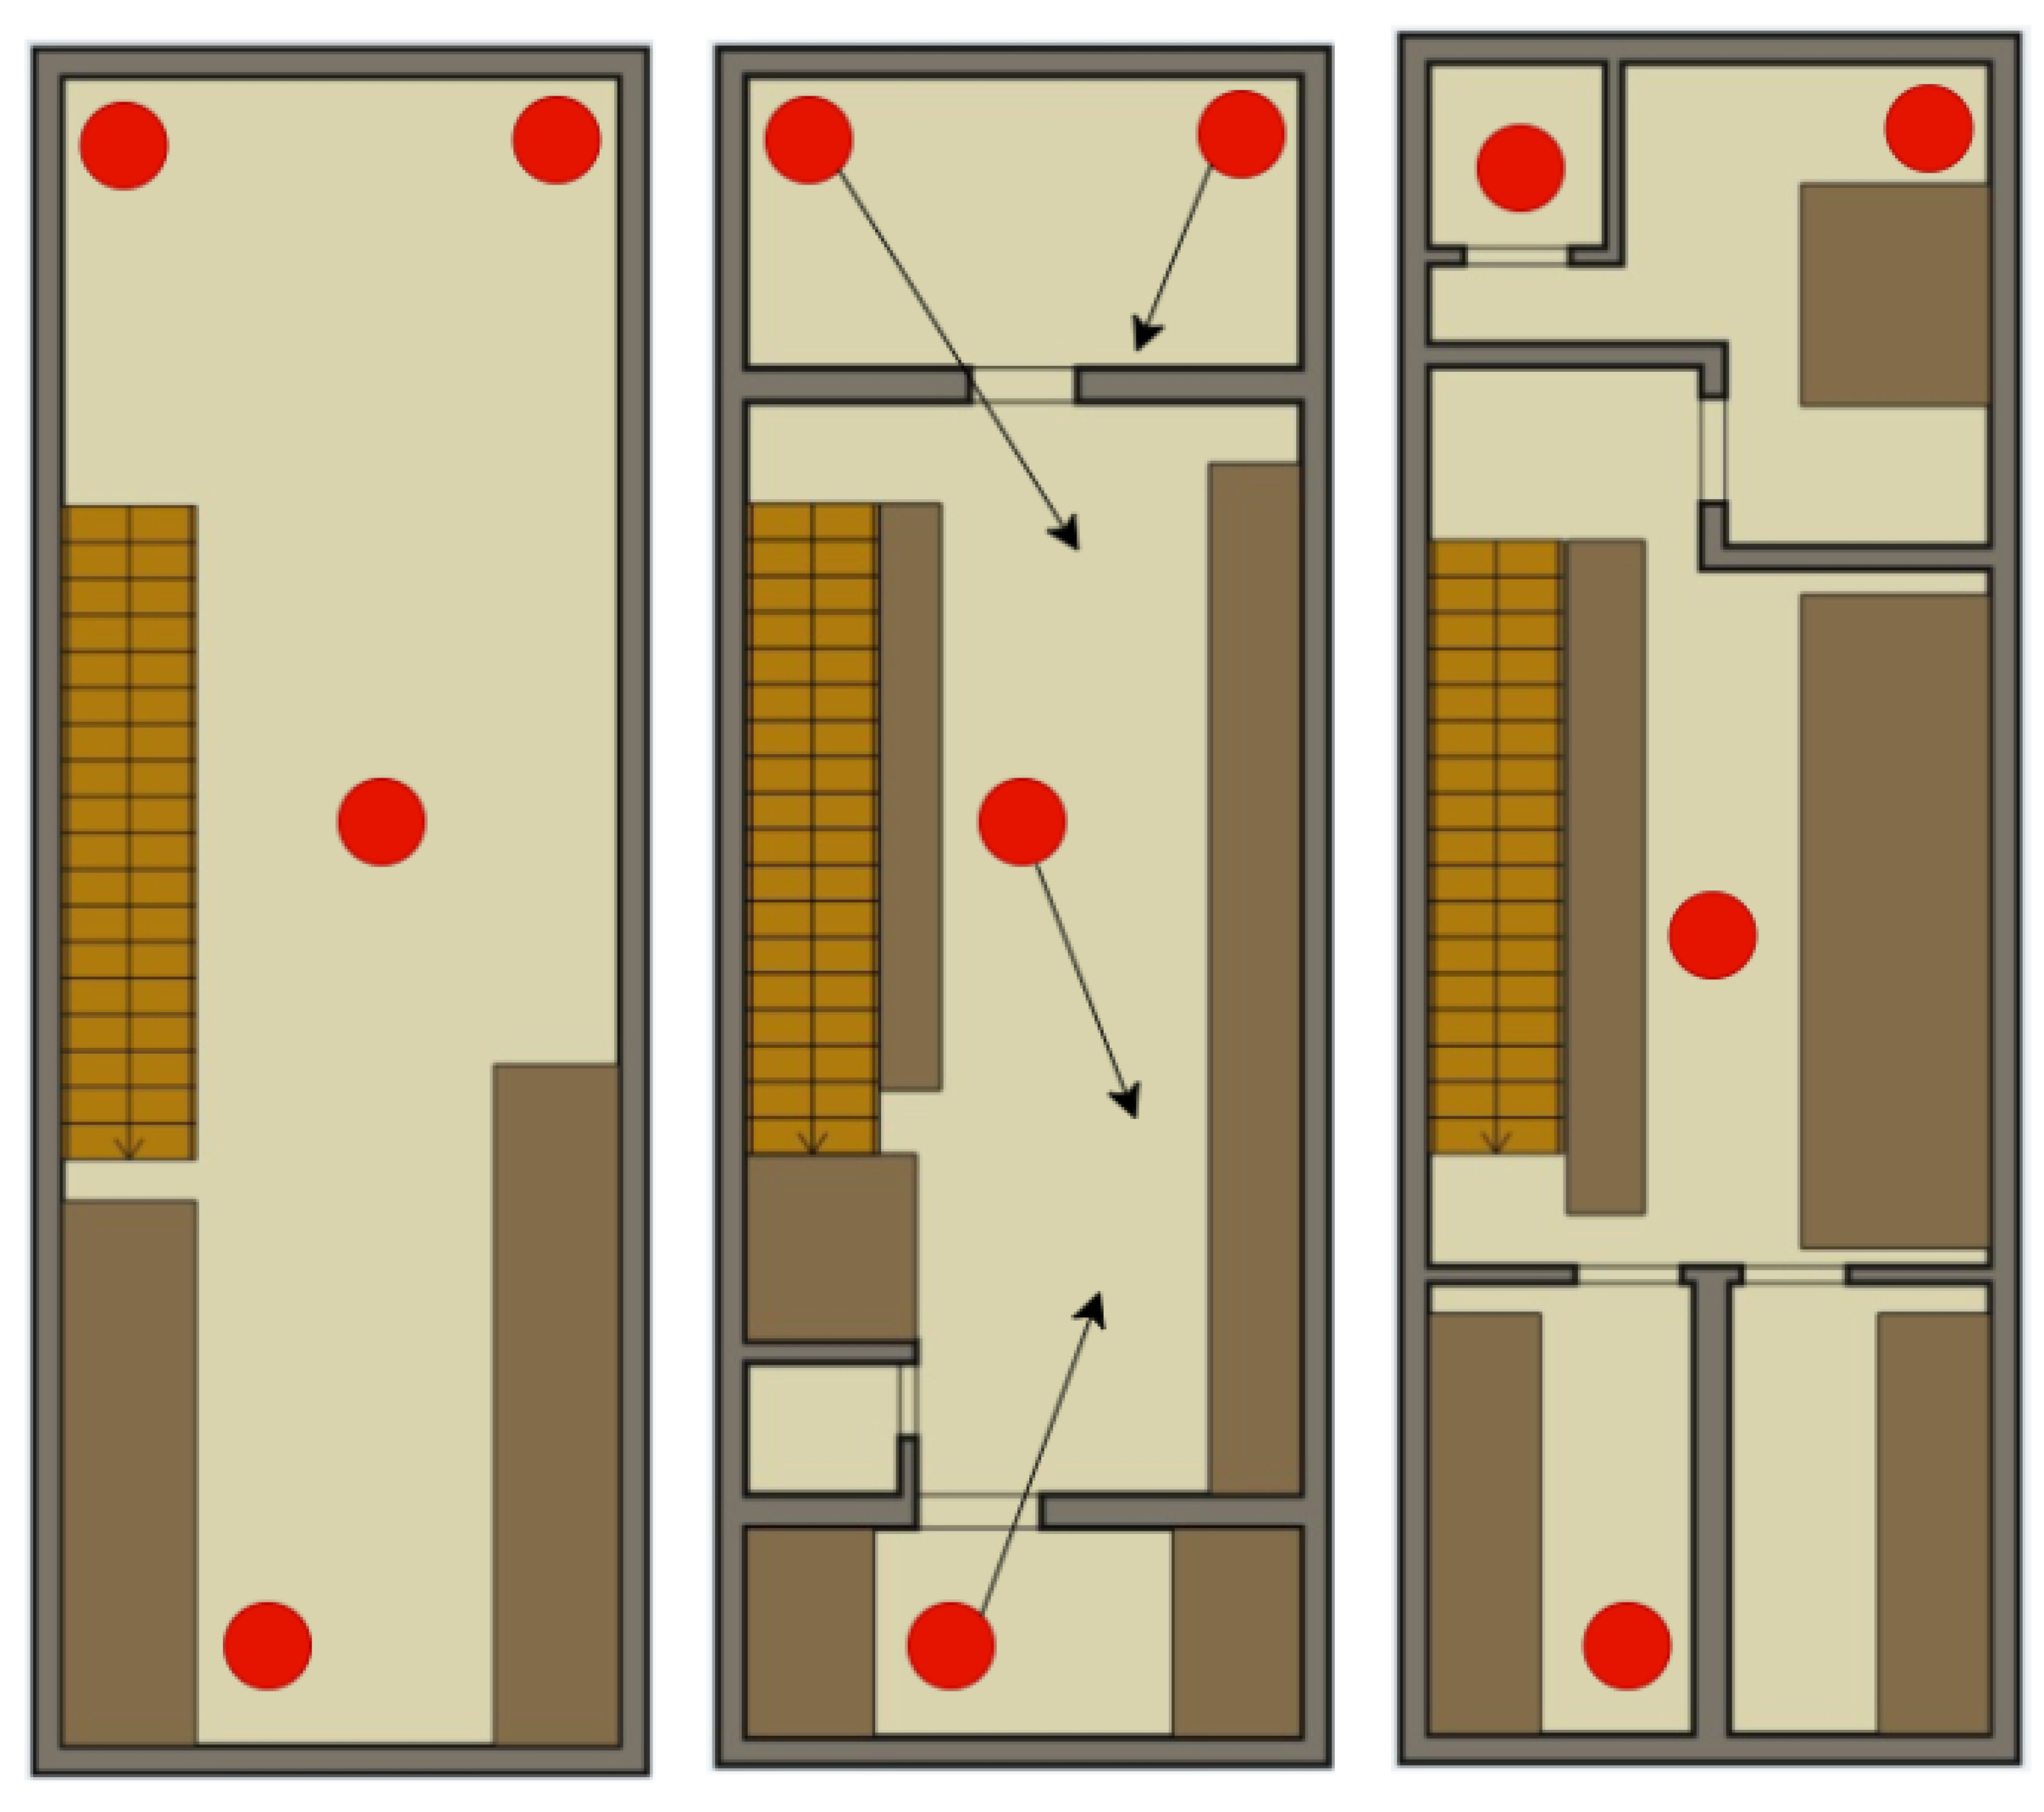
  • We developed and extensively experimented on a WiFi-based indoor monitoring and tracking system deployed in a residential building that is a three-story apartment, has heterogeneous floor arrangements, allows for dynamic movements, and was tested under varying weather conditions. Our Indoor Positioning System relies on a non-uniform floor deployment of WiFi routers, as determined by the household setup. From an initial deployment of nine (9) Access Points for high-accuracy monitoring and tracking, we exploited WiFi wall-penetrating signals to reduce the number of APs needed to still obtain an acceptable indoor movement accuracy.
  • We adapted the fingerprinting method in the characterization of an indoor space by employing the time-series (set) and averaged RSSI measurements as captured and stored by an Android mobile application that we also developed. This comparison of utilizing stored RSSI data allowed the group to only operate on high-performance mobile phones.
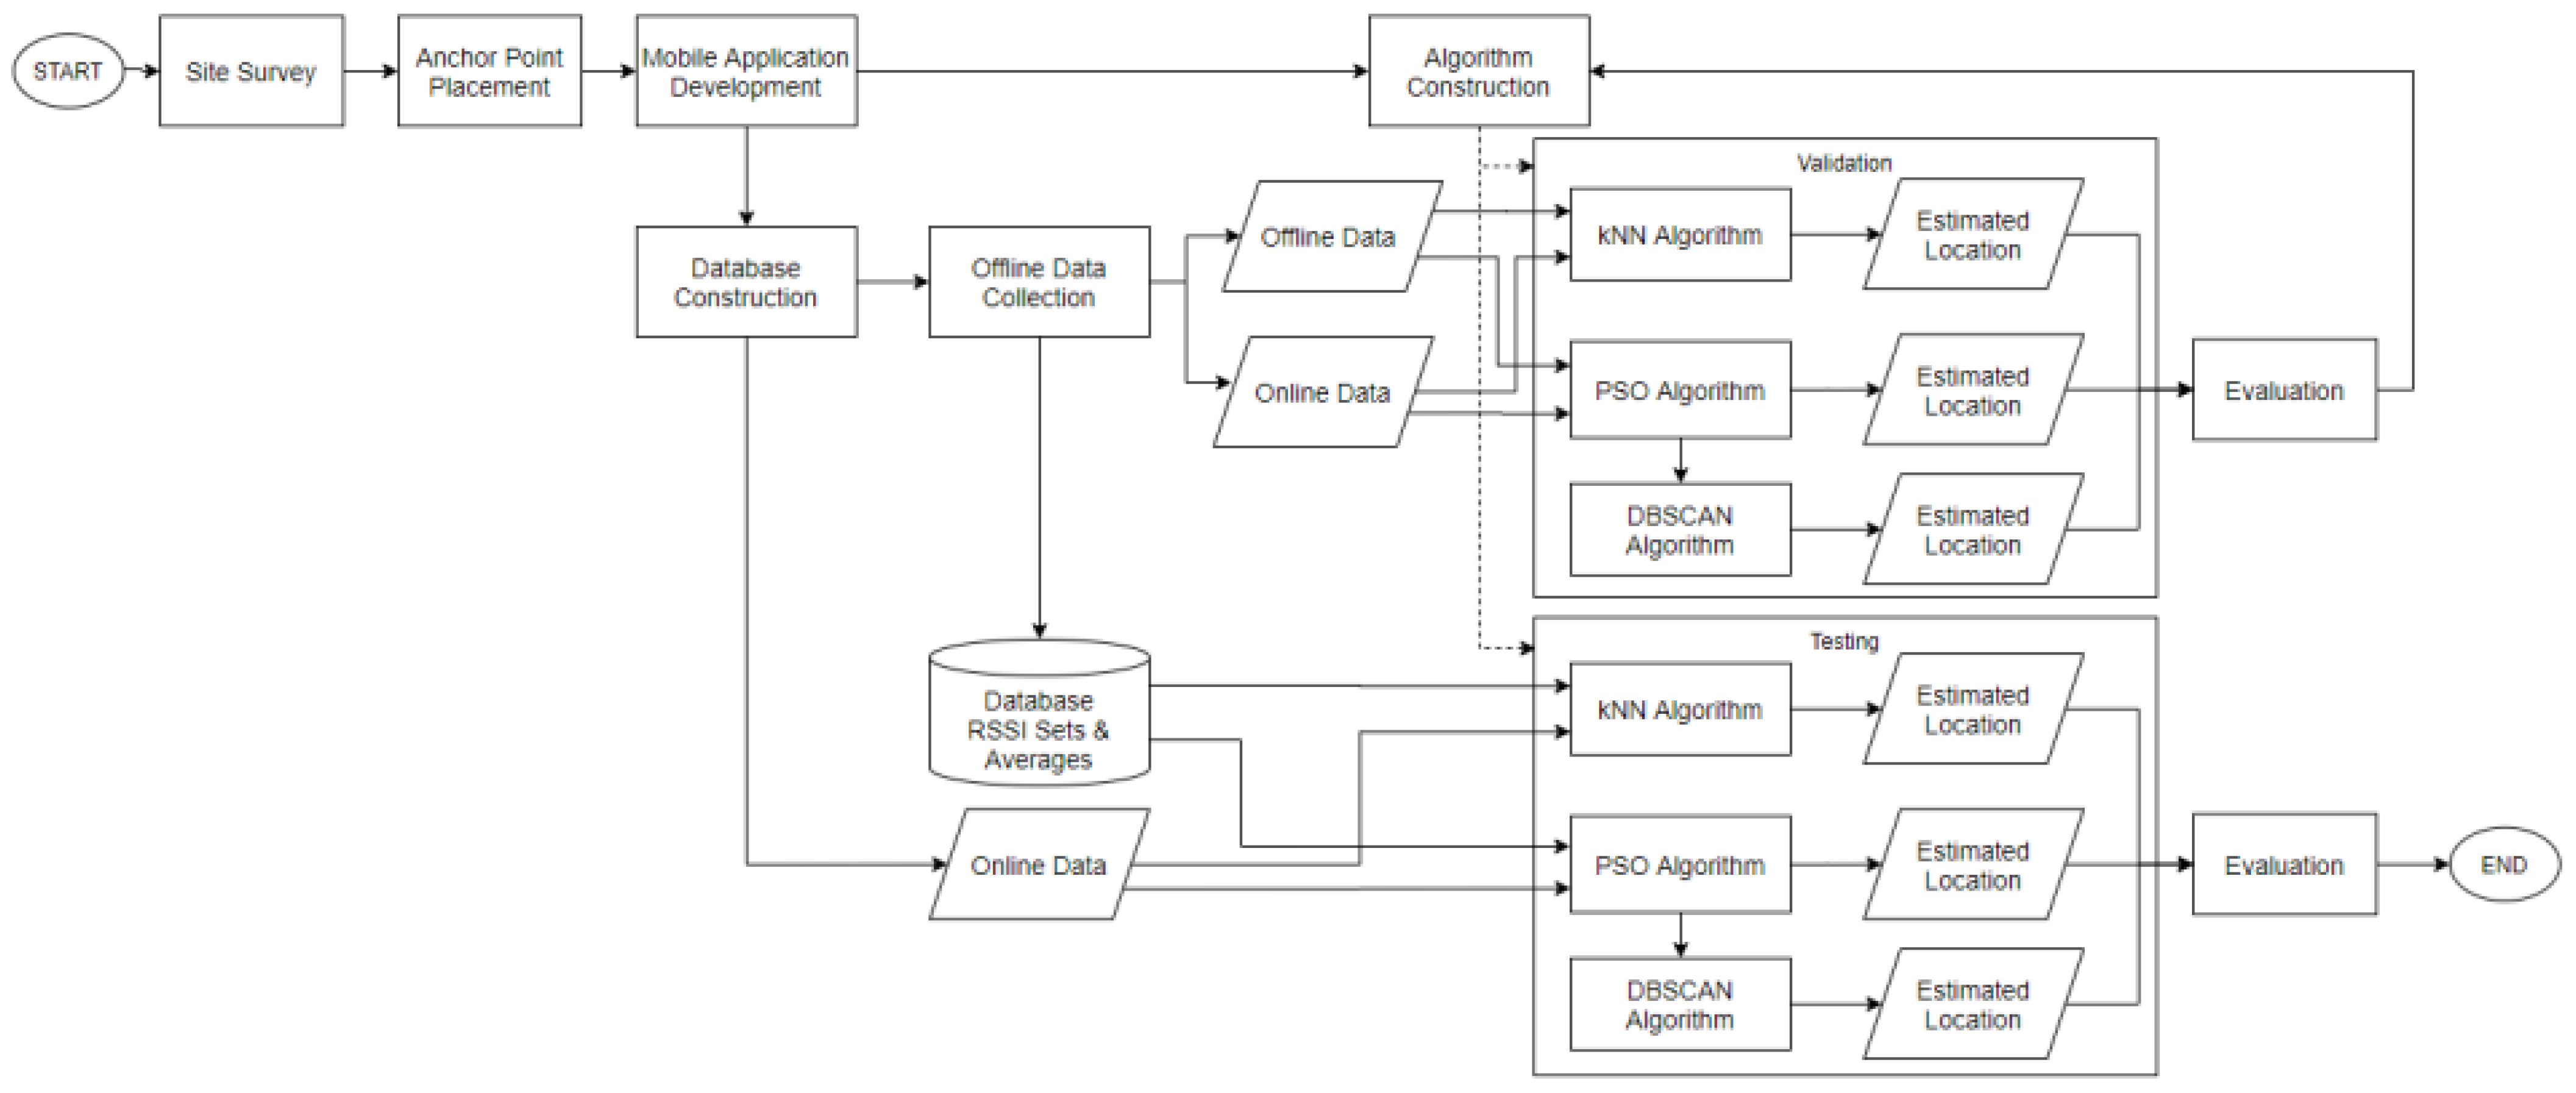
  • To achieve indoor monitoring and tracking, we estimated the target’s location by adopting and comparing three well-known methods, namely, (i) TRRS, (ii) PSO + DBSCAN, and (iii) K-Nearest Neighbors techniques. For the PSO + DBSCAN, and KNN methods, we developed distance metrics that will relate the correlation between the offline and online fingerprints. We incorporated Density-Based Spatial Clustering of Applications with Noise (DBSCAN) to remove outliers and increase accuracy. On the other hand, TRRS depends on the RSSI data length to be correlated in estimating its location.
This research paper is divided into five sections: Section 2 presents the published research works related to WiFi-based indoor positioning and which implement machine learning techniques for tracking. Section 3 tackles the design and implementation of our proposed WiFi-based Indoor Positioning System, from RSSI collection to determining the target location. Section 4 presents the experimental results obtained from a three-story residential building and their corresponding discussion. Finally, Section 5 concludes our work by providing the valuable insights experienced in this study.

2. Literature Review

The most commonly used technologies for Indoor Positioning Systems are Inertial systems, WiFi and WLAN networks, Bluetooth networks, Wireless Sensor Networks, Radio Frequency Identification systems, Ultra-wide bands, Acoustics, and Computer Vision. Each system technology was summarized and compared according to various criteria, e.g., cost, infrastructure, privacy, security, scalability, coverage, power consumption, accuracy, signal type, and limitations [16]. Among these system technologies, WiFi networks are ubiquitous, widely used in indoor infrastructure, and are highly supported by mobile devices, such as smartphones, which becomes the practical approach in implementing indoor tracking and positioning [17]. To analyze the environmental scenario using WiFi, the RSSI fingerprints were recorded and divided into training and testing datasets. However, depending on the environment where WiFi Access Points were deployed, calibration was needed to ensure that an acceptable accuracy was achieved [18]. It is in this scenario where machine learning techniques were applied to the RSSI fingerprints to further improve positioning and tracking accuracy [19] and even predict RSSI measurements from a dataset [20].
A novel neural network architecture, termed FasterKAN, was evaluated in [21] by using two benchmark WiFi RSSI fingerprint datasets. FasterKAN was capable of accurately classifying the floors and building while reducing position errors in a meter-level range. In another study, a temporal convolutional network feature extractor was proposed in [22] to automatically extract spatiotemporal features. The inputs are temporal fingerprints captured from a sliding window. These have positioning information and remove unwanted noise and spatial ambiguity. They are then connected to a deep neural network position regressor to estimate the target coordinates in a 3D environment. Two deep learning-based algorithms were evaluated using WiFi RSSI data in [23]. The first algorithm trained a convolutional neural network with inputs of generated RSSI images from wavelet transforms, while the second algorithm trained an artificial neural network based on power spectral density to finally determine the object’s position. Their work resulted in a relatively high accuracy for room identification and pedestrian position. The work by [24] implemented WiFi localization utilizing convolutional neural networks (CNNs). Their custom architecture WiFiNet exploited the classification performance of CNNs in reducing localization mean errors when compared to the Support Vector Machine implementation. Three experiments were conducted to evaluate the system, namely, localization based on positions found and non-existent in a training dataset and mobile conditions.
The work by [25] proposed a maximum convergence algorithm using WiFi to obtain high accuracy and low complexity when tracking an indoor mobile object’s position. WiFi fingerprints from path loss models were clustered for each AP, and the Nearest Neighbor algorithm was used to correlate them with other APs. They also incorporated the pedestrian dead reckoning method and inertial sensor measurements for improved accuracy. Experiments were then performed in a building with limited obstacles, such as walls and cabinets, and in corridors. The work in [26] also employed clustering and K-Nearest Neighbors algorithms to mitigate the fluctuations of RSSI readings. However, they used Gaussian Mixture Models to establish several localization areas based from offline readings. During the online phase, their adaptive KNN dynamically selected the location based on a flexible distance threshold. The k-means clustering with outlier removal was also applied in [27] for public WiFi fingerprint databases, with the main emphasis being reducing the time needed to track a user’s position in large-scale areas. Lastly, a study by [28] combined k-means clustering and weighted K-Nearest Neighbors to enhance WiFi-based indoor positioning systems. During the offline phase, Particle Swarm Optimization (PSO) was used to obtain nonlinear weights so that the k-means algorithm did not converge to a local minima. They also introduced a new distance metric as a function of Euclidean distance and coordinate position to solve the k-means clustering problem of discreteness. In the online matching phase, an improved Mahalanobis distance was used in KNN, where K is a dynamic value, to select the accurate Nearest Neighbor fingerprint.
These previous studies have shown various ways of achieving indoor positioning systems by implementing machine learning (ML) algorithms and WiFi-based fingerprinting methods. Studies focusing on improving indoor tracking through ML algorithms utilize high-memory and high-computation systems; thus, data compression and length of training are not constraints on the indoor monitoring problem. In [29], computational complexity and memory storage have been emphasized as important factors involved when using the fingerprinting-based localization methods and machine learning algorithms. Previous studies experimenting on multi-level buildings have focused on indoor tracking happening along hallways, where there is almost a line-of-sight between the WiFi routers and target object and where there are no other obstacles present except for the dynamic movements of people.
Given these previous results, we have differentiated our work based on the following aspects. Firstly, we deployed our indoor monitoring and tracking system inside a three-level residential house where fixtures and furniture were situated differently from one house to another. Acknowledging this placement randomness, we extensively experimented on where to deploy multiple APs in each of the floors and then reduced this total household number by exploiting the capability of WiFi signal penetration of walls. Unlike commercial establishments, our work can be categorized as an indoor monitoring system for heterogeneous multi-level buildings. Secondly, the tracking system was implemented in a mobile phone that was limited in computational complexity and memory storage. We found that averaged RSSI readings can achieve an acceptable tracking accuracy when compared to using the full set of sensed RSSI readings. Thus, our work falls on a single-anchor positioning system. However, we have not tested the scenario with multiple anchors, and this is the research topic for future experiments. Finally, we implemented time reversal method and compared it with machine learning techniques for estimating indoor locations.

3. Materials and Methodology

This sections discusses the experimental setup, RSSI fingerprinting, localization algorithms, and system evaluation. The workflow process of our experimentation is shown in Figure 1.
The first three steps in our workflow comprise of site survey, Anchor Point placements, and mobile application development. The residential building chosen for the implementation of the indoor positioning system belongs to one of the residential houses of the authors. This eliminated renting fees and assures that normal daily activities are conducted. The WiFi routers deployed in our experiments are Huawei Echolife HG8145V5 and Linksys E900, while the developed mobile application runs on a Samsung SM-J260Y/DS. The application program can collect offline and online RSSI readings, upload data to the cloud, and implement indoor tracking. These data uploads create our RSSI databases.
Since our work only focuses on the general concept of implementing indoor target localization in a residential setup, we rely only on password encryption set by the owners of a residence; therefore, monitoring of unwanted connections was also performed by the owners. Indoor tracking is only possible if the individual or guest installs our tracking application in their personal mobile phone. The current version of our application can only gather and upload RSSI readings to our cloud database, which was chosen due to its simplicity and price during experimentation. Note that this cloud can be reconfigured by any user once there is full residential implementation. Once installed, the application does not transmit its location and is restricted only to the user, even though the house owner has the right to know where the guests or inhabitants are situated. In the future version of this work, we would extend the work to unwanted intrusion and central knowledge of all inhabitants.

3.1. Experimental Setup

Figure 2 illustrates the floor plan of a three-story residential building where our numerous experiments were done. We decided to implement a one square meter area of detection and based it on the dimensions that can cover the dwellers and furniture during positioning. Each indoor position is labeled in the following format x y y , where x corresponds to the floor level and y y denotes the indoor area number that needs to be tracked. Because of the varying physical obstructions in each floor, the number of target locations for each floor are 31, 23, and 19, totaling to 73 indoor locations.
The placements of Access Point locations for each floor are highlighted also in Figure 2. This deployment is based on a strategy that allows us to obtain distinct RSSI combinations of each indoor position and the idea of maximum coverage for all indoor points. A sufficient number of working APs is essential in localizing an indoor position. As such, we minimized this number to at least three stable AP readings. Admittedly, this experimental stage is rigorous in the study employing fingerprinting methods.
Given that the interior design of each residential house greatly varies from one household to another, this step has been one of the rigorous procedures in our experimentation since the positioning performance is substantially affected. From our deployment experience, we were able to provide a general location where APs can be deployed and how we avoided anomalous RSSI readings. We detail this in Section 4.7.

3.2. Offline Data Collection

RSSI fingerprints for each of the 73 locations are collected, stored, and uploaded as offline references in the Firebase cloud. These sample RSSI readings are captured by a mobile device with our developed application. Inhabitant movements, such as human and pet motions, are not restricted, therefore, allowing dynamics in the indoor environment.
At each location, the average RSSI measurement given a time window is derived from the time-series RSSI readings. This is done to further reduce stored data without compromising the location’s RSSI characteristics. Thus, there are at nine sets per target location for each metric, because of three available APs. During real-time localization, the actual RSSI readings are compared with the offline RSSI measurements which are first downloaded by the mobile application from the cloud and then storing them in the device.
Our offline collection took place from 15–19 March 2022, where weather conditions were sunny and humid in general since this is the start of the summer season.

3.3. Online Data Collection

The online data collected by our mobile application are stored in an array of fixed size that is dependent on the assigned sampling period. These RSSI readings are then compared to the offline reference data, where our positioning algorithms estimate its location for each period. Continuous estimations allow our system to track movements in the indoor environment.
Our online collection took place from 31 May 2022 to 3 June 2022, where weather conditions were cloudy in general since this is the start of the rainy season. This is very much different from the conditions when we obtained our offline RSSI readings to be used as our reference database.
When testing and evaluating our system, several factors were considered, namely: (1) time of day, (2) weather conditions, and (3) movement in the surrounding. To isolate the effects of each factor, we utilized Bedroom 1 of the second floor from locations 201 to 208. The path taken is from 204 → 203 → 202 → 201 → 205 → 206 → 207 → 208.
We tested our IPS for one whole day, every three hours for these eight locations of Bedroom 1. Every three hours, three sets of RSSI data were collected under varying amounts of room activity. The sampling time is set to one minute and is chosen to balance memory storage and capture the important feature of the environment. The first set contains measured RSSI signals from a static environment. The second set of RSSI data are obtained from minimal movement such as a person was walking around continuously during the collection in a predefined manner. The third set of RSSI readings are obtained from a more dynamic environment where multiple people are walking around during the data collection. We also noted the weather and humidity level for each time period. We then compared these collected RSSI data to the reference offline data to observe the effects of different humidity levels, weather, and movements.

3.4. Indoor Target Localization Techniques

3.4.1. K Nearest Neighbor Technique

The K Nearest Neighbor (KNN) algorithm, shown in Algorithm 1, compares the online RSSI measurements with the stored offline fingerprints to be used for classification. The distance/separation (difference between two location readings) of the online data with each offline data is computed by using the L2 norm. Using the RSSI average produces only one distance/separation value. For time-series readings (called set), a distance vector is produced. The distances are sorted from lowest to highest values and the first K distances automatically become the Nearest Neighbors. The estimated position of the online data under test is determined from the most frequent occurring location.
Algorithm 1 K Nearest Neighbor Indoor Monitoring and Tracking Algorithm
INPUT:
Online RSSI Readings
K—number of Nearest Neighbors
OUTPUT: Estimated location
  1:
Download Residential Fingerprints from Cloud
  2:
for i = 0 to Number of Reference Locations do   ▹ 73 Indoor Location Fingerprints
  3:
   for j = 0 to Number of Sets per Locations do        ▹ RSSI Set Comparison
  4:
   for k = 0 to Number of AP do
  5:
      result += distance(online[k], offline[i][k][k])  ▹ Compare distance between online and offline readings
  6:
   end for
  7:
   distances.add(result/Number of AP)
  8:
   particles.add(location[i])
  9:
  end for
10:
end for
11:
for i = 0 to K value do          ▹ Determine which is the Nearest Neighbor
12:
  MinDist = indexOf.min(distances)
13:
  neighbor[i] = particles(MinDist)
14:
  distances[MinDist] = Integer.Maximum
15:
  duplicates [i] = 0
16:
  for j = 1 to neighbor.size() do
17:
   if neighbor[j] = neighbor[i] then
18:
     duplicates[j] += 1
19:
   end if
20:
  end for
21:
end for
22:
maximum = indexOf.max(duplicates) ▹ Determine where is the estimated location of the online RSSI readings
23:
Estimated Location = neighbor(maximum)
24:
Output Estimated Location.
When using the KNN algorithm, we adjusted and experimented on the following parameters, namely: distance metric (Line 5 of Algorithm 1), K (Line 11 of Algorithm 1), sampling time and window size, and area scope. The last two parameters are adjusted during the sensing of RSSI readings. For the distance metric, we applied L2 normalization. We can also use the Manhattan distance or the L1 norm. We also experimented on the optimal value of K. The sampling time and window size dictates the number of RSSI readings to be considered. Finally, the area scope pertains to where the distance metrics are calculated. Including all floors and available target locations is the preferred scenario because our IPS is able to check and correlate our online data to the reference data. This overall comparison allows for error checking across all target locations.

3.4.2. PSO + DBSCAN Techniques

Because there is a huge amount of stored offline data for reference, it takes a considerable amount of time and computational power for the mobile device to correlate them. Instead of using random particle positions, we pre-determined their initial fixed locations per floor as shown by the red circles in Figure 3, labeled as x i in our Algorithms 2 and 3.
The initial particle’s fitness function, ‘fit’, is computed to determine which floor the target location is most likely to be located. The floor having the smallest fitness is chosen to be the target’s final position while the rest is disregarded. The particles’ initial velocities, v e l , are set to be directed towards the middle since their locations have already constrained their motions. The first two iterations determine which section of the floor is the most likely target location, while the third iteration ensures that the particles will swarm towards the optimum location based from the previous iterations.
Algorithm 2 Particle Swarm Optimization Algorithm
INPUT:
Online RSSI Readings
K-number of Nearest Neighbors
OUTPUT: Estimated location
  1:
Download Residential Fingerprints from Cloud
  2:
Initialize First Positions of Particles
  3:
for i = 1 to 4 do                         ▹ Determine gbest
  4:
   fit = Fitness( x i )
  5:
   if gbest > fit then
  6:
   gbest = fit
  7:
   end if
  8:
end for
  9:
for i = 1 to 3 do                     ▹ Determine next position
10:
   out = NextPosition( x n , i , x n , i , gbest,[1.5,5]*random,0.9)
11:
    x n + 1 , i = out.get(0)
12:
   prev v e l i = out.get(1)
13:
   while !offline position.contain( x n + 1 , i ) do        ▹ If next pos is within boundary
14:
   if  x n + 1 , i < x n , i  then
15:
       x n + 1 , i = x n + 1 , i + 1
16:
   else
17:
       x n + 1 , i = x n + 1 , i  − 1
18:
   end if
19:
   end while
20:
    x n i = x n + 1 , i
21:
   fit = Fitness( x n , i )
22:
   if fitness( p b e s t i ) > fit then
23:
    p b e s t i = fit
24:
   end if
25:
   if fitness(gbest) > p b e s t i  then
26:
   gbest = p b e s t i
27:
   end if
28:
end for
29:
out = Next Position( x 4 , x 4 ,gbest,[−1.5,−5]*random,0.9)
30:
x n + 1 , 4 = out.get(0)
31:
prev v e l 4 = out.get(1)
32:
while !offline position.contain x n + 1 , 4  do
33:
   if  x n + 1 , 4 < x n , 4  then
34:
    x n + 1 , 4 = x n + 1 , 4 + 1
35:
   else
36:
    x n + 1 , 4 = x n + 1 , 4  − 1
37:
   end if
38:
end while
39:
x n , 4 = x n + 1 , 4
40:
fit = Fitness( x n , 4 )
41:
if fitness( p b e s t 4 ) > fit then
42:
    p b e s t 4 = fit
43:
end if
44:
if fitness(gbest) > p b e s t 4  then
45:
   gbest = p b e s t 4
46:
end if
Since the particles’ positions are limited by their corresponding floor area, therefore, the next positions must have a match in the locations of the offline data. However, if there is no match, we moved the computed position by 1 m towards the previous position.
The online phase allows continuous RSSI scanning. After obtaining the PSO location estimations, we employed DBSCAN to further remove outliers. This removal decreases the system errors. DBSCAN requires the following parameters to cluster the estimated locations: the maximum euclidean distance, and the minimum number of neighbors to form a cluster, both were rigorously obtained through experiments.
Algorithm 3 Particle Swarm Optimization Algorithm Continuation
  1:
for iteration = 2 to 5 do              ▹ Next Following Iterations
  2:
   for i = 1 to 4 do
  3:
   out = Next Position( x i , p b e s t i , gbest, prev v e l i , fitness(pbest))
  4:
    x n + 1 , i = out.get(0)
  5:
   prev v e l = out.get(1)
  6:
   while !offline position.contain( x n + 1 , i ) do
  7:
     if  x n + 1 < x n  then
  8:
       x n + 1 = x n + 1 + 1
  9:
     else
10:
       x n + 1 = x n + 1  − 1
11:
     end if
12:
   end while
13:
    x n , i = x n + 1 , i
14:
   fit = Fitness( x i )
15:
   if fitness( p b e s t i ) > fit then
16:
      p b e s t i = fit
17:
   end if
18:
   if fitness(gbest) > p b e s t  then
19:
     gbest = p b e s t
20:
   end if
21:
   end for
22:
end for
23:
Estimated Location = location of gbest
24:
procedure Fitness(particle)
25:
   for j = 0 to Number of Sets per Location do
26:
   for k = 0 to Number of AP do
27:
      result+= L2norm(online[k], particle[j][k])
28:
   end for
29:
   distance += result/Number of AP
30:
   end for
31:
   distance = distance/Number of Sets per Location
32:
   Return distance
33:
end procedure
34:
procedure Next Position( x n , p b e s t , gbest, v n ,w)
35:
   c 1 = 0.4 ( 1 w )
36:
   c 2 = 0.5 ( 1 w )
37:
   r 1 = random(0 to 1)
38:
   r 2 = random(0 to 1)
39:
   v n + 1 = w v n + c 1 × r 1 ( p b e s t x n ) + c 2 r 2 ( g b e s t x n )
40:
   x n + 1 = x n + v n + 1
41:
   Return x n + 1 , v n
42:
end procedure
Shown in Figure 4 is how DBSCAN removes outliers and reduces system error. Given a continuously moving device, previous estimations become neighbors of the new estimated location. The physical distance between the new and previous estimations are calculated. When the Nearest Neighbor is found to be more than two meters, then the estimated location is considered an outlier, thus, removed. We just adopted the DBSCAN code from [30].

3.4.3. Time Reversal Resonating Strength (TRRS) Technique

To determine the target point in which the RSSI signature belongs, the signal cross correlation between the offline and online data is computed in (1), where λ [ L On ^ , L Off i ^ ] is the strength of correlation between two target indoor locations. This is termed by [31] as the Time Reversal Resonating Strength (TRRS). This technique has one anchor, (the mobile phone in this study) to analyze fingerprints of a location [7]. When using multiple sampling frequencies and concatenating their responses, TRRS can detect an indoor target up to the centimeter level at the expense of costly deployment.
λ [ L On ^ , L Off i ^ ] = L On ^ L Off i ^ L On ^ , L On ^ L Off i ^ , L Off i ^
where L On ^ and L Off i ^ denote either the average or time-series RSSI readings in the online and offline phases at an indoor position i, respectively, and x , y is the inner product of vectors x and y.
To estimate where the indoor location is, we select the highest value in all λ [ L On ^ , L Off i ^ ] values, for i = 1 , 2 , , 79 , i.e.,
max λ [ L On ^ , L Off 1 ^ ] , λ [ L On ^ , L Off 2 ^ ] , , λ [ L On ^ , L Off i ^ ] , , λ [ L On ^ , L Off 79 ^ ]
In (2), the i that has the maximum value estimates the indoor location characterized by L On ^ .

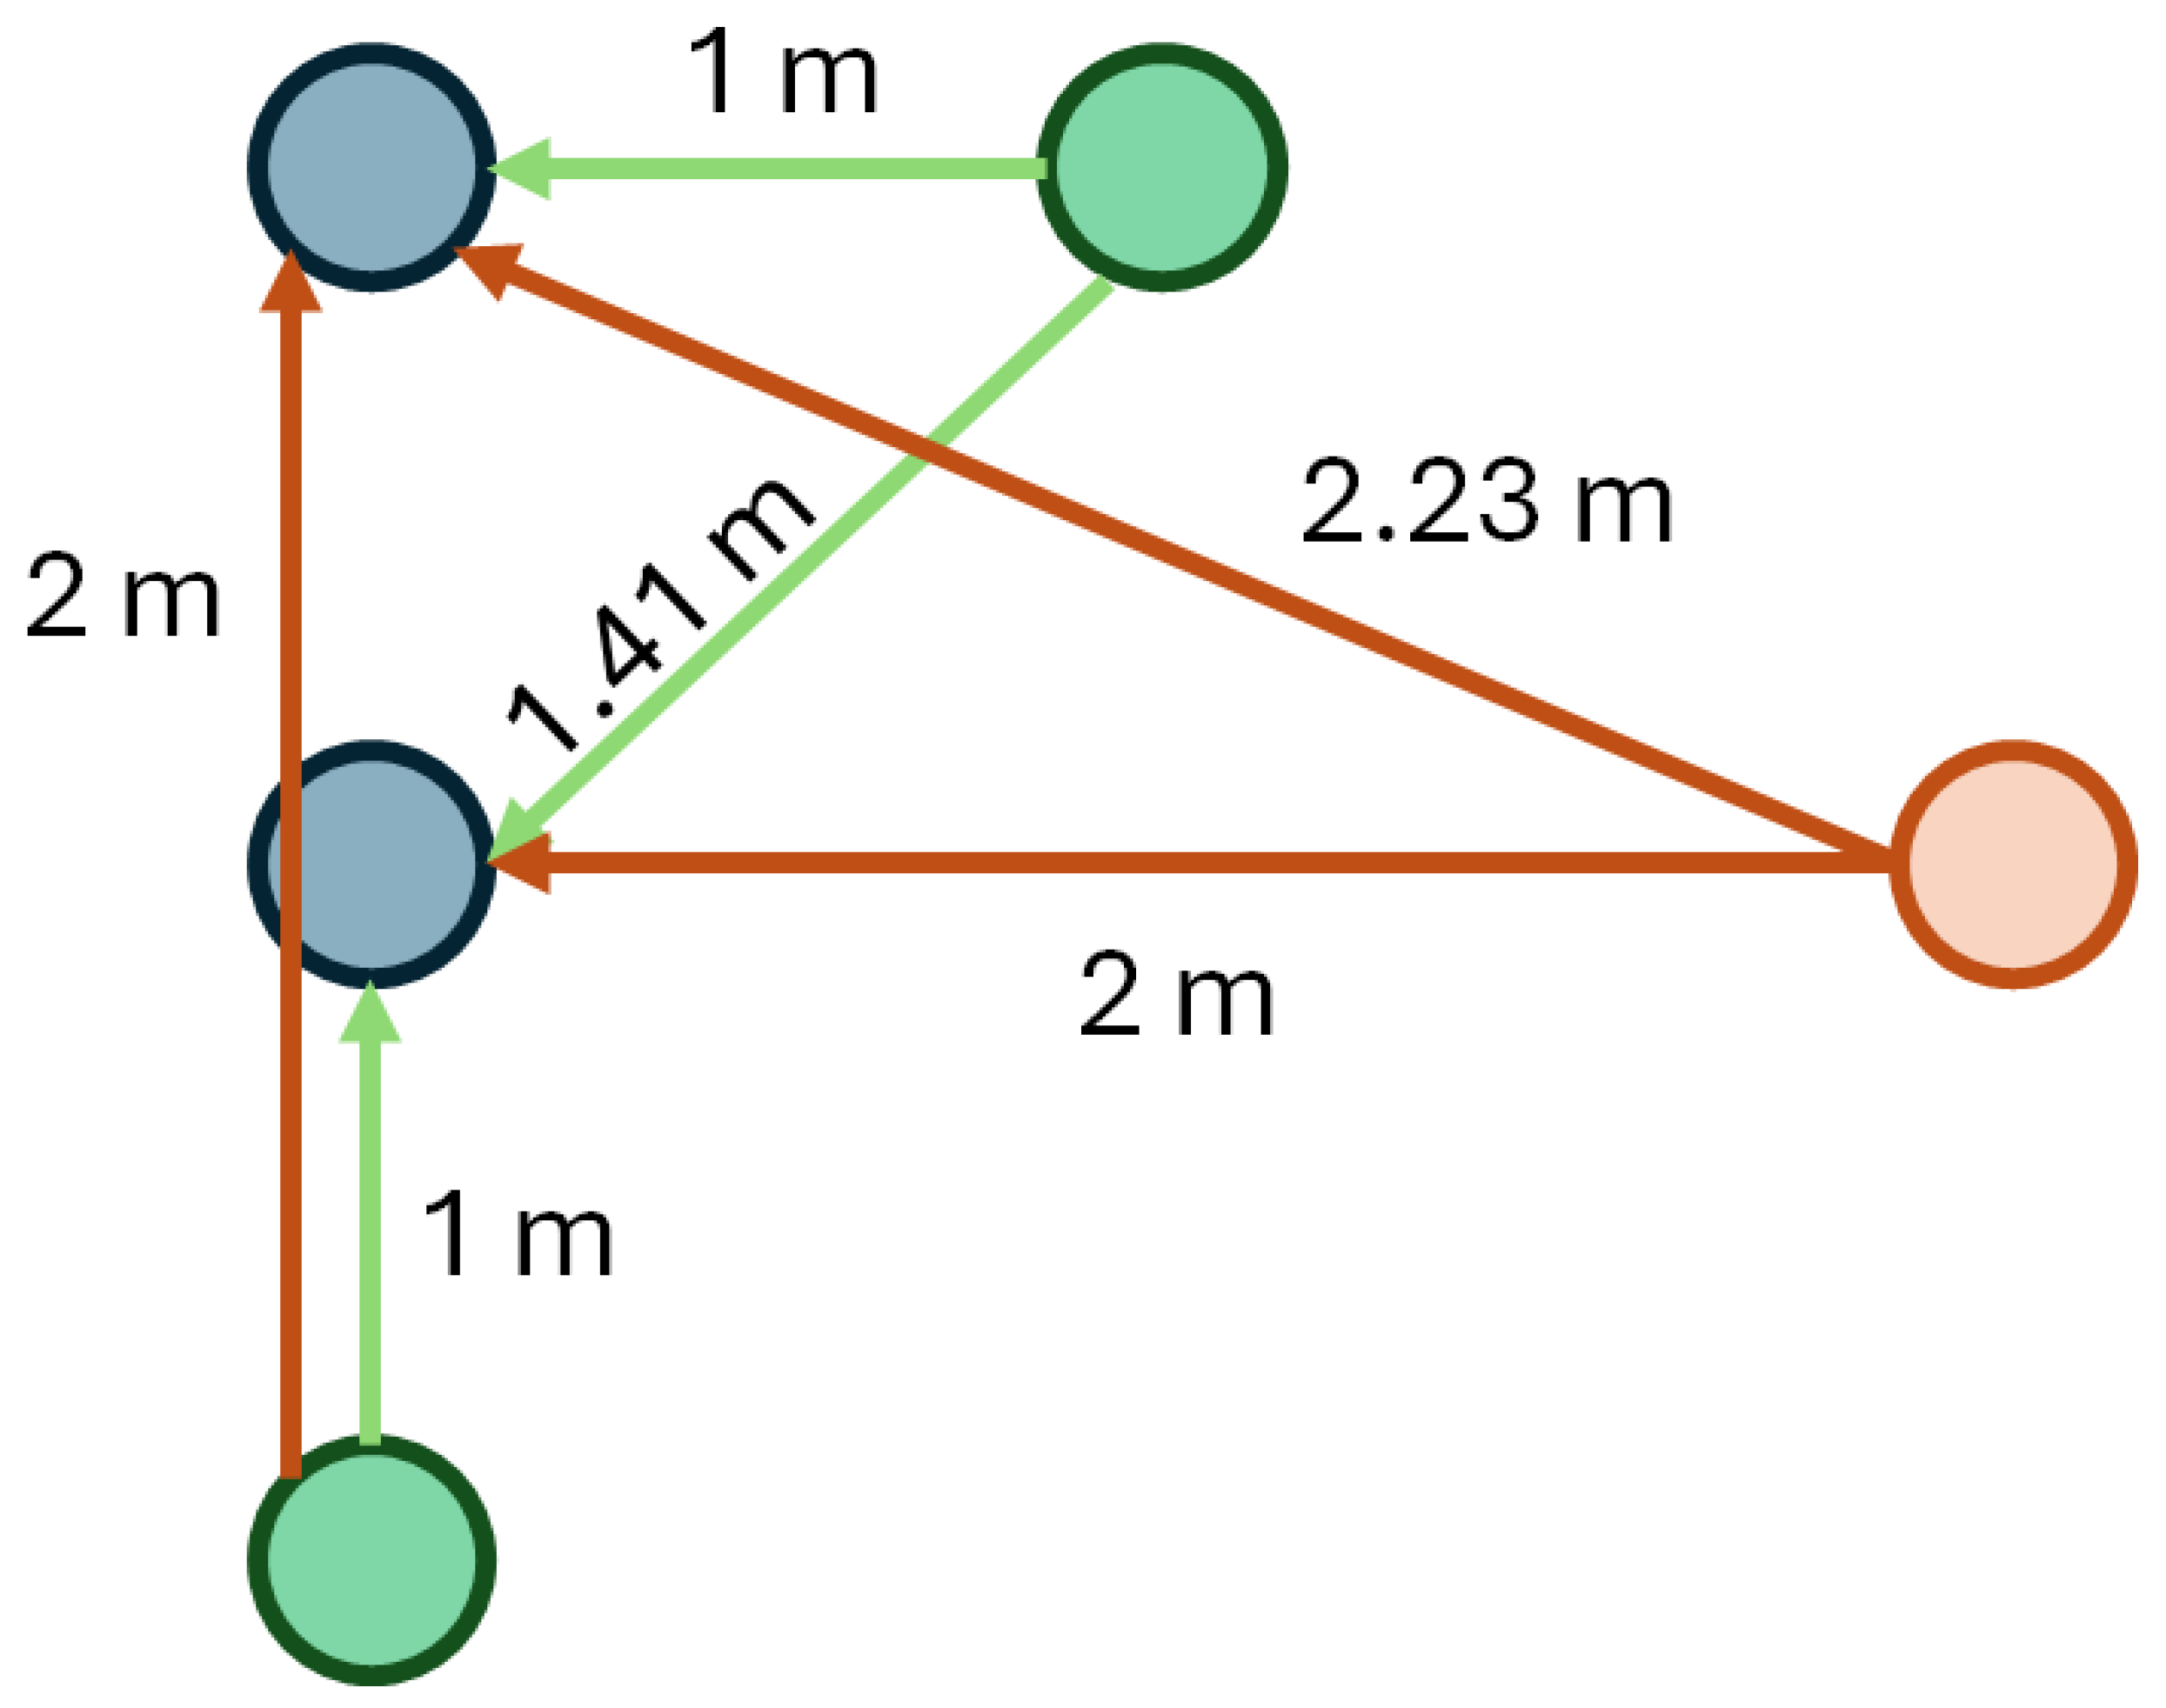
3.5. Distance Metrics

We quantify the differences/similarity between the offline and online RSSI readings when using the KNN and PSO + DBSCAN algorithms by using distance metrics for the average and set RSSI readings as shown in (3) and (4), respectively. These distance metrics represent the distance of the neighbors from the target device and measure the fitness of a particle in being a candidate solution. As these values approach zero, the more accurate the localization is.
d s e t = 1 N i = 1 N L 2 Z i j , A i j
d a v e = 1 N i = 1 N D Z i , A i
where L 2 Z i j , A i j and D Z i , A i are
L 2 Z i j , A i j = 1 M j = 1 M Z i j A i j 2
D Z i , A i = Z i A i m i n Z i , A i
where Z i j and A i j are the time-series online RSSI measurement of the current location and the set of time-series stored offline RSSI measurements for each AP i, respectively The variable j denotes the length of the RSSI readings. N is the number of available Access Points, APs, which is equal to nine.
Where Z i and A i are the average online RSSI measurement of the current location and the set of average stored offline RSSI measurements for each AP i, respectively. N is the number of available Access Points, APs, which is equal to nine.

4. Experimental Results and Discussion

In this section, we present and discuss the results of our extensive experiments based on a strategic organization of our experimental set-up.

4.1. Anchor Point Placement

We first determined the maximum number of APs to be deployed in the multi-story residential place per floor. Excessive AP deployment presents frequency interference, such as shown in Figure 5. Notice that when a fourth AP is added to the environment (Figure 5 fourth row), the RSSI reading in red becomes noisy even when filtered. Thus, in each floor, we only deploy three APs. We then strategically place these three APs in such a way that all target areas receive AP signals. This procedure is tedious and obstacle-dependent.
After the deployment of these nine APs, the heat map of average RSSI readings for each floor is generated. A sample heatmap from the second floor is shown in Figure 6. It is noticeable that APs from the third floor are barely detected by the second-floor target locations. This is due to the presence of too many obstacles and the floor materials. It can also be added that AP9 is not detected in some second-floor locations (represented by the dark red box).
Another notable observation is that utilizing RSSI readings from APs of other floors further discriminates each location, as compared to only using RSSI data of APs from the same floor. Therefore, exploiting this finding, we only deployed two APs at opposite ends in each floor. This deployment also allowed for maximum coverage of the entire three-story house while still providing distinguishable location fingerprints, and avoided signal symmetry.

4.2. Sampling Time

Utilizing our developed mobile application running on a Samsung smartphone, we measured RSSI values at various sampling times. While sensing the environment, the mobile phone was constantly moved to simulate a dynamic environment.
In Figure 7, there is not much difference between the three sampling times. We chose a sampling time of 200 ms so as not to lose too much environmental information, while at the same time not keeping too many RSSI readings.
We also gathered RSSI readings in a five-day duration where the weather conditions are partly sunny, passing clouds, and varying humidity levels.

4.3. Average vs. Time-Series RSSI Readings

Figure 8 shows the distance metric indices between two indoor target points for each floor when correlating the offline and online average and set RSSI readings. In Figure 8, red signifies a zero-dissimilarity index while blue highlights a difference between two target positions. Ideally, the main diagonal of each table should be red because we are correlating the points to themselves. It is also quite understandable that adjacent locations exhibit a certain amount of similarity. Since there is a slight difference between the dissimilarity indices when using average and time-series (set) RSSI data, we will use the average RSSI readings because of the involved processing time. This is crucial, since the downloading time of offline data to the smartphone takes time, thereby affecting the computational time and latency of localization. There have been times where we experienced smartphone unresponsiveness. Finally, it is observed that the dissimilarity index in the first floor is significantly scattered when compared to the second and third floors. This is due to the fact that there is much more open space on the first floor compared to the other floors.

4.4. KNN Technique

We processed 144 experiments involving the KNN technique. For each experiment, we used four sampling sizes, and K varied from 2–19. For each K value, nine trials were performed, and then the average was recorded. The results are shown in Figure 9.
As the number of RSSI values decreases and the accuracy also decreases for either the average or time-series RSSI data. Overall, using the average of 300 data with K = 6 and the time-series (set) of 100 data with K = 14 produces the least amount of errors. We further analyzed these two findings. Figure 10 shows that K = 14 is slightly better than K = 6 . However, a significant difference between these two is seen in their processing times, where K = 6 performs much faster than K = 14 . When using the Samsung smartphone, it takes approximately 0.20 and 0.40 s when processing the average and set RSSI readings, respectively.

4.5. PSO + DBSCAN Technique

The fitness function is determined by calculating the average distance of all the sets in a reference location. It was also determined, using a series of tests, that five iterations, as shown in Figure 11, were enough to produce an accurate PSO algorithm IPS. A lower value of maximum iteration may cause some particles to miss the target location, while a higher iteration would unnecessarily increase the computational power of the mobile device. It is also evident that environmental factors do not affect the performance. When looking at the series data, most peak at the second iteration, then slowly decrease as the number of iteration increases. This is expected, as the area is limited to 50 square meters with obstructions present and 1 m space between each target location.
Implementing PSO on its own for localization shows a lower accuracy when compared to the previous KNN implementation, as shown in Figure 12. Due to this, we integrated DBSCAN for outlier removal.
DBSCAN stores the previous estimations, collects the current estimations as inputs, computes the distance between the two estimations, and determines if the estimated location is acceptable. If there is an outlier detected, the estimation is disregarded. If there is a boundary classification, then the estimation is considered as part of the previous estimations. Finally, if DBSCAN classifies the estimated location as a core, the estimation is added to the stored previous estimations and marked on the map, displayed by the mobile application as the estimated location. Figure 13 shows the localization accuracy of the methods used so far in the localization study. By integrating DBSCAN to PSO, the accuracy increased by 10%, and this was due to the fact that outliers were excluded from the input data. We would also like to emphasize that the improvement due to DBSCAN depends on the previous classification algorithm. When the PSO method produced high deviations, then DBSCAN does not provide an added benefit.

4.6. TRRS Technique

The localization on each floor when using the TRRS technique is shown in Figure 14. Red and blue colors mean correct and incorrect estimation, respectively. Noticeably, there are two incorrect estimations for each floor, leading to each floor accuracy of 29 31 = 94 % , 21 23 = 91 % , and 17 19 = 89 % . The overall localization accuracy is 67 73 = 92 % .
Among the three proposed methods for indoor target localization, the TRRS technique can best estimate the desired indoor target position. Also, TRRS processing is always directly proportional to the amount of data to be correlated. To ensure that the stored fingerprints in the database is up to date, Weighted Fingerprint Averaging (WFA) [7] was adopted. When furniture is moved or because of the presence of sudden guests, the IPS will automatically adjust, thereby achieving higher and accurate localization in as few trials as possible.

4.7. Summary of Discussions

Here, we summarize our findings and the important experimental procedures that we have learned that will help us in duplicating this work in other residential houses. In this study, we have learned that there is not a one-size-fits-all solution for residential houses. Below are the important experimental steps:
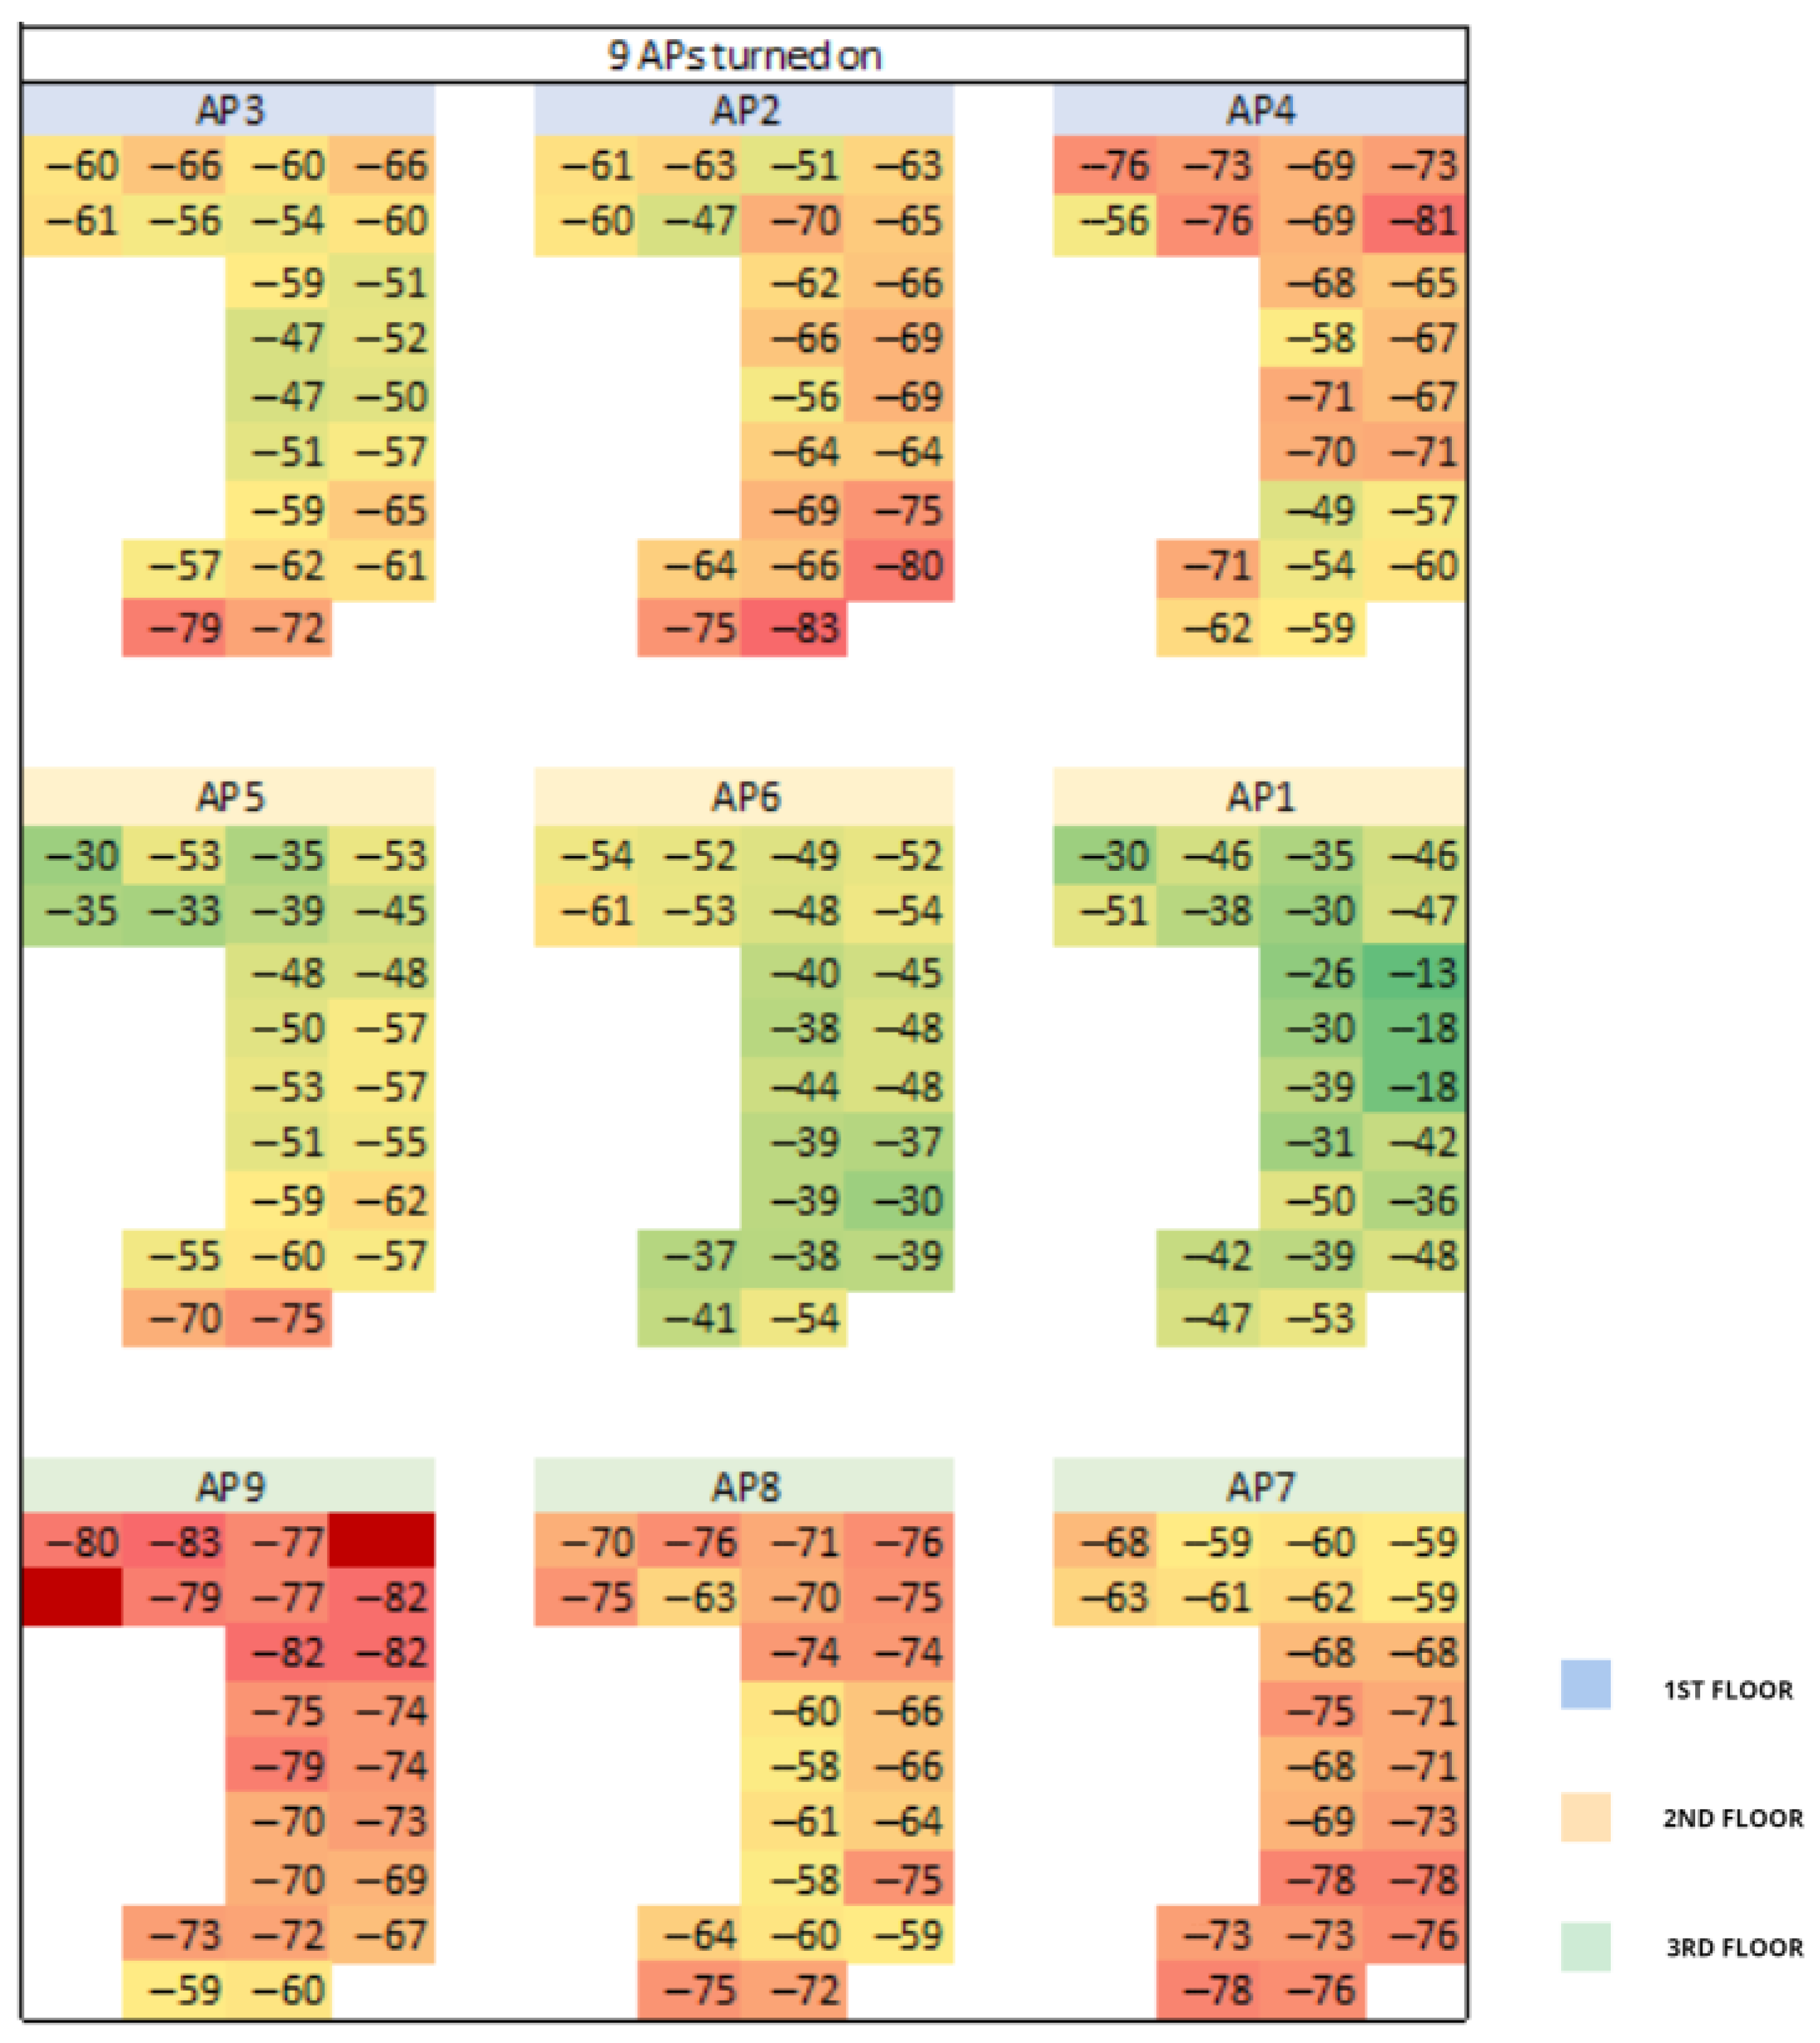
  • A site survey allowed us to finalize the locations where APs are to be deployed so that there was maximum coverage with the least number of deployed APs. Also, it determined how many indoor locations could be tracked. During the preliminary site assessment, we also do not suggest mounting APs onto the ceilings or any high places that will require further wall-drilling. Unlike commercial establishments, residential houses have more conventional movements because they know exactly where these hotspots are and disrupting such wireless system becomes more problematic for them. In most cases, the placement of sockets greatly determines our AP locations.
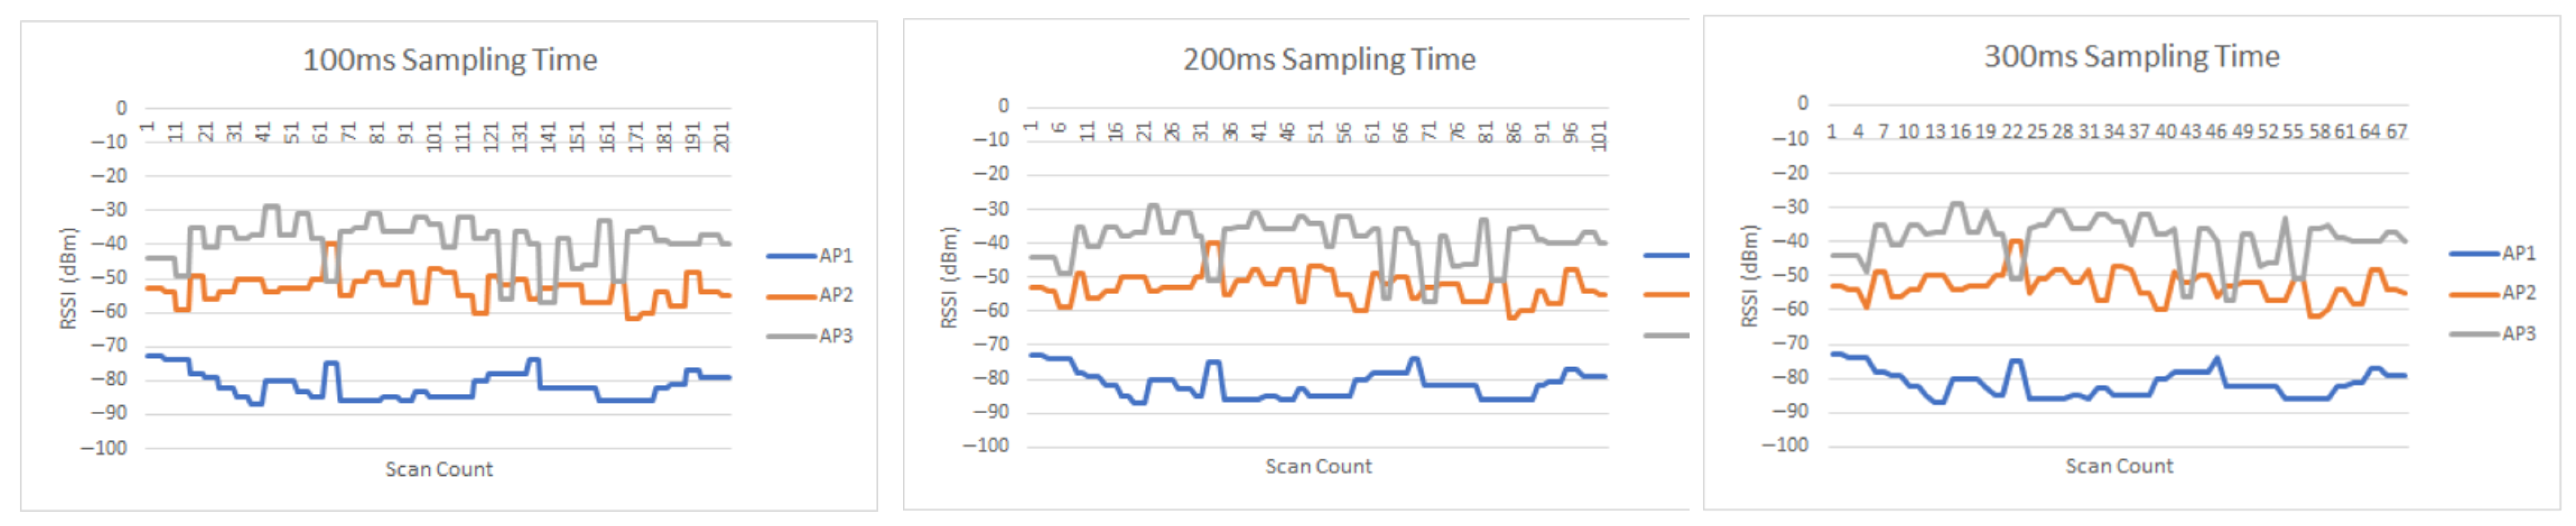
  • The choice of a smartphone is important. We recommend a high-performance smart phone so that it is always responsive and does not keep crashing. Before using the Samsung phone, we utilized the Rino6 Pro phone, which is a cheaper mobile phone. The device used should also be capable of sampling RSSI readings at faster sampling rates to further obtain the environmental features. However, we were not able to test the limit of our smartphone in terms of how fast we could sample the RSSI readings.
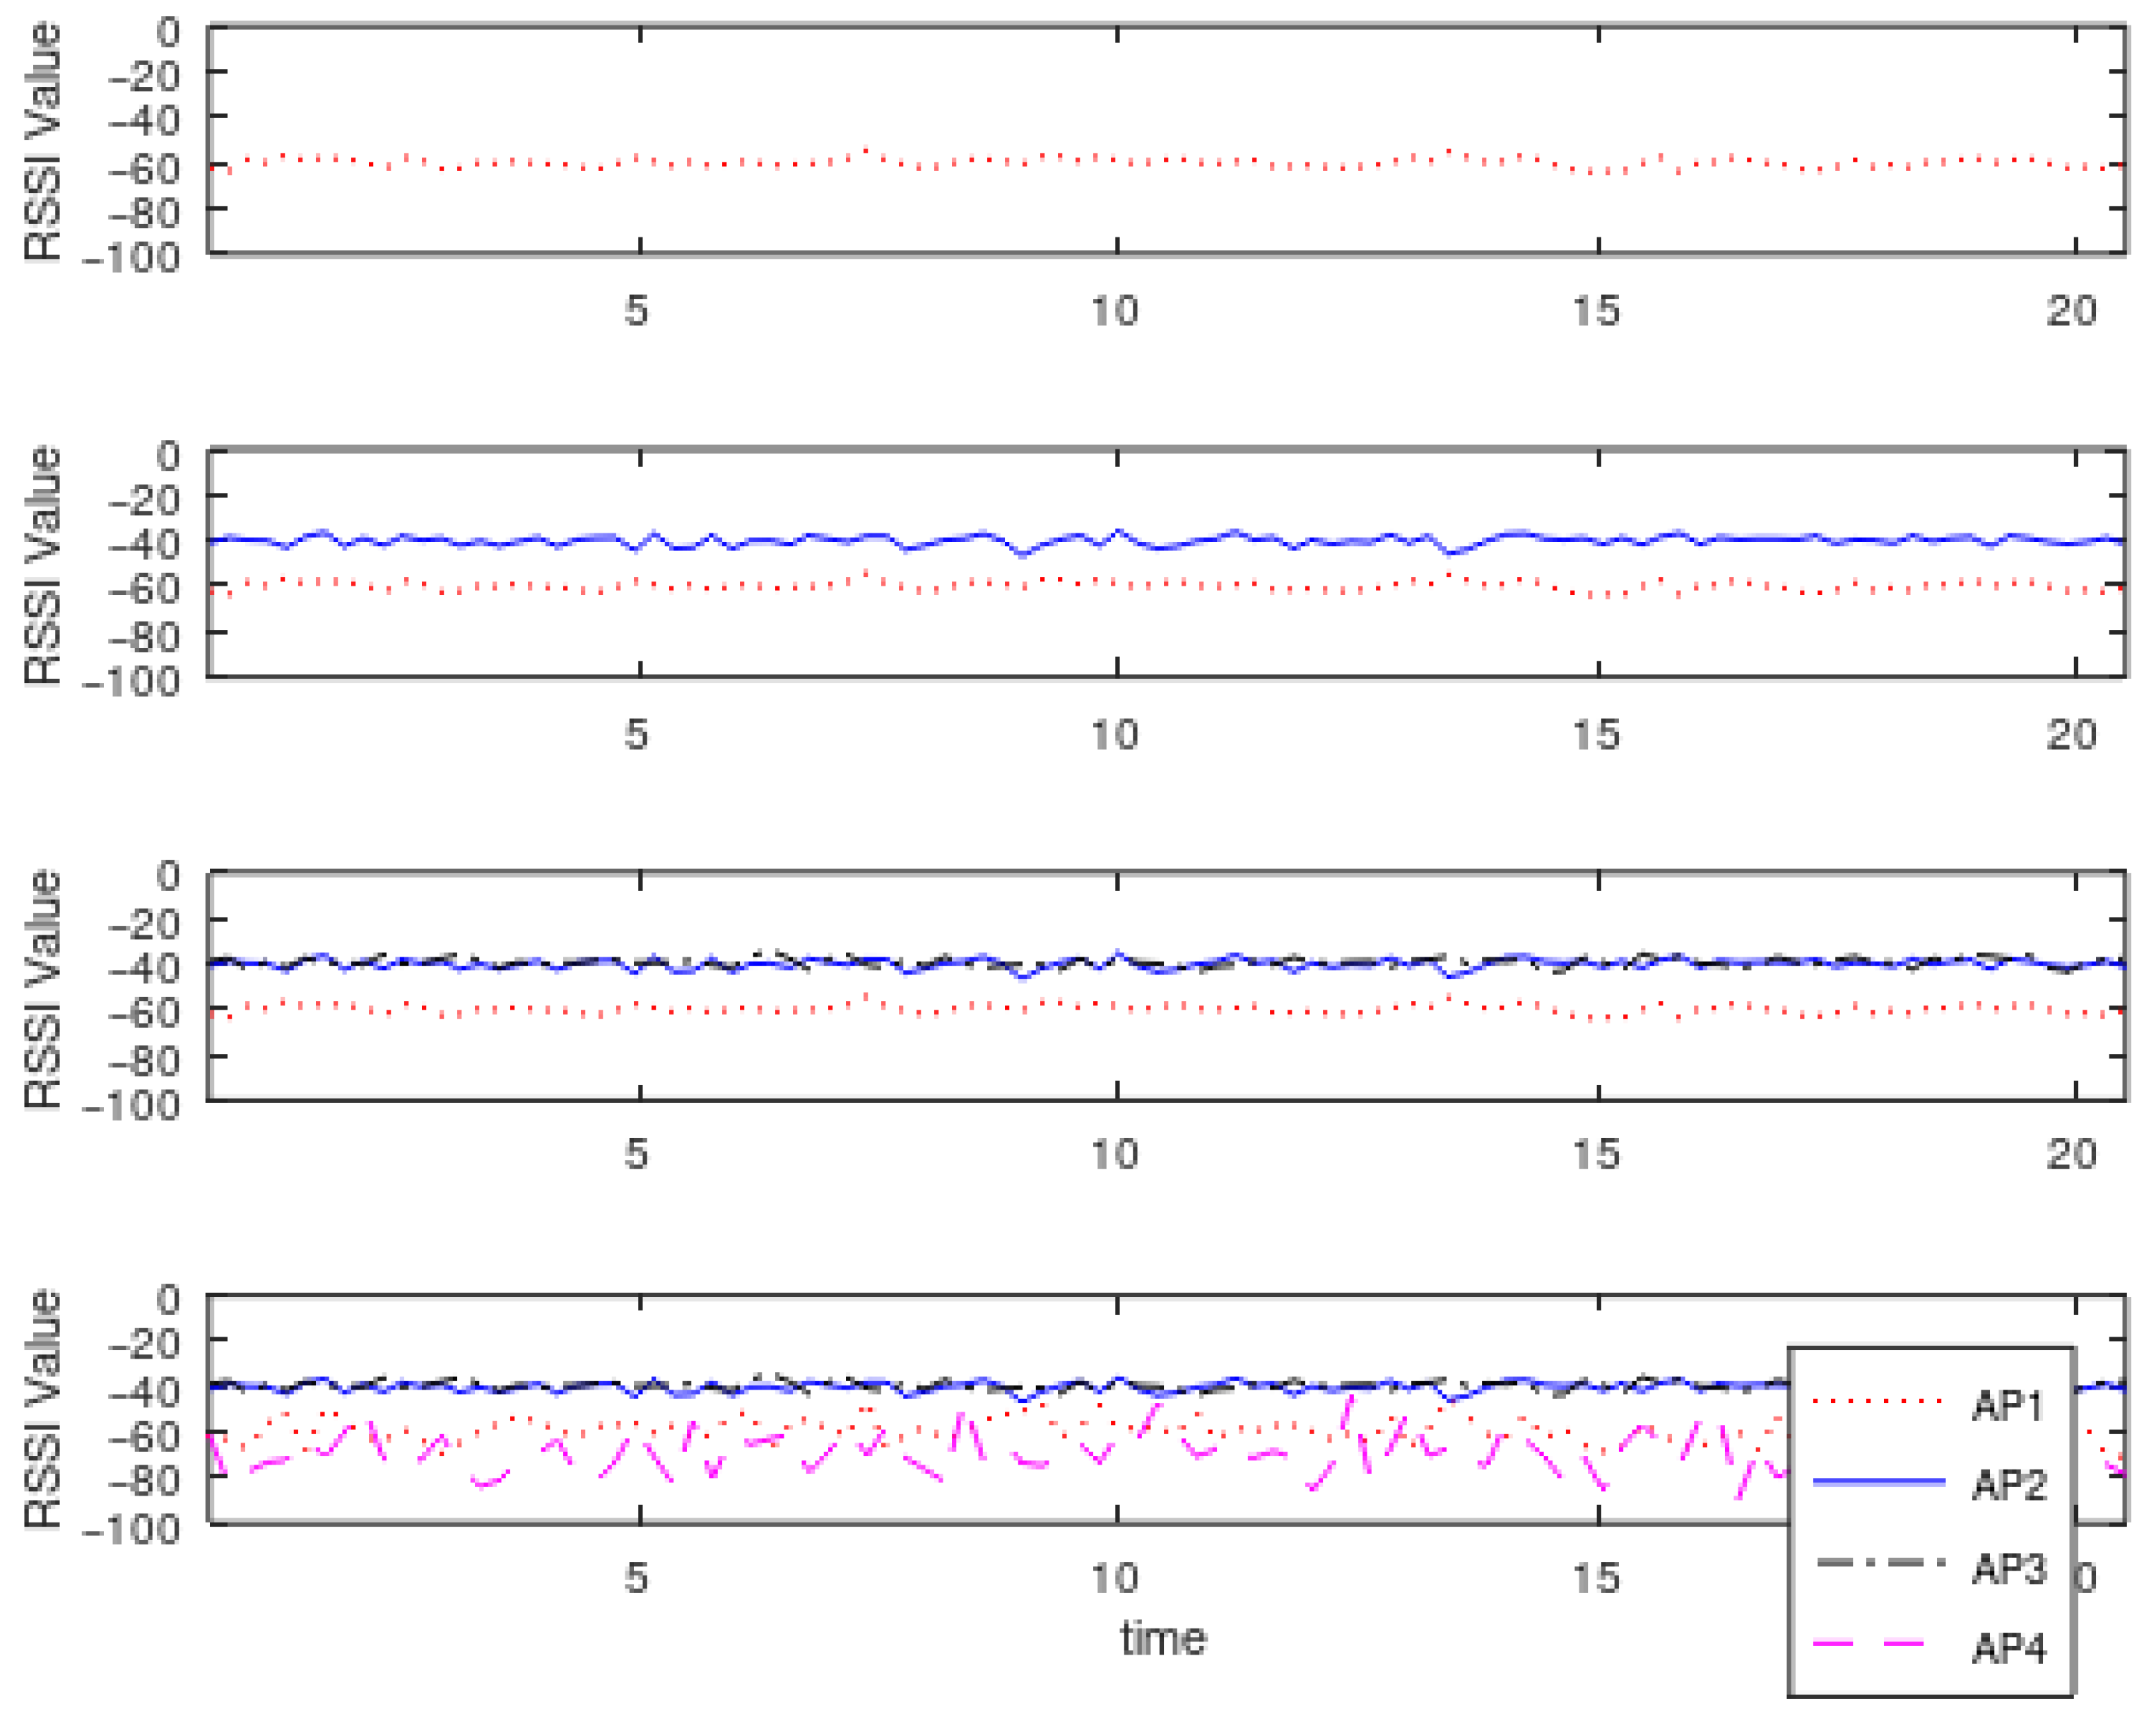
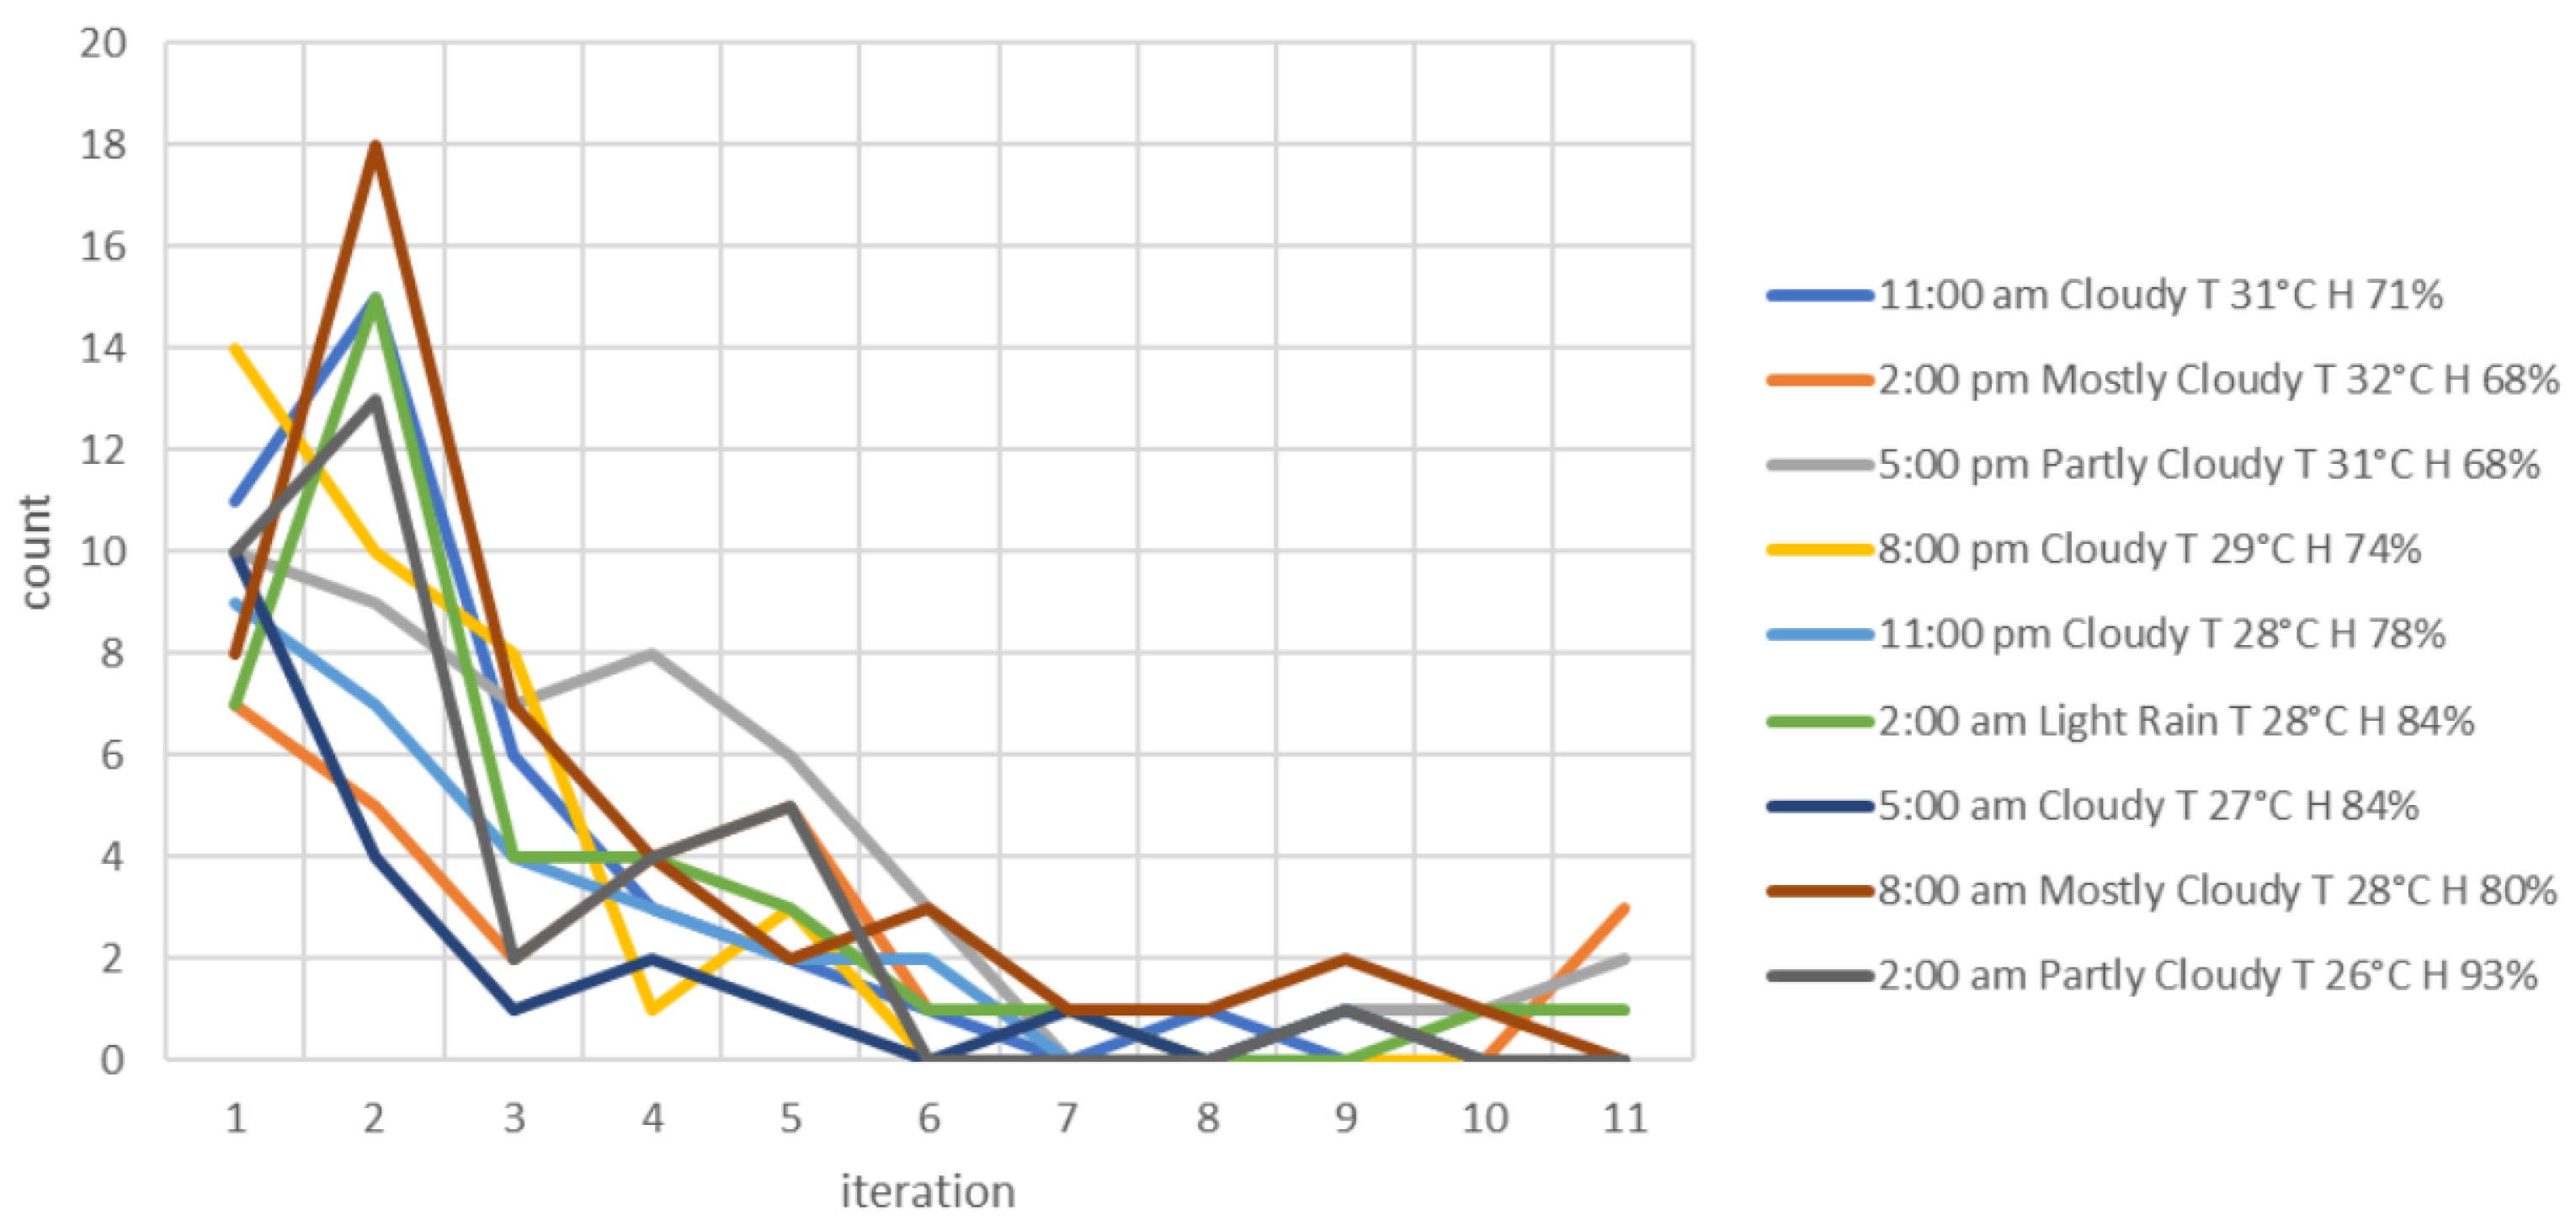
  • The presence of other unwanted APs affects RSSI measurements. With our experiments, we were able to empirically limit the number of APs deployed on each floor. Figure 15 highlights what happens to the three RSSI readings when a fourth AP is added in a floor. Even though the other two readings (violet and red) were not affected, the new AP signal interfered with the gray signal. Ensure that other WiFi routers are absent. However, for houses that are adjacently built where the walls are not enough to attenuate these unwanted signals, it is advantageous to use the received signal as another source of RSSI readings. This scenario will further reduce the deployment of APs, but at the expense of uncertainty, since the control is beyond the homeowner.
  • The environment dynamics greatly affect the scene analysis utilizing fingerprints. It is suggested that these fingerprints are stored for a certain time before being updated. Our work only focuses on the movements of an average household with between five and six members. Therefore, this work excludes the study of a network experiencing heavy congestion, specifically, simultaneous connection with heavy data traffic. The sampling that we chose to capture the RSSI readings was enough for data collection and allowed for high accuracy in indoor tracking and localization.

5. Conclusions

In this study, we have implemented an indoor positioning and tracking system with a 1 m2 resolution in a multi-level residential building. We have utilized RSSI readings coming from WiFi routers to obtain the indoor location’s fingerprint. The indoor target or the user tracked their movement through their mobile phone, acting as a single Anchor Point for detection. From an initial deployment of nine APs, we obtained RSSI readings every 200 ms from six Access Points equally distributed over three floors and situated at the corner ends for maximum coverage. Reading RSSI from APs has been automated by a mobile application we developed that is also capable of storing and updating RSSI fingerprints and performing indoor tracking. To enhance localization and monitoring, we tested three different localization algorithms and compared their performances. The location fingerprints have been measured extensively in a 5-day interval incorporating weather conditions and household movements. Between KNN, PSO + DBSCAN, and TRRS, TRRS achieved the highest accuracy of 92%, although all methods were able to estimate an indoor position at most for an adjacent cell from the true location.
Further research is needed to enhance the performances of our KNN and PSO + DBSCAN techniques and make their results comparable to the TRRS method. We also plan to validate our experimental experience in other residential houses with different structures and indoor arrangements.

Author Contributions

Conceptualization, E.M.; Formal analysis, J.K.S. and J.J.T.; Investigation, R.R.T. and J.J.T.; Methodology, R.R.T. and J.J.T.; Project administration, J.J.T.; Resources, J.K.S.; Software, R.R.T.; Supervision, E.M.; Validation, J.K.S., R.R.T. and J.J.T.; Writing—original draft, E.M.; Writing—review and editing, E.M. All authors have read and agreed to the published version of the manuscript.

Funding

This research received no funding.

Institutional Review Board Statement

Not applicable.

Informed Consent Statement

Not applicable.

Data Availability Statement

The original contributions presented in this study are included in the article. Further inquiries can be directed to the corresponding author(s).

Conflicts of Interest

The authors declare no conflicts of interest.

References

  1. Magsino, E.; Barrameda, J.M.C.; Puno, A.; Ong, S.; Siapco, C.; Vibal, J. Determining commercial parking vacancies employing multiple WiFiRSSI fingerprinting method. J. Sens. Actuator Netw. 2023, 12, 22. [Google Scholar] [CrossRef]
  2. Wichmann, J. Indoor positioning systems in hospitals: A scoping review. Digit. Health 2022, 8, 20552076221081696. [Google Scholar] [CrossRef]
  3. Andersson, I. Indoor Positioning Systems in Office Environments—A Study of Standards, Techniques and Implementation Processes for Indoor Maps. Examensarbete i Geografisk Informationsteknik. 2020. Available online: https://lup.lub.lu.se/luur/download?func=downloadFile&recordOId=9022576&fileOId=9022579 (accessed on 23 July 2025).
  4. Shi, Z.; Deng, Z.; Zheng, W.; Li, N. Campus indoor and outdoor positioning system based on GPS and Wi-Fi. In Proceedings of the 2022 IEEE 9th International Conference on Dependable Systems and Their Applications (DSA), Wulumuqi, China, 4–5 August 2022; pp. 903–908. [Google Scholar]
  5. Kunhoth, J.; Karkar, A.; Al-Maadeed, S.; Al-Ali, A. Indoor positioning and wayfinding systems: A survey. Hum.-Centric Comput. Inf. Sci. 2020, 10, 1–41. [Google Scholar] [CrossRef]
  6. Xie, B.; Cui, M.; Ganesan, D.; Xiong, J. Wall matters: Rethinking the effect of wall for wireless sensing. Proc. ACM Interact. Mob. Wearable Ubiquitous Technol. 2024, 7, 1–22. [Google Scholar] [CrossRef]
  7. Magsino, E.R.; Ho, I.W.H.; Situ, Z. The effects of dynamic environment on channel frequency response-based indoor positioning. In Proceedings of the 2017 IEEE 28th Annual International Symposium on Personal, Indoor, and Mobile Radio Communications (PIMRC), Montreal, QC, Canada, 8–13 October 2017; pp. 1–6. [Google Scholar]
  8. Li, X.; Deng, Z.; Yang, F.; Zheng, X.; Zhang, L.; Zhou, Z. WiFi indoor location method based on RSSI. In Proceedings of the 2021 11th IEEE International Conference on Intelligent Data Acquisition and Advanced Computing Systems: Technology and Applications (IDAACS), Cracow, Poland, 22–25 September 2021; Volume 2, pp. 1036–1040. [Google Scholar]
  9. Wang, J.; Park, J. An enhanced indoor positioning algorithm based on fingerprint using fine-grained csi and rssi measurements of ieee 802.11 n wlan. Sensors 2021, 21, 2769. [Google Scholar] [CrossRef] [PubMed]
  10. Csik, D.; Odry, Á.; Sarcevic, P. Fingerprinting-based indoor positioning using data fusion of different radiocommunication-based technologies. Machines 2023, 11, 302. [Google Scholar] [CrossRef]
  11. Ezhumalai, B.; Song, M.; Park, K. An efficient indoor positioning method based on Wi-Fi RSS fingerprint and classification algorithm. Sensors 2021, 21, 3418. [Google Scholar] [CrossRef] [PubMed]
  12. Regani, S.D.; Hu, Y.; Wang, B.; Liu, K.R. Wifi-based robust indoor localization for daily activity monitoring. In Proceedings of the 1st ACM Workshop on Mobile and Wireless Sensing for Smart Healthcare, Sydney, Australia, 21 October 2022; pp. 1–6. [Google Scholar]
  13. Guo, J.; Ho, I.W.H. Csi-based efficient self-quarantine monitoring system using branchy convolution neural network. In Proceedings of the 2022 IEEE 8th World Forum on Internet of Things (WF-IoT), Yokohama, Japan, 26 October–11 November 2022; pp. 1–6. [Google Scholar]
  14. Magsino, E.R.; Sim, J.K.; Tagabuhin, R.R.; Tirados, J.J.S. Indoor localization of a multi-story residential household using multiple WiFi signals. In Proceedings of the 2021 IEEE International Conference on Innovation and Intelligence for Informatics, Computing, and Technologies (3ICT), Zallaq, Bahrain, 29–30 September 2021; pp. 365–370. [Google Scholar]
  15. Hosseini, K.S.; Azaddel, M.H.; Nourian, M.A.; Azirani, A.A. Improving Multi-floor WiFi-based Indoor positioning systems by Fingerprint grouping. In Proceedings of the 2021 IEEE 5th International Conference on Internet of Things and Applications (IoT), Isfahan, Iran, 19–20 May 2021; pp. 1–6. [Google Scholar]
  16. Hayward, S.; van Lopik, K.; Hinde, C.; West, A.A. A survey of indoor location technologies, techniques and applications in industry. Internet Things 2022, 20, 100608. [Google Scholar] [CrossRef]
  17. Shang, S.; Wang, L. Overview of WiFi fingerprinting-based indoor positioning. IET Commun. 2022, 16, 725–733. [Google Scholar] [CrossRef]
  18. Farahsari, P.S.; Farahzadi, A.; Rezazadeh, J.; Bagheri, A. A survey on indoor positioning systems for IoT-based applications. IEEE Internet Things J. 2022, 9, 7680–7699. [Google Scholar] [CrossRef]
  19. Bellavista-Parent, V.; Torres-Sospedra, J.; Perez-Navarro, A. New trends in indoor positioning based on WiFi and machine learning: A systematic review. In Proceedings of the 2021 IEEE International Conference on Indoor Positioning and Indoor Navigation (IPIN), Lloret de Mar, Spain, 29 November–2 December 2021; pp. 1–8. [Google Scholar]
  20. Raj, N. Indoor RSSI prediction using machine learning for wireless networks. In Proceedings of the 2021 IEEE International Conference on COMmunication Systems & NETworkS (COMSNETS), Bengaluru, India, 5–9 January 2021; pp. 372–374. [Google Scholar]
  21. Feng, Y.; Wang, Y.; Zhao, B.; Bi, J.; Luo, Y. Machine learning-based WiFi indoor localization with FasterKAN: Optimizing communication and signal accuracy. Eng. Sci. 2024, 31, 1289. [Google Scholar] [CrossRef]
  22. Wang, L.; Shang, S.; Wu, Z. Research on indoor 3D positioning algorithm based on wifi fingerprint. Sensors 2022, 23, 153. [Google Scholar] [CrossRef] [PubMed]
  23. Ssekidde, P.; Steven Eyobu, O.; Han, D.S.; Oyana, T.J. Augmented CWT features for deep learning-based indoor localization using WiFi RSSI data. Appl. Sci. 2021, 11, 1806. [Google Scholar] [CrossRef]
  24. Hernández, N.; Parra, I.; Corrales, H.; Izquierdo, R.; Ballardini, A.L.; Salinas, C.; García, I. WiFiNet: WiFi-based indoor localisation using CNNs. Expert Syst. Appl. 2021, 177, 114906. [Google Scholar] [CrossRef]
  25. Truong-Quang, V.; Ho-Sy, T. Maximum convergence algorithm for WiFi based indoor positioning system. Int. J. Electr. Comput. Eng. 2021, 11, 4027. [Google Scholar] [CrossRef]
  26. Luo, M.; Zheng, J.; Sun, W.; Zhang, X. WiFi-based indoor localization using clustering and fusion fingerprint. In Proceedings of the 2021 IEEE 40th Chinese Control Conference (CCC), Shanghai, China, 26–28 July 2021; pp. 3480–3485. [Google Scholar]
  27. Pham-Hai, D.; Duong-Bao, N.; He, J.; Nguyen Thi, L.; Lee, S.W.; Nguyen-Huu, K. WiFi-based Positioning System with k-means Clustering and Outlier Removal: Evidence from Multiple Datasets. In Proceedings of the 12th International Symposium on Information and Communication Technology, Ho Chi Minh, Vietnam, 7–8 December 2023; pp. 980–988. [Google Scholar]
  28. Wang, L.; Zhang, H.; Du, C.; Wu, R.; Liu, Y. WIFI Indoor Positioning Method Based on Global Search K-means Clustering and Improved WKNN Algorithm. In Proceedings of the 2024 IEEE 100th Vehicular Technology Conference (VTC2024-Fall), Washington, DC, USA, 7–10 October 2024; pp. 1–7. [Google Scholar]
  29. Nessa, A.; Adhikari, B.; Hussain, F.; Fernando, X.N. A survey of machine learning for indoor positioning. IEEE Access 2020, 8, 214945–214965. [Google Scholar] [CrossRef]
  30. Kim, Y. An Implementation of DBSCAN. 2025. Available online: https://github.com/mtraton/moa-android/blob/master/moa/src/main/java/moa/clusterers/macro/dbscan/DBScan.java (accessed on 20 July 2025).
  31. Chen, C.; Chen, Y.; Han, Y.; Lai, H.Q.; Zhang, F.; Liu, K.R. Achieving centimeter-accuracy indoor localization on WiFi platforms: A multi-antenna approach. IEEE Internet Things J. 2016, 4, 122–134. [Google Scholar] [CrossRef]
Figure 1. Experimentation study work process.
Information 16 00633 g001
Figure 2. Floor plan of a three-story residential building where indoor tracking and monitoring are performed. The (left), (center), and (right) figures represent the ground, second, and third floor, respectively. AP locations are also shown in each floor.
Information 16 00633 g002
Figure 3. Initial particle positions for each floor. Arrows found in the second floor show the direction of where the particles will go.
Information 16 00633 g003
Figure 4. Implementing DBSCAN to remove online data outliers. Previous Estimations (Blue), Accepted New Estimations (Green) and Rejected New Estimations (Red).
Information 16 00633 g004
Figure 5. RSSI measurements of a single location with a varying number of active APs.
Information 16 00633 g005
Figure 6. Heatmap of the second-floor target locations, with all nine APs active using the average RSSI values. Light and dark colors represent lower and higher RSSI absolute values, respectively.
Information 16 00633 g006
Figure 7. RSSI measurements with varying sampling times. (Left), (middle), and (right) figures represent 100, 200, and 300 ms sampling times, respectively.
Information 16 00633 g007
Figure 8. Comparing average RSSI (first column) and time-series (set) RSSI (second column) values in computing the distance metric to be used in machine learning. (First rows), (second rows), and (third rows) represent the first, second, and third floors, respectively.
Information 16 00633 g008
Figure 9. KNN performance for varying K values.
Information 16 00633 g009
Figure 10. Comparing the performances when K = 6 and K = 14 in terms of accuracy within a meter of localization and its deviation.
Information 16 00633 g010
Figure 11. Number of iterations where the actual location has been first reached by a particle.
Information 16 00633 g011
Figure 12. Performance comparison of KNN and PSO localization implementations.
Information 16 00633 g012
Figure 13. Performance comparison of KNN, PSO, and PSO + DBSCAN localization implementations.
Information 16 00633 g013
Figure 14. Individual localization of first floor (left), second floor (center), and third floor (right).
Information 16 00633 g014
Figure 15. Effects of adding more APs. Left figure shows RSSI readings from three APs that are not distorted. Right figure shows the effects of adding a fourth AP.
Information 16 00633 g015
Disclaimer/Publisher’s Note: The statements, opinions and data contained in all publications are solely those of the individual author(s) and contributor(s) and not of MDPI and/or the editor(s). MDPI and/or the editor(s) disclaim responsibility for any injury to people or property resulting from any ideas, methods, instructions or products referred to in the content.

