Article

Defly Compass Trend Analysis Methodology: Quantifying Trend Detection to Improve Foresight in Strategic Decision Making

by
Mabel López Bordao
,
Antonia Ferrer Sapena
*,
Carlos A. Reyes Pérez
and
Enrique A. Sánchez Pérez
Instituto Universitario de Matemática Pura y Aplicada, Universitat Politècnica de València, 46022 València, Spain
*
Author to whom correspondence should be addressed.
Information 2025, 16(7), 605; https://doi.org/10.3390/info16070605 (registering DOI)
Submission received: 19 June 2025 / Revised: 9 July 2025 / Accepted: 11 July 2025 / Published: 14 July 2025

Abstract

We present a new method for trend analysis that integrates traditional foresight techniques with advanced data processing and artificial intelligence. It addresses the challenge of analyzing large volumes of information while preserving expert insight. The hybrid methodology combines computational analysis with expert validation across four phases: literature review, information systematization, trend identification, and analysis. Tools like Voyant Tools 2.6.18 and NotebookLMare used for semantic and statistical exploration. Among them, we highlight the use of the Defly Compass tool, a natural language processing tool based on semantic projections and developed by our team. The method produces mixed results, including both conceptual conclusions and quantifiable, reproducible outcomes adaptable to diverse contexts. Comparative case studies in agriculture, education, and public health identified key patterns within and across sectors. Cross-domain validation revealed universal trends such as digital infrastructure, data integration, and equity. Designed for accessibility, the method enables small, non-specialized teams to combine computational tools with expert knowledge for strategic decision making in complex environments.

1. Introduction

The unprecedented acceleration of technological and social changes in the 21st century has created a significant methodological gap in the field of foresight analysis. Current methodological development in foresight and trend analysis faces various challenges. Among these, the need to process and analyze increasingly larger volumes of information, the growing complexity of interrelationships between different social and technological phenomena, and the unprecedented speed of global change stand out. Previous methods have failed to resolve three critical gaps: Scalability–Accuracy Trade-off: traditional expert analysis maintains high accuracy but cannot scale to process exponentially growing data volumes; Cross-Domain Integration: existing AI-only approaches miss nuanced interdisciplinary connections that require domain expertise to validate and contextualize; and the Reproducibility Gap: most current foresight methodologies lack standardized protocols for reproducibility, making results difficult to replicate across different research contexts.
Additionally, a standardized definition of what constitutes a trend has not yet been established by the scientific community, despite significant efforts in this direction. A comprehensive analysis of 267 academic records revealed 69 valid definitions, comprising 2255 words, of which 642 were unique [1]. The complete list of all 267 sources analyzed is provided in the Appendix of Reference [1]. This definitional ambiguity manifests in practical challenges: for instance, while some researchers define megatrends as phenomena lasting “7–10 years,” others specify “multiple decades,” and still others require “fundamental structural changes to society”—creating situations where the same phenomenon might be classified as a megatrend by one research team while being dismissed as a temporary trend by another using different definitional criteria.
Foresight studies, a discipline that transformed strategic thinking, emerged in France during the 1950s, revolutionizing how societies envision and construct their future. This innovative field originated from the pioneering work of Gaston Berger, who coined the term “prospective” in his groundbreaking article “L’attitude prospective” [2]. Berger’s vision transcended the boundaries of traditional forecasting, introducing a methodology that not only anticipates the future but proposes its active and conscious construction.
In recent decades, foresight studies and trend analysis have experienced remarkable development [3,4]. The introduction of the megatrend concept by John Naisbitt marked a watershed moment in understanding large-scale social change [5]. Through his work, in which the notion of megatrend was deeply analyzed, Naisbitt transformed the interpretation and analysis of forces defining civilization’s trajectory. This conceptual framework enabled the identification of patterns of change that transcend temporal fluctuations, establishing a new dimension in foresight analysis.
Some of these ideas were gradually transferred to more popular contexts, becoming a common element in the way people think, beyond the academic sphere. Thus, during the same period, Ref. [6] proposed his theory of global and economic changes, referring to broad social movements or “waves” that emerged during the transition from agricultural to industrial and post-industrial society.
The widespread adoption of the megatrends concept has generated variability in its application and some lack of scientific rigor [1]. In the paper [7] by Naisbitt, the concept of megatrend is defined as (p. 12) “major social, economic, political, and technological changes that, although slow in formation, once established, influence us for a considerable period, between seven and ten years or more”. In [8], the original definition of megatrends was expanded, noting that they can be “gradual but explosive trajectories of change” that, once evident, can “precipitate companies, individuals, and societies into free fall” (p. 14).
For the purposes of this analysis, we adopt a synthesized operational definition of megatrends as: large-scale, long-term transformative forces that emerge gradually over multiple years, fundamentally alter social, economic, political, or technological systems, and influence multiple domains simultaneously with sustained impact extending beyond a decade. This definition integrates the temporal persistence emphasized by Naisbitt, the transformative magnitude highlighted by Werner, and the systemic scope recognized by contemporary foresight frameworks.
Thus, a contemporary definition of megatrends is needed to reflect the consensus on how this concept is characterized in the literature, providing the field with a common starting point for future studies. The conceptual evolution of megatrends reflects the increasing complexity of the global environment, as illustrated in Figure 1.
Although the megatrend concept is influential in futures studies, we should not forget that the main interest of these analyses is foresight, and megatrends should be considered central tools for this purpose, but not the only ones. Michel Godet [9] defines foresight as anticipation to illuminate present action in light of possible and desirable futures. Godet emphasizes that foresight does not seek to predict the future but to construct it [10]. This transformative vision of the future aligns perfectly with megatrend analysis, as both approaches recognize the importance of identifying and understanding the forces of change shaping the future.
With the aim of gaining a deeper understanding of the concept of megatrend as an analytical tool, this paper presents an innovative methodology for trend analysis that integrates traditional foresight approaches with advanced data processing technologies and artificial intelligence. By proposing this new methodological framework, which we call Defly Compass [11], we aim to address the growing complexity of foresight analysis in the digital era, offering a systematic and robust approach for the identification/quantification and evaluation of trends.
The research confronts a fundamental challenge in contemporary foresight studies: the need to process and analyze exponentially growing volumes of information while maintaining the depth and precision of expert analysis. Our proposed methodology addresses this challenge through a hybrid process that combines advanced computational analysis with human expertise, allowing for a more precise and well-founded identification of emerging trends, in line with the conceptual framework proposed in [12,13].
Thus, our methodological approach represents a contribution to futures studies by bridging traditional foresight techniques with the analytical capabilities offered by emerging technologies, following the ideas presented in [14,15]. The unique value proposition of our hybrid AI–foresight approach lies in its demonstrated ability to achieve three critical breakthroughs: processing significantly more documents than traditional methods while maintaining expert-level accuracy, identifying previously overlooked cross-domain connections through semantic projections that pure AI or pure expert methods miss, and delivering quantifiable, reproducible results that traditional foresight lacks. As Geurts et al. [13] stated, the integration of quantitative and qualitative data and methods is still a major endeavor in foresight, making our methodology particularly valuable for strategic decision making in data-rich environments. The framework not only facilitates the processing of large-scale data but also incorporates expert validation mechanisms that ensure the practical relevance and significance of the obtained results (see [16]). The effectiveness of the proposed method based on this point of view is demonstrated through its application to comprehensive trend analysis across multiple domains. With this aim, in the present paper we focus attention on three key domains: agriculture, education, and public health, enabling cross-domain validation of the methodology’s robustness and adaptability.
The framework is distinguished by its ability to generate quantifiable and reproducible results, essential characteristics for scientific research in foresight studies. Furthermore, its modular design enables adaptation to diverse analytical contexts and scales, making it particularly valuable for researchers and practitioners across various fields.
While Berger’s foundational prospective methodology and Naisbitt’s megatrend framework provided essential conceptual foundations, contemporary foresight analysis faces challenges that these traditional approaches were not designed to address: the exponential growth of available data, the need for real-time analysis of interconnected global systems, and the requirement for quantifiable, reproducible results. Traditional analytical methods, while valuable, face important limitations given the volume and complexity of information available in the digital age. This research emerges in response to this need, proposing a methodology that integrates the rigor of traditional analysis with modern processing capabilities.
As King et al. [17] note, current trends require adaptive rather than corrective strategies, demanding new methodological approaches capable of capturing and analyzing the complexity of the contemporary environment (see also [18,19]). Other recent studies have demonstrated the inherent complexity in defining and analyzing trends (see for example [20,21]).
All these analyses focus on the detection of trends and megatrends. Our methodological proposal addresses this challenge through the innovative integration of artificial intelligence-based semantic analysis, deep document contextual analysis, and expert-based frequentist analysis (Figure 2). This hybrid approach enables a more complete and nuanced understanding of emerging trends, overcoming the limitations of traditional unidimensional methods [22,23,24].

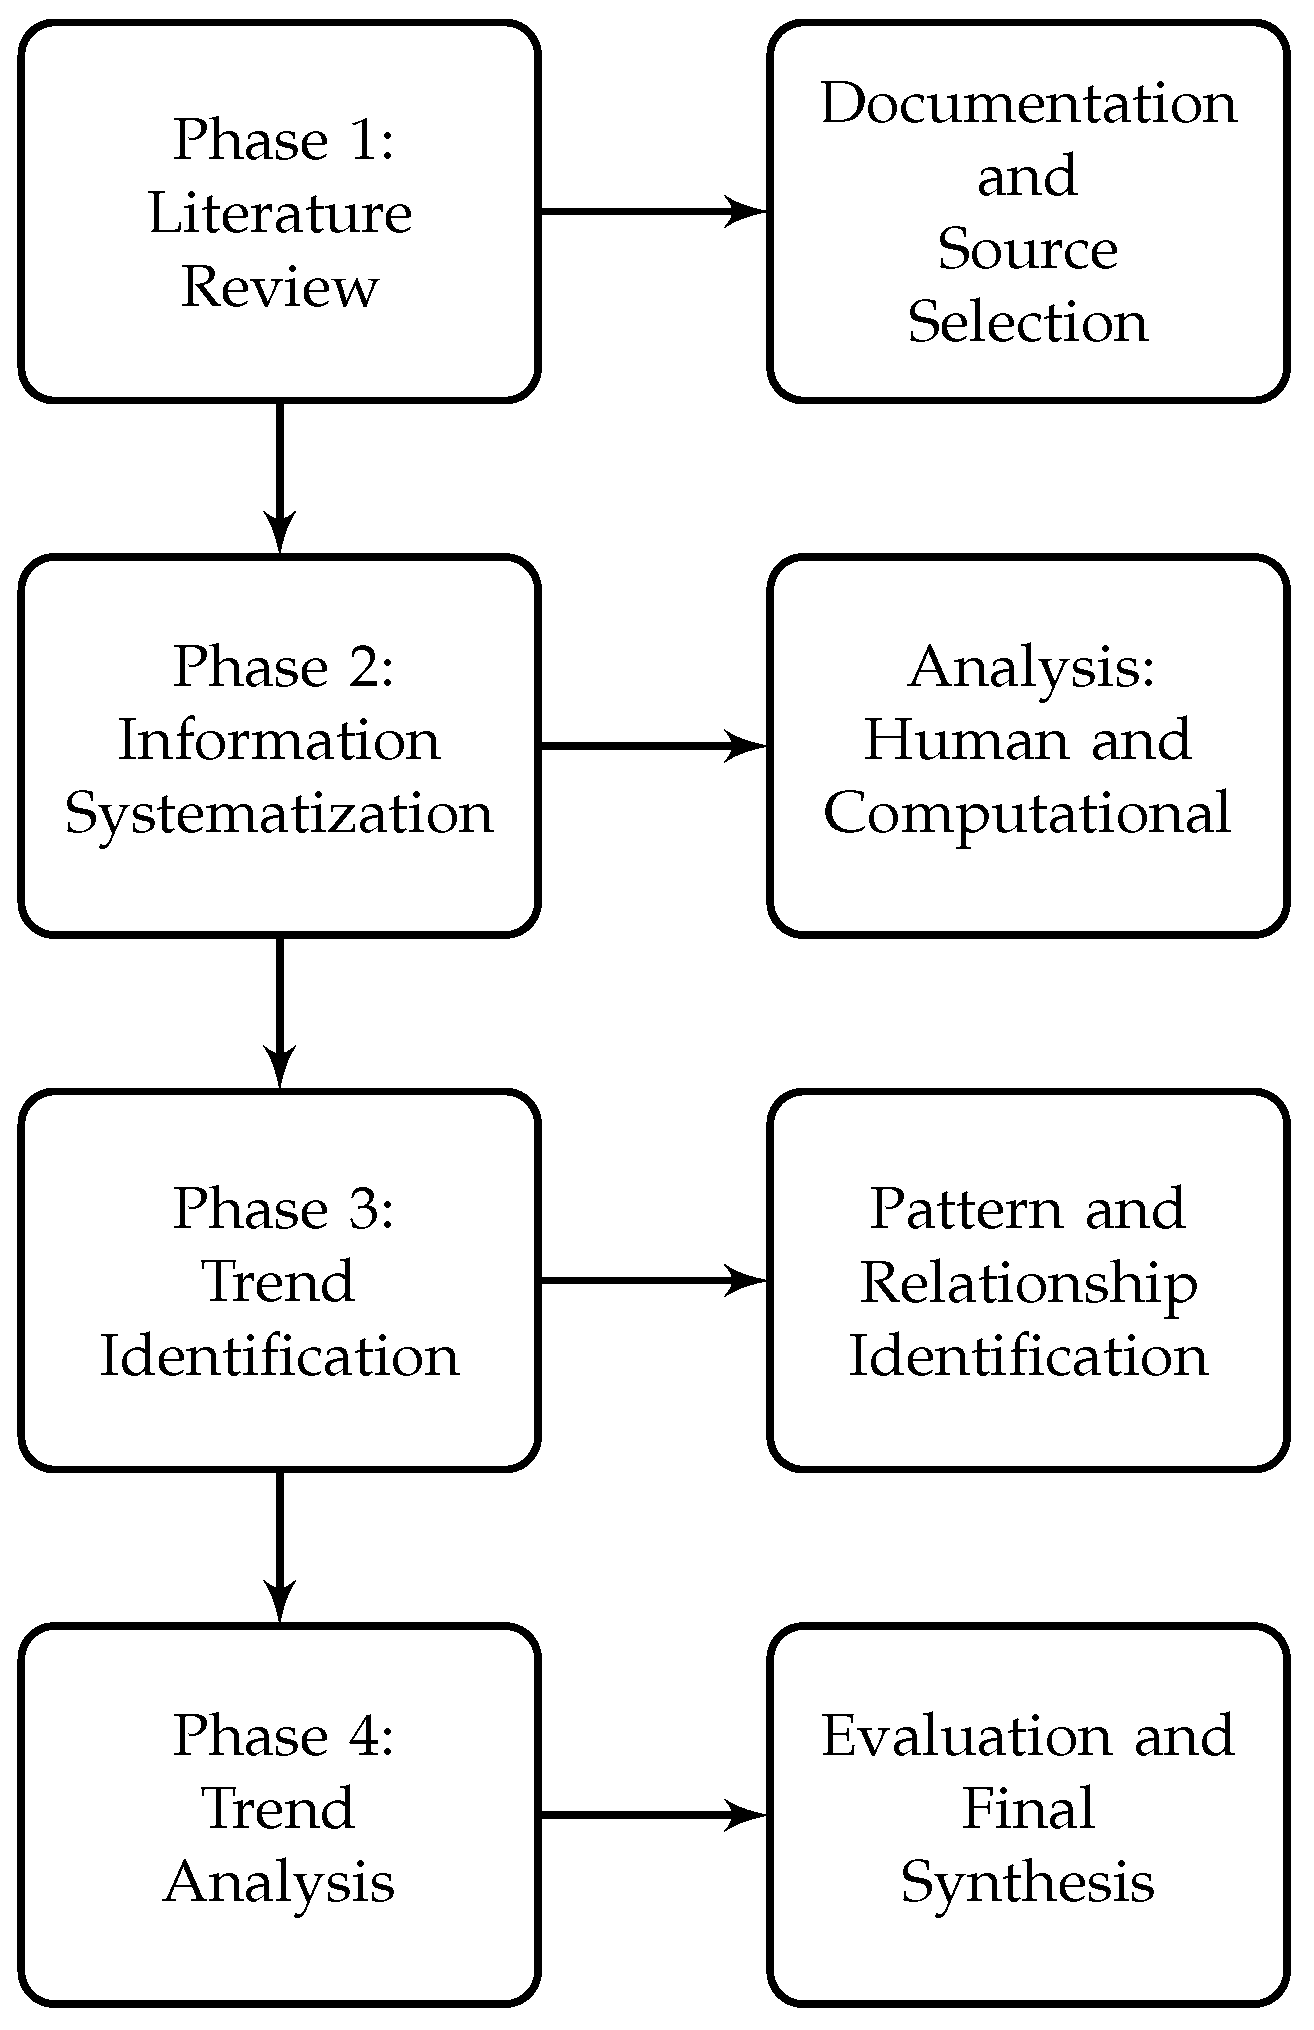
2. Methodological Framework

The proposed methodology integrates the framework explained in [25,26], with innovations in data processing and computational analysis. The process is structured into four fundamental phases, each designed to maximize analytical precision and objectivity, as illustrated in Figure 3.
Phase 1 encompasses a comprehensive literature review, wherein subject matter experts conduct rigorous document selection based on academic impact, temporal relevance, source authority, and reference density. This phase establishes the foundation for subsequent analysis and ensures the quality of baseline information.
Phase 2 implements an innovative dual process that combines human analysis with artificial intelligence processing. This integrated approach, illustrated in Figure 3, enables comprehensive information processing while maintaining analytical rigor.
The frequentist approach was selected over alternative NLP methods due to its superior interpretability, computational efficiency for small document corpora, and alignment with expert validation workflows. Unlike other methods that require extensive prior distributions or neural approaches that operate as “black boxes,” frequentist analysis provides transparent, statistically interpretable results that domain experts can readily evaluate and validate.
The analysis employs specialized tools such as Voyant Tools 2.6.18 and NotebookLM [27,28] for generating term frequency statistics, analyzing co-occurrence patterns, and establishing contextual relationships within the document corpus. Concurrently, artificial intelligence processing utilizes state-of-the-art language models with specialized prompts, enabling deep semantic analysis and complex conceptual relationship extraction.
Phase 3 employs the Defly Compass platform to calculate trends among entities defined in Phase 2. This process involves comprehensive cross-analysis of all identified entities, resulting in a trend matrix. The trend identification algorithm implements a scoring system where relationship strength is calculated using co-occurrence frequency. The calculation process systematically analyzes relationships between entities, computing quantitative values representing relationship strength. Natural clustering patterns emerge from this analysis, with entities forming cluster cores identified as megatrends within their respective contexts.
The final phase consists of comprehensive analysis by an expert examining the megatrends and trends identified in previous phases. Validation protocols are mainly based on Coherence Assessment—experts evaluate the logical consistency of trend relationships between all steps (Voyant Tools, NotebookLM, Defly Compass). Experts evaluate the coherence, relevance, and significance of identified megatrends, contributing specialized knowledge to contextualize and validate findings. This final phase ensures that identified megatrends are not only statistically significant but also relevant and meaningful from practical and theoretical perspectives.
The methodology’s effectiveness derives from its capacity to integrate multiple analytical levels, from computational processing of large data volumes to qualitative expert interpretation. The combination of frequentist analysis, artificial intelligence processing, and expert validation provides deep, nuanced understanding of emerging megatrends and their interconnections, ensuring robust and well-founded results. This integration of computational and human expertise enables comprehensive trend analysis while maintaining analytical rigor throughout the process.

2.1. Comprehensive Textual Analysis Protocol

The implementation of our methodological framework requires a detailed textual analysis protocol that systematizes the multi-dimensional approach to corpus processing. This protocol encompasses corpus preparation, tool configuration, analytical procedures, and validation mechanisms that ensure reproducible and reliable results across diverse domains.

2.1.1. Corpus Preparation and Preprocessing Protocol

The initial phase involves systematic corpus preparation through standardized procedures designed to optimize analytical precision. Document format standardization requires the conversion of all documents to plain text format (UTF-8 encoding), removal of formatting artifacts and metadata, preservation of structural markers (headers, paragraphs), and normalization of citation formats. Quality assurance procedures include the verification of complete text extraction, identification and correction of OCR errors where applicable, validation of document completeness, and elimination of duplicate content segments.
Text normalization processes encompass case standardization for consistency, punctuation normalization following Unicode standards, whitespace regularization, and encoding verification. The protocol maintains document integrity while preparing texts for optimal processing across analytical tools. Special attention is given to preserving domain-specific terminology and technical vocabulary that could be critical for trend identification.

2.1.2. Voyant Tools Processing Configuration

The Voyant Tools implementation follows specific configuration parameters optimized for foresight research applications. Core settings include minimum term frequency thresholds adjusted by corpus size, stopword removal using custom domain-specific lists, and context window configuration of 10 words for co-occurrence analysis.

2.1.3. NotebookLM Analysis Protocol

The NotebookLM implementation utilizes structured prompting protocols designed to maximize analytical depth and consistency. Primary analysis prompts the focus on comprehensive trend identification, pattern recognition for emerging technological developments, and thematic clustering of related concepts.
Secondary analysis procedures include cross-domain relationship mapping, emerging theme detection beyond explicit mentions, and validation of identified patterns through multiple analytical perspectives. The protocol ensures systematic coverage of analytical dimensions while maintaining consistency across diverse document collections.
Quality control measures include output validation through cross-referencing with Voyant Tools results, consistency checking across multiple analysis iterations, expert review of identified patterns for domain relevance, and systematic documentation of analytical decisions and assumptions.

2.1.4. Tool Limitations and Methodological Considerations

While Voyant Tools and NotebookLM provide valuable analytical capabilities, both tools present inherent limitations that must be acknowledged for comprehensive trend analysis across diverse domains.
Voyant Tools Limitations:Voyant Tools focuses primarily on lexical frequency and co-occurrence patterns without deep semantic understanding or contextual intent analysis. Its analytical scope depends entirely on corpus representativeness and quality—biased or limited input data will produce equally biased trend identifications. The platform cannot process multimodal information, limiting its analytical capacity in complex scenarios requiring diverse information integration. Although the tool generates sophisticated visualizations, these require expert interpretation as Voyant Tools provides no automatic trend conclusions. The platform’s effectiveness diminishes when analyzing highly technical or domain-specific terminology that may not follow standard linguistic patterns.
NotebookLM Limitations: NotebookLM’s analytical quality remains constrained by its underlying language model capabilities and inherent biases present in training data. While capable of relating documents, the system experiences difficulties integrating external knowledge not contained within provided documents, potentially missing crucial contextual information. NotebookLM is not designed for the complex quantitative analysis required for rigorous trend validation, limiting its utility in contexts requiring statistical robustness.
Common Methodological Limitations: Both tools struggle with temporal contextualization, making it difficult to position information within appropriate historical or evolutionary frameworks essential for accurate trend identification. Both systems tend to amplify existing biases within input documents without providing mechanisms for bias detection or correction.
For robust trend analysis, we use these computational tools complemented with qualitative methodologies, empirical validation, and expert judgment to compensate for these inherent limitations while leveraging their analytical strengths.

3. Comparative Case Studies: Cross-Domain Applications

To demonstrate the broad applicability and robustness of our methodology across diverse domains, we conducted comprehensive analyses using curated document collections from three distinct sectors: agriculture, education, and public health. This multi-domain approach allows us to validate the methodology’s adaptability and effectiveness across different knowledge areas, each with unique characteristics, stakeholder perspectives, and emerging challenges. The comparative analysis enables assessment of both domain-specific patterns and cross-cutting trends that may influence multiple sectors simultaneously.
Each case study employed identical methodological procedures while adapting to domain-specific terminology, literature characteristics, and expert validation requirements. This parallel implementation approach provides valuable insights into the methodology’s consistency and reveals both universal trends and sector-specific patterns that characterize contemporary technological and social evolution.

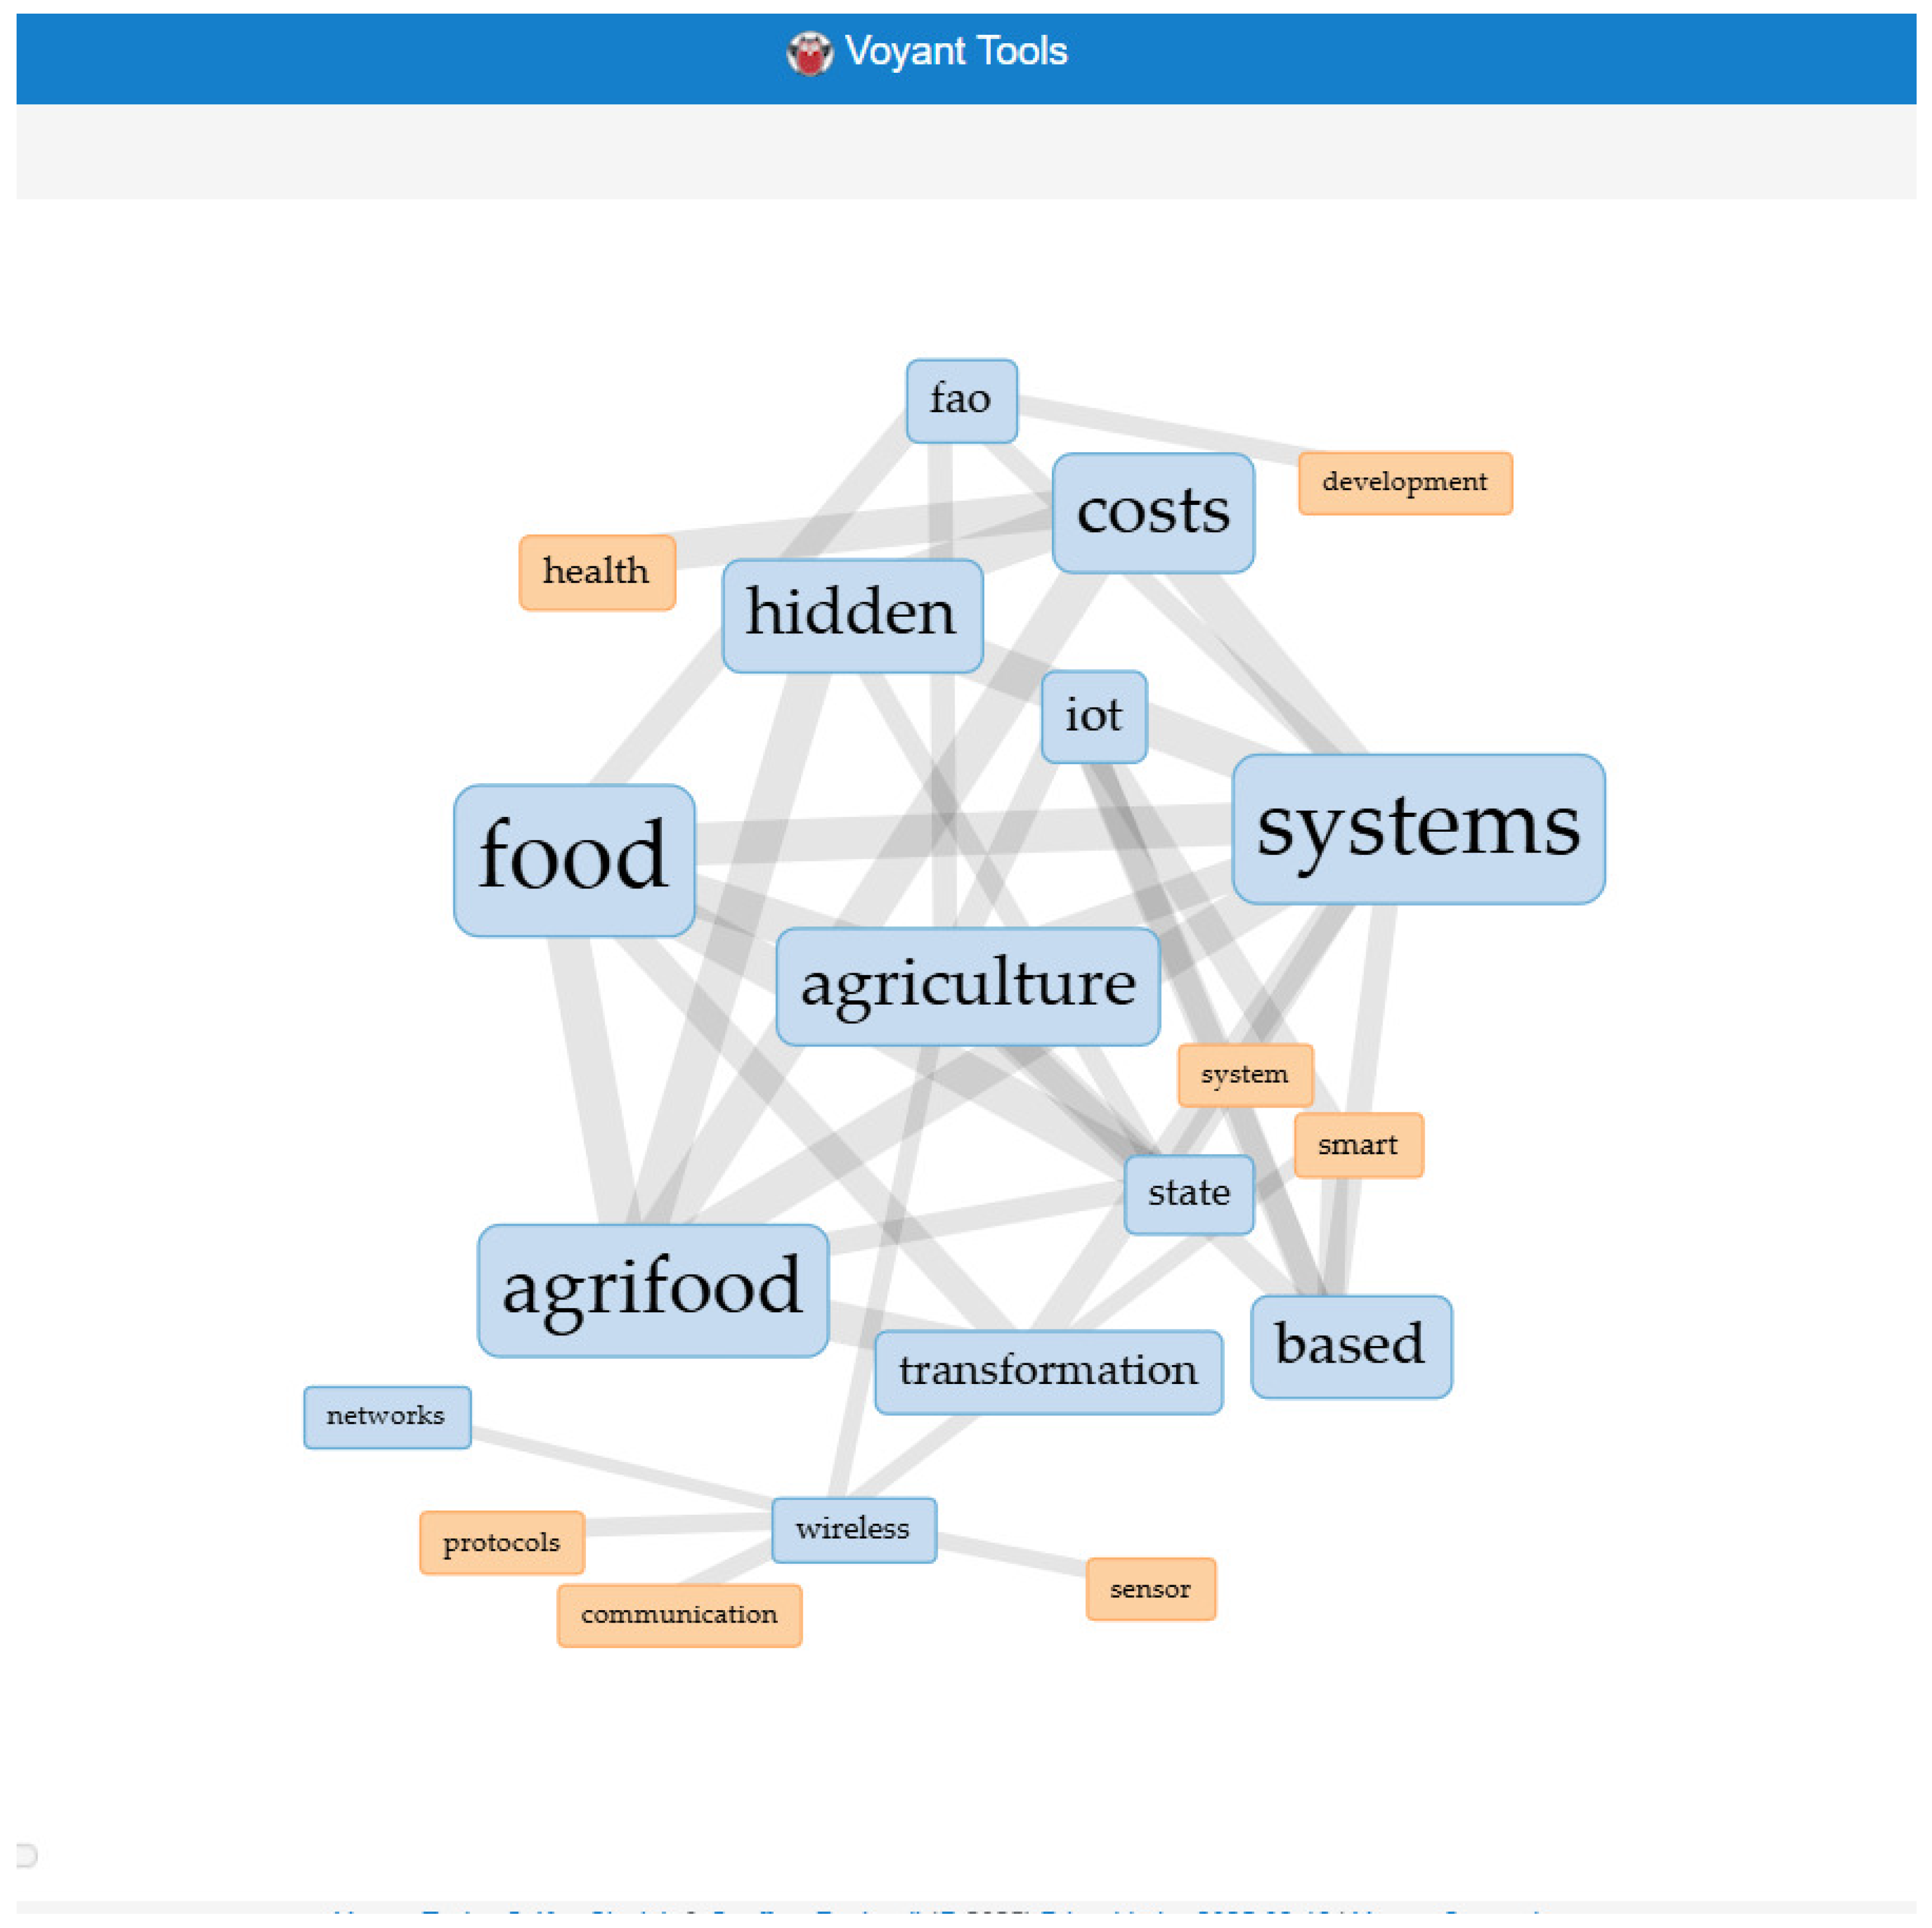
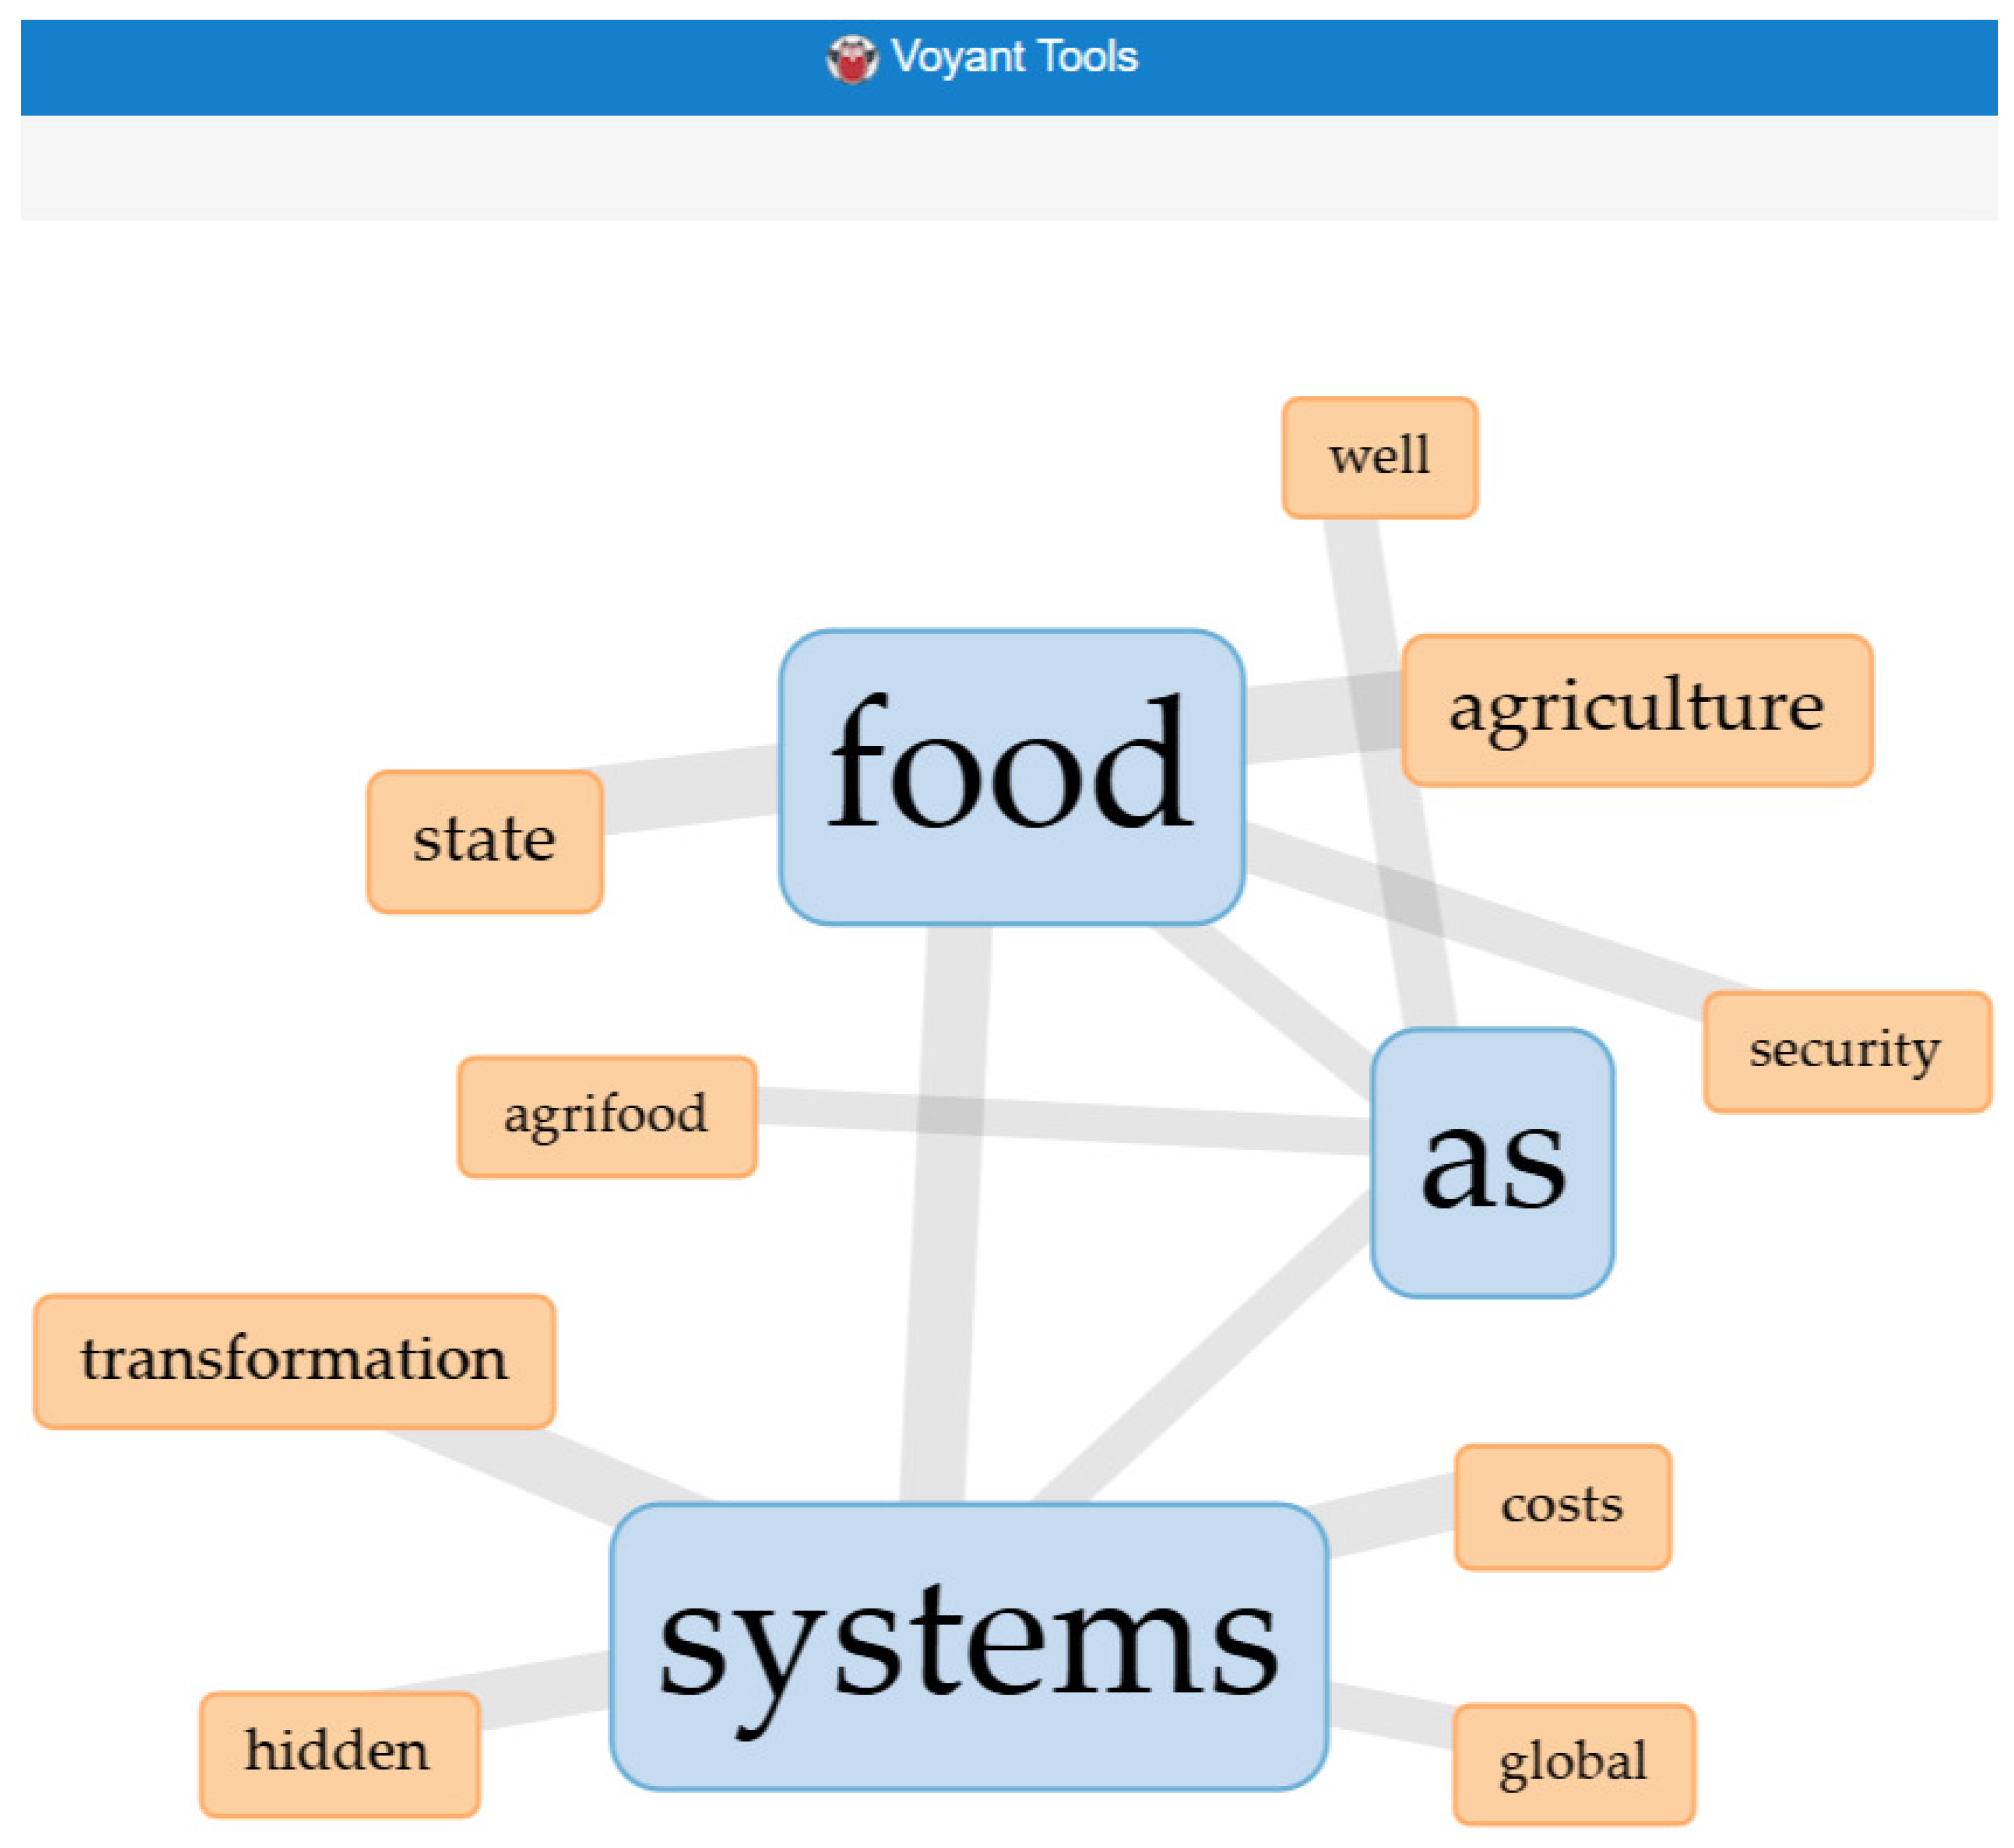
3.1. Agriculture Case Study: Technological Transformation in Food Systems

The document selection process followed rigorous criteria to ensure analytical quality and relevance. Temporal criteria required publications from the last 5 years (2020–2025), prioritizing recent updates of important studies and temporal relevance to the research topic. Accessibility criteria emphasized open access availability, complete text accessibility, and availability of supplementary data. Thematic relevance criteria focused on pertinence to the specific field of study, relevance to the determined research area, keyword alignment with the investigation, and applicability to the research context. Reliability criteria evaluated author affiliation with recognized institutions, conflict of interest declarations, and transparent funding sources. Content quality criteria assessed logical and coherent argumentation, clear distinction between facts, opinions and interpretations, appropriate analytical depth for the format, and terminological and conceptual precision. Diversity criteria ensured the inclusion of multiple perspectives and voices, representation of different geographical or cultural contexts, and appropriate balance between academic and non-academic sources. Pragmatic criteria considered complete content accessibility, the ease of correct citation, availability of supplementary data or information, and clarity of presentation and organization.
The implemented methodology is grounded in a hybrid approach that integrates both quantitative and qualitative analysis, utilizing two complementary natural language processing tools: Voyant Tools and NotebookLM [27,28]. Voyant Tools serves as a textual analysis platform that enables detailed lexicometric analysis, frequency visualizations, and term relationship mapping. NotebookLM, conversely, functions as a natural language processing tool based on advanced language models, capable of conducting deep semantic analysis and identifying emergent patterns in large volumes of text.
Prior to analysis, we conducted a comprehensive corpus cleaning and normalization process. This preprocessing phase included the removal of non-pertinent elements such as URLs and metadata and the elimination of stopwords. This preparatory step proved essential in ensuring the quality and relevance of analytical results by eliminating noise that could potentially interfere with the identification of significant patterns.

3.2. Document Analysis Using Voyant Tools

The initial phase of analysis was conducted using Voyant Tools, facilitating the systematic extraction of lexical patterns and semantic relationships. This digital humanities platform provided a robust framework for textual analysis, enabling the identification of significant linguistic patterns across the corpus. The processing methodology generated three distinct types of analytical visualizations for each document subset, each offering unique insights into the content structure. Word cloud visualizations served as lexical frequency representations, identifying and displaying the frequency distribution of key terms within the corpus. These visualizations proved invaluable for recognizing dominant concepts and terminology patterns across the analyzed documents, bringing immediate attention to central themes that pervaded the literature. The visual prominence of specific terms directly corresponded to their statistical significance within the corpus, providing an intuitive representation of conceptual hierarchies embedded within the text.
A focused analytical approach was applied to the term “agriculture” as a central semantic node, enabling the identification of co-occurrence networks and contextual association patterns within the agricultural domain. Agriculture was selected as the central semantic node based on its high frequency ranking, strong cross-document connectivity, and theoretical significance as the primary domain under investigation, making it an optimal anchor point for semantic network analysis, see Figure 4. This targeted analysis illuminated the semantic ecosystem surrounding agricultural discourse, revealing how various concepts, technologies, and approaches interconnect within the literature.
The network analysis revealed complex patterns of terminology usage and concept relationships, highlighting the multifaceted nature of agricultural technology discourse in the contemporary scientific literature. The visualization of these semantic connections exhibited intricate interconnections between technological innovations, agricultural practices, environmental considerations, and economic factors. These relationships provided valuable insights into the conceptual structure of agricultural technology research and its evolution over the analyzed period, demonstrating how various domains converge to shape agricultural innovation trajectories (Figure 5). The density and structure of these networks reflect the interdisciplinary nature of modern agricultural technology research, where advancements increasingly arise at the intersection of multiple knowledge areas rather than within isolated disciplines.

3.3. Document Analysis Using LLM Notebook

The second methodological phase employed NotebookLM to conduct a comprehensive analysis of the complete corpus, focusing on trend identification across multiple levels (micro, macro, and megatrends). This advanced language model-based tool enabled sophisticated pattern recognition and analysis capabilities beyond conventional text mining approaches. NotebookLM’s implementation facilitated several interconnected analytical functions that enhanced the depth and breadth of our investigation. Through automated thematic pattern recognition, the system systematically identified emerging thematic patterns within the corpus, utilizing advanced natural language processing algorithms to detect subtle conceptual relationships and emerging technological trends without human bias interference. This capability proved particularly valuable when examining complex technological intersections that traditional analytical methods might overlook.
Comparative evaluation against other large language models (ChatGPT o1, Claude 3.5 Sonnet, and Gemini 2.0 Advanced) revealed NotebookLM’s excellent performance, achieving superior results compared to many state-of-the-art models [29]. Its effectiveness has also been demonstrated in various other applications [30].
The strategic integration of NotebookLM with Voyant Tools yielded several significant methodological advantages that strengthened our analytical framework. Through cross-validation and triangulation, this dual-tool approach enabled robust verification of findings, enhancing the reliability of identified trends and patterns through complementary analytical perspectives. The methodological triangulation proved particularly valuable when examining contentious or emerging technological domains where consensus has not yet solidified. Furthermore, the complementary analytical approaches facilitated enhanced trend identification, with each tool providing unique insights that strengthened the overall analysis. Voyant’s quantitative strengths complemented NotebookLM’s qualitative capabilities, creating a more comprehensive analytical lens that captured both statistical significance and contextual nuance.
The validation strength of our approach emerges fundamentally from the independence of our three analytical methods (NotebookLM, Voyant Tools, and the Defly Compass platform). Each method operates through distinct computational paradigms: NotebookLM leverages advanced large language models for semantic pattern recognition, Voyant Tools employs statistical frequency analysis and co-occurrence mapping, while Defly Compass utilizes semantic projections and database integration for relationship quantification [11,31]. This methodological independence is crucial because when three completely separate analytical approaches converge on similar trend identifications and relationship patterns, it provides strong evidence for the validity of the findings. Expert evaluation of coherence between these independent methods serves as our primary validation mechanism, as coherence across methodologically distinct approaches indicates robust trend identification that transcends the limitations of any single analytical tool. Thus, at this point, expert interpretation plays a critical role in consolidating the findings. Rather than relying on specific index values, the expert analyst is expected to assess the degree of alignment among the outputs generated by the three tools. This involves examining whether the frequency-based patterns identified by Voyant Tools, the qualitative insights extracted via NotebookLM, and the relational structures modeled by Defly Compass are conceptually consistent. When such alignment is observed, the analyst can construct a well-contextualized and integrated interpretation that brings together both qualitative and quantitative dimensions. This step enhances the robustness of the overall analysis, as it combines computational rigor with domain-informed judgment, ensuring that the resulting conclusions are both data-driven and contextually meaningful.
The combined methodology enabled multi-dimensional analysis integration, comprehensively integrating quantitative and qualitative aspects of the corpus and providing a more nuanced understanding of technological developments across multiple domains. This integrated analytical approach ultimately provided a robust framework for understanding complex patterns and relationships within technological discourse across agriculture, education, and public health, while ensuring methodological rigor through systematic cross-validation of findings. The resulting insights offered a multifaceted view of technology evolution that accounts for both evident trends and subtler shifts in technological discourse that might signal future directions across diverse fields.

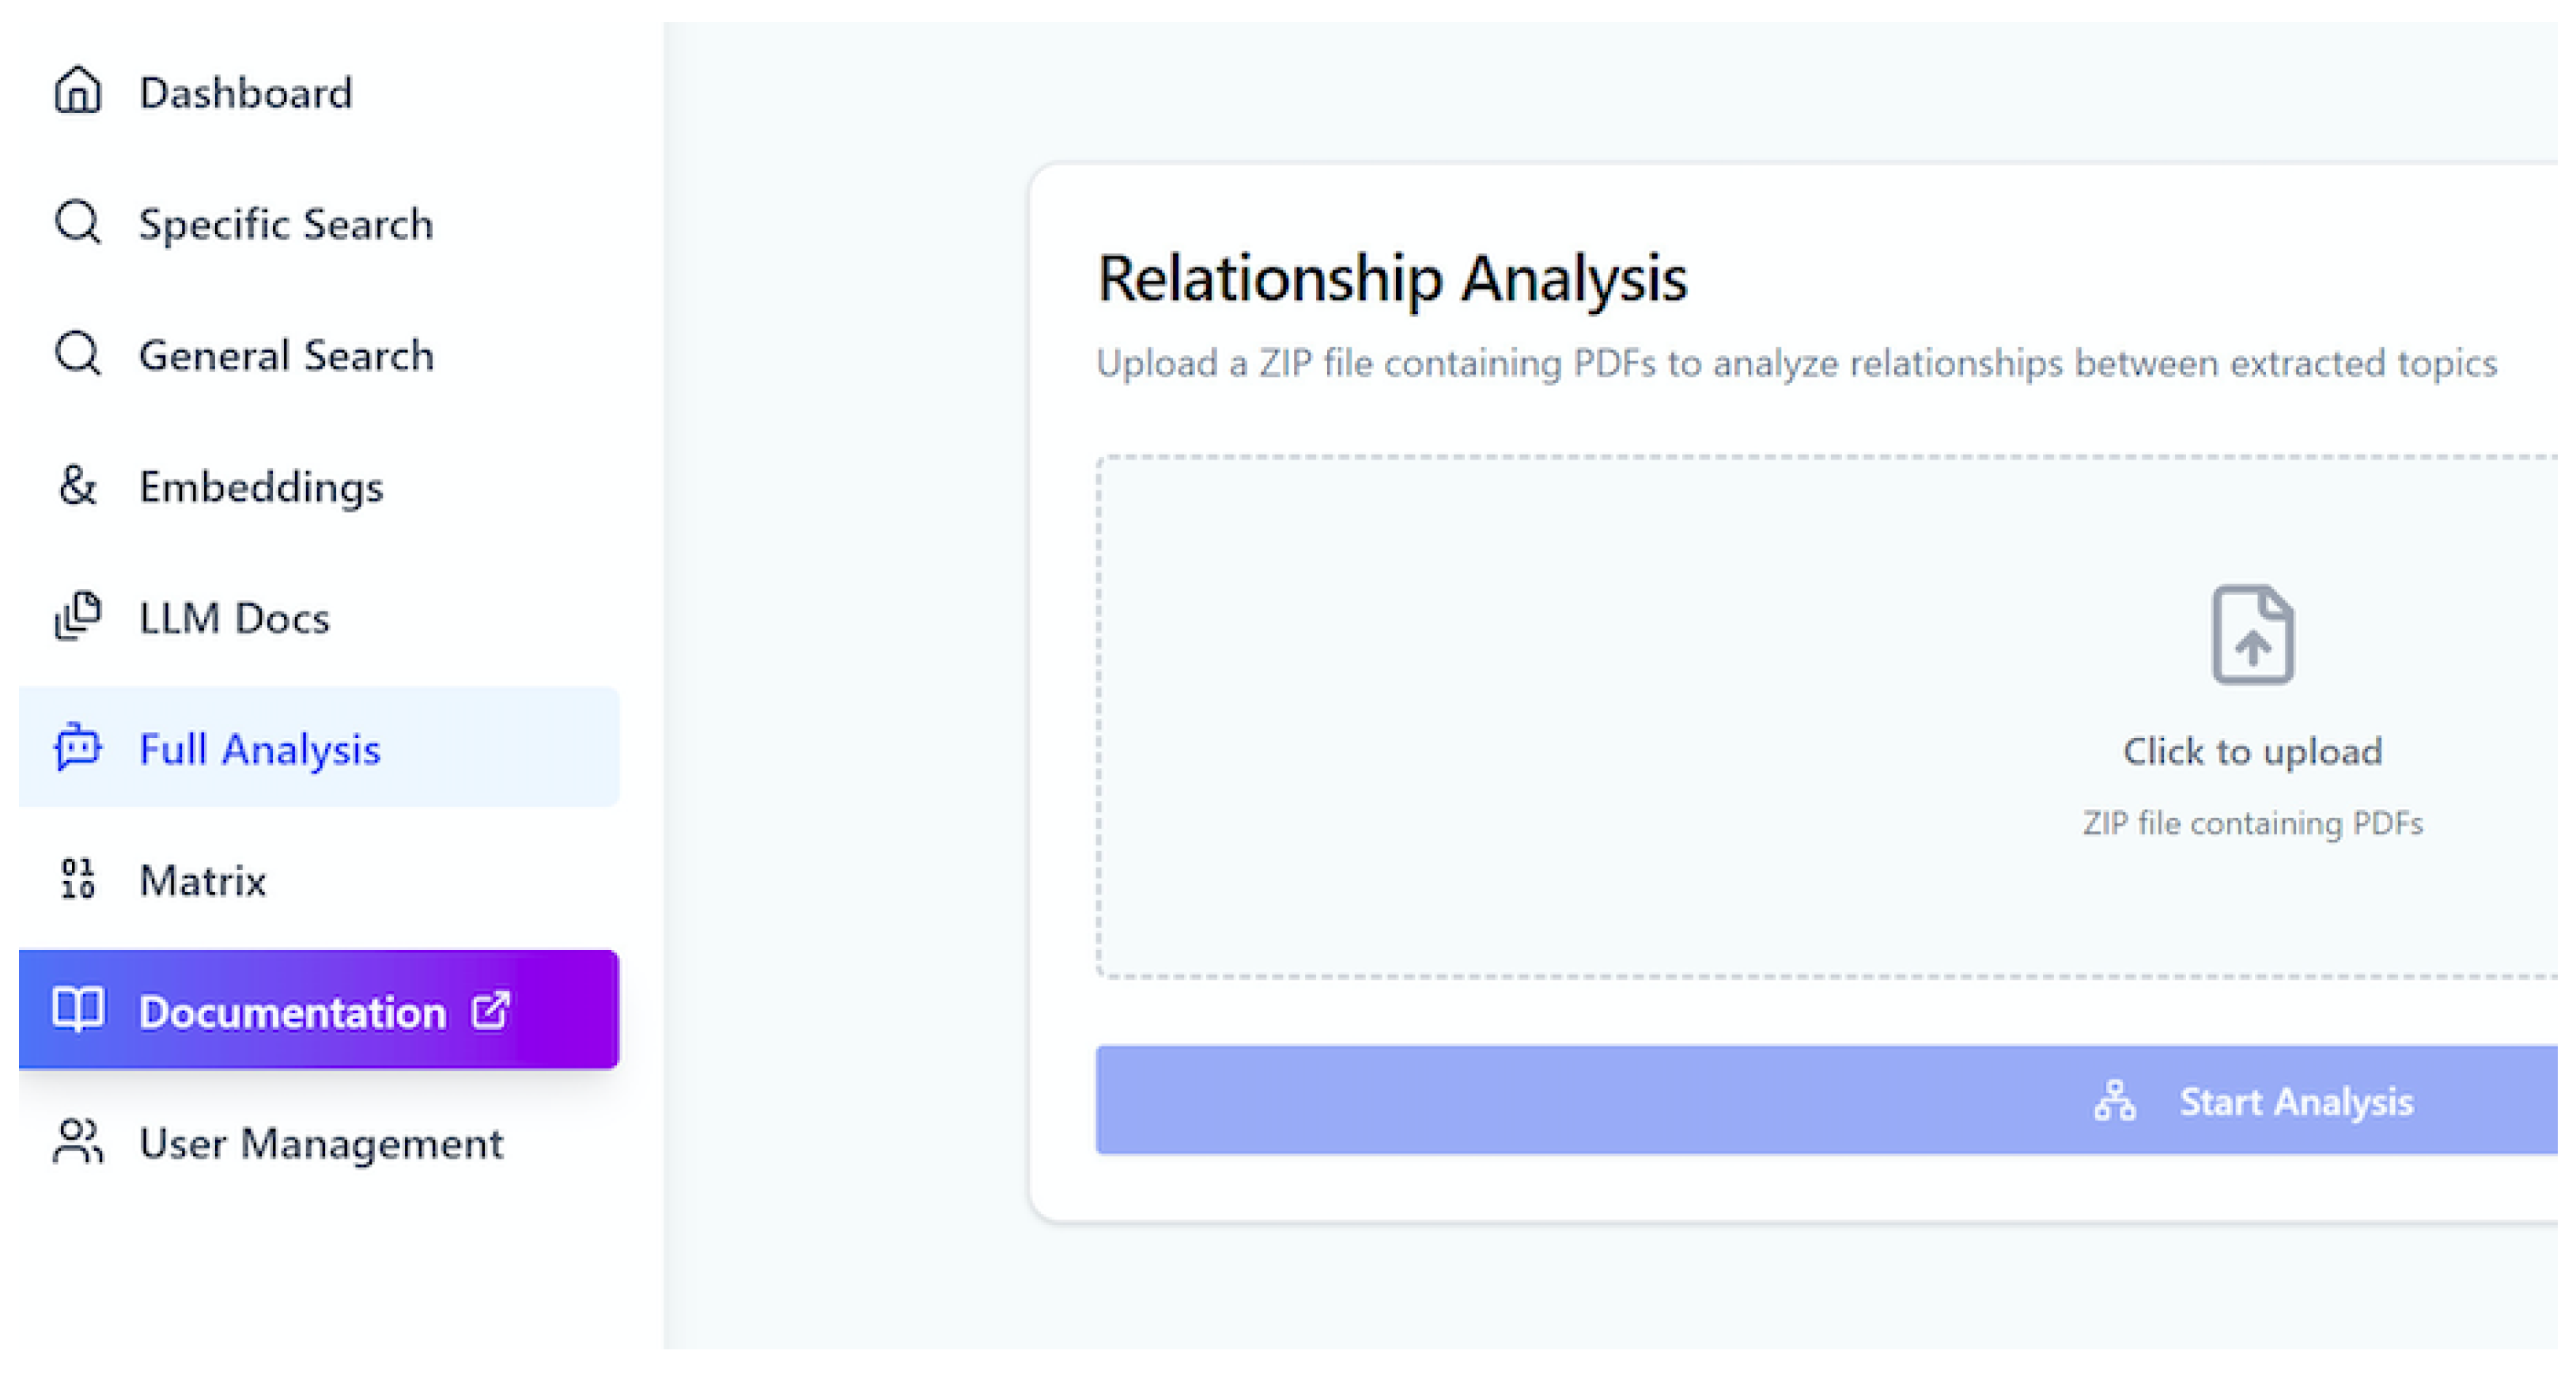
3.4. Defly Compass Methodology

Defly Compass is an experimental methodology designed to streamline expert analysis by integrating artificial intelligence tools and specialized database APIs (refer to [11,31], where it is mentioned under a different name). The accompanying digital platform, designed to automate technical analysis based on this method, facilitates comprehensive document analysis through a sophisticated processing pipeline, connecting both scientific and general databases. Although still in a preliminary version, it has already been used to complete parts of the analysis in this article.
The theoretical foundation of the Defly Compass method relies on semantic projections, which are used to analyze trends by measuring how closely a specific term aligns with a recognized trend. Originally developed in natural language processing (NLP) to define attributes of non-noun words, this technique has been adapted within the mentioned platform to analyze trends in higher education, as well as in other fields. It uses AI to measure the association between terms in academic databases and search engines through semantic similarity coefficients. Essentially, this methodology searches for coincidences of selected terms in several documental repositories. By calculating how frequently two terms appear together across various documents, researchers can assess the evolution of key concepts, such as personalized learning or the adoption of artificial intelligence in education. A complete explanation of the mathematical method that allows to compare and find the correlations between the information obtained finding the semantic projections from different documental sources can be found in the recently published paper [32].
The Defly Compass method integrates AI, text mining, and semantic analysis to identify trends in general subjects. It processes information from scientific articles, search engines, and digital marketing tools. Using the ASPECT model (Arts, Science, Population, Economy, Culture, and Technology), it categorizes trends and assesses their potential impact. This approach helps, for example, to align with market demands and societal changes. In this study, the method was used to analyze established trends, allowing for comparison and concordance analysis among them. It is based on the use of a computation platform that integrates several AI tools as well as our own calculations on semantic projections.
The algorithms implemented in the platform perform semantic projections and generate dynamic visualizations that facilitate interpretation and decision making. Users can select from multiple data sources, which update automatically depending on the type of analysis being conducted. These sources include repositories such as arXiv, Google Scholar, DOAJ, and other indexed or curated databases. The system retrieves and processes information to produce line graphs, bar charts, histograms, and scatter plots, depending on the structure and nature of the underlying data. In addition to bibliometric outputs, the platform enables users to compute semantic projections based on co-occurrence matrices. These projections facilitate the identification of thematic clusters, topic drift over time, and latent semantic structures in textual datasets. The platform features a modular architecture that allows for the integration or replacement of components to enhance specific analytical capabilities. Individual modules handle data ingestion, text preprocessing, and semantic similarity computation. This modular approach ensures scalability, extensibility, and adaptability to different research domains or user needs. Beyond the overview interface illustrated in Figure 6, many figures included in this paper are generated as direct outputs of the platform, based on the algorithms and data processing workflows described above.

3.4.1. Document Processing Methodology

In particular, the platform employs Google Gemini 2 [33], a state-of-the-art language model, as its primary analytical engine. This model’s distinctive advantage lies in its extensive context window of 2M tokens, enabling the analysis of substantial text volumes within a single query. The implementation utilizes optimized instructions and specialized prompts specifically designed for trend extraction. The system prompt structure combines instructions (“You are a renowned trend analyst and prospectivist”) with detailed formatting guidelines specifying: (1) 3–5 word concise phrases using SEO-optimized terminology; (2) the exclusion of articles and numbering; (3) an emphasis on forward-looking developments with cross-industry implications; (4) a balance between technological and social trends; and (5) global market relevance considerations. This structured approach ensures consistent trend extraction across diverse document types while maintaining analytical rigor.
The process unfolds through multiple iterative phases, beginning with initial processing where the model analyzes the original texts and extracts relevant trends across all documents. This phase is guided by predetermined analytical guidelines, with a temperature setting of 0.1 employed to minimize model hallucinations and ensure output consistency. Following initial extraction, the system implements an iterative process of trend refinement and consolidation, progressively filtering and transforming identified trends until reaching a curated list of 30 key trends. This quantity was selected to optimize visualization clarity and processing efficiency while evaluating the model’s summarization capabilities. Although no practical restrictions exist on the final number of trends, this constraint helps evaluate the model’s ability to identify globally relevant patterns across the corpus.

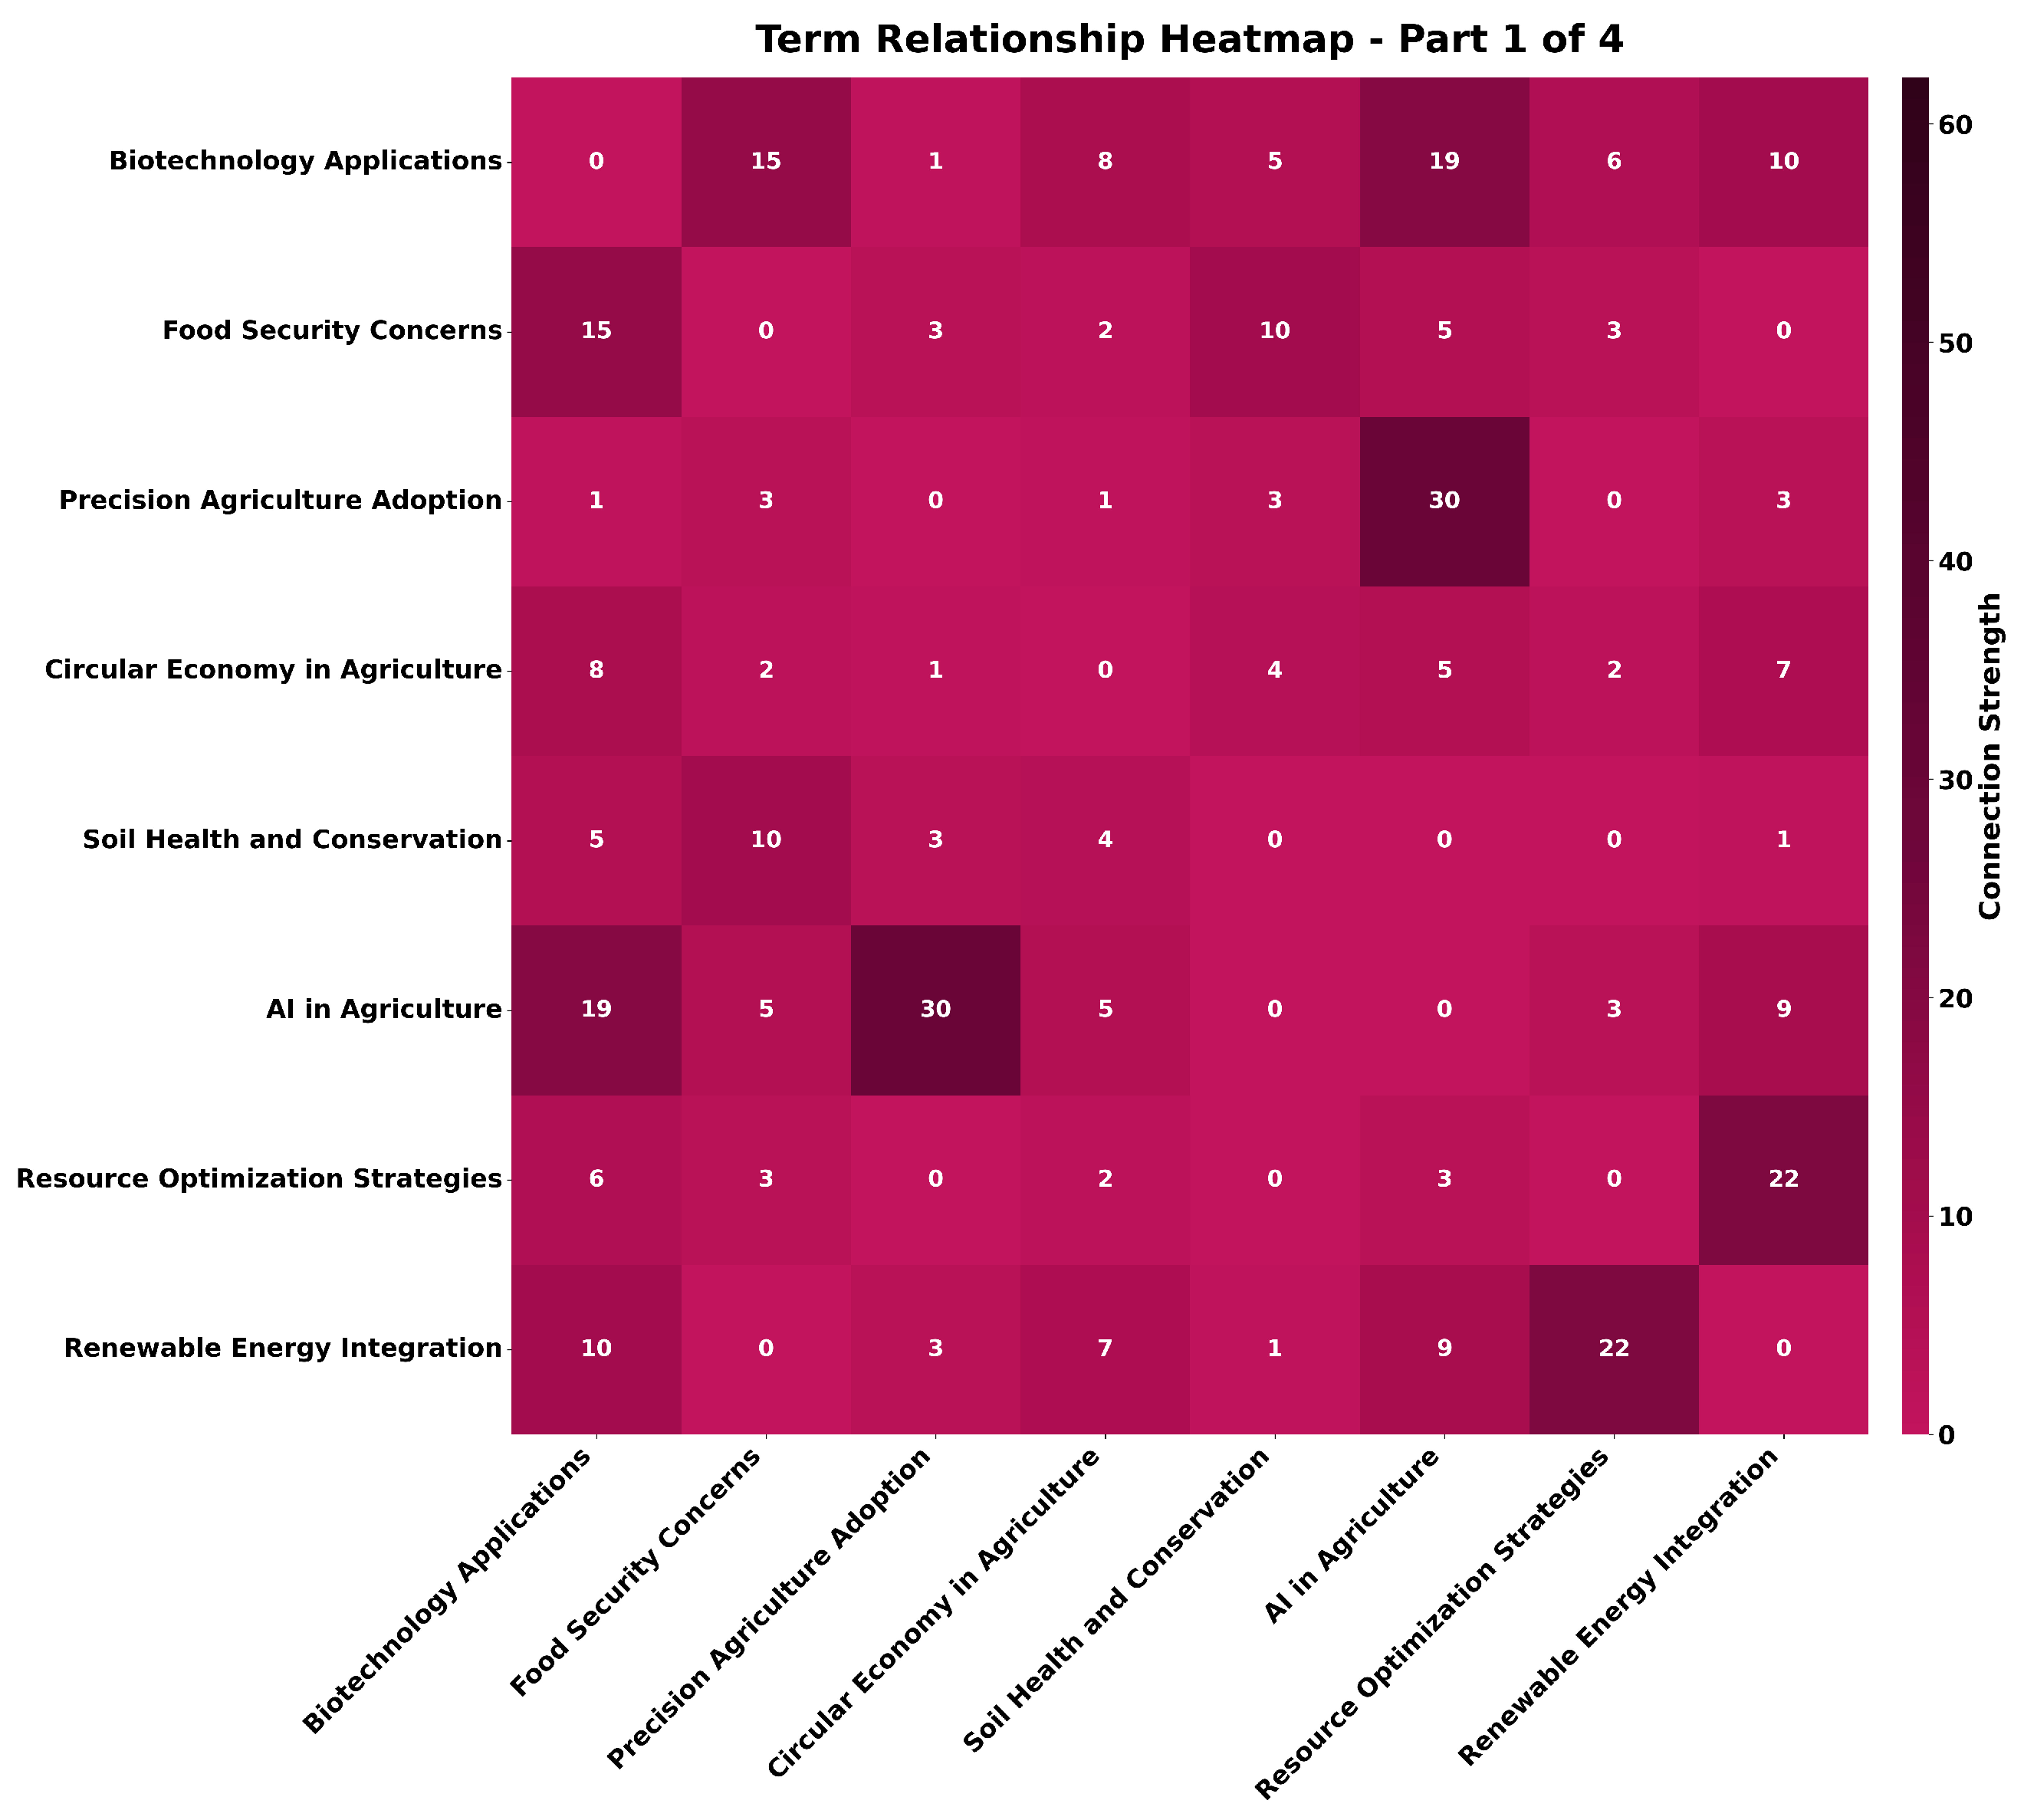
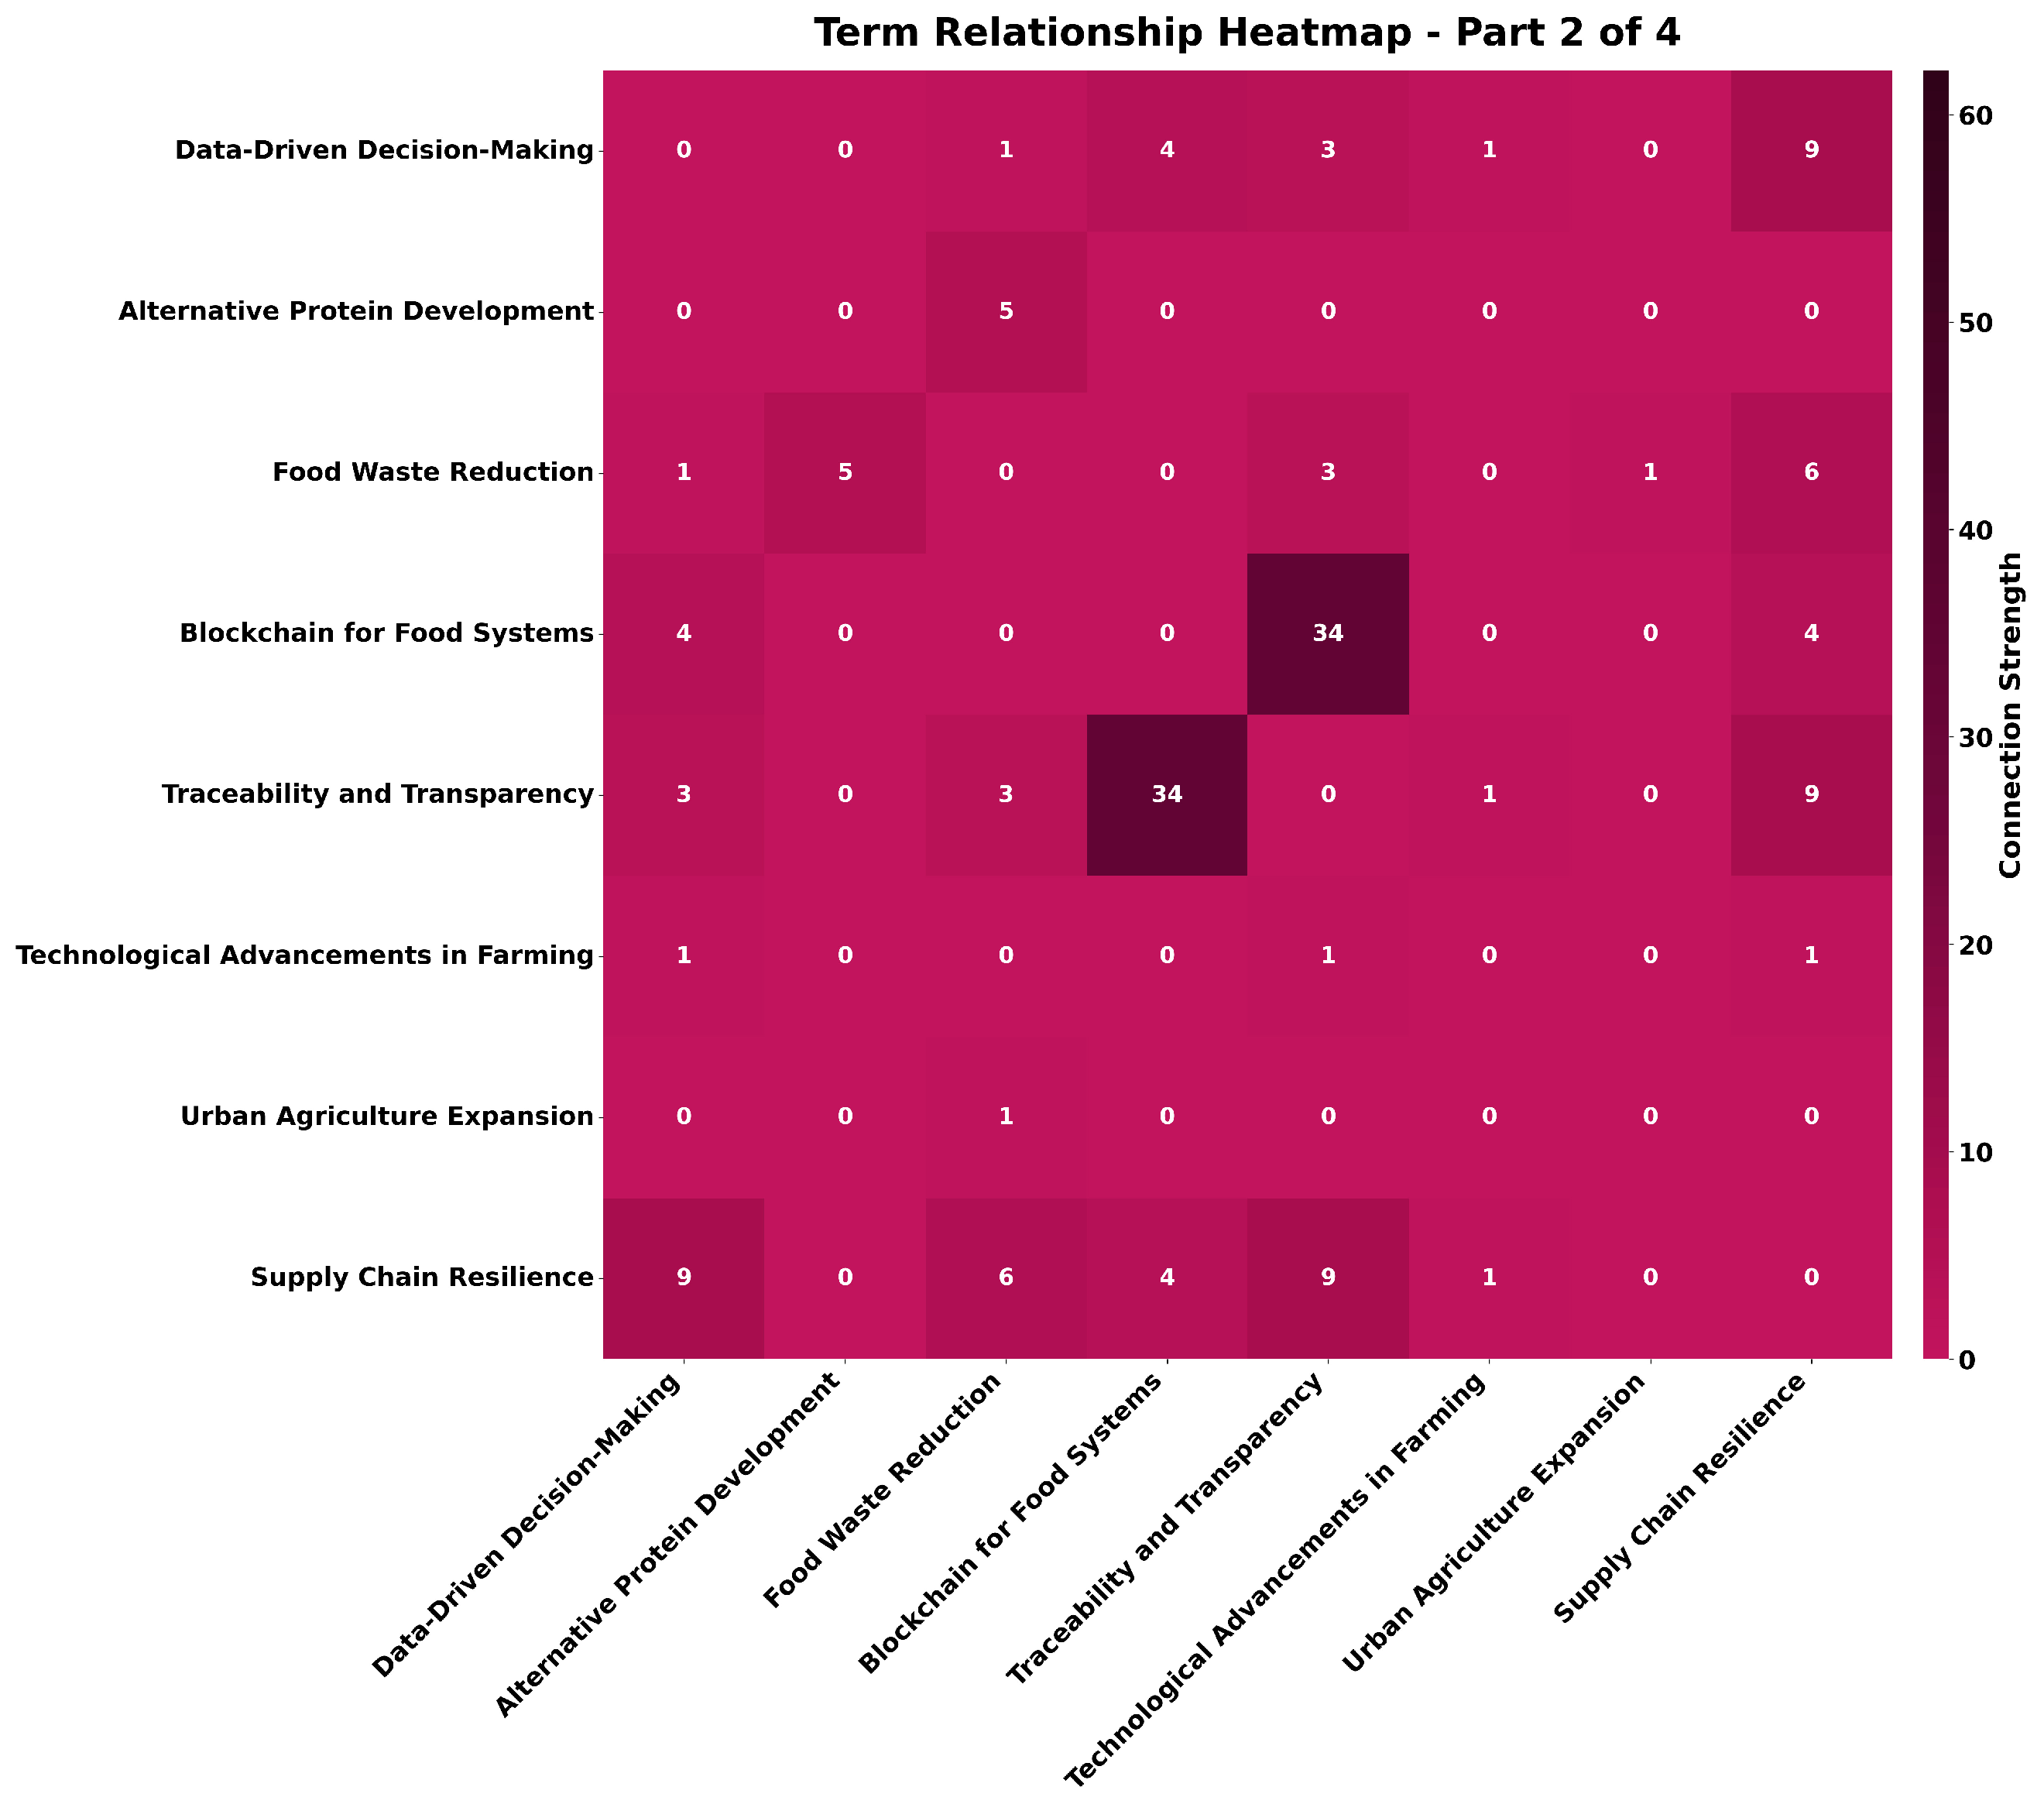
3.4.2. Cross-Reference Matrix Generation

Following the identification of 30 key trends, our platform automatically generates a cross-reference search matrix using the Directory of Open Access Journals (DOAJ) database. This cross-referencing methodology employs pairwise trend analysis, systematically combining trends to formulate comprehensive search queries. For example, when examining trends such as “Artificial Intelligence,” “Digitalization,” and “Smart Agriculture,” the system constructs paired searches using Boolean AND operators (e.g., “Artificial Intelligence AND Digitalization”). This systematic approach facilitates a thorough investigation of trend interconnections within the academic literature.
The resulting search matrix quantifies trend co-occurrences, providing a metric for evaluating the relative significance of relationships between trends. This process yields a comprehensive network of interconnections among the identified trends, which we visualize in subsequent figures. The matrix captures the frequency of co-occurrence between trend pairs, offering insights into the strength and relevance of relationships among various technological and methodological developments in agriculture. Figure 7 presents a sample of the heatmap visualization; see Appendix B for more details. Regarding the high values observed in the matrices, these reflect the actual frequency of co-occurrence of these terms in the DOAJ database at the time of data collection. These values are not anomalies but rather indicate either: (1) genuine strong thematic connections between these concepts in the literature indexed by DOAJ, or (2) potential indexing patterns or keyword clustering within the repository that amplify certain term combinations.
To enhance interpretability, we also represent the relationships between terms (nodes) as edges in a network visualization (Figure 8). This representation makes the relevance of each term and its connections explicit. The network visualization emerges directly from our search results and language model processing, representing the actual content relationships found in the analyzed documents. It reveals clear organizational patterns, with certain high-centrality terms emerging at the core of the network, indicating their pivotal role in connecting multiple agricultural technology domains. The network diagram displays relationships between trends through connecting lines of varying thickness, where edge thickness is calculated using raw co-occurrence data according to the formula: width = 0.5 + 4 × (co-occurrence_frequency/max_co-occurrence), with edge_data[‘weight’] representing the absolute frequency of co-occurrence between trend pairs in the search results. Node colors and sizes are determined by total connection strength, calculated as the sum of all co-occurrence frequencies for each trend (total_connections = Σ co-occurrences), with darker and larger nodes indicating trends with higher aggregate co-occurrence frequencies across all relationships. This approach explicitly uses raw co-occurrence data rather than cosine similarity calculations, ensuring that edge thickness directly reflects the empirical frequency of joint appearances in the analyzed corpus allowing us to extract, quantify, and visually represent the relationships between the most salient terms in the agricultural technology domain.

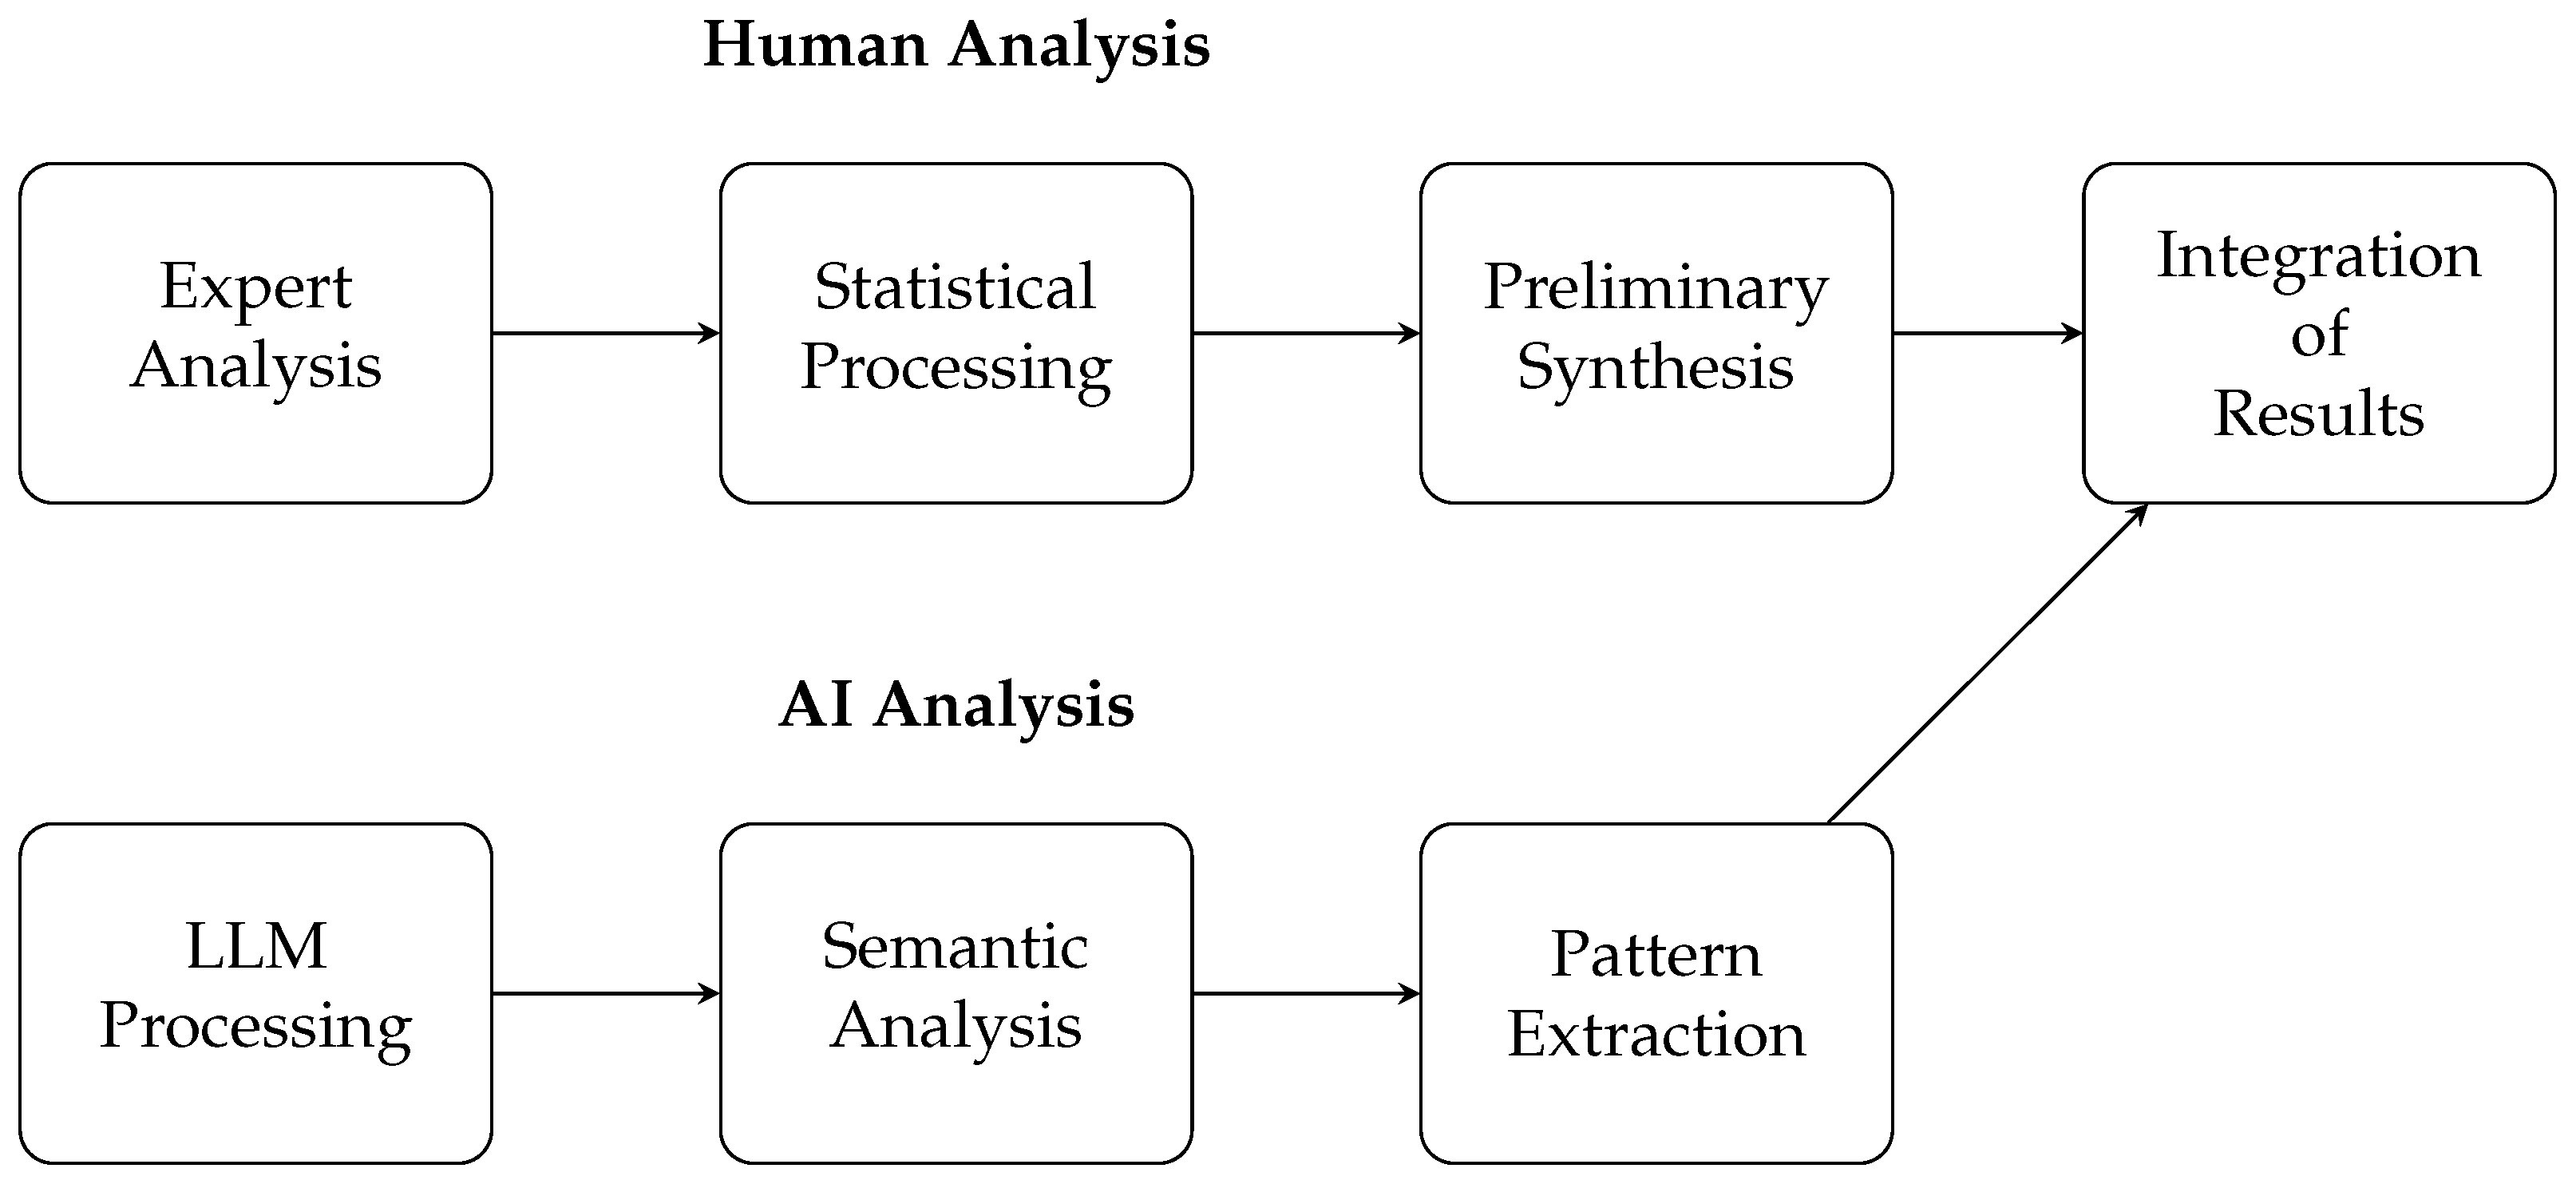
3.5. Integrated Analysis Framework: The Expert Validation

The integration of results from Voyant Tools, NotebookLM, and the Defly Compass platform provides experts with a robust, data-driven decision-making framework. This comprehensive analytical approach encompasses frequentist analysis techniques, advanced semantic processing through state-of-the-art language models, and quantitative relationship analysis using specialized databases including ArXiv, La Referencia, DOAJ, Google Scholar, Riunet, and Dialnet. We are currently expanding our database integration framework to incorporate additional scholarly repositories and specialized information sources to enhance analytical breadth and precision. The combination of these methodological approaches enables sophisticated pattern recognition and trend analysis while maintaining methodological rigor through multiple analytical perspectives.
The validation framework inherent in our integrated approach operates on the principle that independent analytical methods provide mutual validation through expert assessment of inter-method coherence. Each analytical component (Voyant Tools’ statistical analysis, NotebookLM’s semantic interpretation, and Defly Compass’s database-driven relationship mapping) acts as an independent validator for the others. When experts observe consistent trend identification and relationship patterns across these methodologically distinct approaches, it provides compelling evidence for the robustness of the findings.
As we have already outlined, it is important to emphasize that expert validation cannot rely solely on a quantitative approach, as this has already been addressed through the three procedures outlined earlier. At this stage, an interpretation of the information (independent of specific index values) is necessary. The analyst, ideally an expert in the subject area, should compare the insights derived from the frequency analysis using Voyant Tools, the qualitative content from NotebookLM, and the numerical data generated by the Defly Compass platform. The goal is to determine whether these different sources of information align and, if they do, to construct a unified interpretation that integrates both qualitative and quantitative findings. The analyst should remain objective throughout this comparison and, if knowledgeable in the field, offer a well-contextualized, balanced interpretation free from personal biases.
Therefore, to determine whether the results are coherent and mutually compatible, the analyst must have a solid understanding of the subject matter and its context. This contextual knowledge is essential for evaluating whether the outputs from the different tools converge meaningfully and can be integrated into a consistent overall interpretation. When such convergence is identified, it becomes possible to synthesize the findings into a unified analytical narrative that reflects both the richness of the qualitative insights and the precision of the quantitative evidence. The primary procedure relies on the independent analysis carried out by a single expert. However, more advanced methods may be employed if the research context suggests that additional rigor is necessary to ensure robust conclusions. In such cases, a group of qualified experts can perform the analysis individually and subsequently apply a consensus-based evaluation method to assess the various aspects of the results. In a second step, these conclusions (whether numerical or qualitative) can be compared to determine the extent to which they point toward a unified interpretation.
This validation-through-coherence approach is particularly powerful because it does not rely on external ground truth datasets, which are often unavailable in emerging trend analysis, but instead leverages the convergence of independent analytical perspectives as a reliability indicator. The expert evaluation process specifically focuses on assessing where the three methods align in their outputs and understanding why certain discrepancies might occur, using these patterns to strengthen confidence in validated trends while identifying areas requiring further investigation.
This integrated methodology provides researchers with a comprehensive toolkit for analyzing technological developments across diverse domains, combining statistical analysis, semantic processing, and relationship mapping within a unified analytical framework. The resulting insights enable informed decision making based on a robust, multi-dimensional analysis of trends and their interrelationships, as demonstrated through our successful application across agriculture, education, and public health sectors.

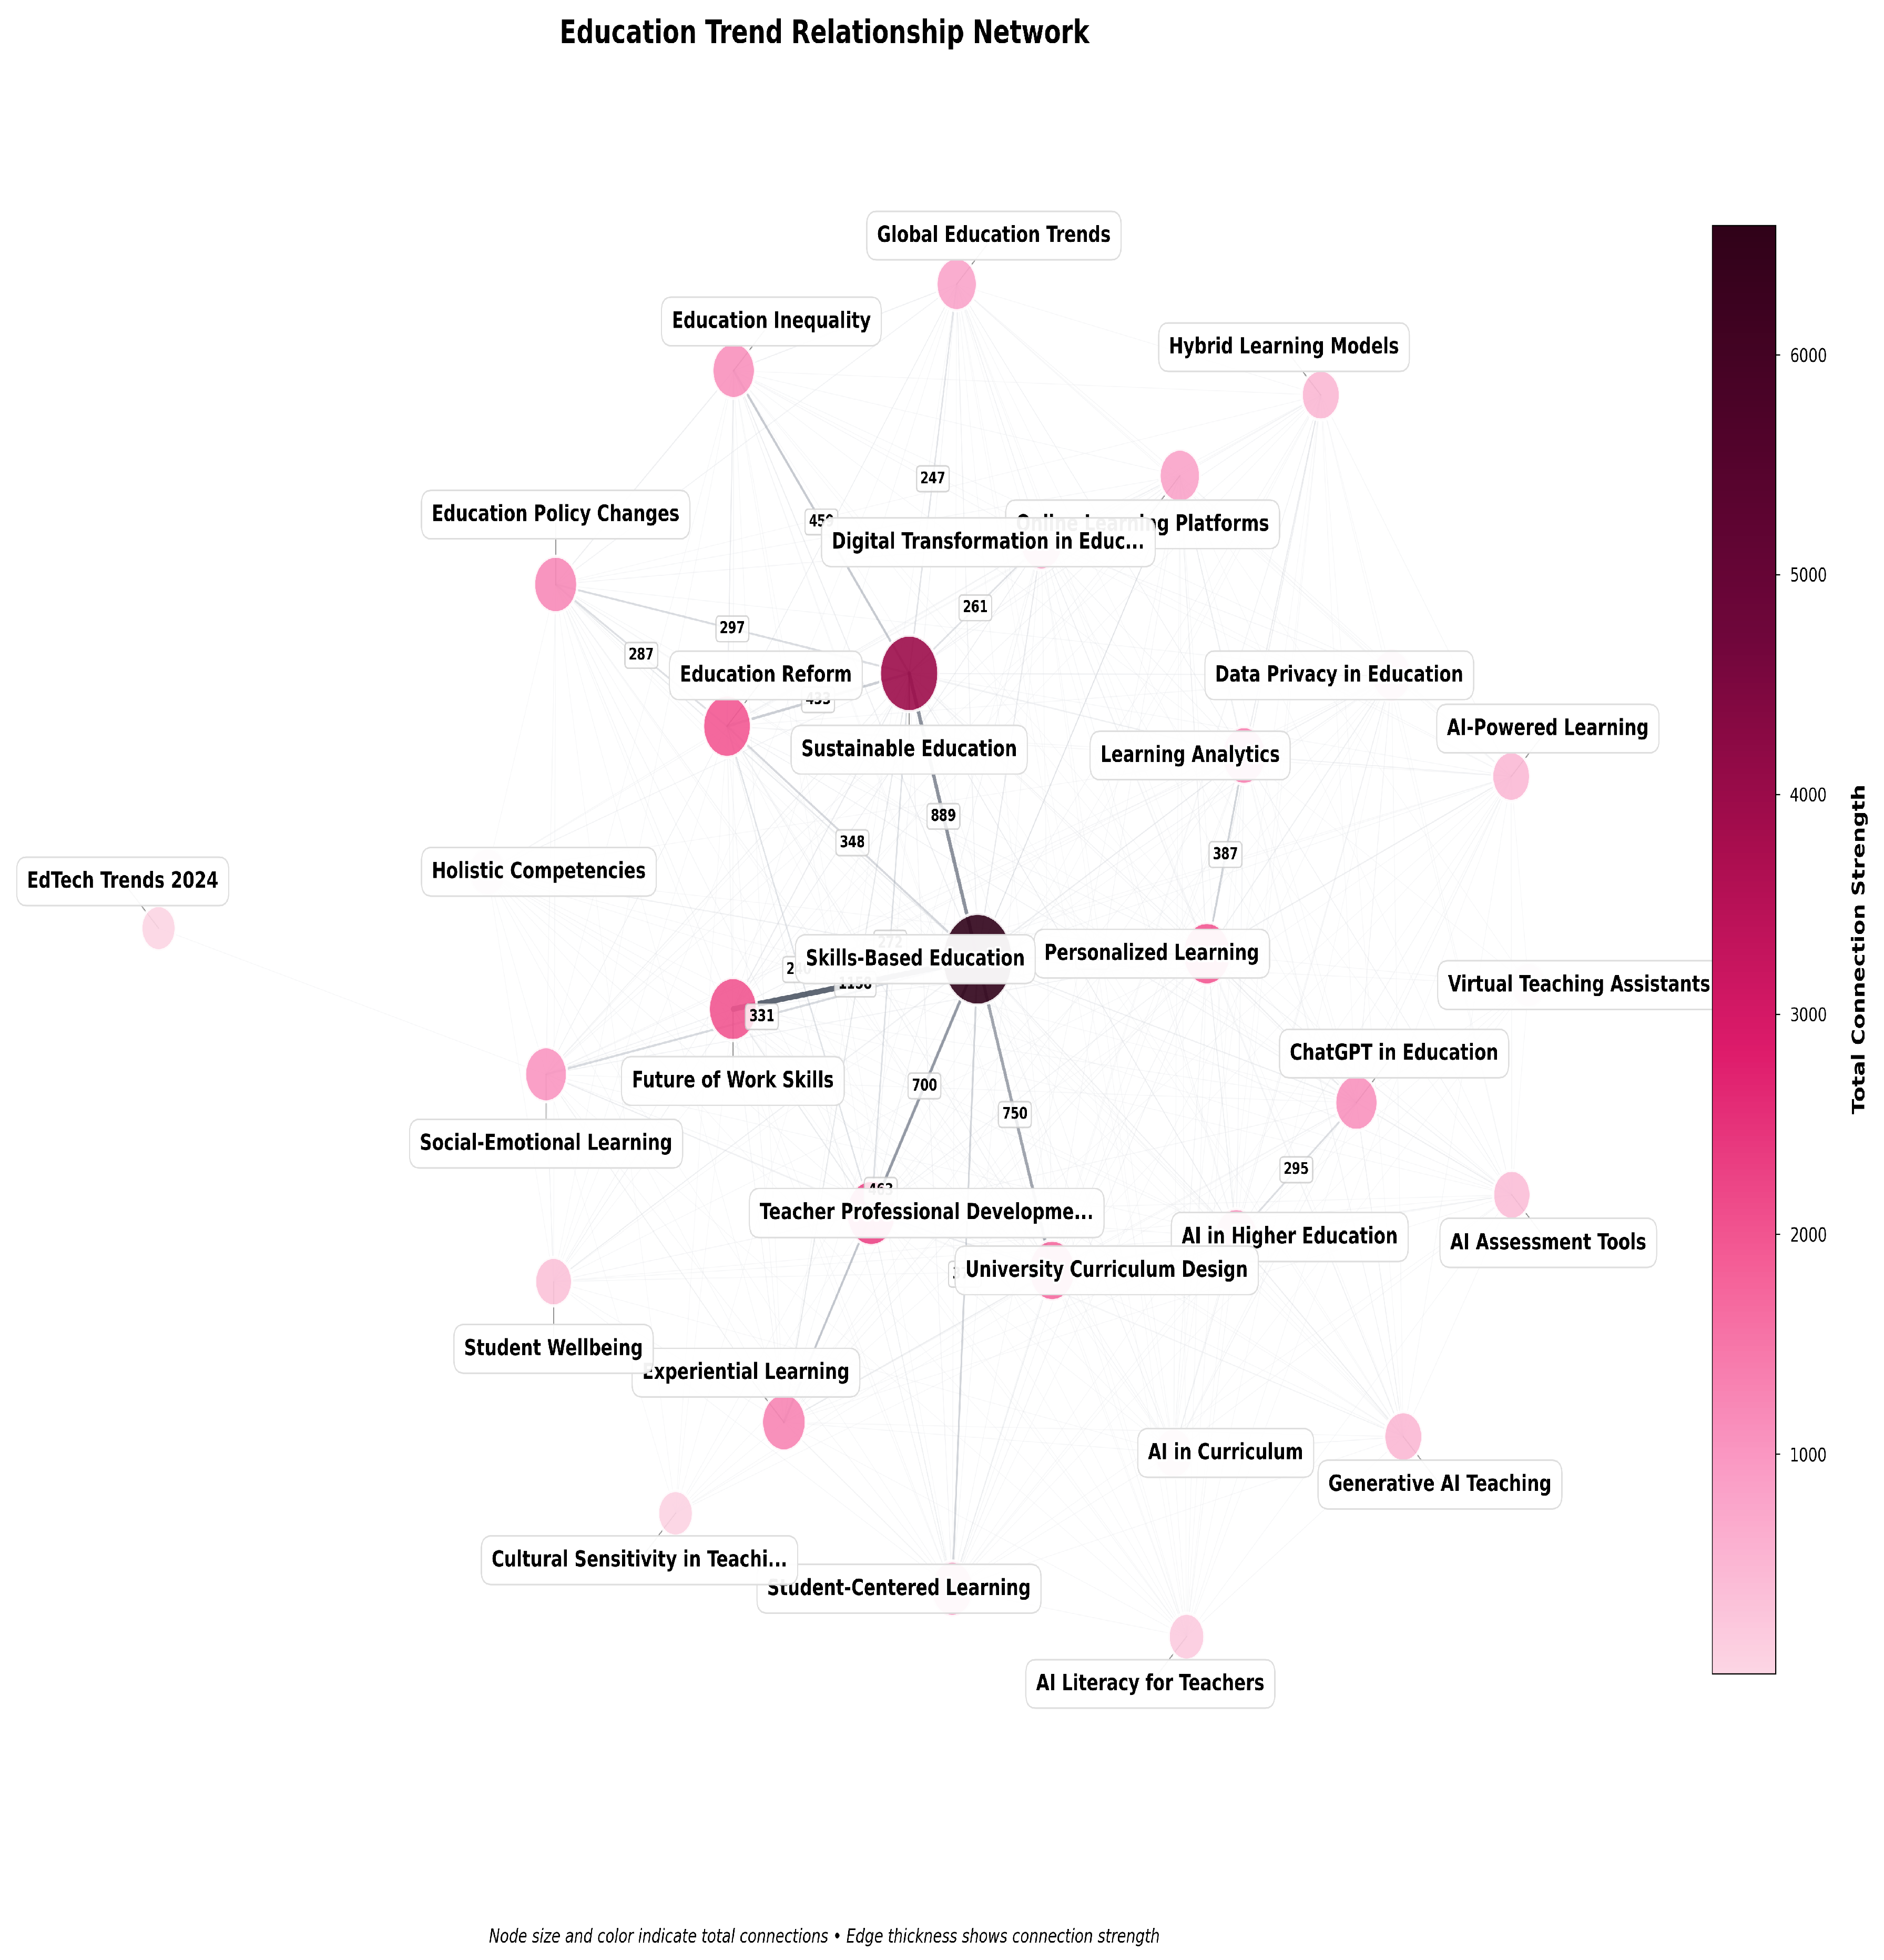
3.6. Education Case Study: Digital Transformation in Learning Systems

To validate the methodology’s applicability across distinct domains, we conducted a parallel analysis focused on educational technology and pedagogical innovation. The educational sector presents unique analytical challenges, including diverse stakeholder perspectives (students, educators, administrators, policymakers), rapid technological adoption cycles, and the intersection of pedagogical theory with technological implementation. Our curated collection of 10 documents encompasses peer-reviewed educational research, institutional reports from leading universities, policy frameworks from educational organizations, and emerging practice analyses from educational technology conferences.
The document selection process prioritized sources addressing digital transformation in education, personalized learning technologies, artificial intelligence applications in pedagogy, remote learning infrastructure, and assessment innovation.

3.6.1. Preliminary Educational Trends Analysis

Initial processing through Voyant Tools revealed distinctive patterns in educational discourse compared to agricultural terminology. Word cloud visualization highlighted central concepts including “education,” “countries,” “learning,” “data,” and “level.”
NotebookLM analysis revealed four primary trend clusters: Personalization and Adaptive Systems—encompassing AI-driven learning paths, adaptive testing, and individualized content delivery; Digital Infrastructure and Access—including connectivity requirements, device availability, and digital equity initiatives; Assessment and Analytics—covering competency-based evaluation, learning analytics, and performance measurement systems; and Pedagogical Innovation—spanning collaborative learning platforms, immersive technologies, and hybrid teaching methodologies.
Detailed NotebookLM processing of the educational corpus generated comprehensive trend analysis based on 10 selected sources addressing AI integration and sustainable education development (EDS) in higher education. Through bibliographic review, the analysis highlighted AI benefits and limitations in higher education, emphasizing personalization potential for learning and administrative management, while addressing ethical challenges, privacy concerns, and teacher training needs. Environmental literacy and active methodologies in EDS were identified as crucial for developing critical and committed citizens.

3.6.2. Educational Relationship Mapping

Defly Compass analysis generated 30 key educational trends, subsequently processed through cross-reference matrices using DOAJ. The relationship quantification revealed strong interconnections between personalized learning systems and data analytics, adaptive assessment and artificial intelligence, and digital equity and infrastructure development, see Figure 9.
Network visualization displayed centralized nodes around “skill-based learning,” “sustainable education,” and “AI in education,” with connecting pathways indicating the interdependent nature of educational technology implementation. Peripheral trends included emerging technologies such as digital transformation in education, hybrid learning, and the future of work skills, suggesting potential growth areas for educational innovation.

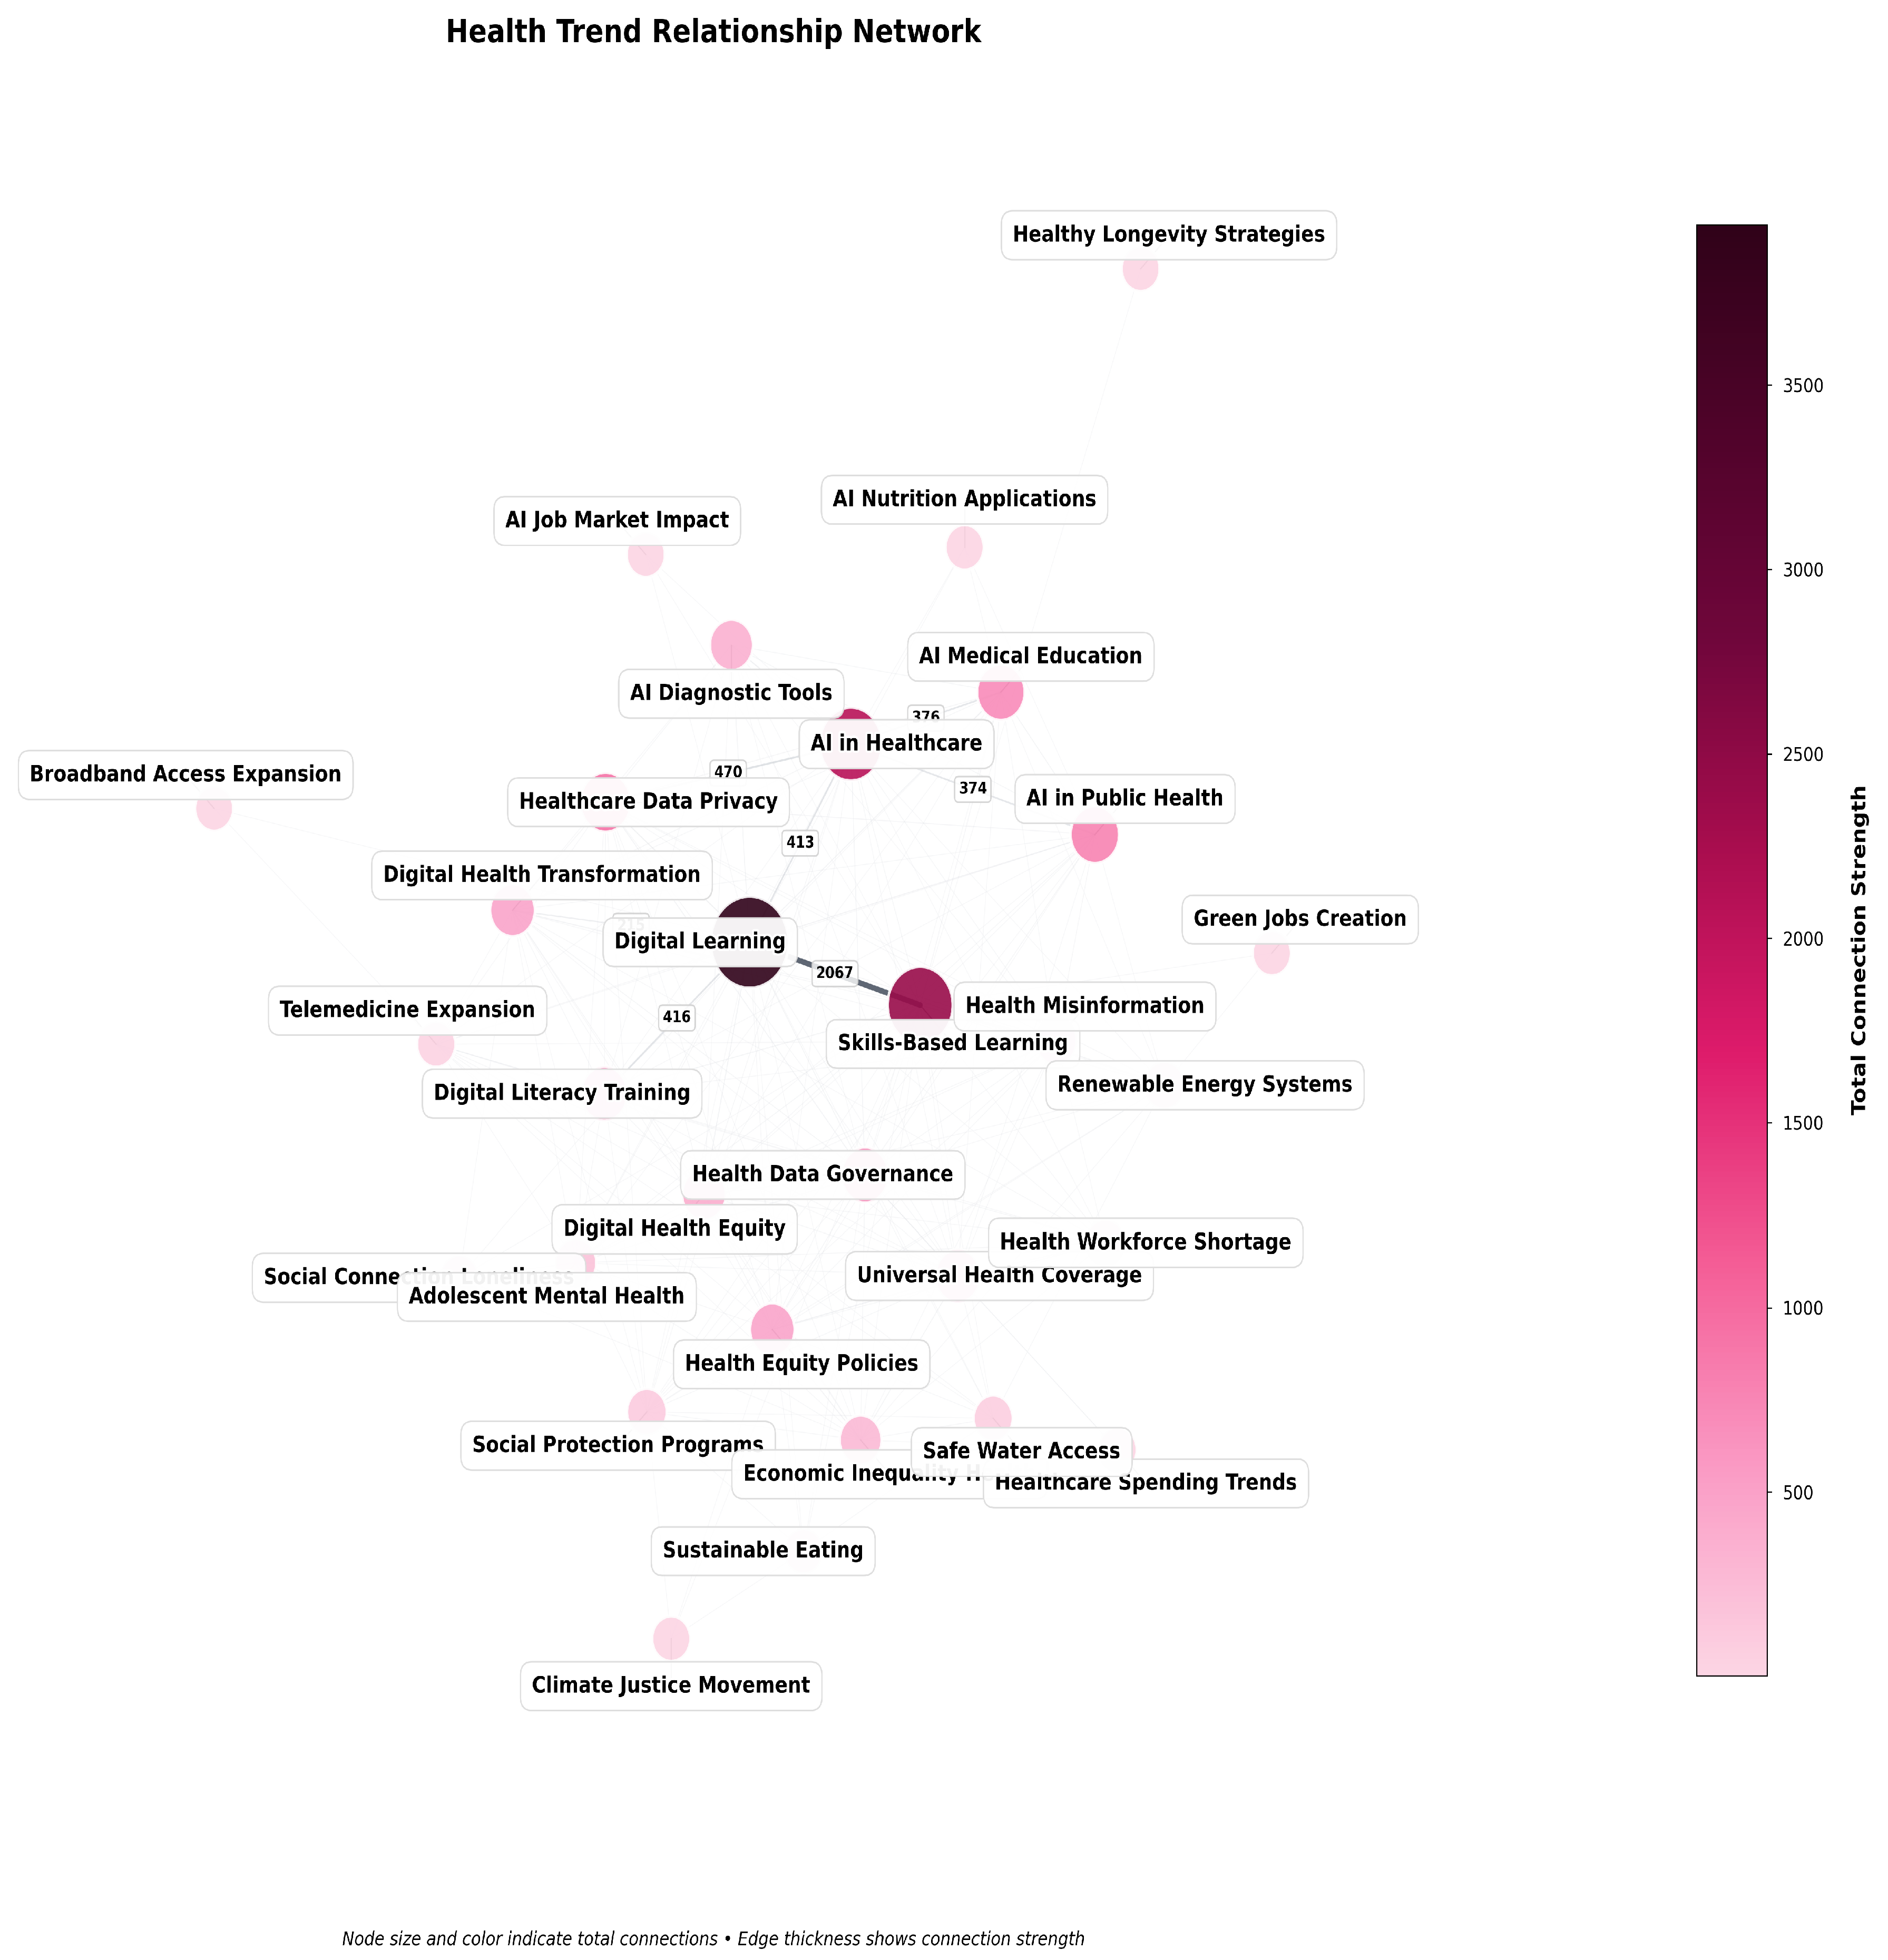
3.7. Public Health Case Study: Data-Driven Health Systems’ Transformation

The public health domain analysis represents our third validation case, offering insights into health systems’ modernization, data governance, and digital learning. Public health presents analytical complexities including multi-scale interventions (individual, community, population), interdisciplinary collaboration requirements, and the integration of technological solutions with established health practices. Our document collection comprised 10 sources including epidemiological studies, health policy analyses, digital health implementation reports, and population health management frameworks.
Document selection emphasized sources addressing digital health ecosystems, population health analytics, telemedicine infrastructure, health equity initiatives, and evidence-based public health interventions.

3.7.1. Public Health Trend Identification

Voyant Tools processing revealed public health discourse characterized by terms such as “public,” “social,” and “data.” The semantic analysis positioned “health” as the central semantic anchor, with robust connections to technology integration and community health.
NotebookLM trend identification uncovered three primary pattern groupings: (1) Digital Health—encompassing electronic health records, interoperability standards, and health information exchanges; (2) Population Health—including epidemiological modeling, health outcome prediction, and risk stratification systems; and (3) Community Health and Equity—covering social determinants’ integration, health disparities’ measurement, and community-based interventions.

3.7.2. Public Health Network Analysis

The 30 extracted public health trends underwent cross-reference analysis using DOAJ databases. Relationship quantification demonstrated strong associations between health surveillance systems and predictive analytics, community health programs and digital equity, and preventive care and personalized medicine.
Network visualization revealed centralized positioning of “digital learning,” “AI in healthcare,” and “community wellness” as primary connection hubs. The analysis identified emerging peripheral trends including social determinants’ integration, health data governance, and health equity policies, indicating evolving directions in public health system development, see Figure 10.

3.8. Cross-Domain Pattern Analysis

Comparative analysis across agriculture, education, and public health domains revealed several cross-cutting trends that transcend sector boundaries: Digital Infrastructure Development appears as a foundational requirement across all three domains, with similar challenges regarding connectivity, accessibility, and equity. Data Analytics and AI Integration emerges as a universal trend, though with domain-specific applications ranging from precision agriculture to personalized learning and to population health management. Equity and Accessibility concerns manifest consistently, whether addressing rural agricultural communities, educational digital divides, or health disparities in underserved populations.
Domain-specific patterns also emerged clearly: agriculture demonstrated a strong emphasis on environmental sustainability and economic optimization, education focused heavily on pedagogical innovation and student engagement, while public health prioritized system resilience and community-centered approaches. These distinctions validate the methodology’s sensitivity to domain-specific characteristics while maintaining analytical consistency across diverse contexts.
The cross-domain validation demonstrates that our methodology successfully adapts to different analytical contexts while maintaining methodological rigor. Each domain produced coherent trend networks with meaningful relationships, suggesting the approach’s robustness across diverse knowledge areas. The identification of both universal and domain-specific patterns provides evidence for the methodology’s balanced sensitivity to general technological and social forces while preserving sector-specific analytical precision.

4. Results

Let us remind the reader that the goal of this research is to present a novel methodology that leverages cutting-edge advances in artificial intelligence to enhance the work of trend and foresight researchers. A visualization of the results that we obtain can be seen in Figure 8. After the results are represented in this fashion, experts should review and validate the identified trends and relationships. Our approach provides a powerful analytical tool capable of processing large volumes of text from user-uploaded documents to extract trends, and then quantifying relationships between these emerging trends through semantic projections based on search results from engines like DOAJ. While we primarily utilized DOAJ as the search engine to quantify relationships between extracted trends in this demonstration, it is important to note that our methodology is independent of any specific search engine. We are actively developing integrations with multiple other search engines to expand its applicability. It should be acknowledged that DOAJ may not represent the optimal search engine for agricultural, education, and health analysis specifically; its selection was based on its accessibility and convenience for illustrative purposes rather than domain-specific optimization.
The flexibility of our methodology extends beyond search engine selection to encompass virtually any research domain or topic of interest. Its effectiveness depends on the quality and representativeness of both the document corpus analyzed and the search engine employed for relationship quantification. The AI-enhanced system processed text from user-uploaded documents to extract trends, and then quantified relationships between these trends by searching for them in the DOAJ database. This approach revealed distinctive patterns and relationships that would be challenging to identify through conventional methods alone.
From a technical point of view, the methodology demonstrated a significant reduction in initial processing time compared to traditional foresight approaches while maintaining strong concordance with expert assessments in trend identification. This efficiency gain allowed for the analysis of a comprehensive set of scholarly articles across numerous technological domains. Expert validation confirmed the reliability of the computational components, with validators noting particular strengths in the identification of emerging cross-disciplinary connections.
The network visualization component of our methodology effectively transforms complex relationship data into actionable insights. Our system generates a visual network where node size and color intensity represent the total connection strength of each trend, connection lines display the relationship strength between pairs of trends, and numerical values on connections quantify the exact strength of each relationship.
This visualization approach allows researchers to quickly identify central trends (represented by larger, darker nodes), strong relationships between trends (shown by thicker connecting lines), and emerging or peripheral topics (appearing as smaller, lighter nodes).
The methodology demonstrated a particular strength in recognizing relationships between traditionally separate domains. Our pairwise trend analysis generated a cross-reference matrix that revealed several previously underexplored research intersections, visually represented through the network diagram.
Our results address a fundamental challenge in contemporary foresight research by successfully balancing computational processing capacity with analytical depth. The methodology maintains the nuanced interpretation capabilities of expert analysis while significantly expanding the scope of processed information. This balance enables comprehensive trend mapping while preserving context-specific insights that purely computational approaches might overlook.
The findings demonstrate that hybrid methodologies can effectively bridge the gap between big data analytics and domain expertise in foresight research. By validating computational outputs through expert assessment, we establish a more robust foundation for strategic planning and technology adoption across various domains. Our validation approach through expert evaluation of coherence between independent analytical methods represents a significant methodological contribution to foresight research. Rather than relying on single-method validation or external benchmarking, our framework demonstrates that when three methodologically independent approaches (statistical frequency analysis, advanced language model processing, and semantic projection mapping) converge on similar findings, the resulting trends exhibit high reliability. This convergence-based validation is particularly valuable in emerging trend analysis where ground truth data is inherently unavailable, providing researchers with a systematic approach to assess confidence levels in identified trends through multi-method coherence analysis. The expert evaluation process serves as the critical validation mechanism, leveraging human expertise to assess not just the individual outputs of each method but, more importantly, the meaningful patterns of agreement and divergence across methods that inform reliability assessments. The methodology’s adaptability suggests applications across diverse sectors where understanding emerging trend relationships is crucial for strategic planning and innovation management, as validated through our comprehensive multi-domain analysis across agriculture, education, and public health.

5. Conclusions

This research introduces a methodological innovation in trend analysis through the systematic integration of human expertise with AI-powered computational processing capabilities. Our framework demonstrates that the synthesis of semi-automated trend extraction from user-uploaded documents with relationship quantification through search engines like DOAJ enables more comprehensive analytical capabilities, particularly suited to the complexity of contemporary technological and social environments.
A key innovation of our methodology lies in its validation approach through expert evaluation of coherence between three independent analytical methods. The strength of this validation framework emerges from the fundamental independence of NotebookLM’s semantic processing, Voyant Tools’ statistical analysis, and Defly Compass’s database-driven relationship mapping. Since each method operates through distinct computational paradigms and data processing approaches, convergence in their outputs provides compelling evidence for trend validity. This cross-validation and triangulation approach addresses a critical challenge in foresight research where external validation datasets are typically unavailable for emerging trends. Expert assessment of inter-method coherence serves as our primary validation mechanism, evaluating not just individual method outputs but the meaningful patterns of agreement that indicate robust trend identification.
The methodology’s effectiveness is evidenced by its capacity to process and analyze user-submitted text while maintaining analytical depth and precision in relationship mapping. The visualization of these relationships through network diagrams with quantifiable connection strengths provides researchers with immediate insights into central trends, strong relationships, and emerging patterns. This integration of quantitative metrics with qualitative expert assessment provides a robust foundation for trend identification and analysis, ensuring both scientific rigor and practical relevance. Our dual approach enables the detection of subtle pattern variations and cross-disciplinary connections that would likely escape traditional analytical methods.
A key strength of the proposed methodology lies in its search engine-agnostic design and adaptability across different analytical contexts and data volumes. The modular architecture allows for customization to specific research requirements while maintaining methodological consistency. This flexibility, combined with the system’s processing capabilities, enables comprehensive trend analysis across various domains, as demonstrated through our multi-domain validation across agriculture, education, and public health sectors, adapting to different scales of investigation and research priorities.
The methodology’s emphasis on visual representation of trend relationships and result verification represents a significant contribution to the field of foresight research. Each analytical step—from trend extraction to relationship quantification and visualization—can be systematically tracked and reproduced, providing essential validation capabilities for scientific investigation. This transparency enhances the methodology’s value for strategic decision making, offering decision makers clear insight into the analytical process and its outcomes through intuitive network visualizations that highlight central nodes, connection strengths, and natural clustering of related trends.
Furthermore, the successful integration of artificial intelligence tools for trend extraction with expert analysis and search engine-based relationship quantification demonstrates the potential for advancing foresight research through hybrid approaches. The methodology effectively addresses the growing complexity of trend analysis in the digital age, providing a systematic framework for processing increasing volumes of information while maintaining analytical rigor and delivering actionable insights through clear visual representations. The validation-through-coherence principle underlying our approach represents a significant advancement in computational foresight methodology, offering researchers a systematic method to assess reliability in emerging trend analysis without requiring external ground truth datasets. This methodological contribution extends beyond trend analysis to potentially benefit other domains where multiple independent computational approaches can be leveraged for mutual validation through expert coherence assessment.
The multi-domain validation across agriculture, education, and public health sectors reveals both universal trends and domain-specific patterns that validate the methodology’s comprehensive applicability. Cross-cutting trends such as digital infrastructure development, data analytics integration, and equity considerations emerged consistently across all three domains, while sector-specific emphases (environmental sustainability in agriculture, pedagogical innovation in education, and system resilience in public health) demonstrate the methodology’s sensitivity to domain-specific characteristics. This dual capability—identifying universal patterns while preserving domain specificity—represents a significant advancement in cross-disciplinary trend analysis.
The results obtained suggest several promising directions for futures research, particularly in the further development of analytical tools, search engine integrations, and validation mechanisms. The methodology’s demonstrated success in combining computational trend extraction, search-based relationship quantification, and human expertise indicates potential applications beyond trend analysis, possibly extending to other areas of foresight research, innovation management, and strategic planning across diverse fields.
The methodology thus represents not only a technical advancement but also a conceptual bridge between traditional foresight approaches and contemporary analytical capabilities. Its successful implementation demonstrates the potential for enhancing our understanding of emerging trends and their interrelationships while maintaining the critical role of human expertise in their interpretation and analysis. By providing researchers with a powerful tool for extracting trends from documents and quantifying their relationships through semantic projections, we enable more informed strategic decision making across domains where understanding emerging trends and their connections is crucial for future planning and innovation.

Author Contributions

Conceptualization, M.L.B. and A.F.S.; methodology, E.A.S.P.; software, C.A.R.P.; validation, C.A.R.P.; formal analysis, C.A.R.P. and E.A.S.P.; investigation, M.L.B. and A.F.S.; data curation, A.F.S.; writing—original draft preparation, M.L.B. and C.A.R.P.; writing—review and editing, E.A.S.P.; visualization, C.A.R.P.; supervision, A.F.S. All authors have read and agreed to the published version of the manuscript.

Funding

This research was funded by Generalitat Valenciana (Spain), grant number PROMETEO 2024 CIPROM/2023/32.

Data Availability Statement

The original contributions presented in this study are included in the article. Further inquiries can be directed to the corresponding author.

Acknowledgments

We would like to acknowledge the support of Instituto Universitario de Matemática Pura y Aplicada and Universitat Politècnica de València.

Conflicts of Interest

The authors declare no conflicts of interest.

Appendix A. Documents Used in the Analysis

Appendix A.1. Agriculture Domain Documents

The following list contains the 10 documents selected for agricultural trend analysis:
  • AgriBusiness Global. (2024). 10 macrotendencias que marcarán la agricultura europea en 2024.
  • Vink, N. (2018–2021). African agricultural development: How are we contributing? IAAE and Professor Emeritus, Stellenbosch University, South Africa.
  • European Union. (2023). EU Agricultural Outlook 2023–2035. Luxembourg: Publications Office of the European Union. Manuscript completed in December 2023 (modification 29.01.24: p18, title of graph 1.22).
  • European Union. (2024). EU Agricultural Outlook 2024–2035: Executive Summary. Luxembourg: Publications Office of the European Union. Manuscript completed in December 2024.
  • FAO. (2023). El futuro de la alimentación y la agricultura: factores y desencadenantes de la transformación—Versión resumida. Roma. https://doi.org/10.4060/cc1024es.
  • FAO. (2024). The State of Food and Agriculture 2024—Value-driven transformation of agrifood systems. Rome. https://doi.org/10.4060/cd2616en.
  • Avşar, E., & Mowla, M. N. (2024). Wireless communication protocols in smart agriculture: A review on applications, challenges and future trends. Dokuz Eylül University, Computer Engineering Department, Turkey and Çukurova University, Electrical and Electronics Engineering Department, Turkey.
  • Warrik, J., & Borthakur, S. (2024). Granjas del futuro: ¿Cómo puede la IA acelerar la agricultura regenerativa? World Economic Forum. https://www.weforum.org/stories/2024/09/farms-ai-accelerate-regenerative-agriculture/ (accessed on 9 June 2025).
  • Agmatix. (2025). Las 5 principales tendencias de tecnología agrícola para 2025: ¿Qué sigue para la agricultura regenerativa? https://www.agmatix.com/blog/top-5-agtech-trends-for-2025-whats-next-for-regenerative-agriculture/ (accessed on 9 June 2025).
  • DLL Group. (2024). Las tendencias en 2024 siguen conectando la agricultura y la industria alimentaria. https://www.dllgroup.com/en/blogs/blogsoverview/Trends-in-2024-continue-to-connect-the-agriculture-and-the-food-industry (accessed on 9 June 2025).

Appendix A.2. Education Domain Documents

The following list contains the documents selected for educational technology trend analysis:
  • Ahmad, S., Umirzakova, S., Mujtaba, G., Amin, M. S., & Whangbo, T. (2023). Education 5.0: Requirements, Enabling Technologies, and Future Directions. arXiv preprint arXiv:2307.15846. https://arxiv.org/abs/2307.15846 (accessed on 9 June 2025).
  • Denny, P., Gulwani, S., Heffernan, N. T., Käser, T., Moore, S., Rafferty, A. N., & Singla, A. (2024). Generative AI for Education (GAIED): Advances, Opportunities, and Challenges. arXiv preprint arXiv:2402.01580. https://arxiv.org/abs/2402.01580 (accessed on 9 June 2025).
  • Costa, J., Alscher, P., & Thums, K. (2024). Global competences and education for sustainable development. A bibliometric analysis to situate the OECD global competences in the scientific discourse. Zeitschrift für Erziehungswissenschaft. https://doi.org/10.1007/s11618-024-01220-z.
  • Eaton, S. E. (2025). Global Trends in Education: Artificial Intelligence, Postplagiarism, and Future-focused Learning for 2025 and Beyond—2024–2025 Werklund Distinguished Research Lecture. International Journal of Educational Integrity, 21, 12. https://doi.org/10.1007/s40979-025-00187-6.
  • OECD. (2024). Future of Education and Skills 2030/2040. Paris: OECD Publishing.
  • OECD. (2024). Education at a Glance 2024: OECD Indicators. Paris: OECD Publishing.
  • Chan, C. K. Y., & Tsi, L. H. Y. (2023). The AI Revolution in Education: Will AI Replace or Assist Teachers in Higher Education? arXiv preprint arXiv:2305.01185. https://arxiv.org/abs/2305.01185 (accessed on 9 June 2025).
  • Marshall, S., Blaj-Ward, L., Dreamson, N., Nyanjom, J., & Bertuol, M. T. (2024). The reshaping of higher education: technological impacts, pedagogical change, and future projections. Higher Education Research & Development, 43(3), 521–541. https://doi.org/10.1080/07294360.2024.2329393.
  • UNESCO. (2024). Global Education Monitoring Report 2024/5: Leadership in Education—Lead for Learning. Paris: UNESCO Publishing.
  • UNESCO. (2024). UNESCO World Education Statistics 2024. Paris: UNESCO Publishing.

Appendix A.3. Public Health Domain Documents

The following list contains the documents selected for public health technology trend analysis:
  • Panteli, D., Adib, K., Buttigieg, S., Goiana-da-Silva, F., Ladewig, K., Azzopardi-Muscat, N., Figueras, J., Novillo-Ortiz, D., & McKee, M. (2025). Artificial intelligence in public health: promises, challenges, and an agenda for policy makers and public health institutions. The Lancet Public Health, 10(5), e428–e432. https://doi.org/10.1016/S2468-2667(25)00036-2.
  • Kitsios, F., Kamariotou, M., Syngelakis, A. I., & Talias, M. A. (2023). Recent Advances of Artificial Intelligence in Healthcare: A Systematic Literature Review. Applied Sciences, 13(13), 7479. https://doi.org/10.3390/app13137479.
  • Olawade, D. B., Wada, O. J., David-Olawade, A. C., Kunonga, E., Abaire, O., & Ling, J. (2023). Using artificial intelligence to improve public health: a narrative review. Frontiers in Public Health, 11, 1196397. https://doi.org/10.3389/fpubh.2023.1196397.
  • Ong, J. C. L., Seng, B. J. J., Law, J. Z. F., Low, L. L., Kwa, A. L. H., Giacomini, K. M., & Ting, D. S. W. (2024). Artificial intelligence, ChatGPT, and other large language models for social determinants of health: Current state and future directions. Cell Reports Medicine, 5(1), 101356. https://doi.org/10.1016/j.xcrm.2023.101356.
  • Institute for Health Metrics and Evaluation. (2021). Global Burden of Disease 2021: Findings from the GBD 2021 Study. University of Washington, Seattle, WA.
  • OECD. (2024). Health at a Glance: Europe 2024—State of Health in the EU Cycle. Paris: OECD Publishing.
  • Papageorgiou, L., Eleni, P., Raftopoulou, S., Mantaiou, M., Megalooikonomou, V., & Vlachakis, D. (2022). Applications of Artificial Intelligence, Machine Learning, and Deep Learning in Nutrition: A Systematic Review. Computer Methods and Programs in Biomedicine, 218, 106730.
  • World Health Organization. (2024). COP29 Special Report on Climate Change and Health: Health is the Argument for Climate Action. Geneva: WHO Press.
  • World Health Organization. (2024). World Report on Social Determinants of Health Equity. Geneva: WHO Press.
  • World Health Organization. (2025). World Health Statistics 2025: Monitoring Health for the SDGs, Sustainable Development Goals. Geneva: WHO Press.

Appendix B. Matrix of Results and Complementary Visualizations

Table A1. Correlation matrix: agriculture domain analysis (Part 1 of 2).
TopicTech. AdvancementsConsumer PreferencesResource Optim.TraceabilitySustainable Pack.BiotechnologySoil HealthPrecision Agri.Climate ChangeMarket DynamicsUrban AgricultureCircular EconomySupply ChainAI in AgricultureBlockchain
Technological Advancements010103121001190
Evolving Consumer Preferences100013001400100
Resource Optimization000106005002430
Traceability and Transparency1010110010009234
Sustainable Packaging010105001101001
Biotechnology Applications33615051113084190
Soil Health and Conservation1000050321114100
Precision Agriculture2000013041010302
Climate Change Adaptation11511112140157516140
Global Market Dynamics0400131115000601
Urban Agriculture000000107003020
Circular Economy102018415030350
Supply Chain Resilience1149041016603024
AI in Agriculture903201903014025202
Blockchain for Food Systems0003410020100420
Connectivity Proliferation000001000100000
Renewable Energy212220101320727590
Alternative Protein0000143101004000
Water Management30560124561250959184141
Digital Transformation000001000100000
Consumer Preference Shifts000000000000000
Investment in AgTech000000000000000
Policy and Regulation000012008600410
Climate-Smart Agriculture40002621213102084486
Food Waste Reduction00236132132133630
Data Analytics107002010000020
Food Security Concerns203511510334232358
Sustainable Agriculture1319444710262195821687822
Automation and Robotics1010260302023182
Data-Driven Decision Making121330517295019324
Table A2. Correlation matrix: agriculture domain analysis (Part 2 of 2).
TopicConnectivityRenewable EnergyAlternative ProteinWater ManagementDigital Transform.Consumer ShiftsAgTech InvestmentPolicy & RegulationClimate-Smart Agri.Food WasteData AnalyticsFood SecuritySustainable Agri.AutomationData-Driven
Technological Advancements0203000040121311
Evolving Consumer Preferences010000000000102
Resource Optimization022056000002739113
Traceability and Transparency020000000305403
Sustainable Packaging001100012601420
Biotechnology Applications110432410026132154765
Soil Health and Conservation01156000021201010201
Precision Agriculture030120000211136237
Climate Change Adaptation020150900083103034195029
Global Market Dynamics170510062202825
Urban Agriculture0209000001032100
Circular Economy074180000833026821
Supply Chain Resilience050400044603739
AI in Agriculture09014000148325821832
Blockchain for Food Systems000100006008224
Connectivity Proliferation010000000000000
Renewable Energy1003710010774018314
Alternative Protein000300001506600
Water Management0373000046910118158021
Digital Transformation010000000000022
Consumer Preference Shifts000000000000000
Investment in AgTech000000000000000
Policy and Regulation0100400000101624
Climate-Smart Agriculture0716900000102319327
Food Waste Reduction07510000110041111
Data Analytics0401000000003118
Food Security Concerns006180001234005211
Sustainable Agriculture01861580006193113520425
Automation and Robotics030020022111405
Data-Driven Decision Making0140212004711812550
Table A3. Correlation matrix: education domain analysis (Part 1 of 2).
TopicAI Higher EdChatGPT EdGen AI TeachingAI LiteracyAI-Powered LearnEdTech TrendsAI AssessmentVirtual AssistantsPersonalized LearnHybrid LearningStudent-CenteredExperiential LearnHolistic Comp.Skills-Based EdOnline Platforms
AI in Higher Education0295116264306521111013819315
ChatGPT in Education29509518470721130479210613
Generative AI Teaching11695019180200461441265
AI Literacy for Teachers261819030100141322152
AI-Powered Learning434718300242121244501810
EdTech Trends 2024000000000000000
AI Assessment Tools6572201024002666232285
Virtual Teaching Assistants210020204020132
Personalized Learning1111304614121066401085641320599
Hybrid Learning Models104112406010806703129
Student-Centered Learning137434022566068637924
Experiential Learning894250304176801246328
Holistic Competencies12120021306120950
Skills-Based Education93106261518028320531379463950141
Online Learning Platforms151352100529929242801410
Teacher Prof. Development72514153071598110572670038
Education Policy Changes75210021621014314313
University Curriculum Design2322127409150101091301575031
AI in Curriculum78543519110192423660626
Education Reform1715522030345703073488
Data Privacy in Education575614218081111410604913
Social–Emotional Learning85226110631822821433143
Student Well-being600000205012144652
Education Inequality351110118299112112
Cultural Sensitivity2300001020030130
Digital Transformation Ed3518113415056101615716955
Learning Analytics46217173013238714524274101109
Future of Work Skills1613112021318225122115831
Sustainable Education772893120706334551805188957
Global Education Trends5741102018391018720
Table A4. Correlation matrix: education domain analysis (Part 2 of 2).
TopicTeacher Prof DevPolicy ChangesCurriculum DesignAI in CurriculumEducation ReformData PrivacySocial–EmotionalStudent Well-beingEducation InequalityCultural SensitivityDigital TransformLearning AnalyticsFuture Work SkillsSustainable EdGlobal Trends
AI in Higher Education77237817578632354616775
ChatGPT in Education255225415565053182113287
Generative AI Teaching14212355142010117194
AI Literacy for Teachers15171922201031131
AI-Powered Learning3041121860104732121
EdTech Trends 2024000000100010000
AI Assessment Tools72919381211513272
Virtual Teaching Assistants111201001002100
Personalized Learning5965042341116358256387316318
Hybrid Learning Models821035418020101458343
Student-Centered Learning1101010967010221290162422559
Experiential Learning5714130630682149315275118010
Holistic Competencies26315070144107422511
Skills-Based Education70014375062348493316512113169101115888987
Online Learning Platforms381331681343212055109315720
Teacher Prof. Development0441598240138728167612215627233
Education Policy Changes44043328716251111422994429767
University Curriculum Design1594303575510136292030976
AI in Curriculum8335025241210141316264
Education Reform2402877525013201114734773843349
Data Privacy in Education13165241307315128864748
Social–Emotional Learning872510120707412383164717
Student Well-being28111321137401205612305
Education Inequality16114611471512120130121645986
Cultural Sensitivity722031301011221
Digital Transformation Ed61299144728853010385826174
Learning Analytics2292013786316121380218117
Future of Work Skills15644301638464121625821014823
Sustainable Education27229797264337471304592261811480247
Global Education Trends336764498758617417232470
Table A5. Correlation matrix: public health domain analysis (Part 1 of 2).
TopicAI HealthcareDigital Health EquityTelemedicineDigital LearningSkills LearningHealth EquityUniversal CoverageSocial ProtectionSocial ConnectionEconomic InequalityRenewable EnergyClimate JusticeGreen JobsAI Public HealthHealth Data Gov
AI in Healthcare03924134881110080037459
Digital Health Equity3904109255221081001935
Telemedicine Expansion240501100100013
Digital Learning413109502067811816890010167
Skills-Based Learning482020670974169121015
Health Equity Policies8551890135150104621763
Universal Health Coverage1122111713501807010011110
Social Protection Programs11084151800952128
Social Connection Loneliness000110000200010
Economic Inequality Health0816610470920510124
Renewable Energy Systems8108996150500445
Climate Justice Movement000012020100100
Green Jobs Creation000021010041000
AI in Public Health37419110110711211400042
Health Data Governance593536715631108024500420
Health Misinformation319140121068120103511
AI Job Market Impact500430000000000
AI Nutrition Applications600300000000020
Sustainable Eating000312120002013
Digital Health Transformation3336121513463235001448
Healthy Longevity Strategies000010011000000
Adolescent Mental Health112140435127812000322
Healthcare Spending Trends000001600200004
AI Diagnostic Tools1721076802000100312
AI Medical Education37610915512000200727
Healthcare Data Privacy4702431536993022005086
Health Workforce Shortage622661136104000117
Safe Water Access021139113081000110
Digital Literacy Training8271416761521000028
Broadband Access Expansion001100000000000
Table A6. Correlation matrix: public health domain analysis (Part 2 of 2).
TopicHealth MisinfoAI Job ImpactAI NutritionSustainable EatDigital TransformHealthy LongevityMental HealthHealthcare SpendAI DiagnosticAI Medical EdData PrivacyWorkforce ShortWater AccessDigital LiteracyBroadband Access
AI in Healthcare315603301101723764706080
Digital Health Equity900036020112422270
Telemedicine Expansion100010100032111
Digital Learning4043321504007691153614161
Skills-Based Learning12301131430855663760
Health Equity Policies10002405101911910
Universal Health Coverage600160126229361150
Social Protection Programs800231700031320
Social Connection Loneliness100021800000010
Economic Inequality Health2000301220024800
Renewable Energy Systems0000500012201000
Climate Justice Movement100200000000000
Green Jobs Creation000000000000000
AI in Public Health35021140303172501120
Health Data Governance110034802242786171080
Health Misinformation00006070211102170
AI Job Market Impact000000000110000
AI Nutrition Applications000000000400000
Sustainable Eating000000100000200
Digital Health Transformation60000071493520190
Healthy Longevity Strategies000000000100000
Adolescent Mental Health700170001437130
Healthcare Spending Trends000010000001000
AI Diagnostic Tools20004010027260020
AI Medical Education111409140270350030
Healthcare Data Privacy10100350302635001100
Health Workforce Shortage200020710000110
Safe Water Access100200100011010
Digital Literacy Training70001903023101100
Broadband Access Expansion000000000000000
Figure A1. Heatmap visualization of trend co-occurrences (Part 1 of 4).
Information 16 00605 g0a1
Figure A2. Heatmap visualization of trend co-occurrences (Part 2 of 4).
Information 16 00605 g0a2
Figure A3. Heatmap visualization of trend co-occurrences (Part 3 of 4).
Information 16 00605 g0a3
Figure A4. Heatmap visualization of trend co-occurrences (Part 4 of 4).
Information 16 00605 g0a4

References

  1. Naughtin, C.K.; Schleiger, E.; Bratanova, A.; Terhorst, A.; Hajkowicz, S. Forty years in the making: A systematic review of the megatrends literature. Futures 2024, 157, 103329. [Google Scholar] [CrossRef]
  2. Berger, G. L’attitude prospective. Manag. Int. 1964, 4, 43–46. [Google Scholar]
  3. Haluza, D.; Jungwirth, D. Artificial Intelligence and Ten Societal Megatrends: An Exploratory Study Using GPT-3. Systems 2023, 11, 120. [Google Scholar] [CrossRef]
  4. Jeflea, F.V.; Danciulescu, D.; Sitnikov, C.S.; Filipeanu, D.; Park, J.O.; Tugui, A. Societal technological megatrends: A bibliometric analysis from 1982 to 2021. Sustainability 2022, 14, 1543. [Google Scholar] [CrossRef]
  5. Naisbitt, J.; Bisesi, M. Megatrends: Ten new directions transforming our lives. Sloan Manag. Rev. 1983, 24, 69. [Google Scholar]
  6. Toffler, A. The Third Wave; Morrow: New York, NY, USA, 1980; Volume 544. [Google Scholar]
  7. Naisbitt, J.; Aburdene, P. Megatrends 2000: Ten New Directions for the 1990’s; William Morrow and Company: New York, NY, USA, 1990. [Google Scholar]
  8. Werner, D.H. Broadband Metamaterials in Electromagnetics: Technology and Applications, 1st ed.; Jenny Stanford Publishing: Singapore, 2017. [Google Scholar] [CrossRef]
  9. Godet, M.; Durance, P. Prospective stratégique. Problèmes et méthodes. Cahiers du LIPSOR 2007, 104, 169–187. [Google Scholar]
  10. Godet, M.; Durance, P. La Prospectiva Estratégica Para las Empresas y los Territorios; LIPSOR: Paris, France, 2011. [Google Scholar]
  11. Lara-Navarra, P.; Ferrer-Sapena, A.; Ismodes-Cascón, E.; Fosca-Pastor, C.; Sánchez-Pérez, E.A. The Future of Higher Education: Trends, Challenges and Opportunities in AI-Driven Lifelong Learning in Peru. Information 2025, 16, 224. [Google Scholar] [CrossRef]
  12. Heinonen, S.; Kuusi, O.; Salminen, H. Hybrid Methods for Making Deliberated Futures. In Proceedings of the 6th International Conference on Future-Oriented Technology Analysis (FTA)—Future in the Making, Finland Futures Research Centre (FFRC), University of Turku, Brussels, Belgium, 4–5 June 2018. Session: Approaching Ethical Aspects with Foresight. [Google Scholar]
  13. Geurts, A.; Gutknecht, R.; Warnke, P.; Goetheer, A.; Schirrmeister, E.; Bakker, B.; Meissner, S. New perspectives for data-supported foresight: The hybrid AI-expert approach. Futur. Foresight Sci. 2022, 4, e99. [Google Scholar] [CrossRef]
  14. Karlsen, J.E. Design and application for a replicable foresight methodology bridging quantitative and qualitative expert data. Eur. J. Futur. Res. 2014, 2, 40. [Google Scholar] [CrossRef]
  15. Bevolo, M.; Draeger, D. Leisure futures: A hybrid approach integrating generative AI and design futures. Res. Hosp. Manag. 2025, 15, 77–83. [Google Scholar] [CrossRef]
  16. Ko, B.K.; Yang, J.S. Developments and challenges of foresight evaluation: Review of the past 30 years of research. Futures 2024, 155, 103291. [Google Scholar] [CrossRef]
  17. King, M.; Retief, F.; Bond, A.; Pope, J.; Morrison-Saunders, A. Global megatrends and their implications for environmental assessment practice. Environ. Impact Assess. Rev. 2016, 61, 52–60. [Google Scholar]
  18. Walker, W.E.; Haasnoot, M.; Kwakkel, J.H. Adapt or Perish: A Review of Planning Approaches for Adaptation under Deep Uncertainty. Sustainability 2013, 5, 955–979. [Google Scholar] [CrossRef]
  19. Wolf, C.; Floyd, S.W. Strategic Planning Research: Toward a Theory-Driven Agenda. J. Manag. 2017, 43, 1754–1788. [Google Scholar] [CrossRef]
  20. Boonmavichit, T.N. Understanding Society: A Reflexive Foresight Matrix for Navigating Complexity and Shaping the Future. Foresight 2024, 27, 432–448. [Google Scholar] [CrossRef]
  21. Pérez-Ortiz, M. From Prediction to Foresight: The Role of AI in Designing Responsible Futures. J. Artif. Intell. Sustain. Dev. 2024, 1, 1–9. [Google Scholar] [CrossRef]
  22. Fitkov-Norris, E.; Kocheva, N. 14: Leveraging AI for strategic foresight: Unveiling future horizons. In Improving and Enhancing Scenario Planning; Edward Elgar Publishing: Cheltenham, UK, 2025; pp. 286–305. [Google Scholar] [CrossRef]
  23. Crawford, M.M.; Wright, G. Improving and Enhancing Scenario Planning: Futures Thinking; Edward Elgar Publishing: Cheltenham, UK, 2025. [Google Scholar] [CrossRef]
  24. Pinto, J.P.; Medina, J. Hybrid processes for a new era of strategic foresight. Foresight 2020, 22, 287–307. [Google Scholar] [CrossRef]
  25. CEPLAN. Plan Bicentenario: El Perú hacia el 2021; CEPLAN: Lima, Peru, 2011. [Google Scholar]
  26. CEPLAN. Perú 2050: Tendencias Globales y Regionales; CEPLAN: Lima, Peru, 2022. [Google Scholar]
  27. Rockwell, G.; Sinclair, S. Voyant Tools (Version 2.6.18) [Computer Software]. Voyant Consortium. Available online: https://voyant-tools.org/ (accessed on 9 June 2025).
  28. Roe, J.; Perkins, M. Generative AI in Self-Directed Learning: A Scoping Review. arXiv 2024, arXiv:2411.07677. [Google Scholar]
  29. Bennis, I.; Mouwafaq, S. Advancing AI-driven thematic analysis in qualitative research: A comparative study of nine generative models on Cutaneous Leishmaniasis data. BMC Med. Inform. Decis. Mak. 2025, 25, 124. [Google Scholar] [CrossRef]
  30. Tozuka, R.; Johno, H.; Amakawa, A.; Sato, J.; Muto, M.; Seki, S.; Komaba, A.; Onishi, H. Application of NotebookLM, a large language model with retrieval-augmented generation, for lung cancer staging. Jpn. J. Radiol. 2025, 43, 706–712. [Google Scholar] [CrossRef]
  31. Manetti, A.; Ferrer-Sapena, A.; Sánchez-Pérez, E.A.; Lara-Navarra, P. Design Trend Forecasting by Combining Conceptual Analysis and Semantic Projections: New Tools for Open Innovation. J. Open Innov. Technol. Mark. Complex. 2021, 7, 92. [Google Scholar] [CrossRef]
  32. Arnau, R.; Ferrer, A.C.; Cortés, A.G.; Arnau, C.S.; Pérez, E.A.S. Measuring Semantic Stability: Statistical Estimation of Semantic Projections via Word Embeddings. Axioms 2025, 14, 389. [Google Scholar] [CrossRef]
  33. Gemini Team. Gemini: A Family of Highly Capable Multimodal Models. arXiv 2024, arXiv:2312.11805. [Google Scholar]
Figure 1. Some milestones in the evolution of the concept of megatrend.
Information 16 00605 g001
Figure 2. Dual analysis process and information synthesis.
Information 16 00605 g002
Figure 3. General structure of the analysis methodology.
Information 16 00605 g003
Figure 4. Word cloud visualization representing lexical frequency analysis.
Information 16 00605 g004
Figure 5. Semantic relationship network.
Information 16 00605 g005
Figure 6. Screenshot of the platform.
Information 16 00605 g006
Figure 7. Heatmap visualization of trend co-occurrences (Part 4 of 4).
Information 16 00605 g007
Figure 8. Network visualization of extracted terms showing relationship strength and centrality patterns.
Information 16 00605 g008
Figure 9. Network visualization of educational technology trends showing relationship strength and centrality patterns in the education domain.
Information 16 00605 g009
Figure 10. Network visualization of public health technology trends showing relationship strength and centrality patterns in the health domain.
Information 16 00605 g010
Disclaimer/Publisher’s Note: The statements, opinions and data contained in all publications are solely those of the individual author(s) and contributor(s) and not of MDPI and/or the editor(s). MDPI and/or the editor(s) disclaim responsibility for any injury to people or property resulting from any ideas, methods, instructions or products referred to in the content.

