Article

On the Capacity of V2X Communication Networks to Support the Delivery of Emerging C-ITS Services: A Case Study on an Irish Motorway

1
School of Computer Science & IT, University College Cork, T12 XF62 Cork, Ireland
2
AECOM Ltd., Bristol BS1 6GD, UK
3
Transport Infrastructure Ireland, D08 DK10 Dublin, Ireland
*
Author to whom correspondence should be addressed.
Information 2025, 16(7), 563; https://doi.org/10.3390/info16070563
Submission received: 21 May 2025 / Revised: 13 June 2025 / Accepted: 15 June 2025 / Published: 30 June 2025
(This article belongs to the Special Issue Internet of Everything and Vehicular Networks)

Abstract

Roadside communication networks with Cooperative Intelligent Transport Systems (C-ITSs) offer services that aim to enhance traffic management and road safety.This paper presents a comprehensive scalability study of C-ITSs to support a deployment of Day 1 advisory services on the busiest Irish motorway. Specifically, the performance of the two standardized C-ITS short-range communication technologies, namely ITS-G5 and C-V2X, are quantified. Both technologies are evaluated while considering different market penetration rates (MPRs), real-world vehicle densities during daily time periods, and data traffic demands linked to real world C-ITS services. The simulation results show that ITS-G5 performs slightly better at shorter distances, and C-V2X performs marginally better at medium and longer distances, benefiting from technology that supports better signal quality and communication robustness.

1. Introduction

Vehicle-to-Everything (V2X) communication is regarded as a crucial technology for enhancing road safety and is a key component in the rollout of Intelligent Transportation Systems (ITSs) [1] across Europe and beyond. Ensuring road safety has consistently been a primary concern in both road design and vehicle manufacturing due to the significant number of injuries and fatalities that occur annually. The World Health Organization (WHO) reported that in 2023, nearly 1.19 million people lost their lives in road accidents worldwide [2]. Cooperative Intelligent Transportation Systems (C-ITSs) leverage V2X communication, enabling vehicles and traffic management infrastructure to exchange information directly. This real-time data sharing facilitates coordinated actions, enhancing traffic efficiency and safety. This is achieved through a range of communication technologies and data delivery platforms. Two distinct wireless communication technologies, ITS-G5 and Long-Term Evolution (LTE)-based cellular V2X (C-V2X), have been standardized by international organizations and consortia for the short-range direct communication of C-ITS services. Ongoing advancements and assessments for both technologies are being carried out globally. Both technologies utilize vehicle Onboard Units (OBUs) and Roadside Unit (RSU) infrastructure.
The IEEE 802.11p wireless standard is an established radio access technology designed for automotive and ITS applications, enabling short-range communication of status information between units at the physical (PHY) and Medium Access Control (MAC) layers. The upper layers, including standardized message structures for data exchange, are defined by the European Telecommunications Standards Institute (ETSI) ITS-G5 in Europe and Wireless Access for Vehicular Environments (WAVE) in North America. The standardized messages exchanged via C-ITS include Cooperative Awareness Messages (CAMs) in Europe and Basic Safety Messages (BSMs) in the U.S., which contain details such as vehicle speed, position, and heading [3]. Additionally, ETSI has defined Decentralized Environmental Notification Messages (DENMs) to support the implementation of safety-related C-ITS applications, such as hazardous location notifications and road works warnings [4]. Other standardized C-ITS message types include In-Vehicle Information Messages (IVIMs) which communicate traffic signs and variable message signs to road users, further enhancing road safety and traffic efficiency.
C-V2X or LTE-V2X, introduced by the 3rd Generation Partnership Project (3GPP), is a competitive alternative to ITS-G5. Several studies have been conducted to evaluate the performance of ITS-G5 and C-V2X individually, as well as through comparative analysis such as [5,6,7,8,9,10,11,12]. These rely on synthetic randomized vehicular traffic models to analyze their performance. In contrast, this paper considers real-world traffic scenarios representative of the true status of road conditions, vehicular movement and traffic patterns. Results from real-world traffic can be expected to prove reliable for industry stakeholders, as they reflect the C-ITS pilot performance in practical, on-the-ground conditions and give an indication of how this will scale as market penetration rates increase. The main contributions of this work are as follows:
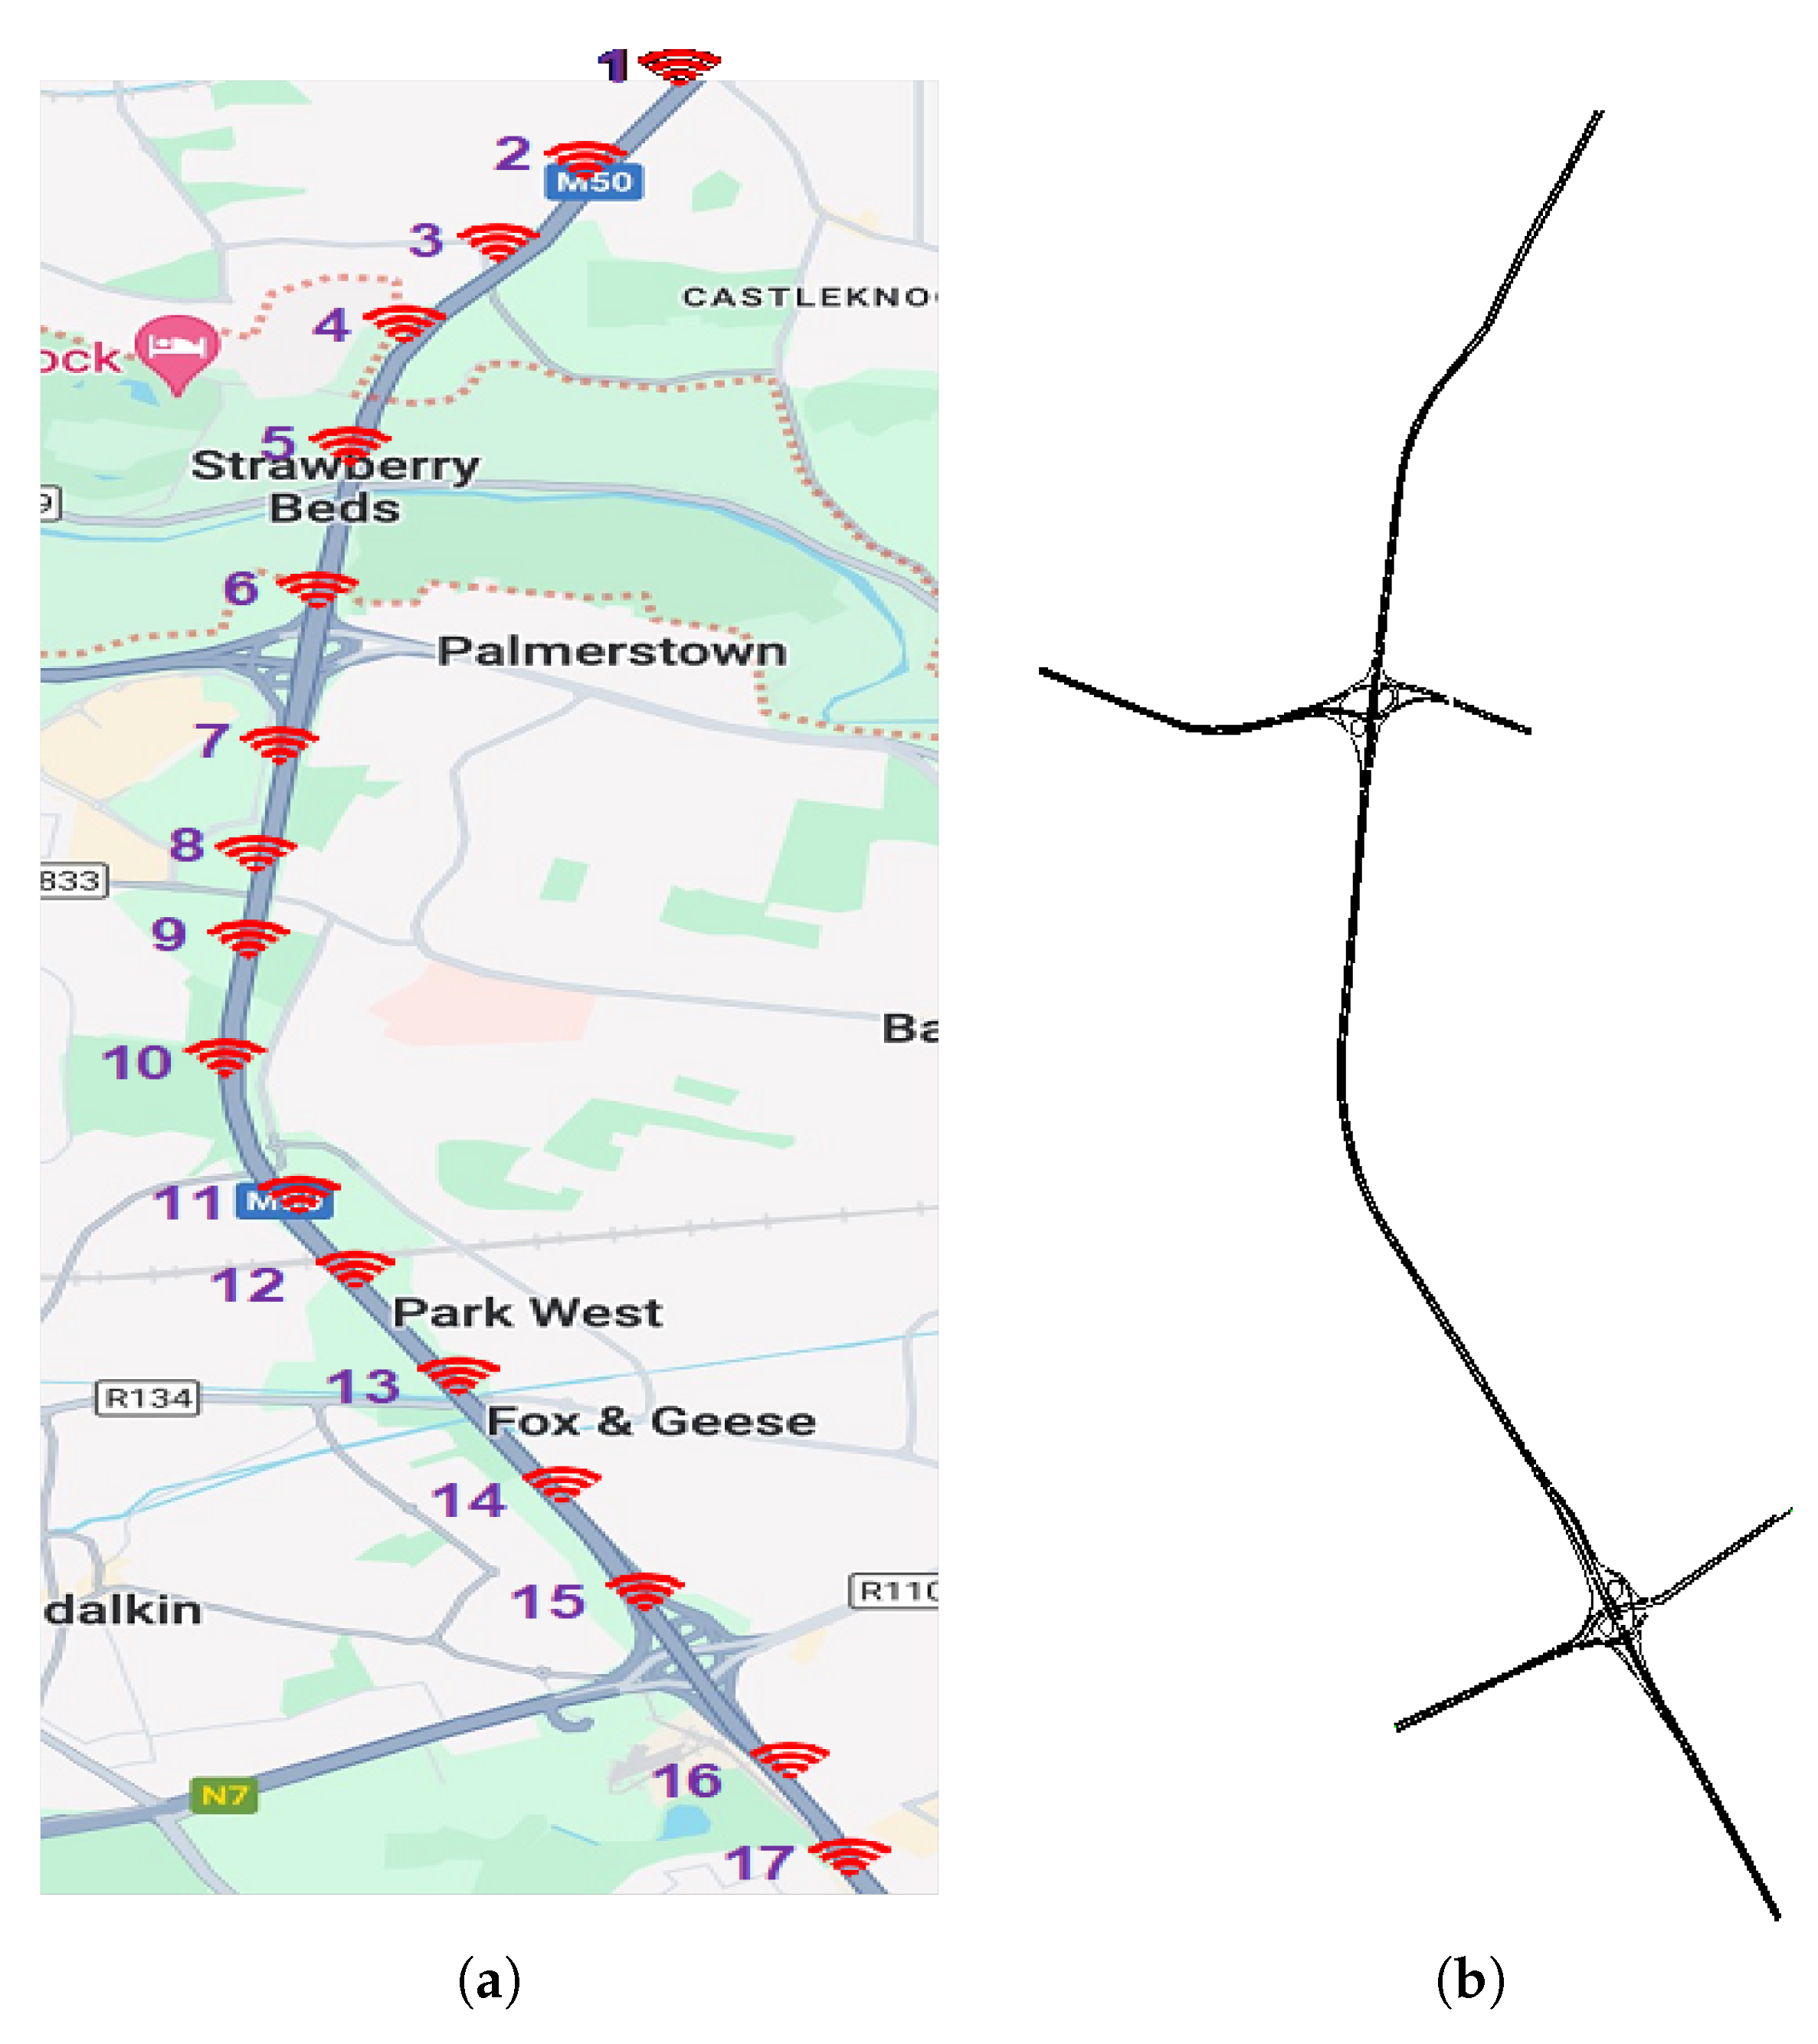
  • A discrete event network simulation model is devised and implemented for Ireland’s busiest motorway, using information on actual RSU locations and real-world vehicular traffic.
  • Using this model, extensive evaluations to analyze vehicular communication performance for both ITS-G5 and C-V2X technologies, are conducted.
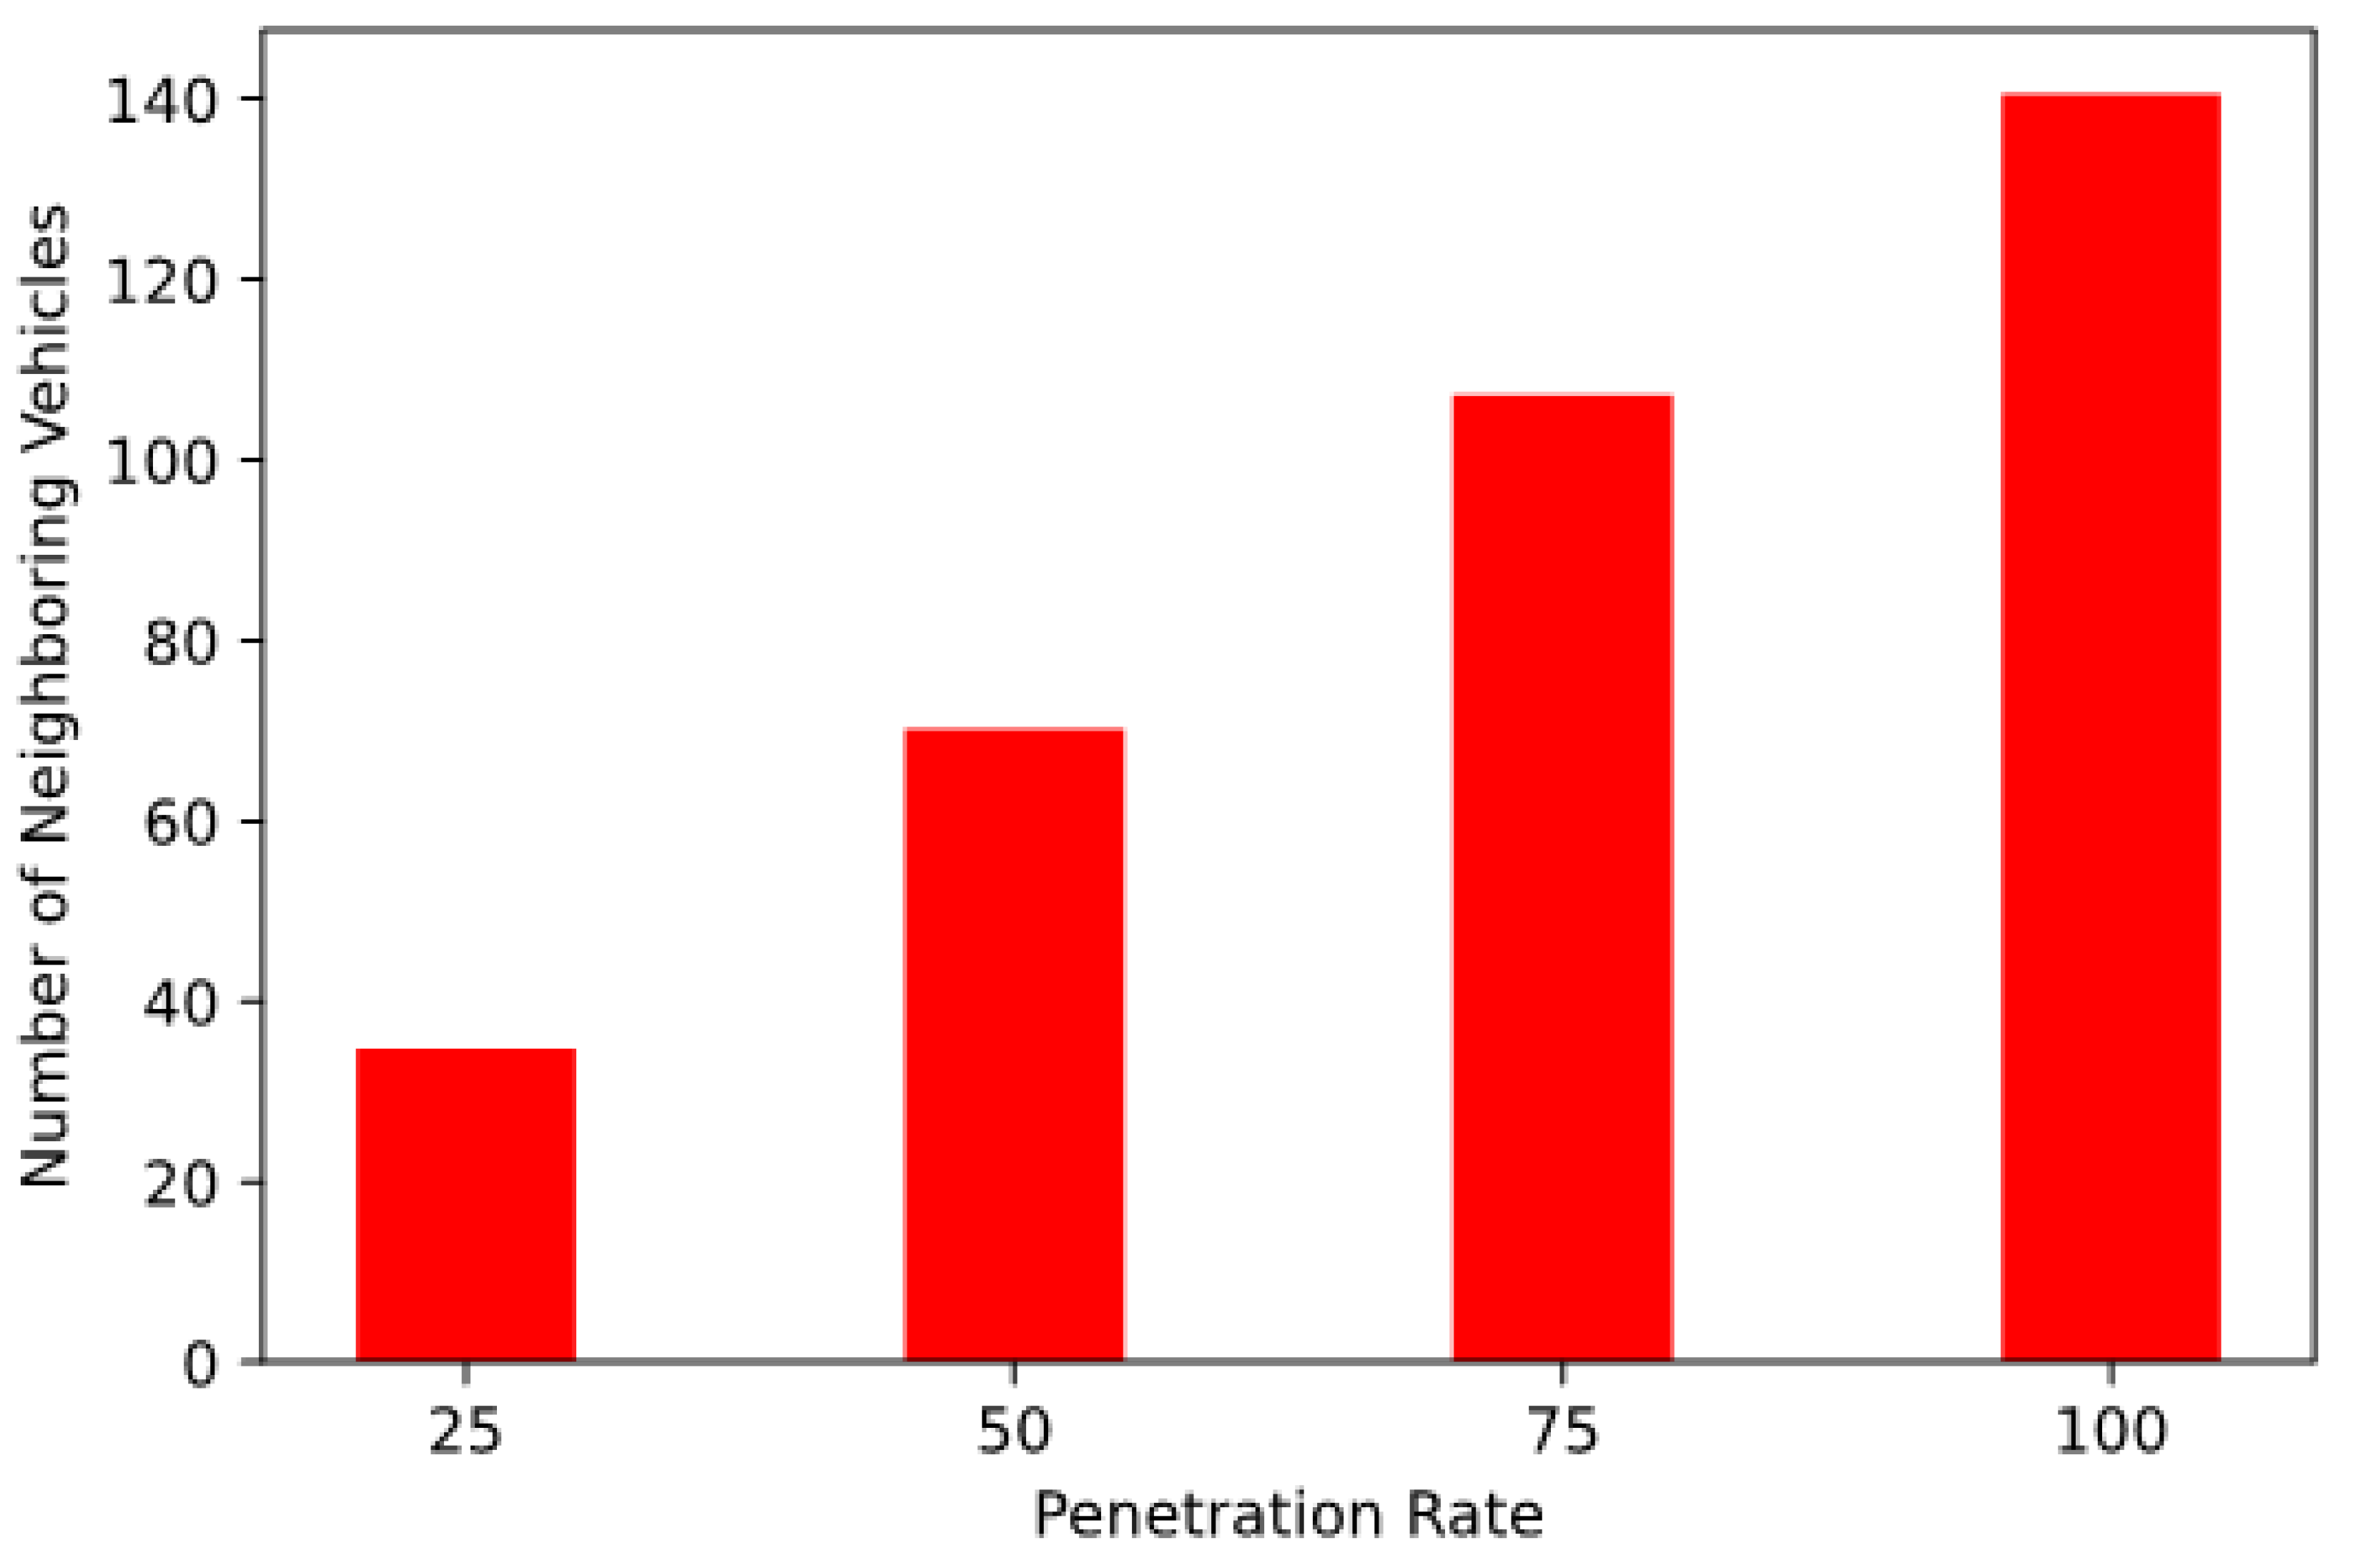
  • This analysis covers a range of traffic conditions, from average load to peak traffic, based on real-world Day 1 C-ITS service profiles, and varying market penetration rates to thoroughly evaluate the impact on network performance.
The remainder of the paper is organized as follows: Section 2 summarizes standardized vehicular radio technologies and gives an overview of C-Roads Ireland C-ITS pilot deployment. The real-world mobility and traffic models are described in Section 3. Section 4 presents the results highlighting the performance of both ITS-G5 and C-V2X technologies individually and comparatively, with conclusions drawn in Section 5.

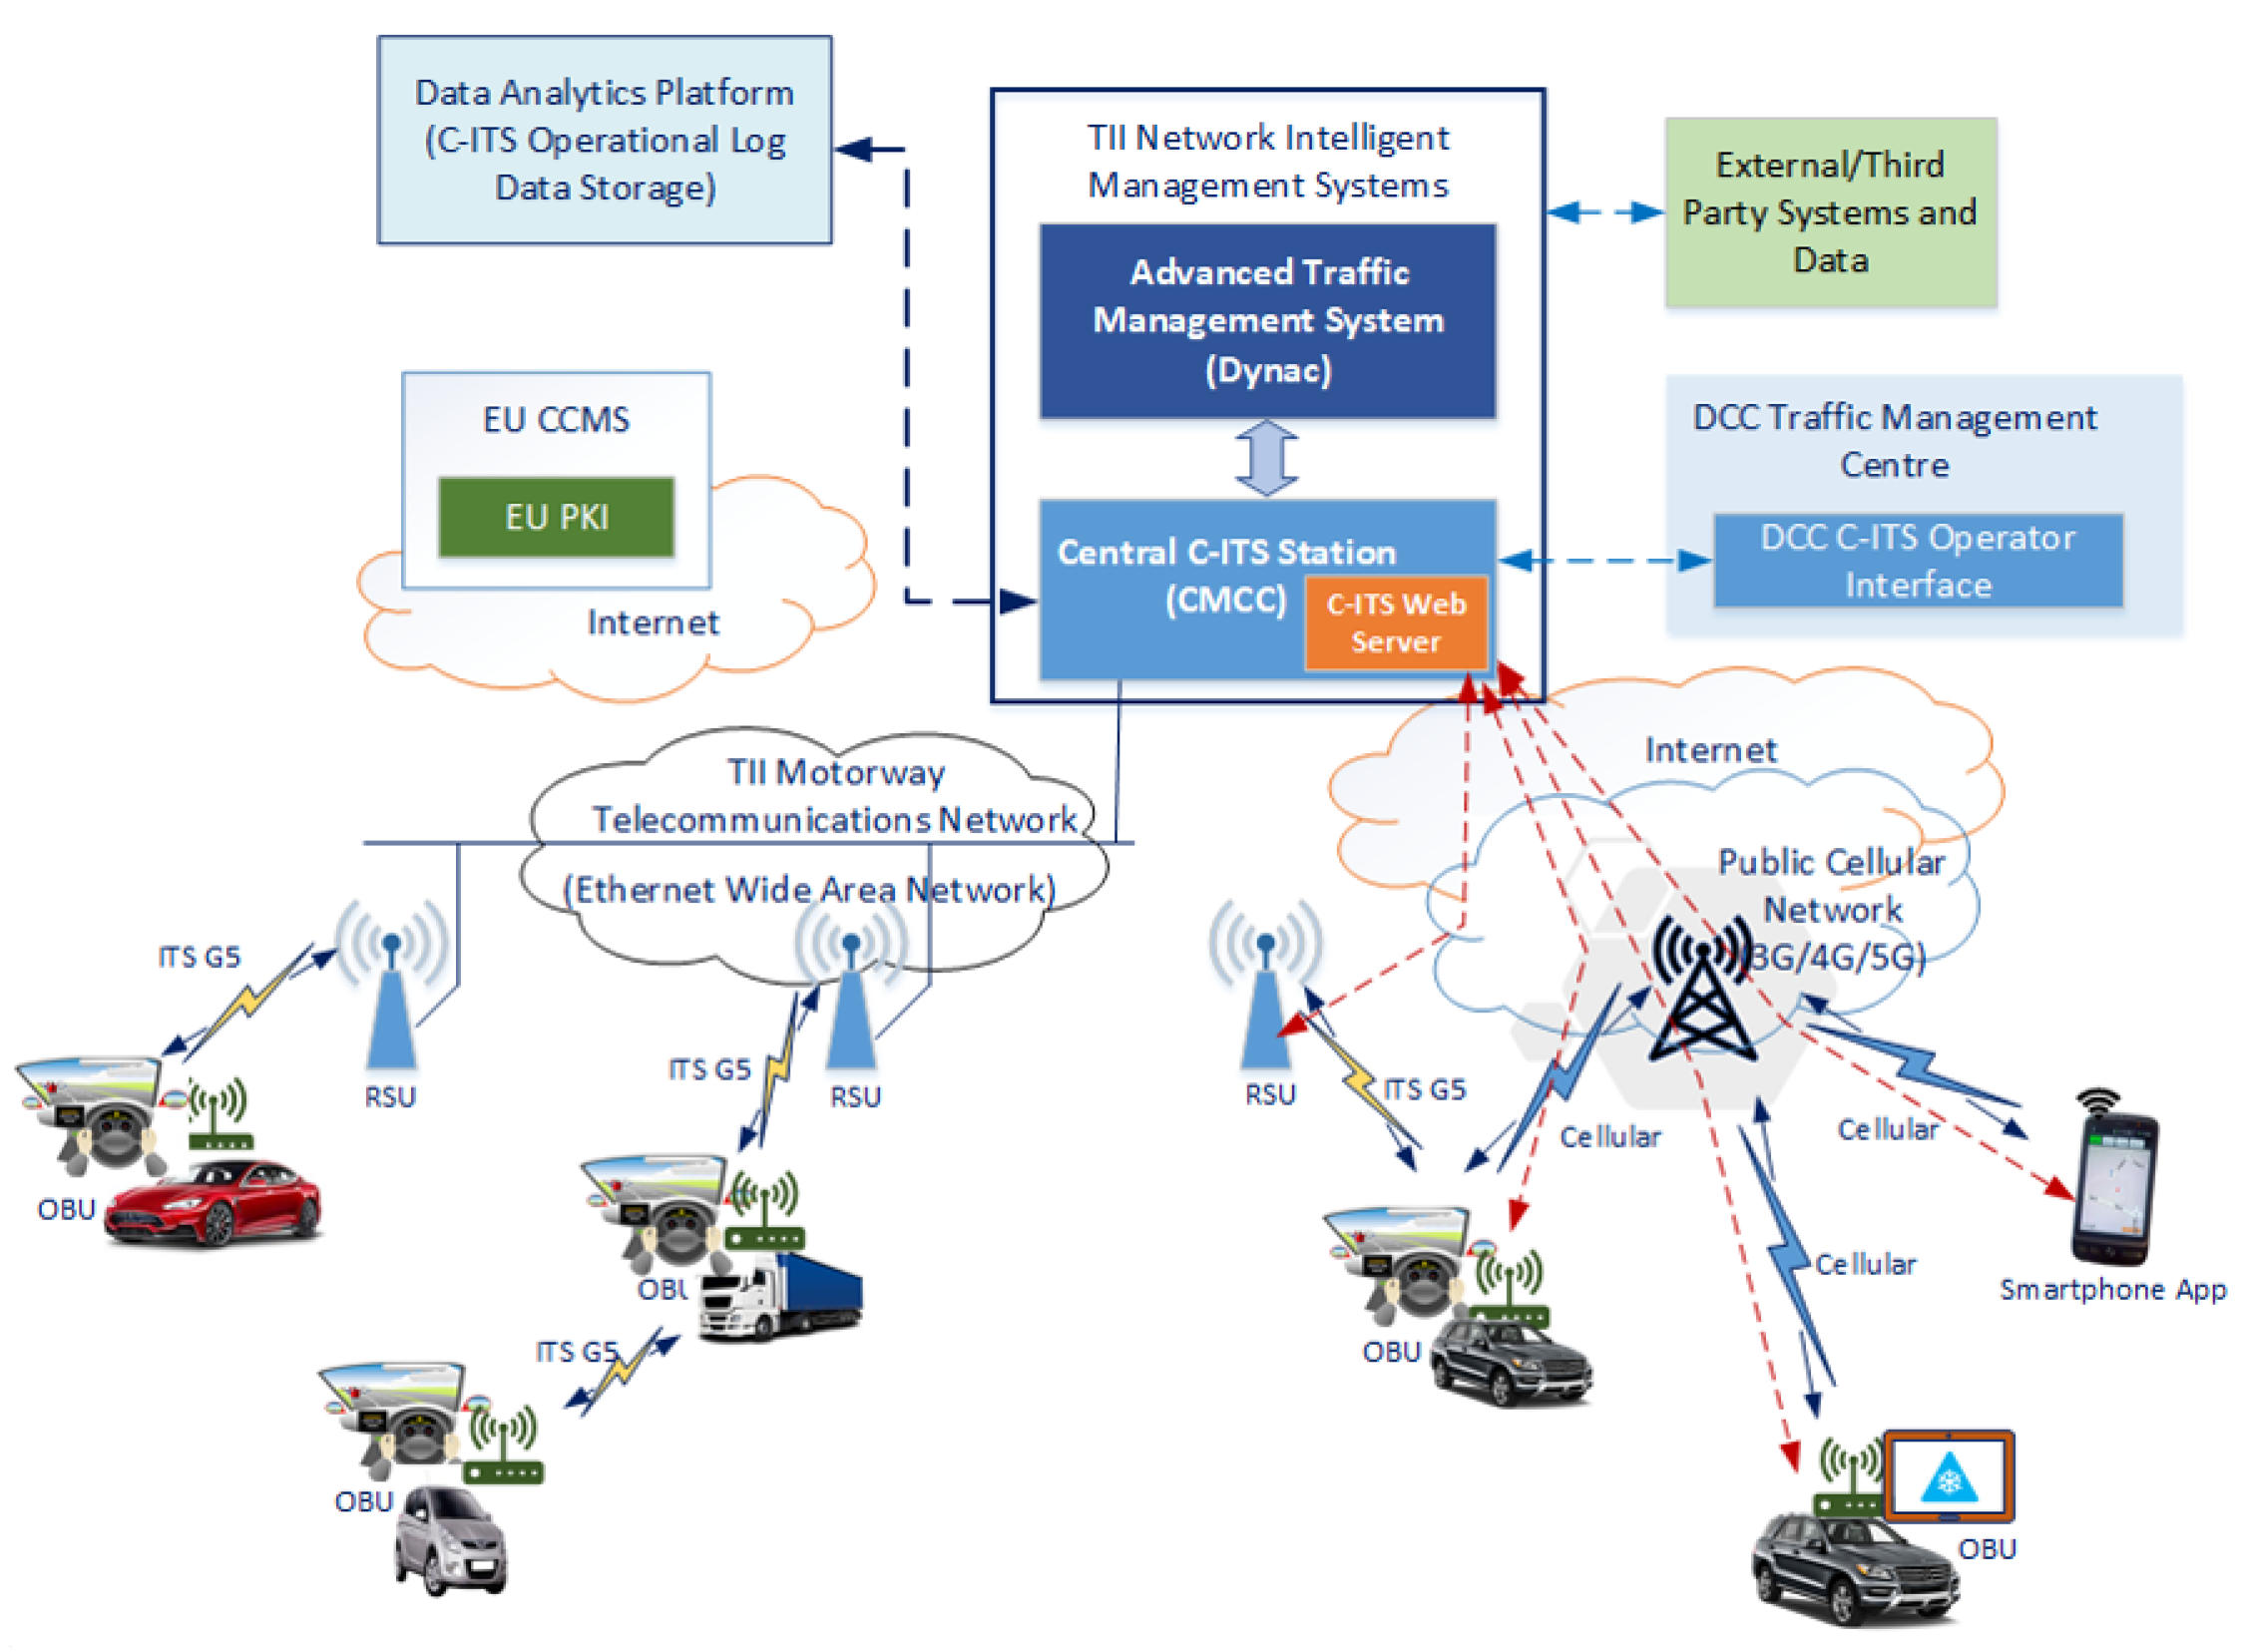
2. Overview of the Irish C-ITS Pilot and Vehicular Radio Technologies

In this section, the system architecture of the Irish C-ITS pilot deployment is briefly described. The Irish C-ITS pilot deployment is part of the C-Roads platform, which is a joint initiative of European Member States and road operators for the deployment of C-ITS. The primary objectives of the C-Roads platform are to coordinate C-ITS deployment activities across member states, collaboratively develop and share technical specifications for implementation, and test and evaluate pilot deployments to ensure interoperability. This approach aims to achieve interoperable and harmonized C-ITS deployments across all C-Roads member states. This section also provides a summary of the two key technologies that were selected for this empirical study. A schema of the C-Roads Ireland C-ITS pilot system architecture is shown in Figure 1. It consists of three primary C-ITS stations: A Central C-ITS Station (known as CMCC), RSUs, and vehicle OBUs. The CMCC is fully integrated with Transport Infrastructure Ireland’s (TII’s) Advanced Traffic Management System (ATMS) within Motorway Operations and Control Centre (MOCC) for receiving traffic events data in real time from the ATMS. It generates C-ITS messages for traffic events and disseminates them via RSUs to notify road users.
RSUs facilitate Infrastructure-to-Vehicle (I2V) and Vehicle-to-Infrastructure (V2I) communications between the traffic management infrastructure and vehicles on the road network. They broadcast C-ITS messages received from the CMCC, and receive C-ITS messages broadcast by OBUs within their communication range. In the Irish pilot deployment, the RSUs and OBUs utilize only ITS-G5 technology. However, this study evaluates both ITS-G5 and C-V2X radio technologies. The two primary radio access technologies are described in the subsequent sections, with a brief comparative summary provided in Table 1. OBUs are installed within vehicles to support I2V, V2I, and vehicle-to-vehicle (V2V) communications. C-ITS messages are also communicated via legacy 4G/5G cellular networks. The services deployed in the pilot, described in more detail in Table 2, broadly address road user safety and traffic management.

2.1. ITS-G5 Vehicular Network

Unlike the United States and other continents, Europe maintains a technology-agnostic approach to deploying C-ITS services in the unlicensed 5.9 GHz dedicated ITS spectrum. This approach allows for the coexistence of various communication technologies, such as ITS-G5 and C-V2X, ensuring flexibility and interoperability at the service level. Under the C-Roads platform, over 20,000 km of road sections are now equipped with ITS-G5 based RSUs, with an aim to enhance road safety and traffic efficiency across the continent.
The dedicated ITS spectrum (5855–5925 MHz) is divided into seven x 10 MHz channels. These consist of one Control Channel (CCH) designated for high-priority short messages and control data, and six Service Channels (SCHs) for general data transmission. Various Modulation and Coding Schemes (MCSs) are accommodated with transmitter power levels ranging from 0 to 28.8 dBm, providing coverage distances approximately from 10 m to 1 km depending on the communication environment.
Channel access is governed by the Distributed Coordination Function (DCF), which uses Carrier-Sense Multiple Access with Collision Avoidance (CSMA/CA). ITS-G5 C-ITS stations (i.e., RSUs and vehicle OBUs) engage in a slotted backoff mechanism, initiating transmissions at the beginning of slots when the channel is free. A random backoff time is chosen from the interval [0, CW-1], where CW denotes the Contention Window. The backoff counter decreases during idle slots, pauses when the channel is detected as busy, and resumes after a Distributed Interframe Space (DIFS) period of channel inactivity. Data transmission takes place when the backoff counter reaches zero, potentially leading to collision if multiple stations select the same time slot. Moreover, IEEE 802.11p includes Enhanced Distributed Channel Access (EDCA), which supports four access categories, each assigned different priority levels for vehicular communication.

2.2. Cellular-Based Vehicular Network (C-V2X)

As a radio alternative, the 3GPP defined LTE-based C-V2X communication in Release 14 in 2017 for direct vehicular communication [14]. Like ITS-G5, it operates in the 5.9 GHz band and operates with 10 or 20 MHz channels. C-V2X communication uses LTE sideline (also referred to as PC5 interface) resources and implements Single-Carrier Frequency Division Multiple Access (SC-FDMA) at the PHY and medium access control (MAC) layers. In the time domain, resources are organized into subframes of 1 ms, which are further grouped into frames of 10 ms. In the frequency domain, the channel is divided into subcarriers of 15 kHz. These subcarriers are grouped into Resource Blocks (RBs), with each RB containing 12 subcarriers and spanning over 1 subframe, and with RBs grouped into subchannels. The number of RBs per subchannel and the number of subchannels are configurable but limited by the allocated bandwidth. C-V2X employs the PC5 interface and at the MAC layer can operate in both network-controlled and autonomous modes [14]. In the network-controlled mode (also known as Sidelink Mode 3), vehicles are assumed to be within the coverage of one or more base stations, which dynamically assign the resources for V2V communications through control signaling. In the autonomous mode (also known as Sidelink Mode 4), vehicles engage in distributed resource allocation by employing a sensing-based semi-persistent transmission mechanism. In this study, we focus on autonomous resource allocation mechanisms using Sidelink Mode 4 for comparison with ITS-G5 technology employed in the Irish C-ITS pilot.

3. Modeling Methodology

To assess the performance of ITS-G5 and C-V2X technologies in a realistic setting, we collaborated with Transport Infrastructure Ireland (TII), the state agency responsible for the deployment and management of the motorway road network in Ireland. TII deployed RSUs along the M50 motorway, the busiest motorway in Ireland, as part of the EU C-Roads Ireland C-ITS pilot. This section outlines the specifics of the simulation environment, including the road and mobility models and data traffic models used in the evaluation. The aim is to create a realistic representation of the Irish motorway to analyze how vehicular communication networks perform under various traffic demands and communication scenarios. The following subsections provide detailed descriptions of the simulation setup, parameters, and methodologies employed in this study.

3.1. Road and Mobility Models

A 7 km stretch of the M50 motorway is modeled with 4 lanes per traffic direction, including two major interchanges with junctions to national roads N7 and N9, as shown in Figure 2a. We consider the deployment of 17 ITS-G5 RSUs, which are installed in the locations specified as part of the C-Roads Ireland C-ITS pilot project [15]. The corresponding view in the popular SUMO micro-mobility simulator [16] is provided in Figure 2b. The simulation study employs a microscopic traffic model where vehicle motion results from the combination of longitudinal and lateral models. Longitudinal behavior, i.e., vehicle acceleration, relies on the default (Krauss) car-following model with parameters listed in Table 3. Lateral behavior is computed using the SUMO lane-changing model that makes decisions based on the perception of surrounding lanes.
The vehicle mobility model is based on real data gathered on the M50 and provided by TII [17,18]. In this work, we consider a congested traffic state reflecting the highest traffic demand observed between 7 and 8 a.m. Using the dataset provided by TII, the traffic flow was generated with loop sensor data in the SUMO simulator. We also consider the following MPRs: 25%, 50%, 75%, and 100% of OBU equipped vehicles. The MPR in vehicular networks refers to the proportion of vehicles equipped with OBUs capable of V2X communication relative to the total number of vehicles on the road. The average number of neighboring vehicles with OBUs within a 300 m radius in the simulations is depicted in Figure 3. As shown, there are approximately 35 neighboring OBU-equipped vehicles for a 25% MPR and around 140 neighboring OBU-equipped vehicles for a 100% MPR.

3.2. Data Traffic Model

In the Irish pilot, selected applications are implemented following the C-Roads specifications using standardized C-ITS messages [13] such as In-Vehicle Information Messages (IVIMs), Decentralized Environmental Notification Messages (DENMs), and Cooperative Awareness Messages (CAMs). Additionally, a new C-ITS application (Point of Interest (POI)-Electric Charging Stations Information) which uses a custom Electric Vehicle Charging Spot Notification (EVCSN) message was also piloted in Ireland. The data traffic model for the simulation considers the C-ITS applications listed in Table 2. The key factors impacting the amount of data generated for an application are the probability of the corresponding event (or notification) being active (labelled as ϵ a ), the size of the C-ITS message, and the repetition rate of transmission of data packet containing the C-ITS message. For a given C-ITS application, ϵ a depends on several factors, e.g., the activation of a weather condition warning depends on the likelihood of severe weather incidents, such as fog, being identified and notified by the Advanced Traffic Management System (ATMS) within the coverage area of the considered C-ITS network. The frequency with which all applications generate application traffic, except for the Probe Vehicle Data (PVD) service, is assumed to be 1 Hz, i.e., one message per second. CAM messages are not repeated but are generated at a rate of 1 Hz to 10 Hz based on vehicle movement, with an average CAM generation rate assumed to be 5 Hz in our analysis. Based on TII’s C-ITS pilot data, the average sizes of DENM, IVIM, CAM, and EVCSN messages are 500, 500, 400, and 300 bytes, respectively. The assumed values for ϵ a for each application are given in Table 2. This represents an average scenario. A peak scenario is also considered, where all ϵ a values for each application are assumed to be 1.

3.3. Simulation Setup

The simulation model is implemented using the open-source WiLabV2Xsim simulator, which is based on the MATLAB package, as presented in [19,20]. We extend WiLabV2Xsim to incorporate the considered M50 topology including the road and mobility models from SUMO. Standard values of physical and MAC layer simulation parameters for ITS-G5 and C-V2X (Mode 4) are used. Results are captured when the simulated time reaches 90 s Messages are transmitted in a conventional half-duplex manner, with rates depending on the average or peak scenario as described in the data traffic model. We consider a dedicated 10 MHz bandwidth with a bit rate of 6 Mbps for both ITS-G5 and C-V2X technologies. The Winner + B1 channel model [21] provided by the 3GPP is used. The parameters used in the simulation are summarized in Table 4. Note that given that WiLabV2Xsim is not a full-stack simulator and the focus of this work is on evaluating wireless network performance, particularly at the MAC and PHY layers, an abstracted version of the above described data traffic model is used. This abstraction averages the size of the C-ITS messages and the message repetition rate based on the activation probability ϵ a .

3.4. Performance Metrics

In this subsection, we define the key performance metrics used in our evaluation of ITS-G5 and C-V2X. These metrics are essential for assessing the effectiveness and reliability of the communication networks in supporting C-ITS services. The following metrics are used in this paper:
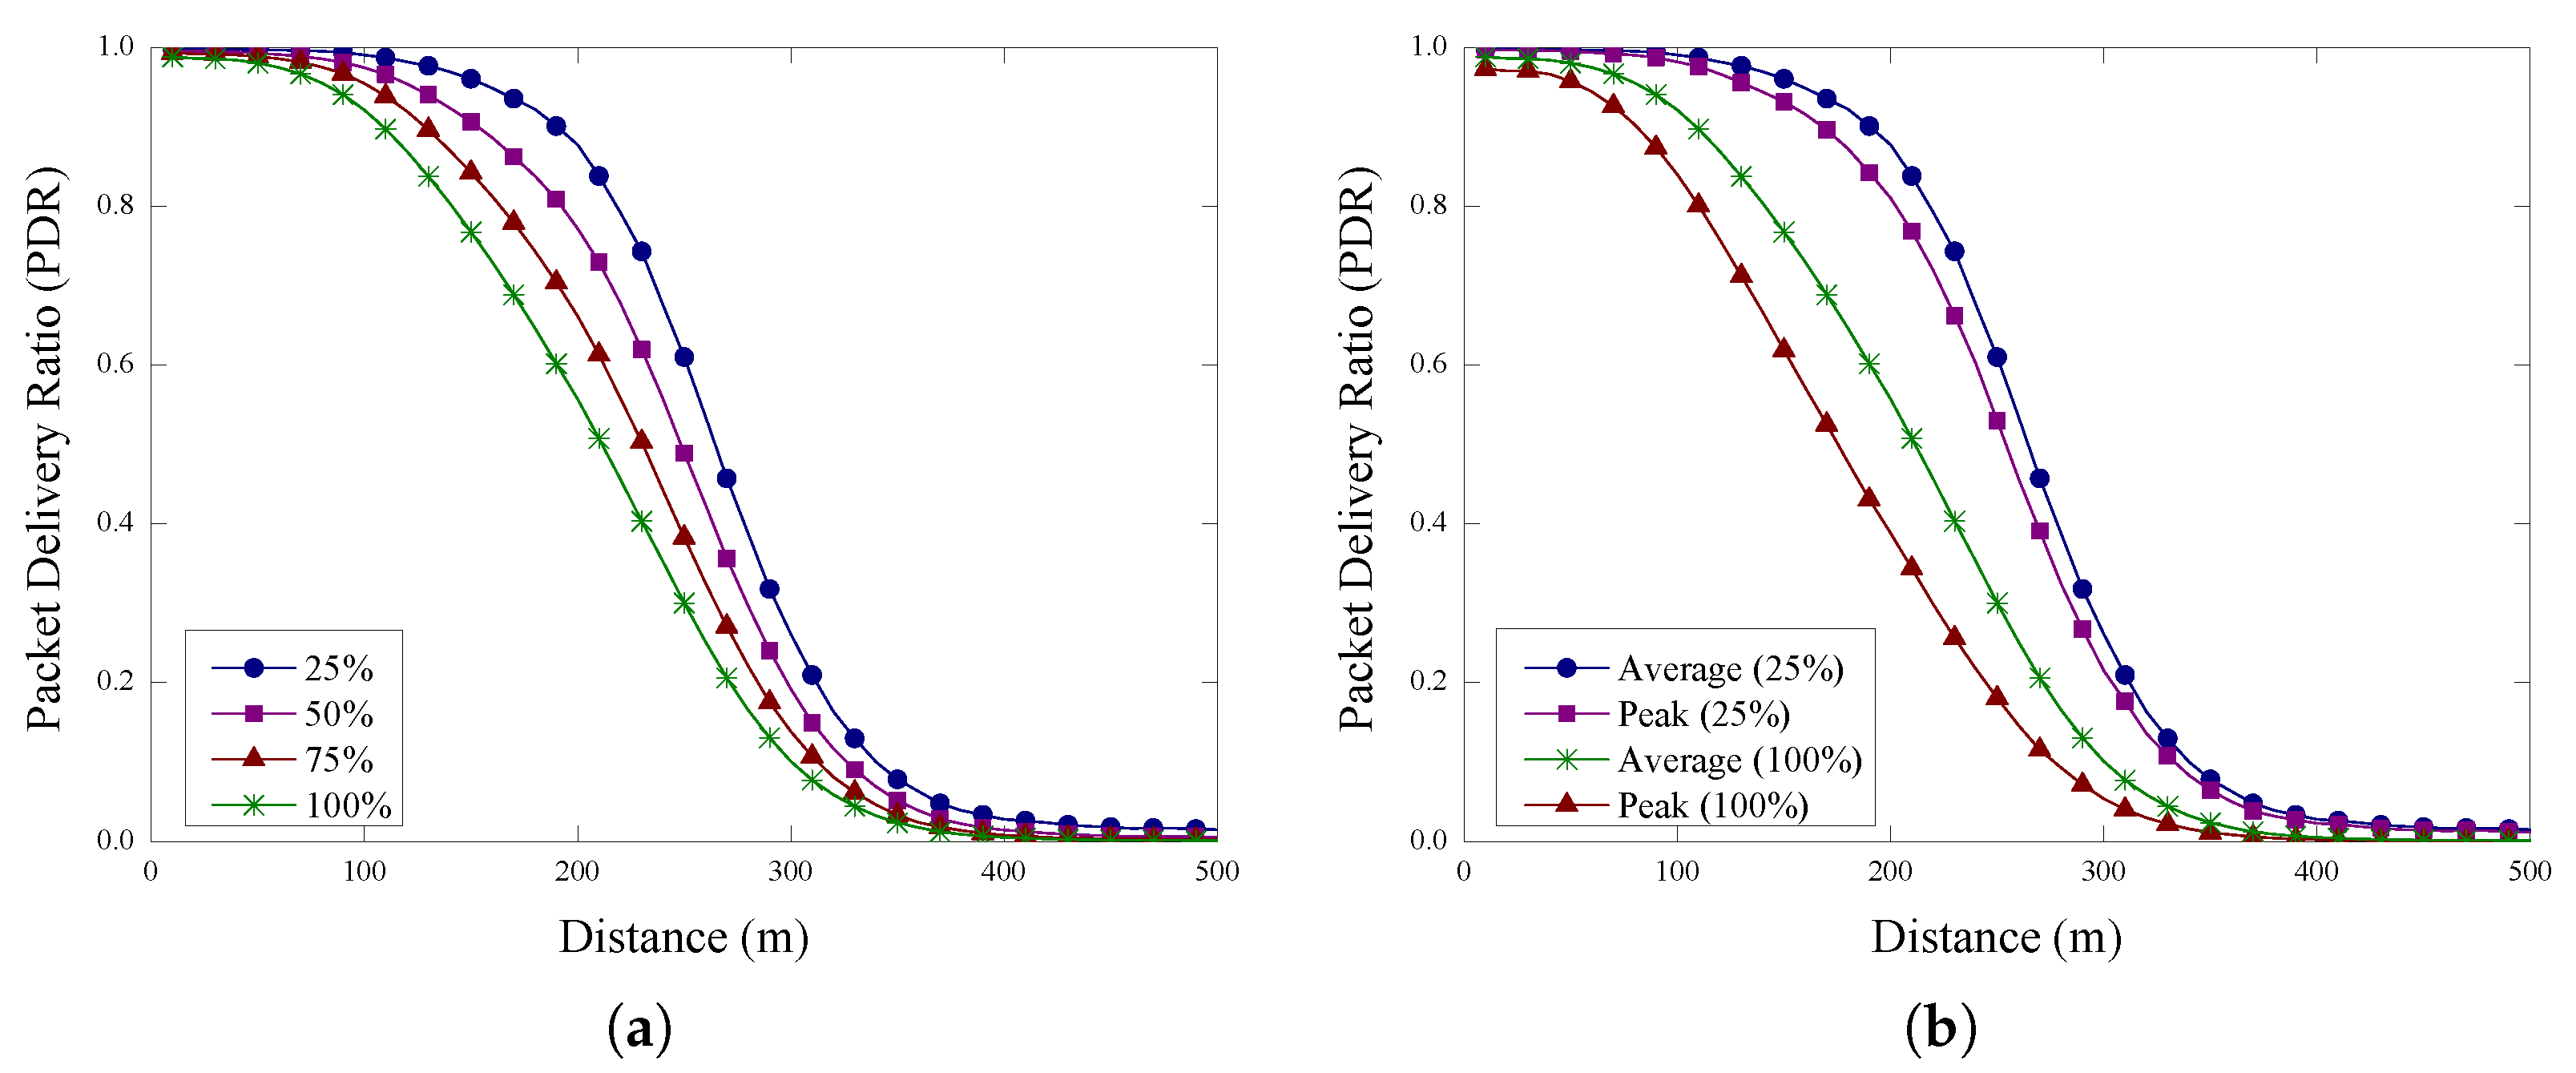
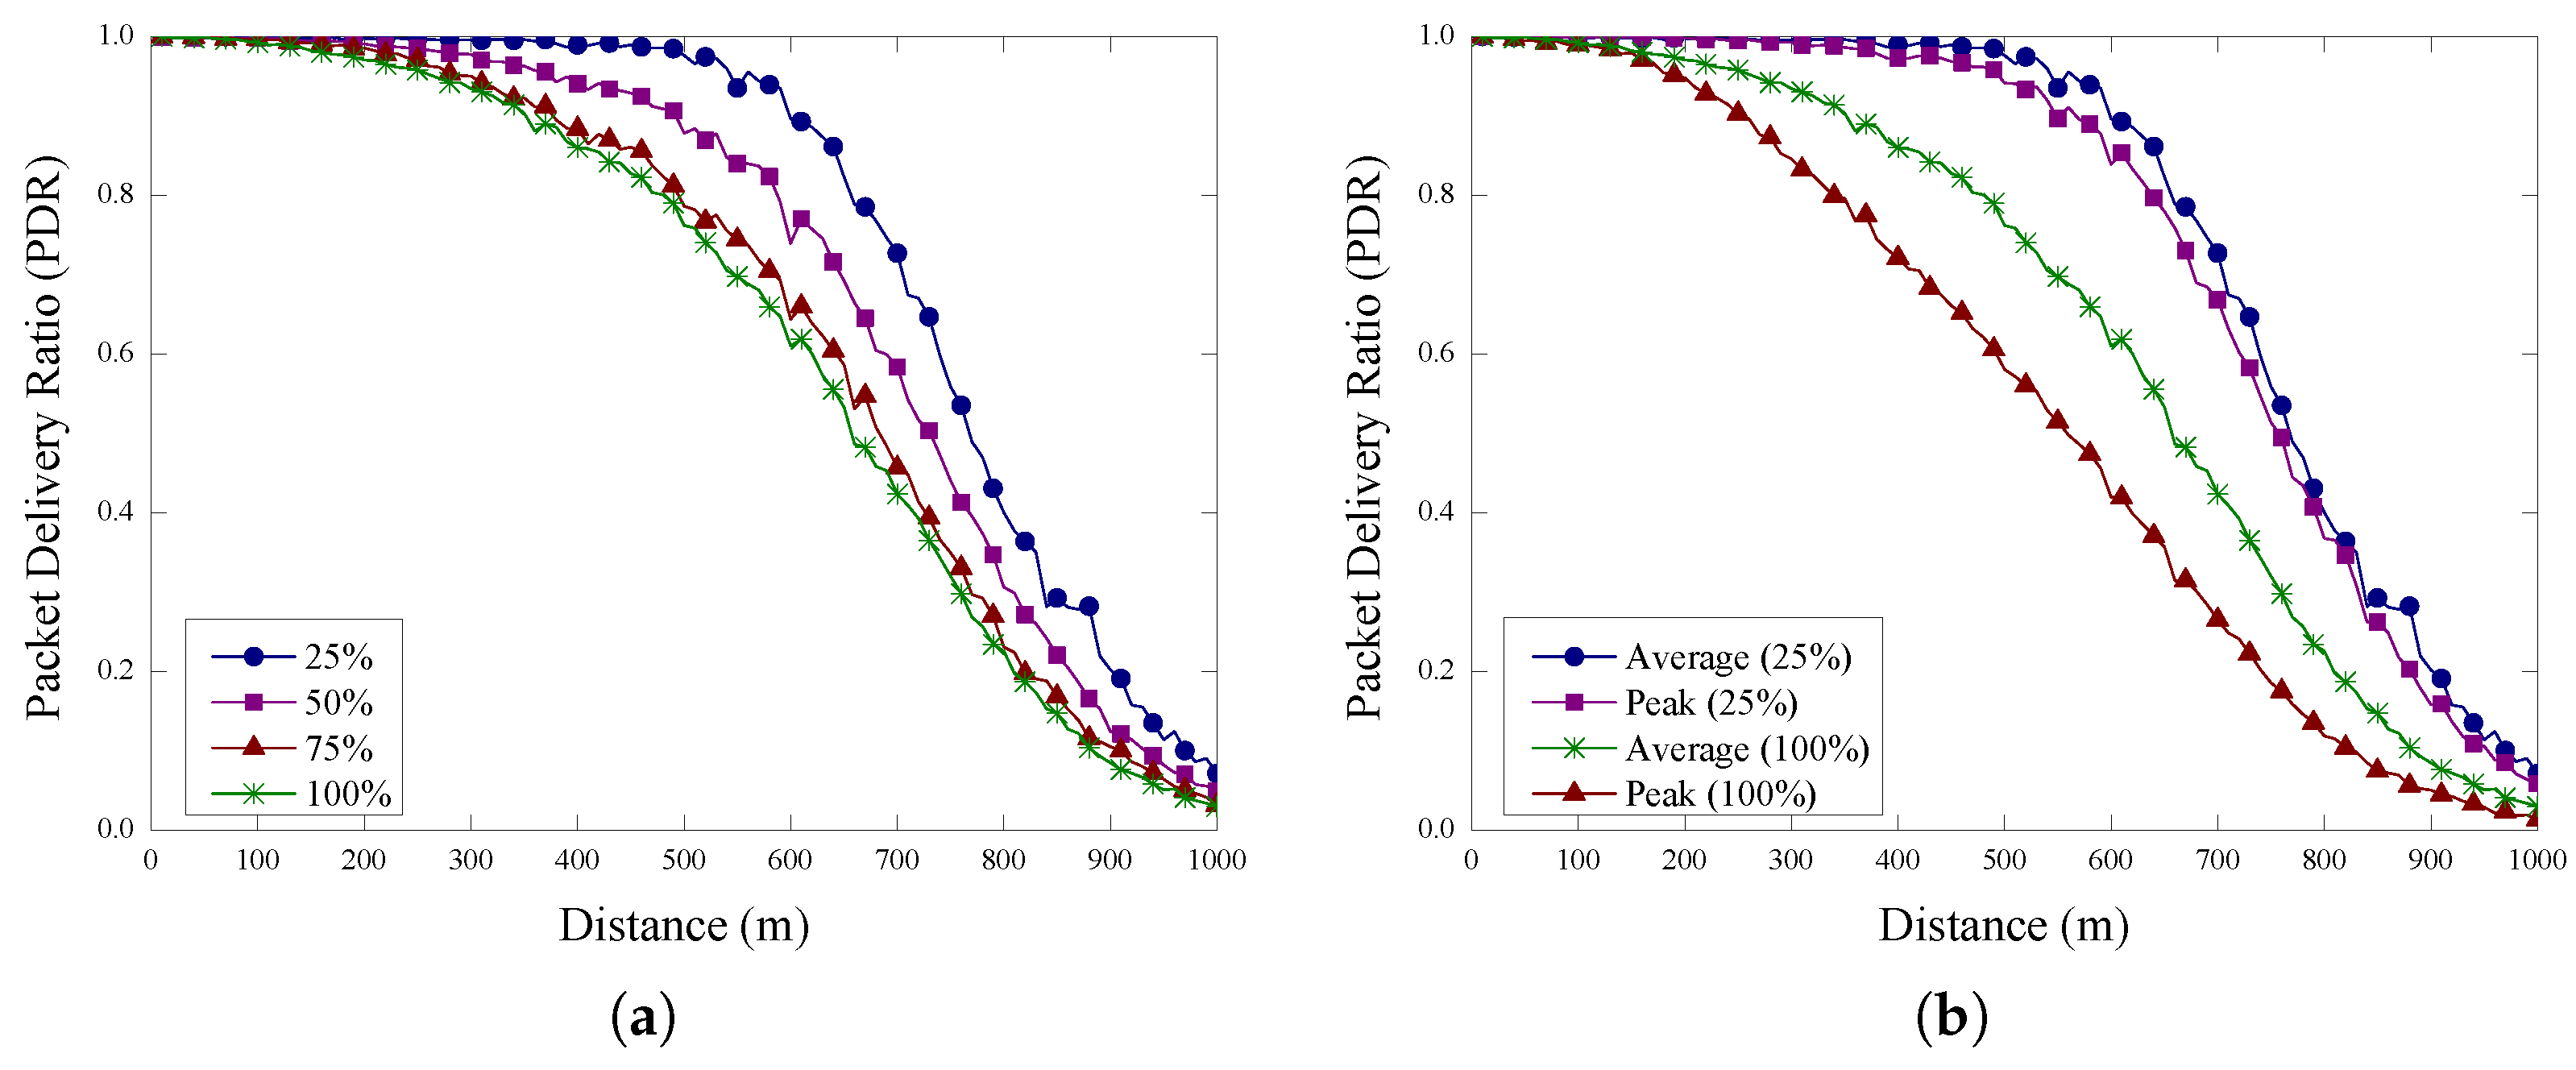
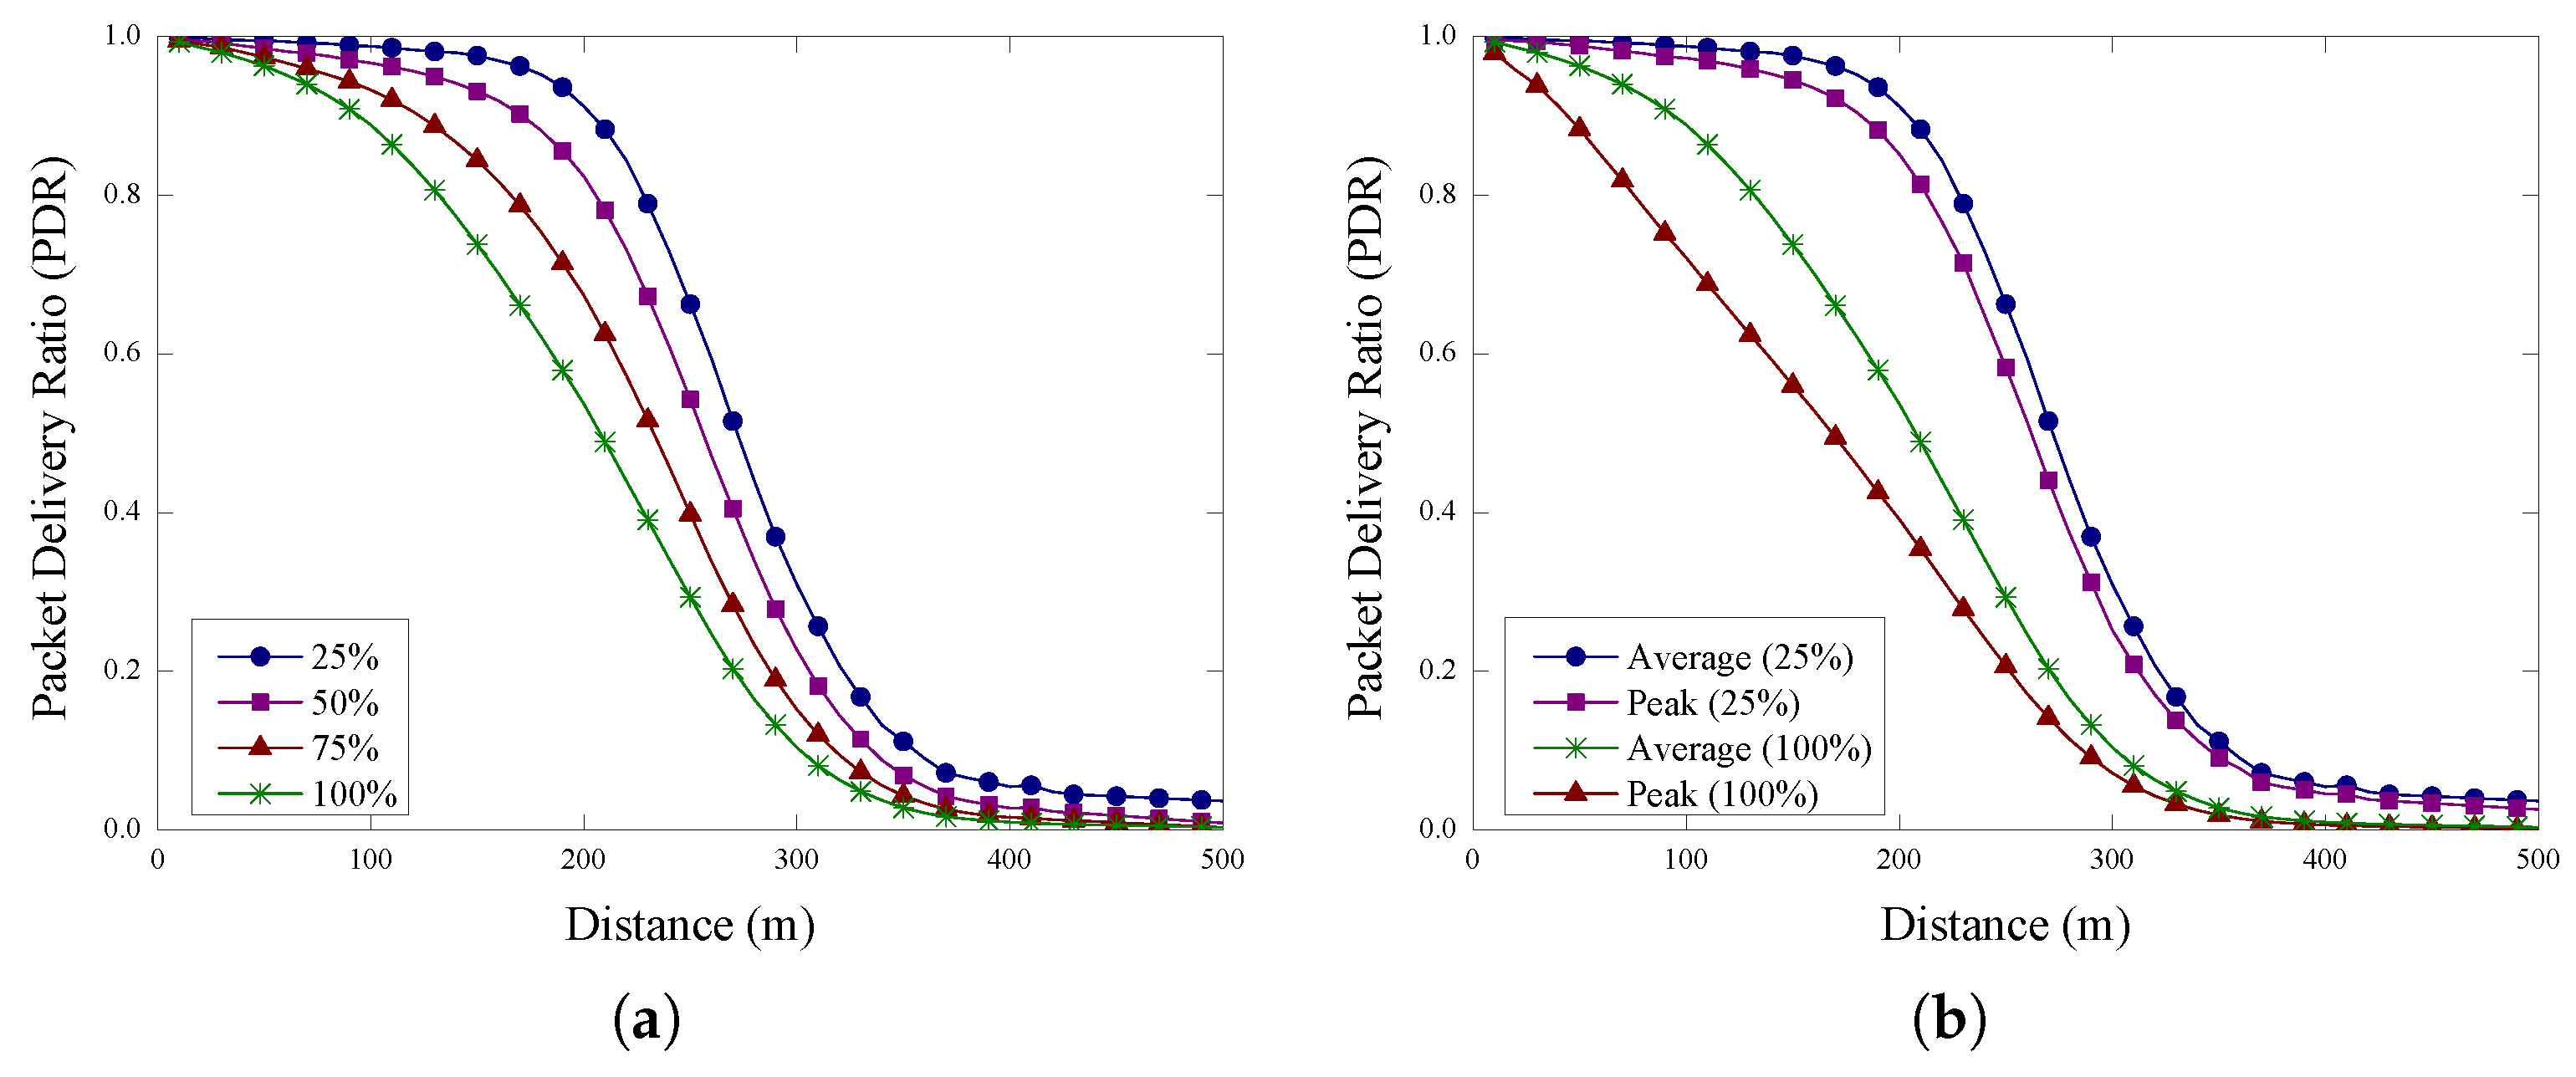
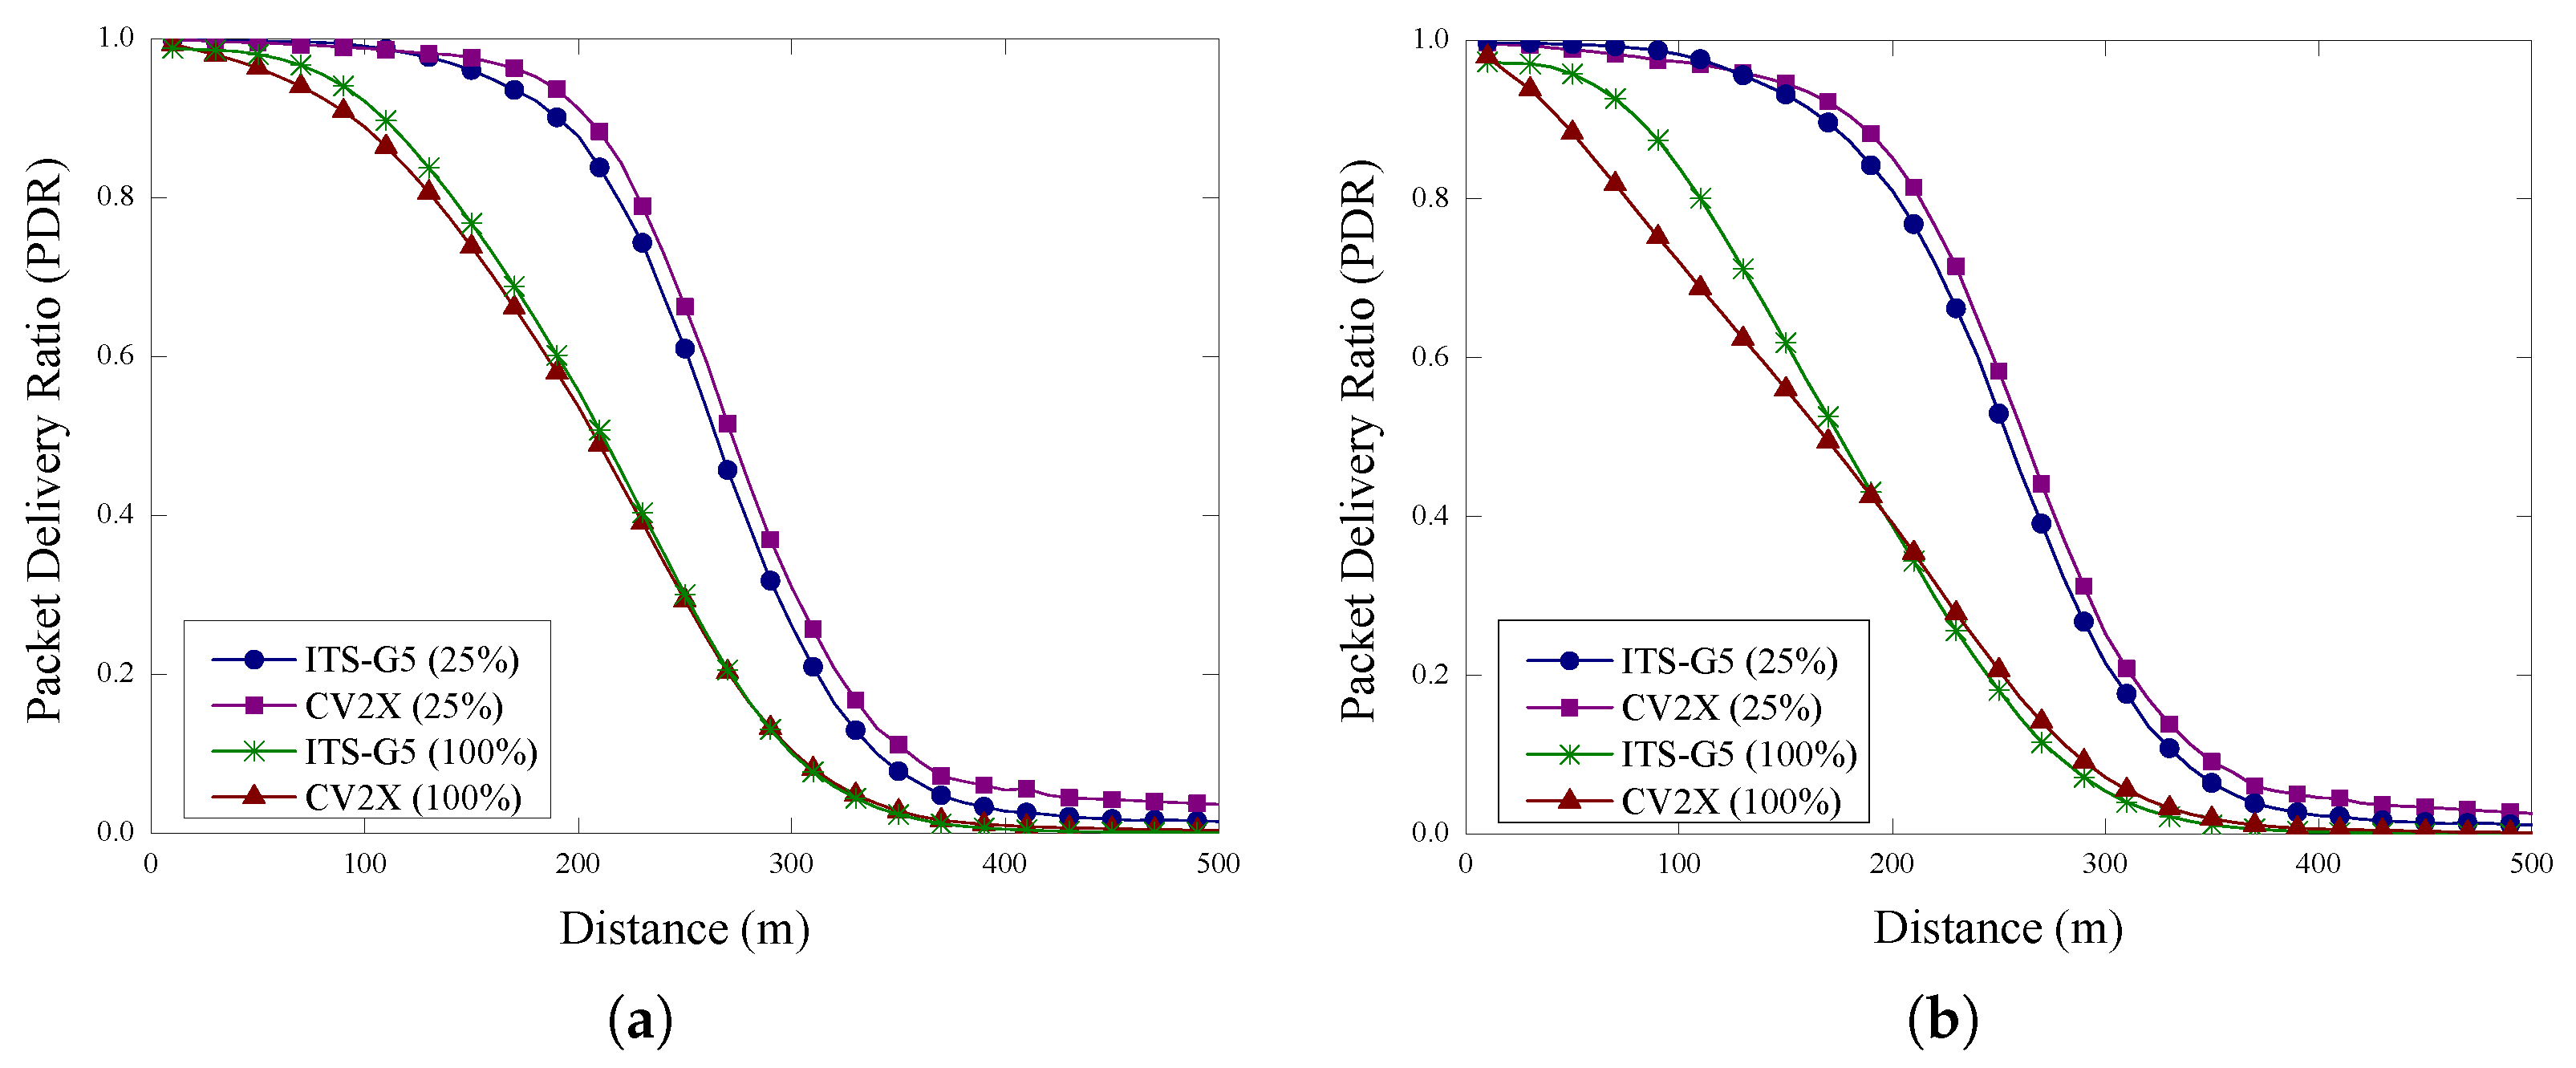
  • Packet Delivery Ratio (PDR): PDR is the ratio of the number of packet successfully received by the receiver to the number of packet sent by the sender. Due to the broadcast nature of C-ITS messages, in this paper, the PDR is defined as the ratio of the number of OBUs that successfully received a data packet to the total number of OBUs within a given distance from the transmitter. This metric is crucial for evaluating the reliability of the communication link between the transmitter and receiver. A high PDR indicates that most packets are successfully delivered, which is vital for the effective functioning of V2X applications. PDR is measured with respect to varying distances between the transmitter and receiver to understand how distance impacts communication reliability.
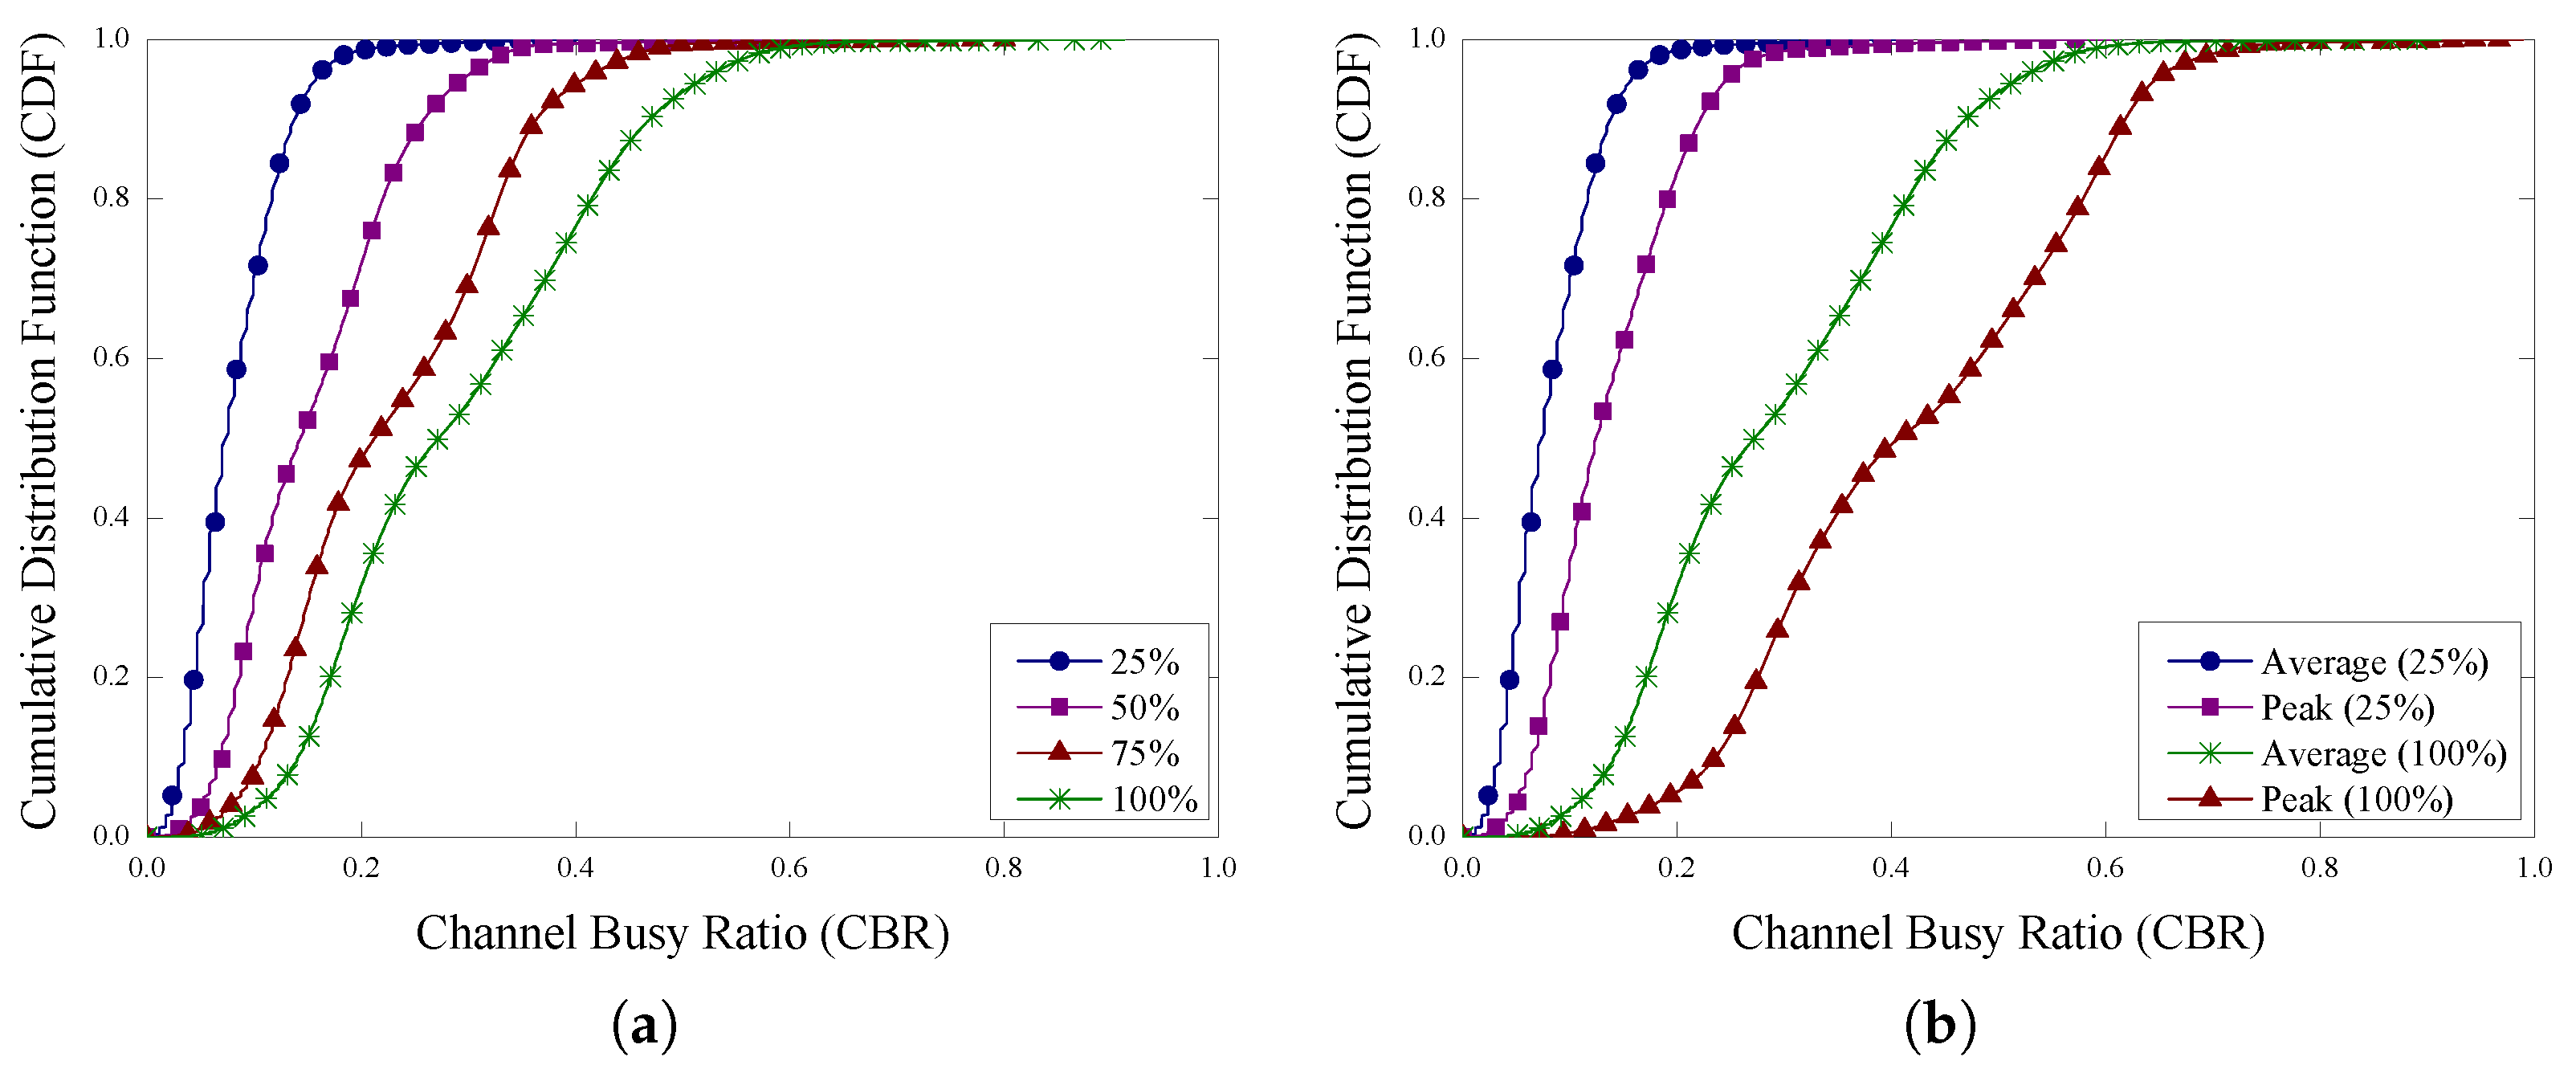
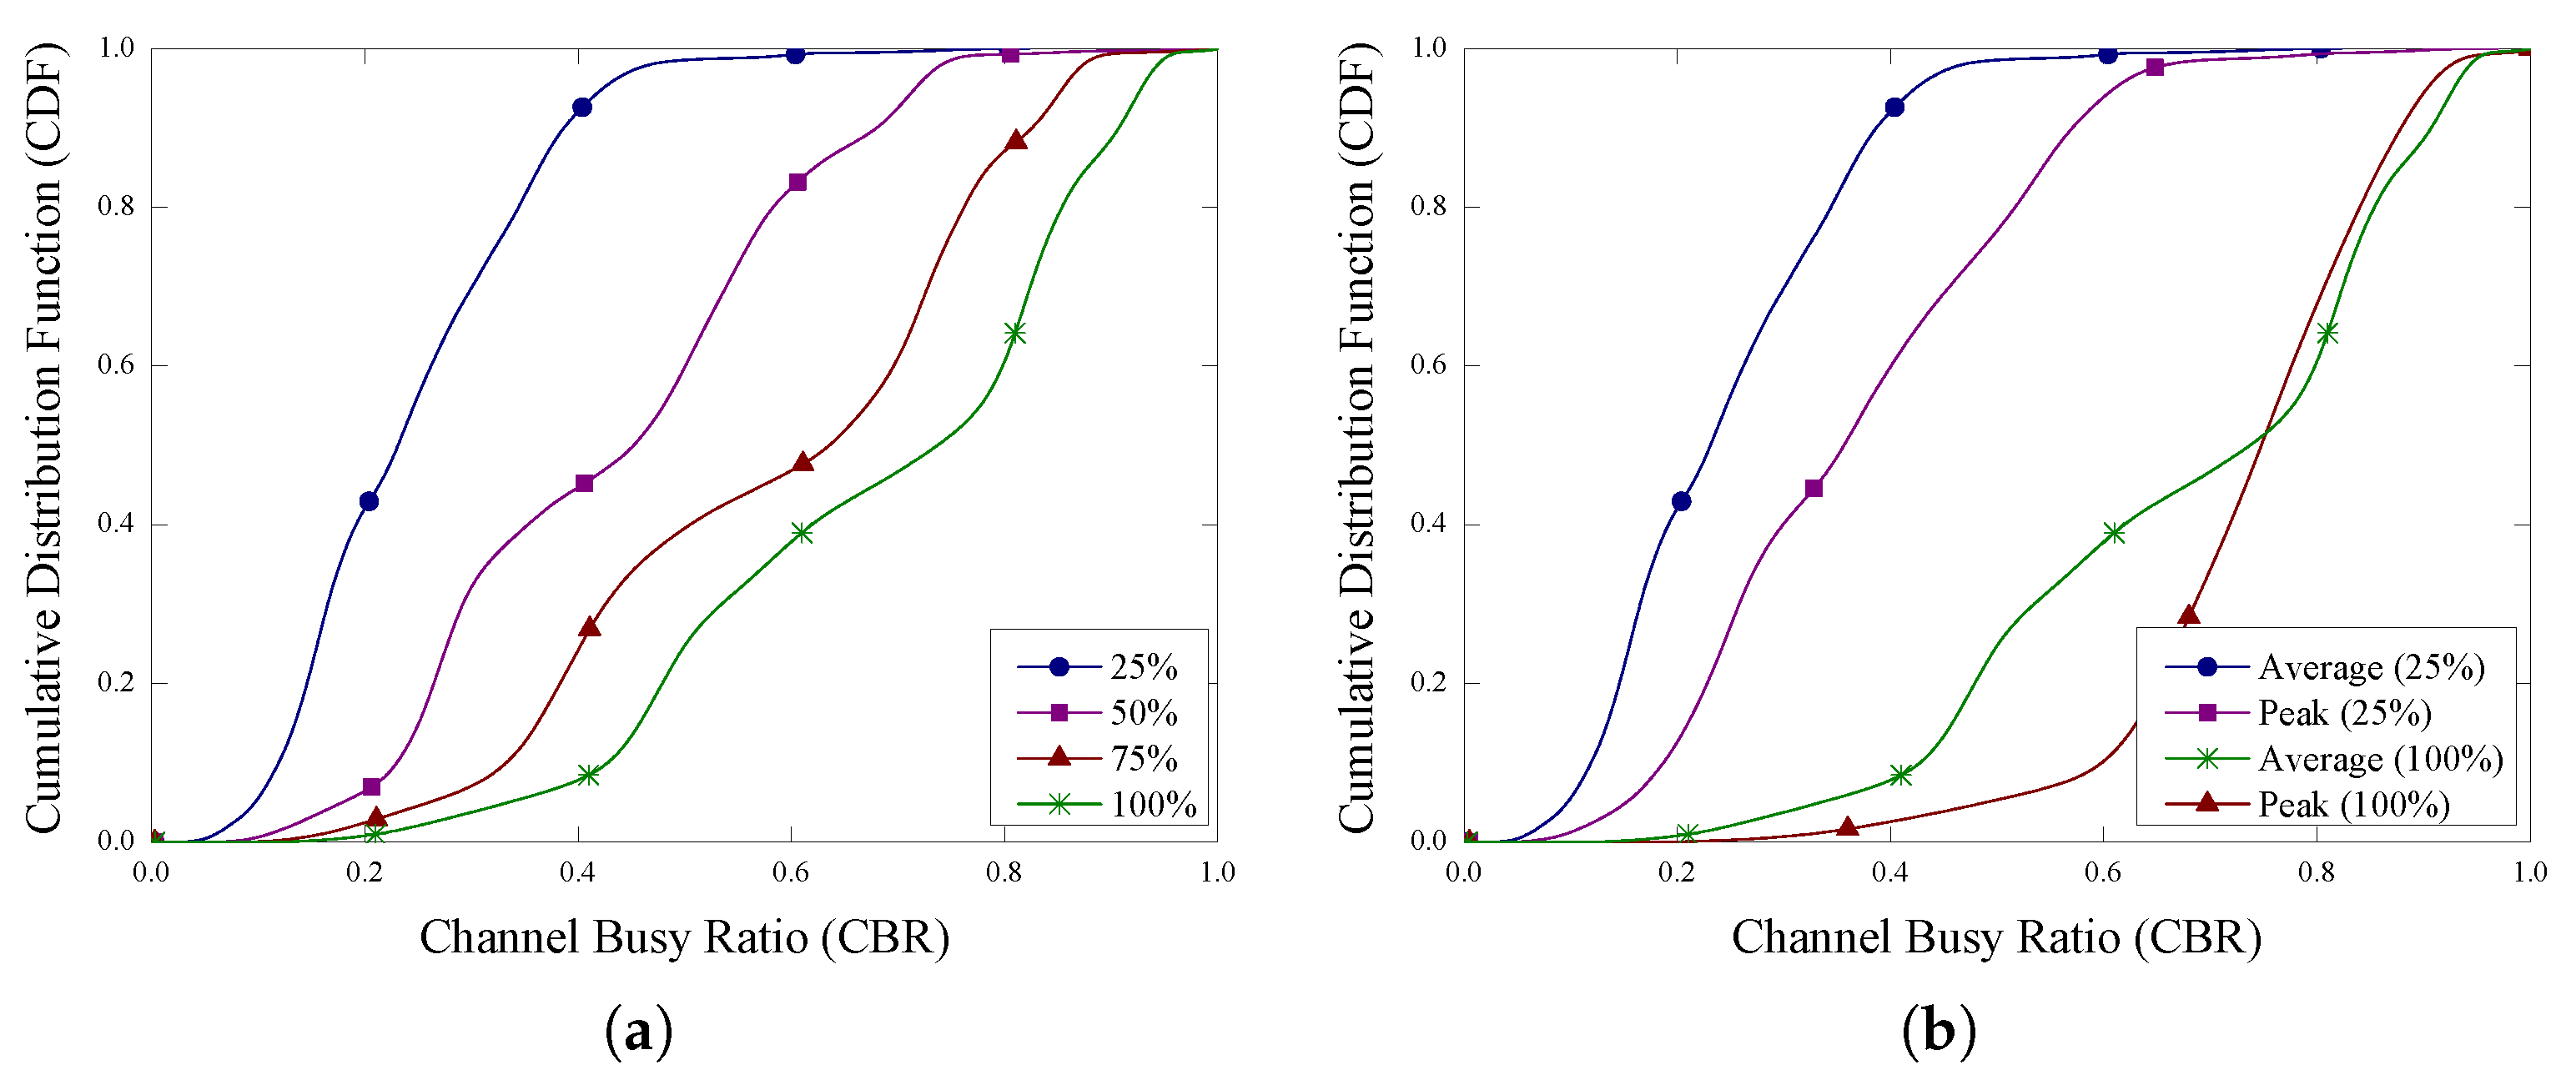
  • Channel Busy Ratio (CBR): The CBR represents the proportion of time that the communication channel is sensed as busy due to ongoing transmissions. This metric provides insight into channel utilization and congestion levels within the communication network. By plotting the Cumulative Distribution Function (CDF) of CBR, we can analyze the distribution and likelihood of various CBR values occurring within the network. A higher CBR indicates a higher level of channel occupancy, which can lead to increased packet collisions and reduced communication efficiency.
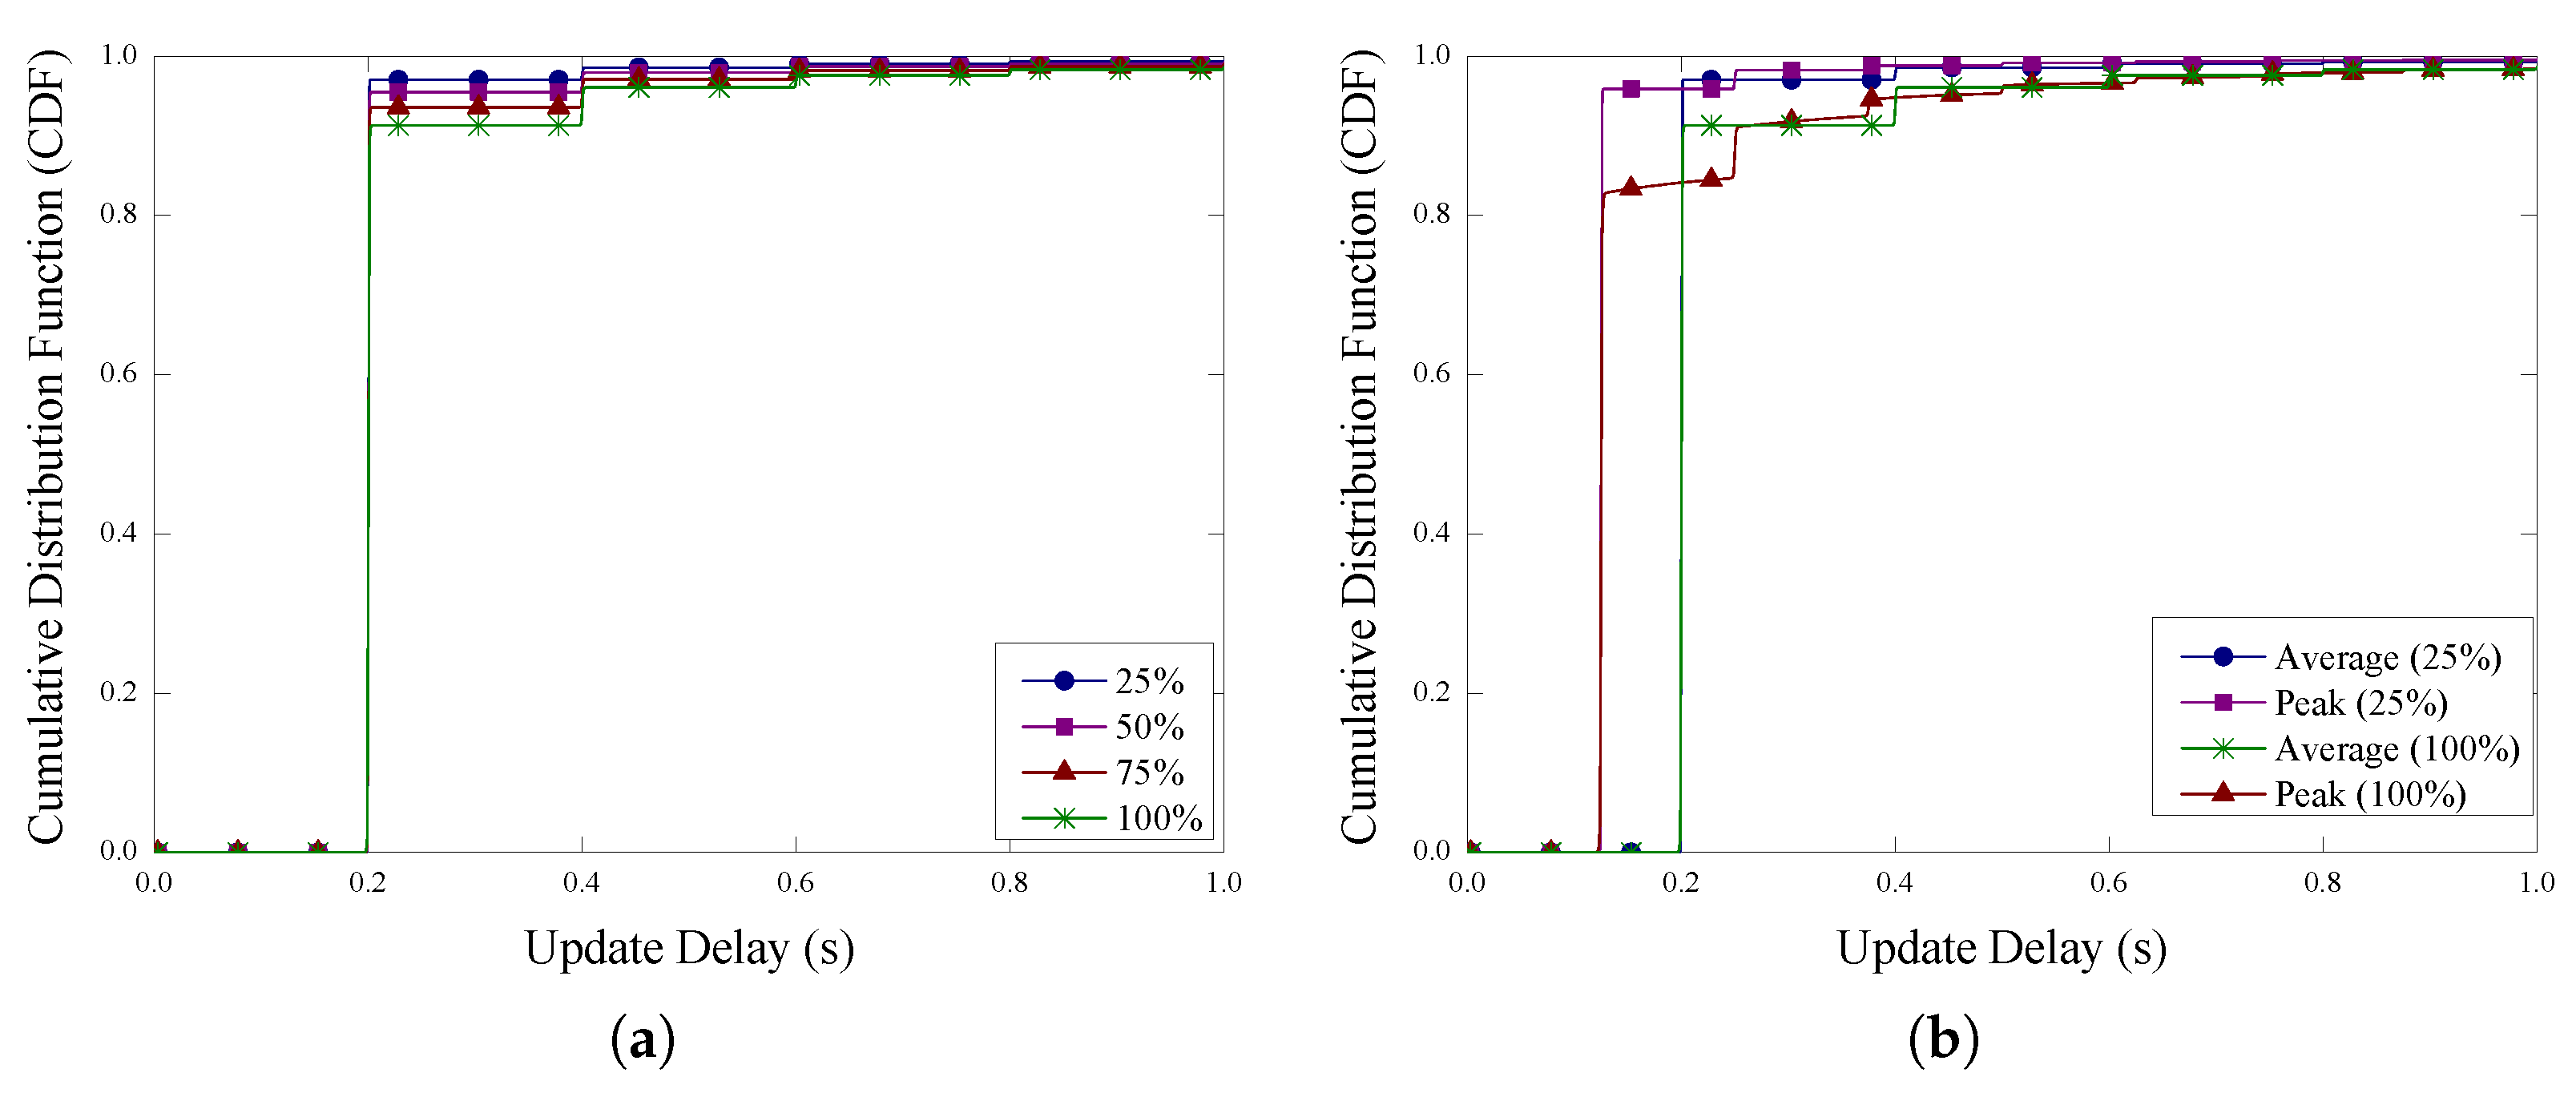
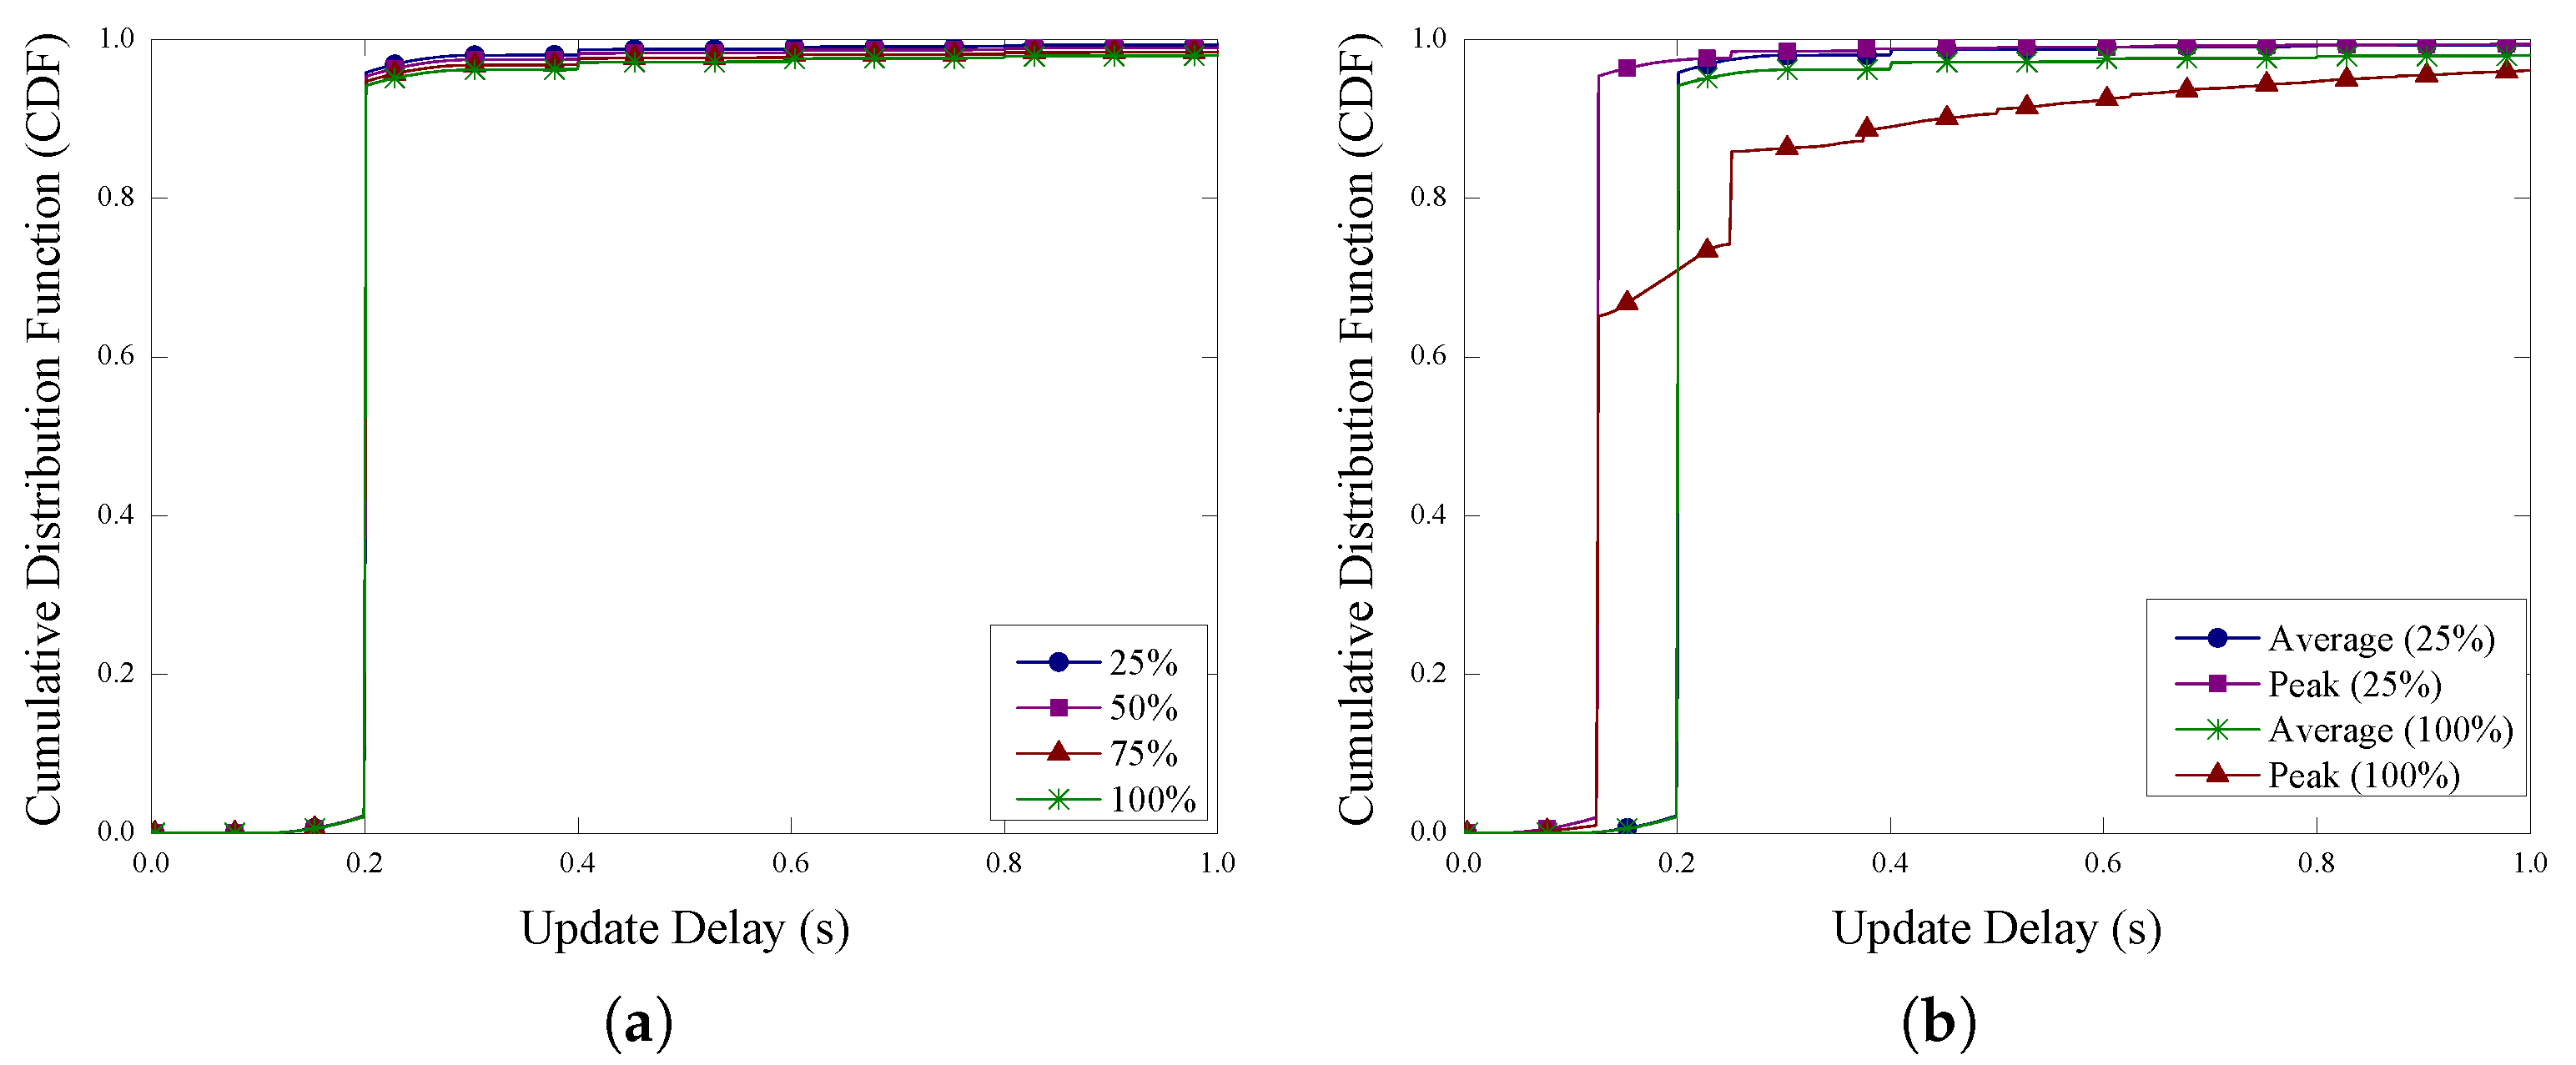
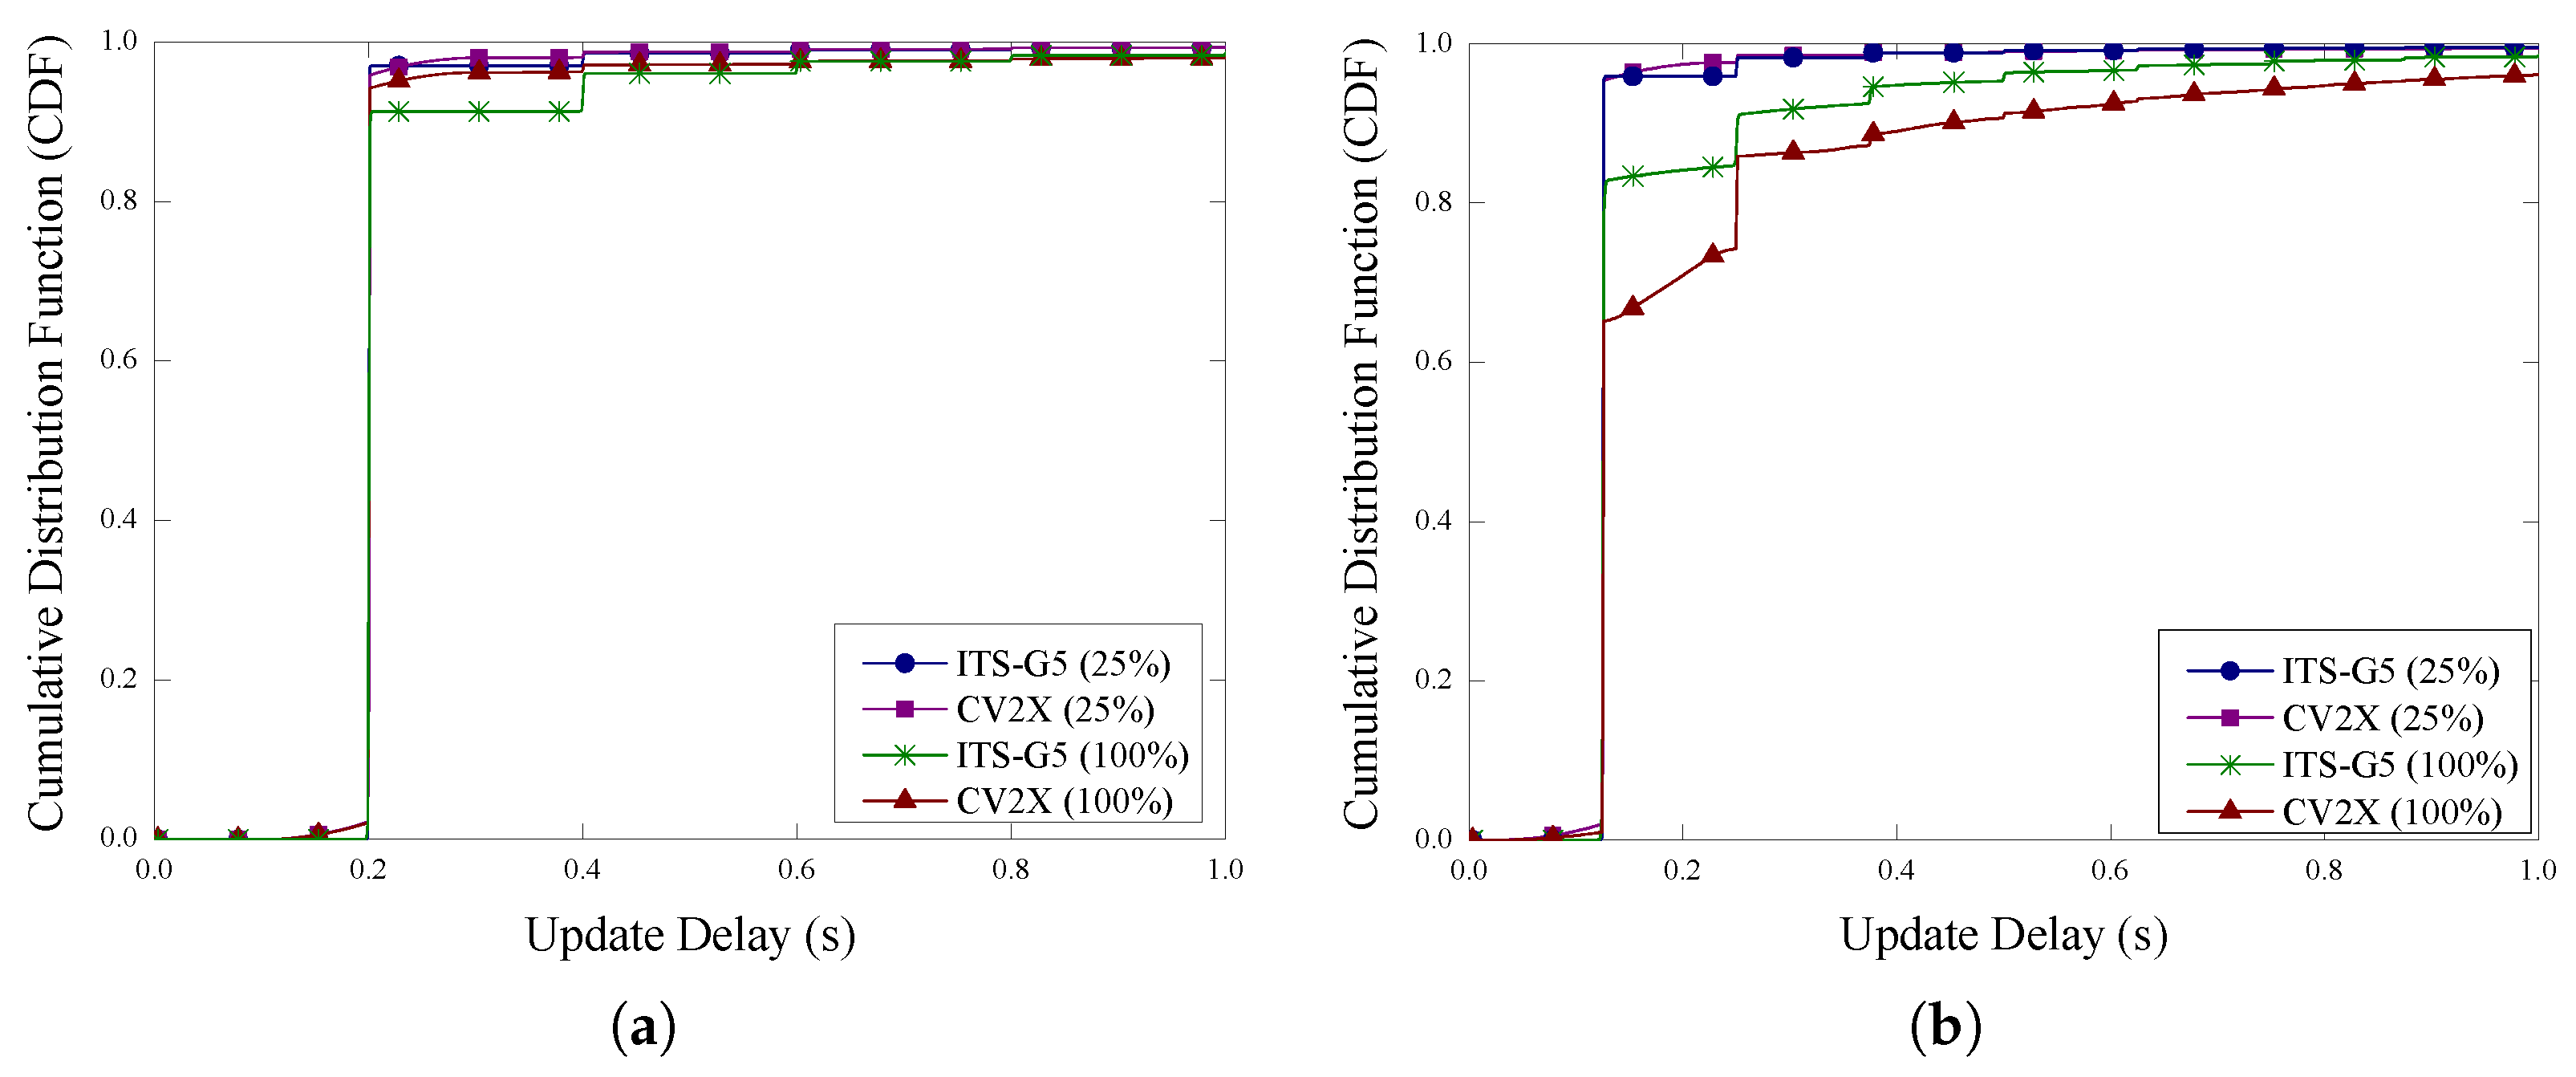
  • Update Delay: The update delay, also known as the inter-packet gap, is defined as the time interval between two consecutive successfully received data packets from the same transmitter within the selected region of interest. This metric is crucial for time-sensitive V2X applications that rely on timely information for decision-making. The CDF of the update delay is plotted to understand the distribution of delay values for different scenarios. A lower update delay indicates faster message update, which is essential for traffic safety applications such as collision avoidance.

4. Results and Discussion

In this section, we present and analyze the simulation results for both ITS-G5 and C-V2X technologies under various traffic conditions and MPRs.

4.1. ITS-G5 Evaluation

Figure 4 shows the PDR performance of ITS-G5, with Figure 4a illustrating the impact of varying MPR under average data traffic conditions and Figure 4b showing the impact of average and peak data traffic variations for 25% and 100% MPRs. While OBUs and RSUs transmit, PDR is measured at the OBUs only. From Figure 4a, it can be observed that the PDR remains above 90% when the transmitter–receiver distance is within 100 m for all MPRs. This level of PDR is crucial, as many advanced vehicular services require at least 90% PDR to function effectively [5]. However, as the distance increases, the PDR declines due to a decrease in the received signal strength, which is a result of increased path loss [22]. The PDR drops below 20% when the distance exceeds 300 m. Additionally, we note that when the MPR is 25%, a 90% PDR can be maintained up to a distance of 200 m. However, this performance degrades with higher MPRs. For instance, at a distance of 200 m, the PDR drops by over 50% when the MPR increases from 25% to 100%. This decrease is expected, as a higher MPR leads to an increased number of OBUs, which results in more data packet collisions at the receiving vehicles. These collisions are primarily caused by the well-known hidden node problem, i.e., OBUs that are unaware of ongoing transmissions. In Figure 4, we examine the impact of varying data traffic levels on PDR performance. There is a noticeable drop in PDR when the system operates under peak data traffic conditions compared to average data traffic conditions. This decline is particularly significant (a 20% drop at a distance of 200 m) when the MPR is very high. The peak data traffic scenario involves OBUs and RSUs transmitting at higher rates than in the average data traffic scenario, which increases the likelihood of data packet collisions.
Figure 5 presents the CDF of the CBR for the ITS-G5 vehicular network. Figure 5a illustrates the impact of varying MPRs for the average data traffic scenario. In ITS-G5 networks, the CBR calculation considers the occupancy of the entire 10 MHz channel due to its spectrum allocation scheme. It can be observed that the CBR increases with higher MPRs. This is due to the increased number of OBUs, which leads to a higher number of transmissions and thus greater channel occupancy. For instance, a maximum channel occupancy of 20% is observed at a 25% MPR, whereas the CBR can reach up to 60% at a 100% MPR. Figure 5b shows the impact of data traffic on CBR. Under peak data traffic conditions, the CBR increases due to the higher transmission rates from the OBUs. For example, at 100% MPR, the maximum CBR of 60% under the average data traffic scenario can rise to 75% under peak data traffic conditions. This indicates that higher data traffic levels exacerbate channel congestion, further increasing the CBR.
We now present the update delay performance of ITS-G5 vehicular networks, considering the receiving vehicle is within a region of interest of 200 m. For the average traffic scenario as illustrated in Figure 6a, over 85% of the cases show an update delay of around 200 ms, which corresponds to the average packet generation interval in this scenario. Additionally, we observe a few instances with update delays of 400 ms and 600 ms, which result from single and two consecutive packet losses, respectively. As expected, these occur more frequently when MPR increases. Figure 6b shows the impact of data traffic on the update delay. In the peak traffic scenario, packets are generated at an average interval of 142 ms. Consequently, the majority of cases exhibit an update delay of 142 ms. However, the CDF value at the packet generation interval for the peak scenario is lower than that for the average scenario. This discrepancy is due to higher packet loss observed in the peak scenario, which delays the reception of the next successful packet after a successful reception.
We also present the PDR results for ITS-G5 RSUs, where both OBUs and RSUs act as transmitters, but the results are only plotted from the perspective of the RSU receivers. Figure 7a,b show the PDR performance when varying MPRs and data traffic, respectively. The overall behavior of these plots is similar to the PDR results presented in Figure 4. Specifically, increases in MPR and data traffic lead to a decrease in PDR performance. However, compared to the OBUs, we observe a significant increase in coverage for RSUs. For example, a PDR of 90% is achievable up to a distance of 400 m for any penetration rate under average data traffic conditions, whereas this is only 100 m for OBUs. This increase in coverage for RSUs is attributed to their higher antenna height, which results in less path loss compared to the OBU scenario. The elevated position of RSUs reduces signal obstructions and enhances communication reliability, thereby extending the effective range of data packet reception.

4.2. C-V2X Evaluation

Figure 8 presents the PDR performance of C-V2X vehicular networks. Similar to ITS-G5, Figure 8a illustrates the impact of varying MPRs under average data traffic conditions, while Figure 8b shows the impact of average and peak data traffic variations. From Figure 8a, we observe that the PDR remains above 90% within a 100 m transmitter–receiver distance for all MPRs, and as the distance increases, the PDR declines due to the increased path loss, similar to the behavior observed in ITS-G5 networks in Figure 4a. The PDR drops below 20% when the distance exceeds 300 m. Additionally, higher MPR leads to a more significant drop in PDR, with substantial performance degradation observed when the MPR increases from 25% to 100%. Figure 8b shows a noticeable drop in PDR under peak data traffic conditions compared to average data traffic conditions, particularly at high MPR. This behavior is similar to the observations for ITS-G5 networks in Figure 4b. The increased transmission rates in peak traffic scenarios elevate the probability of data packet collisions, resulting in lower PDR. A detailed comparison between the performance of ITS-G5 and C-V2X vehicular networks is provided in the following subsection.
Figure 9 presents the CDF of the CBR for C-V2X vehicular networks. Figure 9a illustrates the impact of varying penetration rates under an average data traffic scenario, while Figure 9b shows the impact of varying data traffic conditions. Similar to the behavior observed in Figure 5 for ITS-G5 networks, the CBR increases with higher penetration rates and higher data traffic levels in C-V2X networks. It is important to note that the way in which CBR is calculated in C-V2X differs from ITS-G5. In ITS-G5, the CBR calculation considers the occupancy of the entire 10 MHz channel. In contrast, the CBR calculation in C-V2X considers the occupancy of the candidate sub-channels (part of the 10 MHz channel) used for data packet transmission. Despite this difference, the trend is similar: higher penetration rates and increased data traffic lead to higher CBR values, reflecting greater channel congestion in both technologies.
We now present the update delay performance of C-V2X vehicular networks, considering the receiving vehicle is within a region of interest of 200 m. For the average traffic scenario, as illustrated in Figure 10a, the behavior is similar to that observed in Figure 5a for ITS-G5 networks. Over 85% of the cases show an update delay around the average packet generation interval of 200 ms. Instances of update delays of 400 ms and 600 ms are observed due to single and two consecutive packet losses, respectively. Figure 10b shows the impact of data traffic on the update delay for C-V2X networks. In the peak traffic scenario, packets are generated at an average interval of 142 ms. The majority of cases exhibit an update delay of 142 ms, similar to the pattern seen in Figure 6b for ITS-G5. However, the CDF value at the packet generation interval is lower in the peak scenario compared to the average scenario. This is due to higher packet loss rates in the peak scenario, which cause delays in receiving the next successful packet after a successful reception.

4.3. Performance Comparison of ITS-G5 vs. C-V2X

In this subsection, we derive a comprehensive performance comparison between ITS-G5 and C-V2X networks based on PDR and update delay metrics. Overall, we observe that both technologies exhibit similar performance characteristics, with each having slight advantages under specific conditions. In Figure 11, we present a comparison of PDR performance between ITS-G5 and C-V2X vehicular networks. Figure 11a,b show this comparison under average and peak data traffic scenarios, respectively, with penetration rates of 25% and 100%. At short distances, ITS-G5 performs slightly better than C-V2X, as C-V2X suffers from higher packet collisions at high traffic densities. These collisions are caused by reselections that are part of the sensing-based Semi-Persistent Scheduling (SPS) scheme, occurring when multiple vehicles select new sub-channels around the same time. However, C-V2X slightly outperforms ITS-G5 at medium and longer distances due to its superior physical layer. The advanced Modulation and Coding Schemes in C-V2X provide better signal quality and robustness over longer distances compared to ITS-G5 [10]. Figure 12 presents a performance comparison of update delay between ITS-G5 and C-V2X networks. We observe that ITS-G5 performs slightly better than C-V2X in terms of update delay as indicated by a better CDF value at 200 ms, for higher MPR. This performance is consistent with the earlier observation that ITS-G5 performs better at short distances as observed in the PDR results.

5. Conclusions

This article provides a comprehensive comparison of the two existing technologies, ITS-G5 and C-V2X, for implementing C-ITS services on a busy Irish motorway. The comparison was conducted with a discrete event simulation model incorporating realistic models for road topology, vehicular traffic density and mobility. The performance of both technologies was evaluated considering different market penetration rates and data traffic.
The results indicate that both technologies show limited performance at higher market penetration rates, as each vehicle then represents an additional transmitter source, competing for the radio channel and contributing to channel load. V2V applications are limited to the context of deploying Day 1 advisory services. However, this is not considered a limiting factor for either technology and will only exhibit drawbacks in high-density traffic situations where the number of equipped vehicles exceeds 25%. The simulation results also show that the coverage of RSUs is much larger than that of OBUs, due to their elevated position, which benefits the I2V/V2I applications compared to V2V in terms of communication performance. We observe that both ITS-G5 and C-V2X communication technologies demonstrate, for the most part, negligible differences in performance to support Day 1 C-ITS services on the Irish motorway network. However, ITS-G5 shows a slight advantage at shorter distances, while C-V2X performs somewhat better at medium to longer distances due to its technology. In the future, we will extend this work for NR-V2X in both motorway and urban scenarios. It should also be observed that the advent of alternative radio technologies including 5G/6G V2N2V, mmwave and visible light communications (VLC) need further study as well as analysis as to how multiple radios can be leveraged to add redundancy, especially for safety-related use cases.

Author Contributions

Conceptualisation: C.J.S., P.N., T.A., D.L.-K., A.O.; Methodology: M.N.-a.-R., C.J.S., P.N., S.N., A.O.; Software: A.H., M.N.-a.-R.; Validation: A.H., M.N.-a.-R.; Investigation: M.N.-a.-R., C.J.S., P.N., S.N., D.L.-K., A.O.; Data Curation: A.H., M.N.-a.-R.; Writing—original draft preparation: A.H., M.N.-a.-R., C.J.S., A.O.; Writing—review and editing: P.N., S.N., T.A., D.L.-K.; Supervision: M.N.-a.-R., C.J.S., A.O.; Project Administration: M.N.-a.-R., C.J.S., T.A., D.L.-K., A.O.; Funding Acquisition: C.J.S., A.O. All authors have read and agreed to the published version of the manuscript.

Funding

This publication has emanated from research conducted with the financial support of Research Ireland under Grant number 18/SP/5942. For Open Access purposes, the author has applied a CC BY public copyright licence to any Author Accepted Manuscript version arising from this submission.

Institutional Review Board Statement

Not applicable.

Informed Consent Statement

Not applicable.

Data Availability Statement

The original contributions presented in this study are included in the article. Further inquiries can be directed to the corresponding author(s).

Conflicts of Interest

Author Piraba Navaratnam, Shobanraj Navaratnarajah and Thomas Allen are employed by the AECOM Ltd. The remaining authors declare that the research was conducted in the absence of any commercial or financial relationships that could be construed as a potential conflict of interest.

References

  1. Noor-A-Rahim, M.; Ali, G.M.N.; Guan, Y.L.; Ayalew, B.; Chong, P.H.J.; Pesch, D. Broadcast performance analysis and improvements of the LTE-V2V autonomous mode at road intersection. IEEE Trans. Veh. Technol. 2019, 68, 9359–9369. [Google Scholar] [CrossRef]
  2. World Health Organization (WHO). Available online: https://www.who.int/news-room/fact-sheets/detail/road-traffic-injuries/ (accessed on 2 December 2024).
  3. Moradi-Pari, E.; Tian, D.; Bahramgiri, M.; Rajab, S.; Bai, S. DSRC versus LTE-V2X: Empirical performance analysis of direct vehicular communication technologies. IEEE Trans. Intell. Transp. Syst. 2023, 24, 4889–4903. [Google Scholar] [CrossRef]
  4. Balador, A.; Cinque, E.; Pratesi, M.; Valentini, F.; Bai, C.; Gómez, A.A.; Mohammadi, M. Survey on decentralized congestion control methods for vehicular communication. Veh. Commun. 2022, 33, 100394. [Google Scholar] [CrossRef]
  5. Seo, H.; Lee, K.D.; Yasukawa, S.; Peng, Y.; Sartori, P. LTE evolution for vehicle-to-everything services. IEEE Commun. Mag. 2016, 54, 22–28. [Google Scholar] [CrossRef]
  6. Noor-A-Rahim, M.; Ali, G.M.N.; Nguyen, H.; Guan, Y.L. Performance analysis of IEEE 802.11p safety message broadcast with and without relaying at road intersection. IEEE Access 2018, 6, 23786–23799. [Google Scholar] [CrossRef]
  7. Molina-Masegosa, R.; Gozalvez, J. LTE-V for sidelink 5G V2X vehicular communications: A new 5G technology for short-range vehicle-to-everything communications. IEEE Veh. Technol. Mag. 2017, 12, 30–39. [Google Scholar] [CrossRef]
  8. Nguyen, H.; Xiaoli, X.; Noor-A-Rahim, M.; Guan, Y.L.; Pesch, D.; Li, H.; Filippi, A. Impact of big vehicle shadowing on vehicle-to-vehicle communications. IEEE Trans. Veh. Technol. 2020, 69, 6902–6915. [Google Scholar] [CrossRef]
  9. Ansari, K. Joint use of DSRC and C-V2X for V2X communications in the 5.9 GHz ITS band. IET Intell. Transp. Syst. 2021, 15, 213–224. [Google Scholar] [CrossRef]
  10. Molina-Masegosa, R.; Gozalvez, J.; Sepulcre, M. Comparison of IEEE 802.11p and LTE-V2X: An evaluation with periodic and aperiodic messages of constant and variable size. IEEE Access 2020, 8, 121526–121548. [Google Scholar] [CrossRef]
  11. Karthikeyan, K.; Parthipan, V.; Niranjana, M.I.; Prithvi, D.; Franklin, N.R.; Kaviarasu, N. Enhancing Vehicular Communication Efficiency Through DSRC and LTE-V2X Integration. In Proceedings of the 2024 International Conference on Science Technology Engineering and Management (ICSTEM), Coimbatore, India, 26–27 April 2024; IEEE: New York, NY, USA, 2024; pp. 1–6. [Google Scholar]
  12. Bazzi, A.; Bartoletti, S.; Zanella, A.; Martinez, V. Performance analysis of IEEE 802.11p preamble insertion in C-V2X sidelink signals for co-channel coexistence. Veh. Commun. 2024, 45, 100710. [Google Scholar] [CrossRef]
  13. Navaratnarajah, S.; Navaratnam, P.; Laoide-Kemp, D. On the Capacity of Roadside Communication Networks for Supporting the Delivery of Emerging C-ITS Services. In Proceedings of the Transport Research Arena (TRA) Conference, Dublin, Ireland, 15–18 April 2024; pp. 1–6. [Google Scholar]
  14. 3rd Generation Partnership Project; Technical Specification Group Services and System Aspects; Security Aspect for LTE Support of Vehicle-to-Everything (V2X) Services (Release 14). 2017. Available online: https://www.etsi.org/deliver/etsi_ts/133100_133199/133185/14.01.00_60/ts_133185v140100p.pdf (accessed on 1 June 2025).
  15. Ireland, T.I. Ireland’s National Cooperative ITS (C-ITS) Pilot. Available online: https://www.tii.ie/en/technical-services/research/c-its/ (accessed on 2 December 2024).
  16. V2X-SUMO Documentation. Available online: https://sumo.dlr.de/docs/Topics/V2X.html (accessed on 2 December 2024).
  17. Transport Infrastructure Ireland-Data Portal. Available online: https://data.tii.ie/ (accessed on 2 December 2024).
  18. Guériau, M.; Dusparic, I. Quantifying the impact of connected and autonomous vehicles on traffic efficiency and safety in mixed traffic. In Proceedings of the 2020 IEEE 23rd International Conference on Intelligent Transportation Systems (ITSC), Rhodes, Greece, 20–23 September 2020; IEEE: New York, NY, USA, 2020; pp. 1–8. [Google Scholar]
  19. Todisco, V.; Bartoletti, S.; Campolo, C.; Molinaro, A.; Berthet, A.O.; Bazzi, A. Performance analysis of sidelink 5G-V2X mode 2 through an open-source simulator. IEEE Access 2021, 9, 145648–145661. [Google Scholar] [CrossRef]
  20. WiLabV2XSim Source Code. Available online: https://github.com/V2Xgithub/WiLabV2Xsim (accessed on 2 December 2024).
  21. WINNER II Channel Models. IST-4-027756 WINNER II, D. 1. 1. 2 V1. 2 2007. Available online: https://www.researchgate.net/publication/261467821_CP5-026_WINNER_D53_v10_WINNER_Final_Channel_Models (accessed on 28 May 2021).
  22. Mangel, T.; Klemp, O.; Hartenstein, H. 5.9 GHz inter-vehicle communication at intersections: A validated non-line-of-sight path-loss and fading model. EURASIP J. Wirel. Commun. Netw. 2011, 2011, 182. [Google Scholar] [CrossRef]
Figure 1. C-Roads Ireland C-ITS pilot system architecture.
Information 16 00563 g001
Figure 2. A section of the Irish M50 motorway considered in the simulation. (a) Map view showing real-world RSU locations. (b) Corresponding SUMO view.
Information 16 00563 g002
Figure 3. Market penetration rate (MPR) vs. number of neighboring OBU-equipped vehicles within 300 m.
Information 16 00563 g003
Figure 4. PDR performance of ITS-G5 vehicular networks. (a) Impact of varying MPR. (b) Impact of data traffic.
Information 16 00563 g004
Figure 5. CBR performance of ITS-G5 vehicular networks. (a) Impact of varying MPR. (b) Impact of data traffic.
Information 16 00563 g005
Figure 6. Update delay performance of ITS-G5 vehicular networks. (a) Impact of varying MPR. (b) Impact of data traffic.
Information 16 00563 g006
Figure 7. PDR performance of RSUs in ITS-G5 vehicular networks. (a) Impact of varying MPR. (b) Impact of data traffic.
Information 16 00563 g007
Figure 8. PDR performance of C-V2X vehicular networks. (a) Impact of varying MPR. (b) Impact of data traffic.
Information 16 00563 g008
Figure 9. CBR performance of C-V2X vehicular networks. (a) Impact of varying MPR. (b) Impact of data traffic.
Information 16 00563 g009
Figure 10. Update delay performance of C-V2X vehicular networks. (a) Impact of varying MPR. (b) Impact of data traffic.
Information 16 00563 g010
Figure 11. PDR performance comparison between ITS-G5 and C-V2X vehicular networks. (a) Average data traffic. (b) Peak data traffic.
Information 16 00563 g011
Figure 12. Update-delay performance comparison between ITS-G5 and C-V2X vehicular networks. (a) Average data traffic. (b) Peak data traffic.
Information 16 00563 g012
Table 1. Comparison of LTE-V Mode 4 vs. 802.11p/ITS-G5.
AspectLTE-V (C-V2X, PC5 Interface)ITS-G5 (IEEE 802.11p)
Standardization3GPP Rel-14IEEE 802.11p + ETSI ITS-G5/WAVE (US)
PHY LayerSC-FDMAOFDM (modified 802.11a)
MAC LayerSemi-persistent scheduling (SPS);
centralized (Mode 3) or autonomous (Mode 4)
CSMA/CA
(Carrier Sense Multiple Access
with Collision Avoidance)
Channel Access ModesMode 3: eNodeB-scheduled; Mode 4: autonomousDistributed only
Modulation SchemesQPSK, 16QAMBPSK, QPSK, 16QAM, 64QAM
Subcarrier Spacing15 kHz156.25 kHz (in 10 MHz channels, 64 subcarriers)
Frame Duration10 ms (1 ms subframes)Variable (based on packet size and contention)
SynchronizationSynchronized (GNSS or cellular timing)Asynchronous
Channel CodingTurbo codingConvolutional coding
MIMO SupportLimited/Optional in early releasesNot supported
Interference HandlingBetter (scheduling, SINR-based adaptation)Weaker (hidden node problem, contention issues)
Table 2. C-ITS applications in the Irish national C-ITS pilot [13].
Service CategoryC-ITS ApplicationsMessageTX ModesAssumed ϵ a
In Vehicle Information (IVI)In vehicle Dynamic Speed LimitIVIMI2V0.5
Other Signage InformationIVIMI2V0.5
Embedded VMS ‘Free Text’IVIMI2V0.5
Hazardous Location Notification (HLN)Stationary VehicleDENMI2V0.02
Slow VehicleDENMI2V0.02
Weather Condition WarningDENMI2V0.02
Traffic Jam Ahead WarningDENMI2V0.02
Emergency Electronic Brake LightDENMV2I, V2V0.02
Emergency Vehicle ApproachingIVIMV2I, V2V0.02
Road Works Warning (RWW)Lane Closure WaringDENMI2V0.05
Road Closure WarningDENMI2V0.05
Mobile Road Works WarningDENMI2V0.05
Point of Interest (POI)Electric Charging Stations InfoEVCSNI2V0.03
Probe vehicle Data (PVD)Vehicle Data CollectionCAMV2I, V2V1
Table 3. Mobility Parameters to model realistic vehicle-driving behavior.
ParameterCarTruck
Car-Following ModelKrauss
Speed Deviation (%)0.10.1
Time Headway (s)1.21.5
Min gap (m)2.52.5
Max accel. (m/s2)7.54
Deceleration (m/s2)97
Imperfection0.50.5
Lane-Changing ModelSUMO lane-changing model
Cooperation0.50.5
Anticipation0.50.5
Table 4. Communication model simulation parameters.
ParameterValue(s)Unit
Frequency Band5.9GHz
Bandwidth10MHz
Bit Rate6Mbps
Transmission Power23dBm
Antenna Gain3dBi
OBU Height1.5m
RSU Height8m
Pathloss modelWinner + B1
Small-scale fading3dB
Simulation Time90s
Penetration Rates25, 50, 75, 100%
Disclaimer/Publisher’s Note: The statements, opinions and data contained in all publications are solely those of the individual author(s) and contributor(s) and not of MDPI and/or the editor(s). MDPI and/or the editor(s) disclaim responsibility for any injury to people or property resulting from any ideas, methods, instructions or products referred to in the content.

