1. Introduction
Sentiment analysis, also known as opinion mining, is a form of natural language processing (NLP) that attempts to determine the underlying emotional tone of a passage of text. It has received considerable attention, with diverse applications in studying social media [
1,
2,
3,
4], consumer feedback [
5,
6,
7], film reviews [
8,
9], and political discourse [
10]. Traditional sentiment analysis approaches have successfully classified text as positive, negative, or neutral. However, there is a growing demand for more nuanced and fine-grained approaches to capture the subtle variations in emotions expressed by individuals.
Machine learning techniques are widely used to perform sentiment analysis, employing large annotated datasets and models to achieve impressive results. However, most existing methods rely on coarse-grained sentiment labels and overlook many complexities of human emotional responses. Two persistent challenges hinder progress. First, numeric sentiment scores derived from psycholinguistic lexicons are interpretable but notoriously brittle when confronted with context, informal language, or domain shift. Second, deep contextual models excel at capturing subtle linguistic cues, but they often require large, task-specific datasets to generalize reliably and offer little transparency regarding the role of explicit affective knowledge. Bridging this gap is of fundamental importance, especially in low-resource or culturally diverse settings where labeled data are scarce. This research paper proposes a novel approach that incorporates continuous psychometric scores into machine learning models.
The first objective of this study is to evaluate whether lexicon-based sentiment analysis can predict nuanced affective scores. Several lexicon-based approaches, such as SentiStrength [
1], Valence Aware Dictionary and Sentiment Reasoner (VADER) [
2], and SentiWordNet [
11,
12], can generate continuous sentiment scores. However, the lexicons available for low-resource languages are limited. Typically, either the texts are translated into English or English lexicons are translated into the relevant language before performing the analysis. Moreover, the existing lexicons were created using a combination of human annotators and machine learning. Their accuracy depends strongly on the quality of seed words or initial annotations, and errors in the initial set can propagate to the expanded lexicon. In addition, automated techniques may miss subtle nuances in sentiment, necessitating manual adjustments to improve the quality of the lexicon. Thus, to achieve the first objective, we propose another lexicon-based method to predict sentiment granularity within a short text. The lexicons contain emotion-laden words and were created using a psychometric instrument called the Self-Assessment Manikin (SAM) [
13], in which individuals self-evaluate their emotional response to stimuli using a dimensional approach, measuring the valence of emotions on a scale from 0 (extremely negative) to 9 (extremely positive). Although SAM has been applied extensively in psychology and affective computing, its potential for sentiment analysis remains largely unexplored.
The second objective of this study is to investigate whether a polarity score derived from the results of the first objective can serve as a useful feature for machine learning models to predict continuous sentiment labels. Recent work on hybrid approaches to sentiment analysis has yielded promising results [
3,
4,
5,
6,
7,
8,
9,
14,
15,
16]. However, machine and deep learning models still face challenges in distinguishing sentiment-bearing words and capturing fine-grained sentiment information, particularly in low-resource languages like Indonesian, for which large annotated corpora are scarce. In classical sentiment analysis, lexicon knowledge can compensate for limited training data [
17]. Therefore, we explore various mechanisms to incorporate lexicon-based polarity into models for fine-grained sentiment analysis. By including SAM valence scores in machine learning models, we aim to achieve a more nuanced analysis than conventional binary classification. The proposed methodology seeks to identify a spectrum of emotions, ranging from strongly negative to neutral to strongly positive, to provide a more nuanced understanding of the sentiments expressed in the textual content. We also evaluate the models’ explainability by computing the importance of the fused feature.
Our contribution is twofold. First, we extend the existing Indonesian version of Affective Norms for English Words (ANEW) by providing valence scores for 750 Indonesian words. ANEW is a database that provides ratings of valence, arousal, and dominance for a large set of English words [
18]. The Indonesian version of ANEW, which was introduced in [
19], contains 1490 Indonesian words. Another lexicon called Indonesian Valence and Arousal Words (IVAW) [
20] has 1024 words, which are direct translations of the English words in ANEW. These were both developed through extensive psycholinguistic experiments in which human participants assessed the emotional characteristics of a list of words.
Second, we investigate the importance of the polarity score derived from lexicon-based sentiment analysis as an additional input to textual features for various machine learning algorithms, including recent deep learning approaches such as recurrent neural network (RNN) and transformer-based architectures, in performing fine-grained sentiment analysis. Transformer-based models, such as Bidirectional Encoder Representations from Transformers (BERT) and its family, represent the state of the art in text classification tasks [
21,
22], including sentiment analysis. We seek to implement and assess multiple methods for combining text-derived features with scalar lexicon-based polarity, such as simple concatenation and element-wise gated fusion, to improve the performance of these models further.
The structure of the remainder of this paper is as follows:
Section 2 provides an overview of related work and various sentiment analysis techniques.
Section 3 describes the methodology and experimental setup used to evaluate the proposed approach.
Section 4 presents the results, which are discussed in
Section 5.
Section 6 summarizes the findings, highlights this study’s contributions, and outlines potential future research directions.
Author Contributions
Conceptualization, T.S., H.S. and L.P.M.; methodology, H.S. and L.P.M.; software, A.D. and L.P.M.; validation, L.P.M. and A.D.; formal analysis, A.D. and L.P.M.; data curation, T.S., R.N.P. and H.S.; writing—original draft preparation, L.P.M.; writing—review, A.D. and L.P.M.; investigation, L.P.M. and A.D.; resources, T.S., H.S. and N.P and editing, H.S., A.D. and R.N.P.; visualization, L.P.M.; supervision, T.S. and H.S.; project administration, T.S. and R.N.P.; funding acquisition, T.S. and R.N.P. All authors have read and agreed to the published version of the manuscript.
Funding
This research was funded by Universitas Indonesia via the Publikasi Terindeks Internasional (PUTI) 2020 research grant no. PENG-1/UN2.RST/PPM.00.00/2020.
Institutional Review Board Statement
The Committee on Research Ethics at the Faculty of Psychology, Universitas Indonesia, decided that the study complies with the ethical standards in the discipline of psychology, Universitas Indonesia’s Research Ethical Code of Conduct, and the Indonesian Psychology Association’s Ethical Code of Conduct (No: 927/FPsi.Komite Etik/PDP.04.00/2020 and date of approval: 16 November 2020).
Informed Consent Statement
Informed consent was obtained from all subjects involved in the study.
Data Availability Statement
Acknowledgments
In memoriam of Totok Suhardijanto, who has devoted his life to advancing computational linguistics in Bahasa Indonesia. May he rest in peace.
Conflicts of Interest
The authors declare no conflicts of interest. The funders had no role in the design of the study; in the collection, analyses, or interpretation of data; in the writing of the manuscript; or in the decision to publish the results.
References
- Thelwall, M.; Buckley, K.; Paltoglou, G. Sentiment Strength Detection for the Social Web. J. Am. Soc. Inf. Sci. Technol. 2012, 63, 163–173. [Google Scholar] [CrossRef]
- Hutto, C.; Gilbert, E. VADER: A Parsimonious Rule-Based Model for Sentiment Analysis of Social Media Text. Proc. Int. AAAI Conf. Web Soc. Media 2014, 8, 216–225. [Google Scholar] [CrossRef]
- Nagoudi, E.M.B. ARB-SEN at SemEval-2018 Task1: A New Set of Features for Enhancing the Sentiment Intensity Prediction in Arabic Tweets. In Proceedings of the 12th International Workshop on Semantic Evaluation, New Orleans, LA, USA, 5–6 June 2018; Apidianaki, M., Mohammad, S.M., May, J., Shutova, E., Bethard, S., Carpuat, M., Eds.; ACL: Stroudsburg, PA, USA, 2018; pp. 364–368. [Google Scholar] [CrossRef]
- Cheng, Y.Y.; Chen, Y.M.; Yeh, W.C.; Chang, Y.C. Valence and Arousal-Infused Bi-Directional LSTM for Sentiment Analysis of Government Social Media Management. Appl. Sci. 2021, 11, 880. [Google Scholar] [CrossRef]
- Gupta, V.; Rattan, P. Enhancing Sentiment Analysis in Restaurant Reviews: A Hybrid Approach Integrating Lexicon-Based Features and LSTM Networks. Int. J. Intell. Syst. Appl. Eng. 2024, 12, 185–198. [Google Scholar]
- Li, W.; Zhu, L.; Shi, Y.; Guo, K.; Cambria, E. User reviews: Sentiment analysis using lexicon integrated two-channel CNN–LSTM family models. Appl. Soft Comput. 2020, 94, 106435. [Google Scholar] [CrossRef]
- Mutinda, J.; Mwangi, W.; Okeyo, G. Sentiment Analysis of Text Reviews Using Lexicon-Enhanced Bert Embedding (LeBERT) Model with Convolutional Neural Network. Appl. Sci. 2023, 13, 1445. [Google Scholar] [CrossRef]
- Singh, V.; Piryani, R.; Uddin, A.; Waila, P. Sentiment analysis of Movie reviews and Blog posts. In Proceedings of the 2013 3rd IEEE International Advance Computing Conference (IACC), Ghaziabad, India, 22–23 February 2013; pp. 893–898. [Google Scholar] [CrossRef]
- Kapukaranov, B.; Nakov, P. Fine-Grained Sentiment Analysis for Movie Reviews in Bulgarian. In Proceedings of the International Conference Recent Advances in Natural Language Processing, Hissar, Bulgaria, 7–9 September 2015; Mitkov, R., Angelova, G., Bontcheva, K., Eds.; Incoma Ltd.: Shoumen, Bulgaria, 2015; pp. 266–274. [Google Scholar]
- Manik, L.P.; Febri Mustika, H.; Akbar, Z.; Kartika, Y.A.; Ridwan Saleh, D.; Setiawan, F.A.; Atman Satya, I. Aspect-Based Sentiment Analysis on Candidate Character Traits in Indonesian Presidential Election. In Proceedings of the 2020 International Conference on Radar, Antenna, Microwave, Electronics, and Telecommunications (ICRAMET), Tangerang, Indonesia, 18–20 November 2020; pp. 224–228. [Google Scholar] [CrossRef]
- Esuli, A.; Sebastiani, F. SENTIWORDNET: A Publicly Available Lexical Resource for Opinion Mining. In Proceedings of the Fifth International Conference on Language Resources and Evaluation (LREC’06), Genoa, Italy, 22—28 May 2006. [Google Scholar]
- Baccianella, S.; Esuli, A.; Sebastiani, F. SentiWordNet 3.0: An Enhanced Lexical Resource for Sentiment Analysis and Opinion Mining. In Proceedings of the Seventh International Conference on Language Resources and Evaluation (LREC‘10), Valletta, Malta, 17–23 May 2010; Calzolari, N., Choukri, K., Maegaard, B., Mariani, J., Odijk, J., Piperidis, S., Rosner, M., Tapias, D., Eds.; European Language Resources Association (ELRA): Paris, France, 2010. [Google Scholar]
- Bradley, M.M.; Lang, P.J. Measuring emotion: The self-assessment manikin and the semantic differential. J. Behav. Ther. Exp. Psychiatry 1994, 25, 49–59. [Google Scholar] [CrossRef]
- Deshmane, A.A.; Friedrichs, J. TSA-INF at SemEval-2017 Task 4: An Ensemble of Deep Learning Architectures Including Lexicon Features for Twitter Sentiment Analysis. In Proceedings of the 11th International Workshop on Semantic Evaluation (SemEval-2017), Vancouver, BC, Canada, 3–4 August 2017; Bethard, S., Carpuat, M., Apidianaki, M., Mohammad, S.M., Cer, D., Jurgens, D., Eds.; ACL: Stroudsburg, PA, USA, 2017; pp. 802–806. [Google Scholar] [CrossRef]
- Manik, L.P.; Susianto, H.; Dinakaramani, A.; Pramanik, N.; Suhardijanto, T. Can Lexicon-Based Sentiment Analysis Boost Performances of Transformer-Based Models? In Proceedings of the 2023 7th International Conference on New Media Studies (CONMEDIA), Bali, Indonesia, 6–8 December 2023; pp. 314–319. [Google Scholar] [CrossRef]
- Liu, Y.; Wang, S.; Yu, S. A Bullet Screen Sentiment Analysis Method That Integrates the Sentiment Lexicon with RoBERTa-CNN. Electronics 2024, 13, 3984. [Google Scholar] [CrossRef]
- Koto, F.; Beck, T.; Talat, Z.; Gurevych, I.; Baldwin, T. Zero-shot Sentiment Analysis in Low-Resource Languages Using a Multilingual Sentiment Lexicon. In Proceedings of the 18th Conference of the European Chapter of the Association for Computational Linguistics (Volume 1: Long Papers), St. Julian’s, Malta, 17–22 March 2024; Graham, Y., Purver, M., Eds.; ACL: Stroudsburg, PA, USA, 2024; pp. 298–320. [Google Scholar]
- Bradley, M.M.; Lang, P.J. Affective Norms for English Words (ANEW): Instruction Manual and Affective Ratings; Technical report; The Center for Research in Psychophysiology, University of Florida: Gainesville, FL, USA, 1999. [Google Scholar]
- Sianipar, A.; van Groenestijn, P.; Dijkstra, T. Affective Meaning, Concreteness, and Subjective Frequency Norms for Indonesian Words. Front. Psychol. 2016, 7, 1907. [Google Scholar] [CrossRef]
- Hulliyah, K.; Sukmana, H.T.; Bakar, N.S.A.; Ismail, A.R. Indonesian Affective Word Resources Construction in Valence and Arousal Dimension for Sentiment Analysis. In Proceedings of the 2018 6th International Conference on Cyber and IT Service Management (CITSM), Parapat, Indonesia, 7–9 August 2018; pp. 1–5. [Google Scholar] [CrossRef]
- Manik, L.P.; Akbar, Z.; Mustika, H.F.; Indrawati, A.; Rini, D.S.; Fefirenta, A.D.; Djarwaningsih, T. Out-of-Scope Intent Detection on A Knowledge-Based Chatbot. Int. J. Intell. Eng. Syst. 2021, 14, 446–457. [Google Scholar] [CrossRef]
- Kurniasih, A.; Manik, L.P. On the Role of Text Preprocessing in BERT Embedding-based DNNs for Classifying Informal Texts. Int. J. Adv. Comput. Sci. Appl. 2022, 13, 927–934. [Google Scholar] [CrossRef]
- Jiang, M.; Lan, M.; Wu, Y. ECNU at SemEval-2017 Task 5: An Ensemble of Regression Algorithms with Effective Features for Fine-Grained Sentiment Analysis in Financial Domain. In Proceedings of the 11th International Workshop on Semantic Evaluation (SemEval-2017), Vancouver, BC, Canada, 3–4 August 2017; Bethard, S., Carpuat, M., Apidianaki, M., Mohammad, S.M., Cer, D., Jurgens, D., Eds.; ACL: Stroudsburg, PA, USA, 2017; pp. 888–893. [Google Scholar] [CrossRef]
- Barrett, L.F. How Emotions Are Made: The Secret Life of the Brain; Houghton Mifflin Harcourt: Boston, MA, USA, 2017. [Google Scholar]
- Fontaine, J.R.J.; Scherer, K.R.; Roesch, E.B.; Ellsworth, P.C. The world of emotions is not two-dimensional. Psychol. Sci. 2007, 18, 1050–1057. [Google Scholar] [CrossRef]
- Pang, B.; Lee, L. Opinion Mining and Sentiment Analysis; Foundations and Trends® in Information Retrieval Series; Now Publishers: Norwell, MA, USA, 2008. [Google Scholar]
- Vaswani, A.; Shazeer, N.; Parmar, N.; Uszkoreit, J.; Jones, L.; Gomez, A.N.; Kaiser, L.; Polosukhin, I. Attention is all you need. In Proceedings of the 31st International Conference on Neural Information Processing Systems, Red Hook, NY, USA, 4–9 December 2017; NIPS’17. pp. 6000–6010. [Google Scholar]
- Ma, Y.; Peng, H.; Cambria, E. Targeted Aspect-Based Sentiment Analysis via Embedding Commonsense Knowledge into an Attentive LSTM. Proc. AAAI Conf. Artif. Intell. 2018, 32, 5876–5883. [Google Scholar] [CrossRef]
- Khan, J.; Ahmad, N.; Khalid, S.; Ali, F.; Lee, Y. Sentiment and Context-Aware Hybrid DNN With Attention for Text Sentiment Classification. IEEE Access 2023, 11, 28162–28179. [Google Scholar] [CrossRef]
- Cai, Y.; Li, X.; Zhang, Y.; Li, J.; Zhu, F.; Rao, L. Multimodal sentiment analysis based on multi-layer feature fusion and multi-task learning. Sci. Rep. 2025, 15, 2126. [Google Scholar] [CrossRef]
- Li, H.; Lu, Y.; Zhu, H. Multi-Modal Sentiment Analysis Based on Image and Text Fusion Based on Cross-Attention Mechanism. Electronics 2024, 13, 2069. [Google Scholar] [CrossRef]
- Lundberg, S.M.; Lee, S.I. A unified approach to interpreting model predictions. In Proceedings of the 31st International Conference on Neural Information Processing Systems, Red Hook, NY, USA, 4–9 December 2017; NIPS’17. pp. 4768–4777. [Google Scholar]
- Sihombing, A.; Indrawati, A.; Yaman, A.; Trianggoro, C.; Manik, L.P.; Akbar, Z. A scientific expertise classification model based on experts’ self-claims using the semantic and the TF-IDF approach. In Proceedings of the 2022 International Conference on Computer, Control, Informatics and Its Applications, New York, NY, USA, 22–23 November 2022; IC3INA ’22. pp. 301–305. [Google Scholar] [CrossRef]
- Manik, L.P.; Ferti Syafiandini, A.; Mustika, H.F.; Fatchuttamam Abka, A.; Rianto, Y. Evaluating the Morphological and Capitalization Features for Word Embedding-Based POS Tagger in Bahasa Indonesia. In Proceedings of the 2018 International Conference on Computer, Control, Informatics and its Applications (IC3INA), Tangerang, Indonesia, 1–2 November 2018; pp. 49–53. [Google Scholar] [CrossRef]
- Devlin, J.; Chang, M.W.; Lee, K.; Toutanova, K. BERT: Pre-training of Deep Bidirectional Transformers for Language Understanding. In Proceedings of the 2019 Conference of the North American Chapter of the Association for Computational Linguistics: Human Language Technologies, Volume 1 (Long and Short Papers), Minneapolis, MN, USA, 2–7 June 2019; pp. 4171–4186. [Google Scholar] [CrossRef]
- Sanh, V.; Debut, L.; Chaumond, J.; Wolf, T. DistilBERT, a distilled version of BERT: Smaller, faster, cheaper and lighter. arXiv 2020, arXiv:cs.CL/1910.01108. [Google Scholar]
- Liu, Y.; Ott, M.; Goyal, N.; Du, J.; Joshi, M.; Chen, D.; Levy, O.; Lewis, M.; Zettlemoyer, L.; Stoyanov, V. RoBERTa: A Robustly Optimized BERT Pretraining Approach. arXiv 2019, arXiv:cs.CL/1907.11692. [Google Scholar]
- Wilie, B.; Vincentio, K.; Winata, G.I.; Cahyawijaya, S.; Li, X.; Lim, Z.Y.; Soleman, S.; Mahendra, R.; Fung, P.; Bahar, S.; et al. IndoNLU: Benchmark and Resources for Evaluating Indonesian Natural Language Understanding. In Proceedings of the 1st Conference of the Asia-Pacific Chapter of the Association for Computational Linguistics and the 10th International Joint Conference on Natural Language Processing, Suzhou, China, 4–7 December 2020; Wong, K.F., Knight, K., Wu, H., Eds.; ACL: Stroudsburg, PA, USA, 2020; pp. 843–857. [Google Scholar] [CrossRef]
- Ortiz Su’arez, P.J.; Sagot, B.; Romary, L. Asynchronous pipelines for processing huge corpora on medium to low resource infrastructures. In Proceedings of the Workshop on Challenges in the Management of Large Corpora (CMLC-7) 2019, Cardiff, UK, 22 July 2019; pp. 9–16. [Google Scholar] [CrossRef]
- Ortiz Su’arez, P.J.; Romary, L.; Sagot, B. A Monolingual Approach to Contextualized Word Embeddings for Mid-Resource Languages. In Proceedings of the 58th Annual Meeting of the Association for Computational Linguistics, Online, 5–10 July 2020; pp. 1703–1714. [Google Scholar] [CrossRef]
- Rani, S.; Singh Gill, N.; Gulia, P. Analyzing impact of number of features on efficiency of hybrid model of lexicon and stack based ensemble classifier for twitter sentiment analysis using WEKA tool. Indones. J. Electr. Eng. Comput. Sci. 2021, 22, 1041. [Google Scholar] [CrossRef]
- Loecher, M. Debiasing SHAP scores in random forests. AStA Adv. Stat. Anal. 2024, 108, 427–440. [Google Scholar] [CrossRef]
- Das, R.K.; Islam, M.; Hasan, M.M.; Razia, S.; Hassan, M.; Khushbu, S.A. Sentiment analysis in multilingual context: Comparative analysis of machine learning and hybrid deep learning models. Heliyon 2023, 9, e20281. [Google Scholar] [CrossRef] [PubMed]
- Ashbaugh, L.; Zhang, Y. A Comparative Study of Sentiment Analysis on Customer Reviews Using Machine Learning and Deep Learning. Computers 2024, 13, 340. [Google Scholar] [CrossRef]
- Mikolov, T.; Chen, K.; Corrado, G.; Dean, J. Efficient Estimation of Word Representations in Vector Space. arXiv 2013, arXiv:cs.CL/1301.3781. [Google Scholar]
- Pennington, J.; Socher, R.; Manning, C. GloVe: Global Vectors for Word Representation. In Proceedings of the 2014 Conference on Empirical Methods in Natural Language Processing (EMNLP), Doha, Qatar, 25–29 October 2014; Moschitti, A., Pang, B., Daelemans, W., Eds.; ACL: Stroudsburg, PA, USA, 2014; pp. 1532–1543. [Google Scholar] [CrossRef]
- Bonnier, T. Revisiting Multimodal Transformers for Tabular Data with Text Fields. In Proceedings of the Findings of the Association for Computational Linguistics: ACL 2024, Bangkok, Thailand, 11–16 August 2024; Ku, L.W., Martins, A., Srikumar, V., Eds.; ACL: Stroudsburg, PA, USA, 2024; pp. 1481–1500. [Google Scholar] [CrossRef]
- Catelli, R.; Pelosi, S.; Esposito, M. Lexicon-Based vs. Bert-Based Sentiment Analysis: A Comparative Study in Italian. Electronics 2022, 11, 374. [Google Scholar] [CrossRef]
- Muhammad, S.H.; Brazdil, P.; Jorge, A. Incremental Approach for Automatic Generation of Domain-Specific Sentiment Lexicon. In Proceedings of the Advances in Information Retrieval; Jose, J.M., Yilmaz, E., Magalhães, J., Castells, P., Ferro, N., Silva, M.J., Martins, F., Eds.; Springer: Cham, Switzerland, 2020; pp. 619–623. [Google Scholar] [CrossRef]
- Alahmadi, K.; Alharbi, S.; Chen, J.; Wang, X. Generalizing sentiment analysis: A review of progress, challenges, and emerging directions. Soc. Netw. Anal. Min. 2025, 15, 45. [Google Scholar] [CrossRef]
- Loh, H.W.; Ooi, C.P.; Seoni, S.; Barua, P.D.; Molinari, F.; Acharya, U.R. Application of explainable artificial intelligence for healthcare: A systematic review of the last decade (2011–2022). Comput. Methods Programs Biomed. 2022, 226, 107161. [Google Scholar] [CrossRef]
- Islam, M.S.; Kabir, M.N.; Ghani, N.A.; Zamli, K.Z.; Zulkifli, N.S.A.; Rahman, M.M.; Moni, M.A. Challenges and future in deep learning for sentiment analysis: A comprehensive review and a proposed novel hybrid approach. Artif. Intell. Rev. 2024, 57, 62. [Google Scholar] [CrossRef]
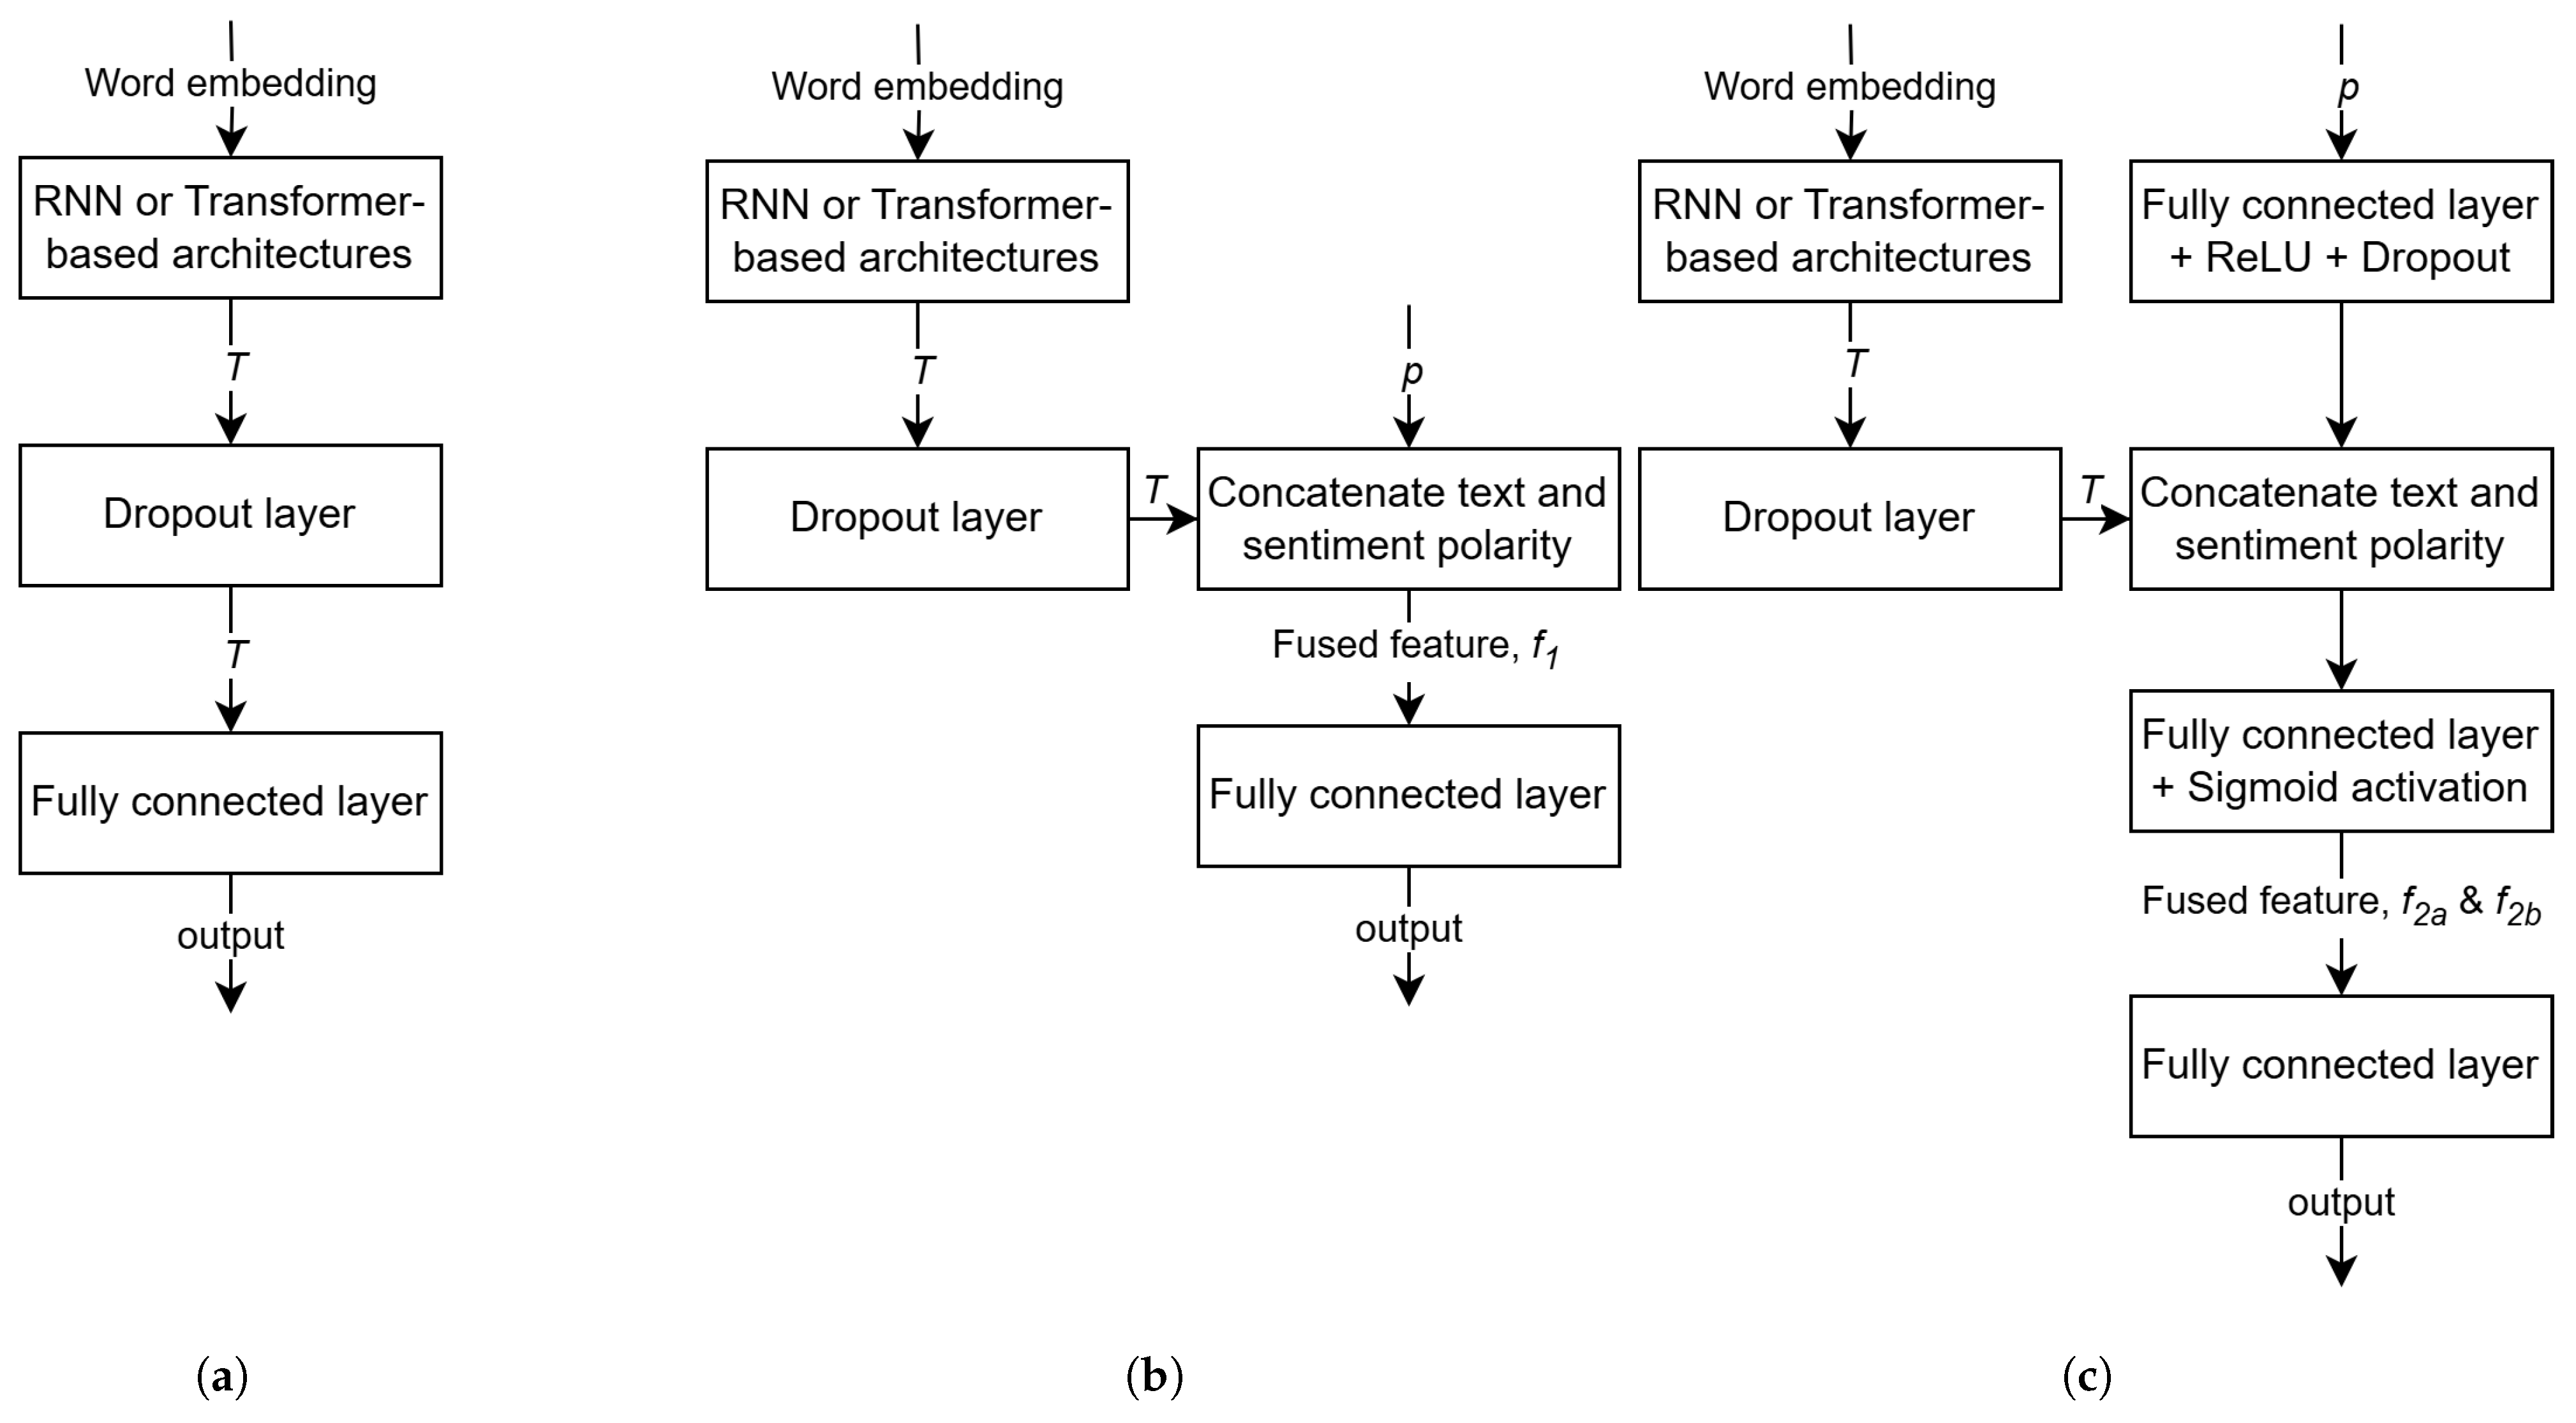
Figure 1.
Deep neural network architectures: (a) Baseline without p (). (b) With . (c) With and .
Figure 2.
Histogram of the first dataset: (a) SD of valence responses across annotators. (b) Valence scores.
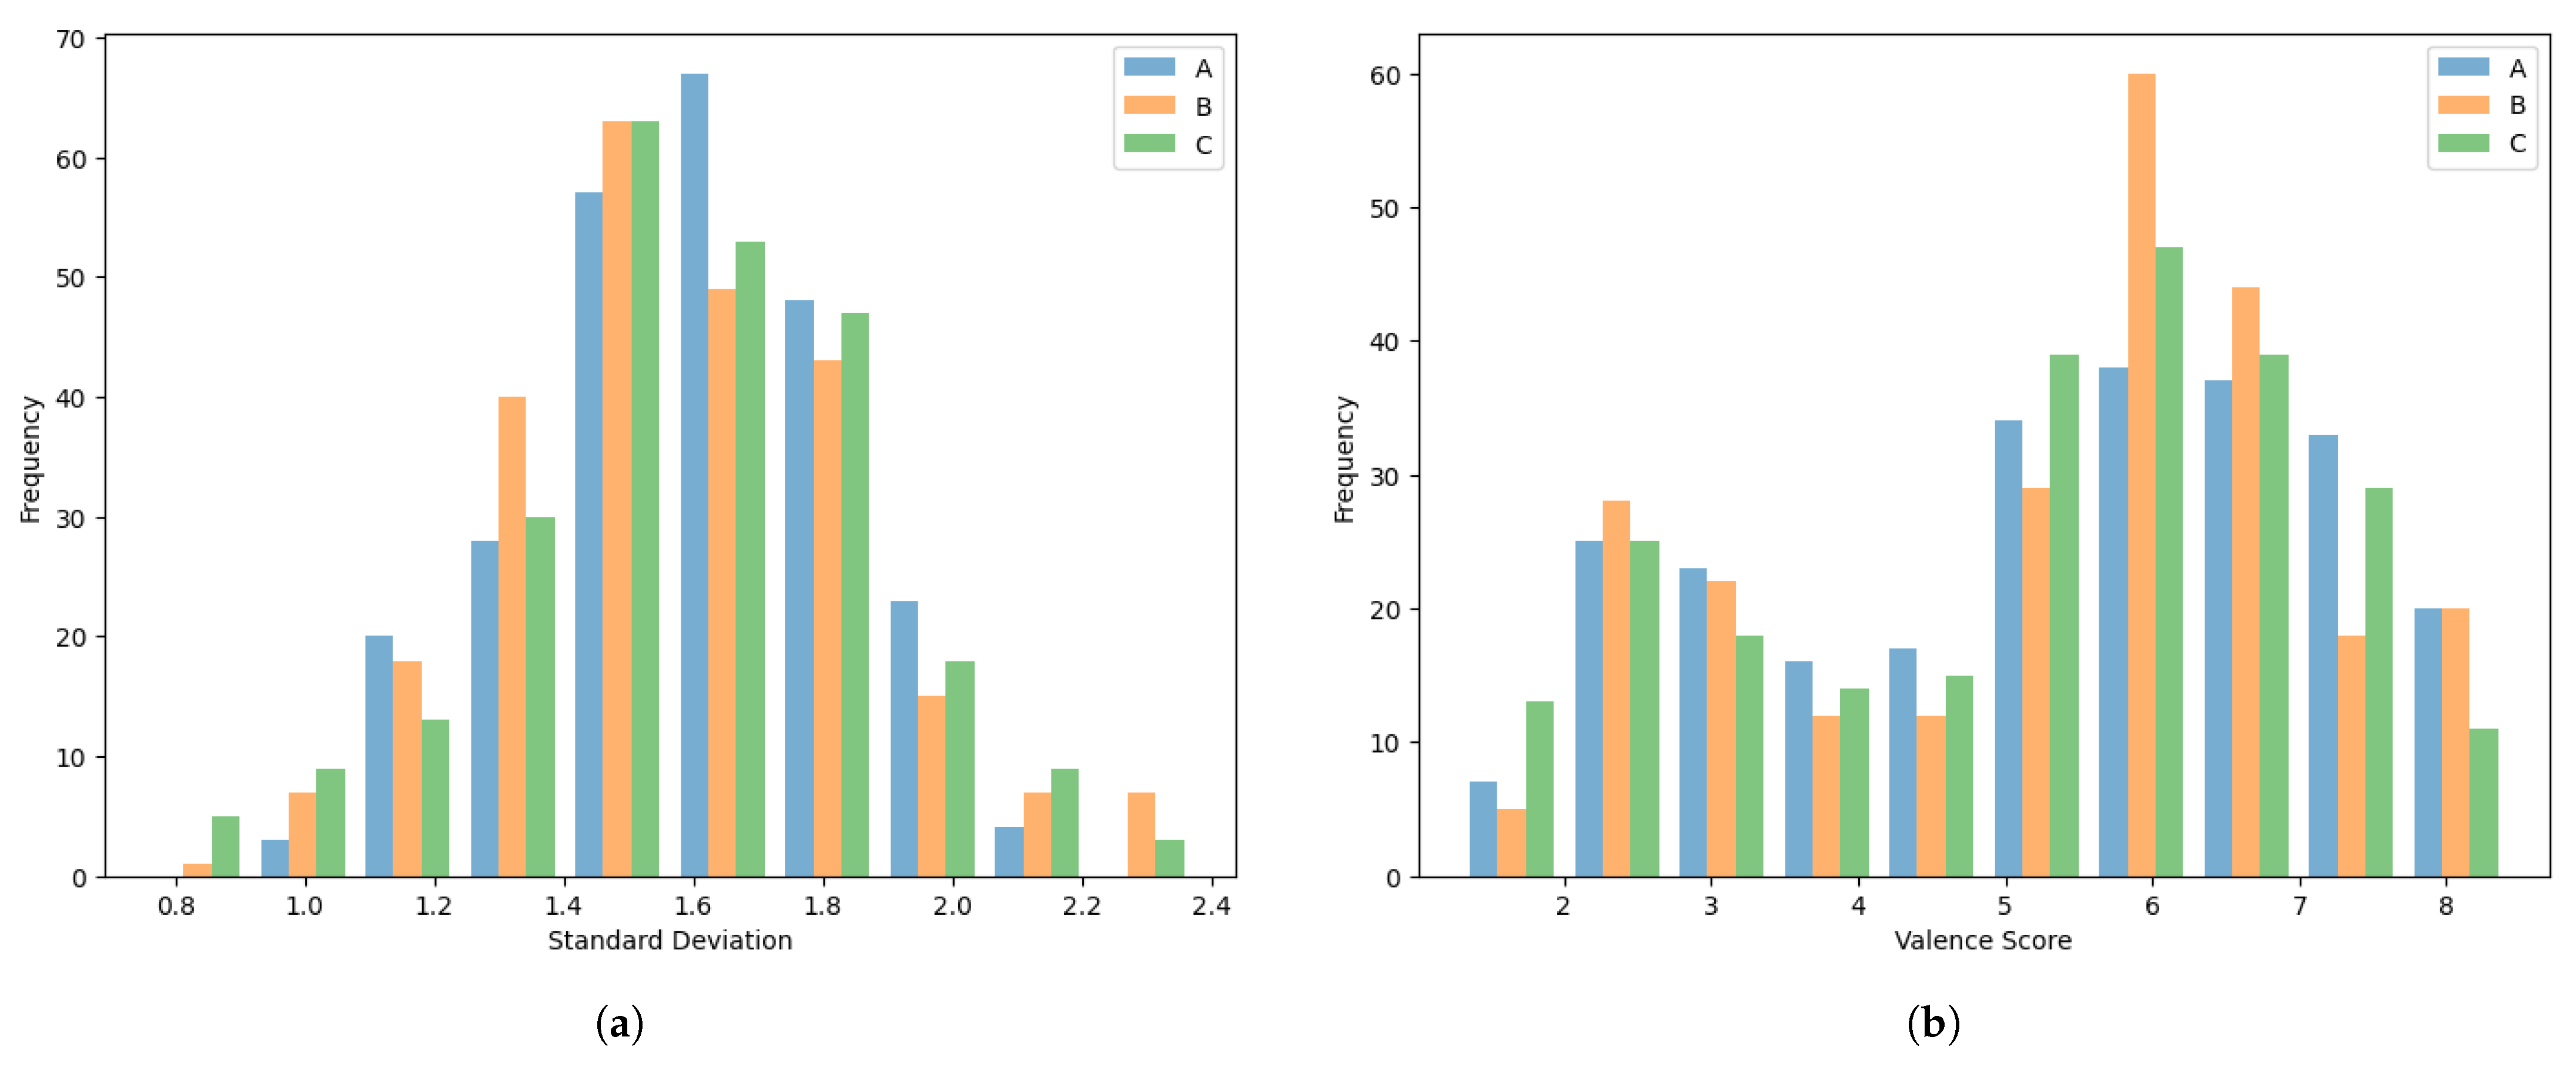
Figure 3.
Reprinted from [
19]: (
a) Histogram of standard deviation of valence responses across annotators. (
b) Histogram of valence scores.
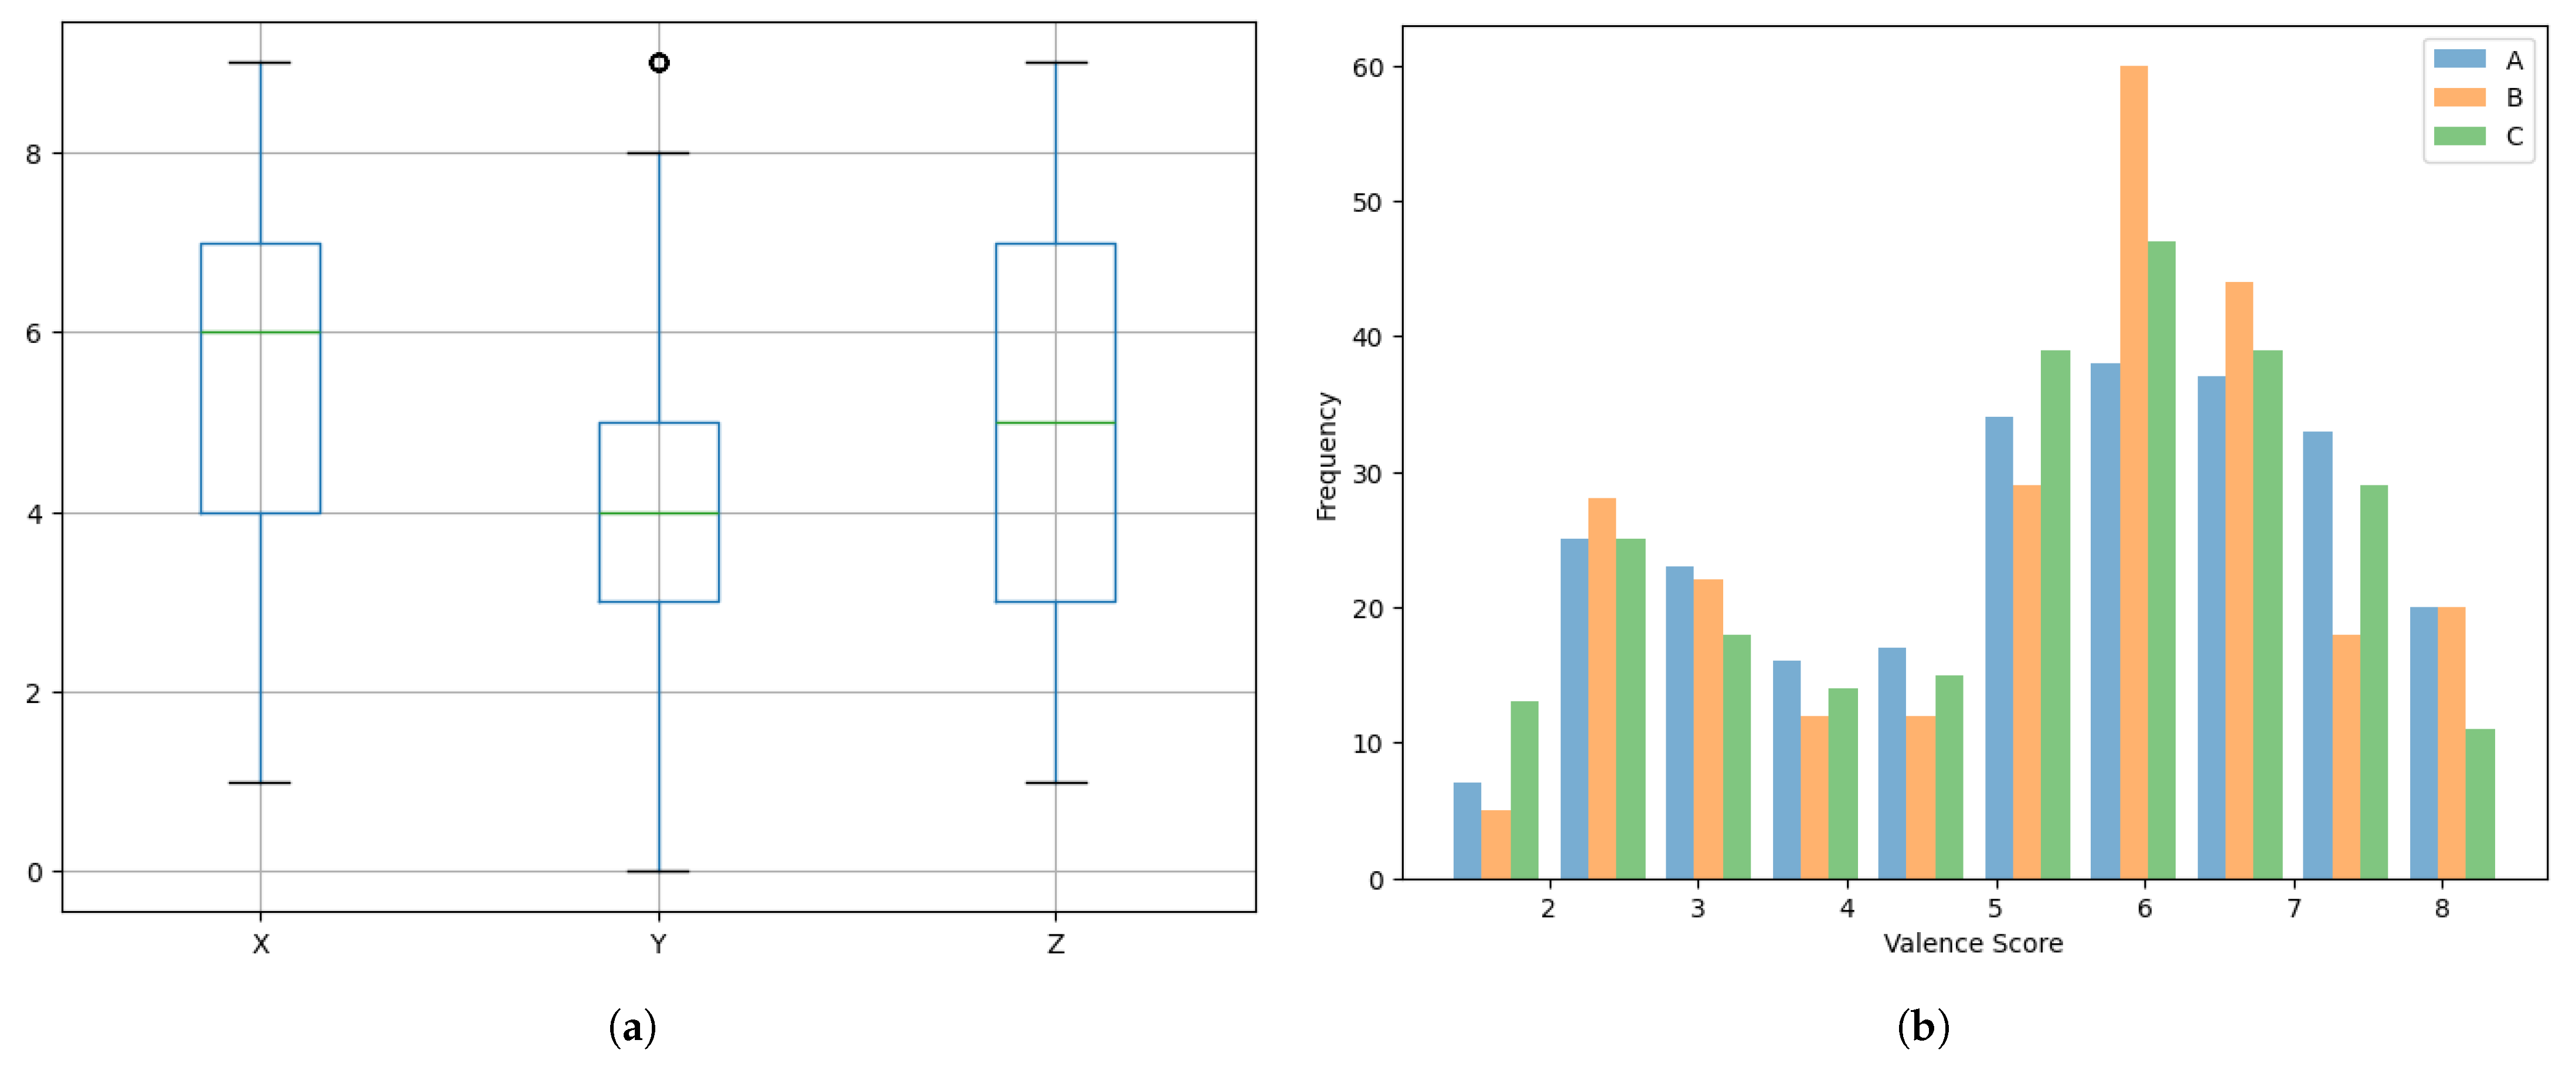
Figure 4.
Sentiment intensities: (a) Box plot. (b) Histogram of the standard deviation.
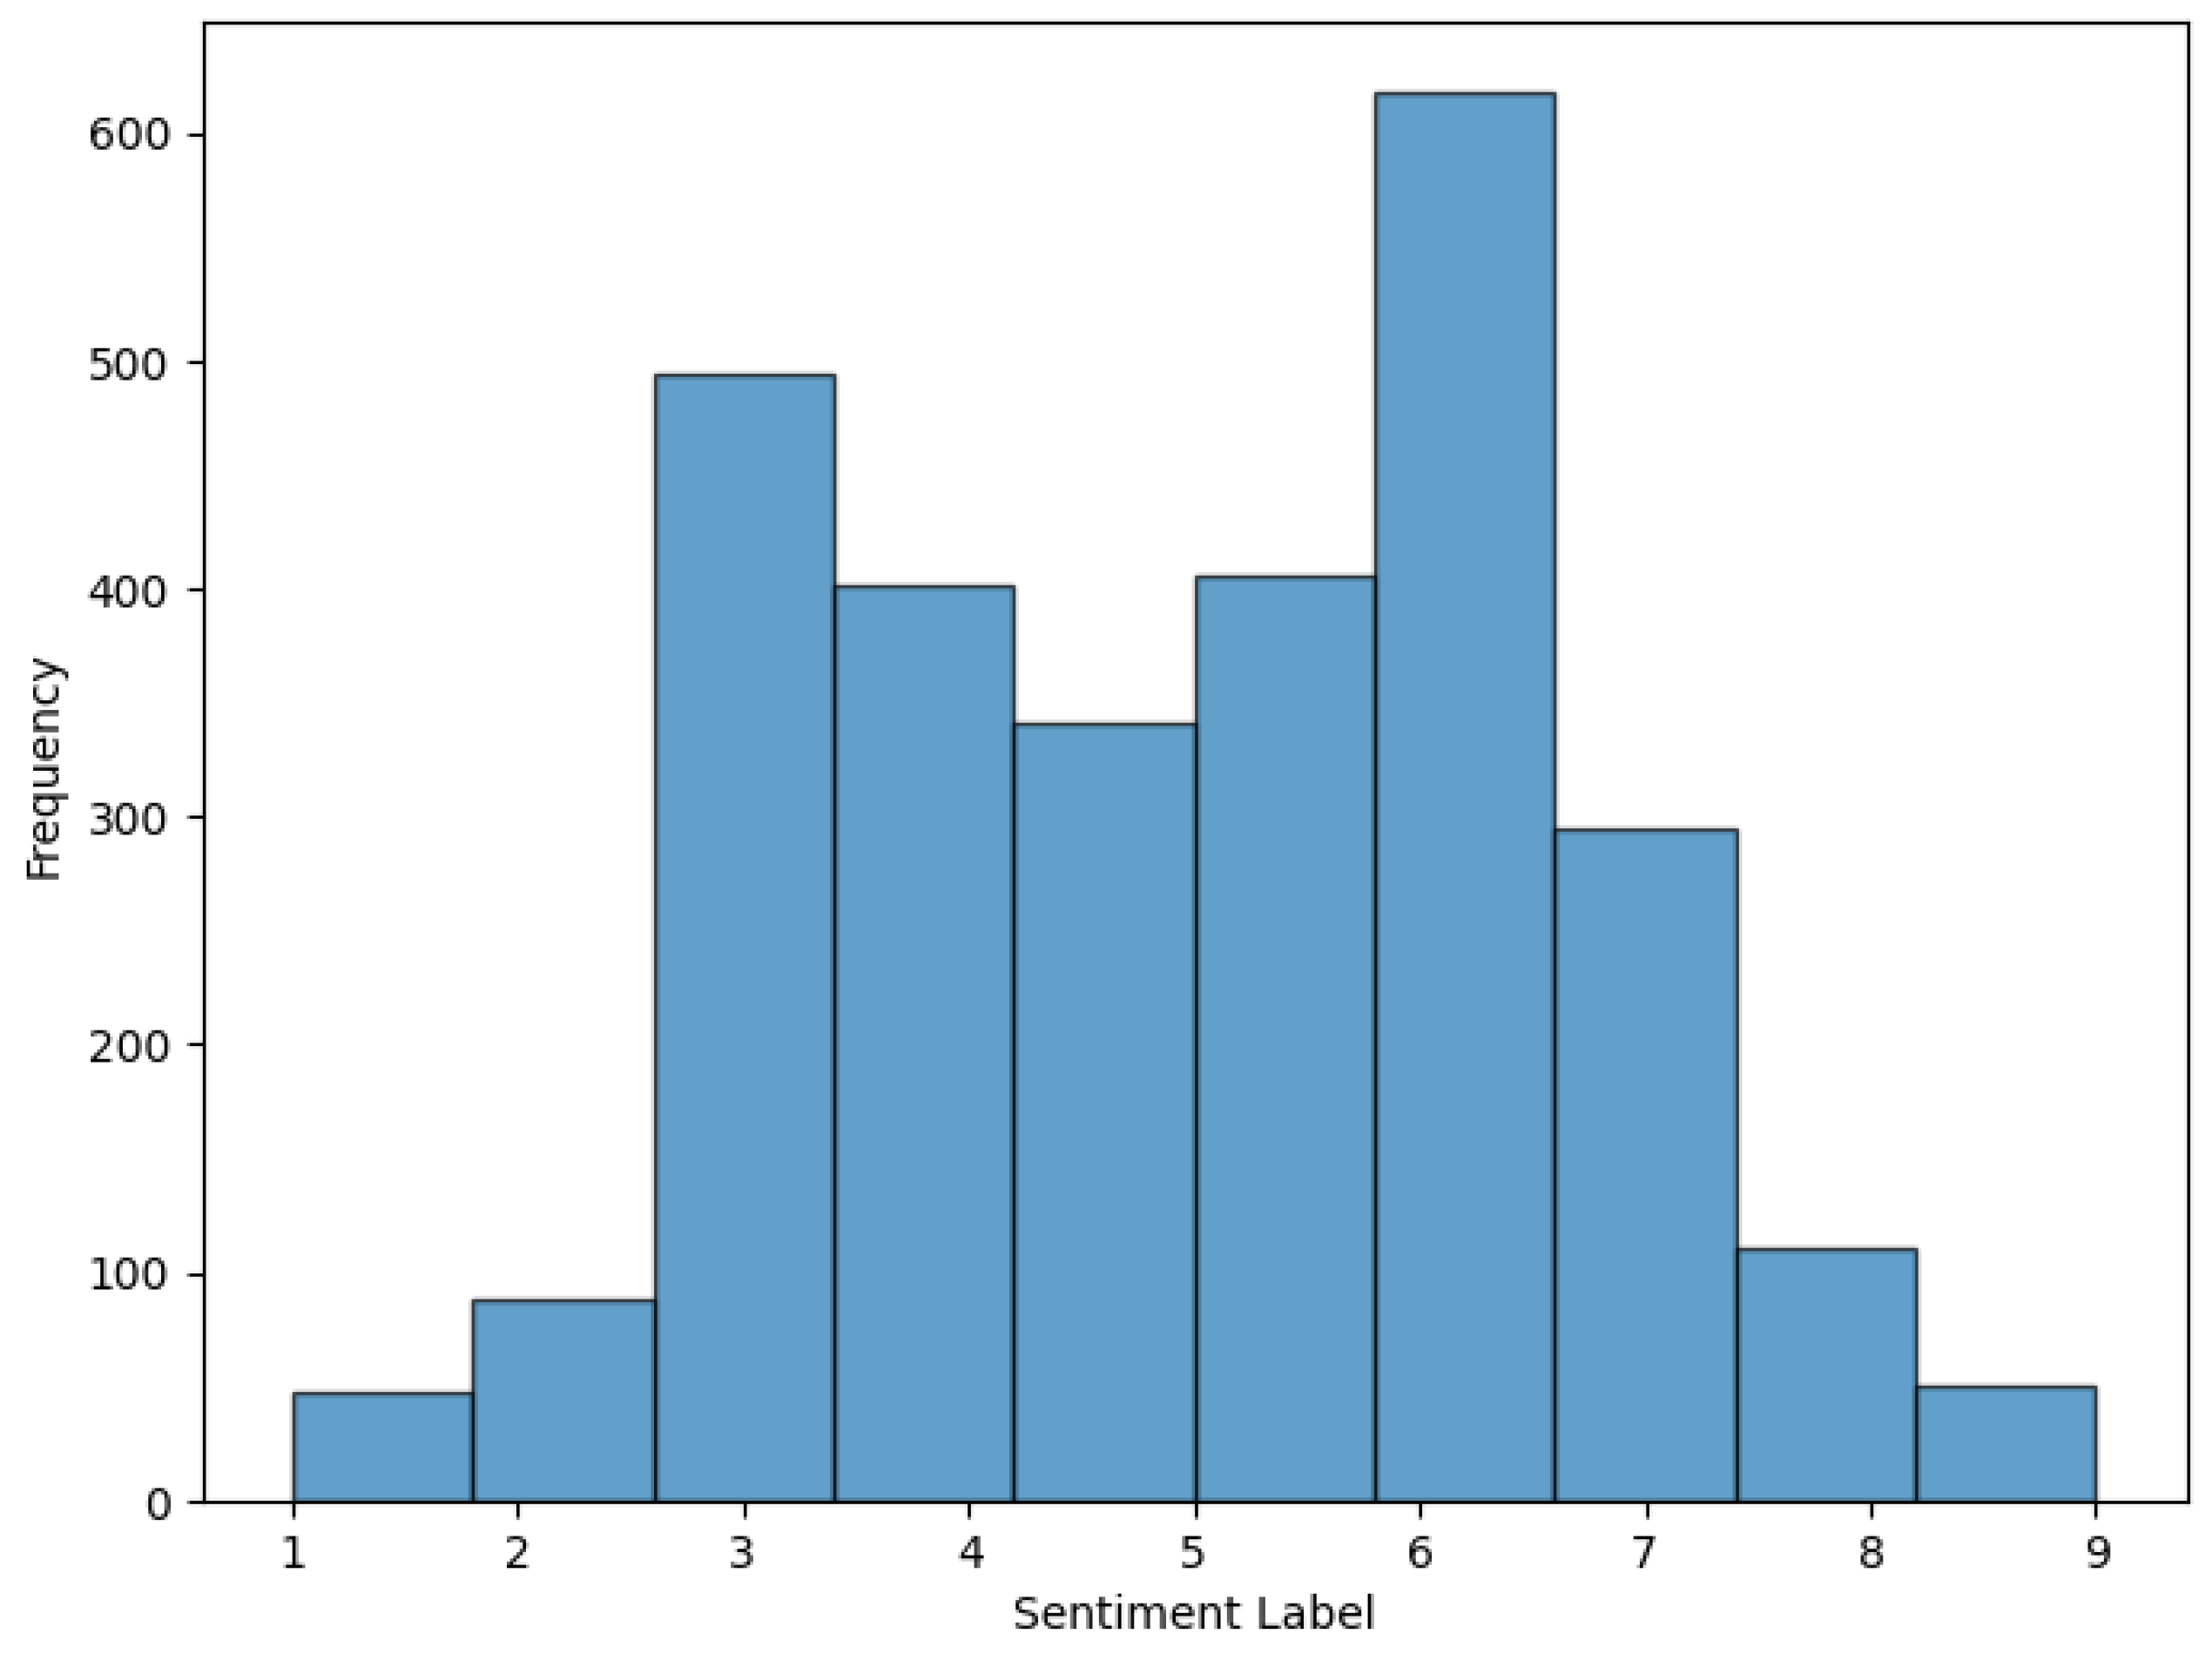
Figure 5.
Histogram of sentiment labels.
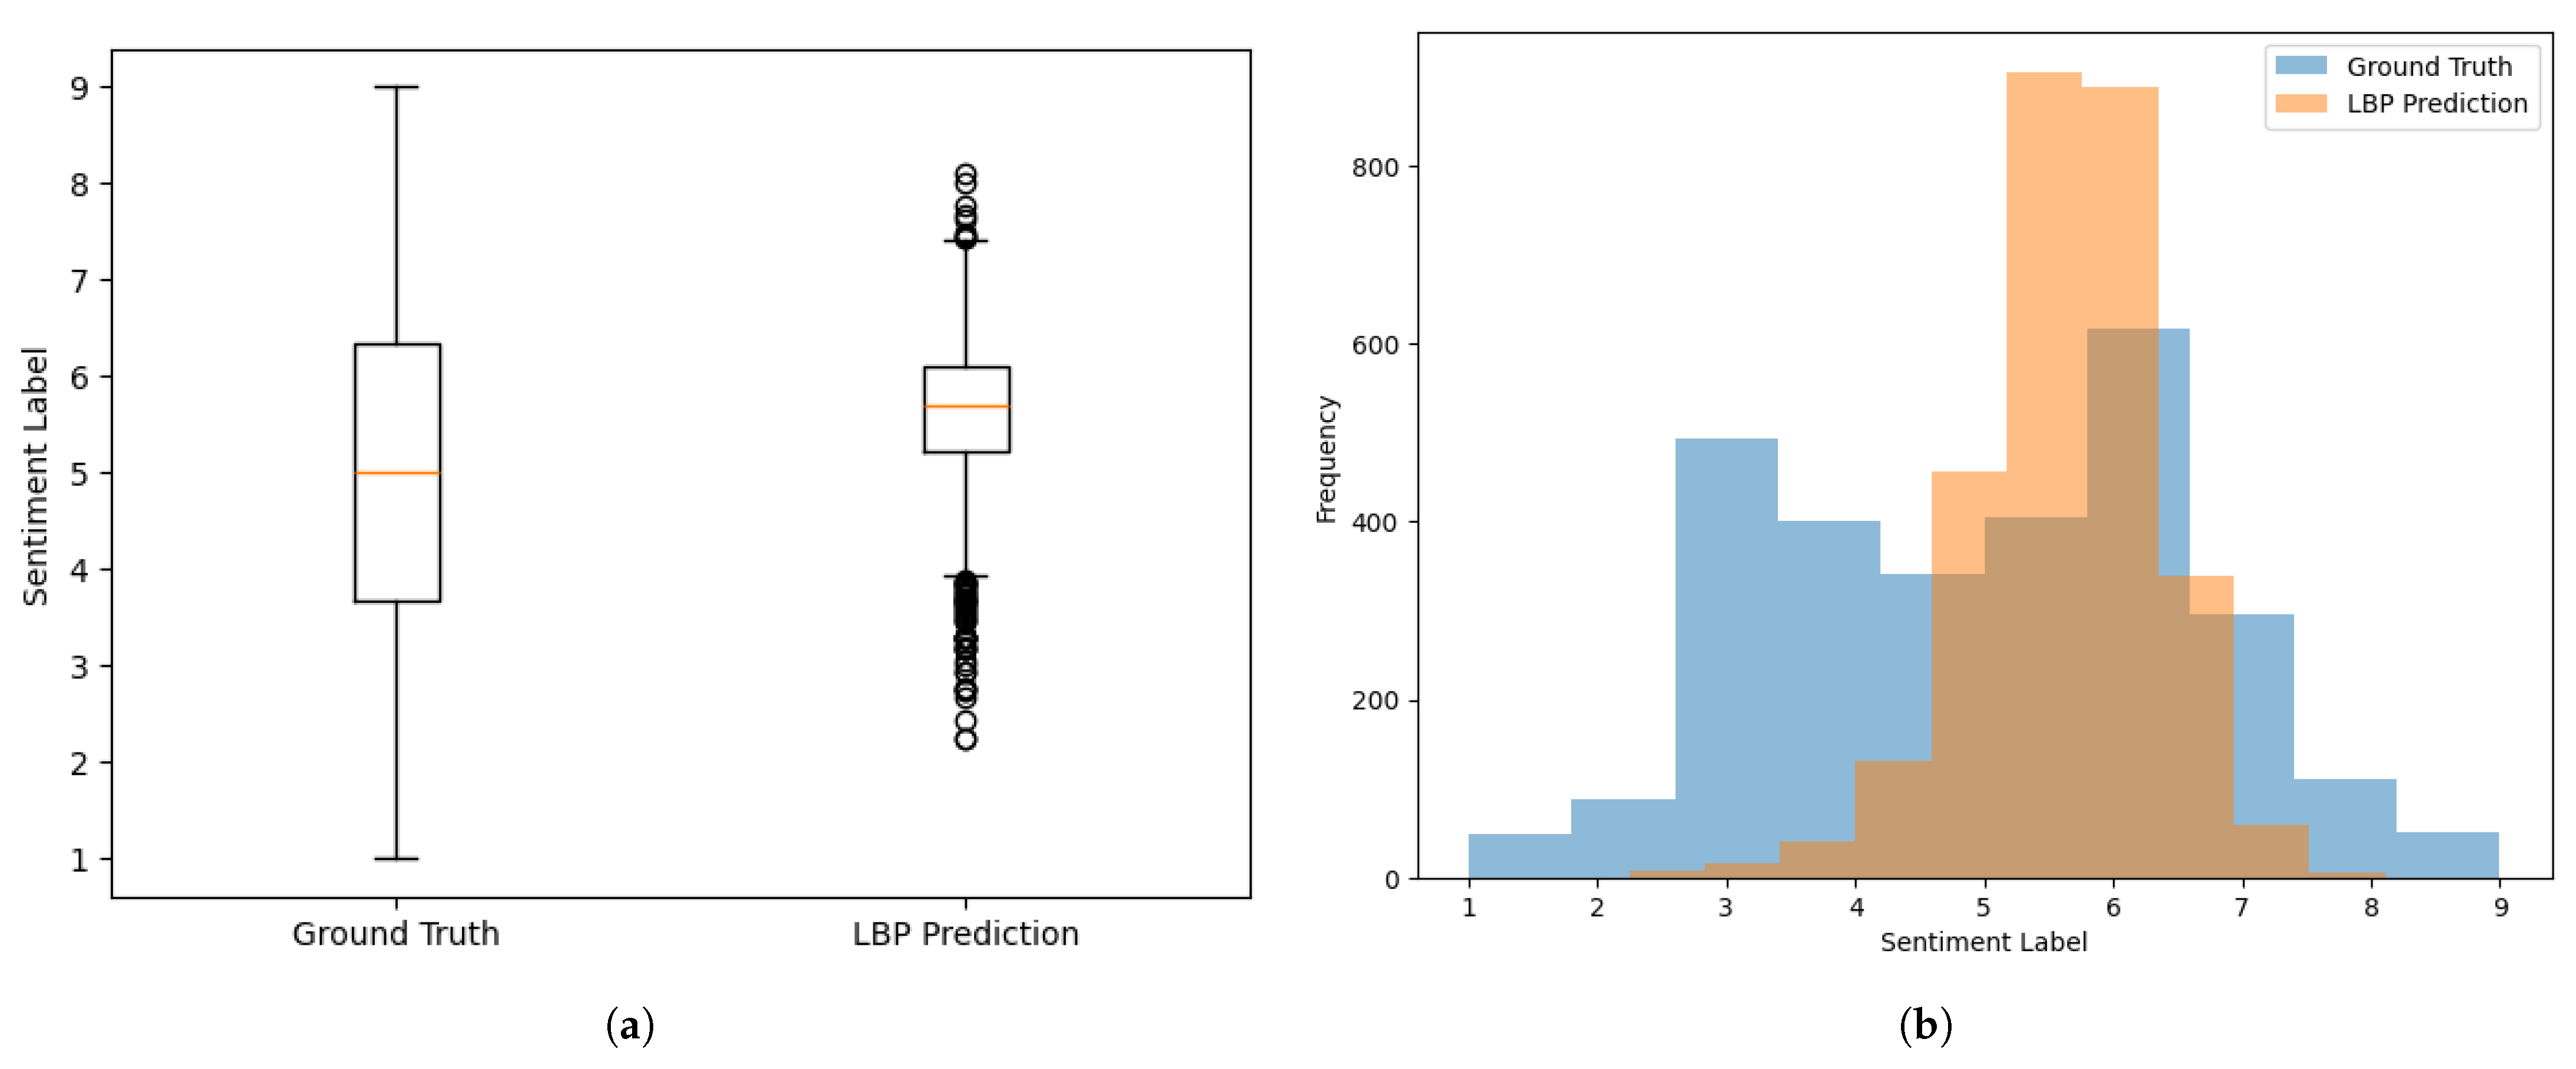
Figure 6.
Sentiment label prediction results using the lexicon-based polarity algorithm: (a) Box plot. The orange line is the median, and the circles are outliers, individual points unusually far from the bulk of the data. (b) Histogram.
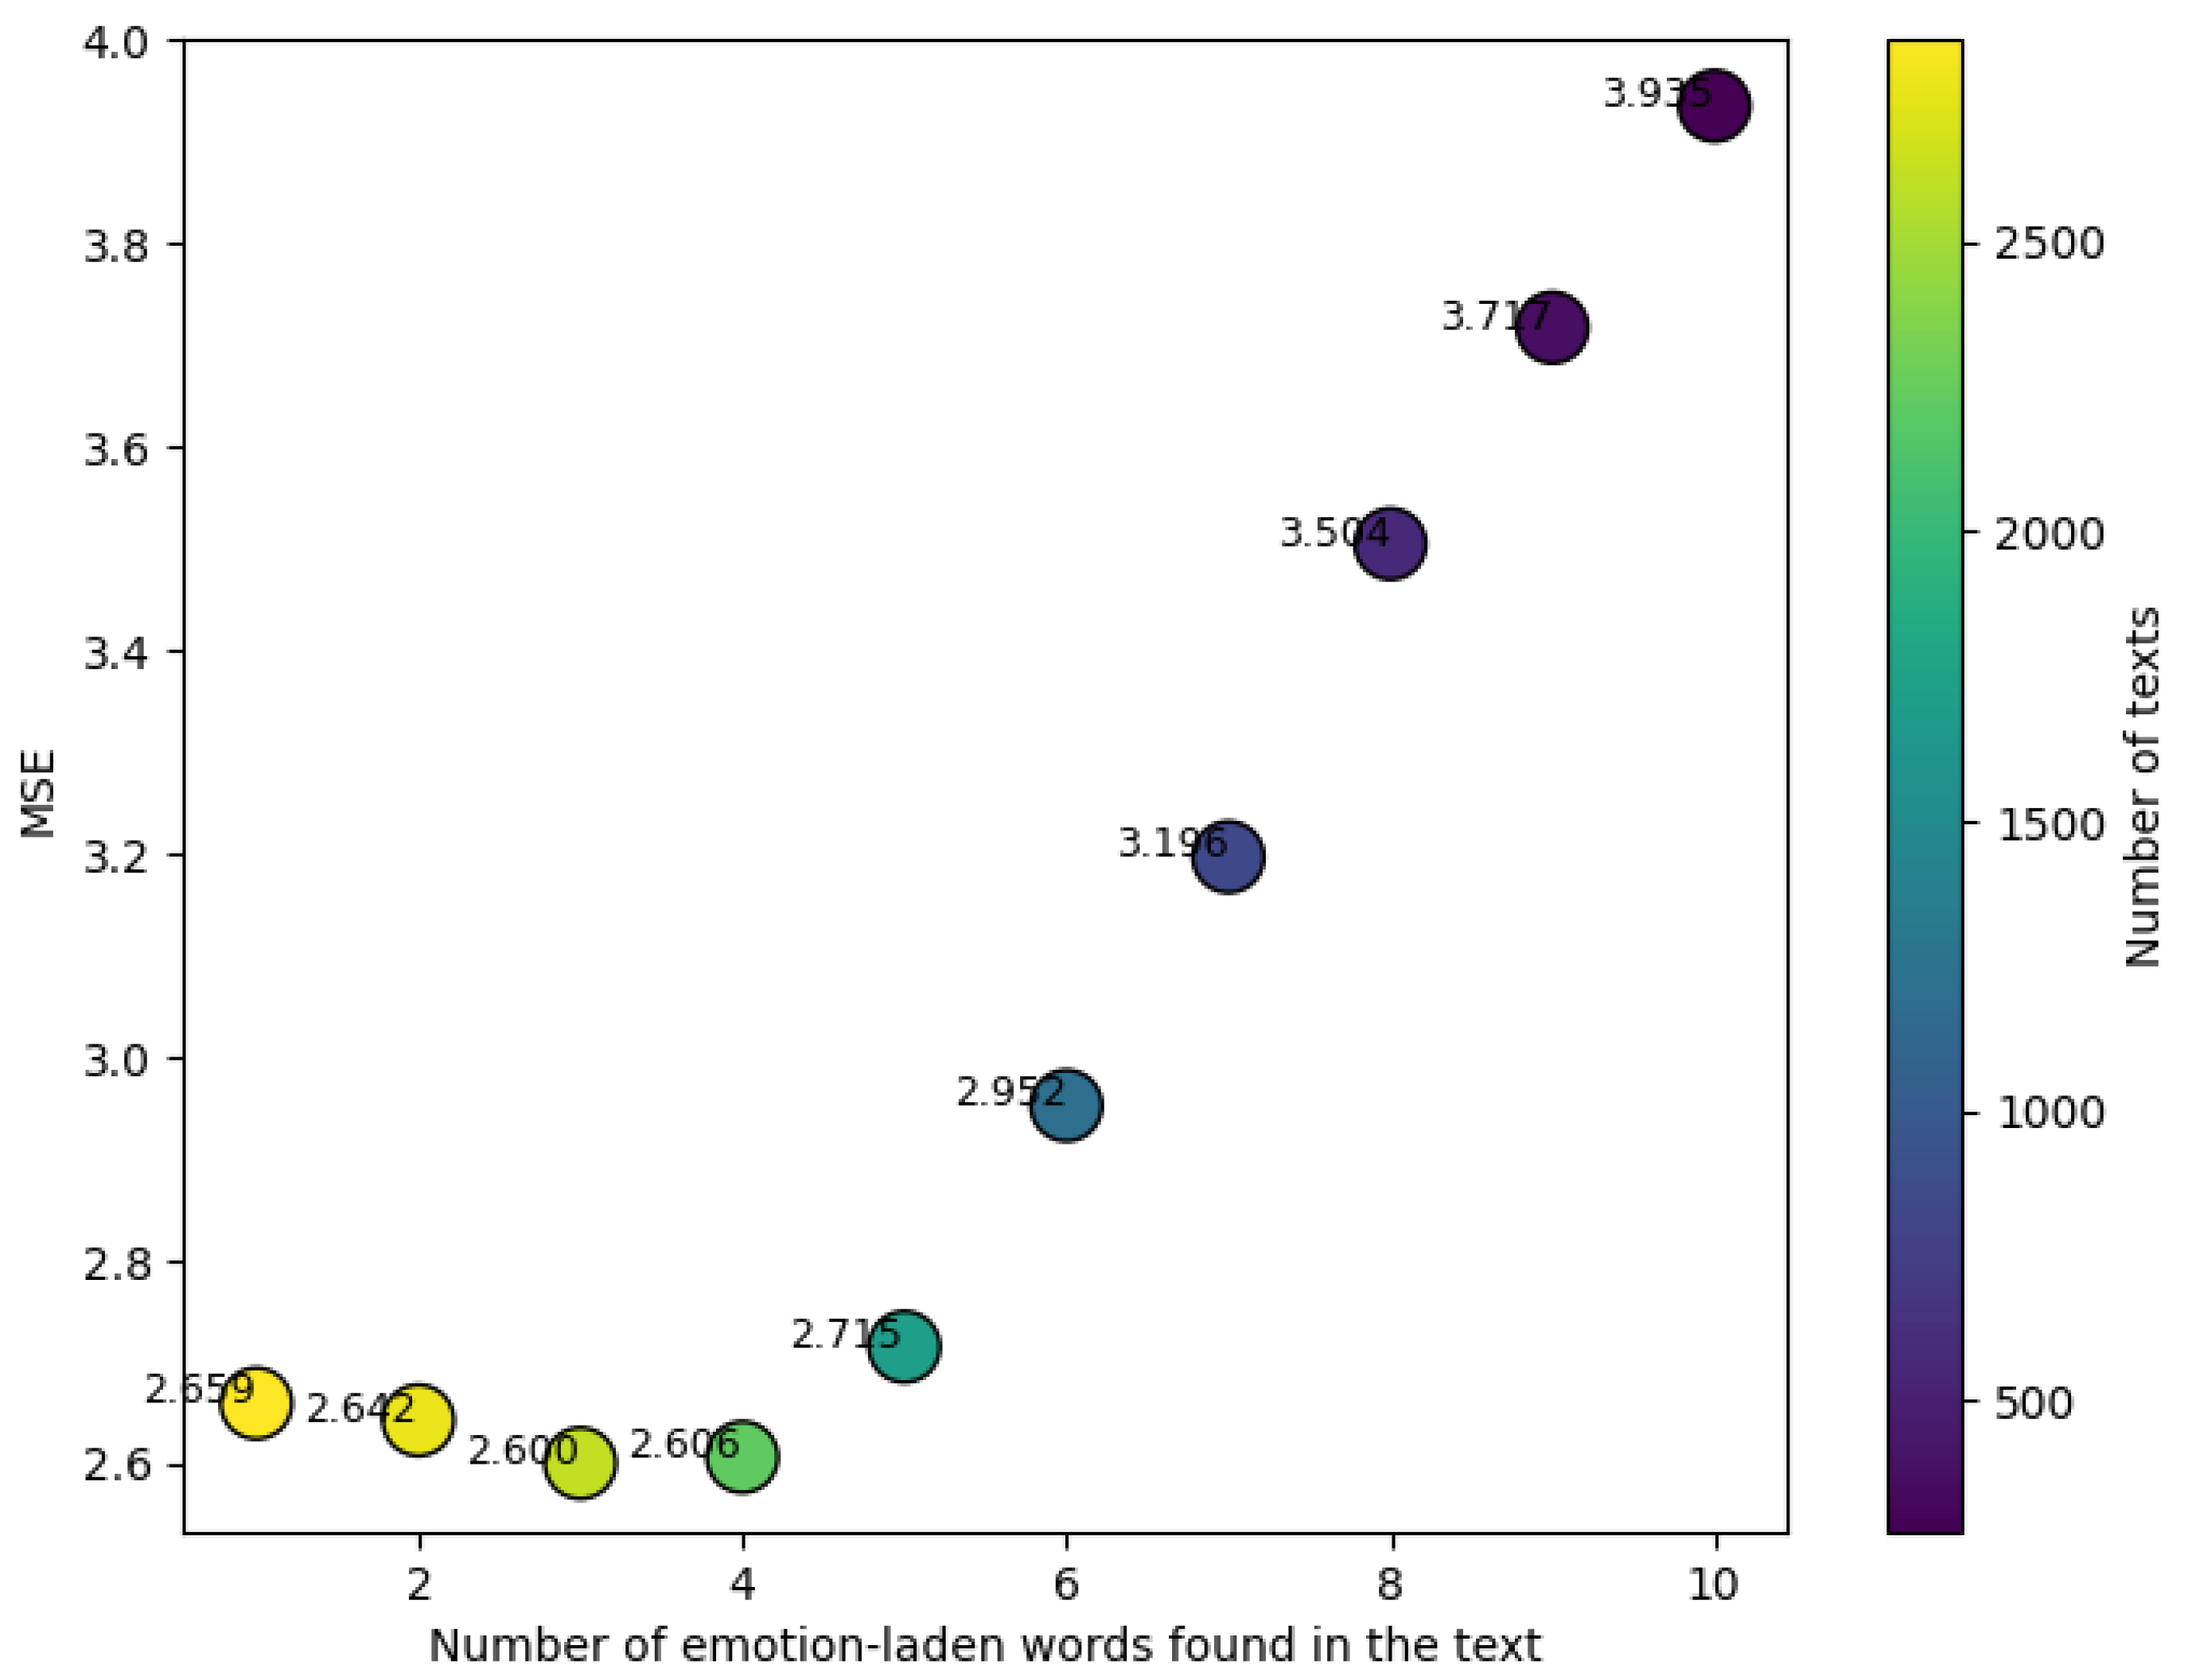
Figure 7.
Plot of the number of emotion-laden words found in the text vs. MSE vs. number of texts.
Figure 8.
Method used to evaluate machine learning algorithms.
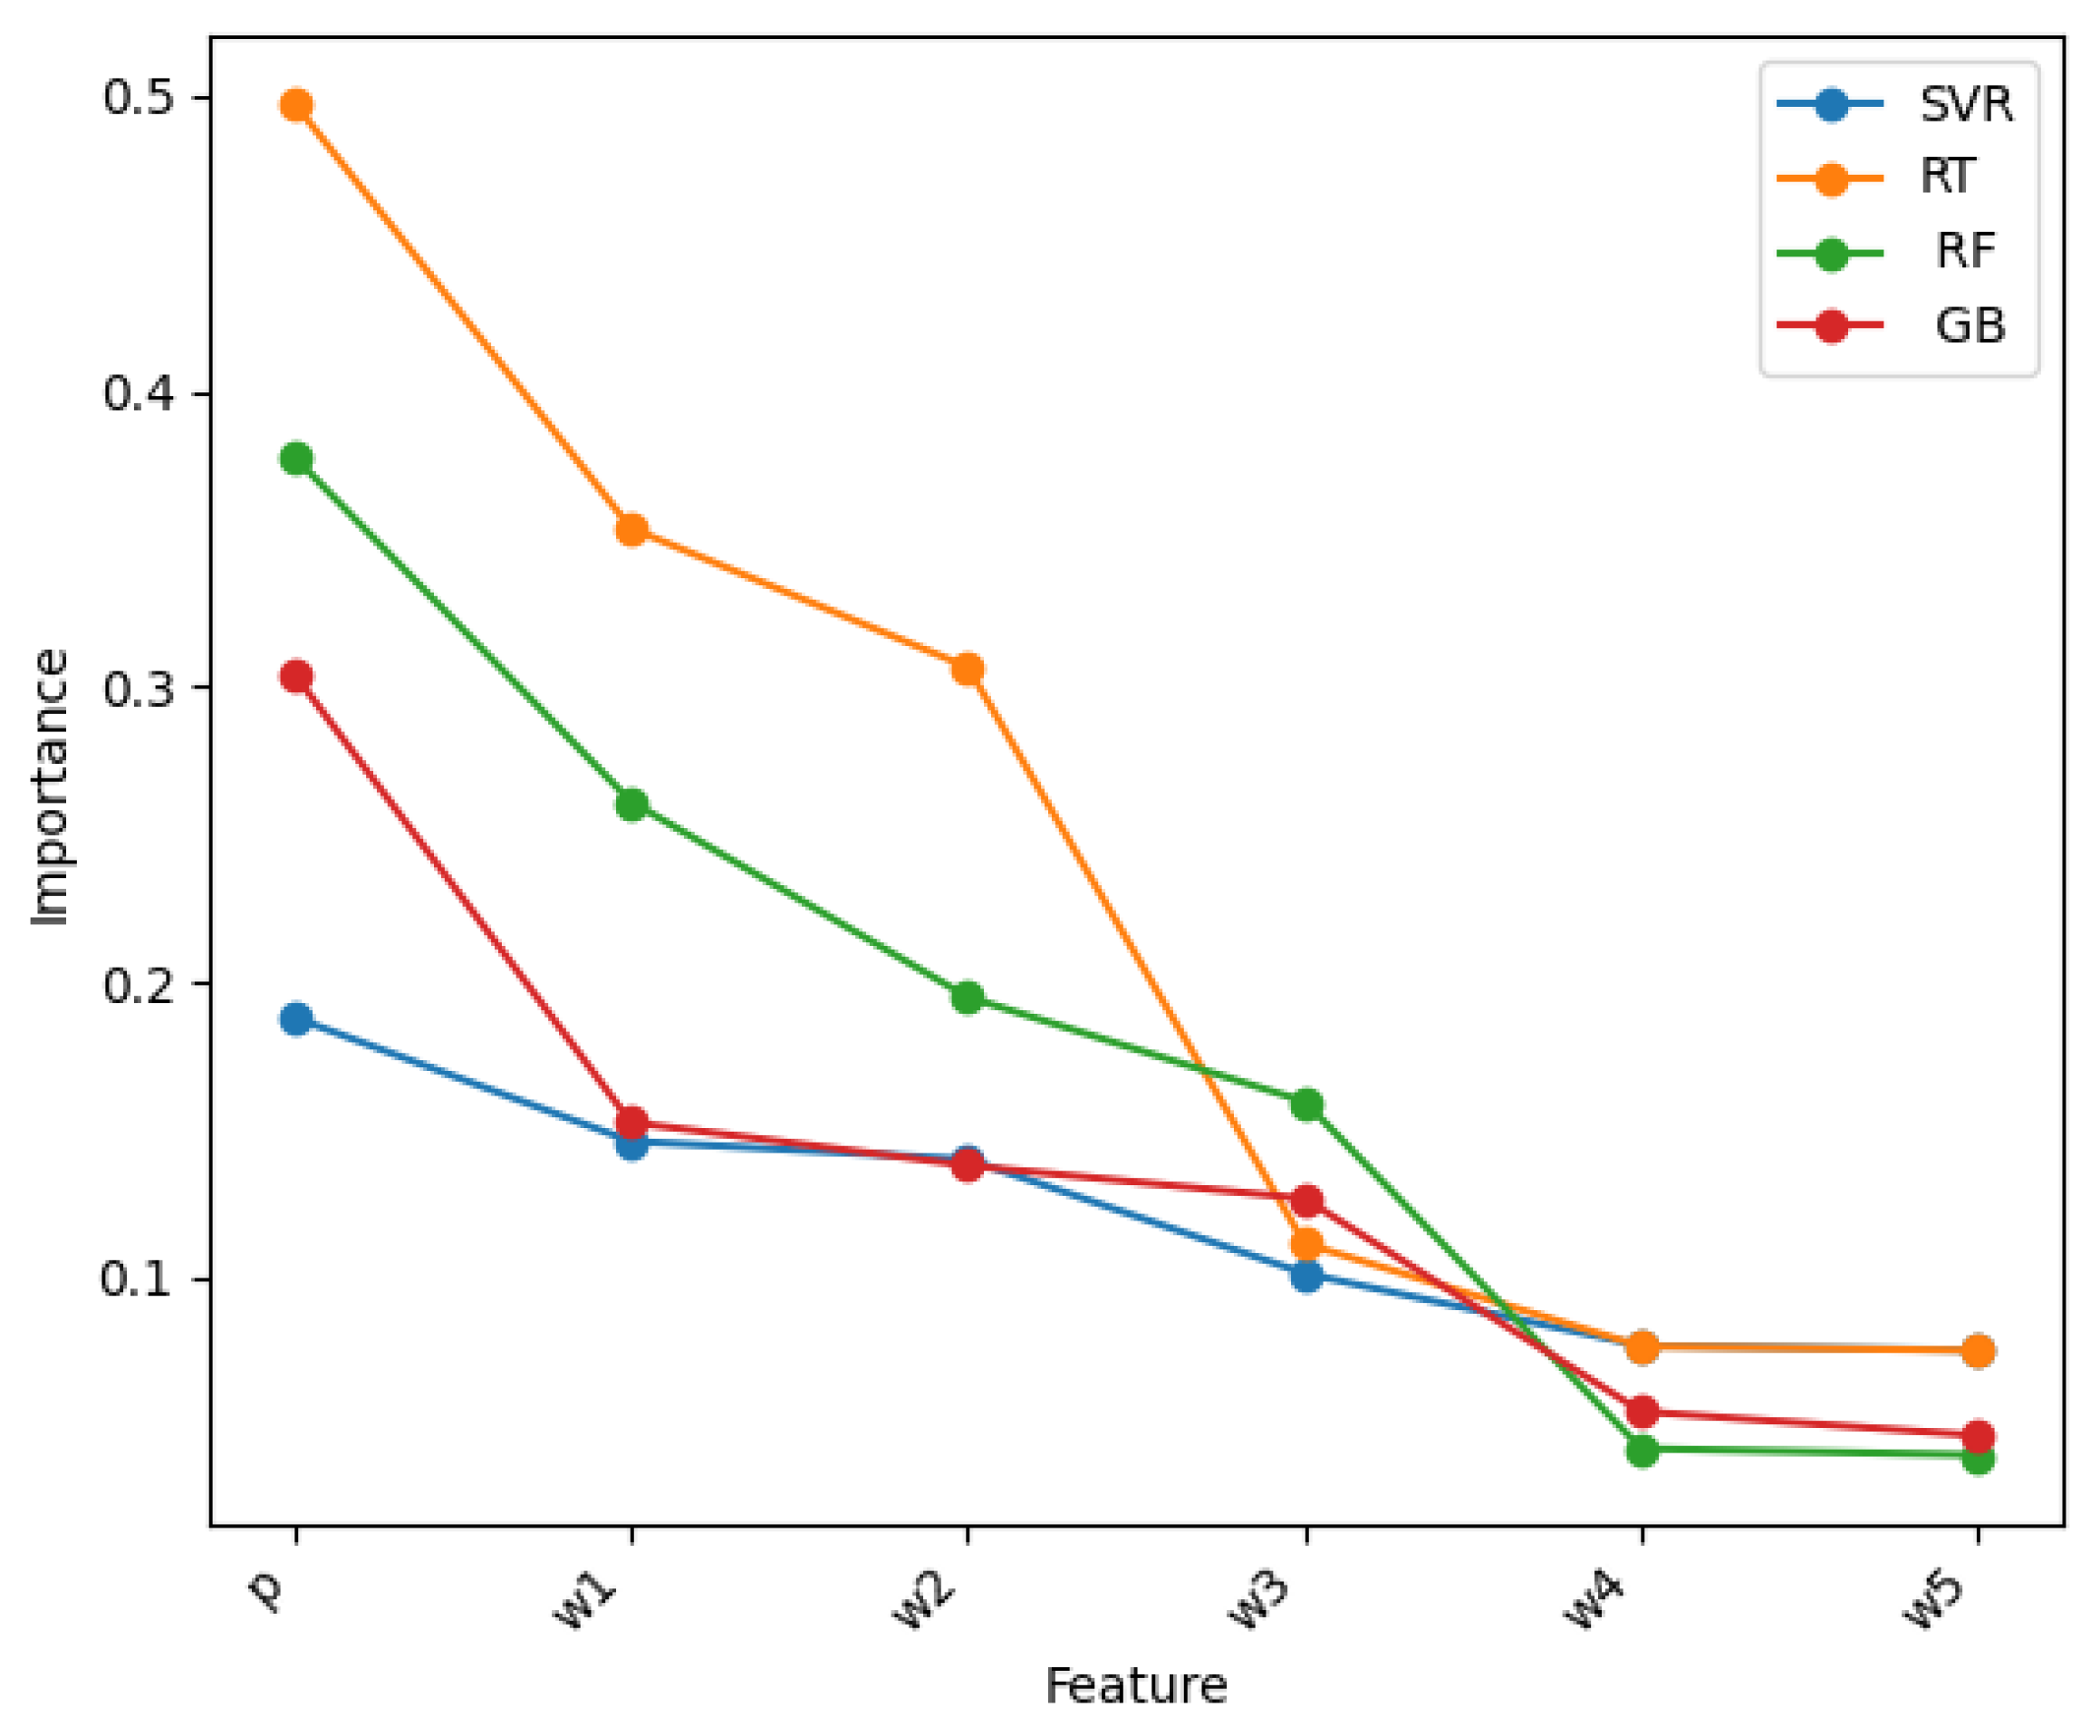
Figure 9.
Feature importance values of the lexicon-based polarity p and the five most important words in the conventional machine learning models.
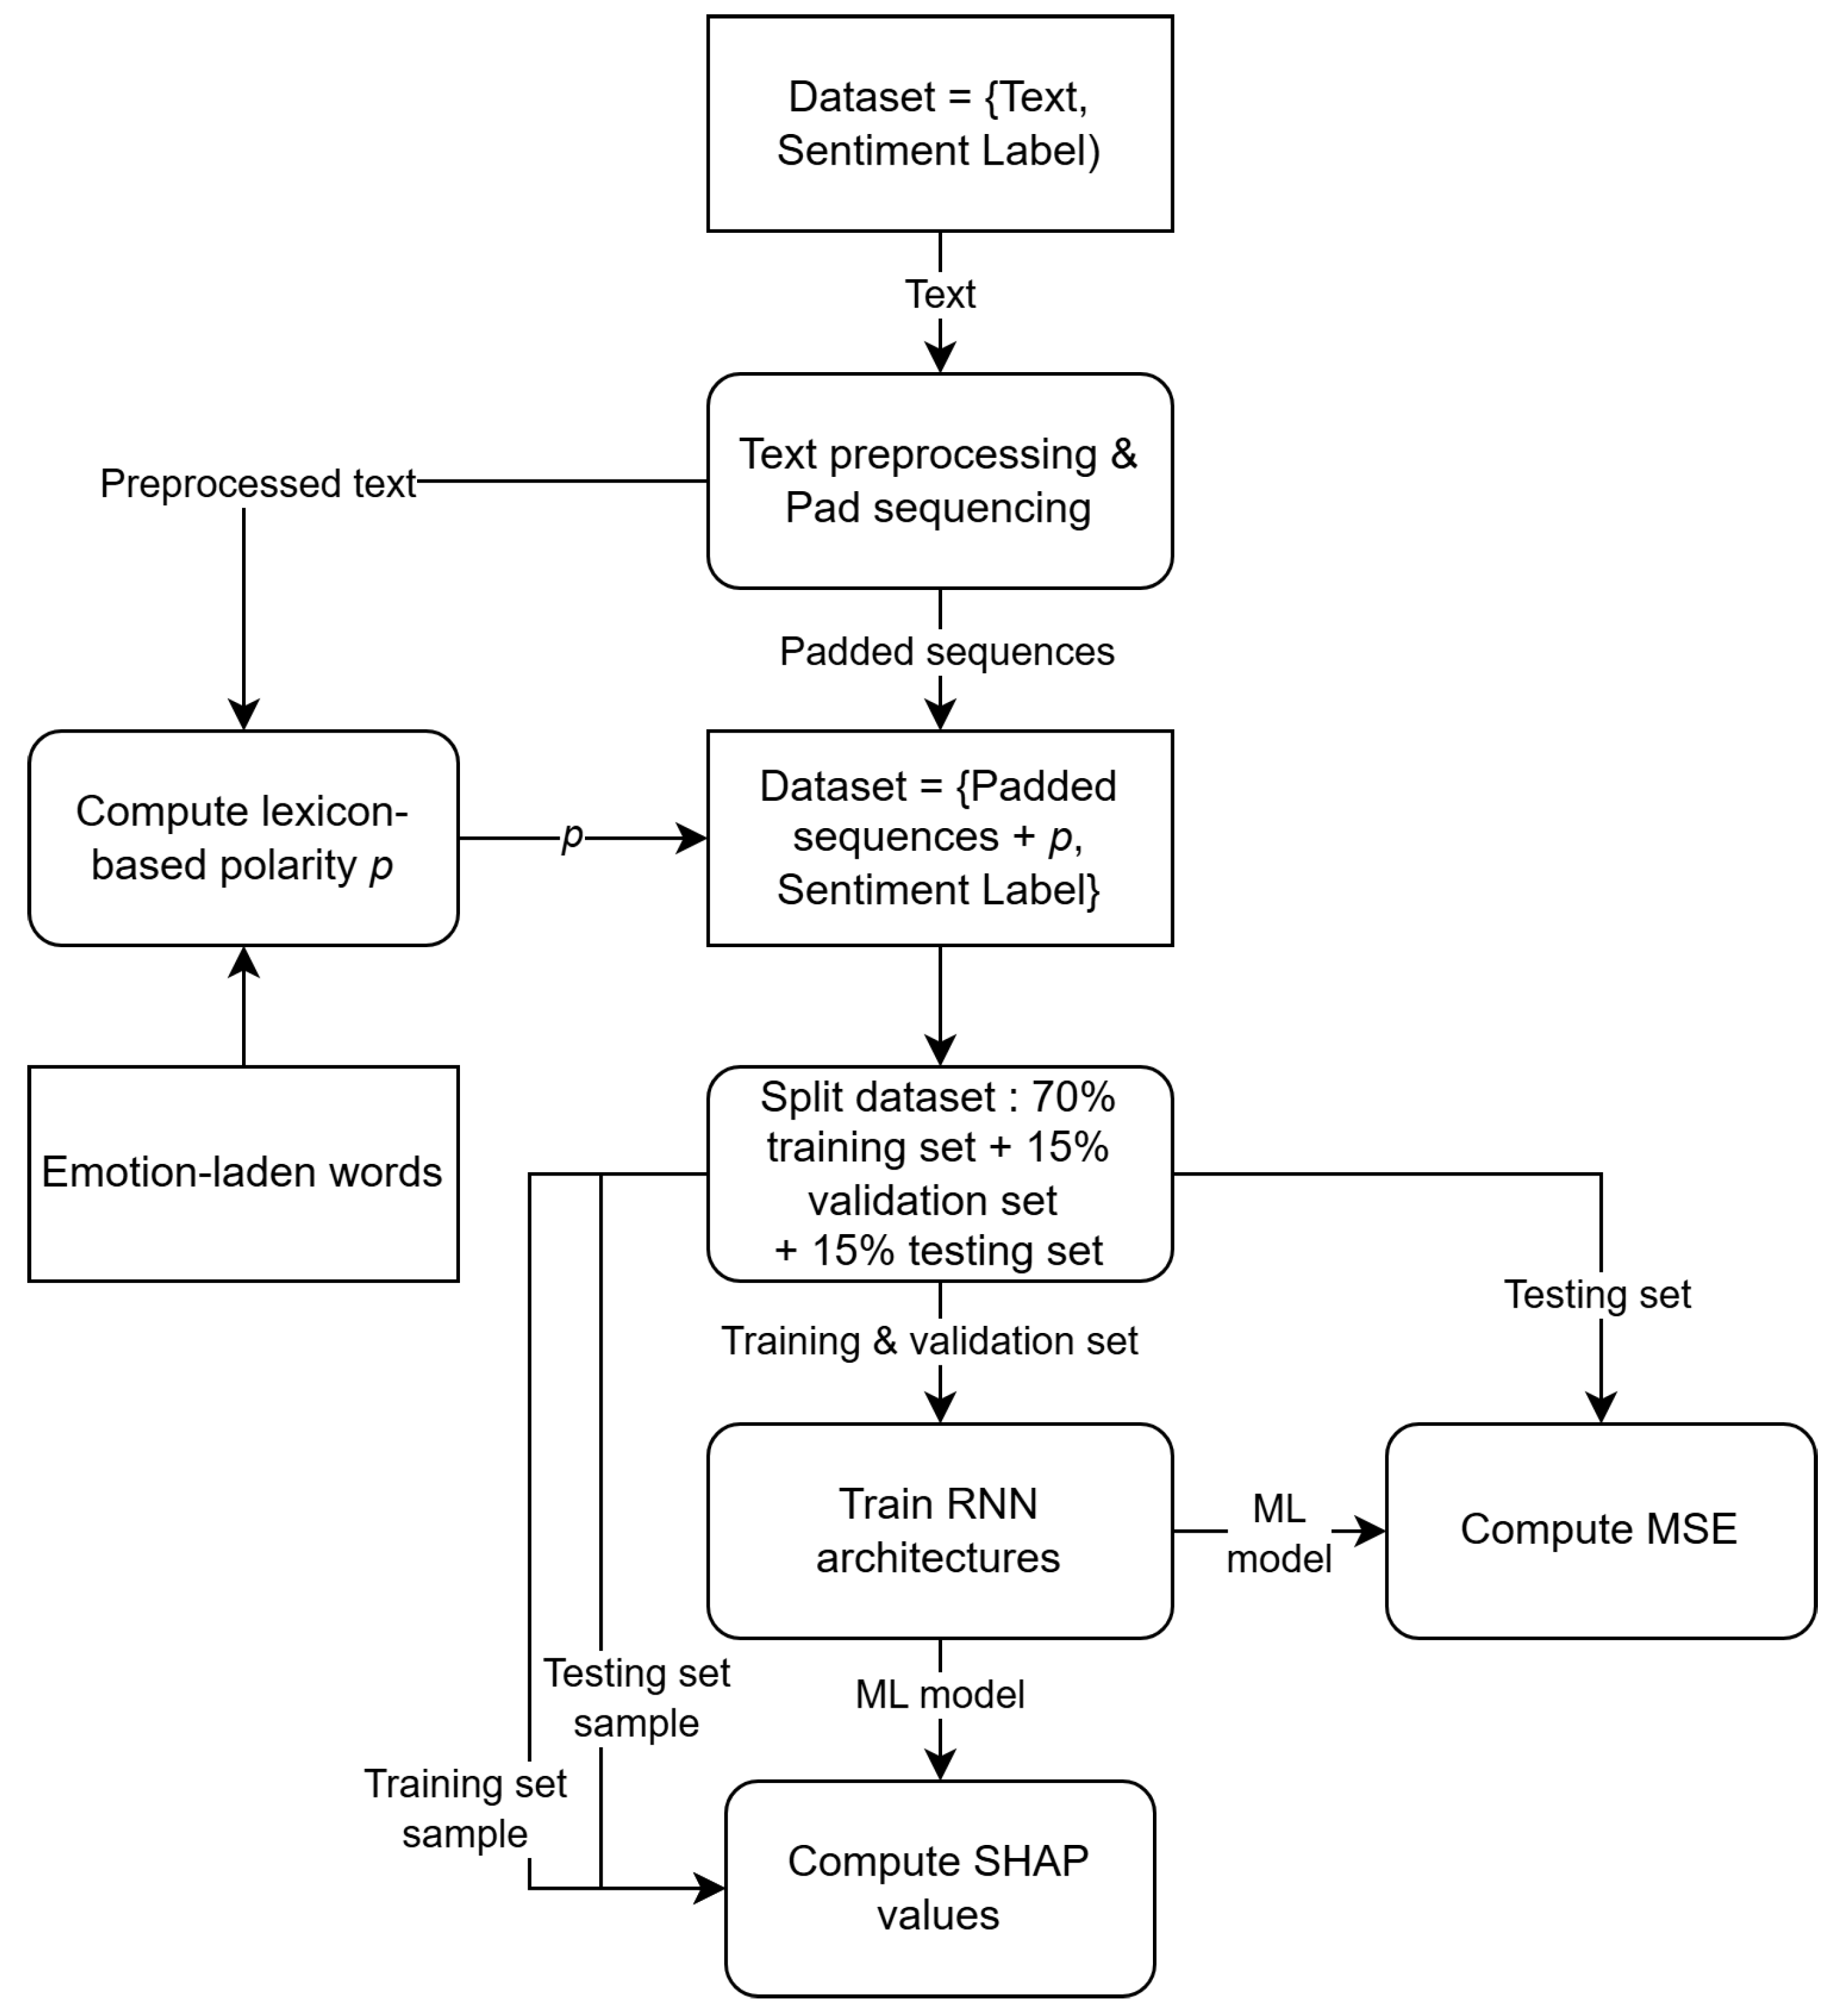
Figure 10.
Method used to evaluate RNN architectures.
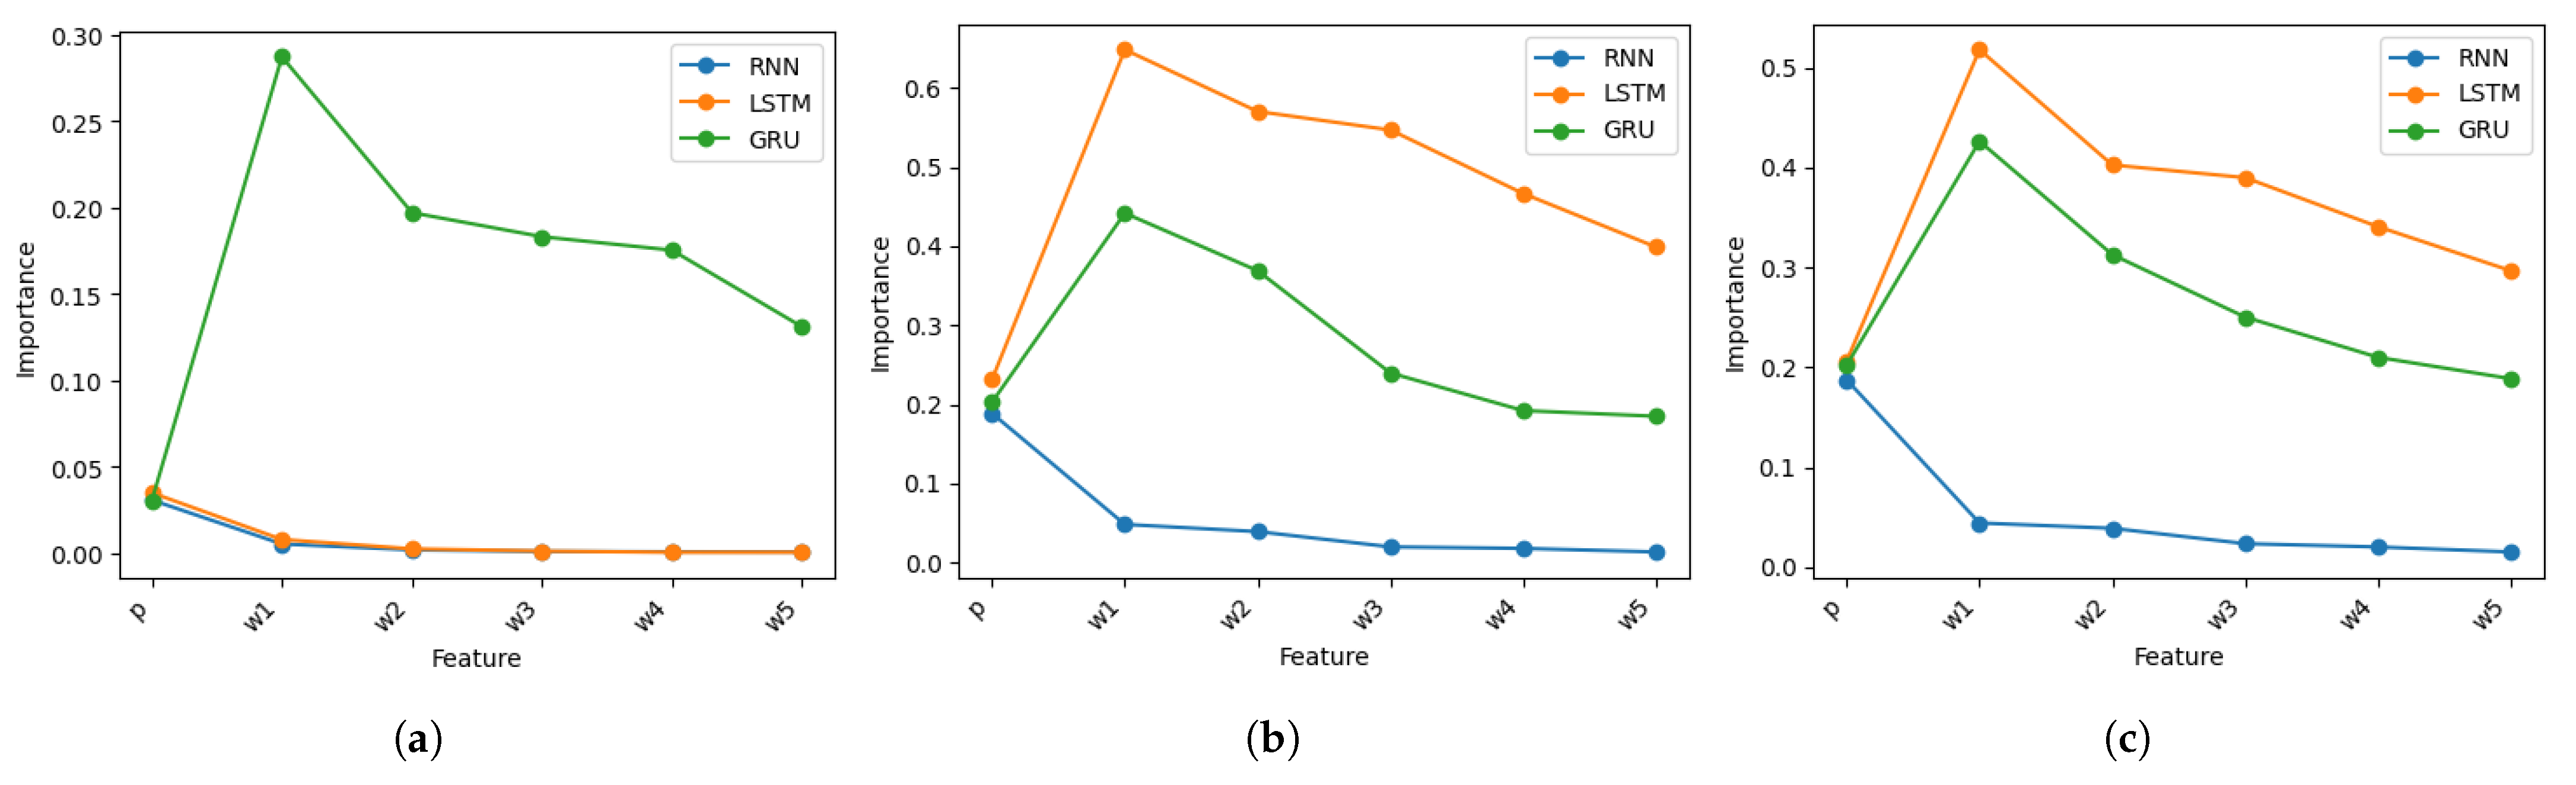
Figure 11.
Comparison of feature importance between text features and the lexicon-based polarity p for different RNN architectures: (a) With . (b) With . (c) With .
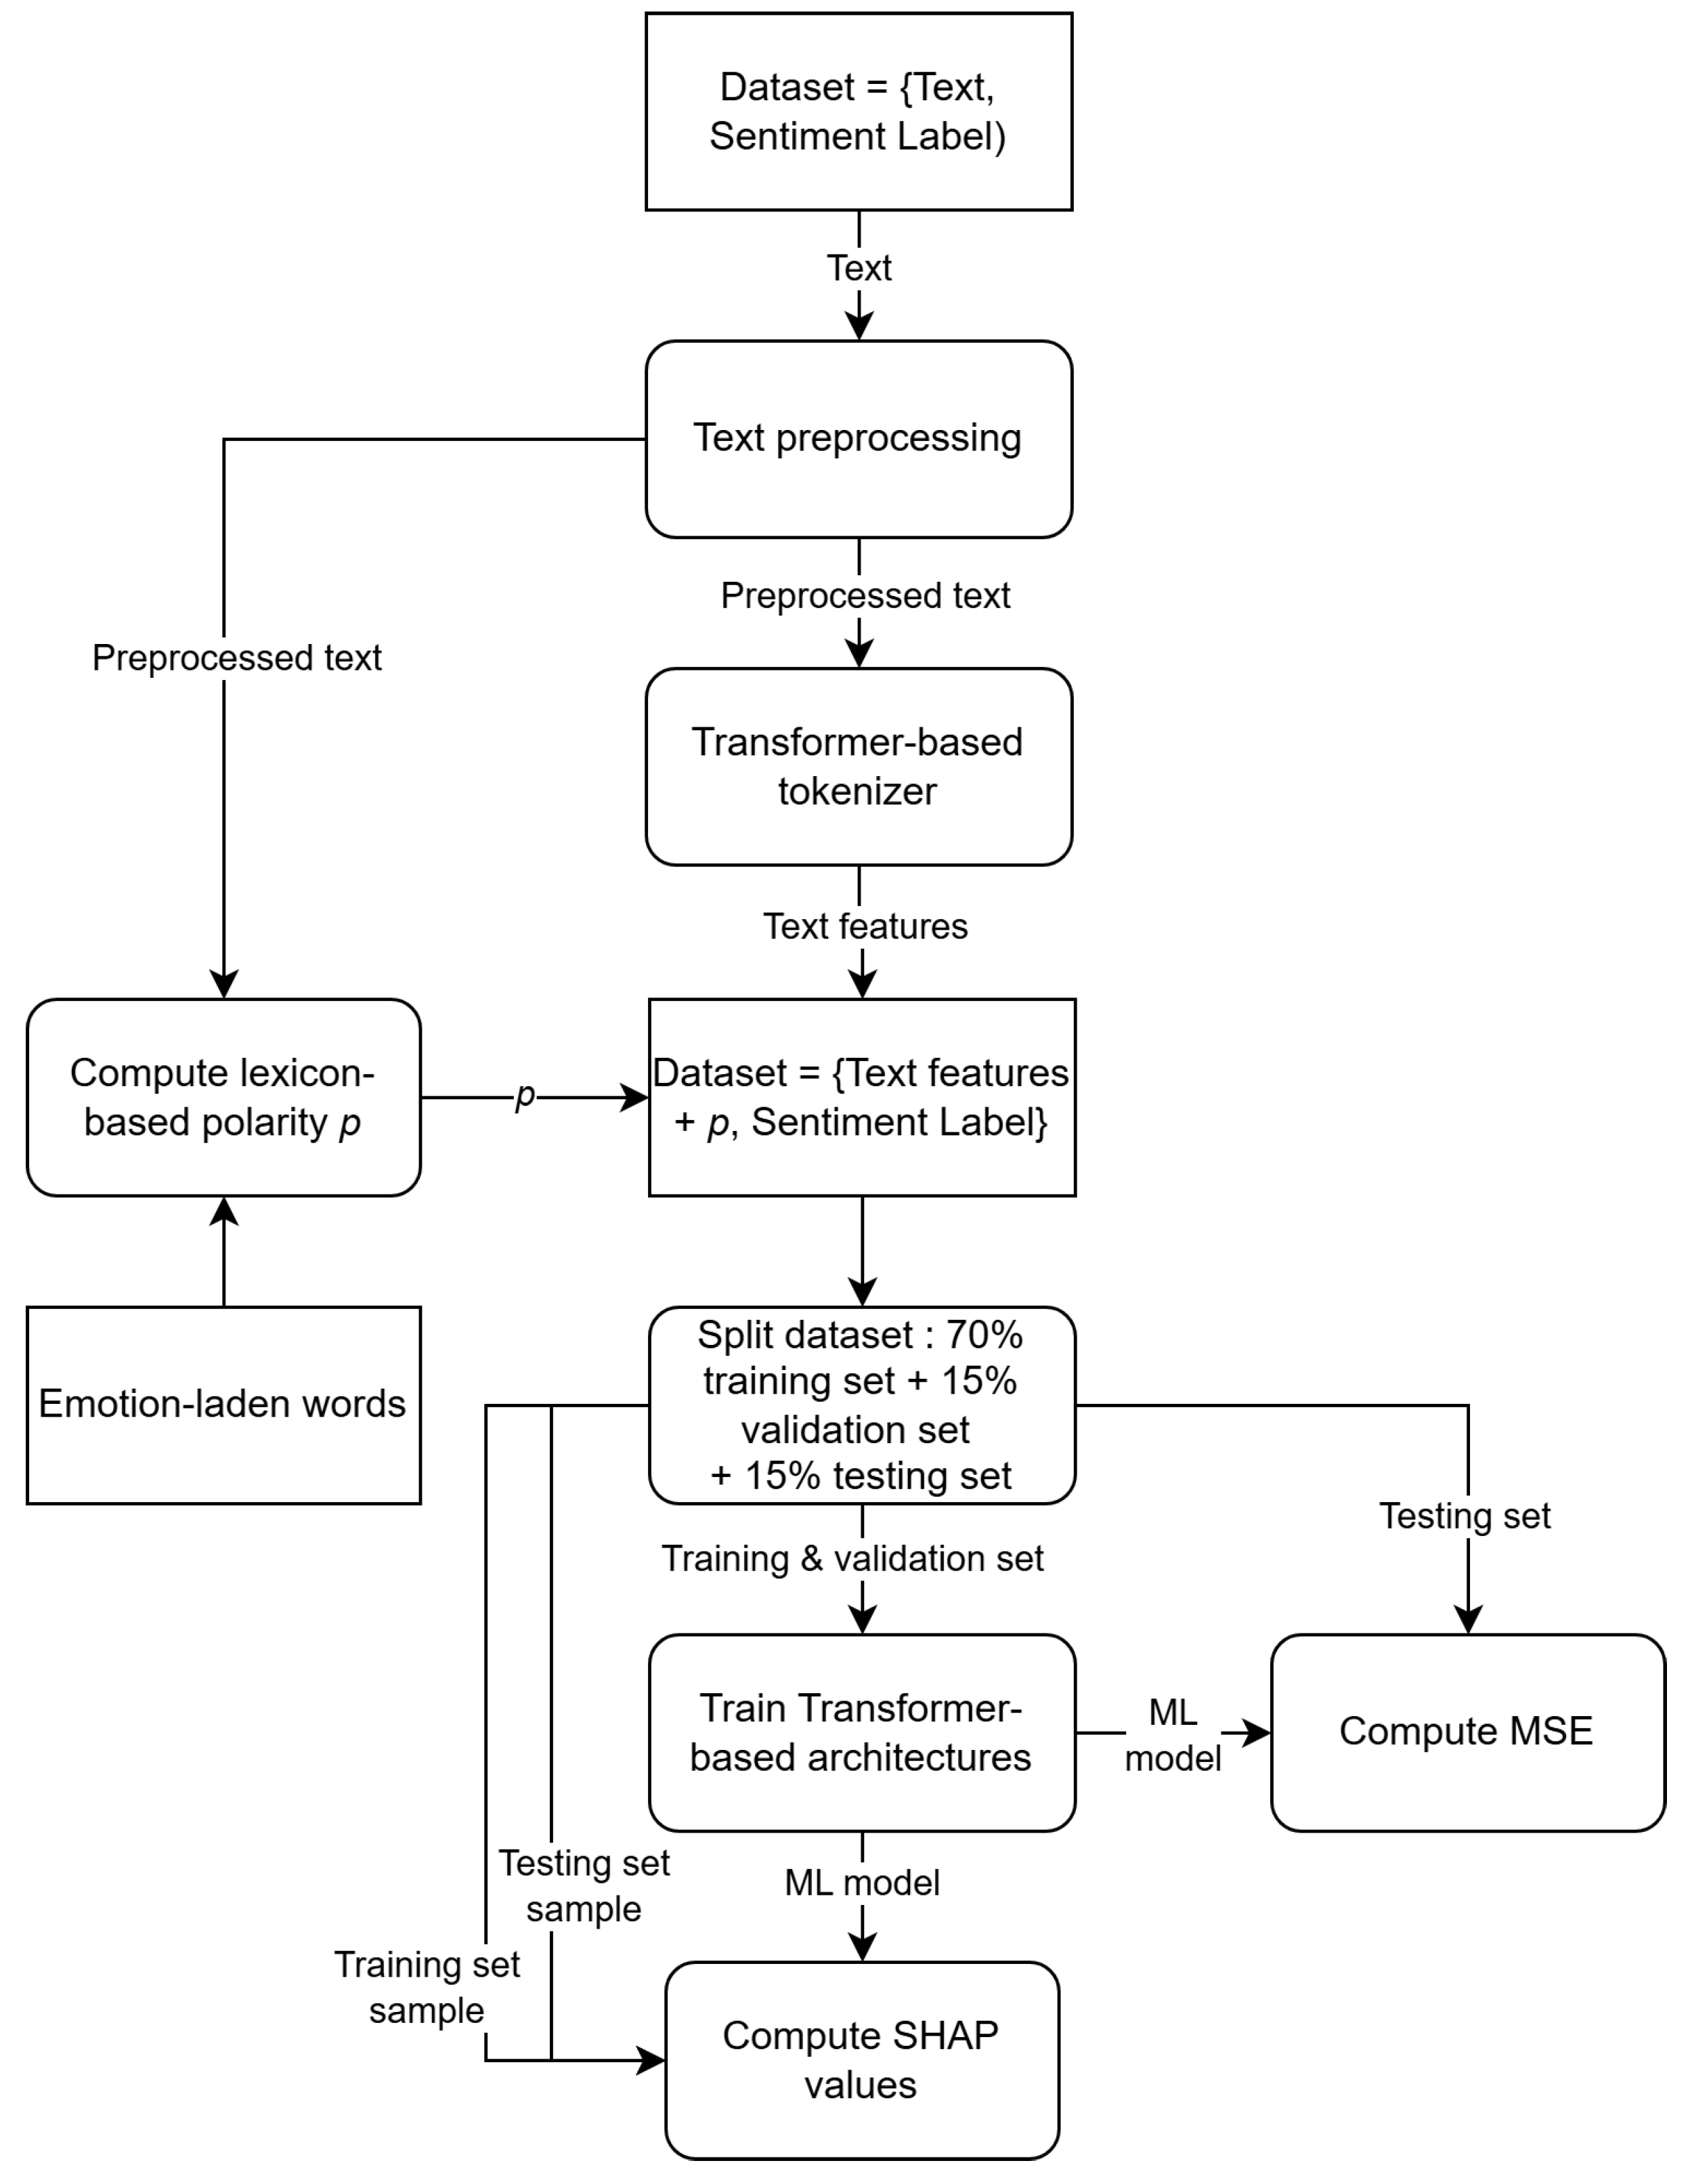
Figure 12.
Method used to evaluate transformer-based architectures.
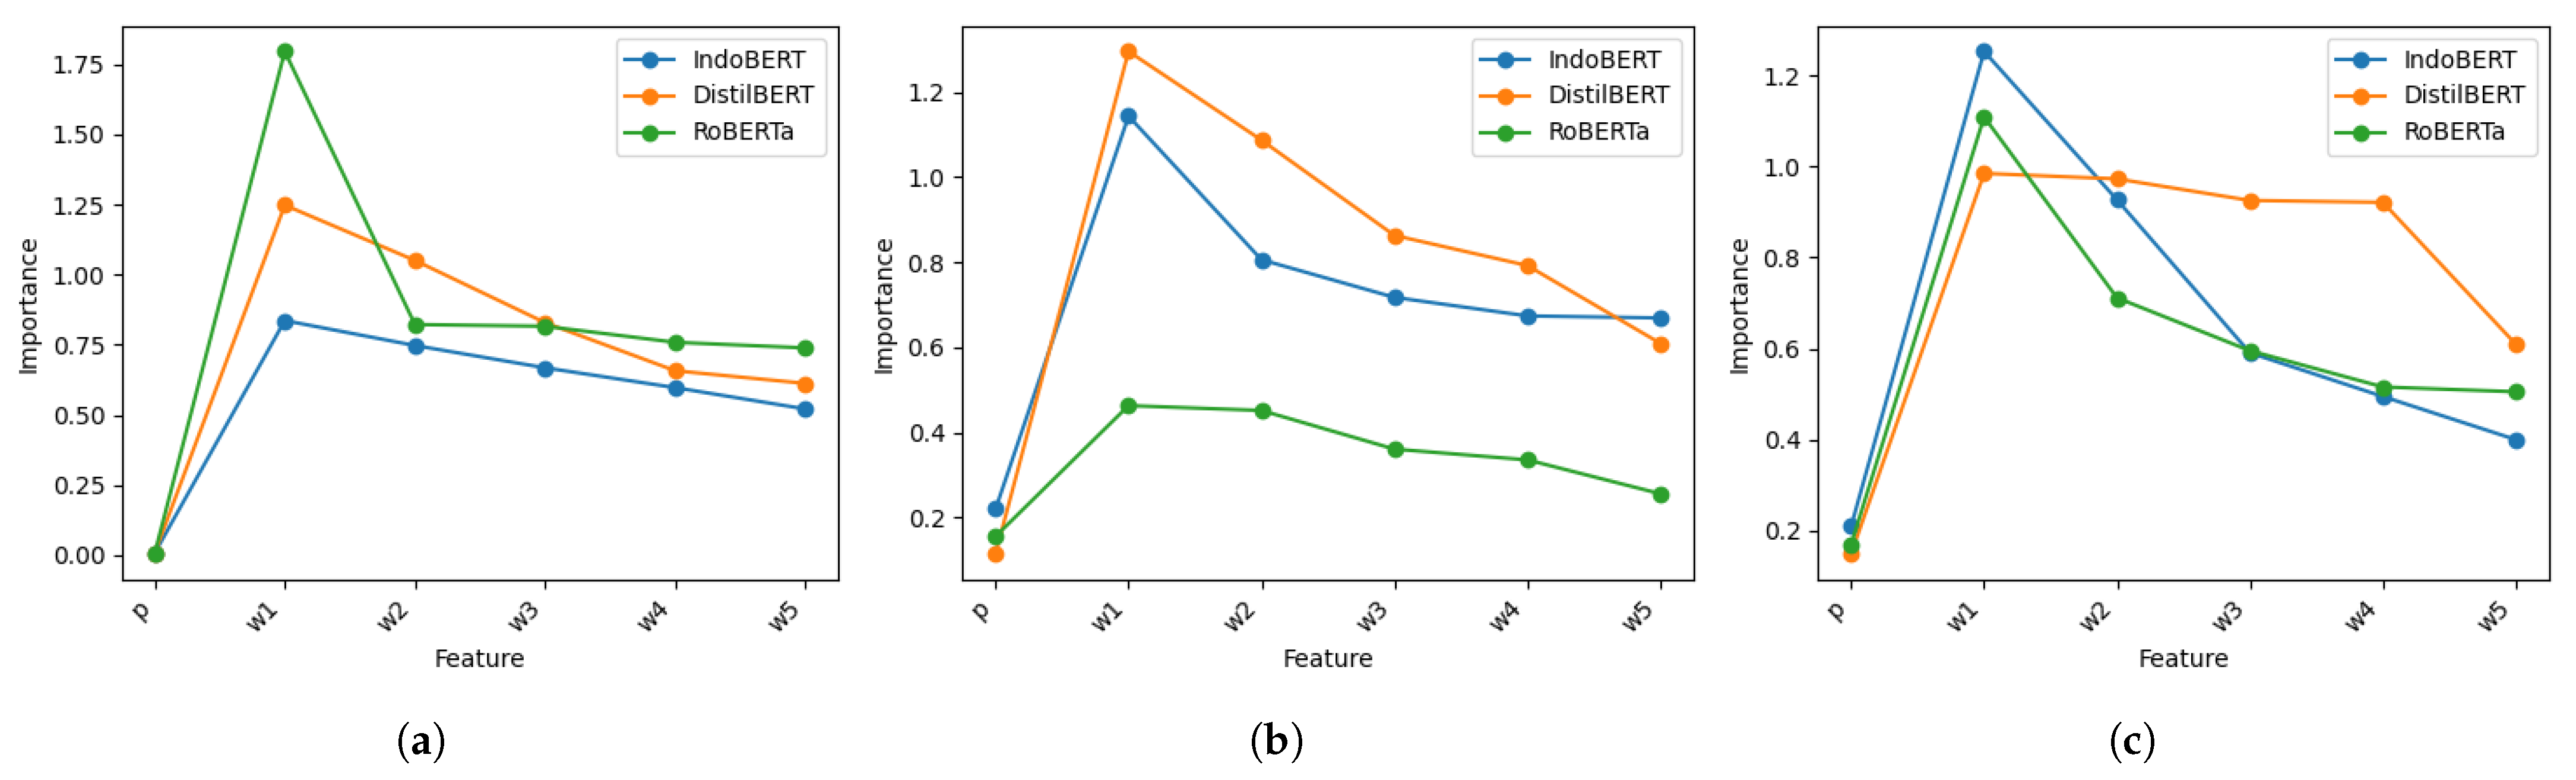
Figure 13.
Comparison of feature importance between text features and the lexicon-based polarity p for different transformer-based architectures: (a) With . (b) With . (c) With .
Table 1.
Sample of emotion-laden words.
| Indonesian | English | Valence Score | Valence SD |
|---|
| bersih | clean | 8.11 | 1.46 |
| buruk | bad | 2.37 | 1.66 |
| cerdas | smart | 8.02 | 1.54 |
| komplain | complaint | 3.02 | 1.45 |
| konsisten | consistent | 7.67 | 1.49 |
| nakal | naughty | 2.39 | 1.64 |
| pandai | clever | 7.78 | 1.87 |
| panas | hot | 3.15 | 1.59 |
| penuh | full | 5.24 | 1.99 |
| saksi | witness | 5.59 | 1.80 |
Table 2.
Distribution of annotators for the first dataset.
| Set | Men | Women | Total |
|---|
| A | 20 | 26 | 46 |
| B | 11 | 34 | 45 |
| C | 12 | 33 | 45 |
Table 3.
Intraclass correlation coefficient (ICC) values for the first dataset.
| Set | ICC2 | F-Statistic | p-Value | 95% CI |
|---|
| A | 0.56099 | 62.784823 | 0.0 | |
| B | 0.546806 | 61.519679 | 0.0 | |
| C | 0.552751 | 62.640933 | 0.0 | |
Table 4.
Sample of the labeled dataset.
| Indonesian | English | X | Y | Z | Label |
|---|
| Min @KAI121 kereta api #Gumarang tujuan Jakarta-Surabaya itu sudah busuk sebusuknya kereta. banyak berhentinya, fasilitas payah. Memalukan. Segera peremajaan dan buang ke laut kereta busuk itu! | Admin @KAI121 the #Gumarang train from Jakarta to Surabaya is as rotten as a train can be. Lots of stops, poor facilities. Embarrassing. Begin refurbishment immediately and throw that rotten train into the sea! | 1 | 2 | 1 | 1.33 |
| @mrtjakarta AC di stasiun bundaran HI tidak nyala dan panas sekali di dalam peron. Kereta juga mengalami gangguan operasional. Gimana nih MRT Jakarta?Baru operasional udah ada gangguan operasional. | @mrtjakarta The AC at the HI roundabout station is not working, and it is very hot on the platform. The train is also experiencing operational disruptions. Why MRT Jakarta? It has only just started operating, and there are already operational disruptions. | 4 | 3 | 2 | 3.00 |
| Tadi liat eskalator di Stasiun Sudirman sdh berfungsi lagi. Terima kasih @CommuterLine smoga eskalator2 yg rusak di stasiun lainnya pun segera diperbaiki. Ayo jadikan stasiun commuter line jadi stasiun yg ramah lansia and ibu hamil. | Earlier, I saw that the escalator at Sudirman Station is working again. Thank you @CommuterLine, hopefully the broken escalators at other stations will be repaired soon. Let’s make commuter line stations friendly to older people and pregnant women. | 8 | 7 | 8 | 7.67 |
| @KAI121 orang tua dan anak2 bgtu nyaman naik keretaapi | @KAI121 parents and children are so comfortable riding the train | 8 | 8 | 9 | 8.33 |
Table 5.
Intraclass correlation coefficient (ICC) for the second dataset.
| Metric | Value |
|---|
| ICC2 | 0.576 |
| F-statistic | 6.618 |
| p-value | 0.0 |
| 95% CI | [0.41, 0.69] |
Table 6.
Comparison of the performance of machine learning models when using TF-IDF alone and when combining TF-IDF with the lexicon-based polarity p.
| Algorithm | MSE Without p | MSE with p | Diff. |
|---|
| SVR | 1.231 | 1.138 | 0.093 |
| RT | 2.996 | 2.746 | 0.250 |
| RF | 1.492 | 1.485 | 0.007 |
| GB | 1.590 | 1.441 | 0.149 |
Table 7.
Comparison of the performance of RNNs when using word embeddings alone and when combining them with the lexicon-based polarity p.
| Architecture | MSE () | MSE () | | MSE () | | MSE () | |
|---|
| Vanilla RNN | 2.778 | 2.710 | 0.068 | 2.456 | 0.254 | 2.587 | 0.191 |
| LSTM | 2.778 | 2.699 | 0.079 | 1.937 | 0.841 | 1.779 | 0.999 |
| GRU | 2.612 | 2.267 | 0.345 | 1.886 | 0.726 | 1.916 | 0.696 |
Table 8.
Comparison of the performance of transformer-based architectures when using contextual embeddings alone and when combining them with the lexicon-based polarity p.
| Architecture | MSE () | MSE () | | MSE () | | MSE () | |
|---|
| IndoBERT | 1.014 | 1.089 | −0.075 | 0.894 | 0.120 | 0.923 | 0.091 |
| DistilBERT | 1.295 | 1.398 | −0.103 | 1.034 | 0.261 | 1.410 | −0.115 |
| RoBERTa | 1.137 | 1.187 | −0.050 | 1.107 | 0.030 | 1.036 | 0.101 |
| Disclaimer/Publisher’s Note: The statements, opinions and data contained in all publications are solely those of the individual author(s) and contributor(s) and not of MDPI and/or the editor(s). MDPI and/or the editor(s) disclaim responsibility for any injury to people or property resulting from any ideas, methods, instructions or products referred to in the content. |
© 2025 by the authors. Licensee MDPI, Basel, Switzerland. This article is an open access article distributed under the terms and conditions of the Creative Commons Attribution (CC BY) license (https://creativecommons.org/licenses/by/4.0/).


 ,
, 


