
Intrusion Alert Analysis Method for Power Information Communication Networks Based on Data Processing Units


Abstract
1. Introduction
2. Background
3. Methodology
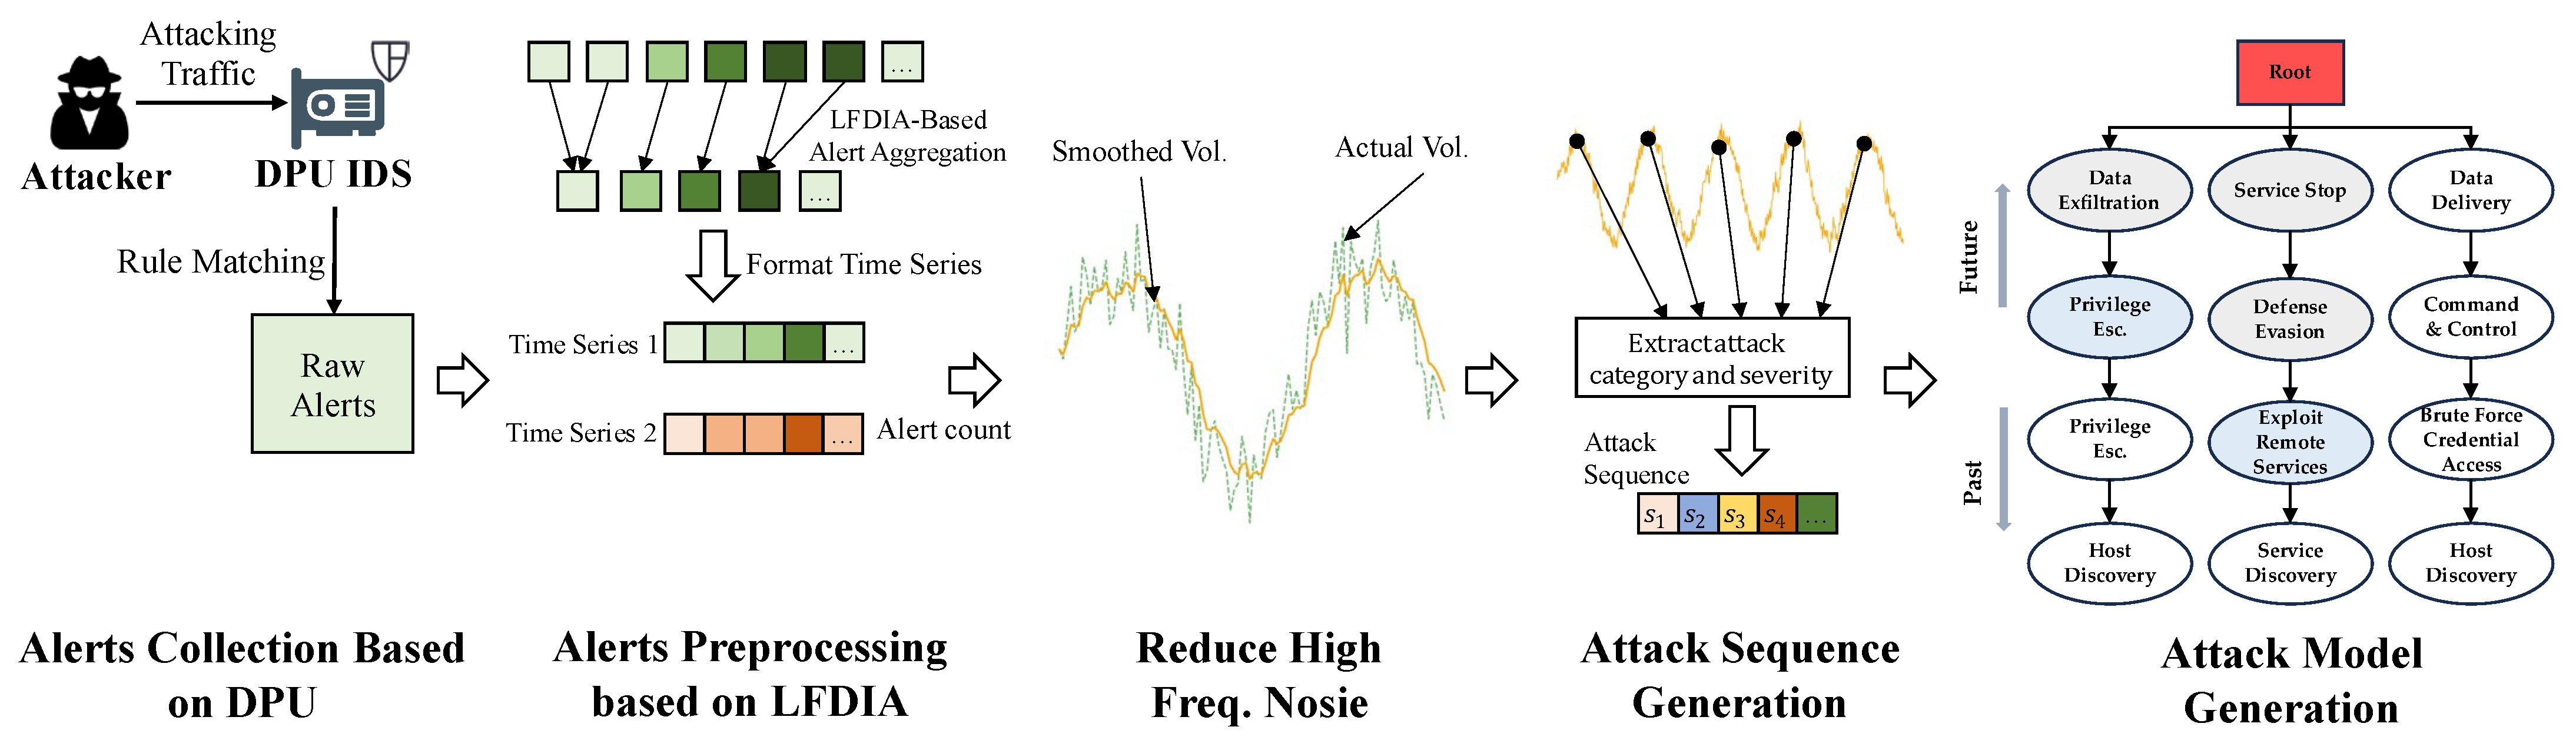
3.1. Overview
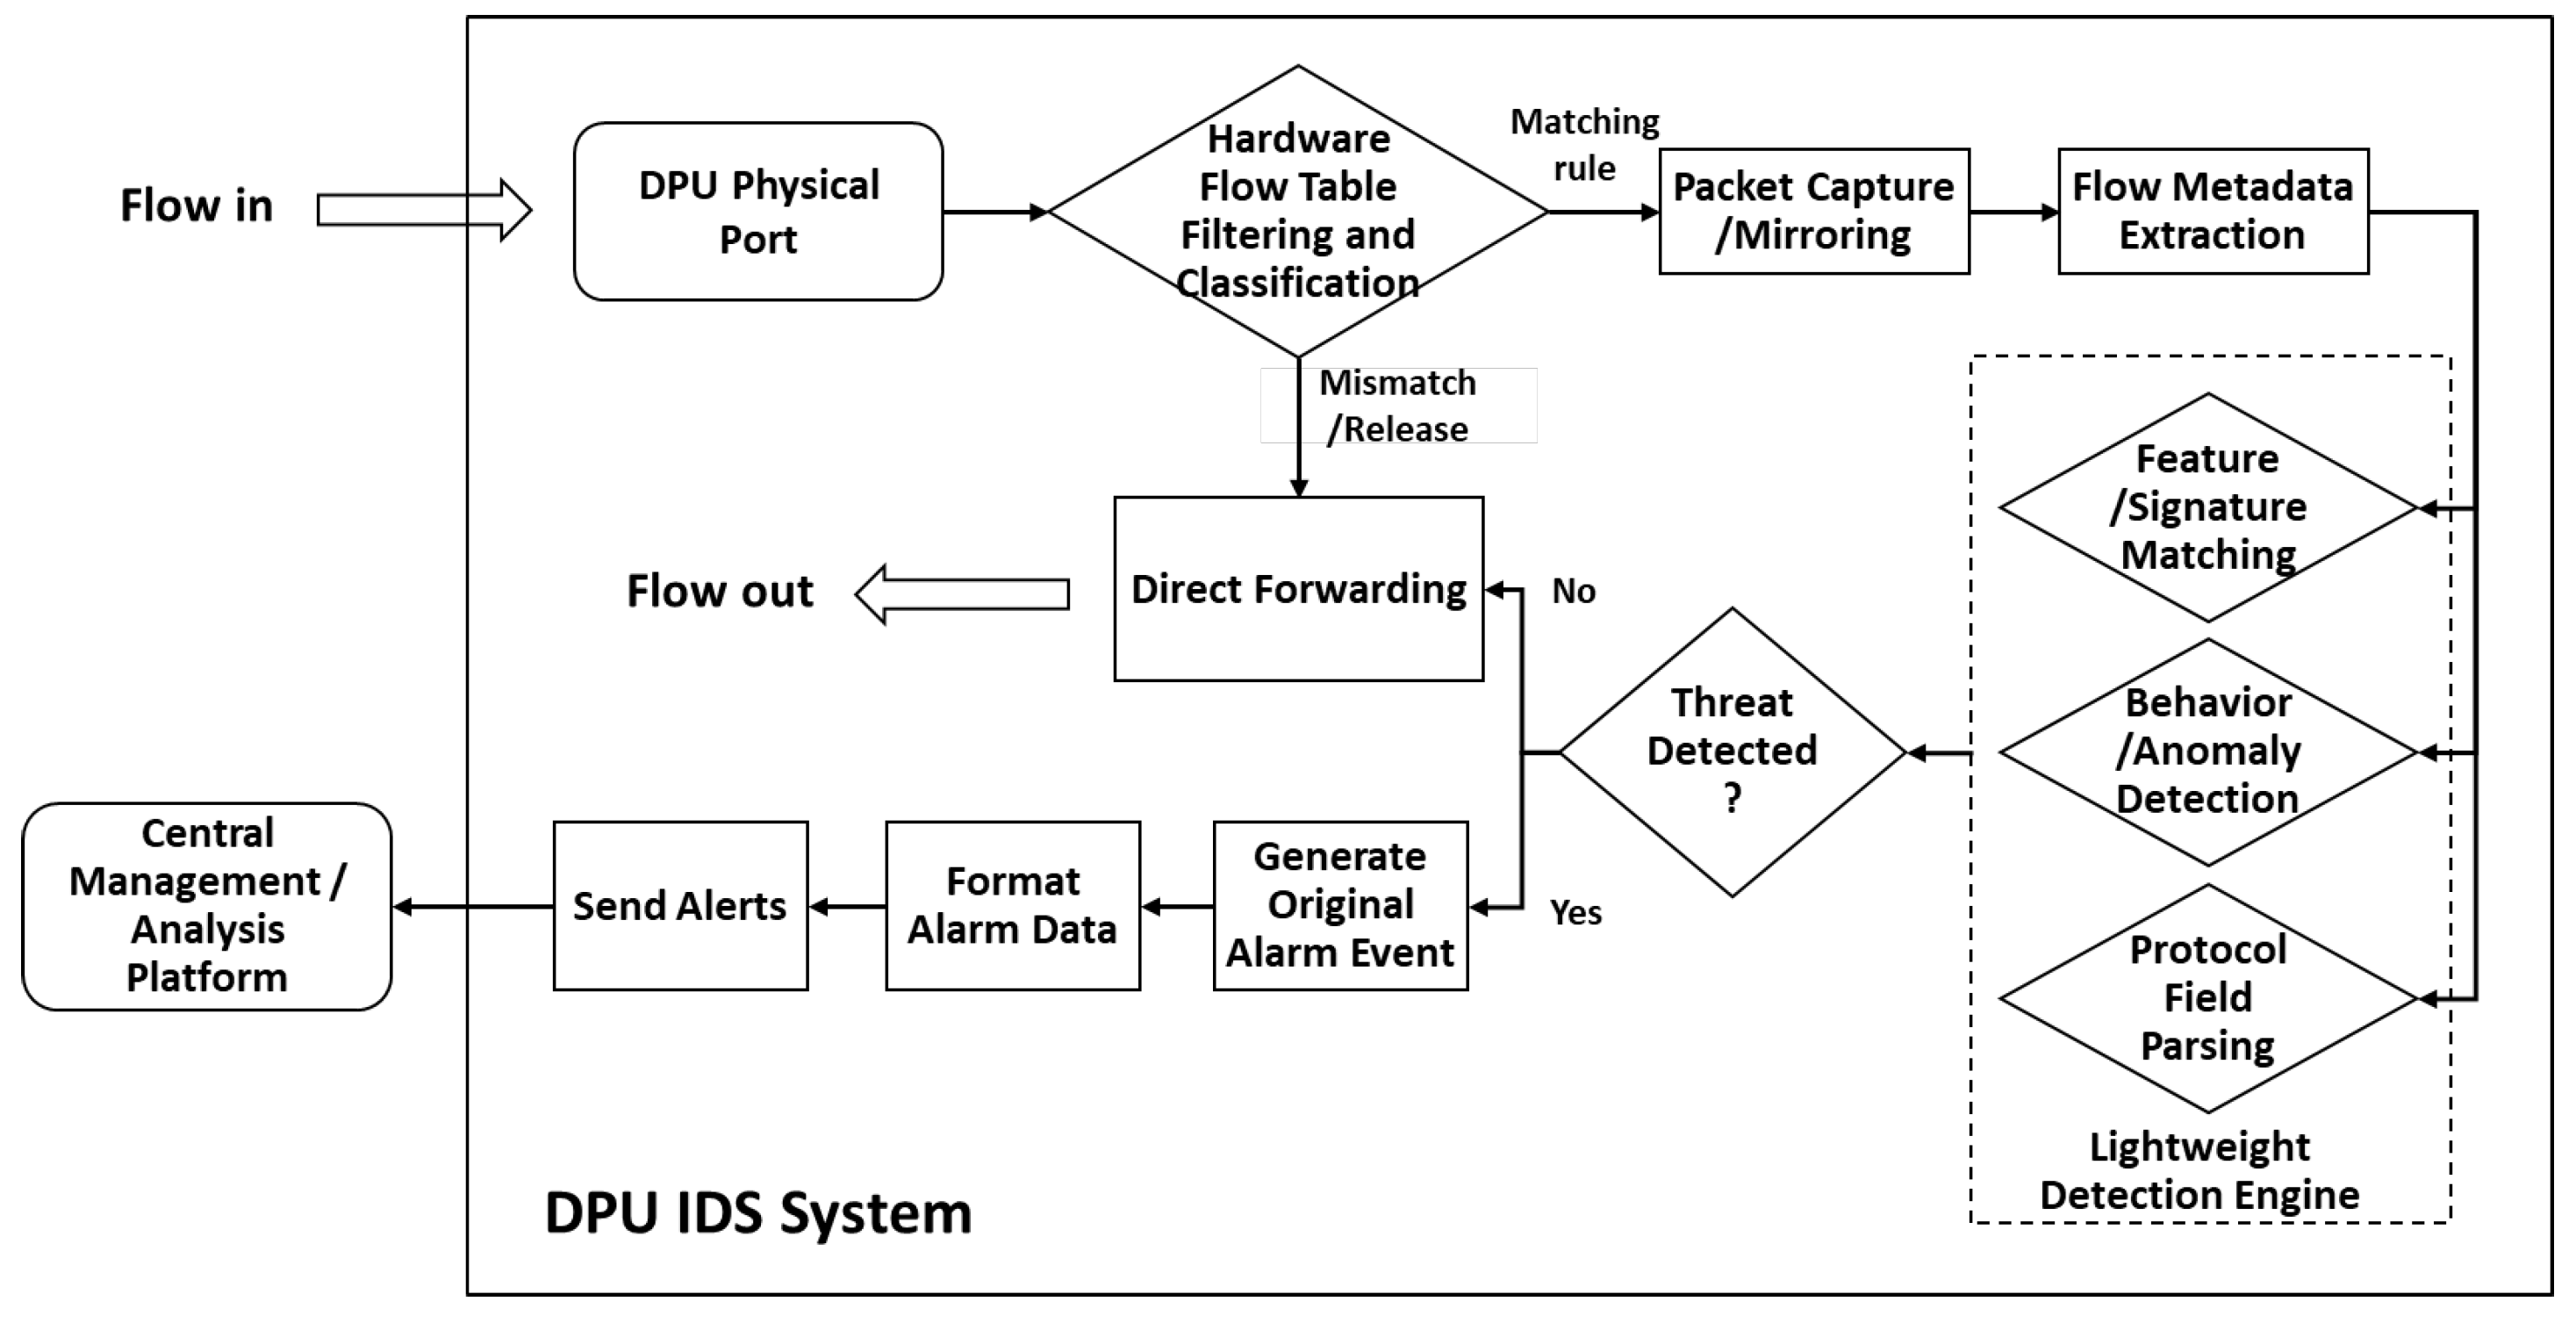
3.2. Alarm Data Collection Based on Distributed DPUs
- 1.
- Raw packets arrive at DPU physical interfaces for internal processing.
- 2.
- Hardware-accelerated filtering (TCAM/flow tables) determines traffic disposition: inspection, forwarding, or dropping.
- 3.
- Selected traffic is mirrored to processing units for the following:
- (a)
- Header parsing;
- (b)
- Flow metadata extraction (IP/port/protocol);
- (c)
- Statistical collection (packet size/rate/connection state).
- 4.
- Metadata and payload segments feed parallel detection modules:
- (a)
- Signature matching: compare against known attack patterns;
- (b)
- Behavior analysis: identify anomalies via statistical baselines (port scans/traffic surges);
- (c)
- Protocol inspection: basic protocol-specific field validation.
- 5.
- Consolidated detection results trigger threat determination.
- 6.
- Identified threats generate raw alerts with contextual details.
- 7.
- Alerts are formatted into standardized outputs (e.g., JSON).
- 8.
- Secure transmission via encrypted channels (HTTPS/Syslog/message queues) to central analysis platforms.
3.3. Intrusion Alert Preprocessing
3.3.1. Raw Alert Representation
3.3.2. LFDIA-Based Alert Preprocessing Method
3.3.3. Time Series Generation
| Algorithm 1 LFDIA-Based Alert Aggregation |
| Input: FormattedAlerts={}, SeverityThresholds, Time threshold , Weight matrix Similarity computation functions . Output: Aggregated alarm set: DeduplicatedAlerts
|
3.3.4. Kalman Filter Smoothing
3.4. Attack Sequence Generation
| Algorithm 2 Attack Sequence Generation |
| Input: Smoothed time series , Set of attack types Output: Attack sequence es, List of attack activities attack_acts
|
3.5. Suffix Tree Model Generation
3.5.1. Definition and Construction of the Suffix Tree
| Algorithm 3 Construction of Suffix Tree Model |
| Input: Attack sequence Output: Suffix tree
|
3.5.2. Probability Evaluation of Attack Sequences
4. Experiment
4.1. Experimental Setup
4.2. Experimental Results
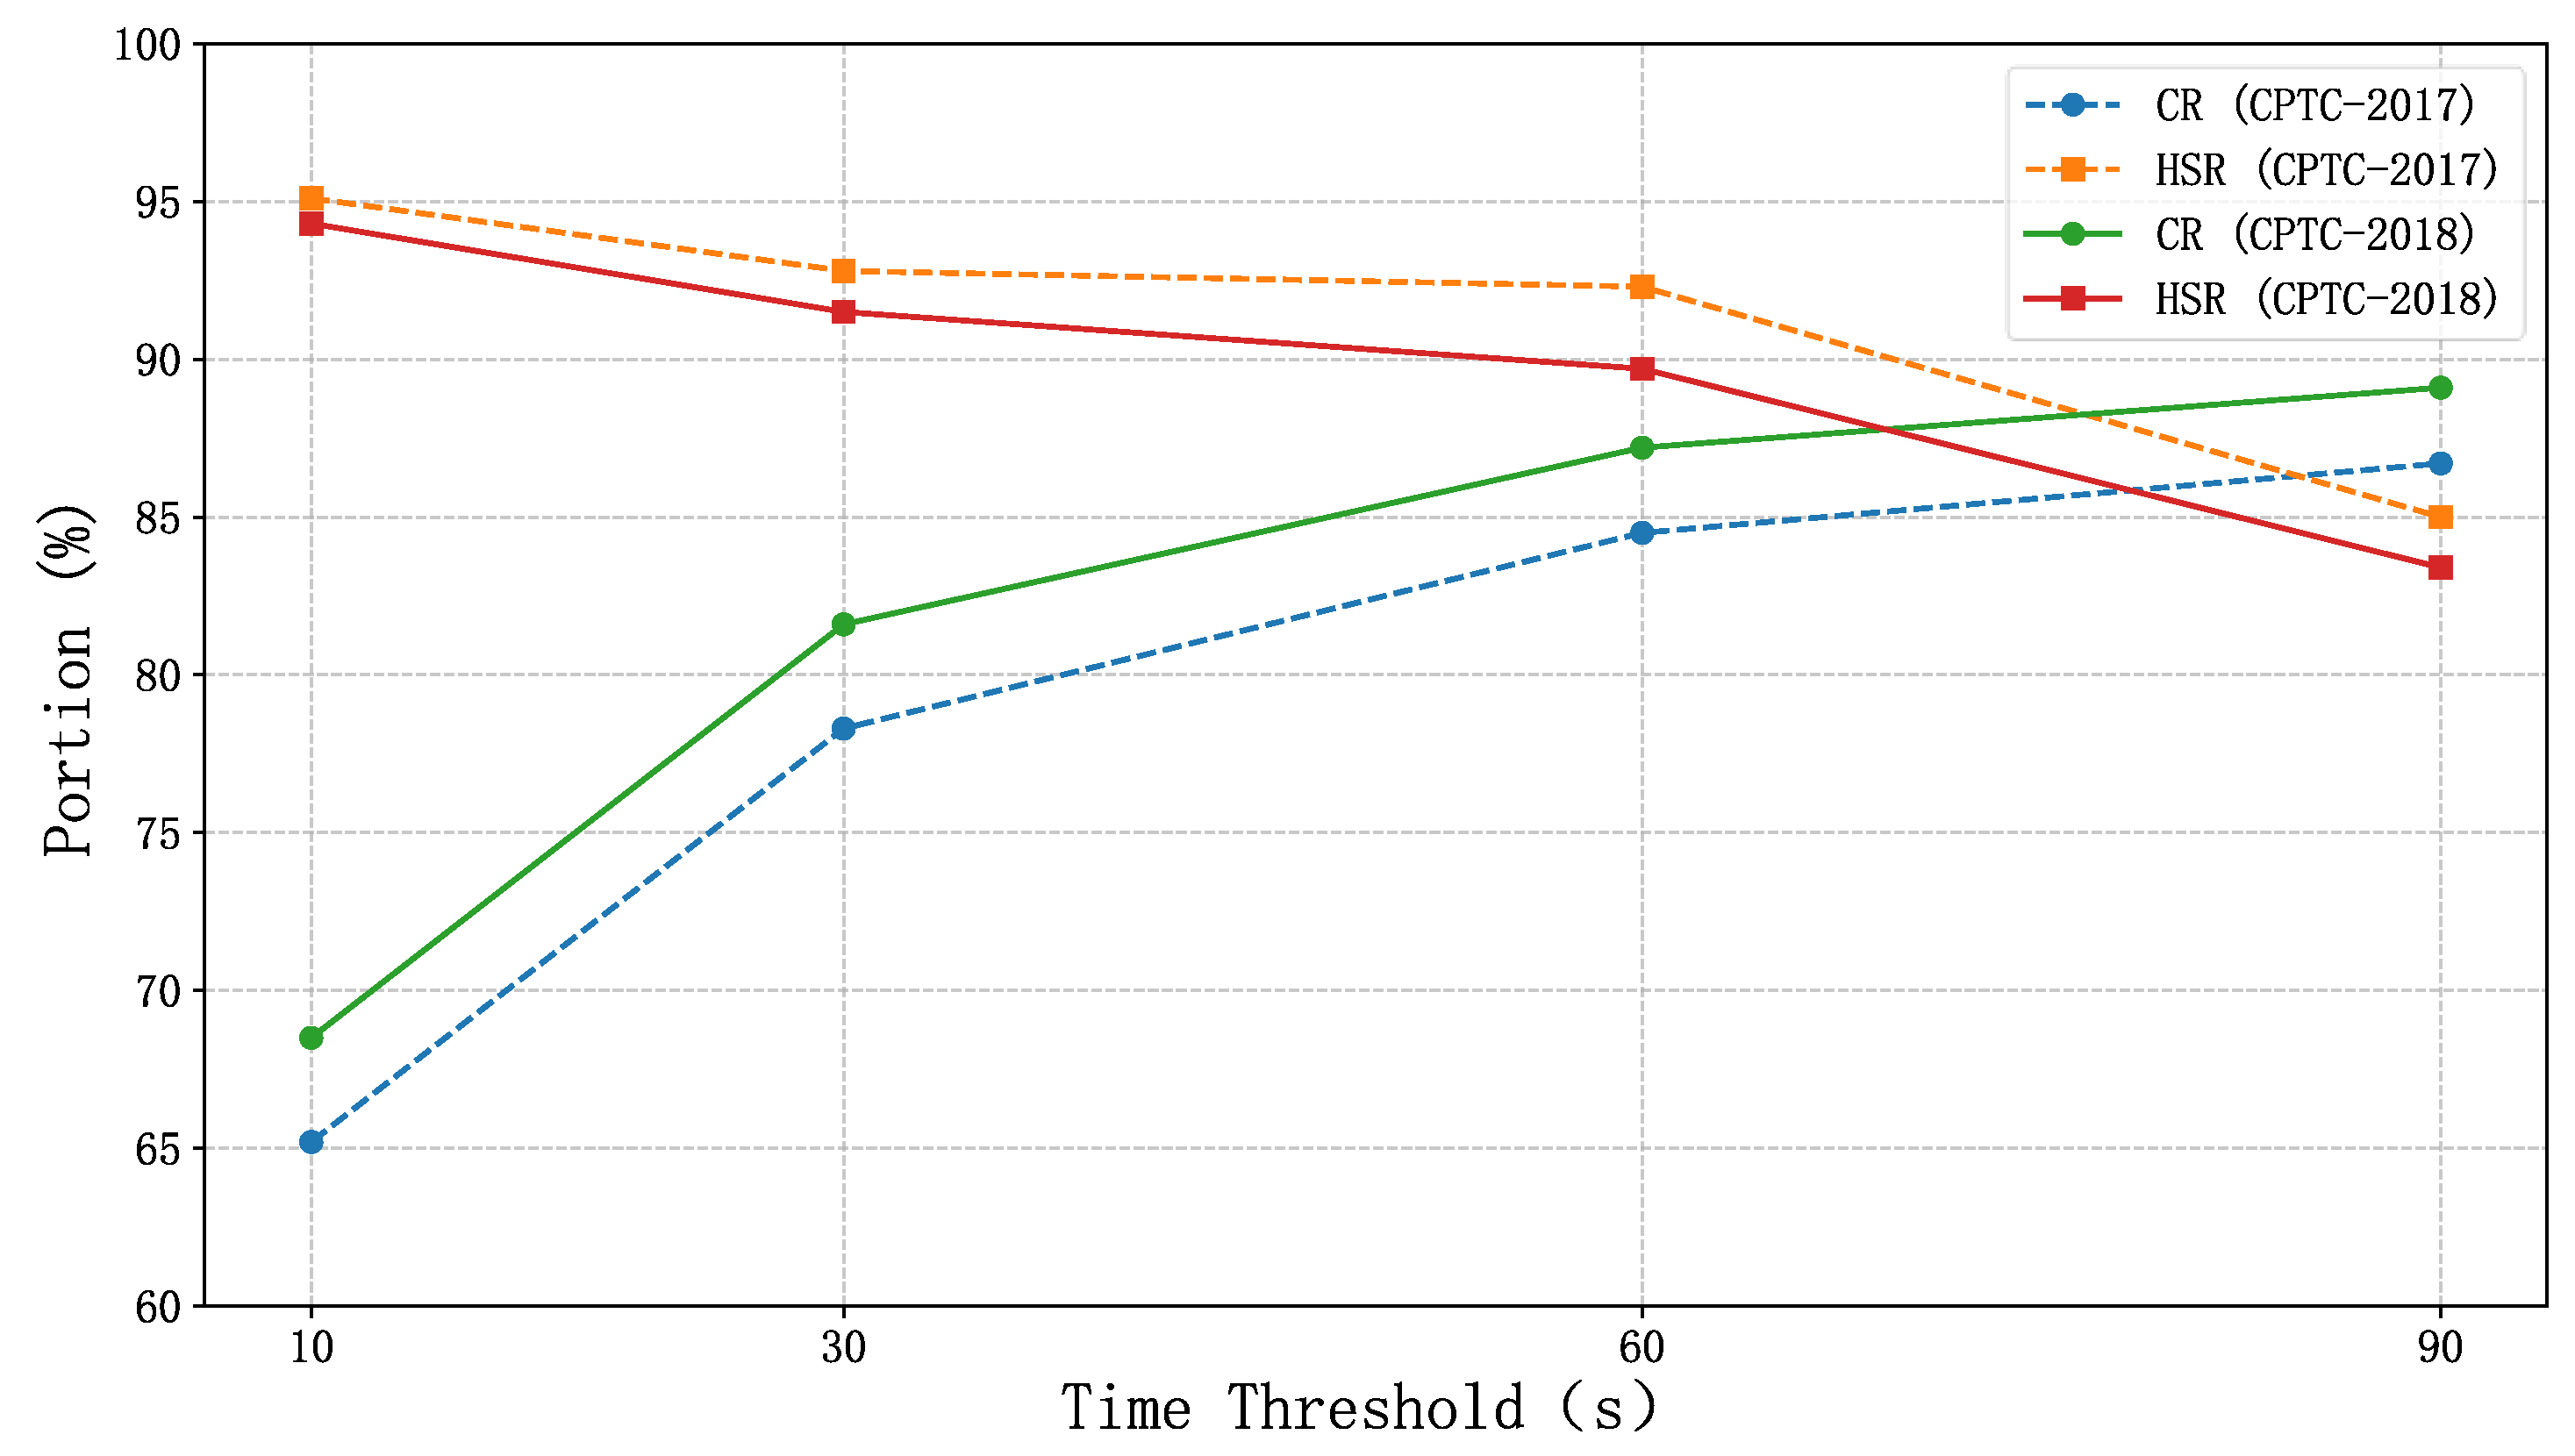
4.2.1. Aggregation Efficiency Analysis
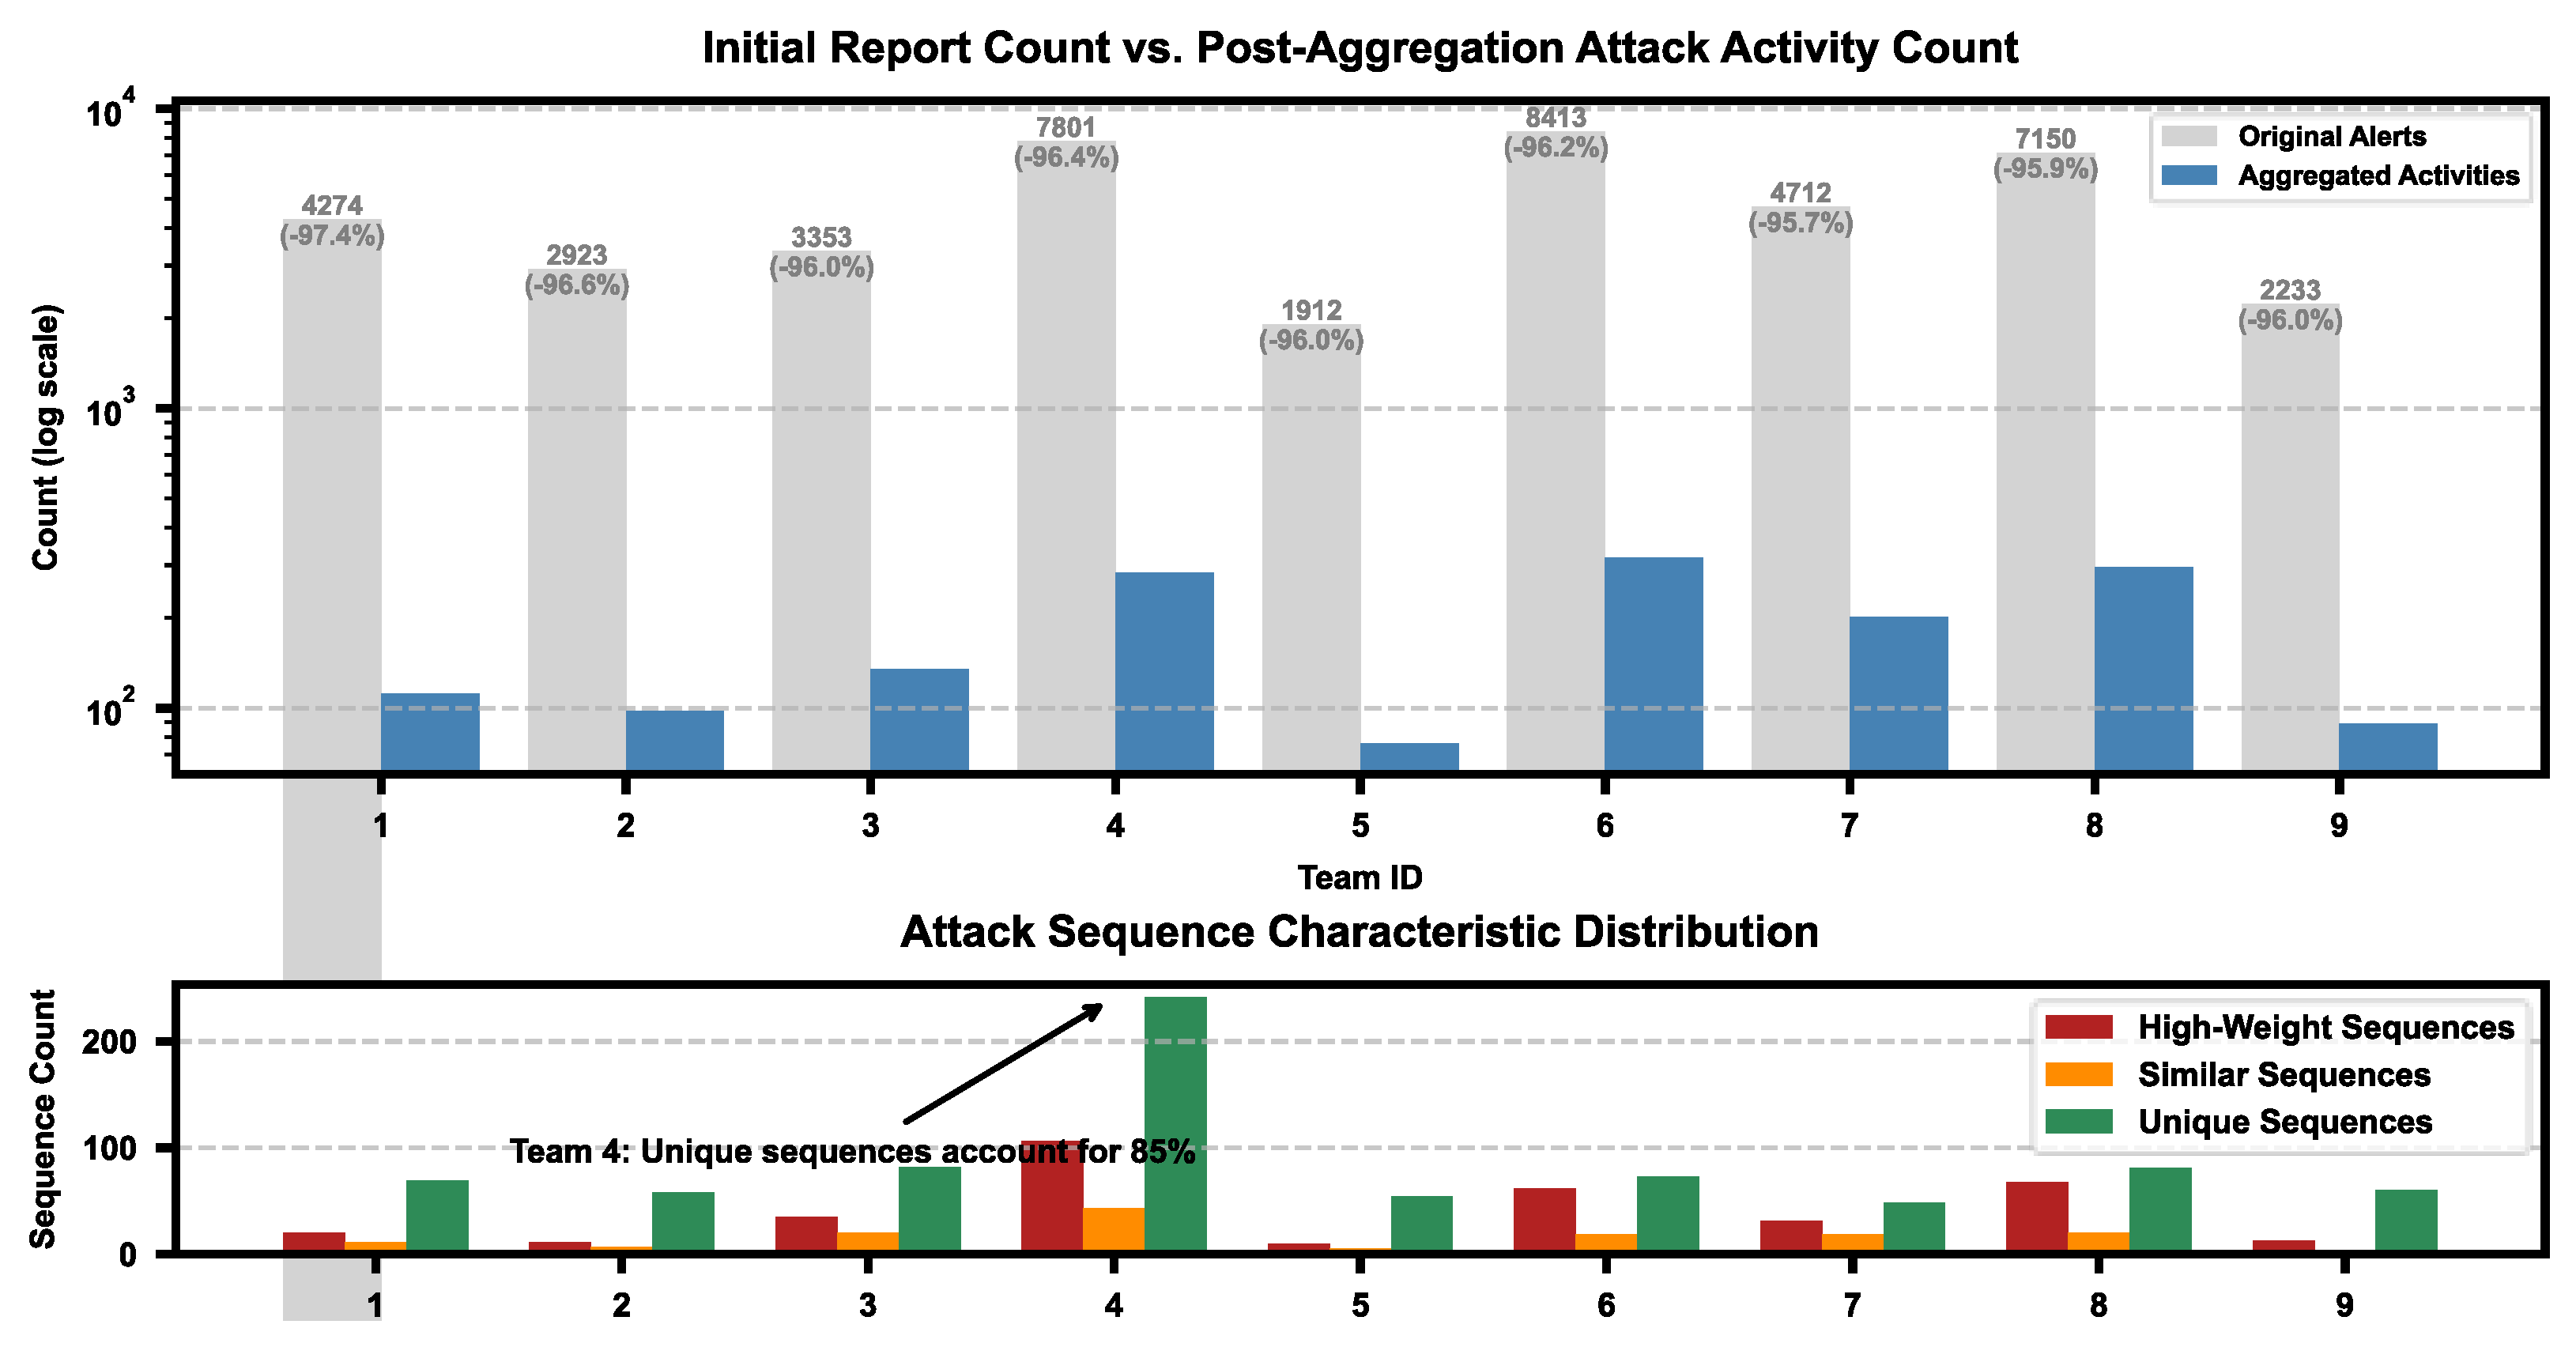
4.2.2. Attack Activity Analysis
5. Conclusions
Author Contributions
Funding
Institutional Review Board Statement
Informed Consent Statement
Data Availability Statement
Conflicts of Interest
References
- Manivannan, D. Recent endeavors in machine learning-powered intrusion detection systems for the Internet of Things. J. Netw. Comput. Appl. 2024, 229, 103925. [Google Scholar] [CrossRef]
- Issa, M.M.; Aljanabi, M.; Muhialdeen, H.M. Systematic literature review on intrusion detection systems: Research trends, algorithms, methods, datasets, and limitations. J. Intell. Syst. 2024, 33, 20230248. [Google Scholar] [CrossRef]
- Morshedi, R.; Matinkhah, S.M.; Sadeghi, M.T. Intrusion Detection for IoT Network Security with Deep learning. J. AI Data Min. 2024, 12, 37–55. [Google Scholar]
- Wang, X.; Yang, X.; Liang, X.; Zhang, X.; Zhang, W.; Gong, X. Combating alert fatigue with AlertPro: Context-aware alert prioritization using reinforcement learning for multi-step attack detection. Comput. Secur. 2024, 137, 103583. [Google Scholar] [CrossRef]
- Roelofs, T.M.; Barbaro, E.; Pekarskikh, S.; Orzechowska, K.; Kwapień, M.; Tyrlik, J.; Smadu, D.; Van Eeten, M.; Zhauniarovich, Y. Finding Harmony in the Noise: Blending Security Alerts for Attack Detection. In Proceedings of the 39th ACM/SIGAPP Symposium on Applied Computing, Avila, Spain, 8–12 April 2024; pp. 1385–1394. [Google Scholar]
- Zadnik, M.; Wrona, J.; Hynek, K.; Cejka, T.; Husak, M. Discovering coordinated groups of IP addresses through temporal correlation of alerts. IEEE Access 2022, 10, 82799–82813. [Google Scholar] [CrossRef]
- Jindal, R.; Singh, I. Detecting malicious transactions in database using hybrid metaheuristic clustering and frequent sequential pattern mining. Clust. Comput. 2022, 25, 3937–3959. [Google Scholar] [CrossRef]
- Albasheer, H.; Siraj, M.M.; Mubarakali, A.; Tayfour, O.E.; Salih, S.; Hamdan, M.; Khan, S.; Zainal, A.; Kamarudeen, S. Cyber-attack prediction based on network intrusion detection systems for alert correlation techniques: A survey. Sensors 2022, 22, 1494. [Google Scholar] [CrossRef] [PubMed]
- Ansari, M.S.; Bartoš, V.; Lee, B. GRU-based deep learning approach for network intrusion alert prediction. Future Gener. Comput. Syst. 2022, 128, 235–247. [Google Scholar] [CrossRef]
- Cheng, Q.; Wu, C.; Zhou, S. Discovering attack scenarios via intrusion alert correlation using graph convolutional networks. IEEE Commun. Lett. 2021, 25, 1564–1567. [Google Scholar] [CrossRef]
- Bitit, R.; Derhab, A.; Guerroumi, M.; Khan, F.A. DDoS attack forecasting based on online multiple change points detection and time series analysis. Multimed. Tools Appl. 2024, 83, 53655–53685. [Google Scholar] [CrossRef]
- Yang, J.; Zhang, Q.; Jiang, X.; Chen, S.; Yang, F. Poirot: Causal correlation aided semantic analysis for advanced persistent threat detection. IEEE Trans. Dependable Secur. Comput. 2021, 19, 3546–3563. [Google Scholar] [CrossRef]
- Zou, Z.; Yin, J.; Fan, S.; Zhang, X. Research on Network Security Event Correlation Analysis Method Based on Knowledge Graph. In Proceedings of the 2024 IEEE 7th Advanced Information Technology, Electronic and Automation Control Conference (IAEAC), Chongqing, China, 15–17 March 2024; IEEE: Piscataway, NJ, USA, 2024; Volume 7, pp. 772–776. [Google Scholar]
- Xie, J.; Zhang, S.; Wang, H.; Chen, M. Multiobjective network security dynamic assessment method based on Bayesian network attack graph. Int. J. Intell. Comput. Cybern. 2024, 17, 38–60. [Google Scholar] [CrossRef]
- Kim, G.; Lee, S.; Kim, S. A novel hybrid intrusion detection method integrating anomaly detection with misuse detection. Expert Syst. Appl. 2014, 41, 1690–1700. [Google Scholar] [CrossRef]
- Yin, C.; Zhu, Y.; Fei, J.; He, X. A Deep Learning Approach for Intrusion Detection Using Recurrent Neural Networks. IEEE Access 2017, 5, 21954–21961. [Google Scholar] [CrossRef]
- Hussain, A.; Tordera, E.M.; Masip-Bruin, X.; Leligou, H.C. Rule-based with Machine learning IDS for DDoS attack detection in cyber-physical production systems (CPPS). IEEE Access 2024, 12, 114894–114911. [Google Scholar] [CrossRef]
- Moskal, S.; Yang, S.J. Cyberattack action-intent-framework for mapping intrusion observables. arXiv 2020, arXiv:2002.07838. [Google Scholar]
- Jiang, B.; Liu, Y.; Liu, H.; Ren, Z.; Wang, Y.; Bao, Y.; Wang, W. An Enhanced EWMA for Alert Reduction and Situation Awareness in Industrial Control Networks. In Proceedings of the 2022 IEEE 18th International Conference on Automation Science and Engineering (CASE), Mexico City, Mexico, 22–26 August 2022; IEEE: Piscataway, NJ, USA, 2022; pp. 888–894. [Google Scholar]
- Kim, Y.; Bang, H. Introduction to Kalman filter and its applications. Introd. Implement. Kalman Filter 2018, 1, 1–16. [Google Scholar]
- Rochester Institute of Technology. Collegiate Penetration Testing Competition [EB/OL]. 2018. Available online: http://nationalcptc.org (accessed on 5 July 2024).
- Bajtoš, T.; Sokol, P.; Mézešová, T. Multi-stage cyber-attacks detection in the industrial control systems. Recent Dev. Ind. Control Syst. Resil. 2020, 255, 151–173. [Google Scholar]
- Zhang, K.; Zhao, F.; Luo, S.; Xin, Y.; Zhu, H. An intrusion action-based IDS alert correlation analysis and prediction framework. IEEE Access 2019, 7, 150540–150551. [Google Scholar] [CrossRef]


| F | Description |
|---|---|
| Longest Common Substring | Measures the textual similarity. |
| Filename | Measures the matching of file name or file suffix. |
| Directory | Measures the matching of directory name or variable name. |
| IP Address | Measures the matching of IP address or domain name. |
| Attack Type | Measures the matching of the attack classification. |
| Dataset | Src IPs (Attackers) | Alerts | Time Frame |
|---|---|---|---|
| CPTC-2017 | 9 | 43,611 | 12 h |
| CPTC-2018 | 6 | 330,270 | 12 h |
| ID | Category | Category Description | Severity |
|---|---|---|---|
| 1 | Host Discovery | Reconnaissance of the location/IP of machines | Low |
| 2 | Service Discovery | Reconnaissance of services or applications of machines | Low |
| 3 | Vulnerability Discovery | Reconnaissance of vulnerabilities in the target network | Low |
| 4 | Information Discovery | Reconnaissance of technical information | Low |
| 5 | Privilege Esc. | Actions that cause an attacker to gain user privileges | Medium |
| 6 | Brute Force Credential Access | Brute force password cracking techniques | Medium |
| 7 | Exploit Public Facing Application | Use of software or commands to exploit weaknesses in computer | Medium |
| 8 | Exploit Remote Services | Connect to internal network from external using vpn etc. | Medium |
| 9 | Arbitrary Code Execution | Arbitrary code execution | Medium |
| 10 | Defense Evasion | Techniques attackers may use to evade detection | Medium |
| 11 | Command & Control | Control of the target by establishing a communication channel | Medium |
| 12 | End Point Dos | Exploiting the system to cause persistent crashes | High |
| 13 | Network Dos | Exhaustion of network bandwidth on which operations depend | High |
| 14 | Service Stop | Stop services to make them unavailable to legitimate users | High |
| 15 | Data Exfiltration | Helps attackers remove files and information from the target | High |
| 16 | Data Delivery | Data theft in the form of malware, backdoors, apps, etc. | High |
| Method | Description |
|---|---|
| Time-Window Aggregation | Fixed time range aggregation |
| IP-Port Method [22] | Alert aggregation method based on IP and port |
| IACF Method [23] | Alert aggregation method based on intrusion actions |
| Dataset | Method | Raw Alerts | Aggregated Alerts | CR (%) | HSR (%) |
|---|---|---|---|---|---|
| CPTC-2017 | Proposed Method | 43,611 | 6760 | 84.5 | 92.3 |
| Time-Window Aggregation | 43,611 | 23,780 | 45.4 | 74.6 | |
| IP-Port Method | 43,611 | 18,520 | 57.5 | 80.2 | |
| IACF Method | 43,611 | 12,340 | 71.7 | 88.5 | |
| CPTC-2018 | Proposed Method | 330,270 | 42,105 | 87.2 | 89.7 |
| Time-Window Aggregation | 330,270 | 158,430 | 52.0 | 68.9 | |
| IP-Port Method | 330,270 | 142,810 | 56.8 | 75.3 | |
| IACF Method | 330,270 | 95,620 | 71.0 | 85.6 |
| Team ID | Raw Alerts | Aggregated Attack Activities | High-Severity Sequences | Similar Sequences | Unique Sequences | Longest Similar Sequence | Typical Unique Sequence |
|---|---|---|---|---|---|---|---|
| 1 | 4274 | 112 | 20 | 11 | 69 | [1 → 2 → 7 → 5] | [7 → 5 → 15] |
| 2 | 2923 | 98 | 11 | 7 | 58 | [1 → 2 → 7 → 5] | [3 → 7 → 5 → 15] |
| 3 | 3353 | 135 | 35 | 20 | 82 | [1 → 3 → 7 → 5] | [3 → 7 → 9 → 15] |
| 4 | 7801 | 284 | 106 | 43 | 241 | [1 → 3 → 8 → 15] | [3 → 8 → 15 → 16] |
| 5 | 1912 | 76 | 10 | 5 | 54 | [1 → 2 → 7 → 5] | [2 → 7 → 5 → 15] |
| 6 | 8413 | 318 | 62 | 19 | 73 | [1 → 3 → 6 → 7 → 5] | [6 → 7 → 5 → 15] |
| 7 | 4712 | 201 | 31 | 19 | 48 | [1 → 3 → 7 → 10 → 5] | [7 → 10 → 5 → 15] |
| 8 | 7150 | 296 | 68 | 20 | 81 | [1 → 3 → 8 → 5 → 10] | [8 → 5 → 10 → 15] |
| 9 | 2233 | 89 | 13 | 4 | 60 | [1 → 2 → 7 → 5 → 15] | [2 → 7 → 5 → 16] |
Disclaimer/Publisher’s Note: The statements, opinions and data contained in all publications are solely those of the individual author(s) and contributor(s) and not of MDPI and/or the editor(s). MDPI and/or the editor(s) disclaim responsibility for any injury to people or property resulting from any ideas, methods, instructions or products referred to in the content. |
© 2025 by the authors. Licensee MDPI, Basel, Switzerland. This article is an open access article distributed under the terms and conditions of the Creative Commons Attribution (CC BY) license (https://creativecommons.org/licenses/by/4.0/).
Share and Cite
Zhang, R.; Zhang, M.; Liu, Y.; Li, Z.; Miao, W.; Shao, S. Intrusion Alert Analysis Method for Power Information Communication Networks Based on Data Processing Units. Information 2025, 16, 547. https://doi.org/10.3390/info16070547
Zhang R, Zhang M, Liu Y, Li Z, Miao W, Shao S. Intrusion Alert Analysis Method for Power Information Communication Networks Based on Data Processing Units. Information. 2025; 16(7):547. https://doi.org/10.3390/info16070547
Chicago/Turabian StyleZhang, Rui, Mingxuan Zhang, Yan Liu, Zhiyi Li, Weiwei Miao, and Sujie Shao. 2025. "Intrusion Alert Analysis Method for Power Information Communication Networks Based on Data Processing Units" Information 16, no. 7: 547. https://doi.org/10.3390/info16070547
APA StyleZhang, R., Zhang, M., Liu, Y., Li, Z., Miao, W., & Shao, S. (2025). Intrusion Alert Analysis Method for Power Information Communication Networks Based on Data Processing Units. Information, 16(7), 547. https://doi.org/10.3390/info16070547