Article

Hierarchical Deep Learning for Comprehensive Epileptic Seizure Analysis: From Detection to Fine-Grained Classification

School of Engineering, Computing and Built Environment, Glasgow Caledonian University, Glasgow G4 0BA, UK
*
Author to whom correspondence should be addressed.
Information 2025, 16(7), 532; https://doi.org/10.3390/info16070532
Submission received: 26 May 2025 / Revised: 18 June 2025 / Accepted: 18 June 2025 / Published: 24 June 2025

Abstract

Epileptic seizure detection and classification from EEG recordings faces significant challenges due to extreme class imbalance. Analysis of the Temple University Hospital Seizure (TUSZ) dataset reveals imbalance ratios of 150:1 between common and rare seizure types, with high temporal heterogeneity (seizure durations of 1–1638 s). We propose a cascaded deep learning architecture with two specialized CNNs: a binary detector followed by a multi-class classifier. This approach decomposes the classification problem, reducing the maximum imbalance from 150:1 to manageable levels (9:1 binary, 5:1 type). The architecture implements a high-confidence filtering mechanism (threshold = 0.9), creating a 99.5% pure dataset for type classification, dynamic class-weighted optimization proportional to inverse class frequencies, and information flow refinement through progressive stages. Loss dynamics analysis reveals that our weighting scheme strategically redistributes optimization attention, reducing variance by 90.7% for majority classes while increasing variance for minority classes, ensuring all seizure types receive proportional learning signals regardless of representation. The binary classifier achieves 99.64% specificity and 98.23% sensitivity (ROC-AUC = 0.995). The type classifier demonstrates >99% accuracy across seven seizure categories with perfect (100%) classification for three seizure types despite minimal representation. Cross-dataset validation on the University of Bonn dataset confirms robust generalization (96.0% accuracy) for binary seizure detection. This framework effectively addresses multi-level imbalance in neurophysiological signal classification with hierarchical class structures.

Graphical Abstract

1. Introduction

Epilepsy affects approximately 50 million people worldwide, making it one of the most common neurological disorders [1]. The disability rate in epilepsy patients ranges from 0.2 to 5.8%, with patients facing significant risks of social maladjustment and stigmatization [2,3]. The accurate detection and classification of epileptic seizures is essential for diagnosis, treatment planning, and evaluating therapeutic efficacy [4].
The interpretation of electroencephalography (EEG) for epileptic events presents substantial challenges. Around 25% of patients are misdiagnosed with epilepsy due to the over-reading of benign EEG features [3,5]. Manual review by neurologists is time-consuming, subjective, and prone to inter-rater variability. These limitations have motivated significant research into automated seizure detection and classification systems using machine learning approaches.
Automated EEG analysis for epilepsy faces several key challenges. First, the spatial resolution of EEG is often too low to accurately specify the location of epileptogenic foci [6]. Second, data preprocessing depends heavily on artifact and noise removal techniques, which can significantly impact subsequent analysis [7]. Third, scalp EEG, while non-invasive and clinically prevalent, is less sensitive than intracranial EEG for detecting certain seizure types [8]. Additionally, EEG findings are difficult to interpret and visualize due to the large volume of data [9].
Recent reviews by Roy et al. [9] and Craik et al. [10] highlight the growing application of deep learning for EEG analysis. These approaches range from convolutional neural networks (CNNs) that exploit the spatial and spectral characteristics of EEG signals, to recurrent architectures that capture temporal dependencies [11], and graph-based models that leverage the topological structure of electrode placements [12].
Despite these advances, a particularly significant challenge—and the focus of this paper—is the inherent and severe class imbalance that characterizes epileptic EEG data. This imbalance manifests at multiple levels: (1) temporal imbalance, where seizure events typically constitute less than 1% of the total EEG recording time [
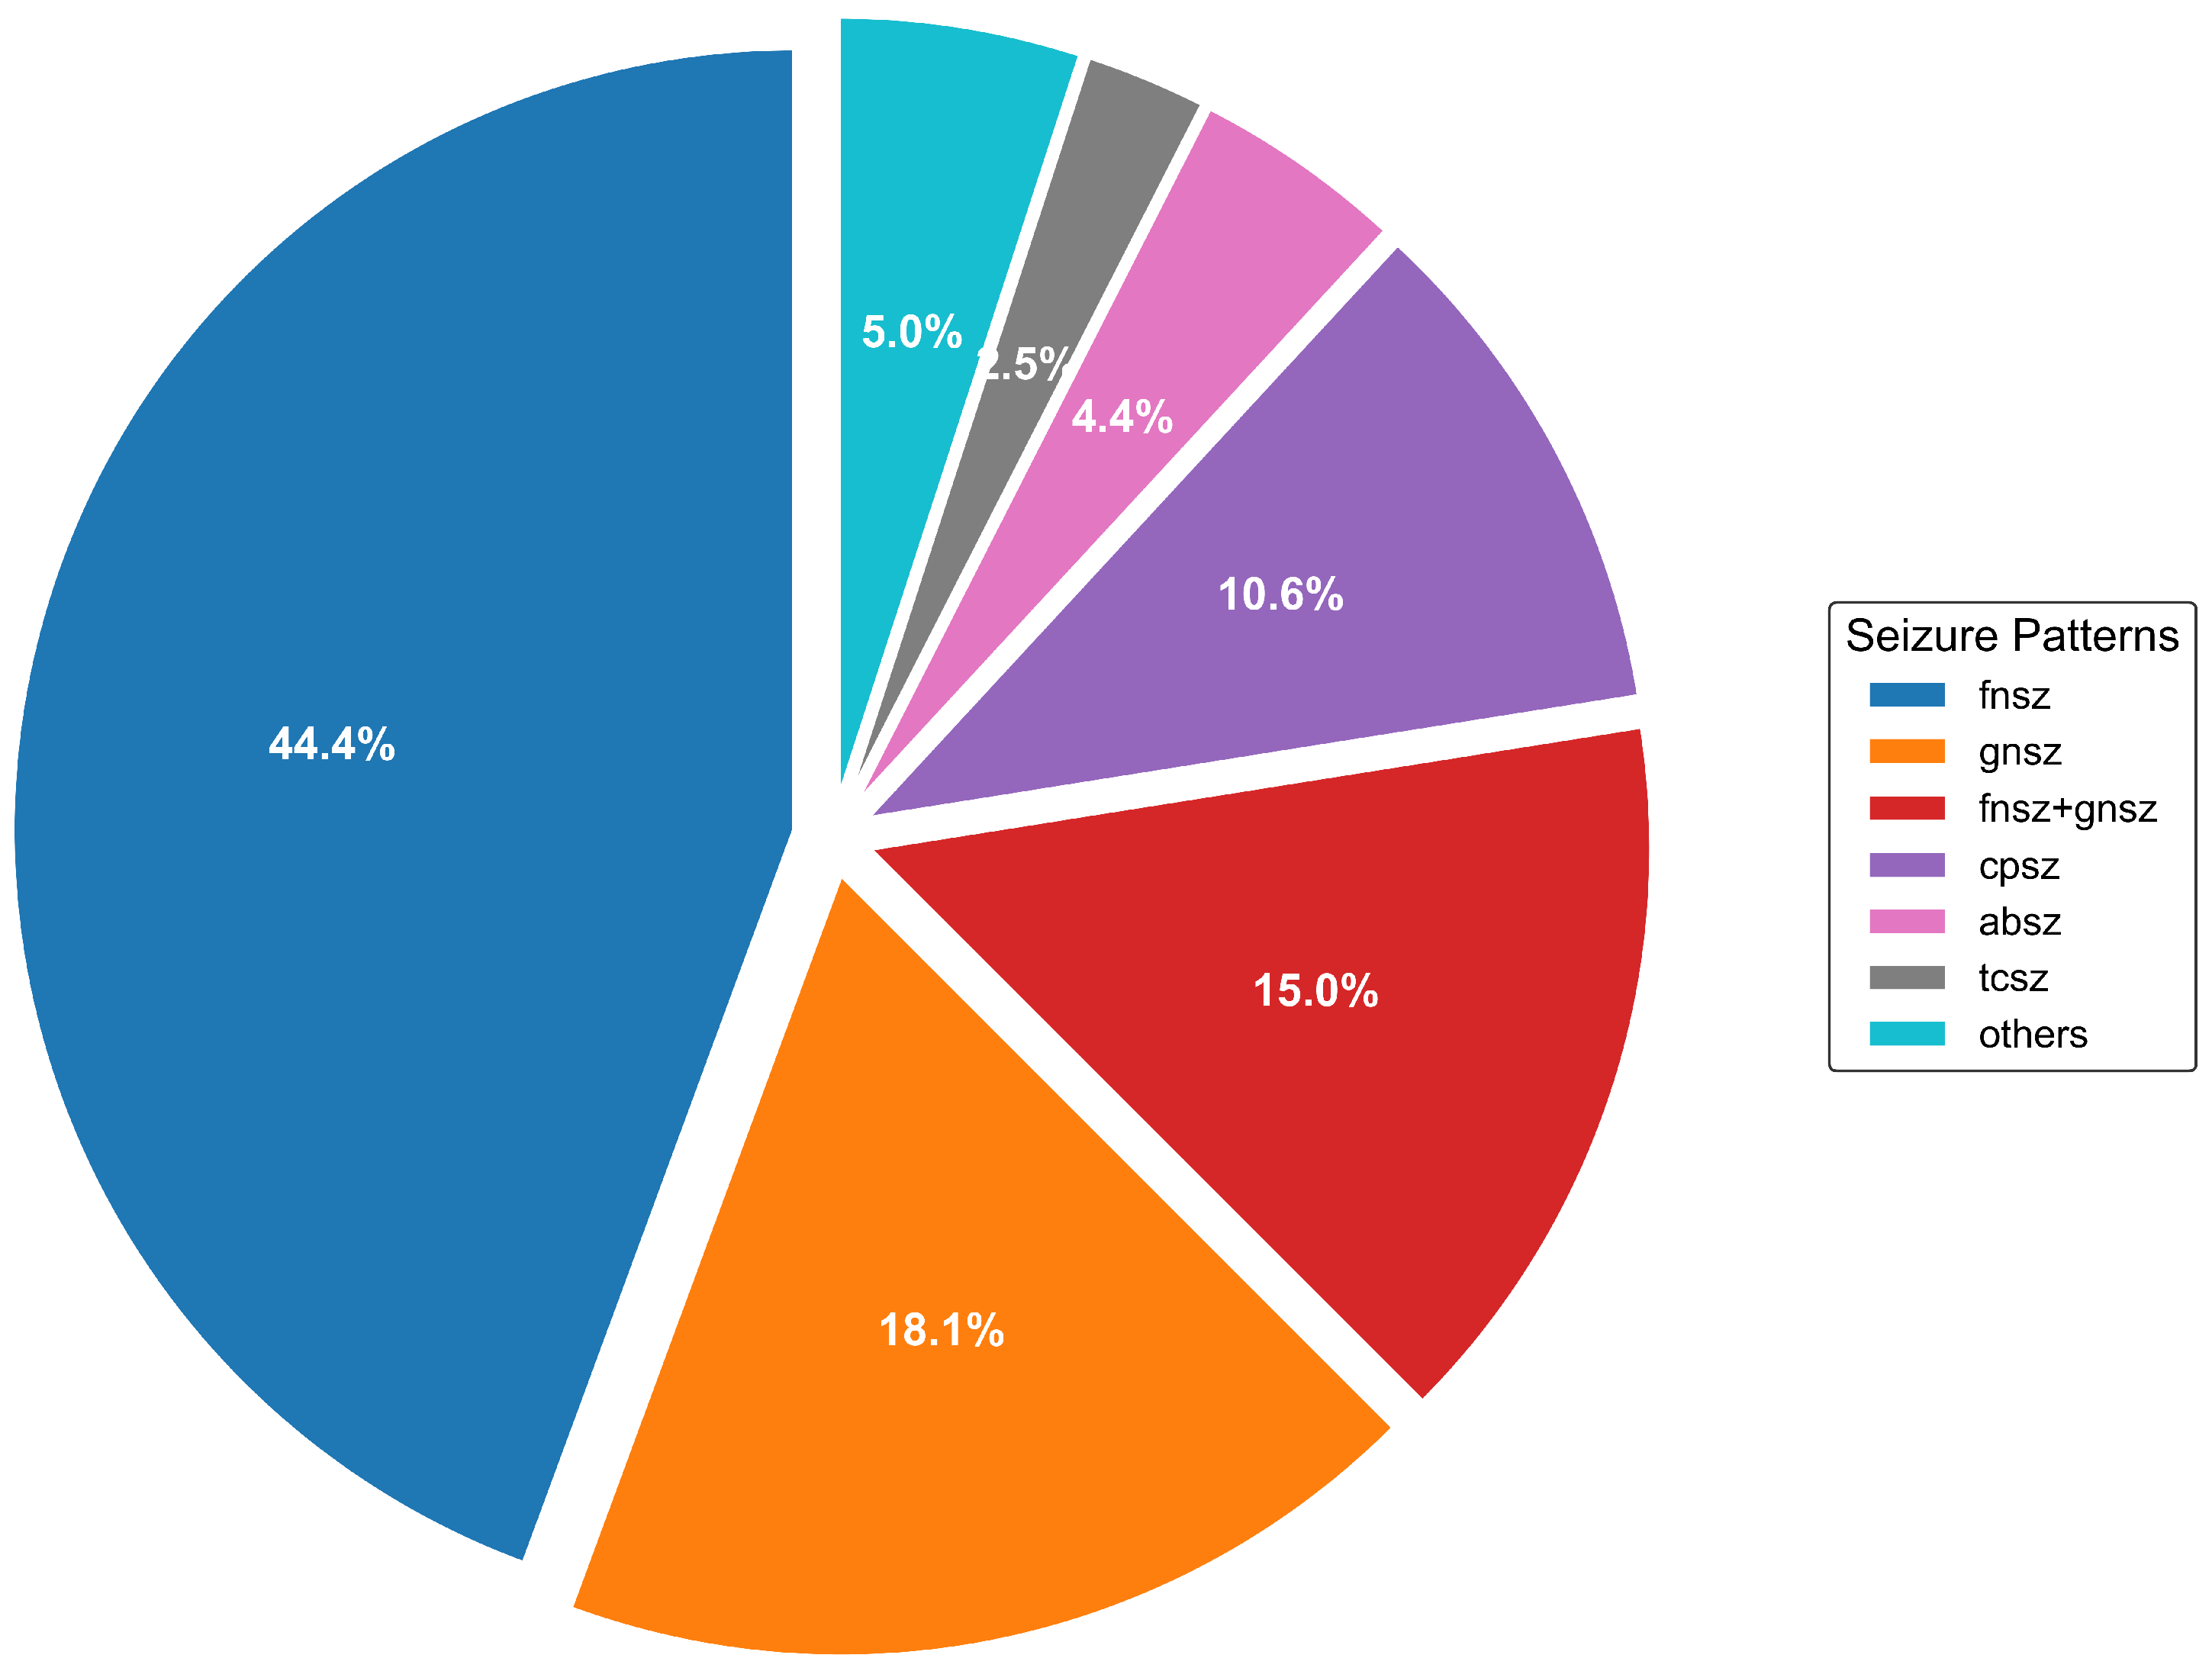
13]; (2) categorical imbalance, as certain seizure types occur much more frequently than others, creating significant disparities in class representation [
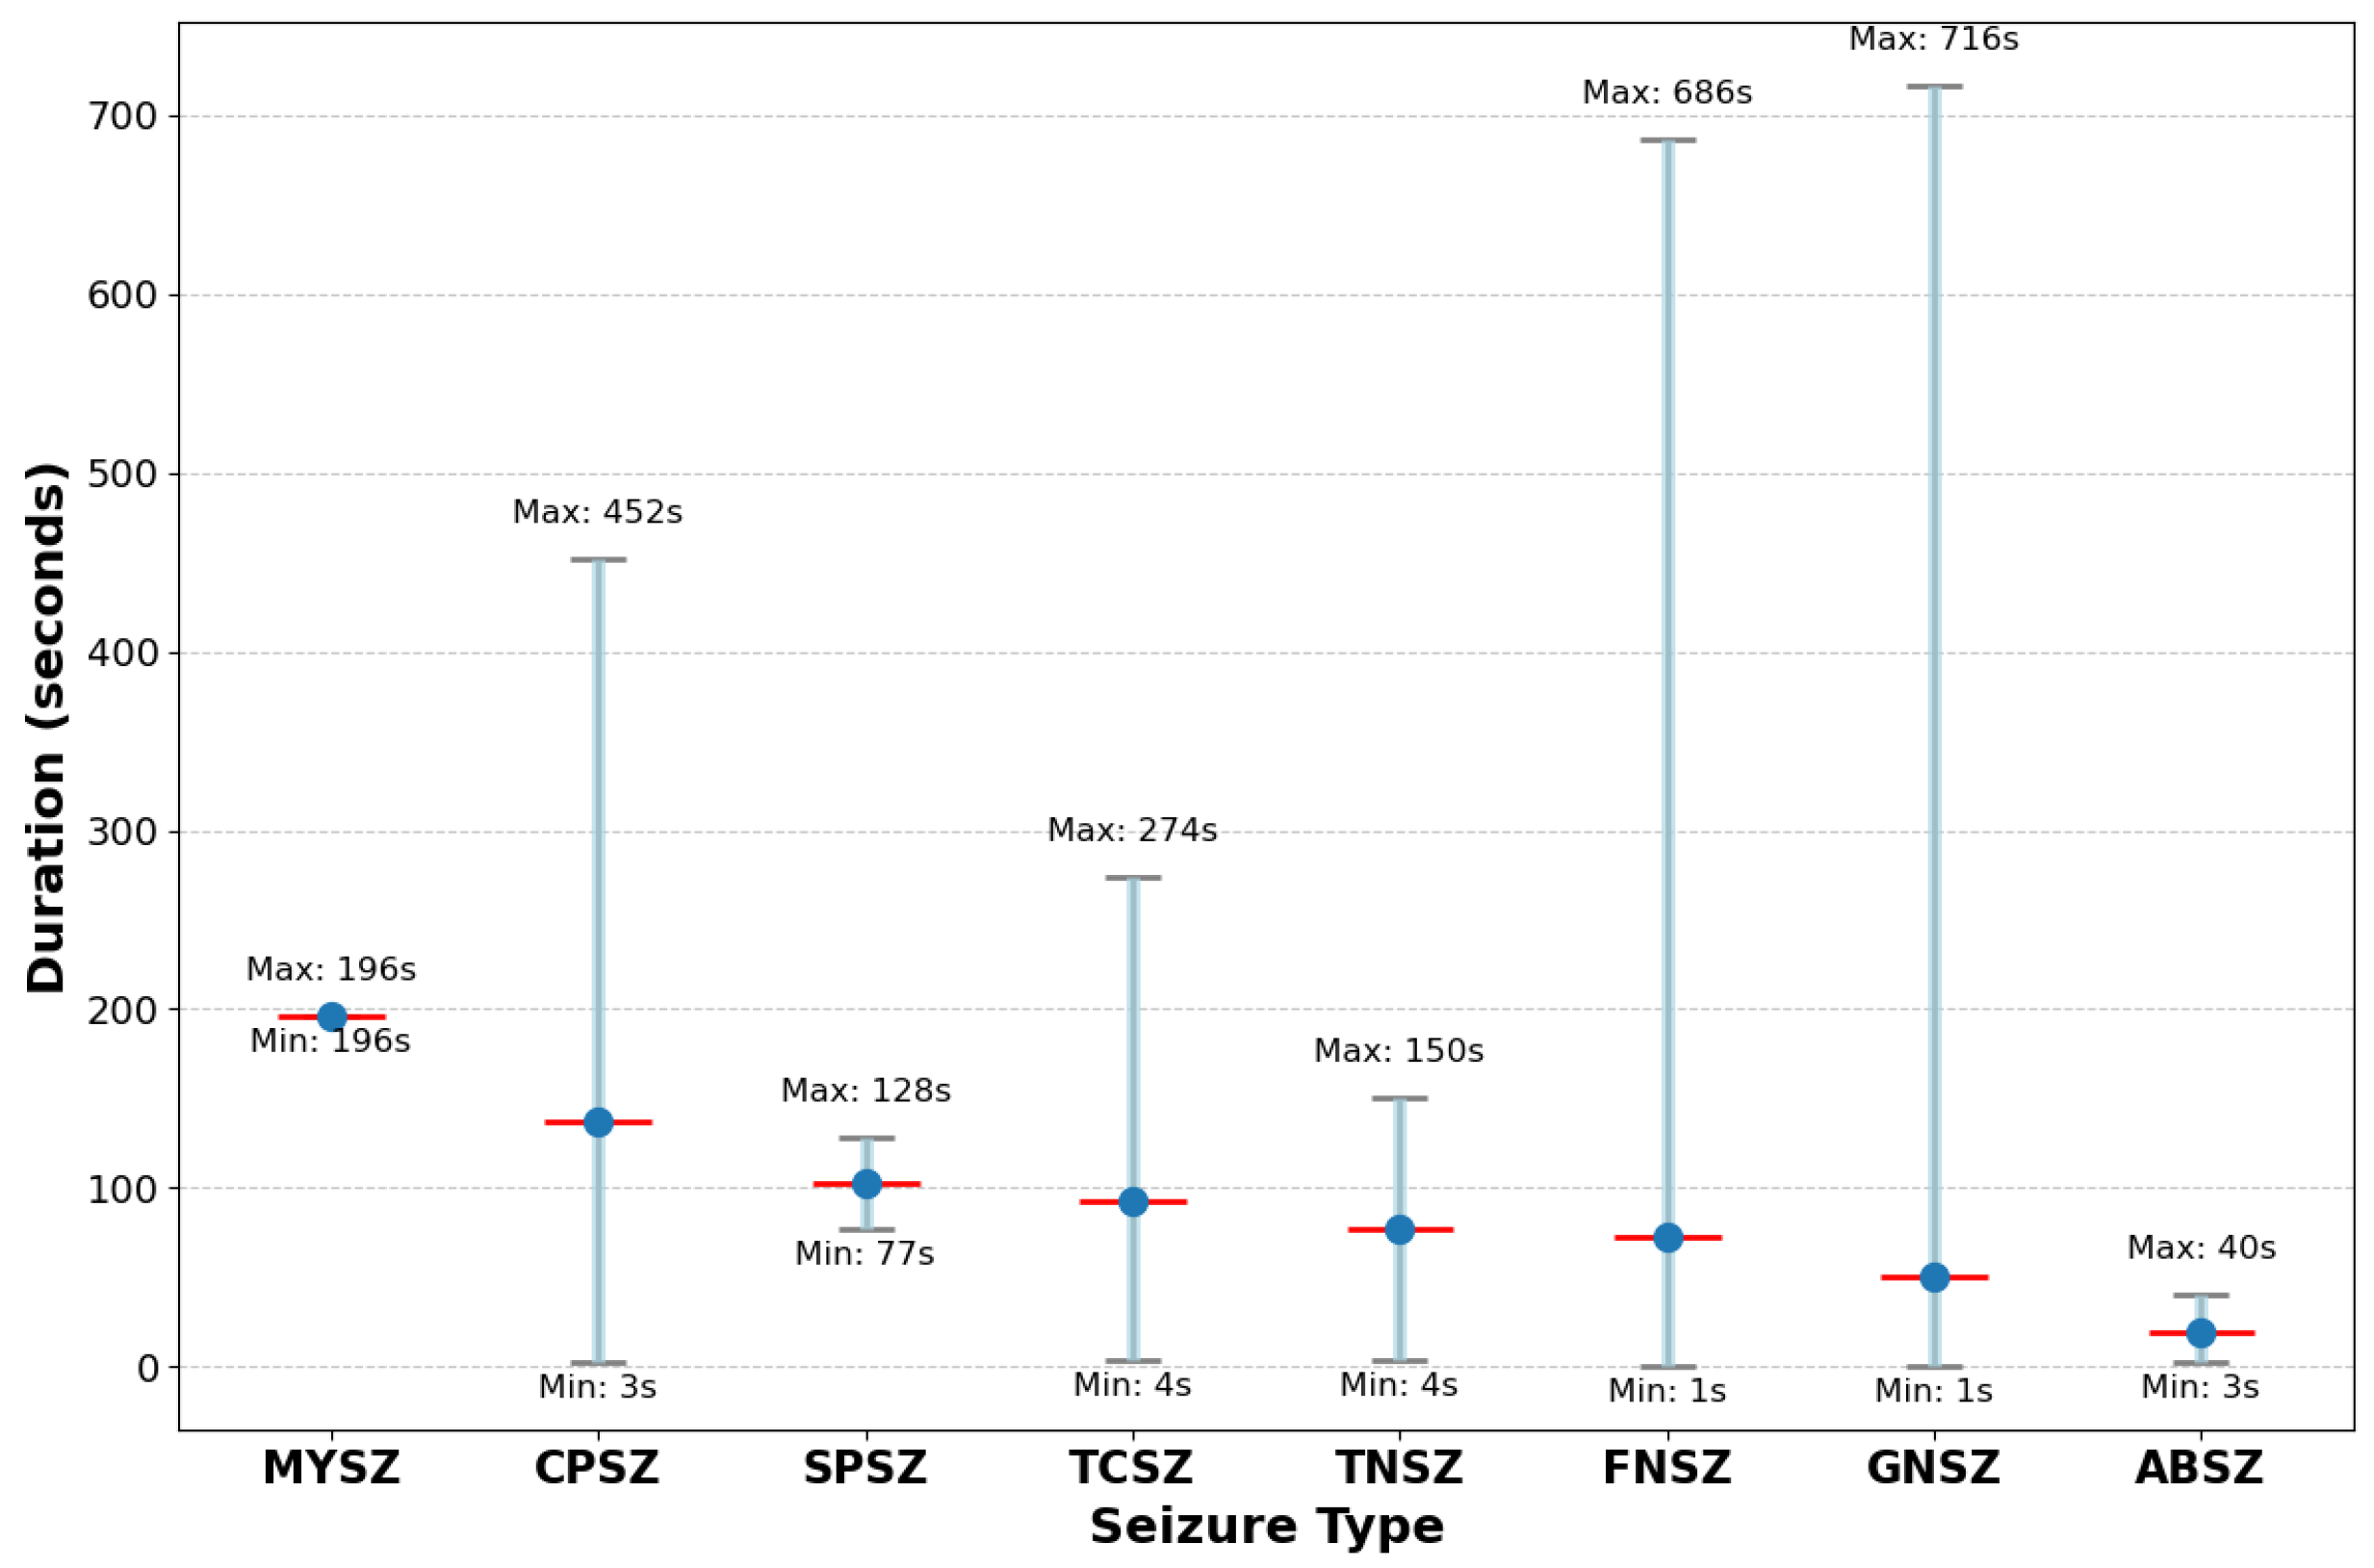
14]; and (3) duration heterogeneity since seizure durations vary greatly, from brief events lasting seconds to prolonged episodes spanning minutes [15].
Raut and Rathee [14] demonstrated that this multi-level imbalance significantly impacts classifier performance, with most algorithms showing bias toward majority classes. Li et al. [16] observed that even advanced deep learning methods tend to underperform on rare seizure categories, which are often the most clinically significant.
The machine learning literature offers several strategies for addressing class imbalance. He and Garcia [17] categorized these approaches into data-level methods, algorithm-level methods, and hybrid approaches. Data-level methods include undersampling majority classes, oversampling minority classes, or generating synthetic samples. The Synthetic Minority Over-sampling Technique (SMOTE) [18] is widely used but often struggles with complex signal patterns like EEG. Algorithm-level methods include cost-sensitive learning, which assigns higher penalties to misclassifying minority classes, and ensemble methods that combine multiple classifiers [19]. Hybrid approaches combine data preprocessing with specialized algorithms to achieve better performance on imbalanced datasets [17].
While these approaches have shown success in various domains, Johnson and Khoshgoftaar [19] note their limitations when dealing with extreme imbalance (ratios exceeding 100:1) or multi-level imbalance as found in the EEG data. Most existing methods address only a single dimension of imbalance, failing to account for the complex, hierarchical nature of the imbalance in seizure classification.
Recent work by Statsenko et al. [20] proposed a system architecture for precise seizure detection and classification using deep learning models for binary and multigroup classifications, also using the TUSZ dataset. While they achieved good results (87.7% sensitivity, 91.16% specificity for detection and 95–100% accuracy for classification), their approach did not specifically address the multi-level imbalance challenge through a specialized framework.
The Temple University Hospital Seizure (TUSZ) dataset [21] has emerged as a benchmark for seizure detection algorithms. It contains 2012 EEG sessions from 264 patients, with 1046 seizure events annotated by expert neurologists. Our analysis of this dataset reveals previously uncharacterized extreme imbalance ratios exceeding 150:1 between common and rare seizure types, with substantial temporal heterogeneity in seizure duration (ranging from 1 s to 1638 s).
Recent work on the TUSZ dataset includes Asif et al. [22], who proposed a multi-spectral CNN that achieved 94.8% accuracy for seizure detection but struggled with rare seizure types. Hussein et al. [23] implemented an optimized RNN architecture reaching 95.7% accuracy but showed significant performance disparities across different seizure categories. Covert et al. [12] applied temporal graph convolutional networks to capture spatial–temporal EEG patterns, achieving 97.2% for binary seizure detection, but did not address type classification.
These approaches, while advancing the state of the art, have not adequately addressed the fundamental challenge of multi-level imbalance in seizure classification.
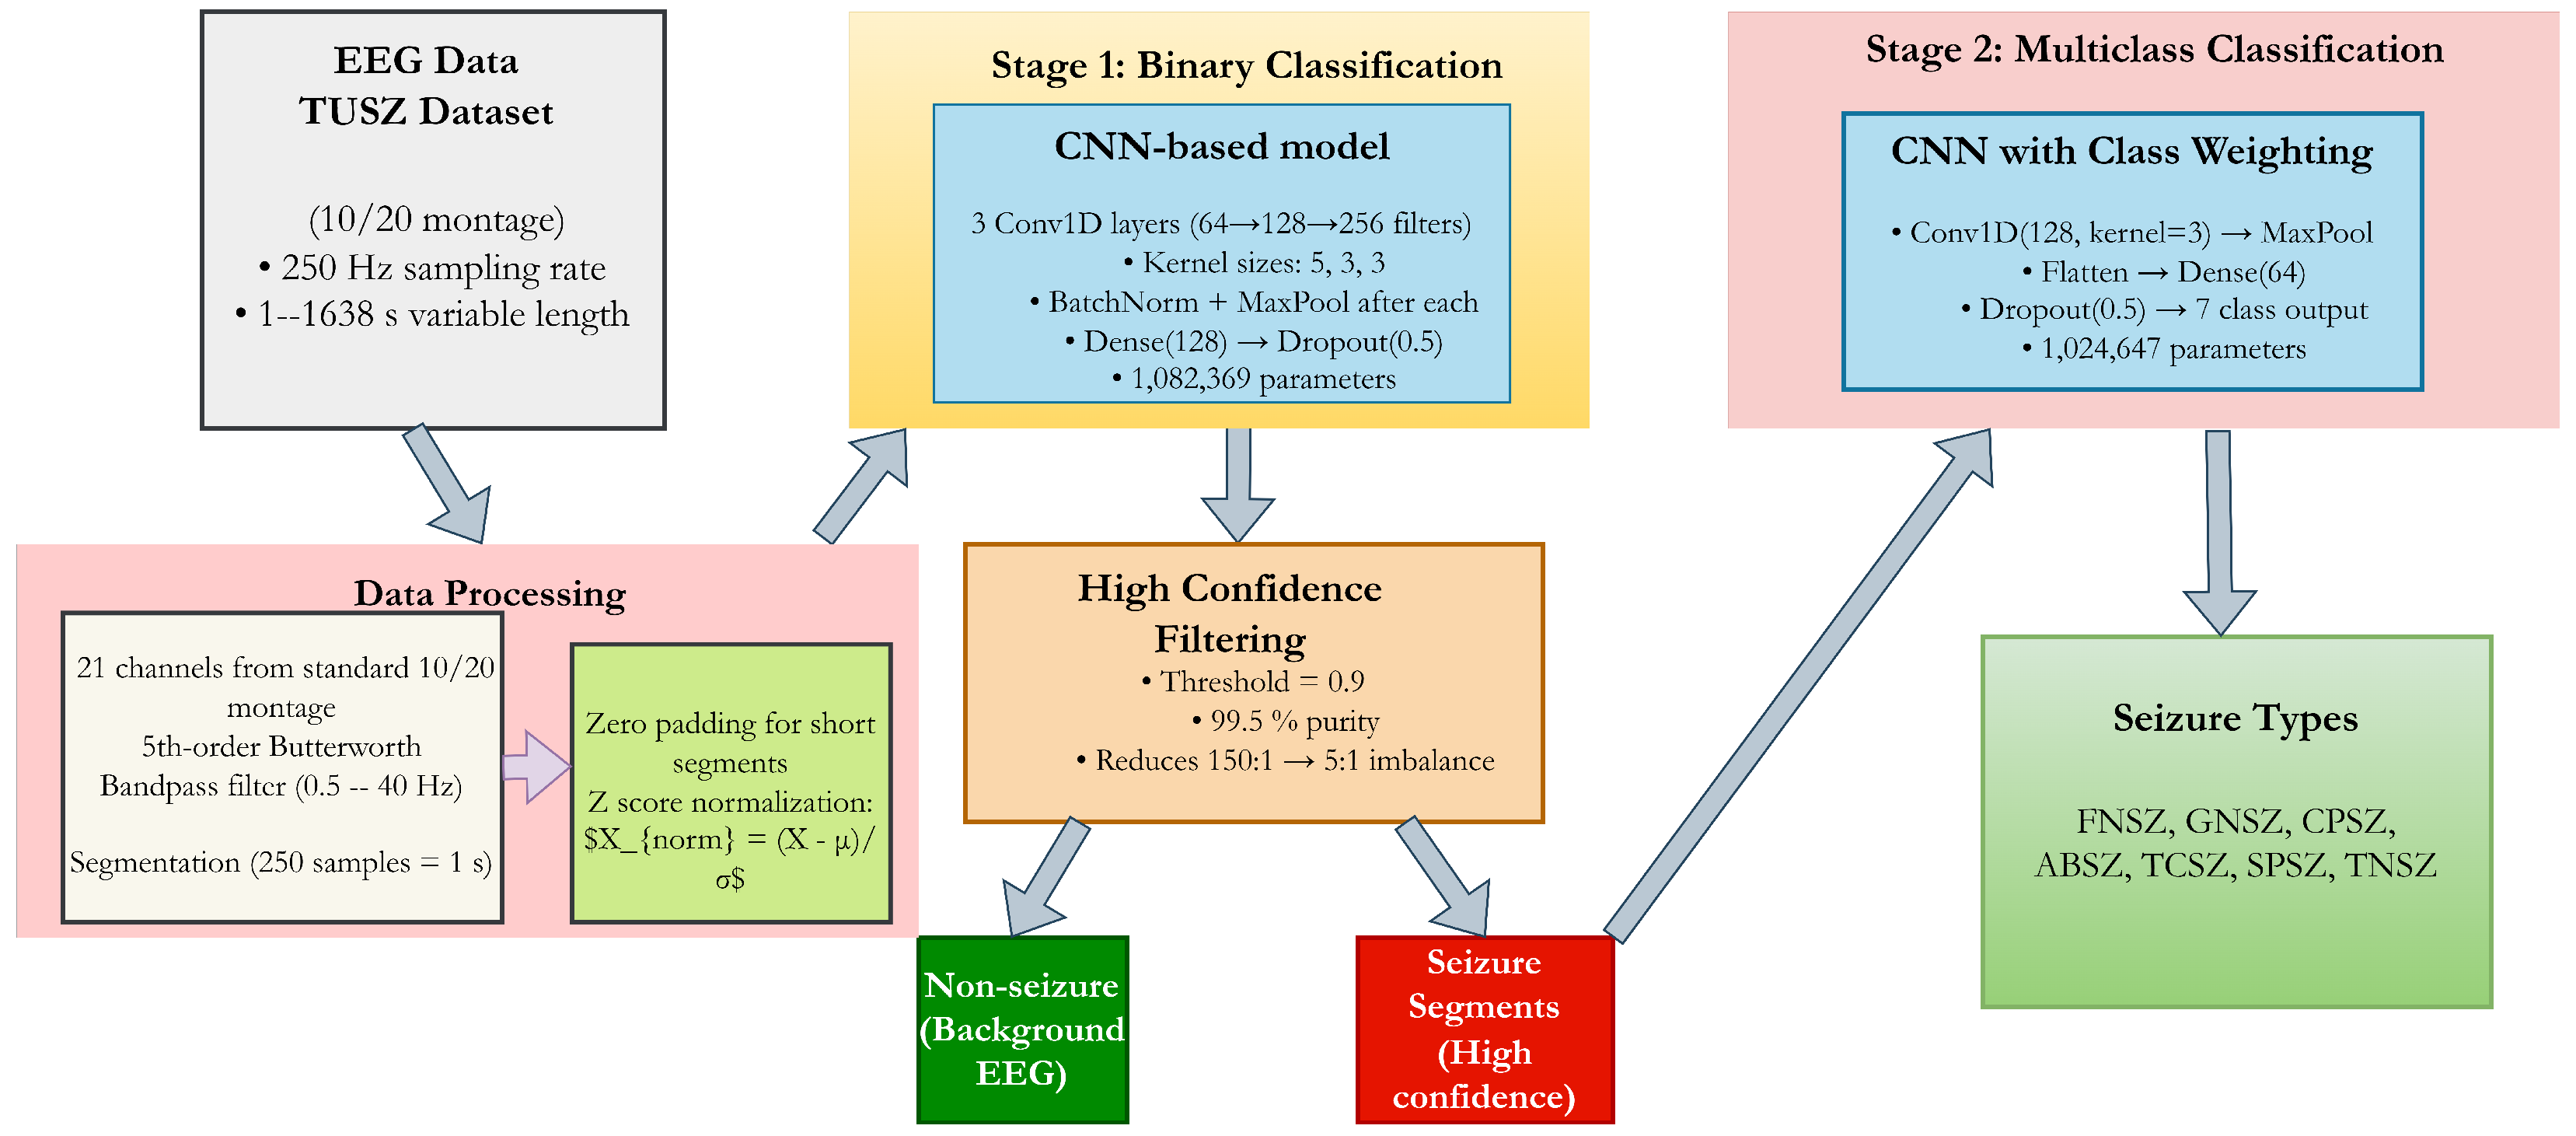
In this paper, we introduce a cascaded deep learning architecture specifically designed to address multi-level imbalance in seizure classification. Our approach decomposes the complex multi-class problem into a sequence of more tractable sub-problems: first distinguishing seizure from non-seizure activity, then classifying the specific seizure type among those segments identified as seizures.
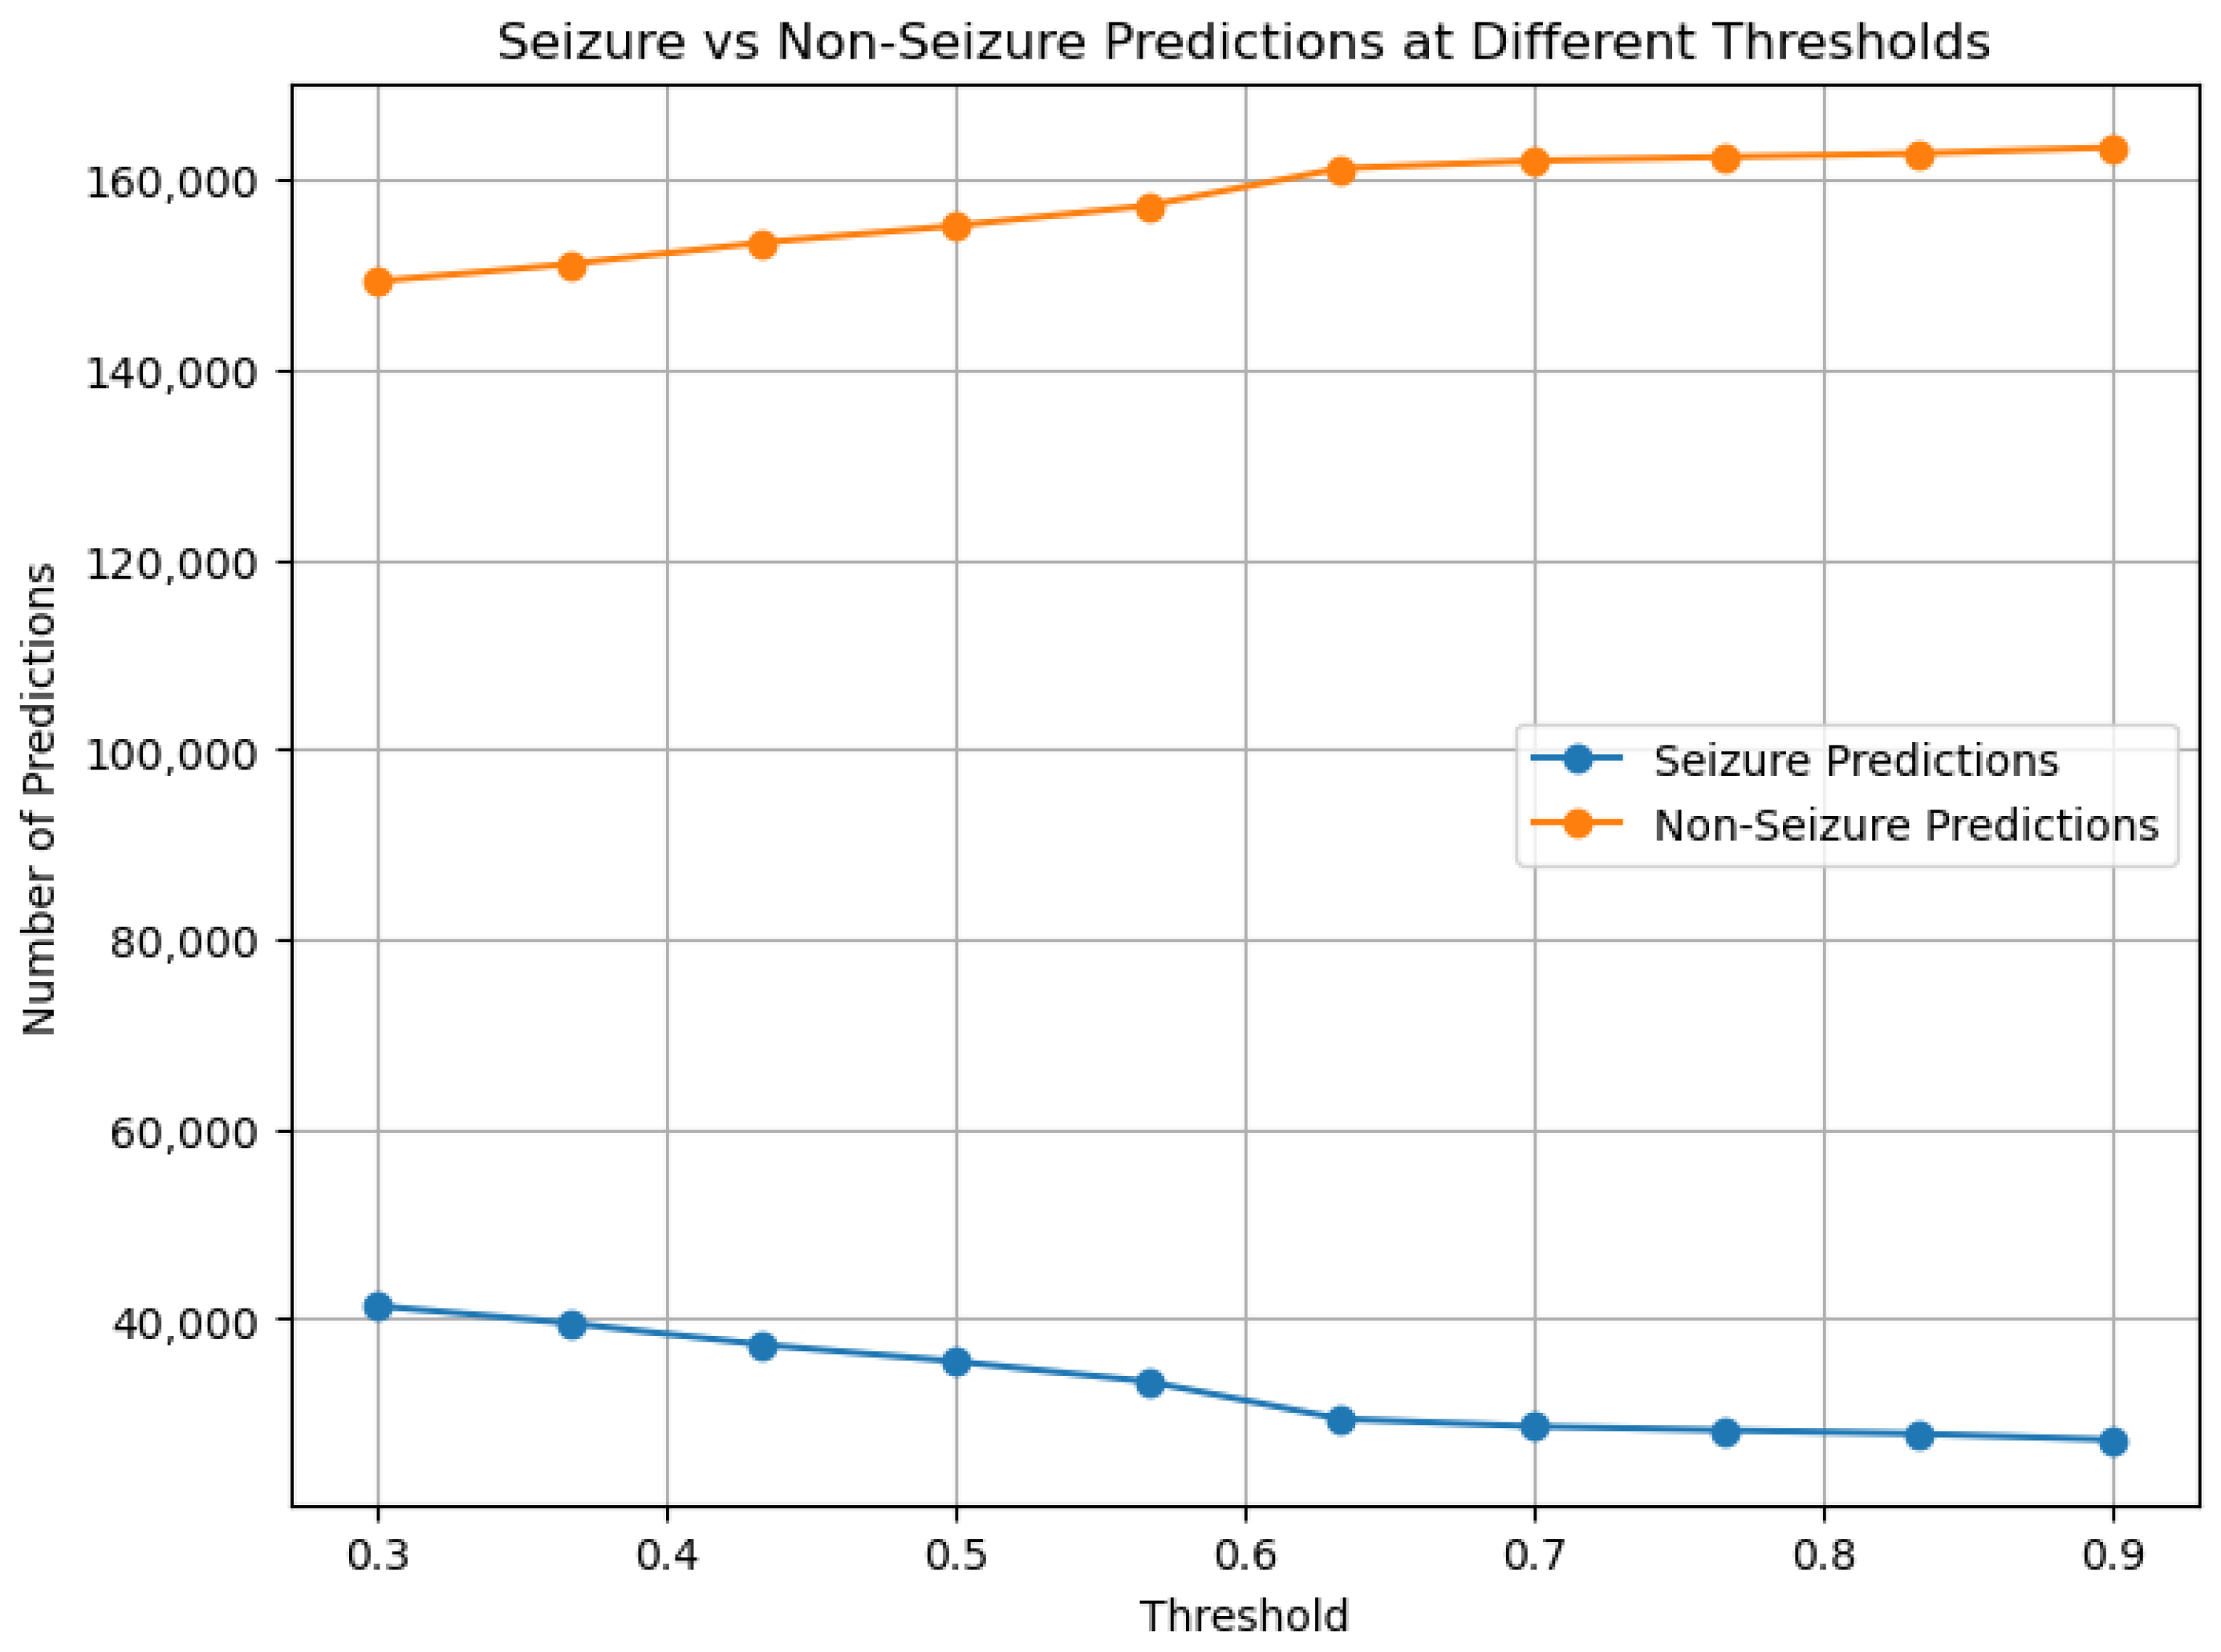
The key innovation lies in our specialized information flow between stages, with high-confidence filtering creating a purified dataset for subsequent type classification. This approach, coupled with class-weighted optimization and gradient flow balancing, enables effective learning even from severely underrepresented classes.
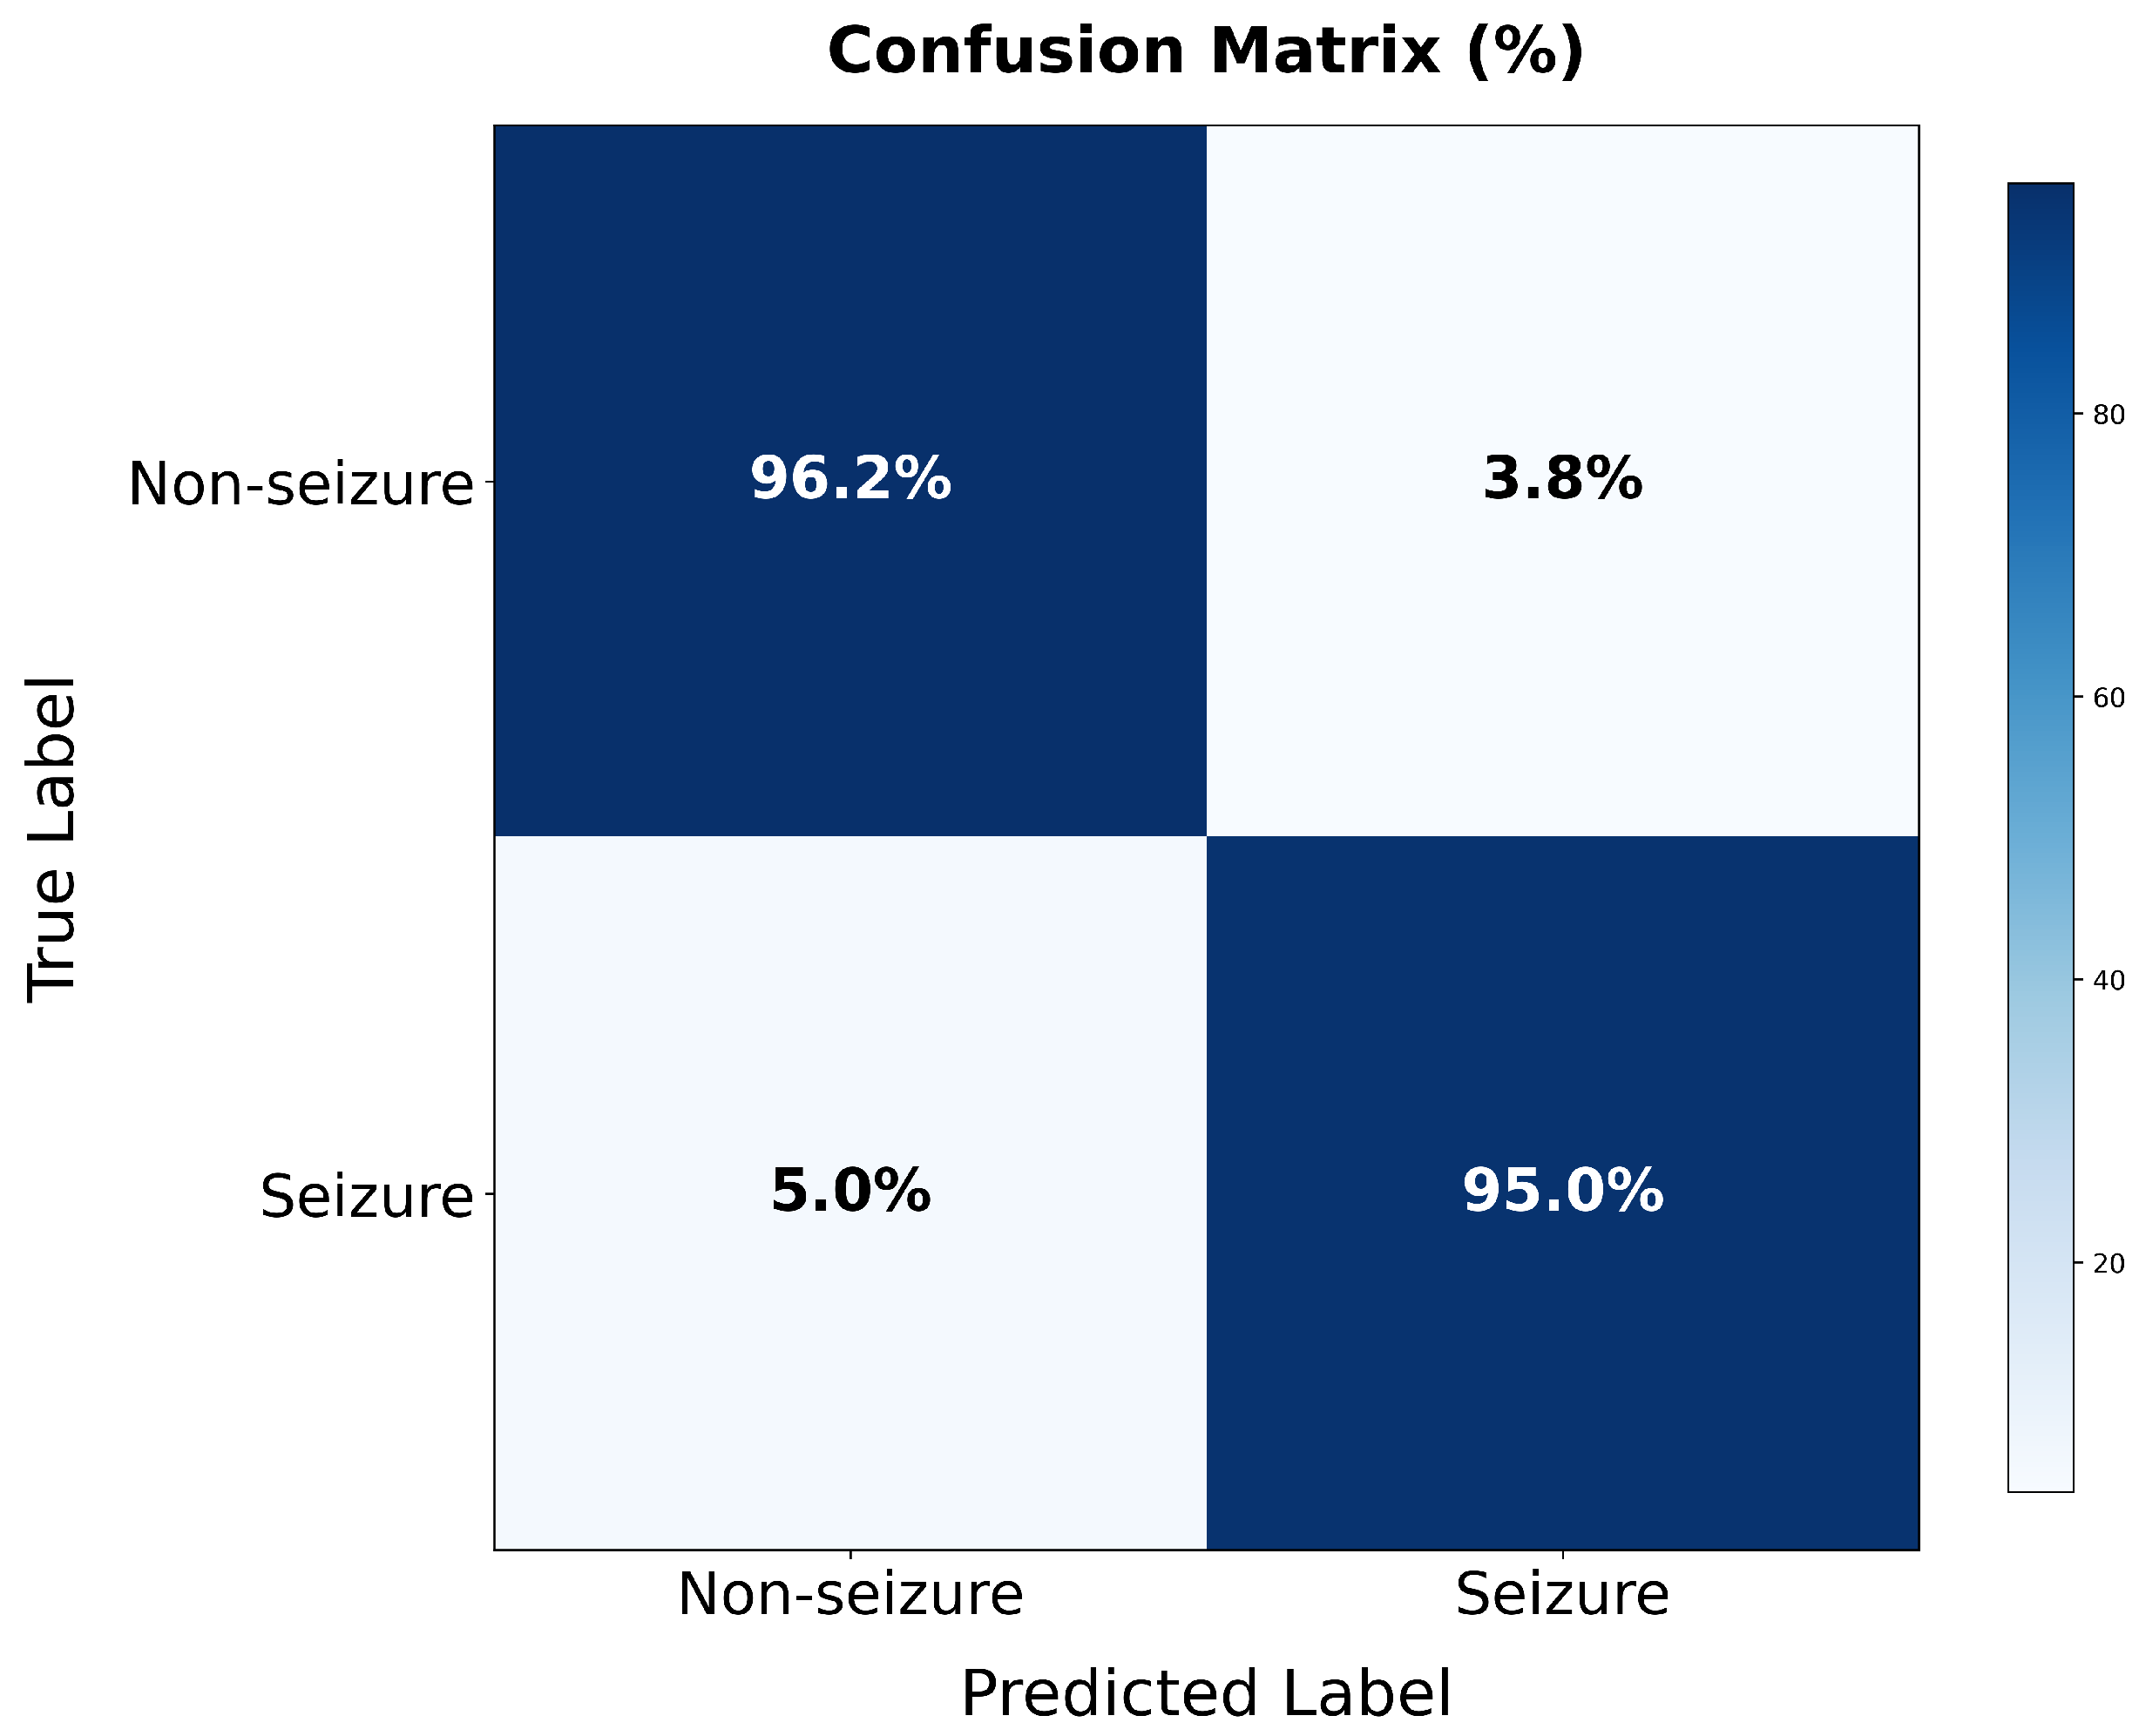
Experimental validation on the TUSZ dataset demonstrates exceptional performance: 99.64% specificity and 98.23% sensitivity for seizure detection, and >99% accuracy across seven seizure categories. Most significantly, our approach achieves consistent performance improvement across all seizure types, rather than improving majority classes at the expense of minority classes as commonly observed in prior work.
The contributions of this work are threefold:
  • We present a comprehensive statistical analysis of the class imbalance and heterogeneity in epileptic seizure data, quantifying the challenges at multiple levels and demonstrating why conventional approaches often underperform on this task.
  • We introduce a cascaded deep learning architecture that effectively addresses multi-level imbalance through problem decomposition, class-weighted optimization, and high-confidence filtering between stages.
  • We provide detailed gradient flow and computational complexity analyses that offer insights into why our approach succeeds where others fail, providing guidance for addressing similar imbalanced classification problems in other domains.
Our results suggest that hierarchical problem decomposition coupled with targeted imbalance mitigation strategies offers a promising approach for biomedical classification tasks characterized by severe class imbalance. The implications extend to other domains with natural hierarchical class structures, such as fault detection, medical diagnosis, and anomaly identification.
The remainder of this paper is organized as follows: Section 2 details our dataset, preprocessing methods, and cascaded architecture; Section 3 presents our experimental results; Section 4 discusses the implications of our findings and limitations; and Section 5 concludes with future research directions.

2. Methodology

2.1. Dataset Characteristics and Imbalance Analysis

The Temple University Hospital Seizure (TUSZ) dataset v2.0.0 [21] was used in this study, comprising 2012 EEG recordings from 264 patients, with seizure events across multiple categories. This dataset provides a comprehensive representation of epileptic seizures in a clinical setting but exhibits significant class imbalance and heterogeneity across seizure patterns, presenting unique challenges for machine learning approaches.

2.1.1. Multi-Level Imbalance Characterization

Our multi-dimensional analysis revealed significant imbalances across patient distribution, seizure counts, and temporal characteristics. As shown in Figure 1, FNSZ dominated at 44.4% of patients, followed by GNSZ (18.1%), and FNSZ+GNSZ (15.0%), with rarer patterns including CPSZ (10.6%), ABSZ (4.4%), TCSZ (2.5%), TNSZ, and SPSZ (1.2% each).
The event-level distribution in Figure 2 reveals an intensified imbalance with FNSZ+GNSZ accounting for 9463 events compared to just 22 events for CPSZ+FNSZ, creating an extreme 430:1 imbalance ratio. Per-patient seizure frequency analysis revealed substantial variability with FNSZ+GNSZ showing the highest average (394.29 ± 510.98 seizures/patient), followed by CPSZ (159.82 ± 150.77), FNSZ (107.89 ± 130.77), GNSZ (87.10 ± 136.12), and ABSZ (19.57 ± 13.48). Notably, standard deviations consistently exceeded means across major pattern types, indicating highly skewed distributions where
σ i > μ i i seizure types

2.1.2. Temporal Heterogeneity and Formal Imbalance Metrics

Our temporal analysis illustrated in Figure 3 reveals considerable duration variability across seizure types, with MYSZ showing the longest average duration (196.0 s), followed by CPSZ (137.0 s), SPSZ (102.5 s), TCSZ (92.6 s), TNSZ (77.0 s), FNSZ (72.5 s), GNSZ (50.4 s), and ABSZ having the shortest (19.6 s). The duration variability is quantified by Equation (2):
R i = max ( d i ) min ( d i )
where  d i  represents the duration in seconds of the i-th seizure event in our dataset.
We quantify the imbalance severity using the established metrics defined in Equations (3)–(5):
IR = max i C n i min i C n i
H = i C p i log 2 p i ( bits )
γ = 1 | C | i C n i n ¯ σ n 3
IR represents the imbalance ratio (multi-class IR = 430:1), H is the Shannon entropy (lower values indicate greater imbalance), and  γ  is Distribution Skewness. These metrics confirm that our dataset exhibits severe class imbalance, particularly in the multi-class seizure type classification task, placing it in the “severely imbalanced domain” category according to standard thresholds (IR > 100:1).

2.2. Data Preprocessing and Feature Extraction

Given the complexity and imbalance of the TUSZ dataset, robust preprocessing was essential to prepare the data for our cascaded architecture.

Signal Preprocessing

Our comprehensive preprocessing pipeline prepared the EEG recordings through a series of sequential operations. For consistency, we used 21 channels from the standard 10/20 montage across all recordings. A 5th-order Butterworth bandpass filter with cutoff frequencies at 0.5 Hz and 40 Hz retained clinically relevant frequency bands while attenuating artifacts. Each EEG segment underwent z-score normalization to ensure uniform amplitude ranges:
X n o r m = X μ σ
where  μ  and  σ  represent the mean and standard deviation of each channel.
Data was segmented according to annotations with uniform length segments of 250 samples (equivalent to 250 Hz sampling rate), with zero-padding applied to shorter segments and truncation for longer ones. Finally, to increase the signal-to-noise ratio, we converted the raw segments into the time-frequency domain using 64-point short-time Fourier transform, resulting in a tensor with dimensions  [ b a t c h _ s i z e ,   21 ,   8 ,   33 ] , representing batch size, EEG channels, time steps, and frequency bins, respectively.

2.3. Cascaded Architecture for Addressing Multi-Level Imbalance

Based on our comprehensive analysis of the imbalance characteristics in the TUSZ dataset, we designed a cascaded deep learning architecture specifically tailored to address the multi-level imbalance challenges.

2.3.1. Architectural Overview

Our cascaded architecture decomposes the complex multi-class imbalanced problem into a sequence of more tractable sub-problems as illustrated in Figure 4 and formalized in Algorithm 1.
Algorithm 1 Cascaded seizure classification algorithm.
1:
Input: EEG segments  X = { x 1 , x 2 , , x N }
2:
Output: Seizure classifications  Y = { y 1 , y 2 , , y N }
3:
Stage 1: Binary Classification
4:
for each segment  x i X  do
5:
      p s e i z u r e = f b i n a r y ( x i )
6:
     if  p s e i z u r e > θ h i g h  (where  θ h i g h = 0.9 ) then
7:
         Add  x i  to high-confidence seizure set  S h c
8:
     else if  p s e i z u r e < θ l o w  (where  θ l o w = 0.1 ) then
9:
         Classify  x i  as non-seizure
10:
   else
11:
       Classify  x i  as uncertain (handle separately)
12:
   end if
13:
end for
14:
Stage 2: Type Classification
15:
for each segment  x i S h c  do
16:
    y i = arg   max c { 1 , , 7 } f m u l t i c l a s s ( x i ) c
17:
end for
18:
Return: Combined classifications Y
The algorithm demonstrates the explicit two-stage processing with high-confidence filtering ( θ h i g h = 0.9 ) that creates the purified dataset for type classification.

2.3.2. Binary Classification Model

The first-stage binary classifier (Stage 1 in Algorithm 1) employs a specialized CNN architecture designed for seizure detection. As shown in our hierarchical model (Figure 4), this stage serves as the initial filter to separate seizure from non-seizure segments.
Table 1 presents our binary classification model architecture. ‘Output Shape’ specifies the tensor dimensions after each layer processing, formatted as (batch_size, sequence_length, features), where ‘None’ represents variable batch size that can accommodate different numbers of input samples simultaneously. ‘Parameters’ indicates the total number of trainable weights in each layer, calculated from the product of input connections, output units, and bias terms. For convolutional layers, this includes filter weights and biases; for dense layers, it includes all weight connections between input and output neurons.
We trained this model using binary cross-entropy loss with class weights to address the 9:1 imbalance ratio between non-seizure and seizure events:
L = 1 N i = 1 N w y i · y i ln ( y ^ i ) + ( 1 y i ) ln ( 1 y ^ i )
where  w c = N K · N c  represents the class weights.

2.3.3. High-Confidence Filtering Mechanism

The critical component of our architecture is the high-confidence filtering mechanism between stages (lines 6–12 in Algorithm 1). Figure 5 demonstrates the impact of different threshold values on seizure vs. non-seizure predictions. After binary classification, we apply a threshold of 0.9 to create a highly purified dataset:
S p u r e = { x i | f b i n a r y ( x i ) > 0.9 }
This approach creates a dataset with 99.5% seizure purity, significantly enhancing the performance of the subsequent type classification while reducing the number of false positives passed to the second stage.

2.3.4. Multi-Class Seizure Type Classification Model

For the second stage (Stage 2 in Algorithm 1), we implemented a streamlined CNN architecture optimized for distinguishing between different seizure types. This model processes only high-confidence seizure segments from the binary classifier.
Table 2 presents our multi-class classification model architecture (tensor dimensions and parameter calculations as defined for Table 1).
We trained this model with categorical cross-entropy loss, incorporating dynamically calculated class weights to address the severe 150:1 imbalance ratio across seizure types:
L = 1 N i = 1 N c = 1 K w c · y i , c ln ( y ^ i , c )
where  w c  is the weight for class c y i , c  is the binary indicator if class c is the correct classification for sample i, and  y ^ i , c  is the predicted probability.

2.4. Cross-Dataset Validation

To evaluate generalization beyond TUSZ, we validated our binary classifier on the University of Bonn dataset [24], comprising sets A-B (normal) and D-E (ictal) with 100 segments each of 23.6 s duration. External datasets like Bonn and CHB-MIT provide only binary seizure/non-seizure annotations, precluding validation of our complete cascaded architecture’s multi-class seizure type classification component. Bonn data was preprocessed to match the TUSZ specifications: resampled to 250 Hz, segmented to 1 s windows, replicated across 21 channels, and z-score normalized. Our pre-trained TUSZ model was evaluated without additional training.

2.4.1. Data Transformation Through Cascaded Architecture

Our cascaded architecture transforms the complex imbalanced dataset through progressive filtering stages. Table 3 presents the overall pipeline transformation, while Table 4 demonstrates step-by-step tracking for the rarest seizure types, illustrating how our approach handles extreme class imbalance at the granular level.
The transformation process demonstrates exceptional efficiency and accuracy. Starting with 190,716 total segments containing 28,600 seizure events (15.0% prevalence), our binary classifier with 0.9 confidence threshold identified 27,272 high-confidence seizure segments, achieving 99.5% purity by correctly identifying 27,135 true seizures while including only 137 false positives. This represents an 85.7% data reduction while preserving 94.9% of the original seizure events. The final type classification stage processed 27,148 pure seizure segments with 100% purity.
The granular analysis of rare seizure types reveals the robustness of our approach. ABSZ, the rarest seizure type with only 86 segments, achieved perfect survival through the binary filter (100% survival rate), demonstrating that our threshold mechanism does not discriminate against underrepresented classes. TCSZ and TNSZ showed excellent survival rates of 99.6% and 95.3%, respectively. Most significantly, all three rare seizure types achieved 100% final classification accuracy despite extreme class imbalance ratios (ABSZ: 148:1, TCSZ: 26:1, TNSZ: 18:1 vs. FNSZ). This step-by-step tracking confirms that our high-confidence filtering mechanism effectively preserves rare seizure instances while eliminating non-seizure noise, enabling perfect performance on underrepresented classes.

2.4.2. Class-Weighted Optimization Strategy

To address the severe class imbalance in seizure type distribution, we implemented a dynamic class-weighting strategy in both classification stages. For the binary classifier, we assigned weights inversely proportional to class frequency:
w c = N K · N c
where N is the total number of samples, K is the number of classes (2 for binary), and  N c  is the number of samples in class c. This approach assigns higher weights to the seizure class to compensate for its lower prevalence compared to non-seizure segments.
For the multi-class seizure type classifier, we extended this approach to address the 150:1 imbalance ratio across seven seizure categories. The weighting scheme was dynamically calculated for each mini-batch during training:
w c = N K · N c · max ( N 1 , N 2 , , N K ) N c
This two-factor weighting assigns particularly high importance to extremely rare classes, with the second term providing additional scaling based on the ratio between the most common and current class frequencies.
To monitor the effect of this weighting scheme on training dynamics, we tracked per-class loss values and their variances throughout the training process. We calculated the variance ratio between weighted and unweighted approaches for each seizure type:
Variance Ratio c = Var ( Weighted Loss c ) Var ( Unweighted Loss c )
We used base-2 logarithms for information-theoretic measures (Equation (4)) to express the entropy in bits, following the standard practice in information theory. For optimization loss functions (Equations (7) and (9)), we employed natural logarithms, which is conventional in machine learning, as they provide more stable gradients during backpropagation.
This analysis allowed us to quantify how our weighting approach redistributed optimization attention across different seizure categories and ensure balanced learning despite the extreme class imbalance.

2.5. Experimental Configuration

All experiments were conducted using the following standardized configuration to ensure reproducibility and consistency across all model training and evaluation phases.
Training Configuration: We employed the Adam optimizer with hyperparameters  β 1 = 0.9  and  β 2 = 0.999 , using an initial learning rate of 0.001. Learning rate scheduling was implemented through ReduceLROnPlateau with a reduction factor of 0.5 and patience of 10 epochs to adaptively adjust the learning rate based on validation performance plateaus. Both the binary classifier and type classifier were trained for 100 epochs each, with early stopping implemented using a patience of 15 epochs while monitoring validation loss to prevent overfitting. All models used a batch size of 32 to balance memory efficiency and gradient stability. The dataset was split using stratified sampling to maintain class distribution proportions, with 80% allocated for training and 20% for testing.
Hardware and Software Configuration: All computational experiments were performed on a system equipped with an NVIDIA GeForce RTX 40 Series Laptop GPU featuring Ada Lovelace architecture, paired with a 12th Generation Intel Core i5 H-Series processor and 16 GB of system RAM. The software environment consisted of TensorFlow 2.8+ and Python 3.9+ with CUDA-enabled GPU acceleration for optimized deep learning computations. The operating system was Windows 11 Home, and thermal management during intensive training sessions was maintained through a WINDFORCE Infinity Cooling System to ensure consistent performance and prevent thermal throttling.

3. Results

3.1. Overview and Statistical Validation

To ensure rigorous evaluation of our cascaded architecture, all performance metrics were calculated with 95% confidence intervals using bootstrap resampling (n = 1000 iterations) on the test set. Our approach demonstrated exceptional performance across both classification stages, with the binary classifier achieving 99.40% ± 0.13% accuracy and the type classifier reaching 99.90% ± 0.04% accuracy. These confidence intervals confirm the statistical significance and robustness of our results.

3.2. Binary Seizure Detection Performance

Our binary classifier achieved exceptional discrimination between seizure and non-seizure EEG segments. Table 5 presents the comprehensive performance metrics, demonstrating near-perfect discriminative capability.
Figure 6 presents the confusion matrix showing 99.64% correct classification for non-seizure segments with only 0.36% false positives, while 98.23% of seizure segments were correctly identified with a 1.77% false negative rate. Threshold analysis revealed optimal operating conditions at threshold = 0.9, providing high-confidence seizure segments for subsequent type classification. The ROC curve in Figure 7 illustrates exceptional performance across different operating points.

3.3. Seizure Type Classification Performance

The seizure type classifier achieved remarkable differentiation between seven seizure categories. Table 6 presents the overall performance metrics, while Table 7 details the per-class performance.
Performance was consistent across both common and rare seizure types, demonstrating the effectiveness of our class-weighted optimization strategy. Notably, three rare seizure types (ABSZ, TCSZ, and TNSZ) achieved perfect 100% precision, recall, and F1-scores despite extreme class imbalance ratios. Figure 8 presents the confusion matrix revealing subtle but clinically meaningful cross-classification patterns that align with known electrophysiological similarities between seizure types.

3.4. Cross-Dataset Validation Results

To evaluate generalizability beyond TUSZ, we validated our binary classifier on the University of Bonn dataset. Table 8 compares performance across datasets, demonstrating robust generalization capabilities.
The cross-dataset evaluation demonstrated robust generalization with 96.0% accuracy and 90.0% F1-score on Bonn data. The 3.4% accuracy decrease reflects the expected domain shift effects from preprocessing adaptations and recording differences between datasets, while maintaining clinically acceptable performance levels. The maintained high recall (95.0%) confirms effective seizure pattern recognition across different recording environments. Figure 9 shows the detailed performance breakdown across both classes.

3.5. Ablation Studies

We conducted comprehensive ablation studies to systematically validate our design choices and demonstrate that performance improvements result from principled optimization rather than arbitrary selection.

3.5.1. Threshold Selection Validation

Table 9 presents systematic evaluation of the confidence thresholds from 0.5 to 0.95, demonstrating trade-offs between data reduction, purity, and classification performance.
The analysis confirms that  θ = 0.9  provides an optimal balance between seizure purity (99.55%) and computational efficiency (85.7% data reduction) while maintaining excellent type classification performance. Higher thresholds yield diminishing returns, while lower thresholds compromise purity without significant performance gains.

3.5.2. Class Weighting Strategy Analysis

Table 10 evaluates multiple class weighting strategies, demonstrating the importance of adaptive approaches for varying degrees of class imbalance.
This analysis demonstrates methodological sophistication: balanced weighting suffices for moderate imbalance scenarios, while custom adaptive weighting becomes essential for extreme imbalance. Overly aggressive weighting degrades performance, validating careful strategy selection.

3.6. Loss Dynamics Analysis

Our analysis of training dynamics revealed significant differences between standard and class-weighted optimization approaches. Table 11 quantifies the variance redistribution effects of our weighting scheme.
The class-weighted approach fundamentally altered optimization dynamics by redistributing attention according to class prevalence. This weighting scheme reduced variance by 90.7% for FNSZ and 84.8% for GNSZ—dominant classes that previously monopolized model updates—while strategically increasing variance for underrepresented classes. This redistribution enabled effective learning from minority classes, achieving 100% accuracy for ABSZ, TCSZ, and TNSZ despite minimal representation.
Figure 10 illustrates these dynamics across training epochs, showing how weighted optimization ensures proportional learning signals across seizure categories regardless of prevalence.

4. Discussion

Our results demonstrate that hierarchical decomposition coupled with targeted imbalance mitigation strategies significantly improves epileptic seizure detection and classification performance. Table 12 summarizes how our approach compares with recent state-of-the-art methods applied to the TUSZ dataset.

4.1. Advantages of Problem Decomposition and Comparative Performance

The decomposition of the seizure classification problem into sequential binary and multi-class stages offers several advantages that contribute to our model’s superior performance. As shown in Table 12, our approach achieves significant improvements over previous methods in both binary detection and type classification.
Our cascaded architecture reduces the maximum imbalance ratio from 430:1 in the original problem to more manageable levels (9:1 for binary classification and at most 5:1 for type classification), allowing each model to specialize in its specific task. The high-confidence filtering mechanism between stages was crucial, creating a dataset with 99.5% seizure purity for the type classification stage.
Recent work by Statsenko et al. [20] proposed a similar system architecture but did not specifically address the extreme class imbalance challenge. Zeng et al. [27] achieved 96.4% accuracy for binary detection and 92.7% for five-class seizure classification, while the recent SeizureNet architecture [26] achieved 96.8% and 93.5% respectively, but both still struggled with rare seizure types.

4.2. Impact of Class-Weighted Optimization and Loss Dynamics

Our loss dynamics analysis revealed that class-weighted optimization was essential for balanced learning across seizure types. Without class weighting, majority classes like FNSZ and GNSZ dominated the optimization process. The class-weighted approach redistributed optimization attention, reducing variance by 90.7% for FNSZ and 84.8% for GNSZ while strategically increasing variance for minority classes.
This redistribution enabled all seizure types to receive proportional learning signals, achieving 100% classification accuracy for rare seizure types (ABSZ, TCSZ, TNSZ). Recent attention-based approaches [26,29] have shown promise but still fall short of our results, particularly for rare seizure categories.

4.3. Cross-Dataset Validation and Clinical Generalizability

Cross-dataset validation on the Bonn dataset (96.0% accuracy) confirms generalization capability beyond TUSZ, addressing concerns about dataset-specific overfitting. The maintained high recall (95.0%) demonstrates robust seizure pattern recognition across different recording environments, supporting clinical deployment feasibility. Note that available external datasets (Bonn, CHB-MIT) contain only binary seizure annotations, limiting validation to our first-stage detector; comprehensive evaluation of the complete cascaded architecture requires datasets with detailed seizure type annotations similar to TUSZ.

4.4. Clinical Implications

The clinical implications of our work are substantial. Accurate seizure type classification is critical for treatment selection, as different seizure types respond to different anti-epileptic medications. The high specificity (99.64%) minimizes false alarms in continuous monitoring scenarios, while the high sensitivity (98.23%) ensures seizure events are rarely missed.
The type classifier’s exceptional performance across seven seizure categories enables the more precise characterization of a patient’s epilepsy syndrome, informing both medical and surgical treatment decisions. The ability to accurately classify rare seizure types is particularly valuable, as these can indicate specific underlying pathologies requiring targeted interventions.
Our approach provides a valuable tool for computer-aided decisions by physicians and can help identify episodes that may remain unmentioned by the patient. As noted by Rahman et al. [30], deep learning techniques generally outperform traditional approaches for seizure classification, and our work pushes the performance boundaries across all metrics.

4.5. Methodological Limitations and Future Directions

While our results demonstrate significant improvements over existing approaches, several considerations merit discussion. Cross-study performance comparisons are inherently limited by differences in data preprocessing, train–test splits, and evaluation protocols across studies. Our confidence intervals provide statistical validity, but direct statistical comparison with prior work would require identical experimental conditions.
Future work should focus on establishing standardized evaluation protocols for seizure detection research and validating our complete cascaded architecture on datasets with detailed seizure type annotations. Our ablation studies demonstrate that optimal design choices depend on specific imbalance characteristics, suggesting adaptive methodologies may be necessary for robust performance across diverse clinical scenarios.
Additional future directions include extending the architecture to localize seizure onset zones, incorporating multimodal data (video and cardiac signals), and developing personalized models that adapt to patient-specific seizure patterns. The hierarchical approach and class-balancing strategies could also be adapted to other biomedical classification tasks characterized by severe class imbalance and natural hierarchical structures, such as arrhythmia detection, sleep stage classification, and pathology identification.

5. Conclusions

This study presented a cascaded deep learning architecture for comprehensive epileptic seizure analysis that effectively addresses multi-level imbalance in neurophysiological signal classification. By achieving 99.64% specificity and 98.23% sensitivity for seizure detection, and >99% accuracy across seven seizure categories including perfect classification for rare types, with cross-dataset validation confirming robust generalization (96.0% accuracy on Bonn dataset), our approach demonstrates that hierarchical problem decomposition combined with targeted imbalance mitigation offers a promising solution for biomedical classification tasks characterized by severe class imbalance and hierarchical structures, with applications extending to fault detection, rare disease diagnosis, and anomaly identification in complex systems.

Author Contributions

Conceptualization, P.A. and G.E.; methodology, P.A.; software, P.A.; validation, G.E., H.L. and U.M.; resources, H.L.; data curation, H.L.; writing—original draft preparation, P.A.; writing—review and editing, G.E., U.M. and R.R.S.; visualization, P.A.; supervision, G.E., U.M. and R.R.S.; project administration, H.L.; funding acquisition, H.L. All authors have read and agreed to the published version of the manuscript.

Funding

This research received no external funding.

Institutional Review Board Statement

Not applicable.

Informed Consent Statement

Not applicable.

Data Availability Statement

The data presented in this study are available from the Temple University Hospital EEG Database at https://isip.piconepress.com/projects/nedc/html/tuh_eeg/ (registration required) and the Bonn EEG Database at https://www.ukbonn.de/epileptologie/arbeitsgruppen/ag-lehnertz-neurophysik/downloads/ (open access).

Conflicts of Interest

The authors declare no conflicts of interest.

Abbreviations

The following abbreviations are used in this manuscript:
ABSZAbsence seizure
CPSZComplex partial seizure
CNNConvolutional neural network
CVCoefficient of variation
EEGElectroencephalography
FNSZFocal non-specific seizure
GNSZGeneralized non-specific seizure
IRImbalance ratio
LSTMLong short-term memory
MYSZMyoclonic seizure
ROC-AUCReceiver operating characteristic—area under curve
RNNRecurrent neural network
SMOTESynthetic minority over-sampling technique
SPSZSimple partial seizure
TCSZTonic-clonic seizure
TNSZTonic seizure
TUSZTemple University Hospital Seizure Corpus

References

  1. World Health Organization. Epilepsy: A Public Health Imperative: Summary; World Health Organization: Geneva, Switzerland, 2019; p. 12.
  2. World Health Organization. Atlas: Country Resources for Neurological Disorders; World Health Organization: Geneva, Switzerland, 2017; p. 71.
  3. Benbadis, S.R.; Lin, K. Errors in EEG interpretation and misdiagnosis of epilepsy. Eur. Neurol. 2008, 59, 267–271. [Google Scholar] [CrossRef]
  4. Engel, J. A practical guide for routine EEG studies in epilepsy. J. Clin. Neurophysiol. 1984, 1, 109–142. [Google Scholar] [CrossRef]
  5. Benbadis, S.R.; Tatum, W.O. Overintepretation of EEGs and misdiagnosis of epilepsy. J. Clin. Neurophysiol. 2003, 20, 42–44. [Google Scholar] [CrossRef]
  6. Michel, C.M.; Brunet, D. EEG Source Imaging: A Practical Review of the Analysis Steps. Front. Neurol. 2019, 10, 325. [Google Scholar] [CrossRef]
  7. Kotte, S.; Dabbakuti, J.K. Methods for removal of artifacts from EEG signal: A review. J. Phys. Conf. Ser. 2020, 1706, 012093. [Google Scholar] [CrossRef]
  8. Baud, M.O.; Schindler, K.; Rao, V.R. Under-sampling in epilepsy: Limitations of conventional EEG. Clin. Neurophysiol. Pract. 2021, 6, 41–49. [Google Scholar] [CrossRef]
  9. Roy, Y.; Banville, H.; Albuquerque, I.; Gramfort, A.; Falk, T.H.; Faubert, J. Deep learning-based electroencephalography analysis: A systematic review. J. Neural Eng. 2019, 16, 051001. [Google Scholar] [CrossRef]
  10. Craik, A.; He, Y.; Contreras-Vidal, J.L. Deep learning for electroencephalogram (EEG) classification tasks: A review. J. Neural Eng. 2019, 16, 031001. [Google Scholar] [CrossRef]
  11. Truong, N.D.; Nguyen, A.D.; Kuhlmann, L.; Bonyadi, M.R.; Yang, J.; Ippolito, S.; Kavehei, O. Convolutional neural networks for seizure prediction using intracranial and scalp electroencephalogram. Neural Netw. 2018, 105, 104–111. [Google Scholar] [CrossRef]
  12. Covert, I.; Krishnan, B.; Najm, I.; Zhan, J.; Shore, M.; Hixson, J.; Po, M.J. Temporal graph convolutional networks for automatic seizure detection. In Proceedings of the Machine Learning for Healthcare Conference, PMLR, Ann Arbor, MI, USA, 8–10 August 2019; pp. 160–180. [Google Scholar]
  13. Ahmedt-Aristizabal, D.; Fookes, C.; Dionisio, S.; Nguyen, K.; Cunha, J.P.S.; Sridharan, S. Automated analysis of seizure semiology and brain electrical activity in presurgery evaluation of epilepsy: A focused survey. Epilepsia 2017, 58, 1817–1831. [Google Scholar] [CrossRef]
  14. Raut, S.; Rathee, N. Comparative Study on Machine Learning Classifiers for Epileptic Seizure Detection in Reference to EEG Signals. In Smart Healthcare Systems: An Internet of Things Perspective; Springer: Singapore, 2021; pp. 375–395. [Google Scholar] [CrossRef]
  15. Li, Q.; Gao, J.; Zhang, Z.; Huang, Q.; Wu, Y.; Xu, B. Distinguishing epileptiform discharges from normal electroencephalograms using adaptive fractal and network analysis: A clinical perspective. Front. Physiol. 2020, 11, 828. [Google Scholar] [CrossRef]
  16. Li, Y.; Cui, W.; Li, H.; Huang, M.; Cui, L. Detection of epileptic seizure based on entropy analysis of short-term EEG. PLoS ONE 2018, 13, e0193691. [Google Scholar] [CrossRef]
  17. He, H.; Garcia, E.A. Learning from Imbalanced Data. IEEE Trans. Knowl. Data Eng. 2009, 21, 1263–1284. [Google Scholar]
  18. Chawla, N.V.; Bowyer, K.W.; Hall, L.O.; Kegelmeyer, W.P. SMOTE: Synthetic Minority Over-sampling Technique. J. Artif. Intell. Res. 2002, 16, 321–357. [Google Scholar] [CrossRef]
  19. Johnson, J.M.; Khoshgoftaar, T.M. Survey on deep learning with class imbalance. J. Big Data 2019, 6, 27. [Google Scholar] [CrossRef]
  20. Statsenko, Y.; Babushkin, V.; Talako, T.; Kurbatova, T.; Smetanina, D.; Simiyu, G.L.; Habuza, T.; Ismail, F.; Almansoori, T.M.; Gorkom, K.N.V.; et al. Automatic Detection and Classification of Epileptic Seizures from EEG Data: Finding Optimal Acquisition Settings and Testing Interpretable Machine Learning Approach. Biomedicines 2023, 11, 2370. [Google Scholar] [CrossRef]
  21. Shah, V.; von Weltin, E.; Lopez, S.; McHugh, J.R.; Veloso, L.; Golmohammadi, M.; Obeid, I.; Picone, J. The Temple University Hospital Seizure Detection Corpus. Front. Neuroinf. 2018, 12, 83. [Google Scholar] [CrossRef]
  22. Asif, U.; Roy, S.; Tang, J.; Harrer, S. SeizureNet: Multi-Spectral Deep Feature Learning for Seizure Type Classification. In Proceedings of the Third International Workshop, MLCN 2020, and Second International Workshop, RNO-AI 2020, Held in Conjunction with MICCAI 2020, Lima, Peru, 4–8 October 2020; Springer: Cham, Switzerland, 2020; pp. 77–87. [Google Scholar]
  23. Hussein, R.; Palangi, H.; Ward, R.K.; Wang, Z.J. Optimized deep neural networks for real-time seizure detection systems. IEEE Trans. Neural Syst. Rehabil. Eng. 2019, 27, 2243–2250. [Google Scholar]
  24. Andrzejak, R.G.; Lehnertz, K.; Mormann, F.; Rieke, C.; David, P.; Elger, C.E. Indications of nonlinear deterministic and finite-dimensional structures in time series of brain electrical activity: Dependence on recording region and brain state. Phys. Rev. E 2001, 64, 061907. [Google Scholar] [CrossRef]
  25. Vanabelle, P.; De Handschutter, P.; El Tahry, R.; Benjelloun, M.; Boukhebouze, M. Epileptic seizure detection using EEG signals and extreme gradient boosting. J. Biomed. Res. 2020, 34, 228–239. [Google Scholar] [CrossRef] [PubMed] [PubMed Central]
  26. Gill, T.S.; Zaidi, S.S.H.; Shirazi, M.A. Attention-based deep convolutional neural network for classification of generalized and focal epileptic seizures. Epilepsy Behav. 2024, 155, 109732. [Google Scholar] [CrossRef] [PubMed]
  27. Zeng, W.; Shan, L.; Su, B.; Du, S. Epileptic seizure detection with deep EEG features by convolutional neural network and shallow classifiers. Front. Neurosci. 2023, 17, 1145526. [Google Scholar] [CrossRef] [PubMed]
  28. Albaqami, H.A.; Hassan, G.M.; Datta, A. Wavelet-Based Multi-Class Seizure Type Classification System. Appl. Sci. 2022, 12, 5702. [Google Scholar] [CrossRef]
  29. Tang, Y.; Wu, Q.; Mao, H.; Guo, L. Epileptic seizure detection based on path signature and Bi-LSTM Network with attention mechanism. IEEE Trans. Neural Syst. Rehabil. Eng. 2024, 32, 304–313. [Google Scholar] [CrossRef] [PubMed]
  30. McCallan, N.; Davidson, S.; Ng, K.Y.; Biglarbeigi, P.; Finlay, D.D.; Lan, B.L.; McLaughlin, J.A.D. Epileptic multi-seizure type classification using electroencephalogram signals from the Temple University Hospital Seizure Corpus: A review. Expert Syst. Appl. 2023, 234, 121040. [Google Scholar] [CrossRef]
Figure 1. Distribution of seizure patterns across patients. The pie chart shows the predominance of focal non-specific seizures (FNSZ) at 44.4% of patients, followed by generalized non-specific seizures (GNSZ) at 18.1%, and combined focal and generalized non-specific seizures (FNSZ+GNSZ) at 15.0%.
Information 16 00532 g001
Figure 2. Distribution of total seizure events across different pattern groups. The combined FNSZ+GNSZ pattern accounts for the highest number of events (9463), followed by FNSZ (7660), CPSZ (2717), and GNSZ (2526), showing CPSZ with extreme variability ( R CPSZ = 449  s, range: 3–452 s) while SPSZ demonstrates more consistency ( R SPSZ = 51  s, range: 77–128 s). FNSZ and GNSZ exhibit high variability with ranges of 1–686 s and 1–716 s, respectively.
Information 16 00532 g002
Figure 3. Temporal heterogeneity of seizure durations across different types. Blue dots represent the average durations for each seizure type, with vertical light blue bars showing the full range from minimum to maximum duration. MYSZ shows the consistent duration (196 s), while FNSZ and GNSZ display extreme variability (ranges of 1–686 s and 1–716 s, respectively).
Information 16 00532 g003
Figure 4. Cascaded architecture for seizure detection and classification.
Information 16 00532 g004
Figure 5. Impact of different threshold values on seizure vs. non-seizure predictions. As the threshold increases from 0.3 to 0.9, the number of segments classified as seizures decreases, while the confidence in those classifications increases. We selected a threshold of 0.9 to ensure high purity in our seizure dataset for the second classification stage.
Information 16 00532 g005
Figure 6. Confusion matrix for binary seizure classification. Diagonal elements show correct classifications (99.64% non-seizure, 98.23% seizure), while off-diagonal elements indicate misclassification rates.
Information 16 00532 g006
Figure 7. ROC curve for binary seizure classifier. AUC of 0.995 demonstrates near-perfect discriminative performance across threshold settings.
Information 16 00532 g007
Figure 8. Confusion matrix for seven-class seizure type classification showing high accuracy (≥99.65%) across all types with minimal confusion between similar categories.
Information 16 00532 g008
Figure 9. Cross-dataset validation confusion matrix on University of Bonn dataset showing 96.2% specificity and 95.0% sensitivity, confirming robust generalization across different recording environments.
Information 16 00532 g009
Figure 10. Loss dynamics comparison: unweighted optimization (top) shows higher initial loss for majority classes, while weighted optimization (bottom) demonstrates balanced learning across all seizure types. The TNSZ spike around epoch 20 exemplifies continued learning for rare classes when challenging examples are encountered.
Information 16 00532 g010
Table 1. Binary classification model summary.
LayerOutput ShapeParameters
Input(None, 250, 21)0
Conv1D (64 filters, kernel = 5)(None, 246, 64)6784
BatchNormalization(None, 246, 64)256
MaxPooling1D(None, 123, 64)0
Conv1D (128 filters, kernel = 3)(None, 121, 128)24,704
BatchNormalization(None, 121, 128)512
MaxPooling1D(None, 60, 128)0
Conv1D (256 filters, kernel = 3)(None, 58, 256)98,560
BatchNormalization(None, 58, 256)1024
MaxPooling1D(None, 29, 256)0
Flatten(None, 7424)0
Dense(None, 128)950,400
Dropout (0.5)(None, 128)0
Dense (Output)(None, 1)129
Total Parameters:1,082,369
Table 2. Multi-class classification model summary.
LayerOutput ShapeParameters
Input(None, 250, 21)0
Conv1D (128 filters, kernel = 3)(None, 248, 128)8320
MaxPooling1D(None, 124, 128)0
Flatten(None, 15,872)0
Dense(None, 64)1,015,872
Dropout (0.5)(None, 64)0
Dense (Output)(None, 7)455
Total Parameters:1,024,647
Table 3. Data transformation statistics through cascaded architecture stages.
StageTotalSeizuresNon-SeizuresPurity (%)
Raw Data190,71628,600162,11615.0
Binary Filter (0.9)27,27227,13513799.5
Type Classification27,14827,1480100.0
Table 4. Step-by-step transformation tracking for rare seizure types.
TypeRaw DataAfter FilterSurvival (%)Final Acc (%)
ABSZ8686100.0100.0
TCSZ49449299.6100.0
TNSZ76072495.3100.0
Table 5. Binary seizure detection performance metrics with 95% confidence intervals.
MetricPerformance (%)
Accuracy99.40 ± 0.13 (95% CI: 99.27–99.53)
Sensitivity (Recall)98.23 ± 0.28 (95% CI: 97.95–98.51)
Specificity99.64 ± 0.09 (95% CI: 99.55–99.73)
Precision96.55 ± 0.31 (95% CI: 96.24–96.86)
F1-score97.38 ± 0.19 (95% CI: 97.19–97.57)
ROC-AUC0.995 ± 0.002 (95% CI: 0.993–0.997)
Table 6. Overall seizure type classification performance with 95% confidence intervals.
MetricPerformance (%)
Overall Accuracy99.90 ± 0.04 (95% CI: 99.86–99.94)
Macro-averaged Precision99.93 ± 0.02 (95% CI: 99.91–99.95)
Macro-averaged Recall99.88 ± 0.04 (95% CI: 99.84–99.92)
Macro-averaged F1-score99.90 ± 0.03 (95% CI: 99.87–99.93)
Rare Class F1-score100.00 ± 0.00 (95% CI: 100.00–100.00)
Table 7. Per-seizure type performance metrics demonstrating consistent accuracy across common and rare seizure types.
Seizure TypePrecision (%)Recall (%)F1-Score (%)
Absence (ABSZ)100.00100.00100.00
Complex partial (CPSZ)99.76100.0099.88
Focal non-specific (FNSZ)99.8899.6599.76
Generalized non-specific (GNSZ)99.8799.7599.81
Simple partial (SPSZ)100.0099.7399.86
Tonic-clonic (TCSZ)100.00100.00100.00
Tonic (TNSZ)100.00100.00100.00
Table 8. Cross-dataset validation: TUSZ training performance vs. Bonn dataset generalization.
MetricTUSZ (Training Dataset)Bonn (External Validation)
Accuracy (%)99.40 ± 0.1396.0
Precision (%)96.55 ± 0.3186.0
Recall (%)98.23 ± 0.2895.0
F1-score (%)97.38 ± 0.1990.0
Specificity (%)99.64 ± 0.0996.2
Performance Gap3.4% accuracy decrease
Table 9. Threshold ablation study demonstrating optimal confidence filtering at  θ = 0.9 .
ThresholdFiltered SegmentsPurity (%)Data Reduction (%)Type Accuracy (%)Rare Class F1 (%)
0.5035,52780.2181.3798.4599.49
0.6030,12994.3084.2098.5599.53
0.7028,68297.9584.9698.5899.53
0.8028,09098.8385.2798.6299.65
0.9027,27299.5585.7098.7099.78
0.9526,23899.7486.2498.7099.76
Table 10. Class weighting strategy ablation demonstrating superiority of adaptive weighting for extreme imbalance.
StrategyOverall Acc (%)Rare Class F1 (%)Imbalance ContextOptimal
No weighting97.8294.61Moderate (20:1)No
Balanced weighting98.8298.23Moderate (20:1)Yes
Inverse frequency98.8292.80Moderate (20:1)No
Custom adaptive (Ours)99.90100.00Extreme (148:1)Yes
Over-aggressive97.6897.88AnyNo
Table 11. Variance ratio analysis between weighted and unweighted optimization showing the strategic redistribution of learning attention.
Seizure TypeVariance RatioEffect (%)
ABSZ2033.68−203,268.0 (increase)
CPSZ8.86−785.9 (increase)
FNSZ0.0990.7 (decrease)
GNSZ0.1584.8 (decrease)
SPSZ4.26−326.5 (increase)
TCSZ62.14−6113.7 (increase)
TNSZ28.69−2769.5 (increase)
Overall2.46−146.1 (increase)
Table 12. Performance comparison with state-of-the-art approaches on TUSZ dataset. Our results include 95% confidence intervals calculated via bootstrap resampling. Literature comparisons are indicative, as studies may employ different TUSZ data splits, patient subsets, cross-validation strategies, and evaluation protocols. Standardized benchmarking frameworks are needed for rigorous cross-study comparisons.
MethodBinary (%)Type (%)ClassesNotes
Statsenko et al. [20]87.7095.00–100.008Different evaluation protocol
XGBoost [25]83.00Not reported-Different data subset
Attention-based CNN [26]92.1090.207Different preprocessing
Zeng et al. [27]96.4092.705Reduced class set
Wavelet-based CNN [28]95.2091.407Different feature extraction
BiLSTM-Attention [29]94.5089.806Different architecture
SeizureNet [26]96.8093.507Different training strategy
Single-stage CNN [22]94.8089.304Limited class set
LSTM-based [23]95.7091.805Different validation
Graph neural network [12]97.20Not reported-Binary only
Our approach99.40 ± 0.1399.90 ± 0.047Systematic validation
Disclaimer/Publisher’s Note: The statements, opinions and data contained in all publications are solely those of the individual author(s) and contributor(s) and not of MDPI and/or the editor(s). MDPI and/or the editor(s) disclaim responsibility for any injury to people or property resulting from any ideas, methods, instructions or products referred to in the content.

