Article

Symbolic Framework for Evaluation of NOMA Modulation Impairments Based on Irregular Constellation Diagrams

1
Center for Applied Mathematics and Electronics, 11000 Belgrade, Serbia
2
Faculty of Technical Sciences, 32000 Čačak, Serbia
3
Military Academy, University of Defence, 11042 Belgrade, Serbia
4
School of Electrical and Computer Engineering, Ben-Gurion University, Be’er Sheva 8410501, Israel
5
Dr BR Ambedkar National Institute of Technology, Jalandhar 144008, Punjab, India
*
Author to whom correspondence should be addressed.
Information 2025, 16(6), 468; https://doi.org/10.3390/info16060468
Submission received: 24 April 2025 / Revised: 23 May 2025 / Accepted: 26 May 2025 / Published: 31 May 2025
(This article belongs to the Special Issue Second Edition of Advances in Wireless Communications Systems)

Abstract

Complexity of non-orthogonal multiple access (NOMA) digital signal processing schemes is particularly relevant in mobile environments because of the varying channel conditions of every single user. In contrast to legacy modulation and coding schemes (MCSs), NOMA MCSs typically have irregular symbol constellations with asymmetric symbol decision regions affecting synchronization at the receiver. Research papers investigating signal processing in this emerging field usually lack sufficient details for facilitating software-defined radio (SDR) implementation. This work presents a new symbolic framework approach for simulating signal processing functions in SDR transmit–receive paths in a dynamic NOMA downlink use case. The proposed framework facilitates simple and intuitive implementation and testing of NOMA schemes and can be easily expanded and implemented on commercially available SDR hardware. We explicitly address several important design and measurement parameters and their relationship to different tasks, including variable constellation processing, carrier and symbol synchronization, and pulse shaping, focusing on quadrature amplitude modulation (QAM). The advantages of the proposed approach include intuitive symbolic modeling in a dynamic framework for NOMA signals; efficient, more accurate, and less time-consuming design flow; and generation of synthetic training data for machine-learning models that could be used for system optimization in real-world use cases.

1. Introduction

The significant gains of using the same space, time, and frequency resource for data transmission simultaneously by multiple users have motivated extensive research into the application and implementation of non-orthogonal multiple access (NOMA) transmission schemes in the last decade. Performance evaluation of such schemes requires both system-level and link-level simulations. A reliable multiuser link-level simulation for NOMA is thus critically important to facilitate precise modeling of inter-user interference for evaluating the performance of NOMA processing algorithms such as interference cancelation, synchronization, and equalization [1].
In particular, irregular NOMA constellations pose unique challenges to the synchronization and decoding tasks, as the decision regions in the signal space become more complex and intertwined, which necessitates sophisticated synchronization algorithms to ensure accurate signal demodulation [2]. Furthermore, the decoding process must be sufficiently robust to handle the increased interference and varying power levels inherent to irregular NOMA schemes. Advanced multi-user detection techniques and iterative decoding algorithms have been proposed to address these challenges, leveraging the unique structure of irregular constellations to improve decoding performance [3].
To facilitate the incorporation of advanced NOMA techniques into communication systems, achieving optimal performance in irregular NOMA setups requires a delicate balance between complexity and practicality. The synchronization process, in particular, must be finely tuned in order to align with the irregular structure of the constellations, which is required for minimizing the error rates and maximizing the throughput. Since many modulation and coding schemes (MCSs) have high implementation complexities, analytical derivations of bit error rate (BER), outage probability, and other performance indicators, are often interactable, and performance characterization mainly relies on simulation tests. These simulations require working out implementation details, carrying out numerical programming, and accounting for hardware imperfections, which, in turn requires additional research and development effort. This need for the development of comprehensive NOMA simulations is the main motivation for the study presented in this manuscript, which details a symbolic, user-comprehensive framework, building on conventional software-defined radio (SDR) signal processing steps employed in NOMA transmission and reception on the downlink path. The proposed symbolic framework facilitates a high-level transceiver design thereby promoting understanding of the effects that different modulation impairments have on the performance of NOMA communication links. Subsequently, ongoing research continues to refine these techniques, exploring new methods to enhance the efficiency and reliability of NOMA systems in real-world applications.

1.1. Related Works

Signal processing for SDR has been intensively studied from multiple perspectives, including MATLAB-based approaches [4,5] and general guides [6,7]. An extensive survey on SDR NOMA implementation is presented in [8]. In Ref. [9], performance of multiuser quadrature phase shift keying (QPSK) NOMA was analyzed for two and for three users both numerically and through practical SDR implementation. In [10], the performance of NOMA implementation on a field-programmable gate array (FPGA) platform was presented; Ref. [11] presented system- and level-link simulators for MATLAB; and in [12], link-level simulation using GNU Radio was presented.
In the context of symbol synchronization, various methods have been proposed to address the challenges posed by the superimposed nature of NOMA signals. Symbol synchronization involves aligning receiver’s timing with the symbol timing of the received waveform, which is particularly challenging in NOMA due to the overlapping of signals from multiple transmitters with different power levels. A recent study [13] introduced a novel synchronization algorithm that leverages the unique structure of NOMA signals to achieve accurate symbol alignment. This method improves the synchronization performance by reducing the inter-symbol interference, which is critical for decoding accuracy.
Timing alignment in NOMA systems is equally crucial, as it ensures that the signals from different users arrive at the receiver within the same time frame. Misalignment can lead to significant performance degradation. In Ref. [14], a robust timing alignment technique that utilizes adaptive filters to dynamically adjust the timing offsets was proposed. This approach was shown to significantly enhance the system’s resilience to timing errors, thereby improving the overall reliability of NOMA transmissions. Triggering mechanisms in NOMA systems refer to the initiation processes for various transmission and reception tasks, such as channel estimation and data decoding. Efficient triggering mechanisms are vital for minimizing latency and maximizing throughput. Recent research [15] has been focused on utilizing deep-learning methods for overcoming challenges in NOMA processing. Overall, performance improvement in symbol synchronization, timing alignment, and triggering mechanisms is essential for the practical implementation of NOMA. These techniques collectively address the inherent challenges of NOMA and pave the way for its deployment in future wireless communication systems. Among the performance metrics, the error vector magnitude (EVM) for downlink NOMA was previously investigated, e.g., [16]. In Ref. [17], it was shown that when timing is aligned and link-level synchronization is achieved, NOMA can result in significantly higher rates compared to orthogonal transmission. We note that to the best of our knowledge, symbolic language models were not applied in generating NOMA link-level simulations, and NOMA signal processing design did not include the complete details of the parameter settings.

1.2. Main Contributions and Orgamization

The main contributions of this work are summarized as follows: (1) We introduce a new approach for intuitive modeling and analysis of NOMA signals using symbolic computations, facilitating a better understanding of complex modulation schemes with irregular constellations. The proposed approach is fundamentally different from previous approaches, which utilized MATLAB [11] or GNU Radio [12], as the operations are stated qualitatively and not quantitatively. (2) The new symbolic framework allows a more precise and much faster design and evaluation processes for NOMA systems compared to conventional numerical approaches. (3) The proposed framework is compatible with SDR platforms, enabling its direct implementation on commercially available hardware. (4) The developed model can serve as a data source for training neural networks and AI methods for optimizing the performance of NOMA systems. (5) The use of intuitive modelling facilitates maximal flexibility in the characterization of the different operations.
The rest of the paper is structured as follows: In Section 2, we demonstrate the use of the symbolic framework through the implementation of a NOMA scheme simulation. In Section 3, we present simulation outcomes and results. Lastly, in Section 4, we summarize the results and comment on future research avenues and further steps. In the following, we use Wolfram symbolic engine to represent signal processing tasks.

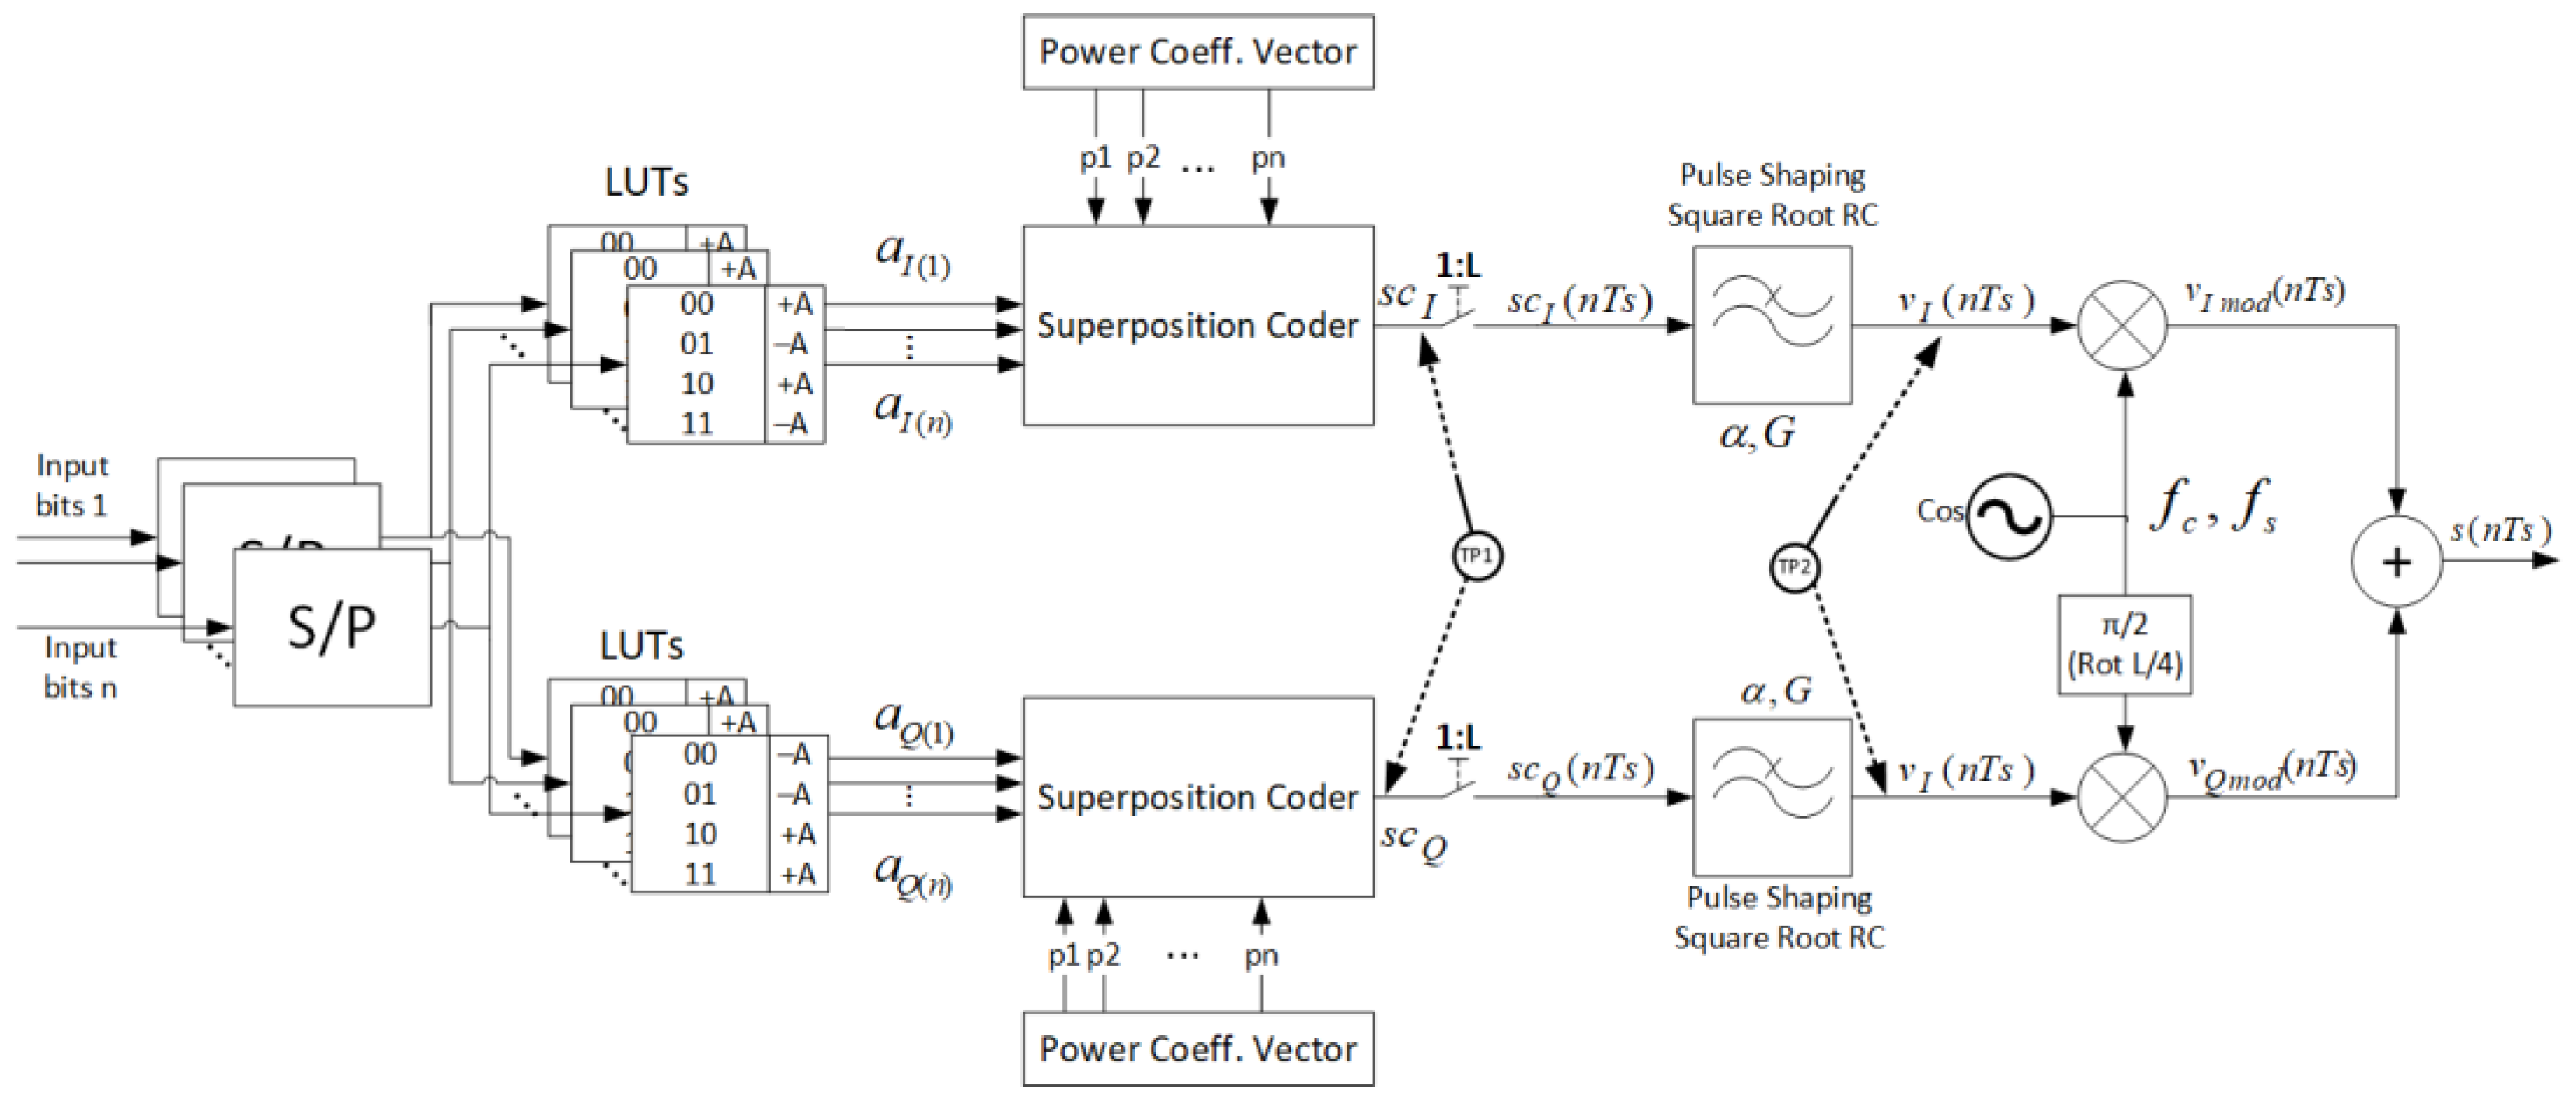
2. Processing Blocks in SDR Transmitter

In this section, we demonstrate the proposed symbolic framework through the implementation of NOMA link-level simulation, by illustrating how the transmitter’s side of the link can be succinctly implemented via symbolic language. Before providing the details of the transmitter configuration, we first introduce notations for several important parameters for SDR implementation: The bit rate and bit duration are denoted by R b and T B = 1 / R B , respectively; sampling frequency and sampling interval are denoted with f s and with T S = 1 / f s , respectively; and the oversampling factor is denoted by L = T B / T S , which represents the number of samples corresponding to a single quadrature symbol. We denote the carrier frequency with f C , the roll-off factor, or excess bandwidth coefficient, for the square-root raised-cosine pulse shaping, with α , the group delay with G, and the power coefficients with p i , i  = 1 , 2 , , n , where n is the number of users and i = 1 n p i = 1 . The overall transmitter is schematically depicted in Figure 1. The input bit stream is first converted from serial to parallel (S/P) by converters that receive input bit streams from each multiplex channel and output bit vectors. The bits are then mapped to symbols via look-up tables (LUTs), and superposition coding with power coefficients p n is applied. The resulting symbols are then input to pulse-shaping filters, mixers, and output adder. The local oscillator circuit generates a cosine waveform whose output is split into two branches, one of which includes a 90-degree phase shifter that produces the imaginary part of the complex exponential. The following subsections show how to implement these steps symbolically.

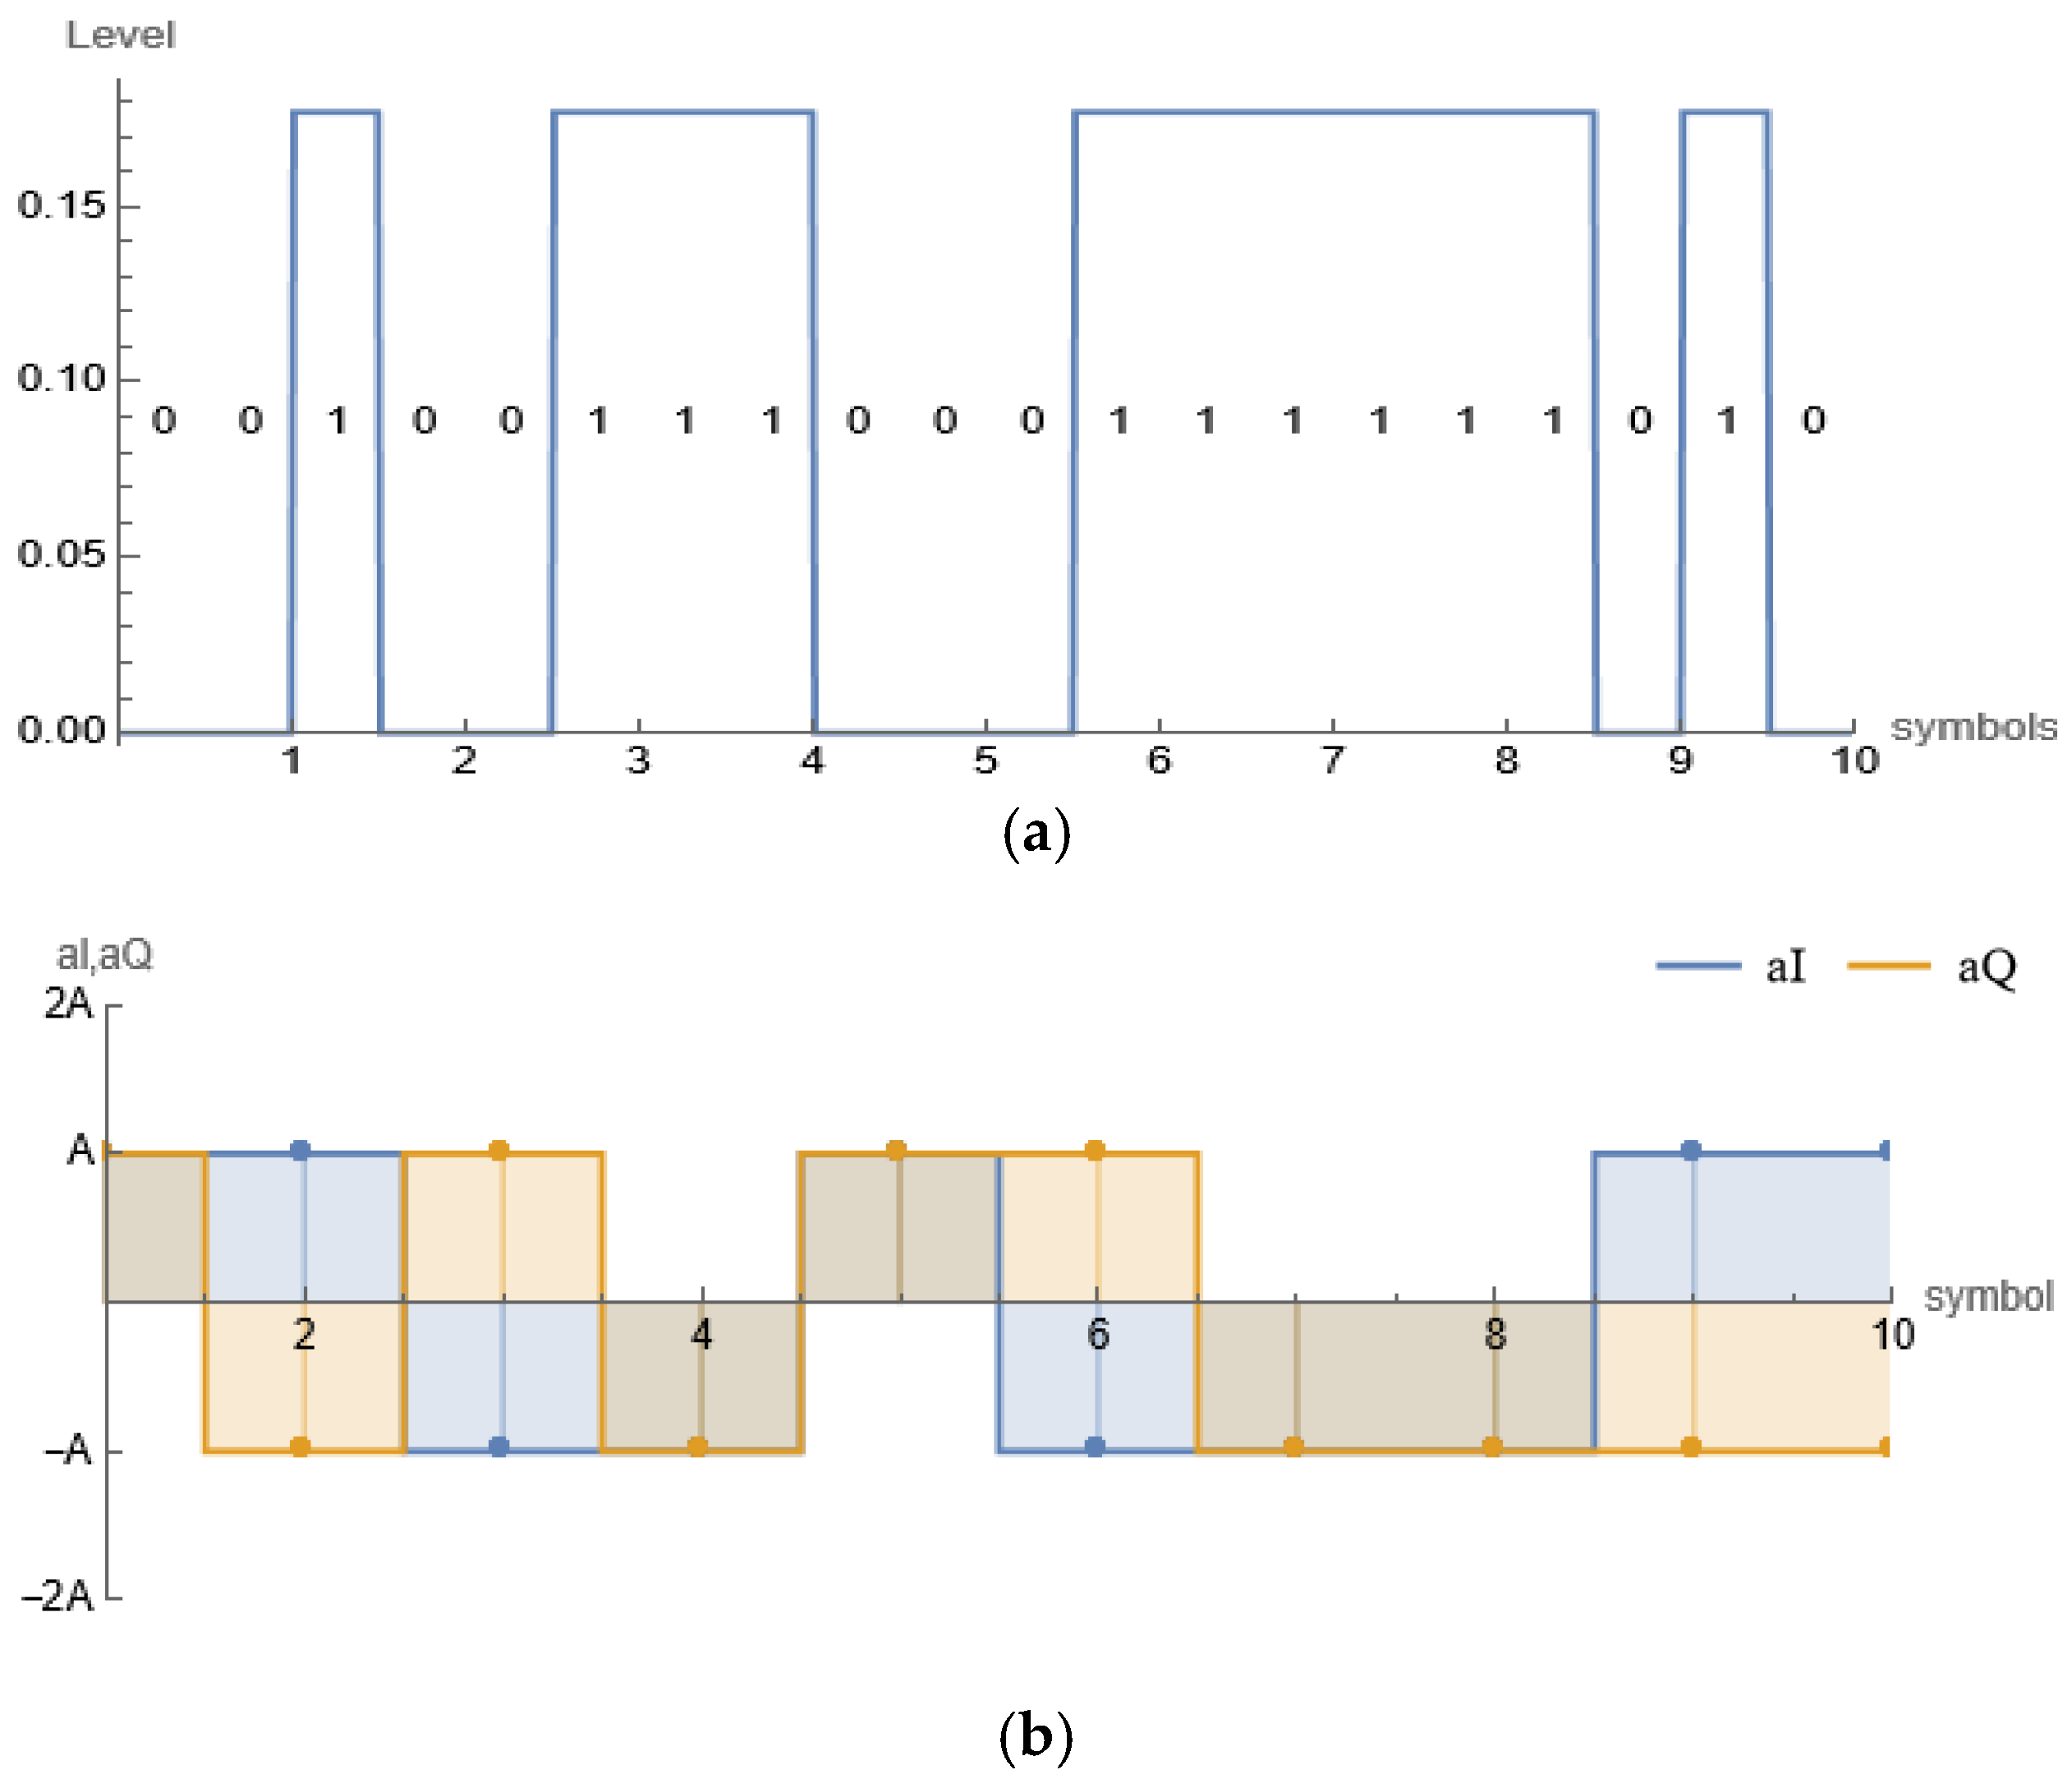
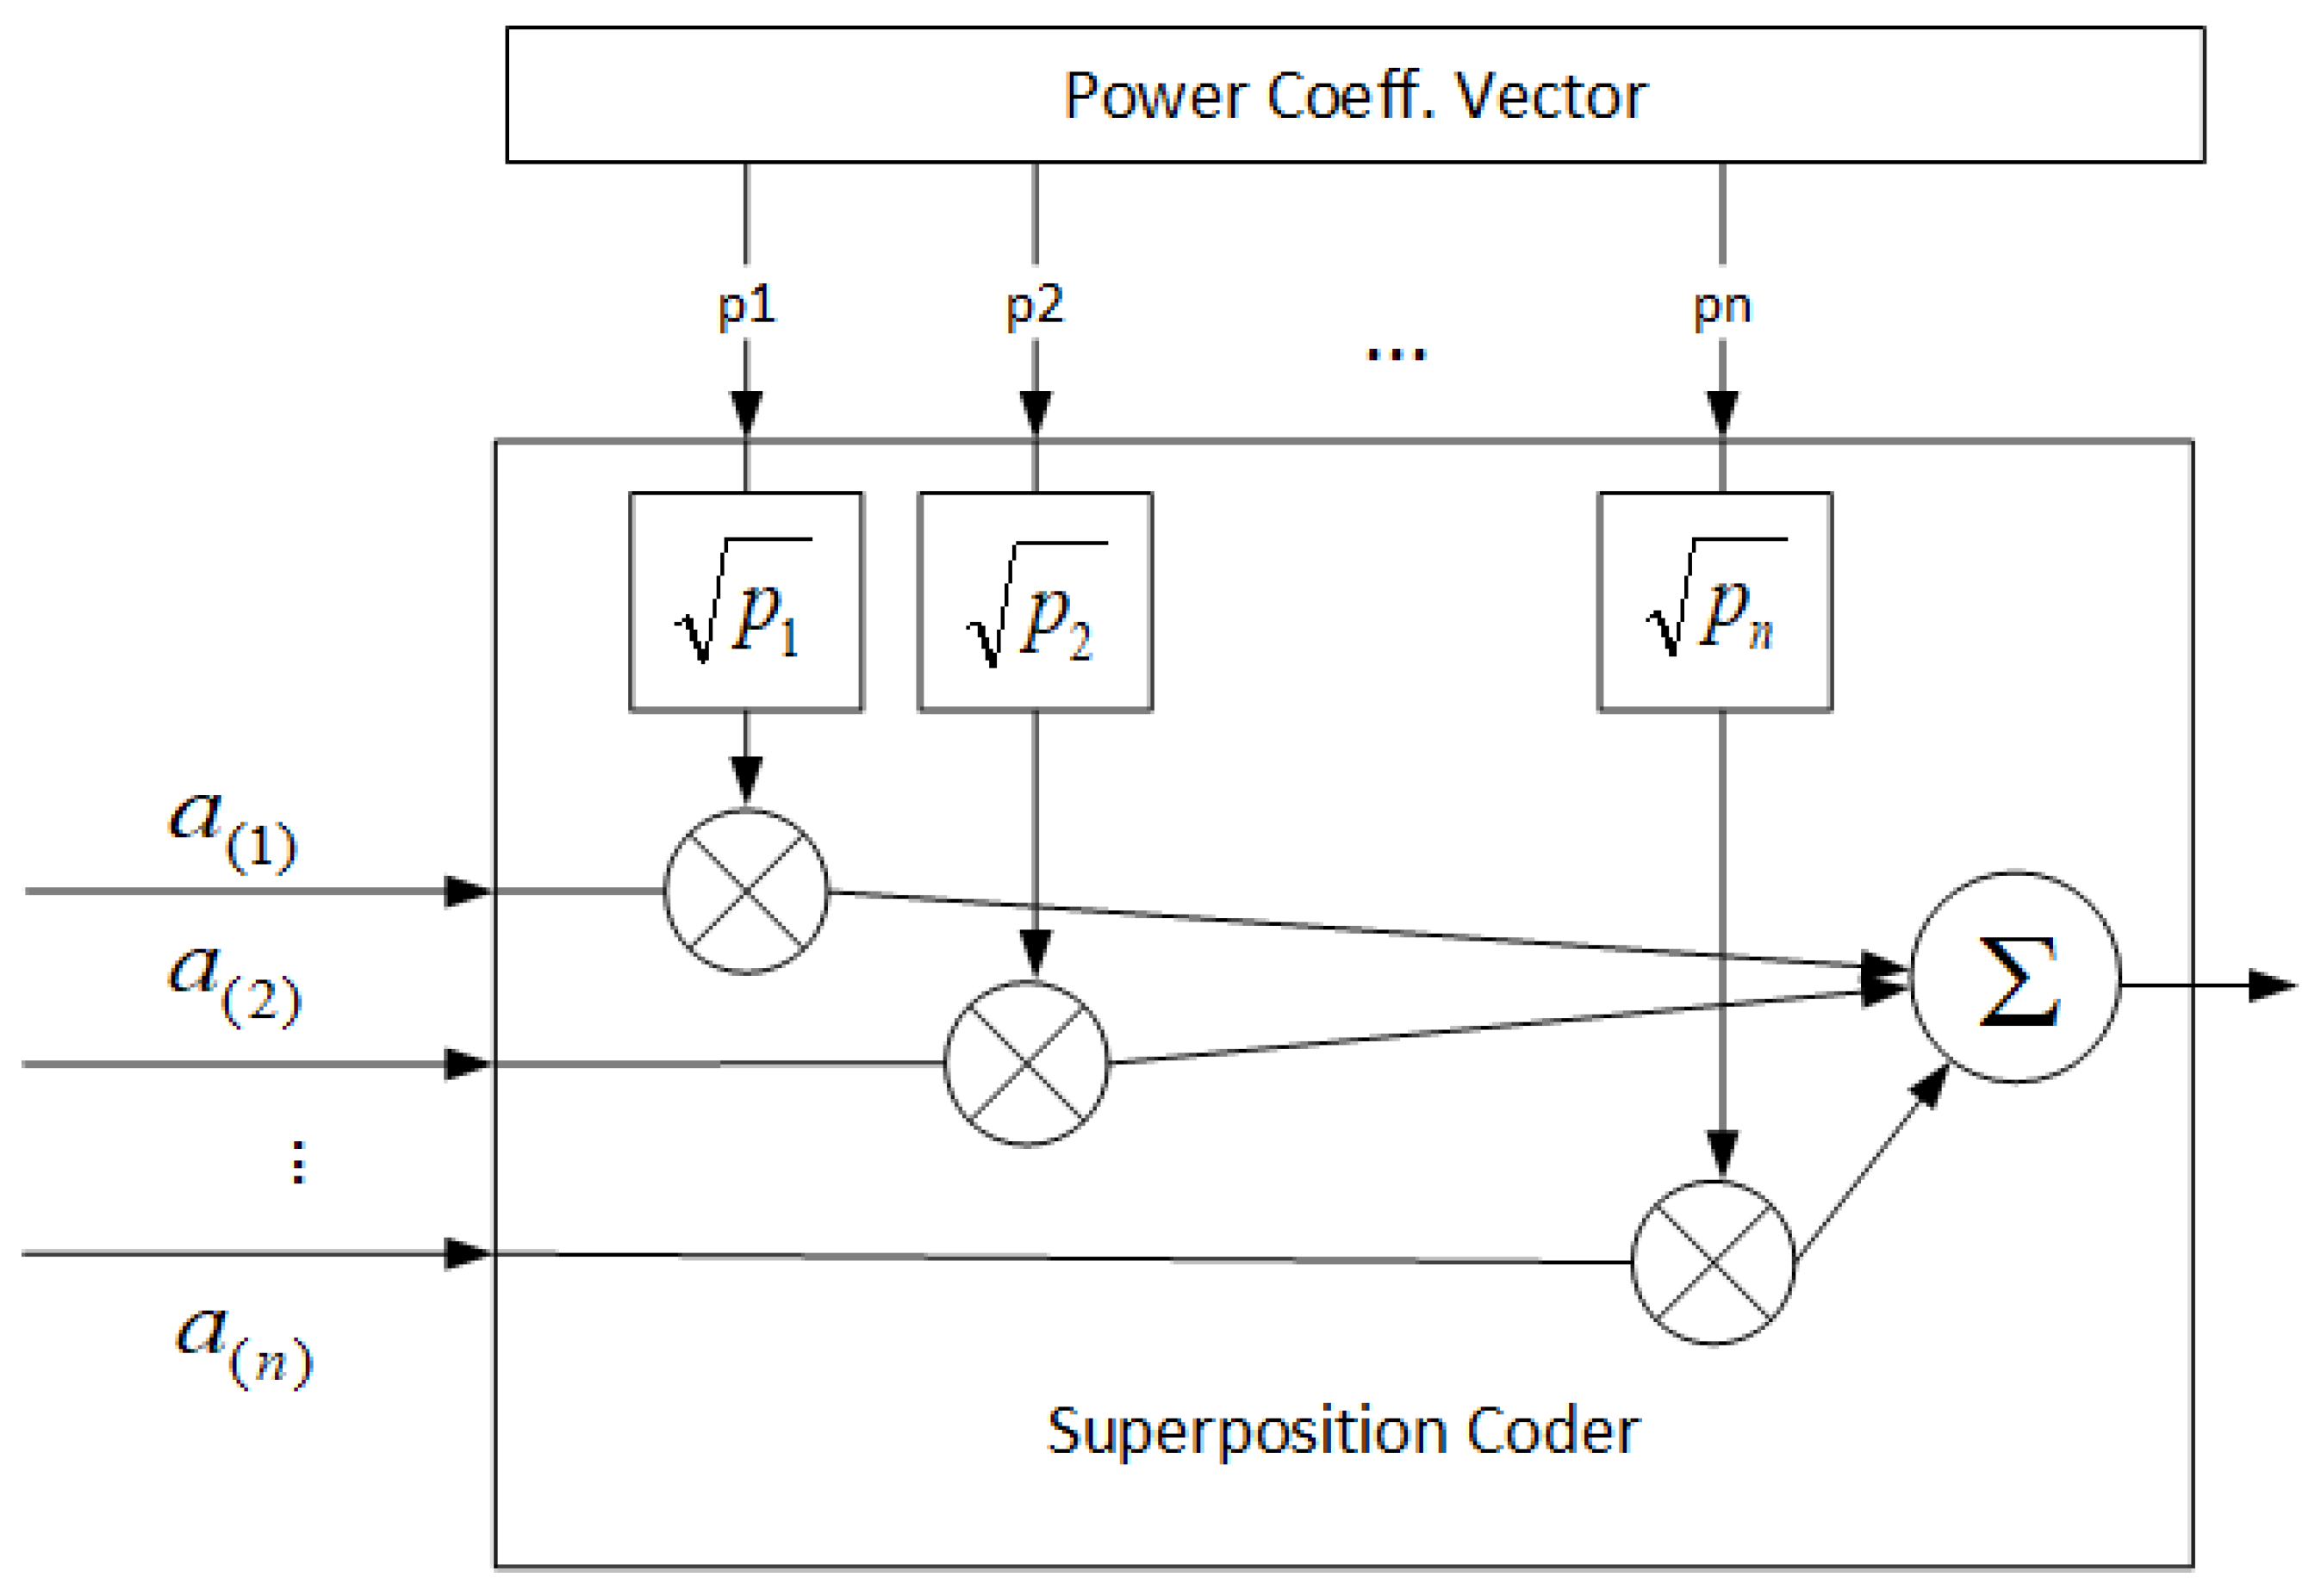
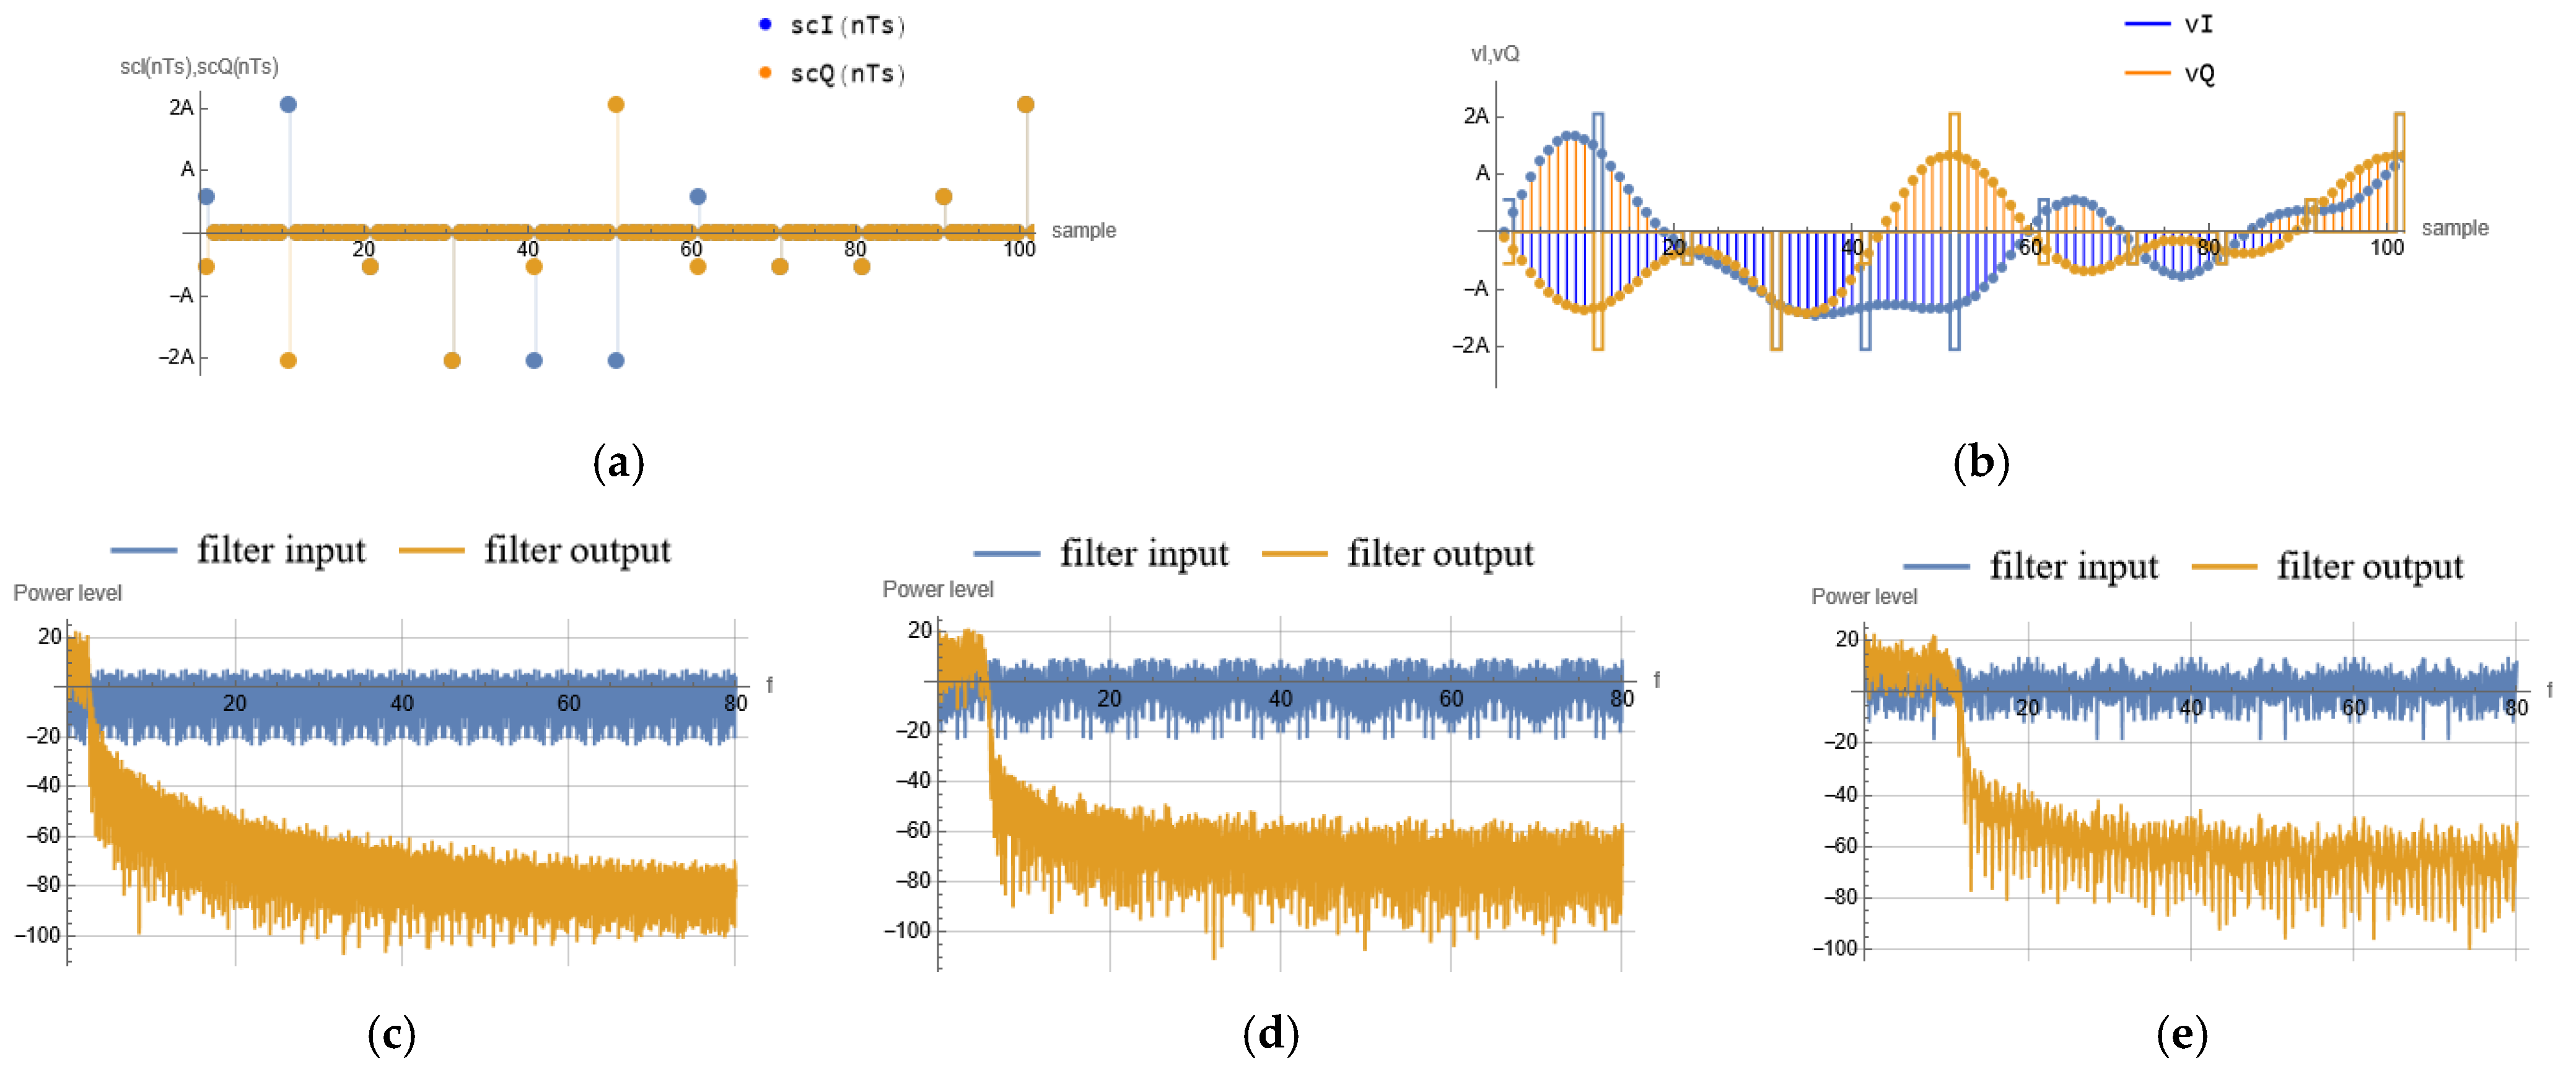
2.1. Quadrature Complex Signal Generation

First, we define a list of ones and zeros that represents the initial (input) bit stream, processed either on a bit-by-bit basis or on a vector basis, buffer, etc. Wolfram has many options for creating lists, and we choose the function Table[]:
inputbitStream = Table[RandomInteger [1],{n,0,numSymb-1}]
Here, numSymb is the number of bits in a list. These bits can be generated either as a random bit train or as a predefined training sequence. For every channel, every T b seconds, a new bit is introduced at the input of the S/P block, which groups l o g 2 M bits every T m = T b l o g 2 M seconds. These groups of bits are used as addresses for accessing content in LUTs at both quadrature branches. In this realization, the quadrature branches are separated after superposition coding, which simplifies further processing. The LUTs contain symbol values according to selected modulation scheme. In the following illustration, we used 4-QAM, which for a single user channel can be expressed with the following Wolfram’s syntax:
M = 4
spKonv = Partition[inputbitStream,Log2[M]] (*S/P converter*)
lut4I = AssociationThread[{{0,0},{0,1},{1,0},{1,1}}→{1,−1,1,−1}]; (*LUTs definition*)
lut4Q = AssociationThread[{{0,0},{0,1},{1,0},{1,1}}→{−1,−1,1,1}]; (*LUTs definition*)
a4I = Lookup[lut4I,spKonv]; (*Process of mapping bits to symbols*)
a4Q = Lookup[lut4Q,spKonv];
One can recognize the symbolic intuitiveness that such coding carries and the ease of following the schematic transmitter’s operations. Here, the so-called antipodal mapping is applied at each branch, where l o g 2 M -tuples of bits are replaced with symbols (1 and −1 in the case of 4-QAM). Wolfram offers functions that are useful for visualizing the blocks’ outcomes, as demonstrated in Figure 2, which clearly shows how, for M = 4 , each pair of bits maps to the corresponding parts of the complex symbol a I + j a Q (case (b)) via the following statement:
ListStepPlot[{a4I1,a4Q1},Center, Mesh->Full,PlotRange->{{1,10},{−2,2}},
ImageSize ->{500,200},Filling->Axis,AspectRatio->1/3,AxesLabel->{“symbol”, “aI,aQ”}, Ticks->{Automatic,{{−2,”−2A”},{−1,”-A”},{1,”A”},{2,”2A”}}},
PlotLegends->Placed[{“aI”,”aQ”},Below]]
Other mapping rules could be used, but the same mapping must be applied both at the transmitter and at the receiver. Here, every two bits are mapped in parallel to one symbol, so the symbol period (new elementary information time) is longer, T s y m b = 2 T b . Note that the two generated lists a I , a Q are shorter than input bit list with a new symbol rate of R s y m b = 1 / T s y m b = 1 / 2   T b = R b / 2 .
After generating the complex-quadrature symbols, the superposition coding processing block is applied. At the output of this block there is an adder that sums the weighted mapped symbols with weights corresponding to the square-root of the power coefficient, according to Equation (1); see Figure 3:
s c [ n ] = p 1 a 1 + p 2 a 2 + + p n a ( n )
We note that computation of the power coefficients (represented here as a vector) depends on channel conditions, and will not be addressed in this work. It is important to note here that while input signals to the superposition coder have regular constellations based on the selected MCS, the output signal constellation of this block may be irregular, as will be shown later. Next, the information waveform is generated. As the upsampling factor is L , then L 1 zeros are inserted between subsequent output of the superposition coder:
scInTs = Upsample[scI,L];
scQnTs = Upsample[scQ,L];
Each symbol at the output of the upsampler at each branch consists of a non-zero sample followed by L 1 zero samples, as depicted in Figure 4. This results in two sample rates in the circuit: f b = R b and f s . There are many aspects for SDR signal processing analysis, and here we consider only the part of interest.

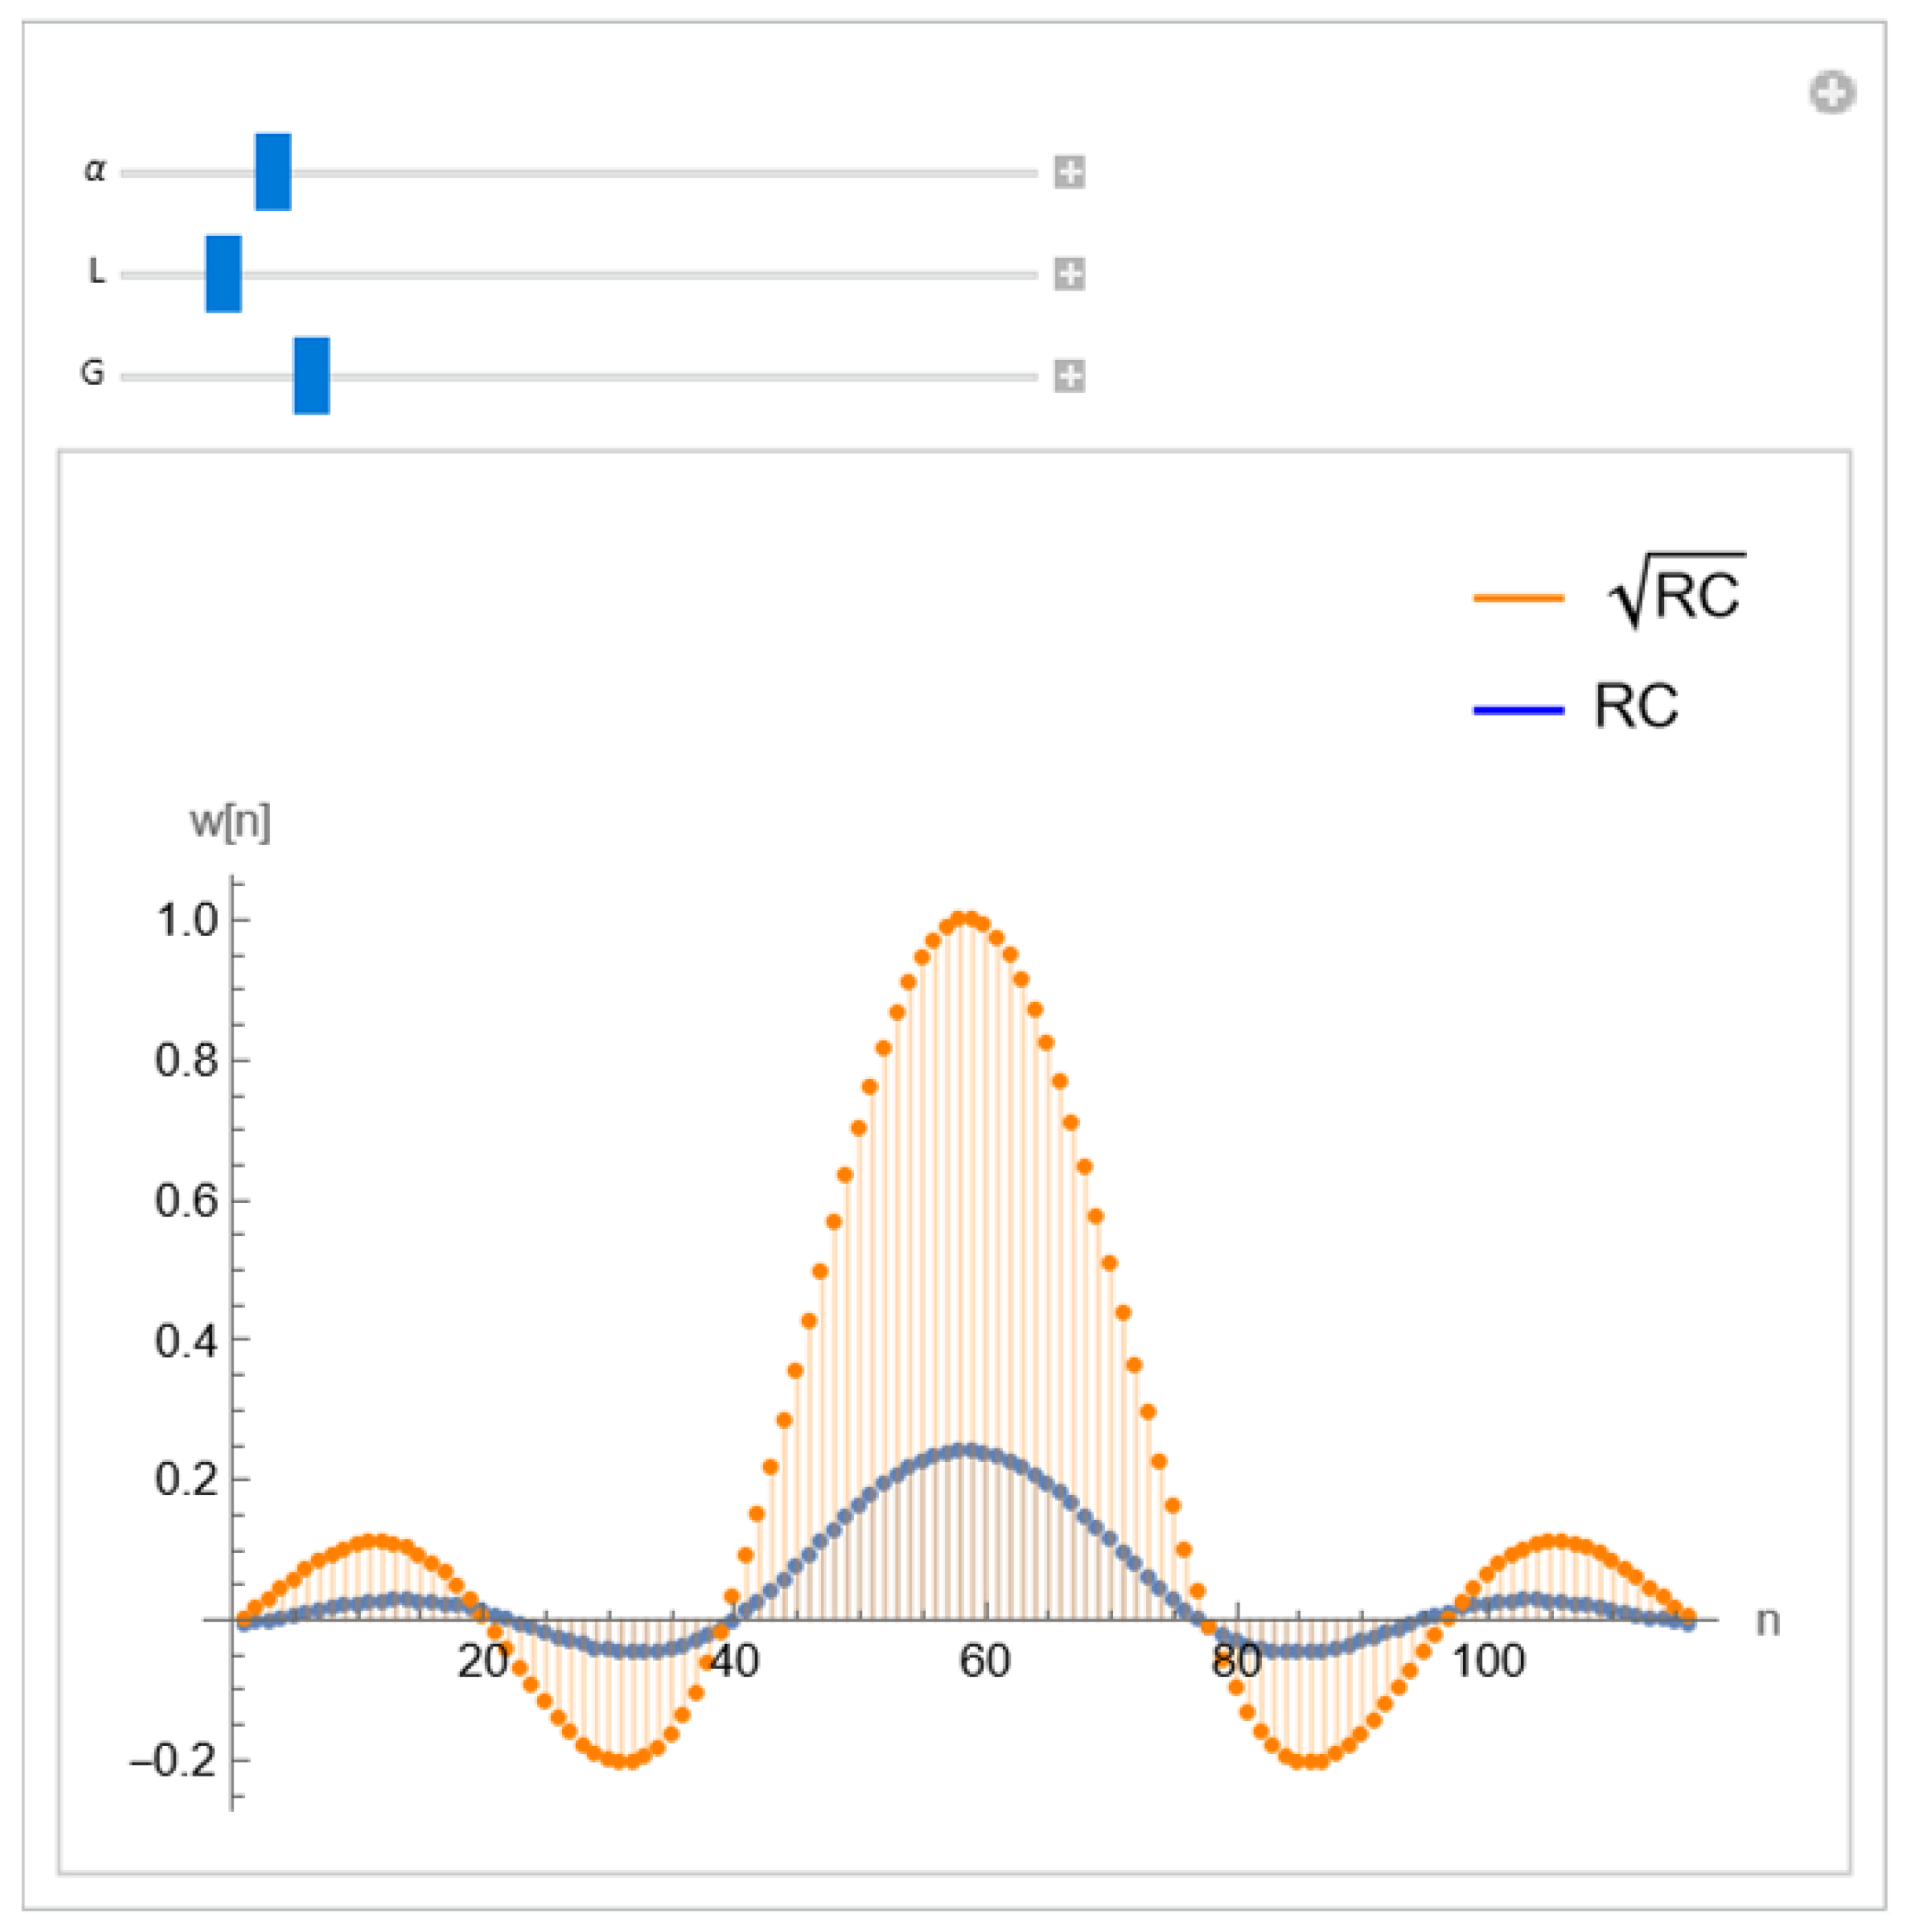
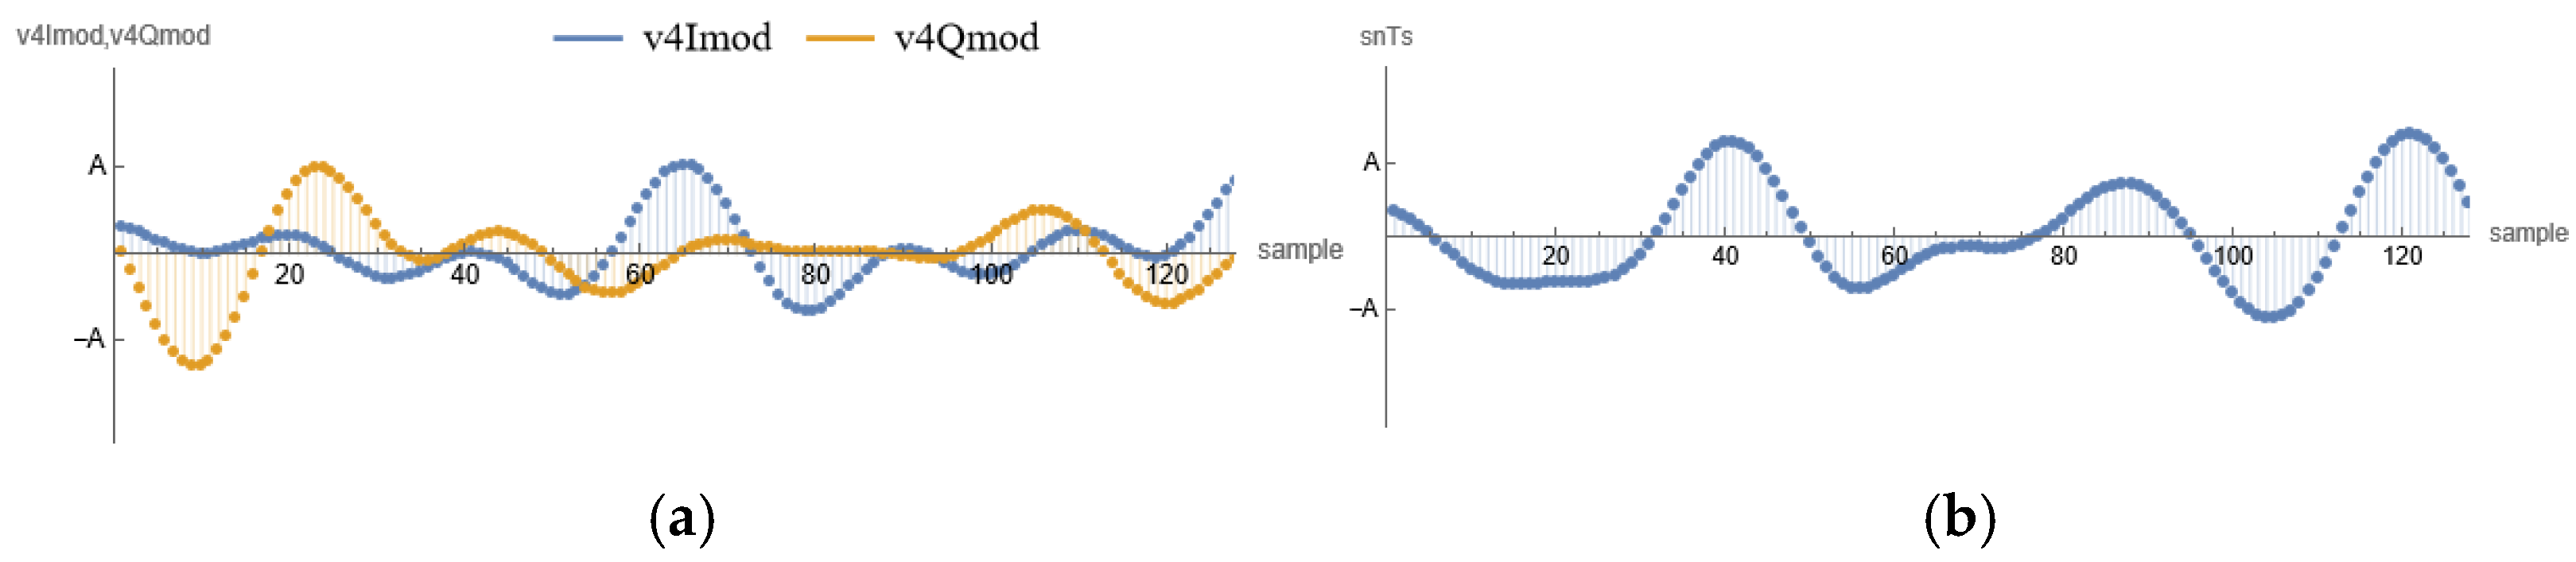
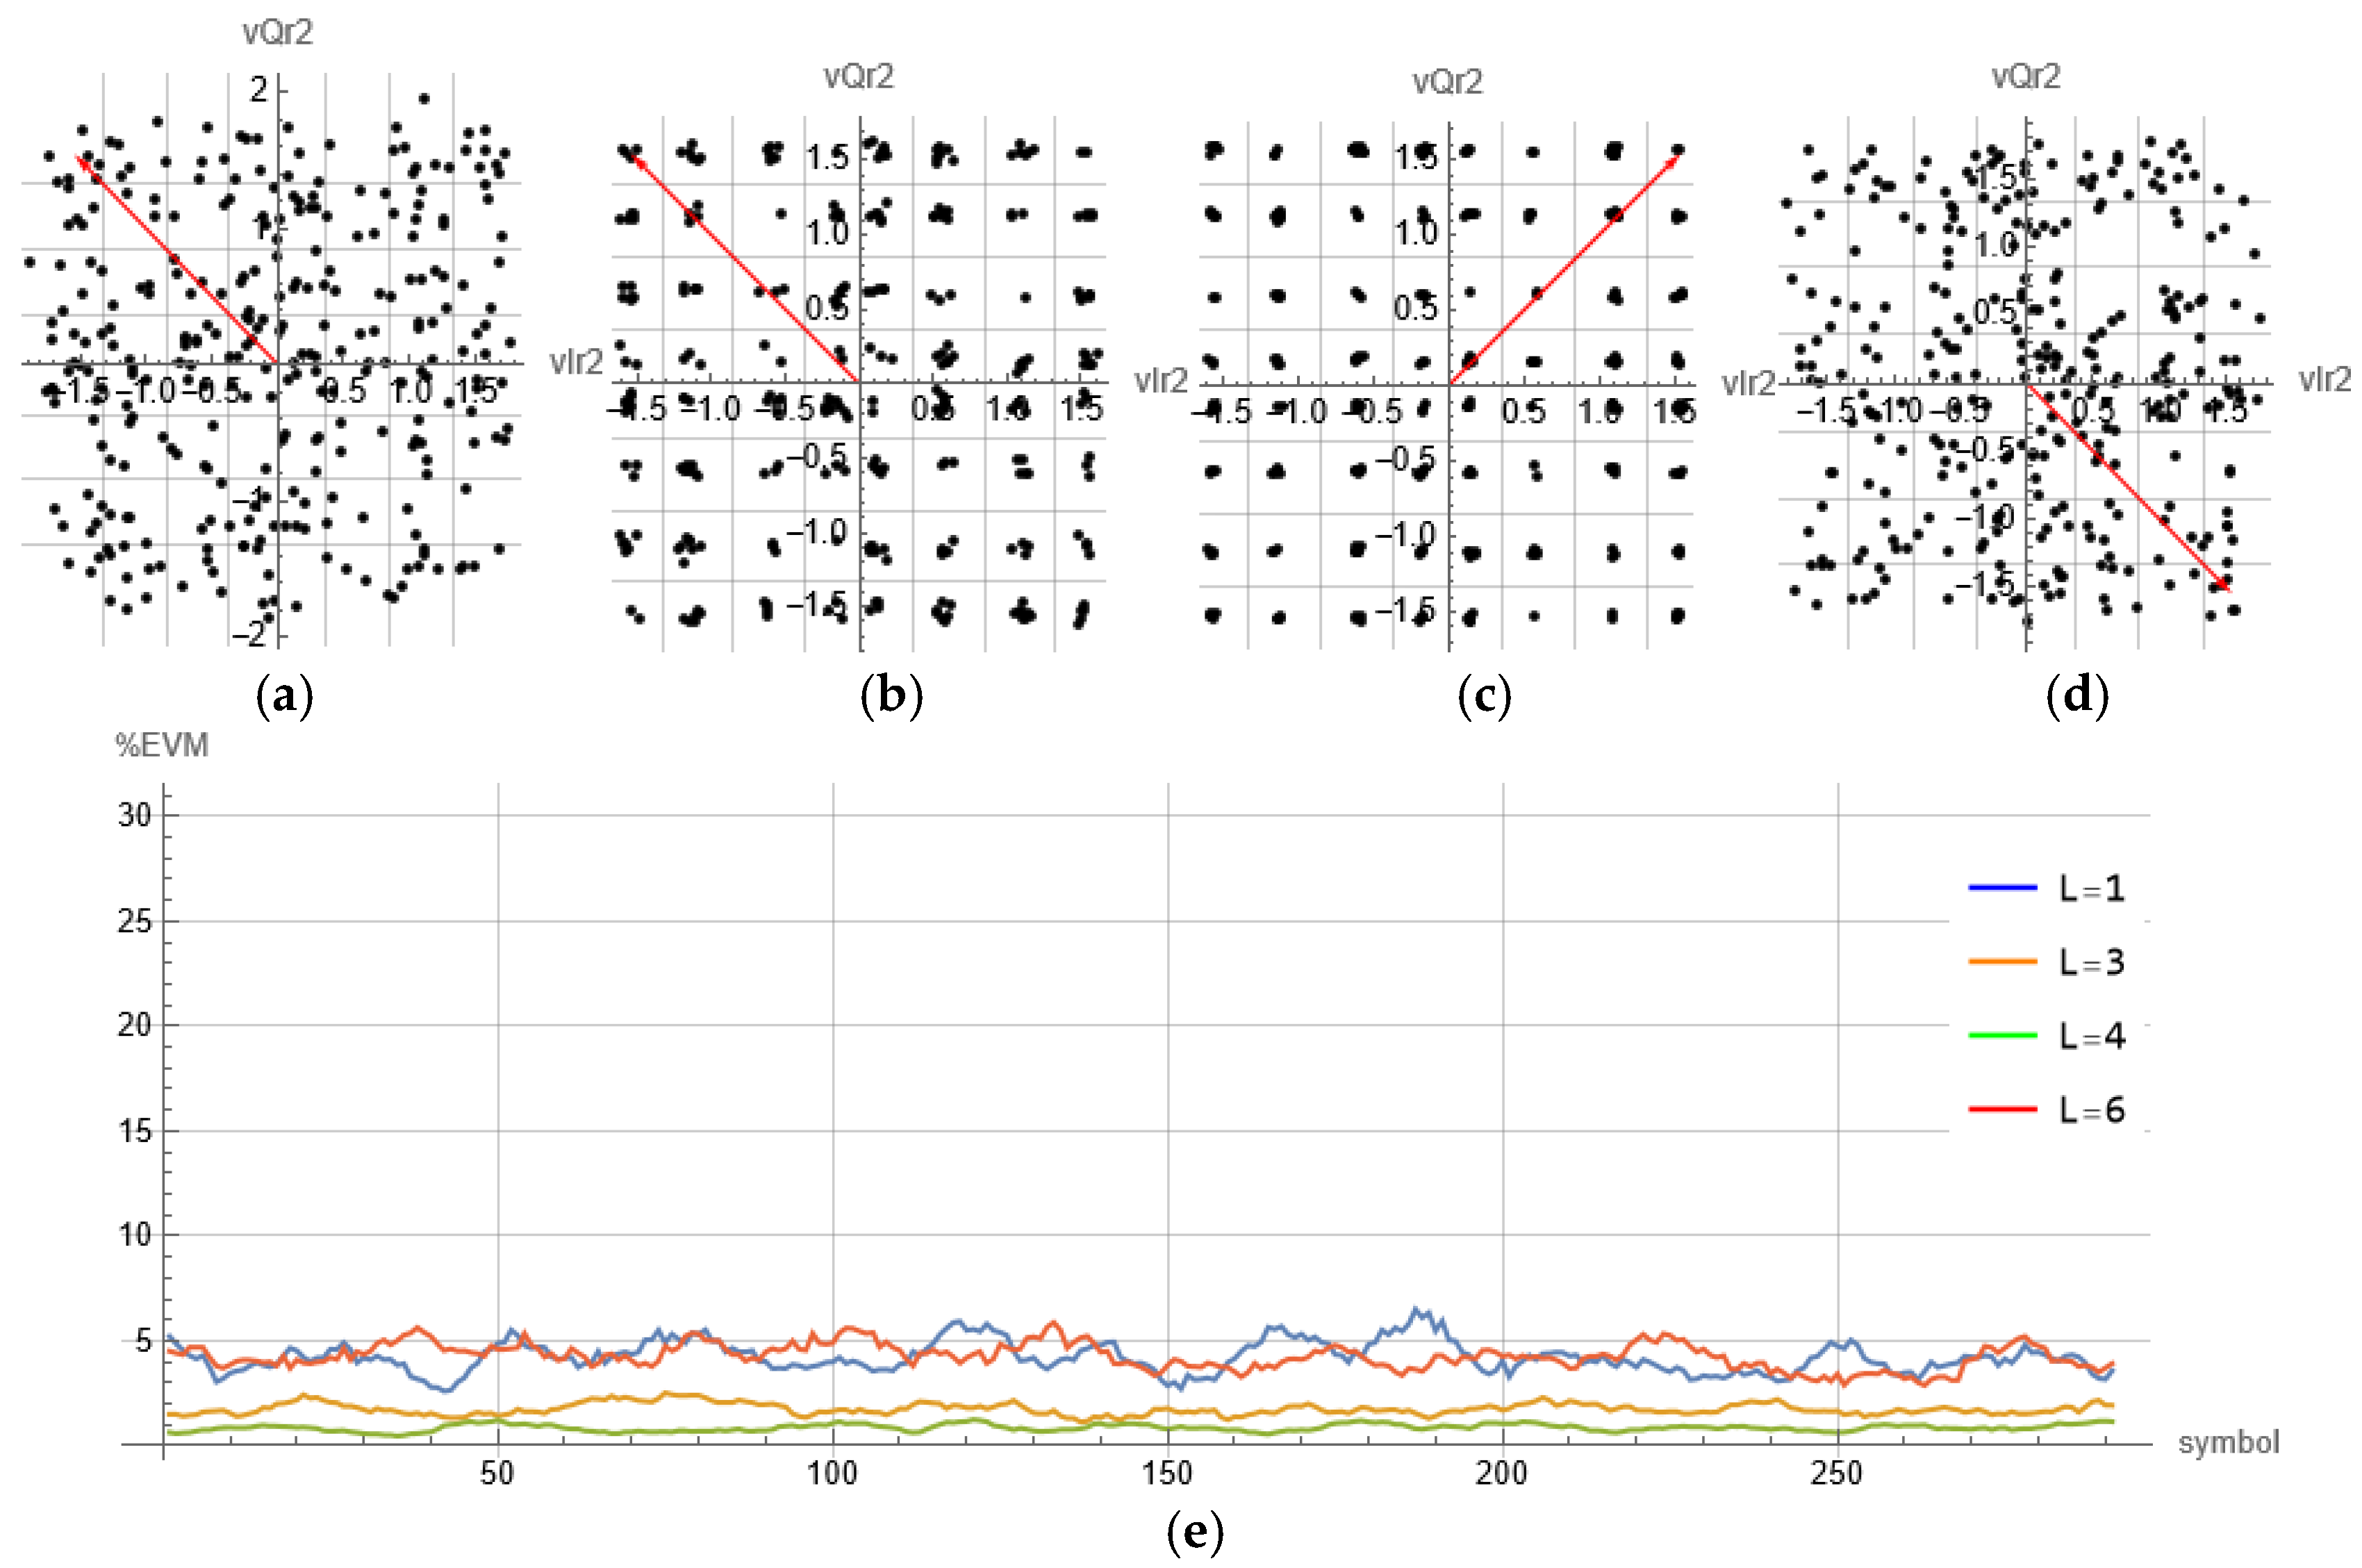
2.2. Sample-Wise Pulse Shaping

The symbol sequence at the output of the upsampler has a very high bandwidth, giving rise to spurious degradations and interference. A well-known technique to limit the spectrum includes a pulse-shaping filter based on convolving the sequence with a given window function and incoming quazi-Dirac impulses. Practical SDR implementation of convolution operation requires some considerations. Examine the analytical expression for r [ n ] , corresponding to the discrete convolution of two sequences, an input symbol sequence s [ n ] and the impulse response of the filter, denoted w[n] (window function):
r [ n ] = m = s [ m ] w [ n m ]
The impulse response of a filter or windowing function must be in sampled form, where in this transmitter it is implemented via two square-root raised cosine filters, one at the Tx size and one at the Rx side:
w [ n ] = 1 L sin π ( 1 α ) n L + 4 α n L cos π ( 1 + α ) n L π n L 1 4 α n L 2
where the expression in Equation (3) can be found in broad literature and is defined for each point except for n = 0 ,   ± L 4 α ,
w [ 0 ] = 1 L ( 1 α + 4 α π )
w ± L 4 α = α 2 L 1 + 2 π sin π 4 α + 1 + 2 π cos π 4 α
For simplicity, we replace Equations (4) and (5) in our symbolic framework, by setting a slight sample offset ( 0.999 instead of 1 ) defined by step of n :
α = 0.3 ; G = 11 ; w = 1 L T a b l e [ S i n π 1 α n / L + 4 α n L C o s π 1 + α n / L π n L 1 4 α n L 2 , { n , L G , L G , 0.99 } ] s l i d i n g W i n d o w = R o t a t e L e f t [ P a d R i g h t [ w , L e n g t h [ s s u m I T s ] ] , L e n g t h [ w ] 1 2 ]
In order to confirm our choice for window function implementation, in Figure 5 we plot the raised cosine (RC) and square-root RC (SQRC) pulse shapes using Wolfram’s symbolic language:
Manipulate[ Legended[ Show[ ListPlot [ Table [ 1 L Sin [ π ( 1 - α ) n / L ] + 4 α n L Cos [ π ( 1 + α ) n / L ] π n L ( 1 - ( 4 α n L ) 2 ) , { n , - LG , LG , 0.99 } ] , Filling - > Axis ] , ListPlot [ Table [ Sin [ π k / L ] π k / L Cos [ π α k / L ] 1 - ( 2 α k / L ) 2 , { k , - LG , LG , 0.99 } ] , PlotStyle Orange , Filling - > Axis ] , PlotRange Full , AxesLabel { n , p [ n ] } ] , Placed [ LineLegend [ { Orange , Blue } , { RC , RC } ] , { Top , Right } ] ] , { α , 0.01 , 1 } , { L , 10 , 100 , 1 } , { G , 1 , 11 , 1 } , ControlPlacement - > Top ]
Implementation of the convolution in Equation (2) requires multiplications and summations. For element-wise multiplication, sequence lengths must be equal, so the sampled impulse response (sampled window function) is flipped (but because of symmetry, flipping has no impact), extended to the sum of lengths of both sequences and cyclically rotated:
s l i d i n g W i n d o w = R o t a t e L e f t [ P a d R i g h t [ w , L e n g t h [ s c I n T s ] ] , L e n g t h [ w ] 1 2 ] ;
Observe that when processing complex signals, the convolution operation must be carried out for both real and imaginary parts. Now both lists (upsampled bit sequence and impulse response) are ready for multiplication and summation that are applied to both I and Q signal components, symbolically expressed as
v 4 I = n = 1 L e n g t h [ s c I n T s ] s c I n T s [ [ n ] ] R o t a t e R i g h t [ s l i d i n g W i n d o w , n ] ;
v 4 Q = n = 1 L e n g t h [ s c Q n T s ] s c Q n T s [ [ n ] ] R o t a t e R i g h t [ s l i d i n g W i n d o w , n ]
Output symbols are now shaped according to the applied window; an important parameter here is α , which trades off between impulse bandwidth and flatness in the time domain (which impacts sampling synchronization), see Figure 6. To demonstrate that this “edge rounding” preserves energy leakage and consumption, we observe the signal spectrum in for different values of α and L , in Figure 6c–e:
Periodogram [ { scInTs , v 4 I } , SampleRate Fs , GridLines Automatic , AspectRatio - > 1 / 2 , AxesLabel - > { f , Power   level } ]

2.3. Mixing

The next step in generating the complex QAM signal is creating output waveforms by mixing signal with the sinusoidal carrier, represented as a complex exponential. One approach for implementation follows from Euler’s representation, i.e., taking the product of the amplitudes and sum of the phases of the complex samples. Alternatively, as the SDR operates on time samples and as the transmitted signal is real, then the real part of the complex product signal representation can also be explicitly obtained as:
R v ~ Q A M ( t ) e i 2 π f C t = I Q A M ( t ) v I n T s I l o 2 π f C t c o s Q Q A M ( t ) v Q n T s Q l o 2 π f C t s i n
Clearly, the real part of the complex product between the signal and the sinusoids carries all the modulated information. We note that transmission of the modulated information can be equivalently implemented via the imaginary part of the complex product:
I v ~ Q A M ( t ) e i 2 π f C t = Q Q A M ( t ) v Q n T s I l o 2 π f C   t c o s I Q A M ( t ) v I n T s Q l o 2 π f C t s i n
For this step we use a symbolic function for generating the analog single-tone local oscillator (LO) signal, cos ( 2 π f C t ) , where f C is the carrier frequency that satisfying f C = f s 2 . LO frequency stability is one of the most critical SDR hardware implementation details. Common SDR simulations for LOs usually engage discrete sinusoid form of this function, i.e., c o s [ 2 π k i ] , where k = f C f s is, the so-called, frequency of discrete sinusoid:
k = F c F s ; l o = 2 × T a b l e [ C o s [ 2 π k i ] , { i , 0 , L e n g t h [ s c I n T s ] 1 } ] ;
Following Equation (7), to create the negative sinusoid for the Q-branch, we rotate the sampled cosinusoid function by π/2 radians, which is equivalent to k/4 samples. When multiplying lists, errors often come from unequal list lengths or alignment, so when transforming to the discrete, digital world, this issue must be carefully accounted for. According to Equation (6), the final addition yields a digital QAM waveform ready for transmission through the channel, as radiated emissions are represented by real signals. This is demonstrated in Figure 7. There are generally two options; one is given by Equation (6), depicted in Figure 1, where
v 4 I m o d = v 4 I × l o ; v 4 Q m o d = v 4 Q × l o 90 d e g ; s n T s = v 4 I m o d + v 4 Q m o d ;
and the second is given by Equation (7), resulting from the imaginary part of the complex product (signal and LO), that is
v 4 I Q m o d j = v 4 Q × l o ; v 4 Q I m o d j = v 4 I × l o 90 d e g ; s n T s j = v 4 I Q m o d j + v 4 Q I m o d j ;
Both snTs and snTsj are real physical signals (snTsj comes with imaginary number j) and carry all the information that is needed to reconstruct the symbols at the receiver. It is very convenient from the aspect of symbol and sample alignment to view the signal as shown in Figure 6b.
Comprehensive functions are available for visualizing digital, analog, and complex signals—ListStepPlot for bit and impulse train signals, ListPlot for sample-wise signals, and ComplexListPlot for displaying constellation diagrams of complex symbols, all followed by appropriate option settings as it was done for Figure 6a:
L i s t P l o t [ { s c I n T s , s c Q n T s } , P l o t R a n g e { { 1 , 100 } , A l l } , P l o t S t y l e P o i n t S i z e [ 0.01 ] , F i l l i n g A x i s , I m a g e S i z e { 500 , 200 } , A s p e c t R a t i o 1 / 3 , A x e s L a b e l > s c I ( n T s ) , s c Q ( n T s ) ]
and Figure 6b:
S h o w [ L i s t P l o t [ { v 4 I , v 4 Q } , F i l l i n g A x i s , P l o t S t y l e P o i n t S i z e [ 0.01 ] ] , L i s t P l o t [ { v 4 I , v 4 Q } , J o i n e d T r u e ] , L i s t S t e p P l o t 1 2 s c I n T s , s c Q n T s , C e n t e r , M e s h F u l l , P l o t R a n g e { { 0 , 5 × L } , A l l } , I m a g e S i z e 500 , 200 , A s p e c t R a t i o 1 / 3 , A x e s L a b e l { v 4 I , v 4 Q }
To track system and link behavior, we define two test points at the transmitter, TP1 and TP2, as shown in Figure 1.
At this point, the digital processing of the NOMA signal is completed. It then passes through a digital-to-analog (D/A) converter for generating an analog signal, which is passed to the processing chain (RF front-end) and eventually emitted over the air. The essential functions at the receiver are retrieving and decoding the transmitted signals, which for the downlink transmissions also requires implementation of successive interference cancellation (SIC), as depicted in Figure 8.
The processing tasks at the receiver are applied after quadrature separation, filtering, and downsampling. The strongest signal is decoded first, via a classical decision block. This decoded signal is weighted and subtracted from the originally received signal following the SIC methodology to facilitate decoding of the strongest signal among the remaining signals. The remaining superimposed signals are recovered via similar recursive steps.
Modulation impairments that can be incorporated with this proof-of-a-concept framework include phase noise/errors, amplifier compression, noise, in-band spurious, IQ gain imbalance, and IQ quadrature error.

3. Simulation Results

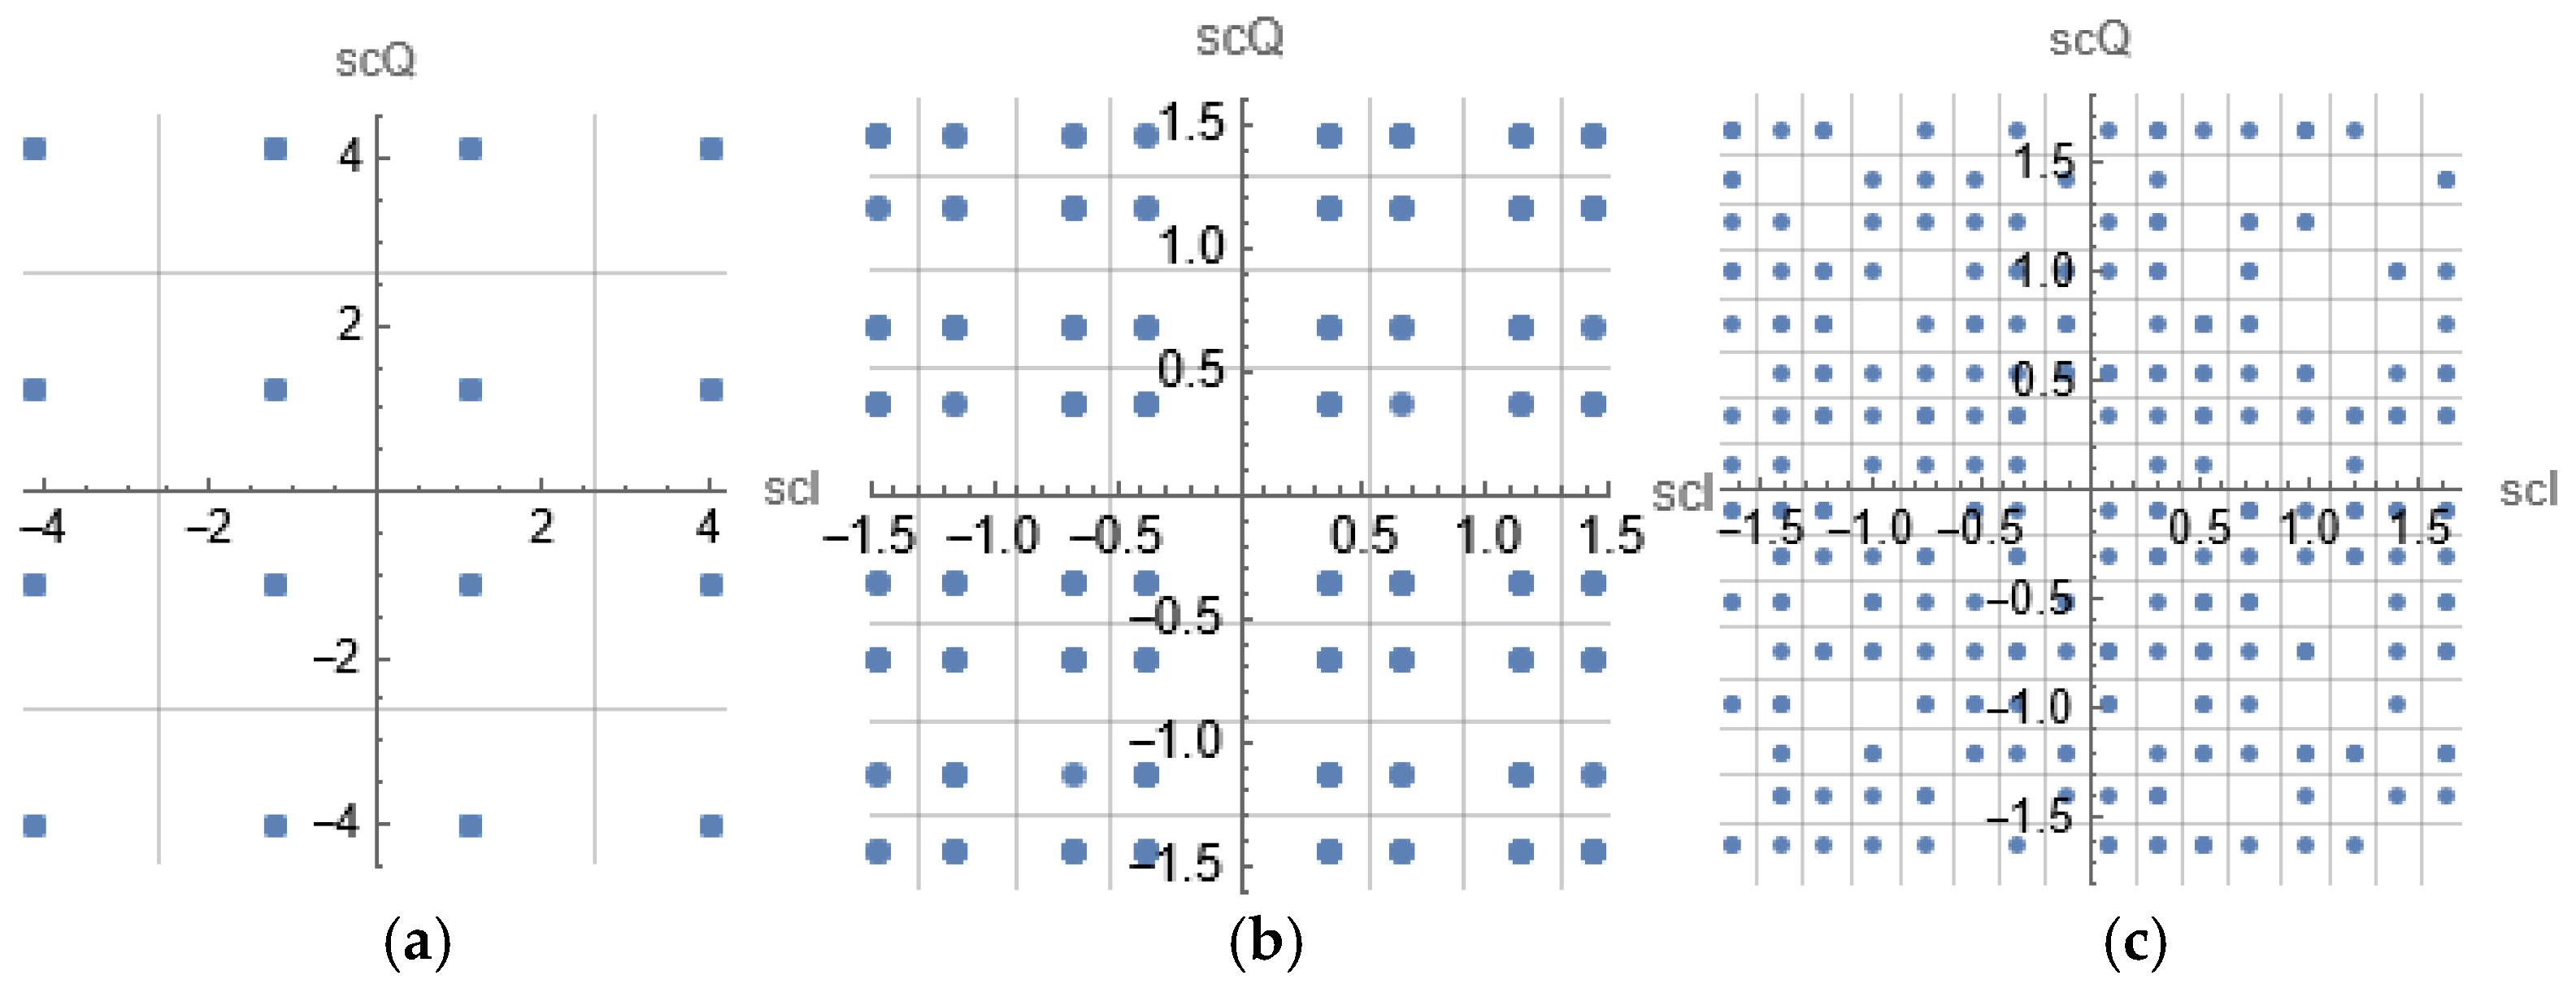
3.1. Transmitting Constellation Constitution

To evaluate performance of our NOMA downlink setup, we considered several different cases: two-, three-, and four 4-QAM/QPSK users, which form 16, 64, and 256-symbol irregular quadrature constellations, respectively, as depicted in Figure 9, showing the constellations measured at test point TP1 along with the decision regions. Observe the asymmetry in the different noise margins around each constellation point, depending on associated power coefficient. Figure 10 presents the measurements at the second test point, TP2. We observe the effect of pulse shaping after upsampling, excluding transitions (by taking every L -th sample in the sequence), as well as the impact of the oversampling factor L and the LO leakage effect.

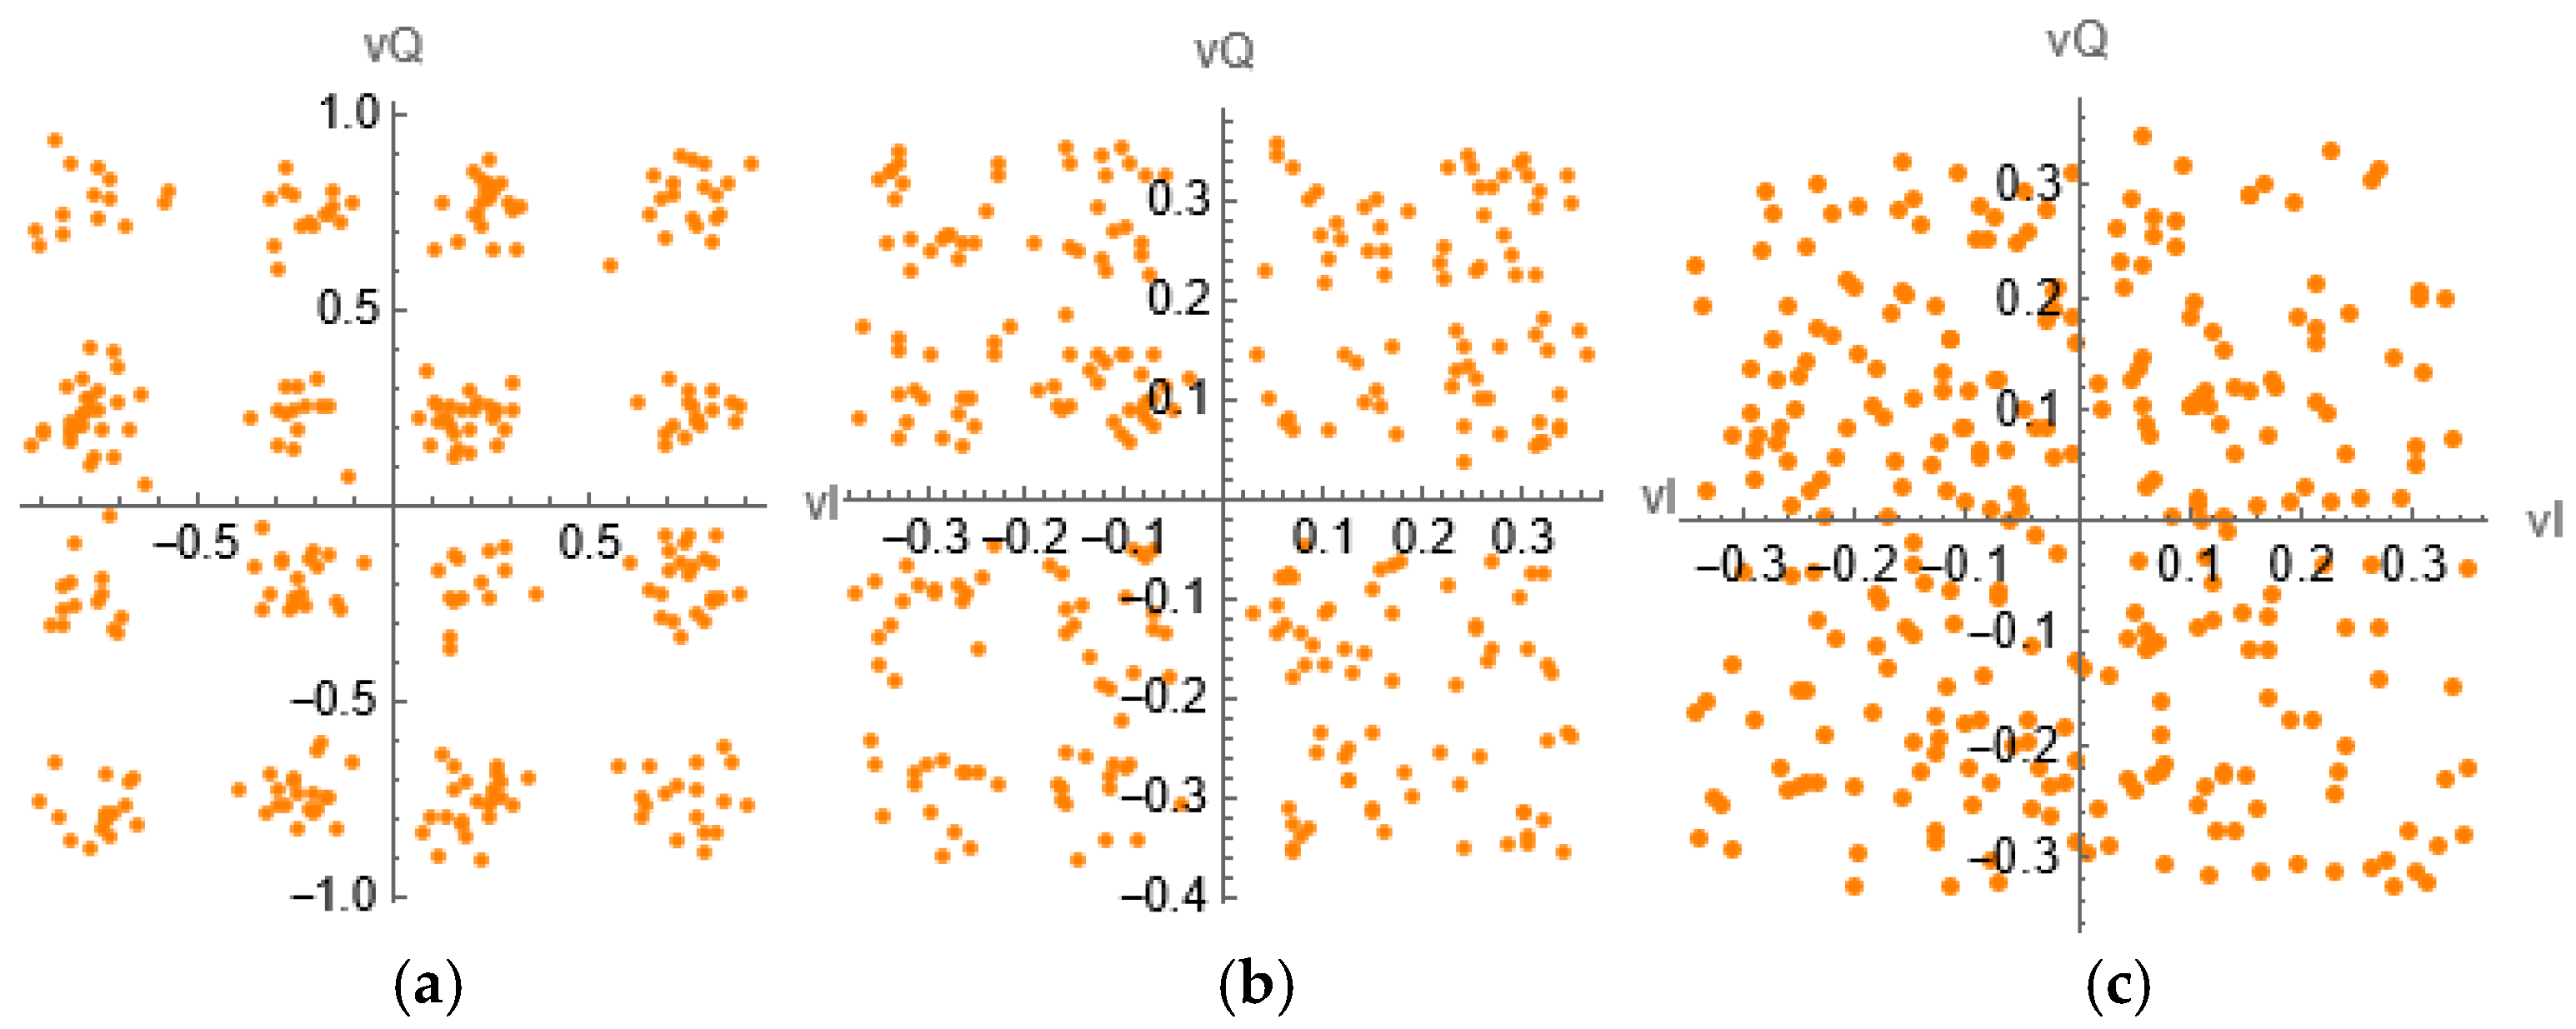
3.2. Receiver Constellation and Error Vector Magnitude

A qualitative prerequisite for achieving SIC is a large minimal distance for the composite constellation. One of the performance metrics for quantifying this feature is error vector magnitude (EVM), which is the magnitude of the difference between the measured symbol (vector) and its true (transmitted) value. In Figure 10, Figure 11, Figure 12, Figure 13 and Figure 14 the symbol for which the EVM was evaluated in indicated by a red arrow. As NOMA contains irregular constellations—resulting from weighting coefficients, the information about the shape of the transmitted constellation is critical for implementing the receiver. Common policy for weight associations is the “weakest signal” in terms that the greatest value is assigned to the user with the worst channel conditions. The goal of the simulation is then to minimize the EVM at the receiver.
When properly synchronized, constellations generated as in Figure 10 are received with minimal EVM, typically less than 2%, and an EVM spectrum below 0 dB; see Figure 11. In practice, the transmitter gathers signal quality indicators (e.g., RSSI, CSI) measured and reported by the receiver and then calculates optimal power weights. The power weights p 1 ,   p 2 , , p n can be manipulated in this model (by means of the Manipulate[] function, for example) and thus facilitate observing dynamic constellation behavior, which is extremely useful for EVM evaluation, and for observing the variation of phase and amplitude of each symbol in the superimposed constellation due to power coefficients variations.

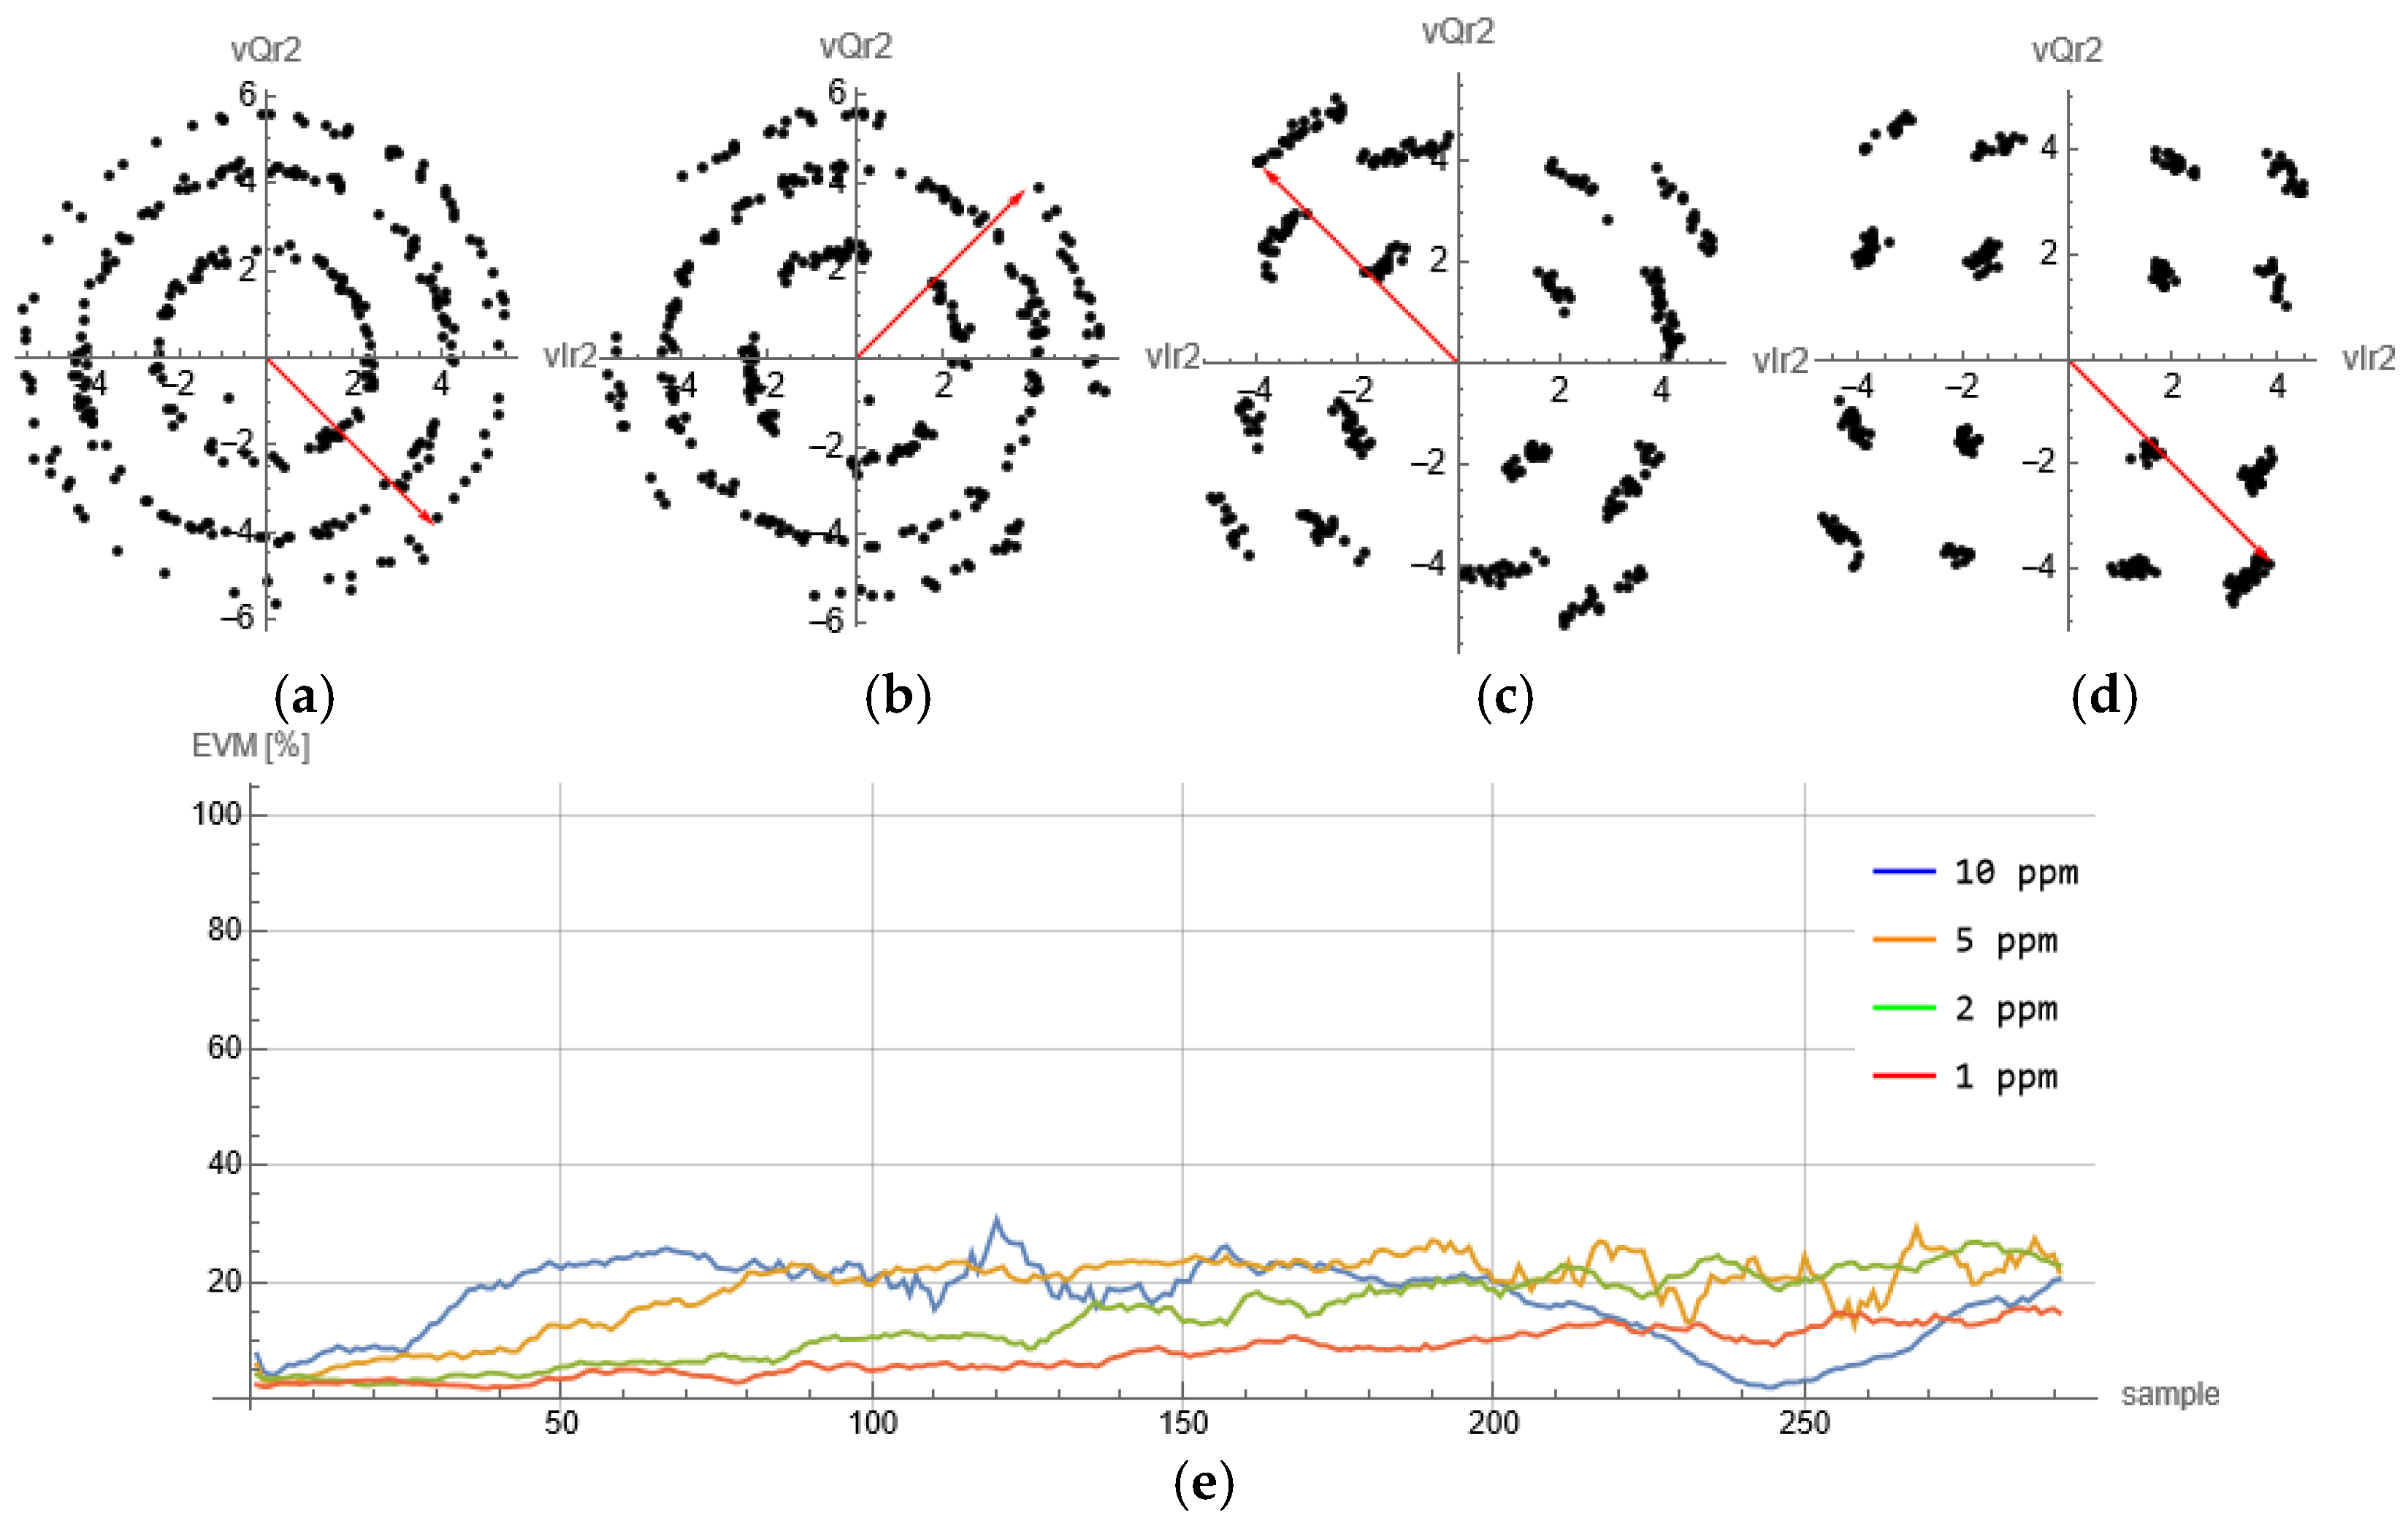
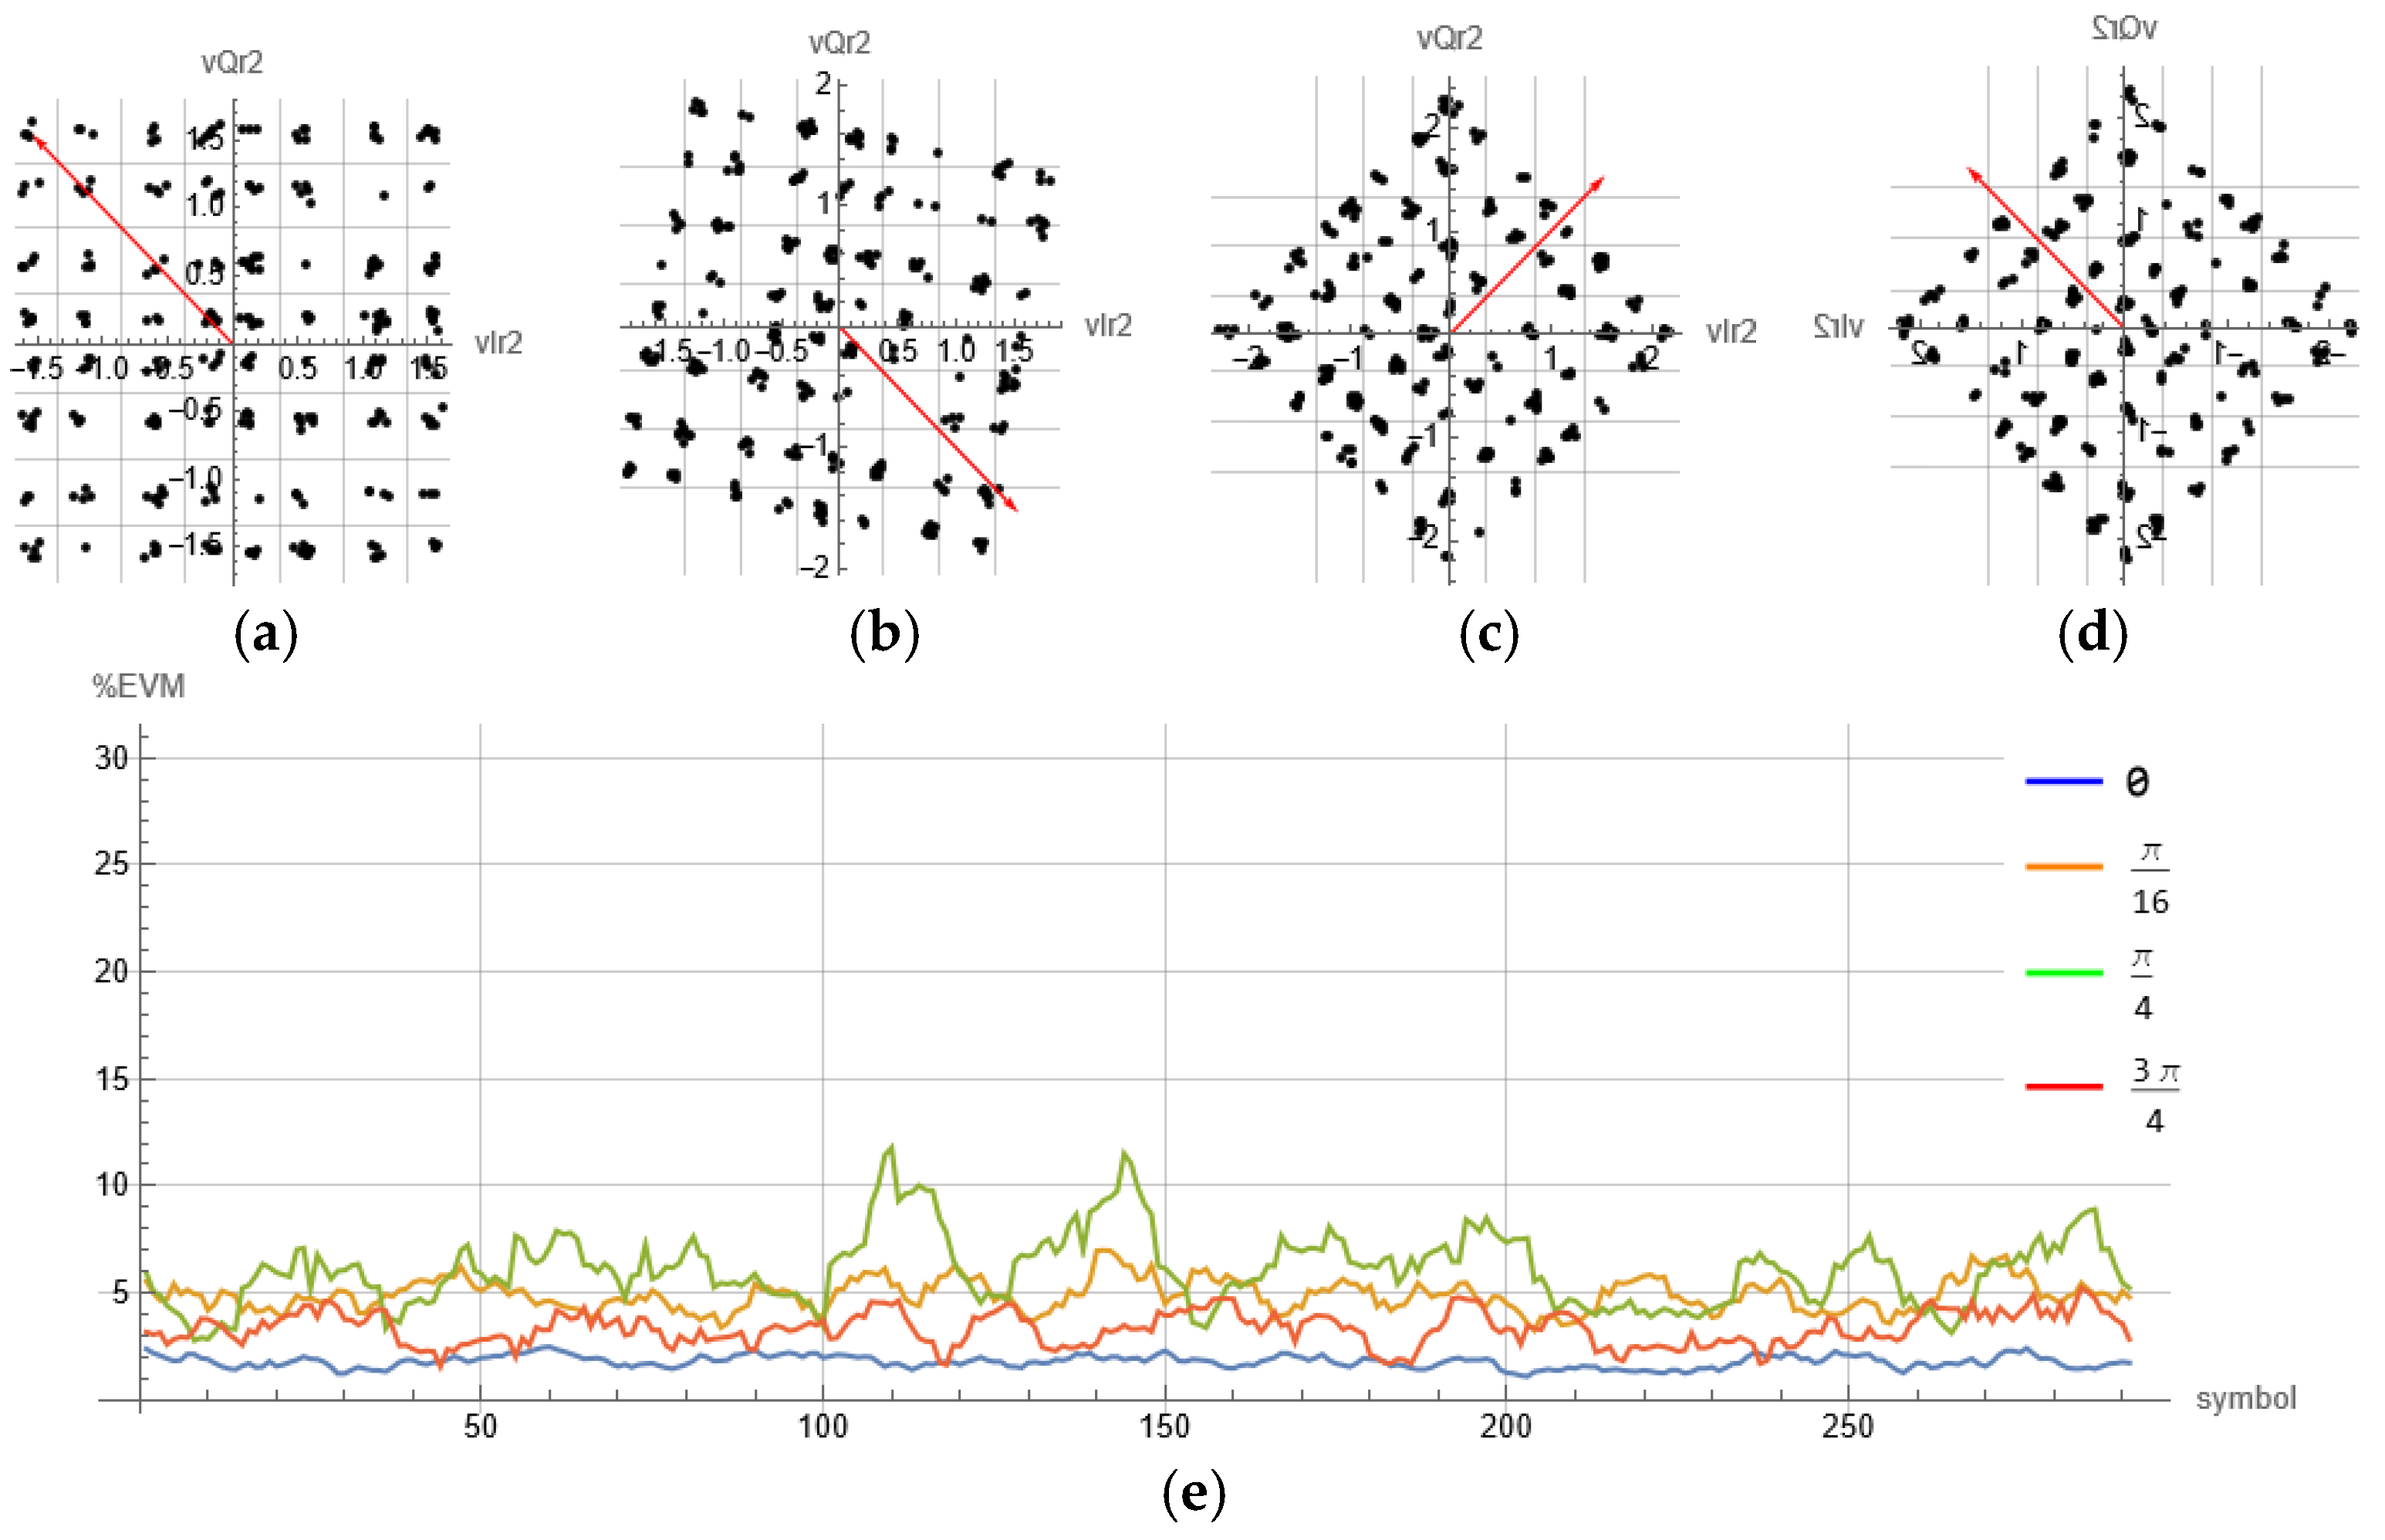
3.3. Synchronization Effects on Modulation Impairments

While there are several impairments to observe within this configuration, here we focus on LO frequency offset, LO phase offset, and sampling time offset. When the frequencies of local oscillators at the transmitter and the receiver do not match, then modulation accuracy is degraded. Figure 12 presents the constellations for several frequency offset values in terms of parts per million (ppm) and corresponding EVM measurements, where only the last case (d) offers satisfying accuracy (red EVM) for this parameter setup ( p ,   α ,   L ). It is important to note that the EVM measurement associates measured values inside each decision region and does not directly show coding performance.
Figure 13 shows measurements taken for a second test scenario. In this scenario, frequency synchronization is achieved, but the receiver’s local oscillators suffer from a slight phase shift. This phase shift is simulated with phase granularity of 2 π / L , so with higher L one can achieve more accurate phase synchronization, which is especially important for high modulation orders. In this case, EVM diagrams show certain spikes, pointing to certain symbol errors. Further analysis of EVM on a symbol basis could show which symbols are most affected. A third simulation test is reported in Figure 14. In this test, full LO synchronization is assumed, while the sampling offset is varied. It is obvious from the figure that with offset of 4 samples (out of 32 that represent a single symbol), the lowest EVM (below 2%) and better accuracy was achieved.
Promising applications for the simulation model presented in this work are found in the context of model-based neural networks: Recent research works stated that utilizing deep neural networks for solving complex communication scenarios requires massive data sets for training, which is a major drawback [18,19]. Although these networks require substantial computational resources, current research of deep unfolding technology in NOMA mobile ad hoc networks shows encouraging advances [20]. An interesting approach here is to generate synthetic data for training processes of neural networks, [21]. This approach can greatly benefit from our proposed intuitive symbolic framework.
To illustrate this point, Figure 15 presents a neural network model that maps various parameters and impairments in the NOMA transmission chain, such as oversampling rate, LO phase offset, and sampling misalignment, to optimal compensation parameters like power allocation, synchronization tuning, and pulse shaping. Experimental results from our model can be used to guide real-time reconfiguration of SDR-based NOMA systems by predicting and adjusting critical physical-layer parameters for improved link performance under dynamic channel conditions.

4. Conclusions and Future Work

Constellation size and irregular configuration in complex NOMA systems are very challenging tasks in the design of communication systems. Introducing a simple-to-implement link-level model that carries the benefits of engineering intuition and the ability to demonstrate the relationships between the different implementation parameters in the system is critically important to facilitate the development of practical NOMA systems. Furthermore, such a model can be utilized as a form of domain knowledge, engaging model-based machine learning systems to address complex communication tasks. In this work, we proposed a new approach for designing and implementing link-level simulations. This new approach differs from previous approaches, e.g., [11,12], as it defines the signal path element symbolically instead of coding them explicitly.

4.1. Pros and Cons of the Proposed Symbolic Model

We next summarize in Table 1 the advantages and disadvantages of our model, and detail a few real case studies that can greatly benefit from symbolic modelling.
To highlight the benefits of the proposed symbolic modelling, we consider three real case studies where it can be applied to significantly improve the outcomes:
Case Study 1: Adaptive Receiver Design in Urban Mobile Environments [22]: In a scenario where a telecom research lab is developing adaptive NOMA receivers for 5G/6G small cell deployments in dense urban areas where multipath fading and user mobility introduce severe synchronization challenges. This symbolic model can simulate irregular QAM constellations and their sensitivity to impairments (e.g., timing offsets, carrier frequency drift) across multiple users in varying channel conditions. This helps design and test adaptive synchronization blocks and equalizers in the receiver chain. This way, early-stage development and theoretical validation are accelerated without relying on hardware prototypes, and labeled synthetic data for training AI-based adaptive receivers can be generated.
Case Study 2: Synthetic Data Generation for Deep Learning in NOMA Detection [23]: A use case where a university research group is building a deep neural network for blind symbol classification in a NOMA uplink, aimed at improving multi-user detection using AI instead of classical SIC. The symbolic framework can rapidly simulate thousands of irregular constellation configurations and modulation impairments under various signal-to-noise ratios (SNRs), thereby facilitating the generation of high-quality training datasets for supervised learning. This removes dependency on hardware-based data collection, ensuring full control over ground-truth parameters while enabling large-scale, diverse dataset creation in a reproducible and low-cost environment.
Case Study 3: SDR System-Level Testing for Mission-Critical Internet-of-Things (IoT) Networks [24]: An industrial R&D team is building a custom SDR-based NOMA transceiver for low-latency, mission-critical IoT applications (e.g., factory automation), where several sensors communicate concurrently with a base station under tight spectral and power constraints. The proposed symbolic model allows pre-deployment validation of the modulation design (e.g., pulse shaping, spectrum usage, constellation overlap) to predict and avoid potential impairments such as inter-symbol interference or spectral leakage. This can have an extended impact as the framework ensures that signal processing algorithms are well-optimized before porting to SDR platforms, saving prototyping time and improving signal quality under constrained resources.

4.2. Further Work

The proposed symbolic framework establishes rapid system development, from mathematical concepts applied on samples in the manner that are processed in SDR. Observing various constellation configurations, one can obtain useful conclusions on system behavior and elaborate data-driven optimization enhancements. Future work will consider real system SDR implementation for 6G NOMA schemes in multi-user NOMA scenarios. Such scenarios are very difficult to simulate and implement. Using the proposed symbolic framework, we will test the implementation of optimization via deep unfolded neural network for synchronization and decoding tasks and evaluation of system performance indicators, such as bit error rate and outage probability. Further work will also incorporate dynamically varying user deployments and channel conditions into the simulation and design adaptive algorithms for handling such dynamics.

Author Contributions

N.S. proposed the method, collected the data, and conducted the experiments. V.M. designed the experiments and supervised the project. B.J. revised the manuscript presentation and evaluated the experiments. R.D. provided theoretical support and guidance for the analysis of NOMA signals. A.K. contributed to the development of the symbolic framework and the adaptation of the SDR implementation. All authors have read and agreed to the published version of the manuscript.

Funding

This study was supported by the Ministry of Science, Technological Development, and Innovation of the Republic of Serbia, and these results are parts of the Grant No. 451-03-66/2024-03/200132 with University of Kragujevac—Faculty of Technical Sciences Čačak.

Institutional Review Board Statement

Not applicable.

Informed Consent Statement

Not applicable.

Data Availability Statement

The original contributions presented in this study are included in the article. Further inquiries can be directed to the corresponding author.

Conflicts of Interest

The authors declare no conflicts of interest.

Abbreviations

A/DAnalog to digital
BERBit error rate
CSIChannel state information
D/ADigital to analog
EVMError vector magnitude
FPGAField programmable gate array
IoTInternet-of-things
IQIn-phase and quadrature
LOLocal oscillator
LUTLook-up table
MCSModulation and coding scheme
NOMANon-orthogonal multiple access
ppmParts per million
QAMQuadrature amplitude modulation
QPSKQuadrature phase shift keying
RCRaised cosine
RFRadio frequency
RSSIReceived signal strength indicator
SDRSoftware-defined radio
SICSuccessive interference cancellation
S/PSerial to parallel
SQRCSquare-root raised cosine
TPTest point

References

  1. Yuan, Y.; Yuan, Z. 5G New Radio Non-Orthogonal Multiple Access; CRC Press: Boca Raton, FL, USA; Taylor & Francis: Boca Raton, FL, USA, 2023. [Google Scholar]
  2. Dai, L.; Wang, B.; Ding, Z.; Wang, Z.; Chen, S.; Hanzo, L. A survey on non-orthogonal multiple access for 5G. IEEE Commun. Surv.Tutor. 2018, 20, 2294–2323. [Google Scholar] [CrossRef]
  3. Dai, L.; Wang, B.; Yuan, Y.; Han, S.; Chih-Lin, I.; Wang, Z. Non-orthogonal multiple access for 5G: Solutions, challenges, opportunities, and future research trends. IEEE Commun. Mag. 2015, 53, 74–81. [Google Scholar] [CrossRef]
  4. Collins, T.F.; Getz, R.; Pu, D.; Wyglinski, A.M. Software-Defined Radio for Engineers; Artech House: Boston, MA, USA, 2018. [Google Scholar]
  5. Zielinski, T.P. Starting Digital Signal Processing in Telecommunications Engineering: A Laboratory-Based Course; Springer Nature: Cham, Switzerland, 2020. [Google Scholar]
  6. Rayland, J. Software Defined Radio: Theory and Practice; Artech House: Norwood, MA, USA, 2023. [Google Scholar]
  7. Chaudhari, Q. Wireless Communications from the Ground Up: An SDR Perspective; Self-published; CreateSpace Independent Publishing Platform: Scotts Valley, CA, USA, 2018. [Google Scholar]
  8. Reddy BS, K.; Mannem, K.; Jamal, K. Software defined radio based non-orthogonal multiple access (NOMA) systems. Wireless Pers. Commun. 2021, 119, 1251–1273. [Google Scholar] [CrossRef]
  9. Garnier, J.-R.; Fabre, A.; Farès, H.; Bonnefoi, R. On the performance of QPSK modulation over downlink NOMA: From error probability derivation to SDR-based validation. IEEE Access 2020, 8, 66495–66507. [Google Scholar] [CrossRef]
  10. Ahmed, M.A.; Mahmmod, K.F.; Azeez, M.M. On the performance of non-orthogonal multiple access (NOMA) using FPGA. Int. J. Electr. Comput. Eng. (IJECE) 2020, 10, 2151–2163. [Google Scholar] [CrossRef]
  11. Khan, A.; Usman, M.A.; Usman, M.R.; Ahmad, M.; Shin, S.-Y. Link and system-level NOMA simulator: The reproducibility of research. Electronics 2021, 10, 2388. [Google Scholar] [CrossRef]
  12. Reddy, B.S.K. Experimental validation of non-orthogonal multiple access (NOMA) technique using software defined radio. Wireless Pers Commun. 2021, 116, 3599–3612. [Google Scholar] [CrossRef]
  13. Ding, Z.; Dai, X.; Poor, H.V. MIMO-NOMA design for small packet transmission in the internet of things. IEEE Access 2017, 4, 1393–1405. [Google Scholar] [CrossRef]
  14. Liu, Y.; Qin, Z.; Elkashlan, M.; Ding, Z.; Nallanathan, A.; Hanzo, L. Non-orthogonal multiple access for 5G and beyond. Proc. IEEE 2017, 105, 2347–2381. [Google Scholar] [CrossRef]
  15. Awan, D.A.; Cavalcante, R.L.G.; Yukawa, M.; Stanczak, S. Detection for 5G-NOMA: An online adaptive machine learning approach. In Proceedings of the IEEE International Conference on Communications (ICC), Kansas City, MO, USA, 20–24 May 2018; pp. 1–6. [Google Scholar] [CrossRef]
  16. Mayama, K.; Akimoto, K.; Kameda, S.; Suematsu, N. Evaluation of link-level performance considering EVM of transmit signal for downlink NOMA. In Proceedings of the Asia-Pacific Microwave Conference (APMC), Kyoto, Japan, 6–9 November 2018; pp. 774–776. [Google Scholar] [CrossRef]
  17. Wulich, D.; Dabora, R.; Tsouri, G.R. On Increasing Spectral Efficiency of Frequency Division Multiple Access Using Synchronized Superposition-Modulation. In Proceedings of the IEEE International Conference on Microwaves, Communications, Antennas and Electronics Systems (COMCAS), Tel-Aviv, Israel, 9–11 November 2009; pp. 1–4. [Google Scholar] [CrossRef]
  18. Shlezinger, N.; Whang, J.; Eldar, Y.C.; Dimakis, A.G. Model-based deep learning: Key approaches and design guidelines. In Proceedings of the IEEE Data Science and Learning Workshop (DSLW), Toronto, ON, Canada, 5–6 June 2021. [Google Scholar] [CrossRef]
  19. Eldar, Y.C.; Goldsmith, A.; Gunduz, D.; Poor, H.V. Machine Learning and Wireless Communications; Cambridge University Press: Cambridge, UK, 2022. [Google Scholar]
  20. Alter, T.; Shlezinger, N. Deep unfolded superposition coding optimization for two-hop NOMA MANETs. In Proceedings of the IEEE Military Communications Conference (MILCOM), Boston, MA, USA, 30 October–3 November 2023; pp. 286–291. [Google Scholar] [CrossRef]
  21. Scholl, S. RF signal classification with synthetic training data and its real-world performance. arXiv 2022, arXiv:2206.12967. [Google Scholar]
  22. Balaraman, A.; Shioda, S.; Kim, Y.; Kim, Y.; Kim, T. Efficient User Pairing and Resource Optimization for NOMA-OMA Switching Enabled Dynamic Urban Vehicular Networks. Electronics 2024, 13, 4834. [Google Scholar] [CrossRef]
  23. Annapurna, H.S.; Devi, S. Machine Learning-Based Adaptive Equalization with Software-Dened Radio Experimental Setup. ECTI Trans. Comput. Inf. Technol. (ECTI-CIT) 2025, 19, 271–281. [Google Scholar]
  24. Gkonis, P.; Trakadas, P.; Sarakis, L.; Giannopoulos, A.; Spantideas, S.; Capsalis, N. On the Performance Evaluation of 5G MIMO Networks employing NOMA via System-Link Level Simulations. In Proceedings of the IEEE 9th International Conference on Information, Communication and Networks (ICICN), Xi’an, China, 25–28 November 2021; pp. 264–268. [Google Scholar] [CrossRef]
Figure 1. Basic quadrature NOMA SDR transmitter.
Information 16 00468 g001
Figure 2. (a) Input bit stream; (b) a I and a Q symbols at the output of the LUTs.
Information 16 00468 g002
Figure 3. Single superposition coder.
Information 16 00468 g003
Figure 4. Process of upsampling: (a) quadrature NOMA streams at TP1; (b) close look at upsampling process for L = 10 .
Information 16 00468 g004
Figure 5. Sampled RC (orange) and SQRC (blue) window function.
Information 16 00468 g005
Figure 6. (a) Sample stream view before filter; (b) sample stream after filter; (c) spectrum for α = 0.2 , L = 32 ; (d) spectrum for α = 0.2 , L = 16 ; (e) spectrum for α = 0.2 , L = 8 .
Information 16 00468 g006
Figure 7. (a) I and Q streams after mixing (b) Tx output NOMA signal s ( n T S ) .
Information 16 00468 g007
Figure 8. NOMA SIC QAM receiver processing.
Information 16 00468 g008
Figure 9. Constellation diagrams with decision regions of the superimposed signal measured at TP1 for: (a) two 4-QAM users, (b) three 4-QAM users, and (c) four 4-QAM users.
Information 16 00468 g009
Figure 10. The effect of pulse-shaping observed in TP2 for: (a) two 4-QAM users, (b) three 4-QAM users, and (c) four 4-QAM users.
Information 16 00468 g010
Figure 11. Diagrams with decision regions of NOMA constellations at receiver for: (a) 16 symbols, (b) 64 symbols, (c) 256 symbols, (d) EVM, and (e) EVM spectrum.
Information 16 00468 g011
Figure 12. NOMA constellations and EVM for different LO frequency offset: (a) 10 ppm, (b) 5 ppm, (c) 2 ppm, (d) 1 ppm, and (e) corresponding EVM.
Information 16 00468 g012
Figure 13. NOMA constellations and EVM for different LO phase offset: (a) 0, (b) π/16, (c) π/4, (d) 3π/4, and (e) corresponding EVM.
Information 16 00468 g013
Figure 14. NOMA constellations and EVM for different sampling offsets: (a) L = 1 , (b) L = 3 , (c) L = 4 , (d) L = 6 , and (e) corresponding EVM.
Information 16 00468 g014
Figure 15. An example of neural network for prediction and optimization of physical layer link, trained on synthetic generated data obtained by symbolic model. The input features are represented by the squares, intermediate neurons by orange circles and output neurons by the blue circles.
Information 16 00468 g015
Table 1. Advantages and disadvantages of the proposed symbolic model.
ProsCons
Intuitive representation of irregular NOMA constellations and symbol decision regionsSymbolic computations can be slower for large-scale system-level simulations
Enables generation of synthetic training datasets for machine learning modelsRequires symbolic math expertise for effective customization
Easily modifiable for testing different modulation, synchronization, and pulse shaping schemesLimited support for real-time testing without external SDR integration
Provides analytical insight into signal behavior under modulation impairmentsMay not capture full non-linear effects of analog RF front-ends without additional modeling
Supports rapid prototyping and algorithm validation in Wolfram languageWolfram environment may not be as widely adopted in communication system prototyping
Facilitates SDR implementation by bridging high-level theory and practical system behaviorLess suited for integration with traditional SDR toolchains (e.g., GNU Radio) without export
Disclaimer/Publisher’s Note: The statements, opinions and data contained in all publications are solely those of the individual author(s) and contributor(s) and not of MDPI and/or the editor(s). MDPI and/or the editor(s) disclaim responsibility for any injury to people or property resulting from any ideas, methods, instructions or products referred to in the content.

