Article

Focal Cosine-Enhanced EfficientNetB0: A Novel Approach to Classifying Breast Histopathological Images

School of Electrical and Electronic Engineering, Hubei University of Technology, Wuhan 430068, China
*
Author to whom correspondence should be addressed.
Information 2025, 16(6), 444; https://doi.org/10.3390/info16060444
Submission received: 8 April 2025 / Revised: 17 May 2025 / Accepted: 23 May 2025 / Published: 27 May 2025

Abstract

:
Early and accurate breast cancer diagnosis is critical in enhancing patient survival rates, with histopathological image analysis serving as a key diagnostic tool. To address challenges in breast histopathology image analysis, including multi-magnification characteristics, insufficient feature extraction in traditional CNNs, and high inter-class similarity coupled with significant intra-class variation among tumor subtypes, this work proposes a focal cosine-enhanced EfficientNetB0 (FCE-EfficientNetB0) classification model. The framework incorporates a multiscale efficient attention mechanism into a multiscale efficient mobile inverted bottleneck conv, where parallel 1D convolutional branches extract features across magnification levels, while the attention mechanism prioritizes clinically relevant patterns. A focal cosine hybrid loss function further optimizes classification by enlarging interclass distances and reducing intraclass variations in the feature space. Experimental results demonstrate state-of-the-art performance, with the model achieving 99.34% accuracy for benign/malignant classification and 95.97% accuracy for eight-subtype classification on the BreakHis dataset, confirming its effectiveness in breast cancer histopathology analysis.

1. Introduction

In clinical practice, distinguishing between benign and malignant breast cancer is a critical prognostic factor that influences patient treatment, highlighting the importance of early diagnosis [1]. Typically, breast tissue biopsy is regarded as the standard diagnostic procedure. However, traditional medical diagnostic processes strongly rely on the clinical experience of physicians, often leading to inefficiencies [2]. Advancements in computer technology have made the development of computer-aided diagnosis (CAD) systems using convolutional neural networks (CNNs) a prominent trend, facilitating the rapid and accurate classification of pathological images to support clinicians in making informed decisions [3].
In the medical domain, deep learning-based classification methods for breast tissue pathological images can automatically extract features from data [4,5,6,7]. However, due to the ultra-high resolution of histopathological images, it is expensive to input them directly into the network. Some existing approaches [8,9,10,11] segment these images into multiple input patches. Nonetheless, this patch-based method overlooks the correlations between adjacent patches, diminishing the feature representation capabilities of each patch. To address these challenges, Kang et al. [12] employed a multiscale curriculum learning strategy to enhance model accuracy. Tong et al. utilized the built-in image pyramid structure of whole slide images (WSI) to integrate contextual information from low-magnification images, thereby enhancing the predictive capabilities of patches [13]. Xie et al. [14] proposed a multiscale convolutional network based on ResNet50 that simultaneously processes images at 40× and 100× magnification, merging features from different scales to improve the classification network performance.
The above-mentioned works show that neural networks utilizing a multiscale strategy significantly outperform their single-scale counterparts, enriching the feature information within the network and enhancing feature utilization. However, the previously mentioned multiscale methods do not account for the significance of features from different scales before feature fusion. The Squeeze and Excitation (SE) model [15], which operates within the feature channel domain, suppresses irrelevant features and enhances the classification performance through channel weights learned during training. To differentiate between the contributions of features from various scale channels to the classification task of breast cancer histopathological images, selective kernel networks, proposed by [16], leverage channel information to identify images, capturing cross-channel interactions while integrating multiscale information to extract features pertinent to the classification task, but this lacks spatial information. Yu et al. [17] integrated coordinate attention (CA) [18] into the DenseNet architecture to enhance the classification network’s focus on texture and positional information within pathological images, thereby improving the classification performance.
However, the aforementioned methods exhibit significant limitations. The existing attention mechanisms employed either fail to utilize spatial information effectively or reduce the channel dimensions in the process. To enhance spatial attention learning, the efficient local attention (ELA) proposed by [19] improves upon CA by enabling deep convolutional neural networks to accurately locate regions of interest while effectively leveraging spatial information without diminishing the channel dimensions, thus demonstrating superior performance in image classification. Nevertheless, given the substantial variations in target scale present in breast cancer histopathology images, ELA remains inadequate for the extraction of features from images at varying magnification levels. To address this problem, this paper introduces the multiscale ELA module based on ELA, which employs multi-branch parallel 1D convolution to obtain multiscale features and applies a combination of position attention and channel attention to each scale feature, thereby identifying features that are beneficial in improving the classification accuracy.
Moreover, although CNNs can process a vast number of contextual features to accomplish the classification of histopathological images for breast cancer, deep learning models face significant challenges when dealing with imbalanced datasets [20]. Specifically, the medical field has garnered interest from researchers in recent years [21,22,23,24]. While data-level methods such as oversampling [25] perform well in machine learning, the impact of imbalanced data on CNNs in pathological datasets has not been systematically studied.
Other existing solutions include loss functions, such as focal loss [26] and gravitation loss [27], which have shown effectiveness in handling imbalanced samples by adjusting the sample weights in the loss function, thereby directing more attention to the hard-to-classify minority class samples. However, these methods often overlook the intraclass variability and interclass similarity of pathological images [28,29]. Particularly in cases where the boundaries between classes are ambiguous, the model may struggle to accurately distinguish similar cancer subtypes. To address this issue, this paper introduces cosine loss, which is based on focal loss, to increase the angular separation between different categories while reducing the angular difference among samples within the same category. This approach achieves more effective category distinction and the clustering of similar samples. The total loss function integrates these two enhanced loss functions, thereby enabling the model to improve its ability to differentiate between various cancer subtypes during training.
This paper proposes the focal cosine-enhanced EfficientNetB0 model to comprehensively improve the performance and generalization abilities of breast cancer pathological image classification models by introducing a multiscale efficient local attention mechanism, loss function, and transfer learning strategy. This study makes the following contributions.
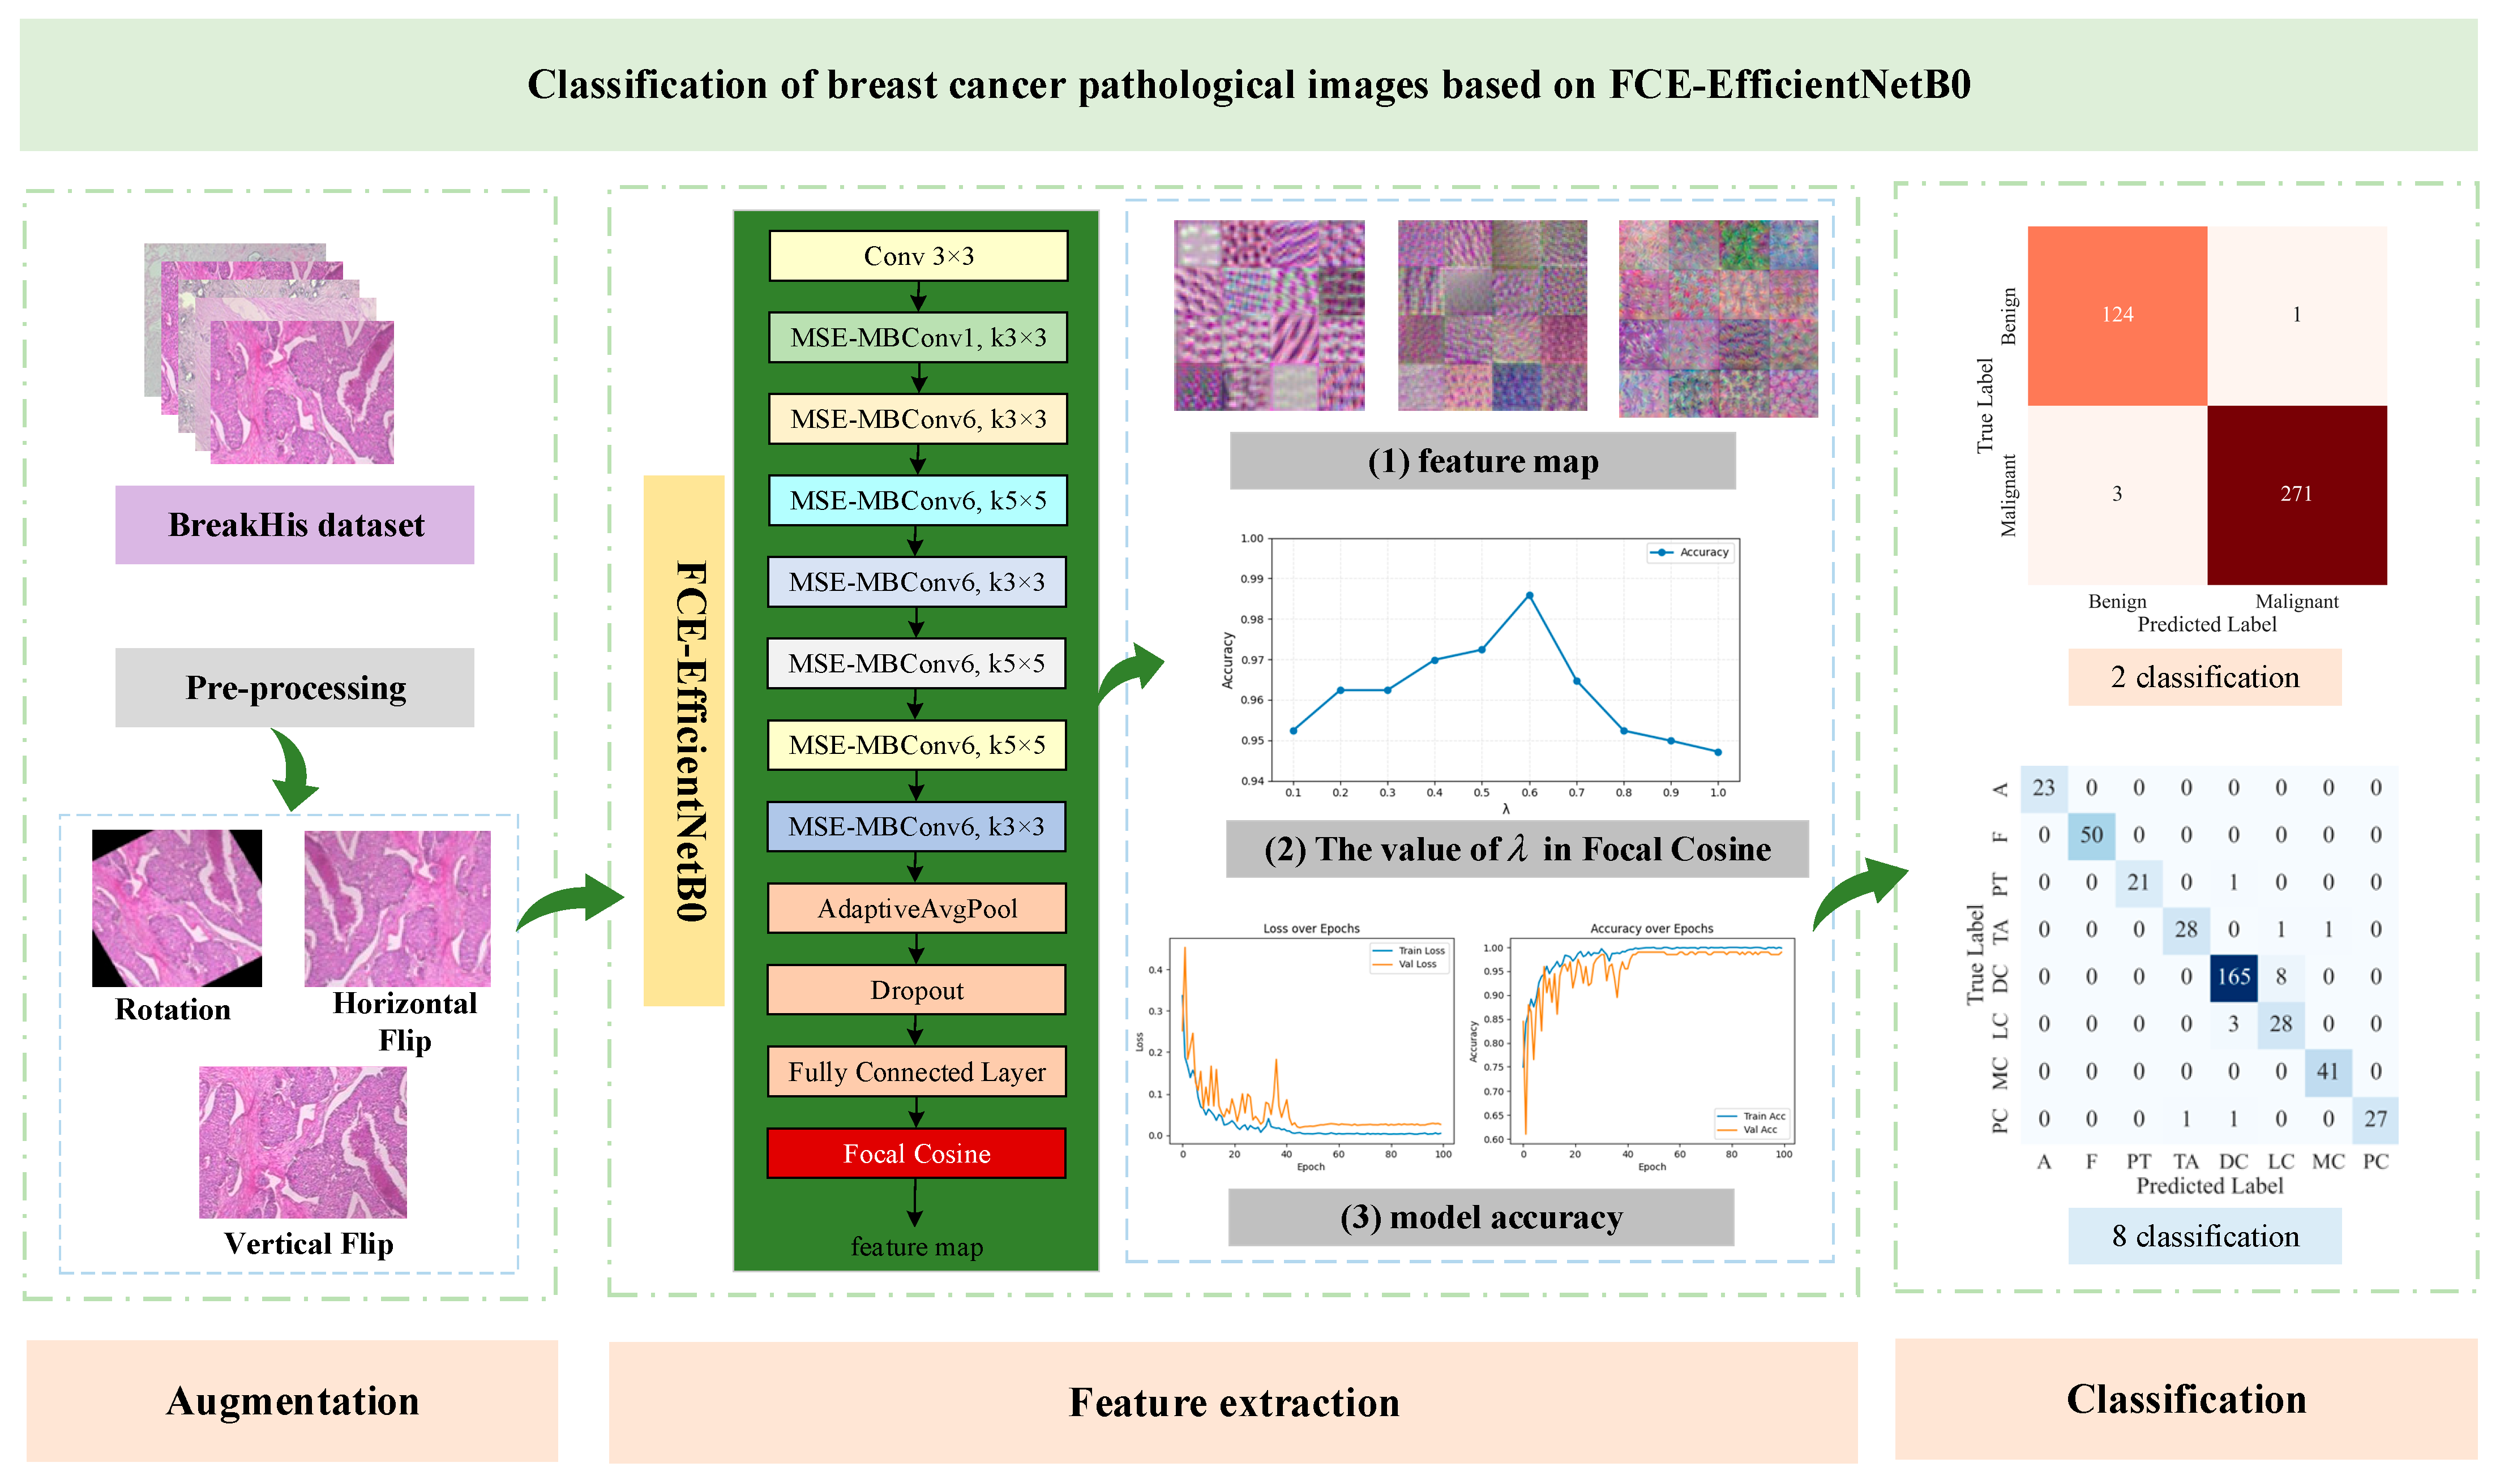
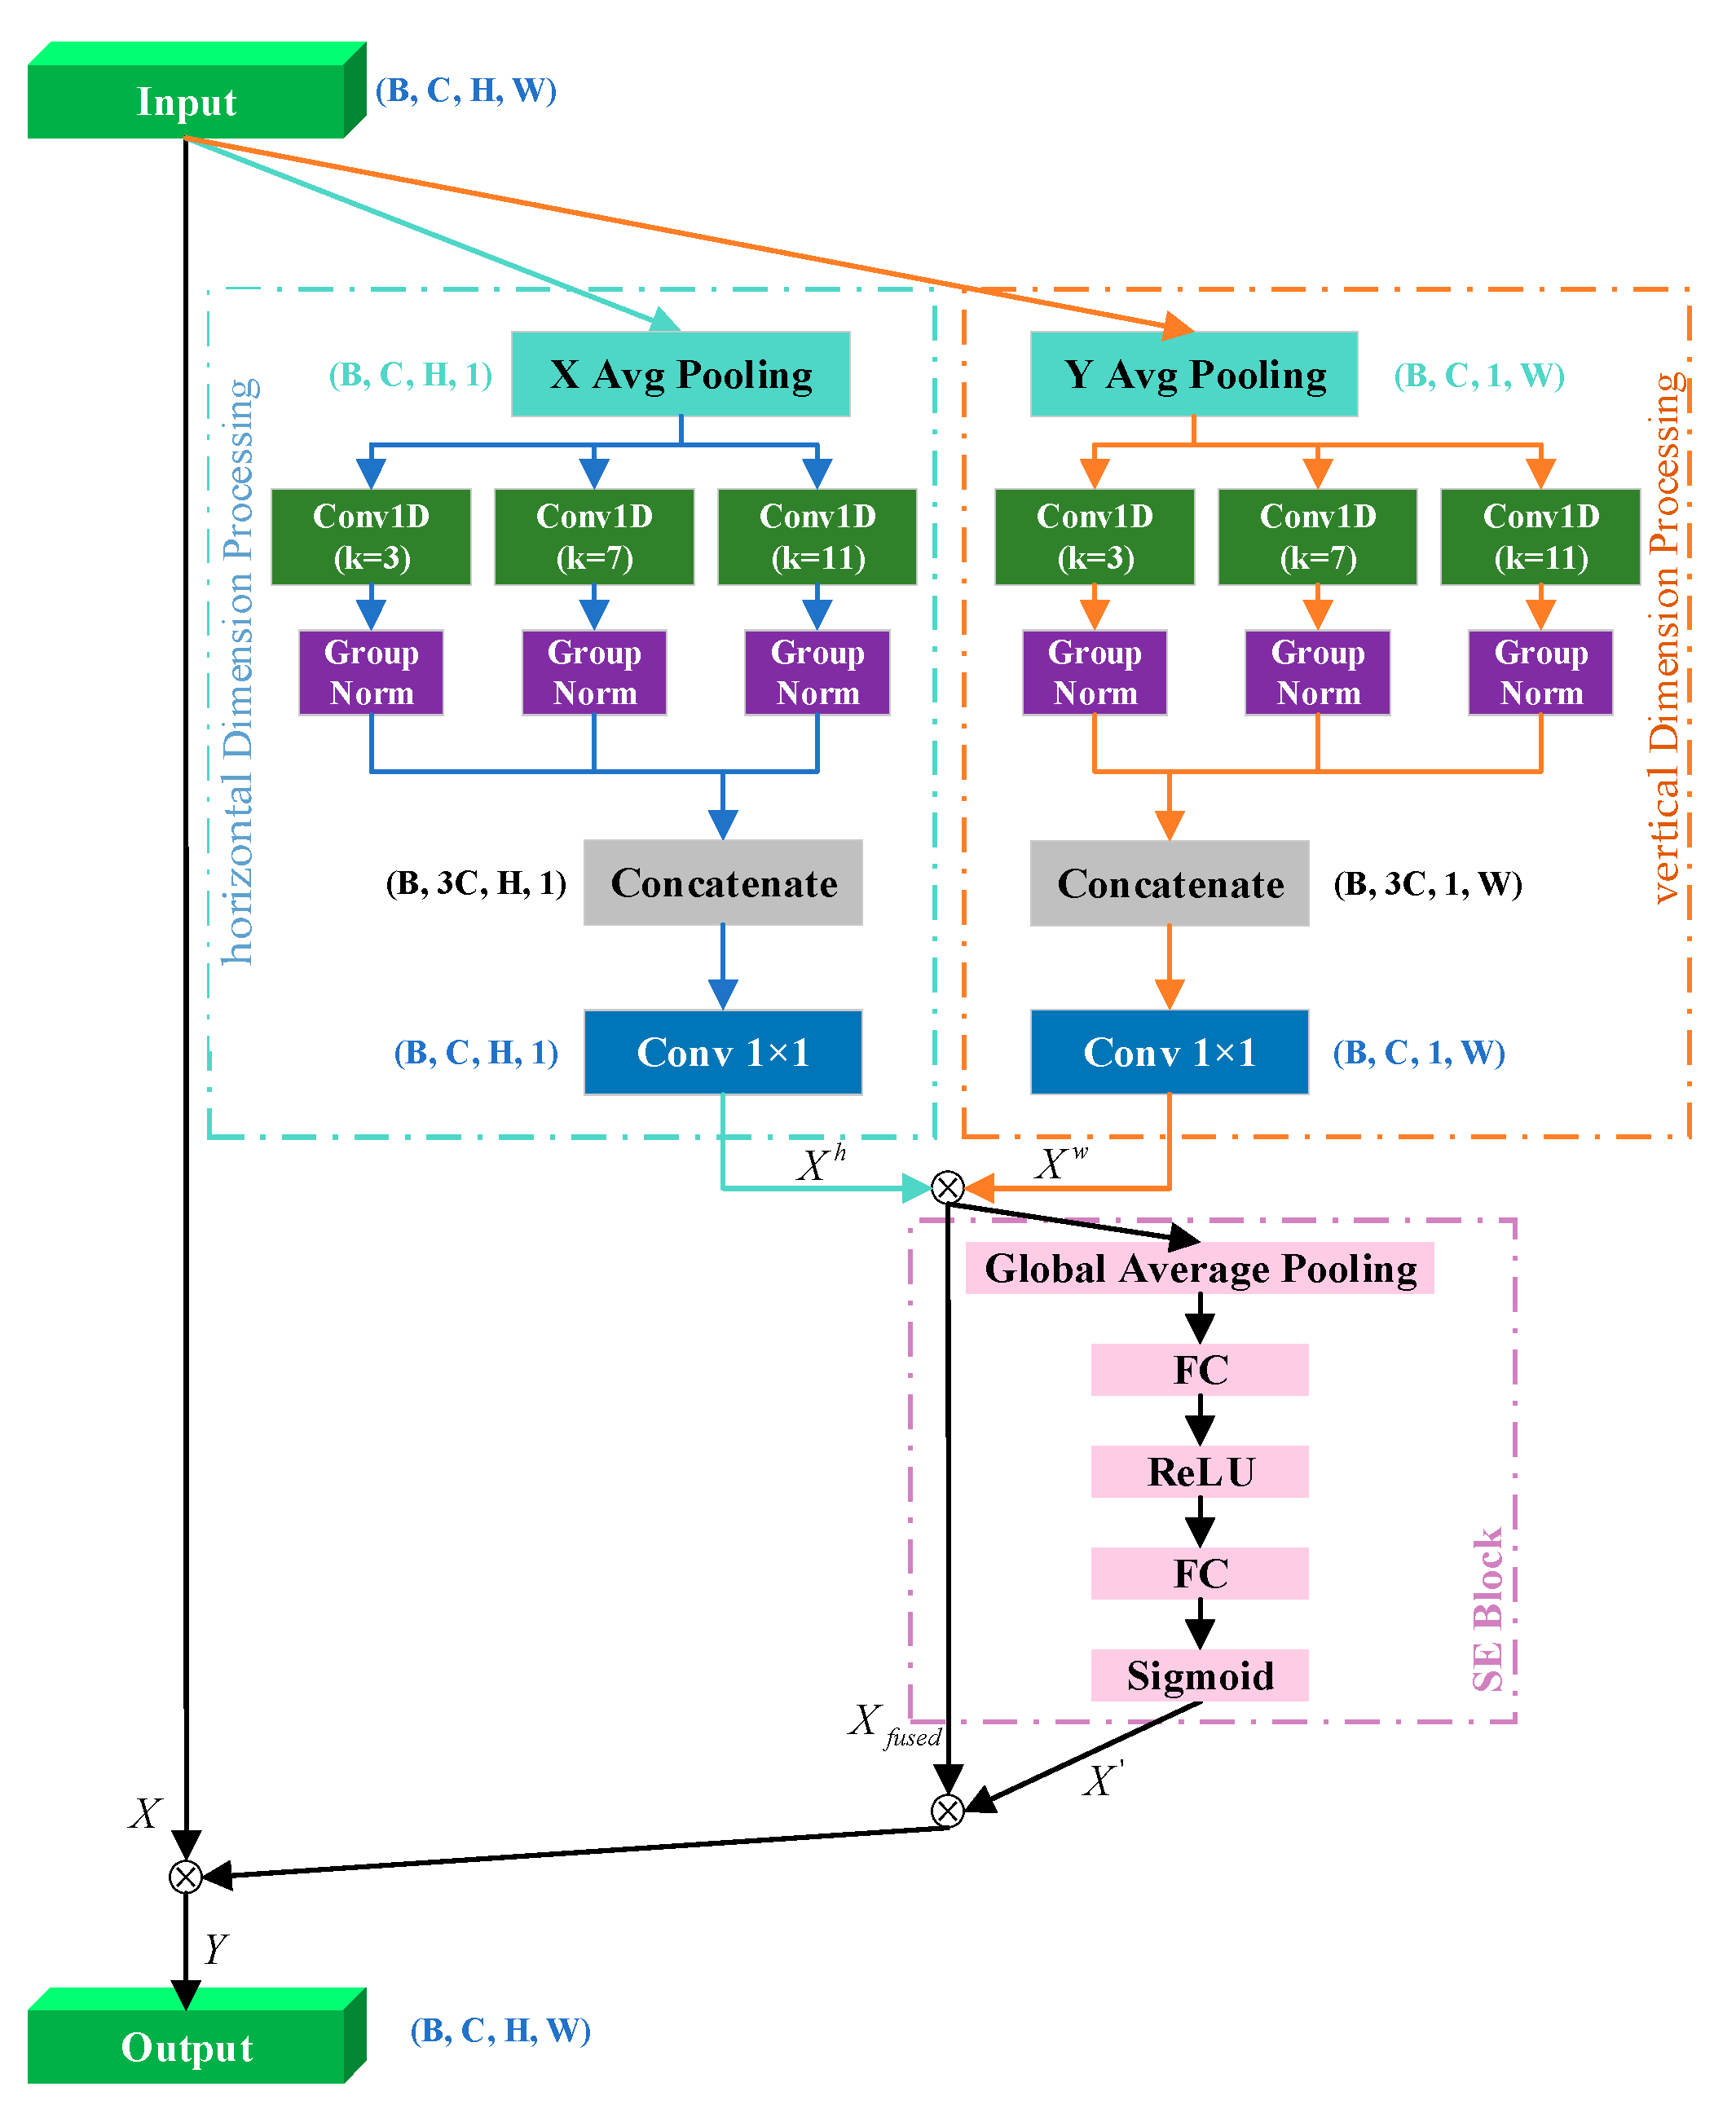
  • Traditional CNNs are constrained by fixed receptive fields, limiting their ability to collaboratively extract cellular and tissue structural features from low- and high-magnification microscopy images. Therefore, we propose the multiscale ELA module, which integrates multi-branch convolutions with attention mechanisms to automatically focus on critical lesion regions across scales, significantly enhancing the feature extraction capabilities for key pathological characteristics under varying magnifications.
  • To address the shortcomings in terms of small interclass differences and large intraclass variations in histopathological breast images, the model is trained using an improved focal cosine loss. This loss function integrates modified focal loss and enhanced cosine loss mechanisms, which enhance the model’s sensitivity to minority class samples by adaptively adjusting the weights for hard-to-classify samples and optimizing the interclass angular discrepancies, thereby improving the overall classification performance.
  • By adopting EfficientNetB0 as the backbone network and integrating transfer learning techniques, the model applies ImageNet pre-trained weights to the breast cancer image classification task. Through structural optimization and feature fine-tuning, both the classification accuracy and generalization capabilities are significantly improved.
The remainder of this paper is structured as follows: Section 2 introduces our proposed FCE-EfficientNetB0, the multiscale ELA, and the new loss function; Section 3 presents the experimental outcomes and comparative analysis; Section 4 explores the implications and future directions; and Section 5 summarizes the key findings. Readers can access our code at https://github.com/patricia1301/FCE-EFFicientNet (accessed on 24 May 2025).

2. Proposed Approach

Based on the EfficientNet [30] architecture, the proposed MSE-EfficientNetB0 framework, illustrated in Figure 1, consists primarily of a standard convolution layer followed by a stack of 16 multiscale efficient mobile inverted bottleneck convolution layers (MSE-MBConv). This structure is further augmented by dropout, a fully connected layer, and a focal cosine function. MSE-EfficientNetB0 has undergone optimization in three key aspects.
First, MSE-MBConv is employed to extract image features, utilizing a multiscale efficient local attention (multiscale ELA) mechanism that integrates spatial features into channel attention, thereby enhancing the information that is critical for classification. Second, a multi-branch parallel 1D convolution is implemented to extract features at varying scales, which minimizes information loss. Finally, the output feature vector of the fully connected layer is adjusted to either 2 or 8 to accommodate the classifications of benign, malignant, and eight tumor subtypes in the BreakHis dataset. Additionally, a novel focal cosine joint loss function has been developed to improve the model’s predictive performance.
MSE-MBConv, as depicted in Figure 2, comprises a 1 × 1 convolution for increased dimensionality, multiscale ELA, depthwise separable convolutions, and a 1 × 1 convolution for dimensionality reduction.
Multiscale ELA serves as a multiscale spatial–channel joint attention mechanism, addressing the limitations of the original MBConv, which relied solely on the SE mechanism while overlooking spatial features. This design adheres to the channel expansion ratio principle validated by the original EfficientNet, wherein the 1 × 1 convolution in the first layer of MSE-MBConv employs two expansion ratios: a 1× expansion for the processing of shallow low-dimensional features, which has been shown to maintain optimal computational efficiency, and a 6× expansion to manage deep high-level semantic features, achieving an optimal balance between model expressiveness and the computational cost. This ratio design is particularly significant for breast cancer image analysis tasks constrained by limited computational resources. The kernel sizes for the depthwise separable convolutions are set to either 3 or 5.
The proposed model’s classification process for histopathological images of breast cancer is depicted in Figure 3. The model that we propose enables end-to-end image processing. In this classification process, breast cancer tissue images undergo preprocessing to ensure the completeness and accuracy of the image information. Next, the FCE-EfficientNetB0 network is used for feature extraction, identifying key features that aid in classification. Finally, the extracted features are fed into the classifier, where the system determines whether the image is benign or malignant, ultimately providing a diagnosis for breast cancer.

2.1. Multiscale ELA

The spatial dimensions of an image contain essential positional information; however, existing attention mechanisms often struggle to utilize this spatial information effectively, sometimes compromising the channel integrity. To address these limitations, the multiscale ELA mechanism has been proposed. This approach encodes two one-dimensional positional feature maps, enabling the precise localization of regions of interest without reducing the channel dimensions, thereby preserving the channel integrity and preventing information loss. Furthermore, it integrates multi-branch convolution and SE to achieve the fusion of spatial and channel attention. This integration enhances the model’s ability to perceive the texture of breast cancer pathological images. Its structure is presented in Figure 4.
Multiscale ELA encodes the horizontal and vertical directional information for each position in the input feature map X with the shape B , C , H , W , where B denotes the batch size, C is the number of channels, and H and W indicate the height and width of the feature map, respectively. Therefore, the one-dimensional horizontal and vertical average pooling outputs for the c-th channel at height h and width w are denoted as z c h and z c w :
z c h ( h ) = 1 W 1 i < W X c ( h , i )
z c w ( w ) = 1 H 1 j < H X c ( j , w )
Subsequently, position information is enhanced through 1D convolutions with varying kernel sizes, followed by group normalization (GN). The results are concatenated along the channel dimension and reduced in dimensionality using a 1 × 1 convolution layer. The variable k represents the different scales of the 1D convolution kernels, which take values of 3, 7, and 11 to capture features at various scales. The fused height and width feature maps are then element-wise multiplied to generate the fused feature map X f u s e d . To further enhance inter-channel dependencies, global average pooling is applied to the fused feature map X f u s e d to obtain global information for each channel. Finally, two fully connected layers compute the feature map of the weights of important channels X :
X h = C o n v 2 D ( C o n c a t ( G N ( C o n v 1 D ( z c h ( h ) , 3 , ) ) , G N ( C o n v 1 D ( z c h ( h ) , 7 ) ) , G N ( C o n v 1 D ( z c h ( h ) , 11 ) ) ) , 1 × 1 )
X w = C o n v 2 D ( C o n c a t ( G N ( C o n v 1 D ( z c w ( w ) , 3 ) ) , G N ( C o n v 1 D ( z c w ( w ) , 7 ) ) , G N ( C o n v 1 D ( z c w ( w ) , 11 ) ) ) , 1 × 1 )
X f u s e d = X h × X w
X = σ ( Re L U ( F C ( G A P ( X f u s e d ) ) ) )
Here, σ denotes the Sigmoid function. The output of the multiscale ELA module, denoted as Y, is generated by multiplying the feature map processed by the SE attention mechanism and the short-connected feature map with the original input, as represented in Equation (7):
Y = X × X f u s e d × X
The use of a 1 × 1 convolution after concatenation is justified by the fact that the convolution kernel incorporates a nonlinear activation function, which enhances the model’s nonlinearity. Additionally, the 1 × 1 convolution can reduce the dimensionality without altering the image size, thereby preserving the spatial structure of the image.
For the multi-branch parallel 1D convolutions, the approach allows for accurate spatial position prediction without sacrificing the channel dimensions of the input feature map. The multiscale convolution layer, comprising several branches with kernels of different sizes, captures features from both low and high magnifications of breast pathological images, thereby enhancing the representational capabilities of the model.

2.2. Focal Cosine Loss Function

Breast pathological images often exhibit issues of class imbalance, as well as low interclass differences and high intraclass variability. To better balance the dataset and constrain the feature distances, a focal cosine joint loss function is employed for model training.
1.
Optimized Focal Loss
Focal loss can alleviate class imbalance by suppressing the loss from the majority class. Considering the multi-classification needs of breast cancer tissue images, the handling mechanism for easy and hard samples has been refined. By introducing class weights w , a new loss function is constructed to alleviate the excessive reduction in loss contribution from majority classes. Its expression and the computational formulas for w are given by Equations (8) and (9):
L F ( x , y ) = i w i 1 p i ( x ) γ y i log p i ( x )
w i = N c × N i
where x is the feature vector of the input sample, y is the true label of the input sample, w i is the weight for class i , p i ( x ) is the predicted class probability given by the model, γ is a hyperparameter set to 2, N represents the total number of samples in the dataset, c is the total number of classes, and N i is the number of samples for class i .
Class weights are calculated based on the sample frequency of each class; specifically, the sample count for each class is tallied, and weights are determined to be inversely proportional to the class frequency. Majority classes receive higher weights, thereby increasing the penalty for these classes in the loss function and mitigating the loss reduction effect of the focal loss on such samples.
While the improved focal loss balances the classes, it remains insufficient in addressing the issues of interclass similarity and intraclass variability within the BreakHis dataset. Therefore, a cosine embedding loss function is introduced.
2.
Optimized Cosine Embedding Loss Function
The core idea of the cosine embedding loss is to compute the similarity between the feature vectors of two samples and adjust the loss based on their labels (either the same or different classes), helping the model to differentiate between multi-class classifications of breast cancer tissue images. Similarly, the expression for the introduction of class weights is given by
L C = i w i 1 i y i y ^ i i y i 2 i y ^ i 2
where y i represents the mapping of class labels to a one-hot vector, and y ^ i denotes the model’s predicted probability distribution.
3.
Focal Cosine Loss Function
To balance the dataset and expand the interclass distances while reducing the intraclass distances, the optimized focal loss and cosine embedding loss function are combined, defined as
L F C = λ L F + ( 1 λ ) L C
where λ is a hyperparameter used to balance the two components of the loss. The new loss function combines the dynamic sample weighting mechanism of the focal loss with the feature aggregation and separation strengths of the cosine embedding loss, achieving more adaptive and discriminative training.

3. Results

We performed some experiments on the shared BreakHis dataset to evaluate our proposed model and assess its performance. The experimental configuration and evaluation metrics are presented first, followed by an evaluation of the proposed network’s modules and loss functions. Additionally, we compared our method with other leading approaches in the field.

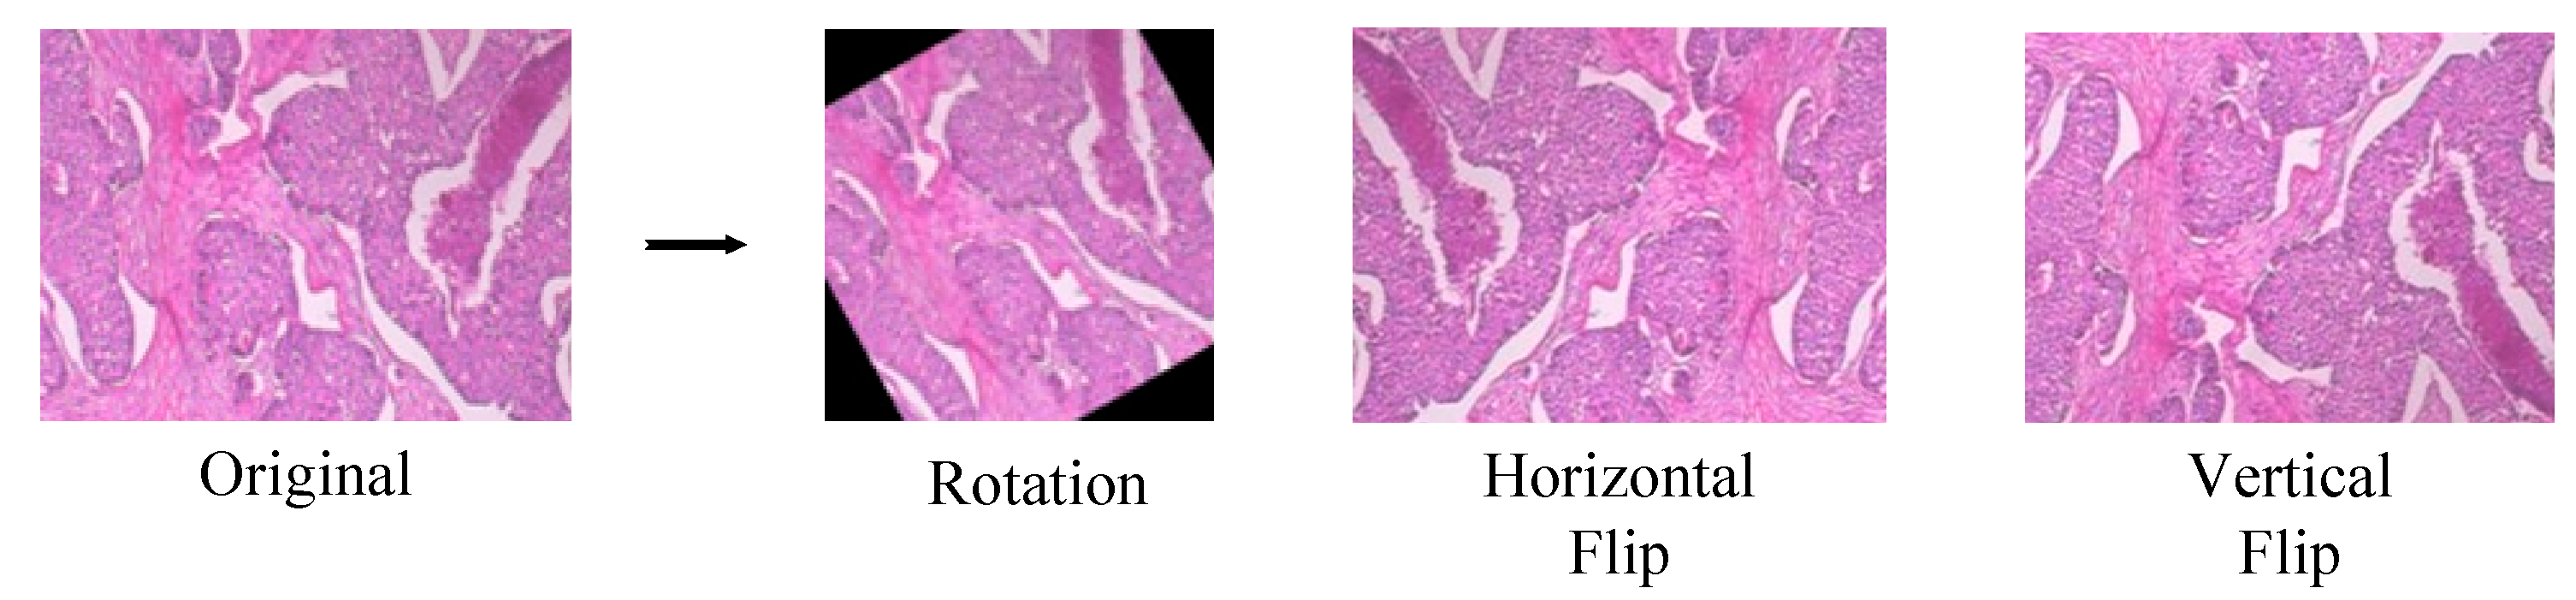
3.1. Data Description and Augmentation

The BreakHis dataset, developed by L. A. Ribeiro and A. S. Silva in 2016, is a key resource for breast cancer histopathology image classification [31]. It includes 7909 RGB images stained with hematoxylin and eosin, each at a resolution of 700 × 460 pixels, collected from 82 patients. These images are categorized into benign and malignant samples, organized across four magnification levels, 40×, 100×, 200×, and 400×, as shown in Figure 5. The varying magnifications provide a comprehensive representation of histopathological features relevant to breast cancer classification.
The dataset also contains eight tumor subtypes, among which benign and malignant have four subtypes, respectively. Table 1 shows the distribution of the eight tumor categories. Various subtypes of breast tumors may have different prognostic and therapeutic significance, which provides the possibility for multiple classifications.
Geometric transformations were applied to the pathological images in the original BreakHis dataset through data augmentation strategies. These transformations included rotation and horizontal and vertical flipping, as illustrated in Figure 6. This augmentation method effectively expands the data distribution space while mitigating the model’s tendency to overfit to the training samples, thus enhancing its capacity to extract geometrically invariant features.

3.2. Evaluation Metrics and Experimental Settings

To comprehensively evaluate the performance of our proposed models on the multi-class BreakHis dataset, we employed four key metrics, computed using macro-averaging: accuracy, precision, recall, and the F1-score. These metrics provide distinct perspectives on the predictive performance while ensuring an equitable evaluation across all classes, which is particularly crucial for imbalanced histopathology image classification. For our multi-class scenario, all metrics (except accuracy) were calculated as macro-averages, where each class contributes equally regardless of the sample size. The class-specific metrics are derived from each class’s confusion matrix components.
  • True Positives ( T P i ): Correctly predicted instances of class i .
  • False Positives ( F P i ): Instances predicted as class i but belonging to other classes.
  • False Negatives ( F N i ): Instances of class i incorrectly predicted as other classes.
The macro-averaged metrics are calculated as follows:
A c c u r a c y = T P + F N T P + F P + T N + F N
M a c r o P r e c i s i o n = 1 C i = 1 C T P i T P i + F P i
M a c r o R e c a l l = 1 C i = 1 C T P i T P i + F N i
M a c r o F 1 - s c o r e = 1 C i = 1 C 2 × P r e c i s i o n × R e c a l l P r e c i s i o n + R e c a l l
The experiments were conducted on machines equipped with a 12th Gen Intel® Core™ i7-12650H processor (Intel Corporation, Santa Clara, CA, USA) (2.30 GHz) and an NVIDIA GeForce RTX 4060 GPU (NVIDIA Corporation, Santa Clara, CA, USA), running a 64-bit version of Windows 11. The NVIDIA CUDA Toolkit 12.1 (NVIDIA Corporation, Santa Clara, CA, USA) was used to fully utilize the GPU capabilities, while PyTorch 2.2.1 served as the main deep learning framework. All model development was carried out using Python 3.9, managed through Anaconda3.
All comparative models partitioned the dataset into training, validation, and test sets at a ratio of 7:1:2. The experimental results were evaluated based on the performance metrics obtained from the test set. During model training, the data-augmented BreakHis dataset was employed to enhance generalization. Model training was optimized using the Adam optimizer, with 100 epochs, a batch size of 64, and a learning rate of 0.0001. To accelerate convergence and improve the training efficiency, a ReduceLROnPlateau scheduler was employed to dynamically lower the learning rate when the validation performance plateaued. In addition, an early stopping mechanism was incorporated, monitoring the validation loss with a patience threshold of 10 epochs. If no improvement in the validation performance was observed within this window, the training was terminated to avoid overfitting and conserve computational resources.

3.3. Classification Results of FCE-EfficientNetB0 at Different Magnifications

As shown in Table 2 and Table 3, we validated the effectiveness of each module by progressively incorporating different structures. Specifically, we started with EfficientNetB0 and gradually added the multiscale ELA attention and focal cosine loss, demonstrating the contribution of each module to the overall performance. In our study, EfficientNetB0 was trained from scratch, whereas ‘FCE-EfficientNetB0 + TL’ utilized ImageNet pre-trained weights, where ‘TL’ denotes transfer learning. As the multiscale ELA module is deeply integrated into the EfficientNetB0 architecture in our design, rather than being an added module, we have renamed the model to ‘EfficientNetB0-MSE’. The ‘EfficientNetB0-MSE + FC’ model extends ‘EfficientNetB0-MSE’ by incorporating the proposed focal cosine loss (FC loss) function for enhanced training optimization. The specific implementation of the ‘FCE-EfficientNetB0 + TL’ model includes the following: EfficientNetB0 with ImageNet pre-trained weights are used to leverage the feature representations learned from a large-scale dataset. The original classification layer of EfficientNetB0 was removed to design a more suitable classifier for the new task. Our custom-designed multiscale ELA module is added to better capture multiscale features and enhance the performance. Focal cosine loss is employed as the loss function, in combination with the new classifier, to improve the model’s ability to handle challenging samples, especially in situations with class imbalance.
The ‘EfficientNetB0-MSE’ model consistently outperformed ‘EfficientNetB0’ in terms of accuracy and the other evaluation metrics at the four magnification levels. This improvement is attributed to the multiscale ELA, which enhances the model’s ability to perceive detailed features by integrating the spatial position and channel attention. It employs a multi-branch parallel 1D convolution structure with convolution kernels of varying scales, such as 3, 7, and 11. This architecture effectively captures global features at low magnifications while extracting local details from high-magnification breast pathological images. Consequently, it mitigates the representation bias associated with using a single-scale convolution kernel across varying magnifications, significantly improving the model’s feature representation capacity.
Similarly, the evaluation metrics for ‘EfficientNetB0-MSE + FC Loss’ consistently exceeded those for ‘EfficientNetB0-MSE’, demonstrating that the improved focal cosine loss function is primarily designed to address sample imbalance while simultaneously enhancing the model’s ability to aggregate significant features of intraclass variability and to separate features of interclass similarity. The evaluation metrics for ‘FCE-EfficientNetB0 + TL’ are the highest among all models, indicating that transfer learning can effectively improve the classification performance of the network. Through the pre-training process, the network acquires prior knowledge from ImageNet, positively impacting the classification of the BreakHis dataset.
Figure 7 illustrates the accuracy and loss curves for binary classification with the model under mixed magnification. The data show that the model rapidly converges within the first 60 training epochs, after which the convergence process becomes more gradual, ultimately reaching a final loss value of 0.005. This indicates that the model demonstrates strong stability and generalization capabilities.
The FCE-EfficientNetB0 model that we propose demonstrates significant advantages across several key performance metrics. Compared to traditional deep neural network models, FCE-EfficientNetB0 maintains a lower overhead in terms of both the parameter count and computational cost. Specifically, when compared to ResNet50 (23.51 M parameters, 4.13 G FLOPs) and Inceptionv3 (21.79 M parameters, 2.85 G FLOPs), our model has 49.85 M parameters and 0.82 G FLOPs. While its parameter count is similar to that of DenseNet121 (49.84 M), its computational cost is significantly lower than those of other traditional models. Notably, compared to EfficientNetB0 (4.01 M parameters, 0.41 G FLOPs), although FCE-EfficientNetB0 (ours) has a slightly increased parameter count, its computational cost increase remains within a reasonable range. Additionally, the MSE-MBConv structure employed in FCE-EfficientNetB0 effectively combines efficient convolution operations with an improved model design, enhancing the model’s expressive power while optimizing computational resource utilization. The results are shown in Table 4.

3.4. Contrast Test

We use EfficientNetB0 as the baseline network and employ transfer learning. The proposed loss function is used to train and compare four attention mechanisms: a convolutional block attention module (CBAM), CA, enhanced channel attention (ECA), and multiscale ELA. The evaluation of the feature extraction capabilities under mixed magnification factors covers both binary classification and eight-class classification tasks, with the comparisons based on metrics such as accuracy, precision, recall, and the F1-score. The goal of this experiment is to identify an attention mechanism suitable for breast cancer tissue pathology image classification. The results for classification are illustrated in Figure 8, from which we observe the following.
In both binary and eight-class tasks across magnifications of 40×, 100×, 200×, and 400×, our proposed improved multiscale ELA consistently outperformed other mechanisms, achieving the highest metrics for accuracy, precision, recall, and the F1-score. The outstanding performance of our model is due to its ability to capture complex spatial and channel features, particularly at higher magnification levels. CA demonstrated subpar performance at increased magnifications, revealing its limitations in capturing detailed spatial features. Although ECA also exhibited strong performance, it lagged behind multiscale ELA in the more complex eight-class task, especially in terms of precision and recall. The CBAM’s performance was suboptimal due to its inability to model long-range dependencies, which diminished the channel dimensions of the input feature map. Therefore, the proposed multiscale ELA effectively extracts features from pathological images, significantly enhancing the network’s performance to meet the classification requirements of breast cancer histopathology images.
In the focal cosine loss, the hyperparameter γ balances the contributions of the focal component and the cosine embedding component. After introducing class weights, the cosine embedding loss for each sample is multiplied by its corresponding weight, and the weighted losses are then averaged. To examine the sensitivity of γ, we evaluated a range of values on a binary classification task that used a mixed-magnification dataset. As illustrated in Figure 9, the FCE-EfficientNetB0 model achieved its highest accuracy of 98.56% when γ was set to 0.6. This configuration, which places greater emphasis on feature similarity information, significantly enhances the model’s discriminative performance.
Experiments were carried out on images at various magnification levels to evaluate the proposed focal cosine loss. Using our network as the backbone, breast cancer histopathology images were classified under three loss regimes: standard cross-entropy loss, focal loss, and the proposed focal cosine composite loss. Table 5 reports the classification accuracies for each. In these trials, focal cosine loss not only achieved the highest mean accuracy but also proved the most robust to changes in the dataset size, underlining its dual strengths in handling challenging examples and feature discrimination. By contrast, cross-entropy remains a solid baseline, closing the gap with the focal cosine loss only when very large sample sizes are available. Finally, using the focal loss in isolation may be insufficient to counteract the noise introduced by data augmentation—it typically needs to be paired with additional regularization or embedding constraints to remain competitive.
The confusion matrices for the FCE-EfficientNetB0 model on the test set are shown in Figure 10, with the rows representing predicted classes and the columns representing true classes. The values along the main diagonal indicate the number of correctly classified samples. It can be observed that, after using the focal cosine loss function, the FCE-EfficientNetB0 successfully classifies all subtypes of breast cancer, with low rates of both missed and false detections. This indicates that the proposed loss function better assists the model in distinguishing between similar categories.

3.5. Comparison with Other Methods

The model’s final evaluation is performed using the BreakHis dataset, comparing it against several state-of-the-art models. Table 6 presents the binary classification performance results of the FCE-EfficientNetB0 model alongside other methods at various magnifications.
FCE-EfficientNetB0 delivers superior performance across all magnifications for binary classification, achieving the highest accuracy scores of 99.34%, 98.86%, 99.14%, and 99.02% at 40×, 100×, 200×, and 400× magnifications, respectively. For example, Abdulaal A H, et al. [32] achieved 97.49% accuracy at 40× using VGG19 + SAM, while Dihin R A, et al. [33] reported 87% with Gabor-EfficientNetV2. Although DML [34] reached 97.87% accuracy at 40×, FCE-EfficientNetB0 consistently outperformed other models, especially at higher magnifications.
Furthermore, we also compared the models DenseNet-121, ResNet-50, Inceptionv3, and MobileNetV2, with their results presented in Table 6 and Table 7, covering both the two-class and eight-class classification tasks. These models are widely recognized in histopathology image analysis for their balance between performance and computational efficiency. Our experiments show that DenseNet-121 and ResNet-50 outperform traditional VGG architectures in terms of accuracy and the F1-score, while MobileNetV2 provides a lightweight alternative with competitive performance. FCE-EfficientNetB0 excels in key performance metrics, including precision, recall, and the F1-score. For example, Kaur A, et al. [34] reported an F1-score of 97.89% at 200× using DML, but FCE-EfficientNetB0 further raised the bar by achieving an F1-score of 99.13%, indicating a significant improvement in classification precision and recall balance.
The FCE-EfficientNetB0 model excels in eight-class classification tasks, as shown in Table 7, outperforming several state-of-the-art models across various magnifications. At 40× magnification, FCE-EfficientNetB0 achieves accuracy of 95.97%, significantly surpassing CNN models [39], which plateau between 88.23% and 90.14%. Even at higher magnifications, where models such as VGG19 + SVM [40] and MLF2-CNN [41] experience noticeable performance drops, FCE-EfficientNetB0 maintains a robust level of accuracy, particularly at 400× magnification, demonstrating its effectiveness in complex multi-class classification tasks.
Similar to its performance in binary classification, FCE-EfficientNetB0 exhibits superior precision, recall, and F1-scores across magnifications. For instance, it achieves an F1-score of 94.8% at 40× magnification, surpassing the previous best F1-score of 92% reported by Sharma et al. [40]. These results confirm the efficacy of FCE-EfficientNetB0 in addressing multi-class classification challenges.
Overall, the proposed FCE-EfficientNetB0 model demonstrates exceptional performance in both binary and multi-class classification tasks. Its outstanding performance in key metrics, along with its resilience to both balanced and imbalanced datasets, positions FCE-EfficientNetB0 as an exceptional tool for histopathological image analysis.

4. Discussion

The proposed FCE-EfficientNetB0 shows strong performance in both binary and multi-class classification tasks, but certain limitations must be considered for a balanced evaluation.
First, the model’s performance is closely tied to the dataset used in the experiments. Although high accuracy is achieved on the current dataset, its generalizability to other histopathological datasets with different imaging characteristics remains uncertain. Future work should include validation across diverse datasets to assess its robustness and adaptability in varying clinical settings.
Second, while EfficientNet balances efficiency and accuracy, training FCE-EfficientNetB0 on high-resolution images still demands substantial computational resources. This may limit its deployment in resource-constrained environments such as smaller hospitals or remote clinics. Future research could explore lightweight model compression techniques, quantization, or edge computing integration to reduce the computational costs without compromising the performance.
Additionally, challenges persist in multi-class classification at higher magnifications (e.g., 400×), where the model’s performance shows a slight decline. Although this drop is less pronounced compared to other models, further architectural refinements or the incorporation of attention mechanisms may enhance its sensitivity to subtle morphological differences at these magnifications.
Looking ahead, the proposed approach has the potential to be extended beyond breast cancer histopathology. With appropriate adaptation, the model could support screening and diagnosis workflows in other cancer types or be integrated into AI-assisted pathology platforms for real-time decision support. Moreover, coupling the model with emerging modalities such as multi-omics data or explainable AI techniques may offer more comprehensive and interpretable diagnostic tools, promoting clinical adoption and personalized medicine.
In summary, while FCE-EfficientNetB0 performs effectively, addressing its current limitations and pursuing these future directions will improve its robustness, scalability, and impact on real-world histopathological analysis and clinical workflows.

5. Conclusions

This study introduces the FCE-EfficientNetB0 model for breast cancer histopathology image classification using the BreakHis dataset. By incorporating the multiscale ELA module and an enhanced focal cosine loss function, the model addresses key challenges such as class imbalance and complex tissue representation across different magnifications.
The FCE-EfficientNetB0 model achieved over 98% accuracy in binary classification, peaking at 99.34% at 40× magnification, with strong precision, recall, and F1-scores. Multi-class classification posed greater difficulty, with the accuracy dropping from 95.97% at 40× to 92.81% at 100× magnification, but the inclusion of mixed-magnification datasets improved the overall performance to 92.23%. The improved focal cosine loss function mitigated the class imbalance, particularly enhancing the performance on underrepresented cancer subtypes. Meanwhile, the multiscale ELA module effectively captured multi-resolution features, improving the classification in challenging image backgrounds.
Despite these achievements, eight-class classification at higher magnifications remains an area for improvement. Future work should explore advanced techniques to preserve features at high magnifications and diversify the datasets to improve the model’s generalization.

Author Contributions

Conceptualization, M.L. and Y.P.; methodology, M.L., Y.P. and M.W.; validation, M.W. and J.W.; writing—review and editing, Y.P.; visualization, Y.P. and J.W.; supervision, M.W.; funding acquisition, J.W. All authors have read and agreed to the published version of the manuscript.

Funding

This research was funded by the Natural Science Foundation of Hubei Province, grant number 2022CFA007, and the Hubei Province Centralized Guided Local Science and Technology Development Funds Project, grant number 2023EGA027.

Institutional Review Board Statement

This study was conducted in accordance with the Declaration of Helsinki, and the protocol was approved by the Ethics Committee of Hubei University of Technology (HBUT20250009) on 18 April 2025.

Informed Consent Statement

Not applicable.

Data Availability Statement

The public data used can be accessed through the Breast Cancer Histopathological Database (BreakHis), and the only condition for its use is to cite [31] (in our References).

Conflicts of Interest

All authors declare no conflicts of interest.

References

  1. Huang, S.; Yang, J.; Fong, S.; Zhao, Q. Artificial intelligence in cancer diagnosis and prognosis: Opportunities and challenges. Cancer Lett. 2020, 471, 61–71. [Google Scholar] [CrossRef]
  2. Siegel, R.L.; Giaquinto, A.N.; Jemal, A. Cancer statistics 2024. CA A Cancer J. Clin. 2024, 74, 12–49. [Google Scholar] [CrossRef]
  3. Massafra, R.; Bove, S.; Lorusso, V.; Biafora, A.; Comes, M.C.; Didonna, V.; Diotaiuti, S.; Fanizzi, A.; Nardone, A.; Nolasco, A.; et al. Radiomic feature reduction approach to predict breast cancer by contrast-enhanced spectral mammography images. Diagnostics 2021, 11, 684. [Google Scholar] [CrossRef]
  4. Litjens, G.; Kooi, T.; Bejnordi, B.E.; Setio, A.A.A.; Ciompi, F.; Ghafoorian, M.; van der Laak, J.A.W.M.; van Ginneken, B.; Sánchez, C.I. A survey on deep learning in medical image analysis. Med. Image Anal. 2017, 42, 60–88. [Google Scholar] [CrossRef]
  5. Campanella, G.; Hanna, M.G.; Geneslaw, L.; Miraflor, A.; Silva, V.W.K.; Busam, K.J.; Brogi, E.; Reuter, V.E.; Klimstra, D.S.; Fuchs, T.J. Clinical-grade computational pathology using weakly supervised deep learning on whole slide images. Nat. Med. 2019, 25, 1301–1309. [Google Scholar] [CrossRef]
  6. Senousy, Z.; Abdelsamea, M.M.; Gaber, M.M.; Abdar, M.; Acharya, U.R.; Khosravi, A.; Nahavandi, S. MCUa: Multi-level context and uncertainty aware dynamic deep ensemble for breast cancer histology image classification. IEEE Trans. Biomed. Eng. 2021, 69, 818–829. [Google Scholar] [CrossRef]
  7. Venugopal, A.; Sreelekshmi, V.; Nair, J.J. Ensemble Deep Learning Model for Breast Histopathology Image Classification. In ICT Infrastructure and Computing: Proceedings of ICT4SD 2022; Springer Nature: Singapore, 2022; pp. 499–509. [Google Scholar]
  8. Man, R.; Yang, P.; Xu, B. Classification of breast cancer histopathological images using discriminative patches screened by generative adversarial networks. IEEE Access 2020, 8, 155362–155377. [Google Scholar] [CrossRef]
  9. Seo, H.; Brand, L.; Barco, L.S.; Wang, H. Scaling multi-instance support vector machine to breast cancer detection on the BreaKHis dataset. Bioinformatics 2022, 38 (Suppl. 1), i92–i100. [Google Scholar] [CrossRef]
  10. Ortiz, S.; Rojas-Valenzuela, I.; Rojas, F.; Valenzuela, O.; Herrera, L.J.; Rojas, I. Novel methodology for detecting and localizing cancer area in histopathological images based on overlapping patches. Comput. Biol. Med. 2024, 168, 107713. [Google Scholar] [CrossRef]
  11. Bakshi, A.A.; Joarder, R.H.; Tasmi, S.T. Wavelet-Infused U-Net for Breast Ultrasound Image Segmentation. Ph.D. Thesis, Islamic University of Technology (IUT), Board Bazar, Gazipur, Bangladesh, 2024. [Google Scholar]
  12. Kang, D.U.; Chun, S.Y. Multi-Scale Curriculum Learning for Efficient Automatic Whole Slide Image Segmentation. In Proceedings of the 2022 IEEE International Conference on Big Data and Smart Computing (BigComp), Daegu, Republic of Korea, 17–20 January 2022; pp. 366–367. [Google Scholar]
  13. Tong, L.; Sha, Y.; Wang, M.D. Improving Classification of Breast Cancer by Utilizing the Image Pyramids of Whole-Slide Imaging and Multi-Scale Convolutional Neural Networks. In Proceedings of the 2019 IEEE 43rd Annual Computer Software and Applications Conference (COMPSAC), Milwaukee, WI, USA, 15–19 July 2019; Volume 1, pp. 696–703. [Google Scholar]
  14. Xie, P.; Li, T.; Li, F.; Zuo, K.; Zhou, J.; Liu, J. Multi-Scale Convolutional Neural Network for Melanoma Histopathology Image Classification. In Proceedings of the 2021 IEEE 3rd International Conference on Frontiers Technology of Information and Computer (ICFTIC), Qingdao, China, 12–14 November 2021; pp. 551–554. [Google Scholar]
  15. Hu, J.; Shen, L.; Sun, G. Squeeze-and-Excitation Networks. In Proceedings of the IEEE Conference on Computer Vision and Pattern Recognition, Salt Lake City, UT, USA, 18–22 June 2018; pp. 7132–7141. [Google Scholar]
  16. Li, X.; Wang, W.; Hu, X.; Yang, J. Selective Kernel Networks. In Proceedings of the IEEE/CVF Conference on Computer Vision and Pattern Recognition, Long Beach, CA, USA, 15–20 June 2019; pp. 510–519. [Google Scholar]
  17. Yu, D.; Lin, J.; Cao, T.; Chen, Y.; Li, M.; Zhang, X. SECS: An effective CNN joint construction strategy for breast cancer histopathological image classification. J. King Saud Univ.-Comput. Inf. Sci. 2023, 35, 810–820. [Google Scholar] [CrossRef]
  18. Hou, Q.; Zhou, D.; Feng, J. Coordinate Attention for Efficient Mobile Network Design. In Proceedings of the IEEE/CVF Conference on Computer Vision and Pattern Recognition, Nashville, TN, USA, 20–25 June 2021; pp. 13713–13722. [Google Scholar]
  19. Xu, W.; Wan, Y. ELA: Efficient local attention for deep convolutional neural networks. arXiv 2024, arXiv:2403.01123. [Google Scholar]
  20. Reza, M.S.; Ma, J. Imbalanced Histopathological Breast Cancer Image Classification with Convolutional Neural Network. In Proceedings of the 2018 14th IEEE International Conference on Signal Processing (ICSP), Beijing, China, 12–16 August 2018; pp. 619–624. [Google Scholar]
  21. Larrazabal, A.J.; Nieto, N.; Peterson, V.; Milone, D.H.; Ferrante, E. Gender imbalance in medical imaging datasets produces biased classifiers for computer-aided diagnosis. Proc. Natl. Acad. Sci. USA 2020, 117, 12592–12594. [Google Scholar] [CrossRef]
  22. Mosquera, C.; Ferrer, L.; Milone, D.H.; Luna, D.; Ferrante, E. Class imbalance on medical image classification: Towards better evaluation practices for discrimination and calibration performance. Eur. Radiol. 2024, 34, 7895–7903. [Google Scholar] [CrossRef]
  23. Salmi, M.; Atif, D.; Oliva, D.; Abraham, A.; Ventura, S. Handling imbalanced medical datasets: Review of a decade of research. Artif. Intell. Rev. 2024, 57, 273. [Google Scholar] [CrossRef]
  24. Edward, J.; Rosli, M.M.; Seman, A. A new multi-class rebalancing framework for imbalance medical data. IEEE Access 2023, 11, 92857–92874. [Google Scholar] [CrossRef]
  25. Chawla, N.V.; Bowyer, K.W.; Hall, L.O.; Kegelmeyer, W.P. SMOTE: Synthetic minority over-sampling technique. J. Artif. Intell. Res. 2002, 16, 321–357. [Google Scholar] [CrossRef]
  26. Lin, T.Y.; Goyal, P.; Girshick, R.; He, K.; Dollár, P. Focal Loss for Dense Object Detection. In Proceedings of the IEEE International Conference on Computer Vision, Venice, Italy, 22–29 October 2017; pp. 2980–2988. [Google Scholar]
  27. Meng, Z.; Zhao, Z.; Su, F. Multi-Classification of Breast Cancer Histology Images by Using Gravitation Loss. In Proceedings of the ICASSP 2019—2019 IEEE International Conference on Acoustics, Speech and Signal Processing (ICASSP), Brighton, Great Britain, 12–17 May 2019; pp. 1030–1034. [Google Scholar]
  28. Cao, B.; Li, L.; Ma, Y.; Ye, S.; Li, S.; He, X. RAANet: Residual Aggregation Attention Network for Classification of Small Intestinal Endoscopic Images. In Proceedings of the 2023 IEEE 12th Data Driven Control and Learning Systems Conference (DDCLS), Xiangtan, China, 12–14 May 2023; pp. 1014–1019. [Google Scholar]
  29. Hu, S.; Zhang, Z.; Yang, J. Handling Intra-Class Dissimilarity and Inter-Class Similarity for Imbalanced Skin Lesion Image Classification. In Proceedings of the International Joint Conference on Rough Sets, Krakow, Poland, 5–8 October 2023; Springer Nature: Cham, Switzerland, 2023; pp. 565–579. [Google Scholar]
  30. Tan, M.; Le, Q. Efficientnet: Rethinking model scaling for convolutional neural networks. arXiv 2019, arXiv:1905.11946. [Google Scholar]
  31. Spanhol, F.A.; Oliveira, L.S.; Petitjean, C.; Heutte, L. A dataset for breast cancer histopathological image classification. IEEE Trans. Biomed. Eng. 2015, 63, 1455–1462. [Google Scholar] [CrossRef]
  32. Abdulaal, A.H.; Yassin, R.A.; Valizadeh, M.; Abdulwahhab, A.H.; Jasim, A.M.; Mohammetd, A.J.; Jabir, H.J.; Albaker, B.M.; Dheyaa, N.H.; Amirani, M.C. Cutting-Edge CNN Approaches for Breast Histopathological Classification: The Impact of Spatial Attention Mechanisms. ShodhAI J. Artif. Intell. 2024, 1, 109–130. [Google Scholar] [CrossRef]
  33. Dihin, R.A. Breast Cancer Detection and Diagnosis Using Gabor Features and EfficientNetV2 Model. J. Al-Qadisiyah Comput. Sci. Math. 2024, 16, 290–299. [Google Scholar]
  34. Kaur, A.; Kaushal, C.; Sandhu, J.K.; Damaševičius, R.; Thakur, N. Histopathological image diagnosis for breast cancer diagnosis based on deep mutual learning. Diagnostics 2023, 14, 95. [Google Scholar] [CrossRef]
  35. He, K.; Zhang, X.; Ren, S.; Sun, J. Deep residual learning for image recognition. In Proceedings of the IEEE Conference on Computer Vision and Pattern Recognition, Las Vegas, NV, USA, 27–30 June 2016; pp. 770–778. [Google Scholar]
  36. Sandler, M.; Howard, A.; Zhu, M.; Zhmoginov, A.; Chen, L.C. Mobilenetv2: Inverted Residuals and Linear Bottlenecks. In Proceedings of the IEEE Conference on Computer Vision and Pattern Recognition, Salt Lake City, UT, USA, 18–22 June 2018; pp. 4510–4520. [Google Scholar]
  37. Huang, G.; Liu, Z.; Van Der Maaten, L.; Weinberger, K.Q. Densely Connected Convolutional Networks. In Proceedings of the IEEE Conference on Computer Vision and Pattern Recognition, Honolulu, HI, USA, 21–26 July 2017; pp. 4700–4708. [Google Scholar]
  38. Szegedy, C.; Vanhoucke, V.; Ioffe, S.; Shlens, J.; Wojna, Z. Rethinking the Inception Architecture for Computer Vision. In Proceedings of the IEEE Conference on Computer Vision and Pattern Recognition, Las Vegas, NV, USA, 27–30 June 2016; pp. 2818–2826. [Google Scholar]
  39. Bardou, D.; Zhang, K.; Ahmad, S.M. Classification of breast cancer based on histology images using convolutional neural networks. IEEE Access 2018, 6, 24680–24693. [Google Scholar] [CrossRef]
  40. Sharma, S.; Mehra, R. Conventional machine learning and deep learning approach for multi-classification of breast cancer histopathology images—a comparative insight. J. Digit. Imaging 2020, 33, 632–654. [Google Scholar] [CrossRef]
  41. Taheri, S.; Golrizkhatami, Z.; Basabrain, A.A.; Hazzazi, M.S. A comprehensive study on classification of breast cancer histopathological images: Binary versus multi-category and magnification-specific versus magnification-independent. IEEE Access 2024, 12, 50431–50443. [Google Scholar] [CrossRef]
Figure 1. The overall architecture of FCE-EfficientNetB0.
Information 16 00444 g001
Figure 2. Structure diagram of MSE-MBConv.
Information 16 00444 g002
Figure 3. Flowchart of breast cancer pathological image classification based on FCE-EfficientNetB0.
Information 16 00444 g003
Figure 4. Structure diagram of multiscale ELA.
Information 16 00444 g004
Figure 5. Lobular carcinoma histopathological images at different magnification levels (40×, 100×, 200×, 400×) from the BreakHis dataset.
Information 16 00444 g005
Figure 6. Data enhancement operations.
Information 16 00444 g006
Figure 7. Training and validation loss and accuracy curves of FCE-EfficientNetB0 for binary classification across mixed magnifications.
Information 16 00444 g007
Figure 8. (a) Binary classification performance across different attention mechanisms. (b) Eight-class classification performance across different attention mechanisms.
Information 16 00444 g008
Figure 9. The relationship between the λ value and model accuracy.
Information 16 00444 g009
Figure 10. FCE-EfficientNetB0 model confusion matrix.
Information 16 00444 g010
Table 1. Sample distribution of BreakHis dataset.
ClassSubtype40×100×200×400×Total
Benign (B)Adenosis (A)114113111106444
Fibroadenoma (F)2532602642371014
Phyllodes Tumor (PT)149150140130569
Tubular Adenoma (TA)109121108115453
Malignant (M)Ductal Carcinoma (DC)8649038967883451
Lobular Carcinoma (LC)156170163137626
Mucinous Carcinoma (MC)205222196169792
Papillary Carcinoma (PC)145142135138560
Total 19952081201318207909
Table 2. Binary classification results for images at different magnifications.
MagnificationMethodMetric (%)
AccuracyPrecisionRecallF1-Score
40×EfficientNetB089.22 ± 1.0887.84 ± 1.8887.08 ± 0.6287.38 ± 1.0
EfficientNetB0-MSE90.47 ± 1.2389.65 ± 0.9488.35 ± 2.6288.85 ± 1.70
EfficientNetB0-MSE + FC Loss 96.54 ± 0.5096.69 ± 0.9094.27 ± 0.1594.61 ± 0.50
FCE-EfficientNetB0 + TL 98.71 ± 0.6397.06 ± 0.6798.57 ± 0.2797.06 ± 0.97
100×EfficientNetB089.21 ± 2.4187.30 ± 2.3287.55 ± 3.8987.34 ± 3.13
EfficientNetB0-MSE91.37 ± 0.9889.32 ± 1.5191.18 ± 2.7790.14 ± 1.12
EfficientNetB0-MSE + FC Loss 95.33 ± 1.8094.71 ± 1.7795.57 ± 0.4595.66 ± 1.69
FCE-EfficientNetB0 + TL 98.65 ± 0.2197.28 ± 0.6697.51 ± 0.6397.26 ± 0.78
200×EfficientNetB092.81 ± 1.5391.85 ± 1.7991.33 ± 2.0991.54 ± 1.85
EfficientNetB0-MSE93.14 ± 0.6291.99 ± 0.6892.75 ± 1.2292.09 ± 0.76
EfficientNetB0-MSE + FC Loss 96.40 ± 0.8795.21 ± 1.0197.06 ± 0.5295.67 ± 0.89
FCE-EfficientNetB0 + TL 98.72 ± 0.4298.63 ± 0.6398.26 ± 0.7698.67 ± 0.46
400×EfficientNetB091.85 ± 1.4490.82 ± 2.1490.96 ± 1.9290.74 ± 1.60
EfficientNetB0-MSE92.03 ± 0.9990.96 ± 1.4891.53 ± 1.9591.03 ± 1.20
EfficientNetB0-MSE + FC Loss 96.35 ± 1.1596.01 ± 1.7097.24 ± 0.6797.14 ± 1.13
FCE-EfficientNetB0 + TL 98.74 ± 0.2898.16 ± 0.5998.52 ± 0.2398.53 ± 0.22
MixedEfficientNetB093.78 ± 0.6693.45 ± 0.1791.99 ± 1.4492.64 ± 0.89
EfficientNetB0-MSE94.22 ± 0.6093.94 ± 0.8493.08 ± 0.5293.25 ± 0.68
EfficientNetB0-MSE + FC Loss 95.50 ± 0.5696.85 ± 0.8196.31 ± 0.4997.57 ± 0.52
FCE-EfficientNetB0 + TL 98.59 ± 0.4098.56 ± 0.3298.36 ± 0.4198.26 ± 0.56
Table 3. Eight-class classification results for images at different magnifications.
MagnificationMethodMetric (%)
AccuracyPrecisionRecallF1-Score
40×EfficientNetB068.84 ± 0.8264.25 ± 2.9159.63 ± 2.2259.63 ± 3.32
EfficientNetB0-MSE76.94 ± 0.8972.21 ± 1.8369.87 ± 1.1670.33 ± 1.13
EfficientNetB0-MSE + FC Loss 86.23 ± 0.2390.98 ± 0.3888.26 ± 0.6589.31 ± 0.18
FCE-EfficientNetB0 + TL 95.17 ± 0.8095.52 ± 0.3495.78 ± 0.1794.43 ± 0.37
100×EfficientNetB065.83 ± 2.0762.13 ± 1.6763.78 ± 1.6562.11 ± 2.26
EfficientNetB0-MSE74.18 ± 1.3769.90 ± 1.2271.38 ± 1.4369.88 ± 1.23
EfficientNetB0-MSE + FC Loss 90.31 ± 0.8690.37 ± 0.2489.63 ± 0.6290.20 ± 0.72
FCE-EfficientNetB0 + TL 92.07 ± 0.7492.42 ± 0.2192.05 ± 0.7092.68 ± 0.95
200×EfficientNetB068.65 ± 1.1061.48 ± 1.4962.29 ± 1.3160.72 ± 1.35
EfficientNetB0-MSE73.20 ± 0.8867.14 ± 1.0565.60 ± 0.9765.75 ± 0.98
EfficientNetB0-MSE + FC Loss 88.44 ± 0.8986.44 ± 0.2486.74 ± 0.0886.88 ± 0.03
FCE-EfficientNetB0 + TL 90.45 ± 0.8788.67 ± 1.0688.50 ± 0.7990.35 ± 0.75
400×EfficientNetB066.48 ± 1.2059.04 ± 1.1056.76 ± 1.6057.05 ± 1.33
EfficientNetB0-MSE69.69 ± 1.1363.51 ± 1.4064.93 ± 2.7563.93 ± 1.77
EfficientNetB0-MSE + FC Loss 89.17 ± 0.5489.38 ± 0.9485.64 ± 0.4587.61 ± 0.43
FCE-EfficientNetB0 + TL 90.26 ± 0.1290.45 ± 0.3791.24 ± 0.2192.05 ± 0.31
MixedEfficientNetB078.49 ± 1.5974.69 ± 2.5275.18 ± 1.1374.44 ± 1.78
EfficientNetB0-MSE79.58 ± 0.6275.93 ± 0.8575.21 ± 0.9676.26 ± 0.89
EfficientNetB0-MSE + FC Loss 90.49 ± 0.9990.14 ± 0.7590.48 ± 0.0289.63 ± 0.94
FCE-EfficientNetB0 + TL 92.55 ± 0.6992.33 ± 0.2291.38 ± 0.8591.53 ± 0.83
Table 4. Comparative evaluation of model complexity metrics.
ModelBottleneckParameters (M)FLOPs (G)
ResNet50Residual23.514.13
Inceptionv3Conv21.792.85
DenseNet121Conv49.842.90
EfficientNetB0MBConv4.010.41
FCE-EfficientNetB0MSE-MBConv49.850.82
Table 5. Accuracy of different loss functions.
Loss Function40×100×200×400×Mean
Cross-Entropy Loss96.4996.6498.0197.897.24
Focal Loss95.3694.7295.2594.4994.96
Focal Cosine loss98.7198.6598.7298.7498.70
Table 6. Comparison of binary classification performance with that of other methods at different magnifications.
ReferenceMethodMagnificationAccuracy (%)Precision (%)Recall (%)F1-Score (%)
Abdulaal A H, et al. [32]VGG19 + SAM40×97.4996.8095.2896.03
100×96.7195.6894.3395
200×96.0394.4092.9193.65
400×97.5395.7696.5896.17
Dihin R A, et al. [33]Gabor-
EfficientNetV2
40×8785.687.0186.88
100×93.590.309593.8
200×94.192.4094.7994.78
400×96.392.9097.398.52
Kaur A, et al. [34]DML40×97.8797.5692.5697.89
100×98.5695.3895.4598.34
200×98.3498.6598.3197.89
400×96.5499.7196.4499.44
He K, et al. [35]ResNet5040×84.7182.2082.3482.27
100×87.5.86.4483.7084.86
200×89.3389.1285.4486.95
400×88.7488.3385.4986.68
Sandler M, et al. [36] MobileNetv240×97.2497.4497.9397.50
100×97.8497.2097.8097.49
200×97.0297.4095.6496.46
400×98.0897.3598.3697.83
Huang G, et al. [37]DenseNet12140×84.7182.2082.3482.27
100×87.5.86.4483.7084.86
200×89.3389.1285.4486.95
400×88.7488.3385.4986.68
Szegedy C, et al. [38]Inceptionv340×95.2494.9393.9294.40
100×94.9693.8894.4394.14
200×96.3895.3995.9895.68
400×95.3394.4394.0094.71
This paperFCE-EfficientNetB040×98.71 ± 0.6397.06 ± 0.6798.57 ± 0.2797.06 ± 0.97
100×98.65 ± 0.2197.28 ± 0.6697.51 ± 0.6397.26 ± 0.78
200×98.72 ± 0.4298.63 ± 0.6398.26 ± 0.7698.67 ± 0.46
400×98.74 ± 0.2898.16 ± 0.5998.52 ± 0.2398.53 ± 0.22
Table 7. Comparison of eight-class classification performance with that of other methods at different magnifications.
ReferenceMethodMagnificationAccuracy (%)Precision (%)Recall (%)F1-Score (%)
Bardou et al. [39]Ensemble CNN model40×88.2384.2783.7983.74
100×84.6484.2984.4884.31
200×83.3181.8580.8380.48
400×83.9880.8481.0380.63
Sharma et al. [40]VGG19 + SVM (L, 1)
(balanced + augmented data)
40×92.6492.0092.0092.00
100×91.2591.0091.0091.00
200×81.4282.0082.0082.00
400×80.8482.0081.0082.00
Taheri et al. [41]MLF2-CNN40×90.1488.5782.7686
100×91.3888.0286.9686
200×91.4588.187.1490
400×89.988.5782.7686
He K, et al. [35]ResNet5040×83.1679.2186.6179.92
100×86.8379.6683.0485.01
200×80.7980.6283.7986.69
400×80.7181.5580.2379.33
Sandler M, et al. [36] MobileNetv240×89.2285.8486.4287.37
100×85.6184.6984.1784.06
200×87.3486.9086.1085.25
400×85.2383.1184.8383.68
Huang G, et al. [37]DenseNet12140×87.9785.3186.4186.43
100×85.6182.0382.5383.23
200×85.1684.8382.6581.96
400×84.2083.6483.7983.15
Szegedy C, et al. [38]Inceptionv340×85.4683.0382.2382.14
100×83.2181.7780.3580.15
200×81.8988.7687.2587.02
400×88.0283.5283.2383.29
This paperFCE-EfficientNetB040×95.17 ± 0.8095.52 ± 0.3495.78 ± 0.1794.43 ± 0.37
100×92.07 ± 0.7492.42 ± 0.2192.05 ± 0.7092.68 ± 0.95
200×90.45 ± 0.8788.67 ± 1.0688.50 ± 0.7990.35 ± 0.75
400×90.26 ± 0.1290.45 ± 0.3791.24 ± 0.2192.05 ± 0.31
Disclaimer/Publisher’s Note: The statements, opinions and data contained in all publications are solely those of the individual author(s) and contributor(s) and not of MDPI and/or the editor(s). MDPI and/or the editor(s) disclaim responsibility for any injury to people or property resulting from any ideas, methods, instructions or products referred to in the content.

