
Enhancing Customer Segmentation Through Factor Analysis of Mixed Data (FAMD)-Based Approach Using K-Means and Hierarchical Clustering Algorithms


Abstract

1. Introduction
1.1. Motivation and Research Gap
- Applying Eta correlation ratio filtering to select meaningful features;
- Using FAMD for dimensionality reduction;
- Conducting a comparative evaluation of K-means and Agglomerative Clustering using the Silhouette Score.
1.2. Research Contribution
2. Background and Significance of This Study
2.1. Traditional Customer Segmentation Approaches
2.1.1. Demographic Segmentation
2.1.2. Geographic Segmentation
2.1.3. Behavioral Segmentation
2.1.4. Psychographic Segmentation
2.2. Machine Learning in Customer Segmentation
2.2.1. K-Means Clustering
2.2.2. Agglomerative Hierarchical Clustering
2.2.3. Comparison with Other Algorithms
2.3. FAMD
2.4. Research Gaps and Significance
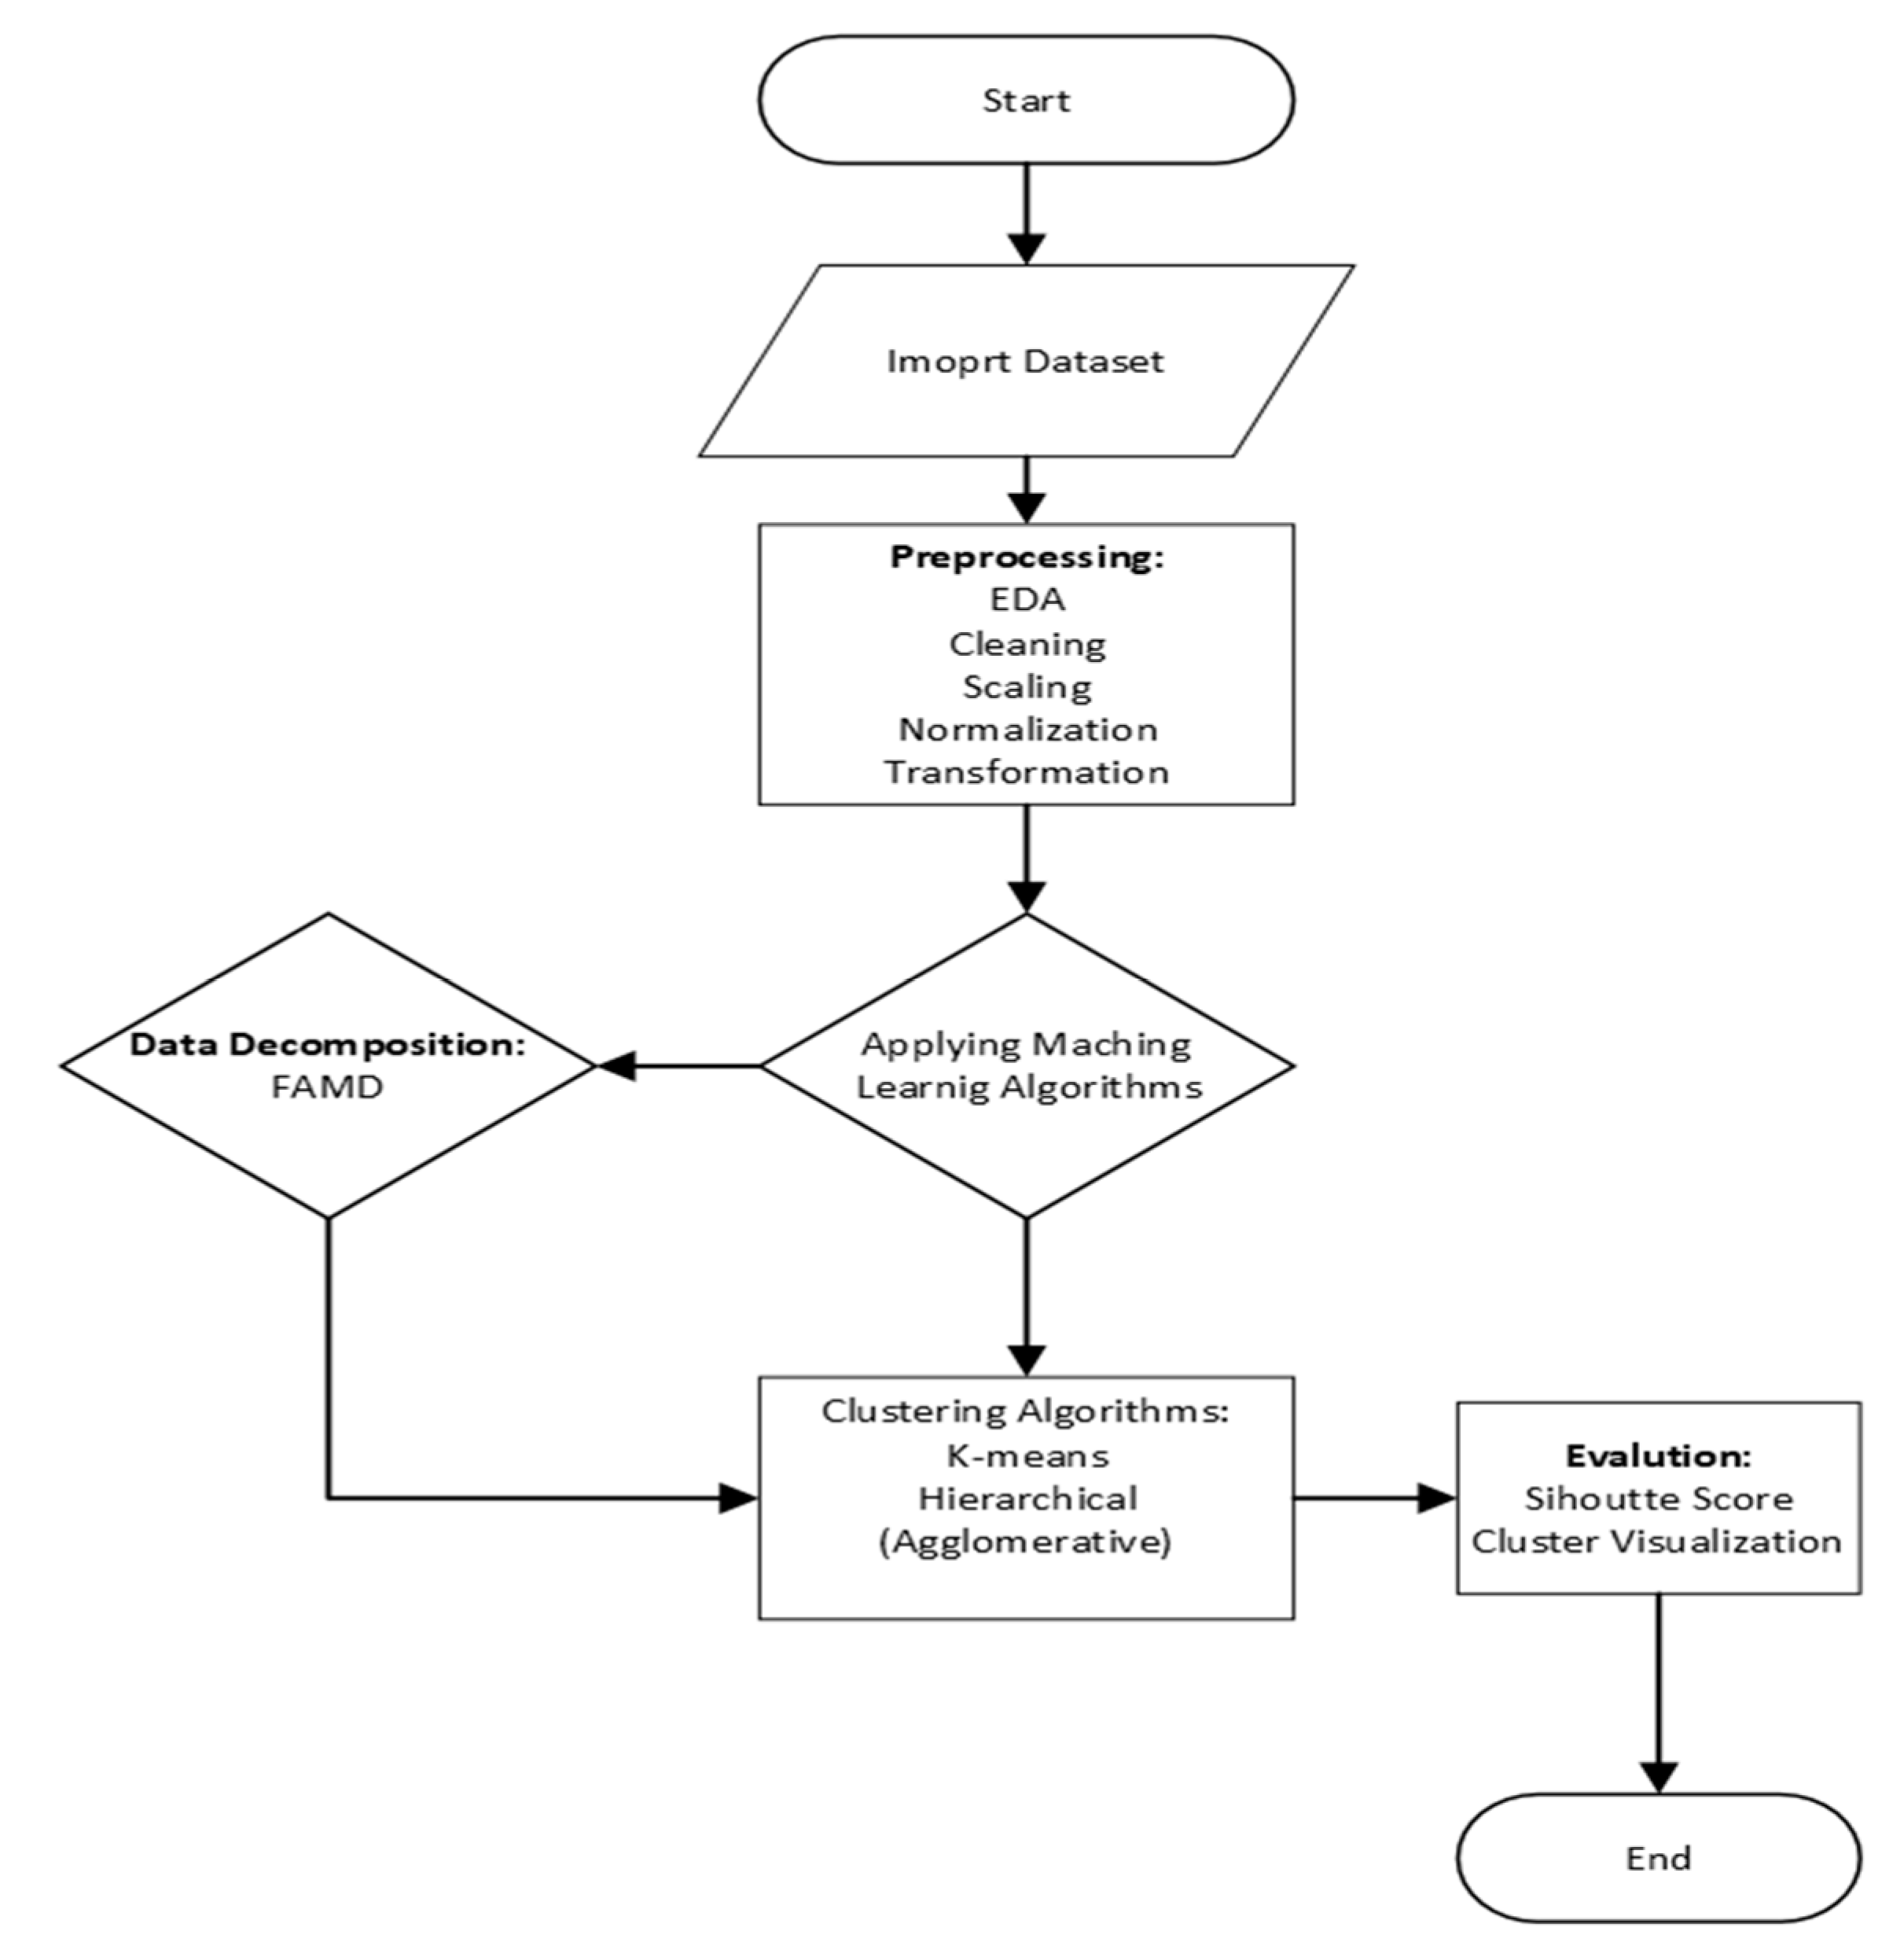
3. Proposed Methodology
3.1. Dataset Overview
3.2. Dataset Selection Rationale
3.3. Dataset Preprocessing
3.3.1. Missing Value Handling
3.3.2. Outlier Treatment
3.3.3. Data Harmonization for FAMD and Clustering
3.3.4. FAMD-Based Feature Transformation
3.4. Comparative Datasets
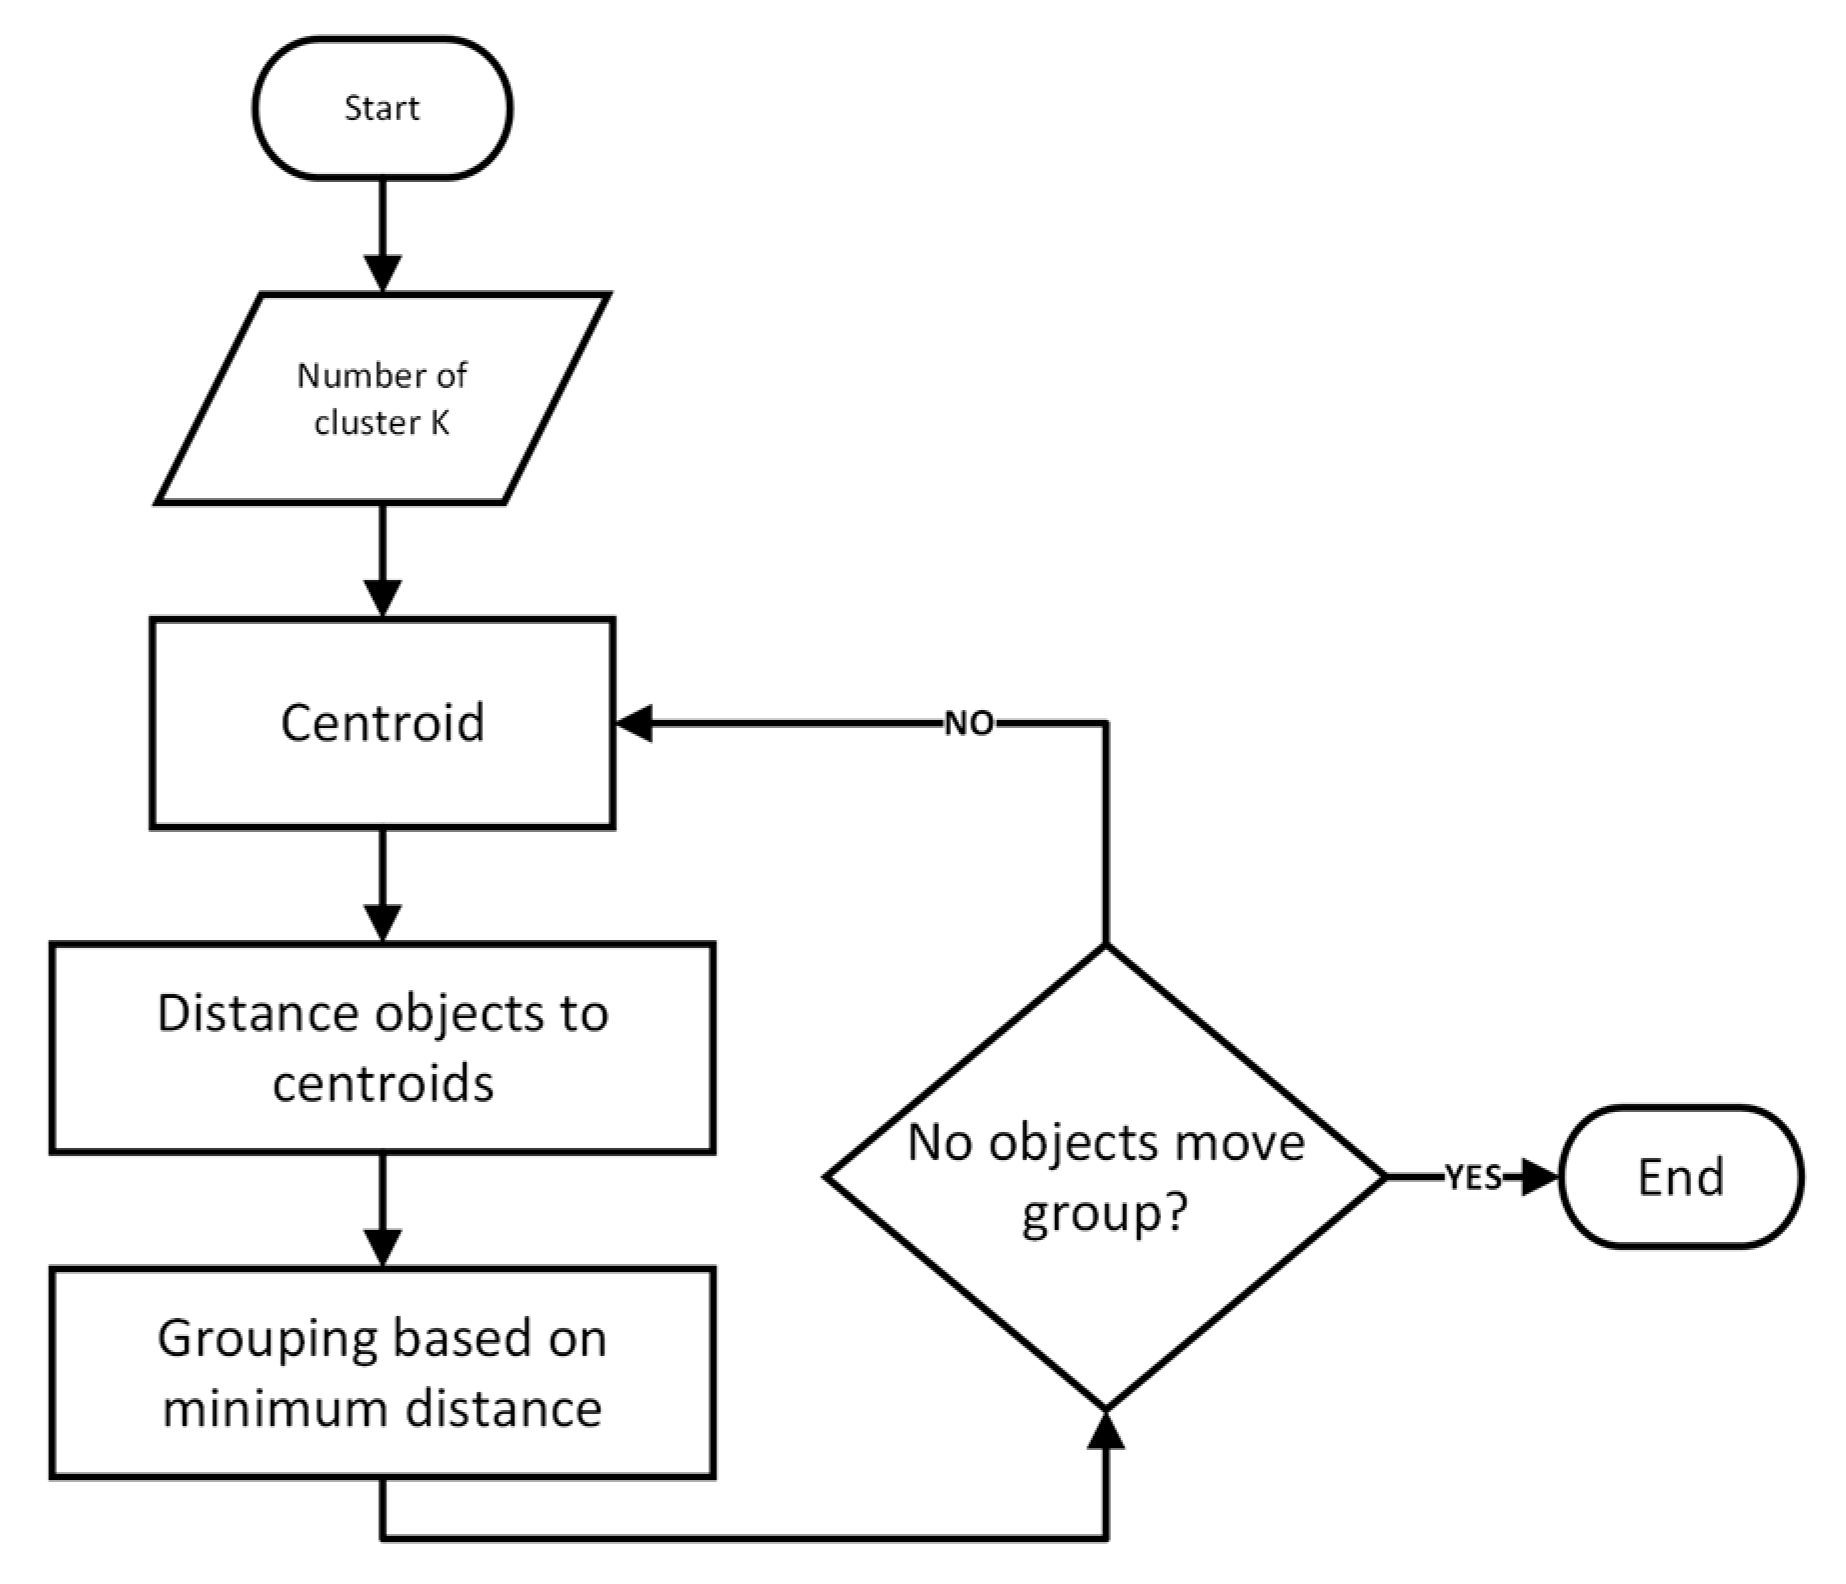
3.5. K-Means Algorithm
- Initialization: randomly select K data points from the dataset as the initial cluster centroids: μ1, μ2, …, μk;
- Assignment step: for each data point xi, calculate its distance to each centroid using the Euclidean distance formula. The point is assigned to the cluster with the nearest centroid as defined in Equation (1):In Equation (1), Ci represents the cluster assignment for data point xi, and µk represents the centroid of cluster;
- Update step: recompute the centroids of each cluster by calculating the mean of all data points assigned to it, as shown in Equation (2):where Ck is the set of points assigned to cluster k, and |Ck| is the number of points in that cluster;
- Convergence check: the algorithm repeats the Assignment and Update steps iteratively until one of the following conditions is met:
- The centroids do not change significantly between iterations (convergence);
- A predefined maximum number of iterations is reached.
When convergence is achieved, the algorithm outputs the final cluster centroids and the assignment of each data point to its respective cluster; - Objective function (WCSS minimization): K-means optimizes the clustering by minimizing the Within-Cluster Sum of Squares (WCSS), represented mathematically in Equation (3):whereK is the total number of clusters;Ck is the set of points assigned to cluster k;µk is the centroid of cluster k;||xi − µk|| is the Euclidean distance between a point and its corresponding centroid µk.
3.6. Agglomerative Algorithm
- Initialization: the algorithm begins with each data point as its own individual cluster:where xi represents each data point and n is the total number of data points;C = {{x1}, {x2}, …, {xn}}
- Distance calculation: the distance between every pair of clusters is computed using a specified linkage criterion. Common distance measures include:
- Single Linkage (Minimum Distance): Single Linkage, also known as the Minimum Distance method, defines the distance between two clusters as the minimum distance between any two points in the respective clusters. This method tends to create “chain-like” clusters and is sensitive to outliers as shown in Equation (4).whereCi and Cj are the clusters;x and y are points in clusters Ci and Cj, respectively;d(x,y) is the distance between points x and y;
- Complete Linkage (Maximum Distance): We also considered the Complete Linkage method, which defines the distance between two clusters as the maximum distance between any two points in the respective clusters. This method tends to produce more compact and spherical clusters, making it robust to outliers as shown in Equation (5).
- Average Linkage (Mean Distance): Average Linkage, or the Mean Distance method, defines the distance between two clusters as the average distance between all pairs of points in the respective clusters as shown in Equation (6). This method provides a balance between the Single and Complete Linkage methods.
- Centroid Linkage: Centroid Linkage defines the distance between two clusters as the distance between their centroids as shown in Equation (7). The centroid of a cluster is the mean position of all the points in that cluster. This method is also known as the UPGMA (Unweighted Pair Group Method with Arithmetic Mean) when applied to hierarchical clustering.
- Merging clusters: find the pair of clusters Ci and Cj with the smallest distance according to the chosen linkage criterion and merge them:Cij = Ci ∪ CjUpdate the set of clusters:C ← (C\{Ci, Cj)}) ∪ {Cij}
- Iterative process: repeat Steps 2 and 3 iteratively:
- Recalculate distances between the newly formed cluster and all remaining clusters;
- Merge the closest clusters.This process continues until one of the following occurs:
- Only a single cluster remains, representing the entire dataset;
- A predefined number of clusters k is reached.
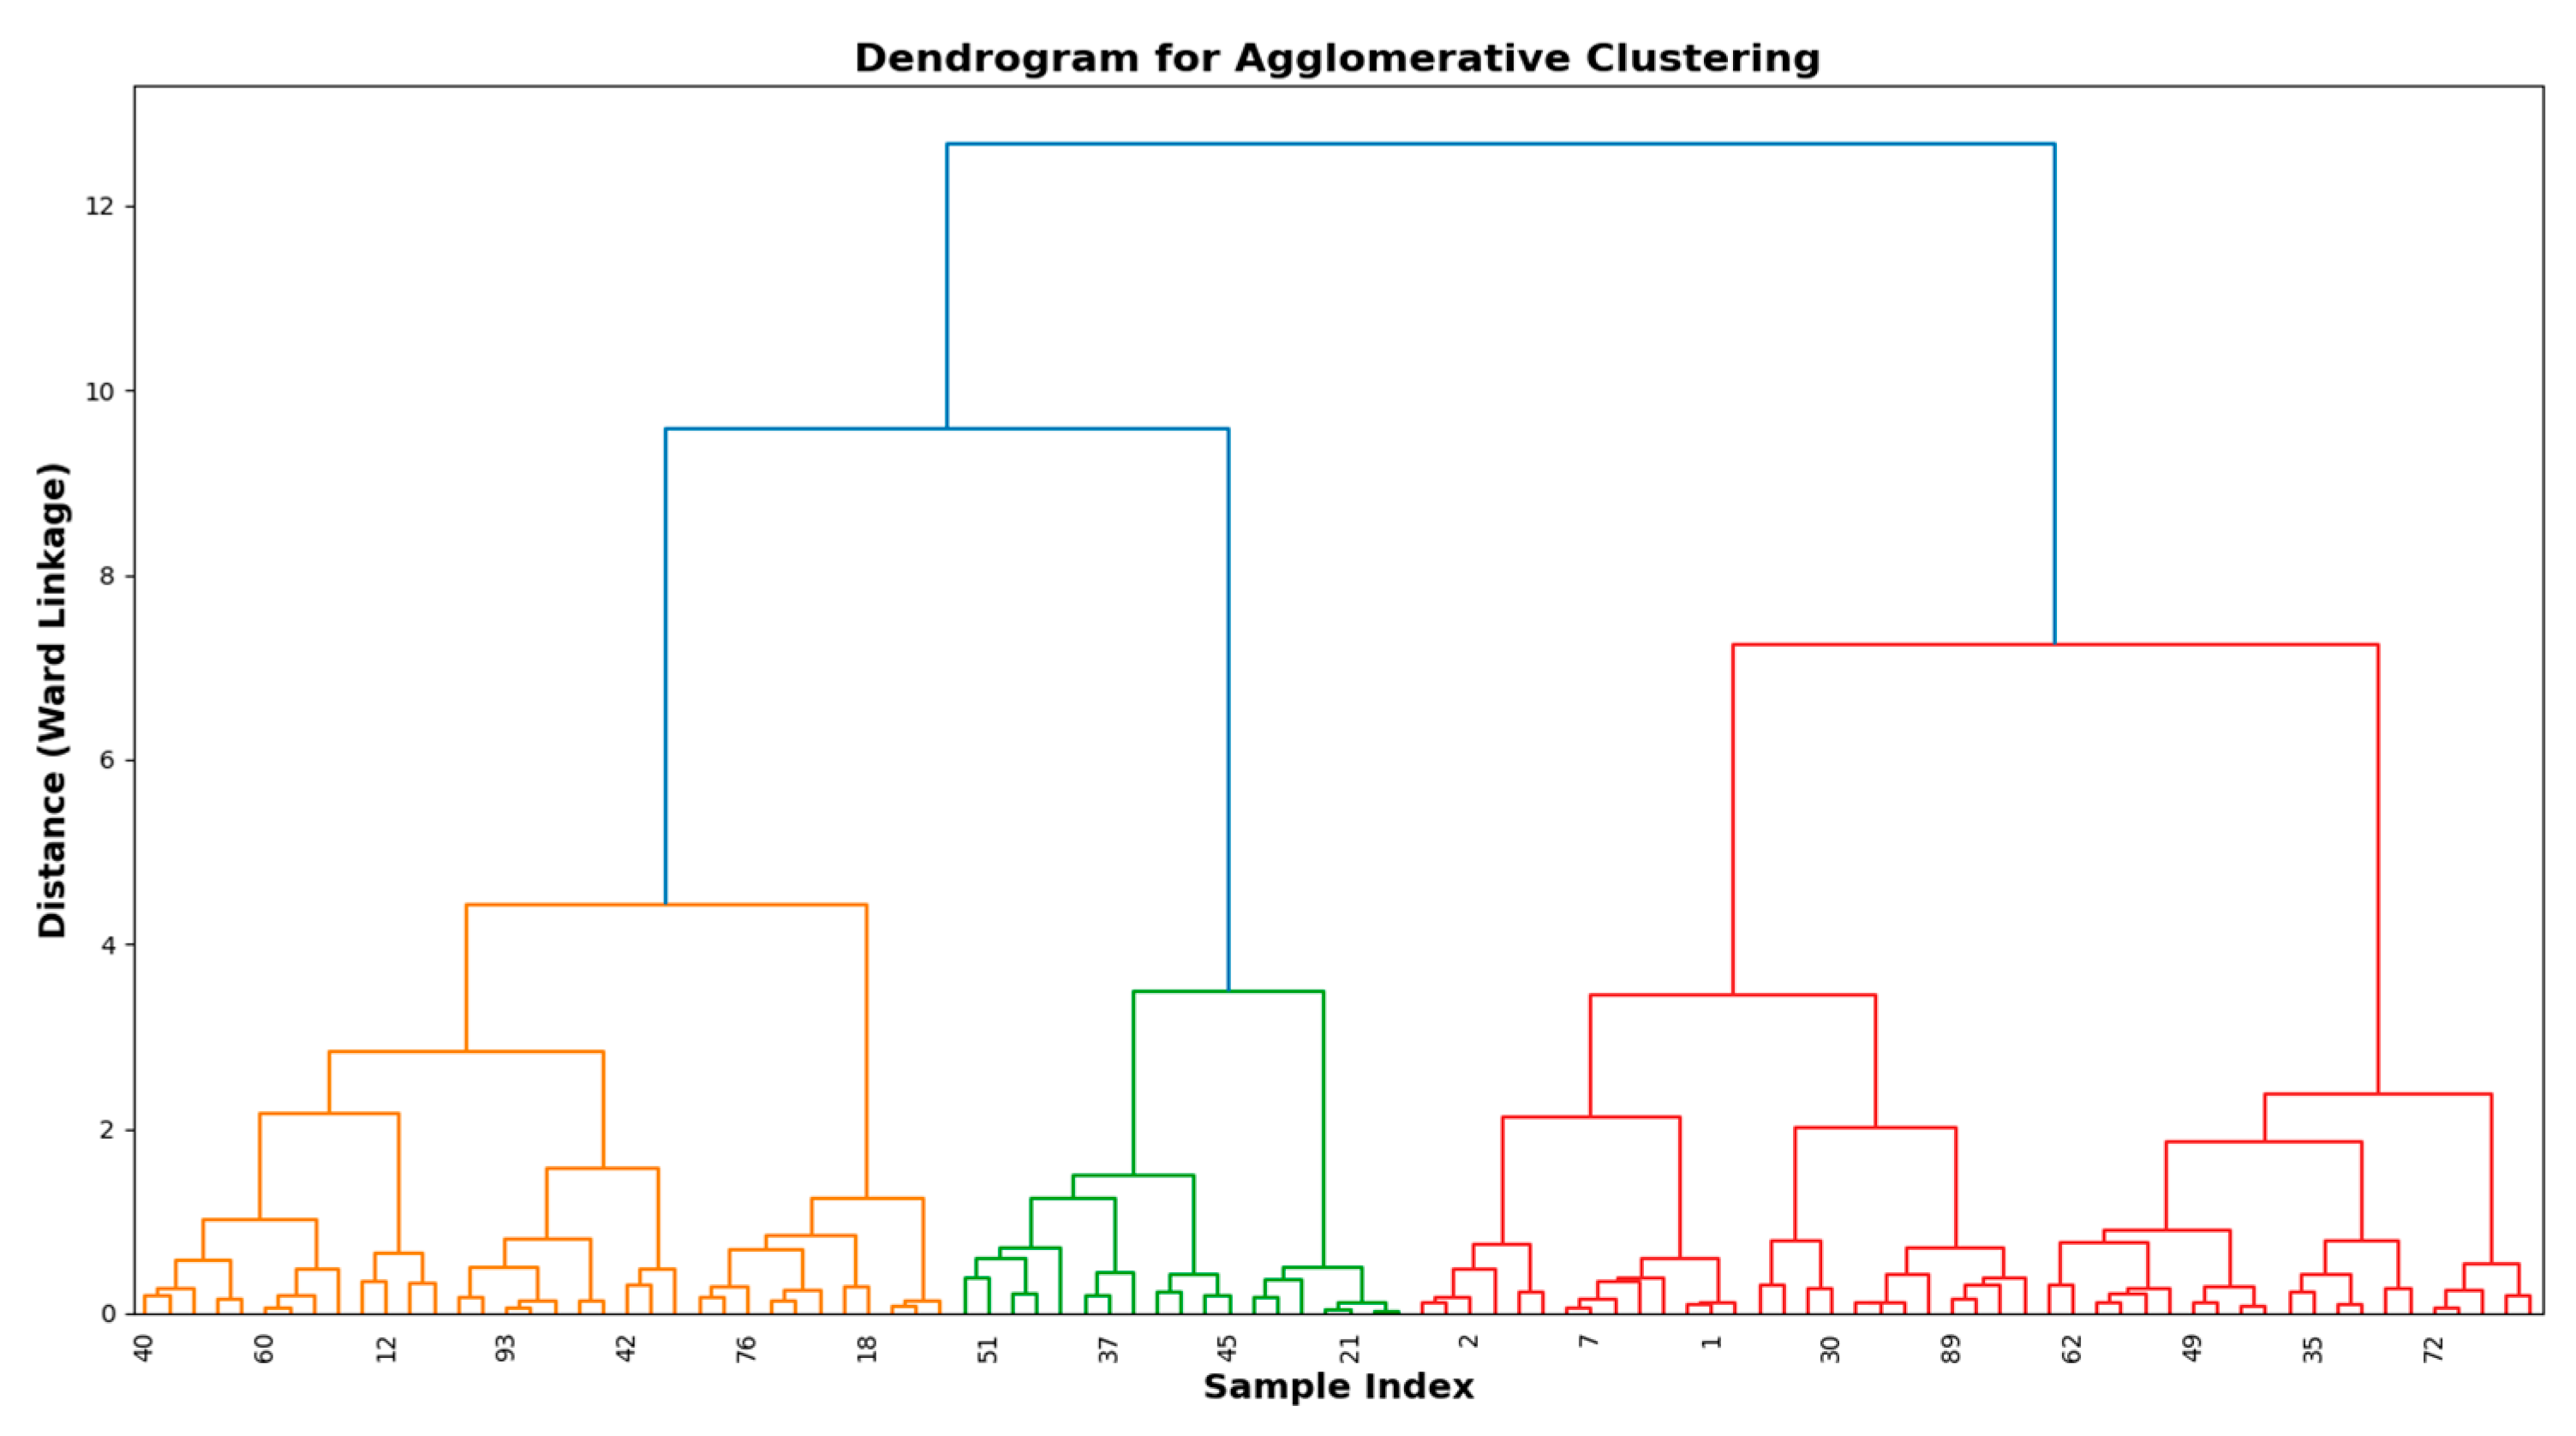
- Dendrogram representation: the complete Agglomerative Clustering process is represented using a dendrogram (Figure 4), which illustrates the hierarchical merging of clusters and can be cut at different levels to achieve the desired number of clusters.
3.7. Validation Metrics
3.7.1. Silhouette Score
- a(i) is the average distance from point i to all other points within the same cluster (cohesion);
- b(i) is the minimum average distance from point i to all points in the nearest neighboring cluster (separation).
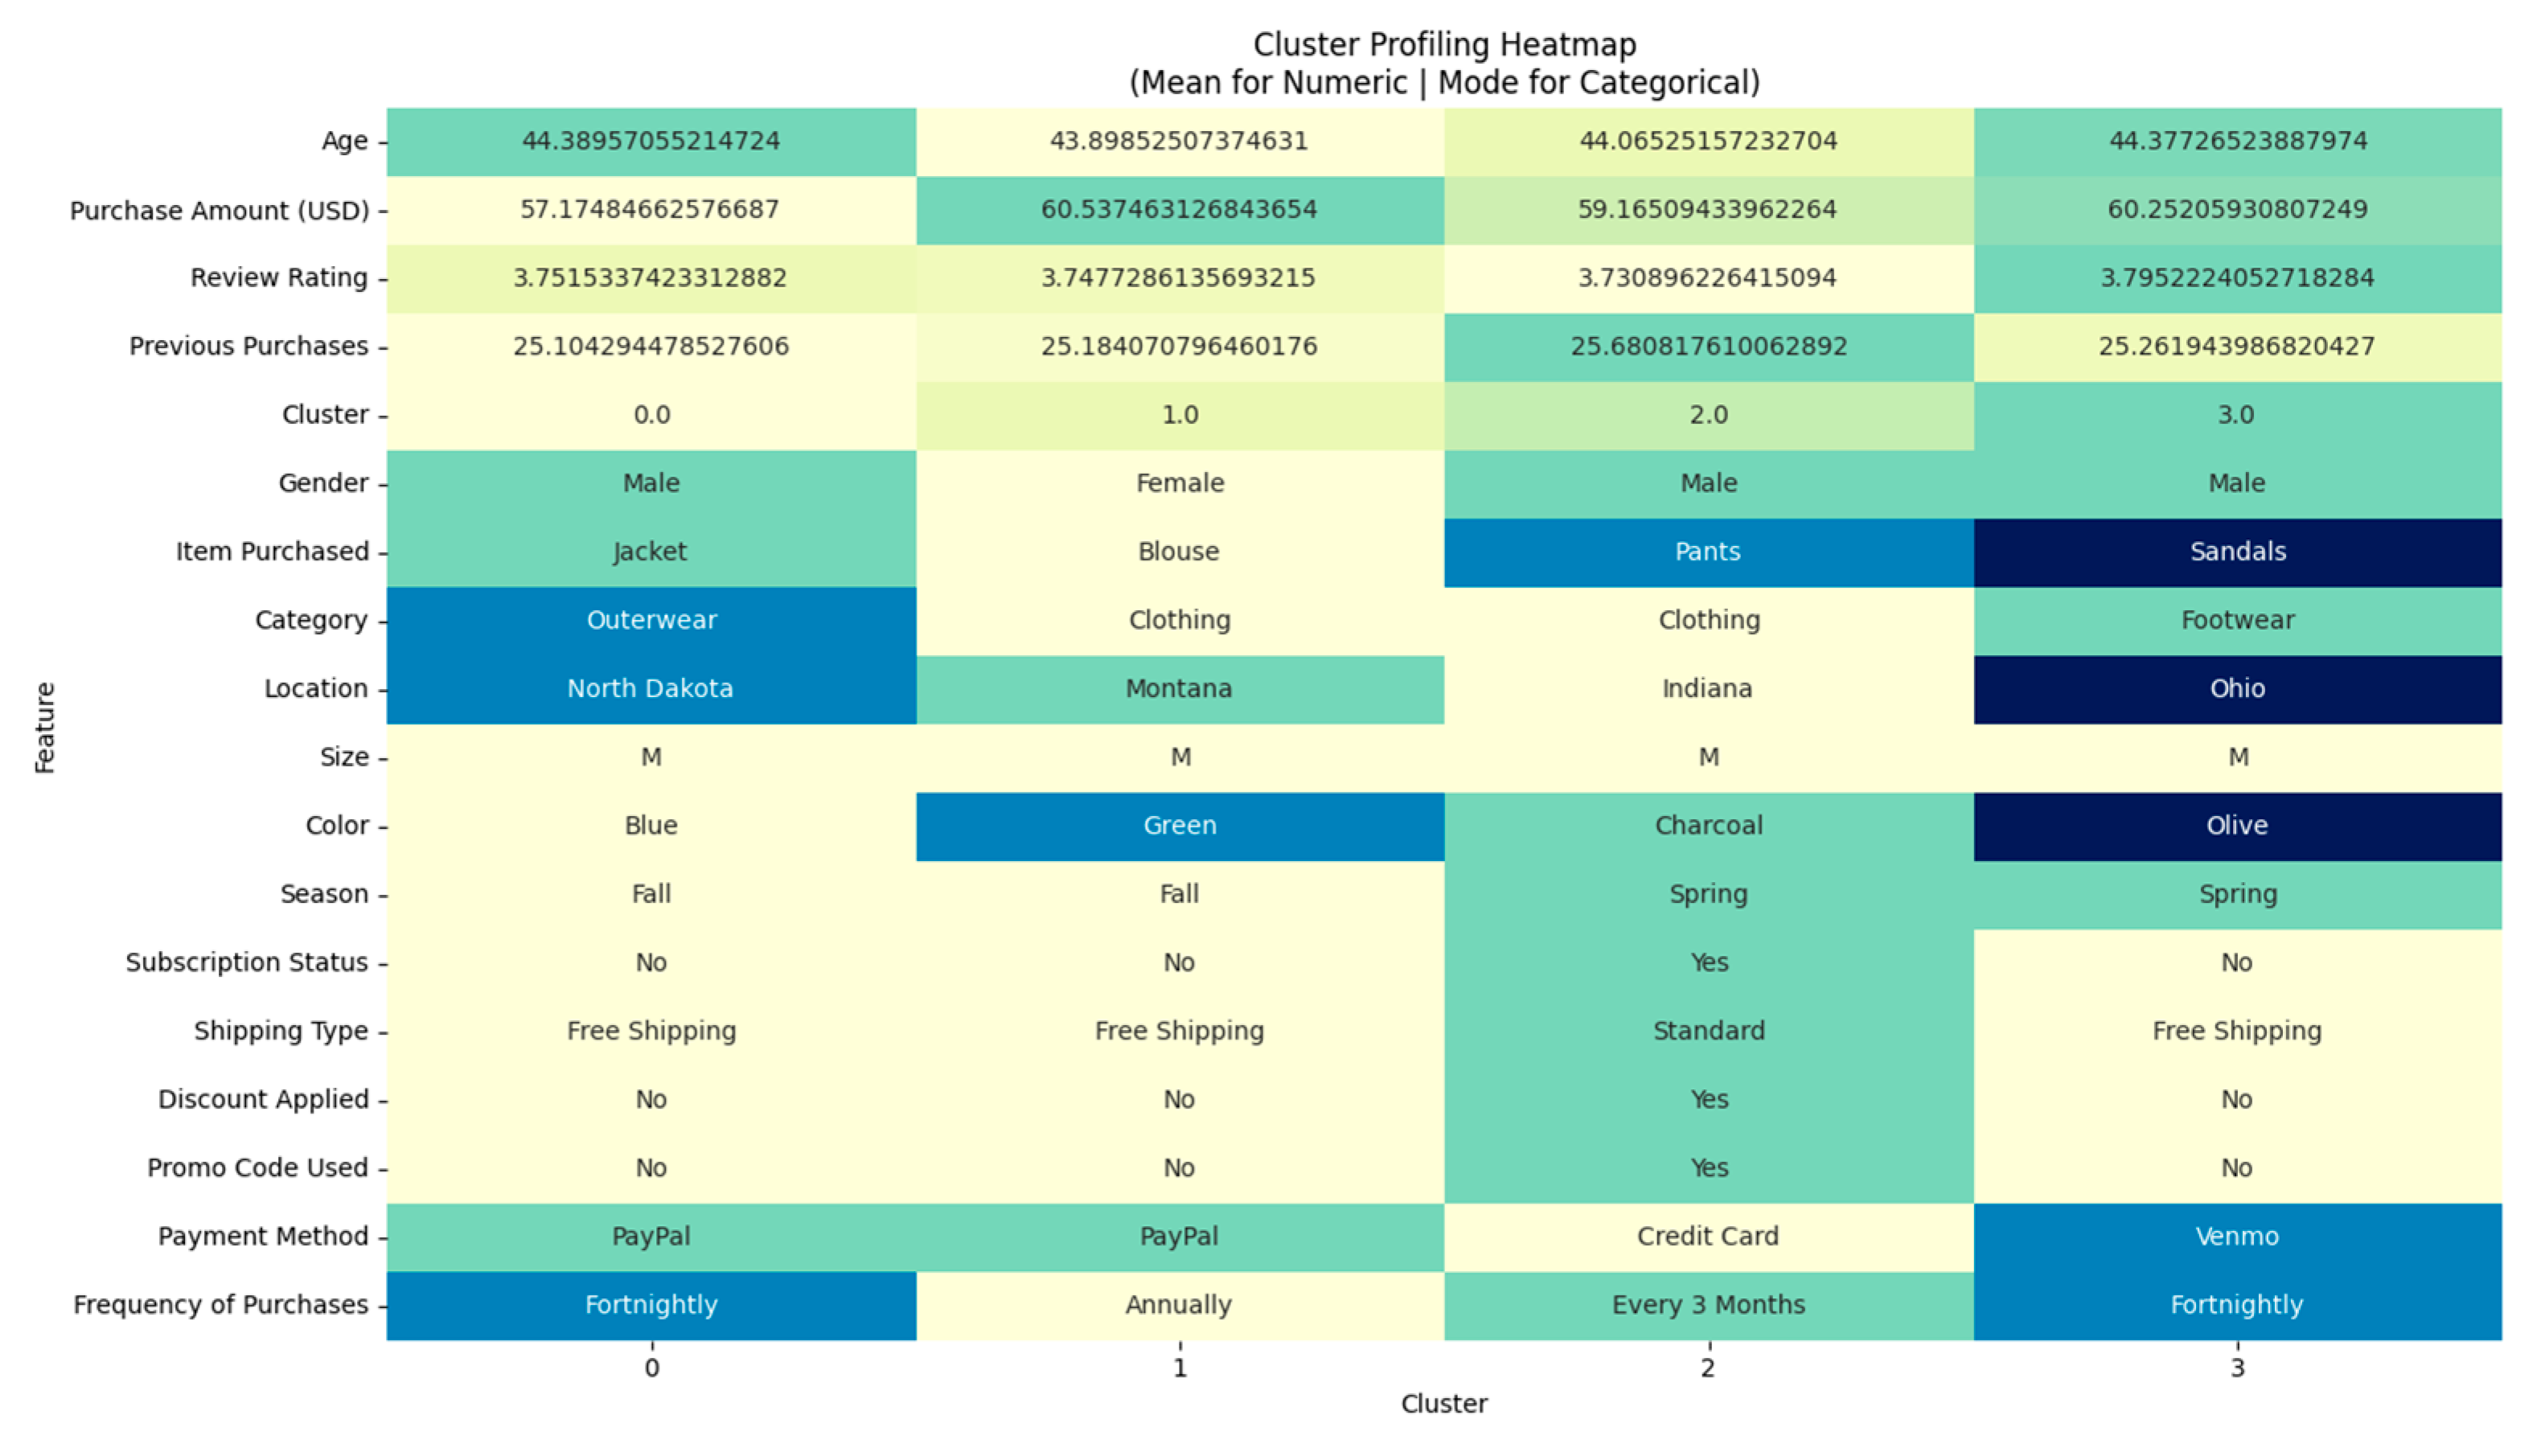
3.7.2. Cluster Profiling
3.8. Ethical Considerations
3.8.1. Bias Mitigation
3.8.2. Transparency
4. Experimental Findings
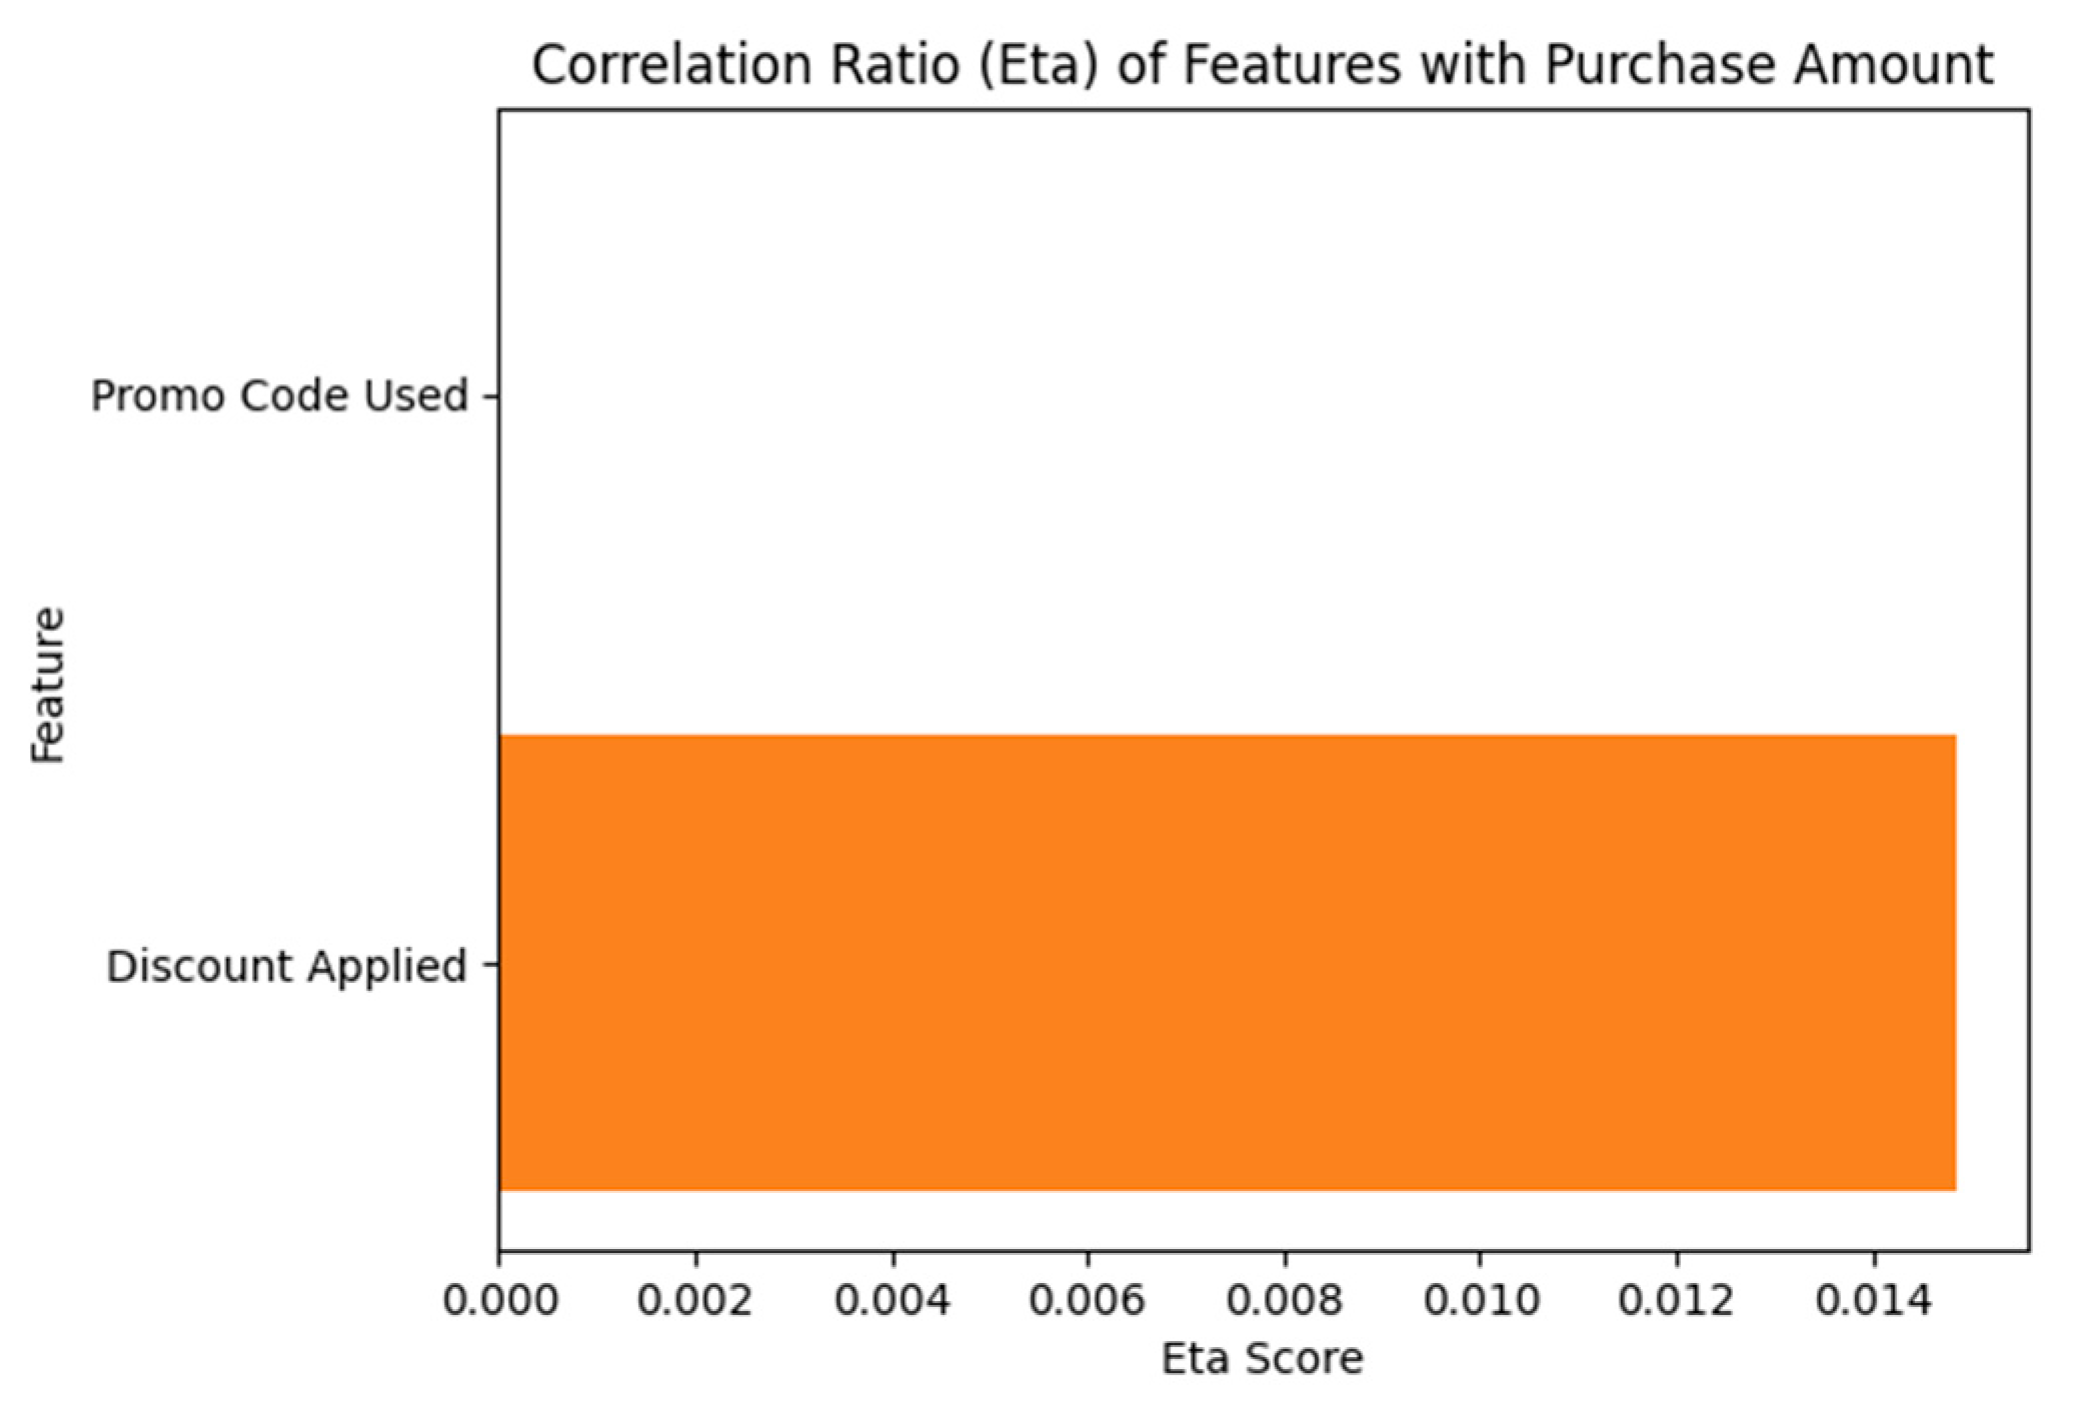
4.1. Feature Selection via Correlation Ratio (Eta)
4.2. Dimensionality Reduction with FAMD
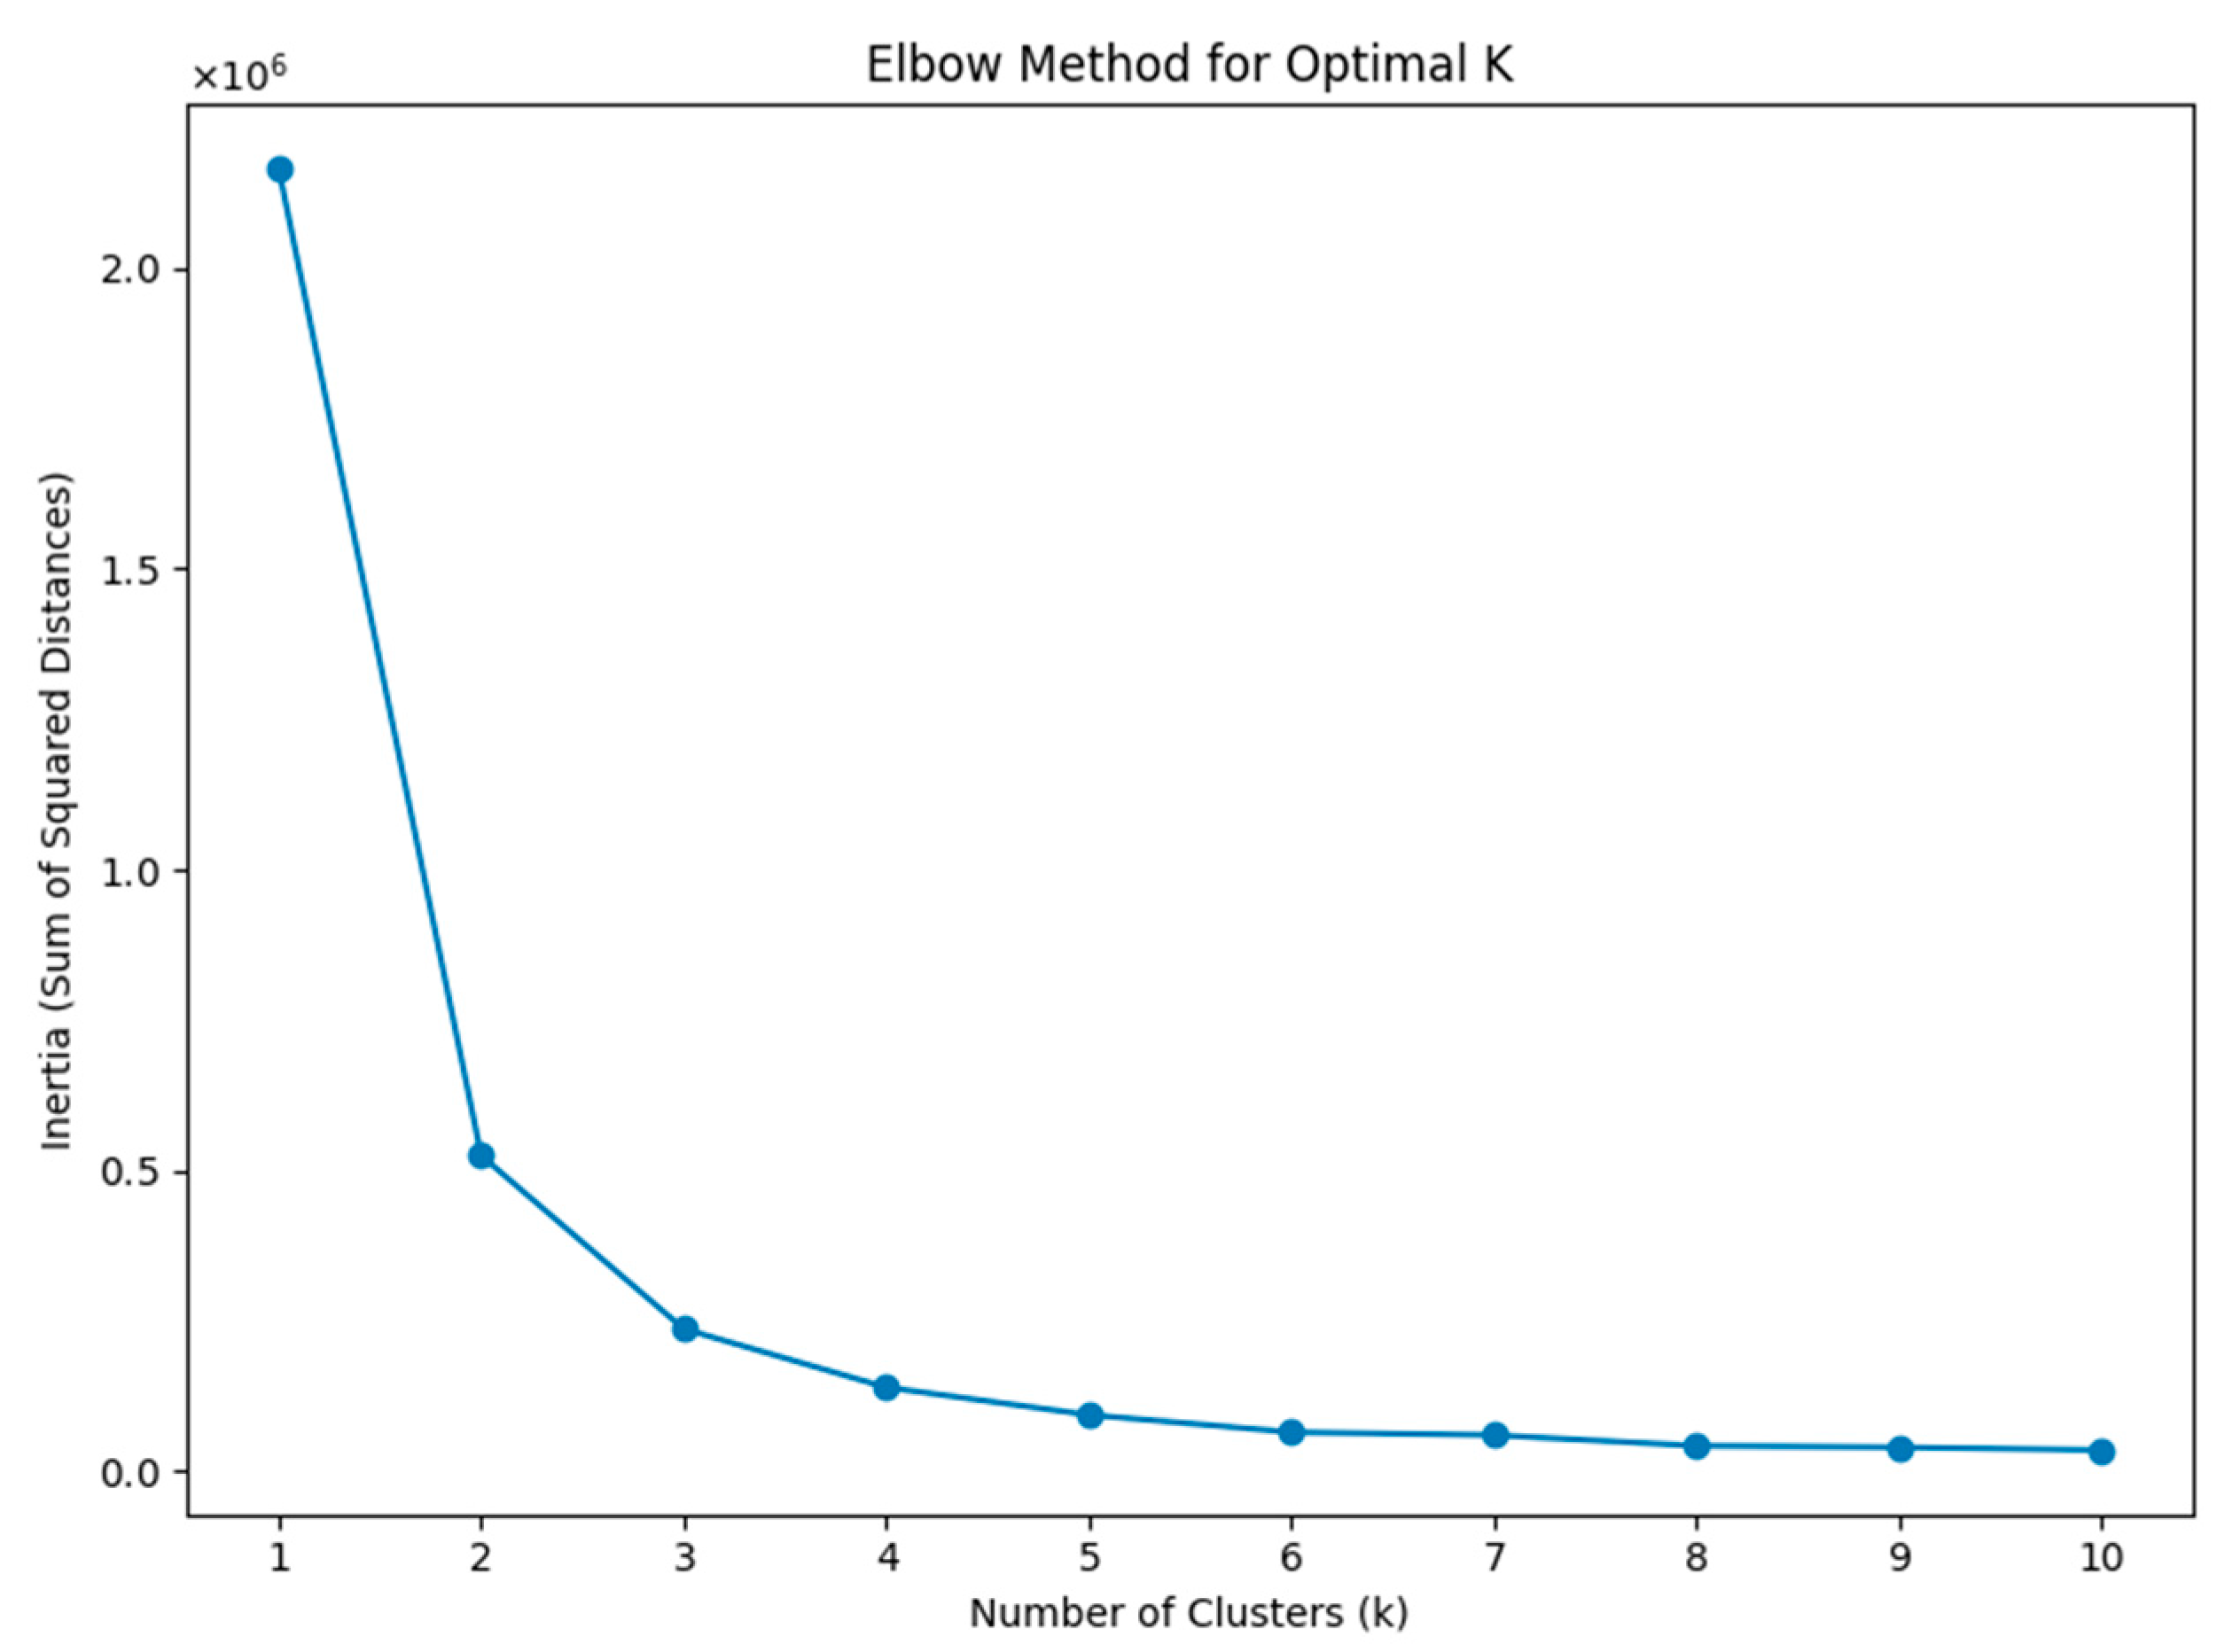
4.3. Cluster Number Determination
4.4. Clustering Performance
4.5. Comparative Performance Across Studies
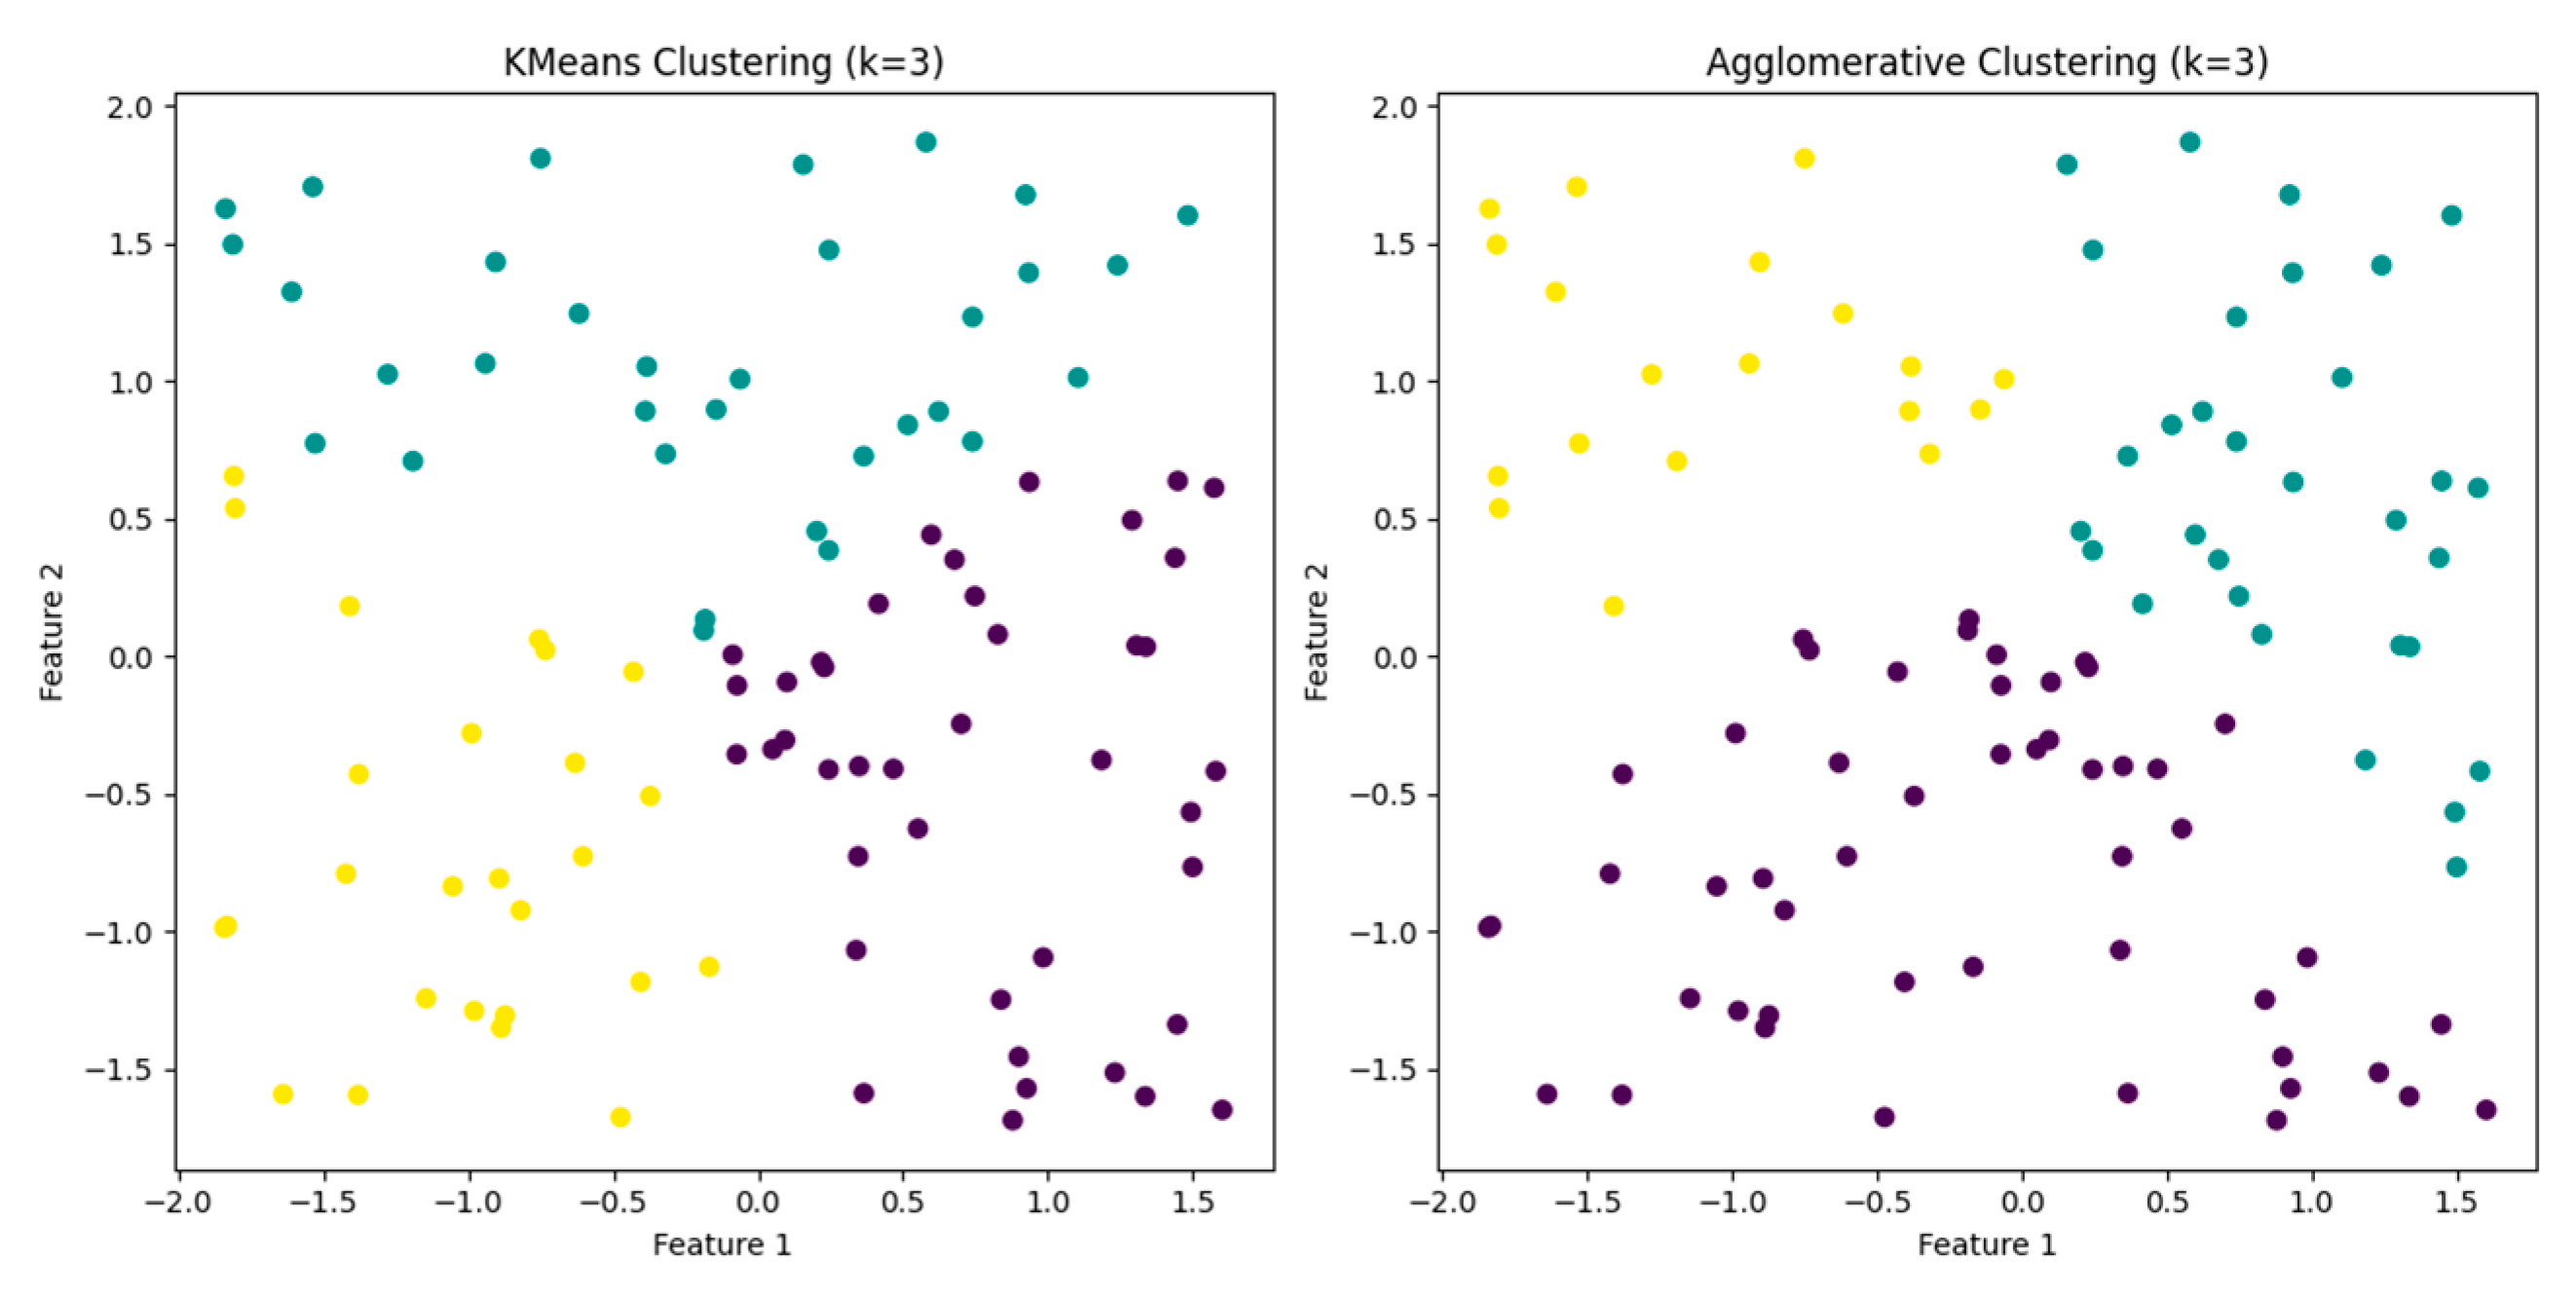
4.6. Clustering Visualization
4.7. Clustering Performance and Validation
4.7.1. Clustering Evaluation Metrics
4.7.2. Performance Comparison of Algorithms
4.7.3. Impact of Dimensionality Reduction (FAMD)
4.8. Practical Implications
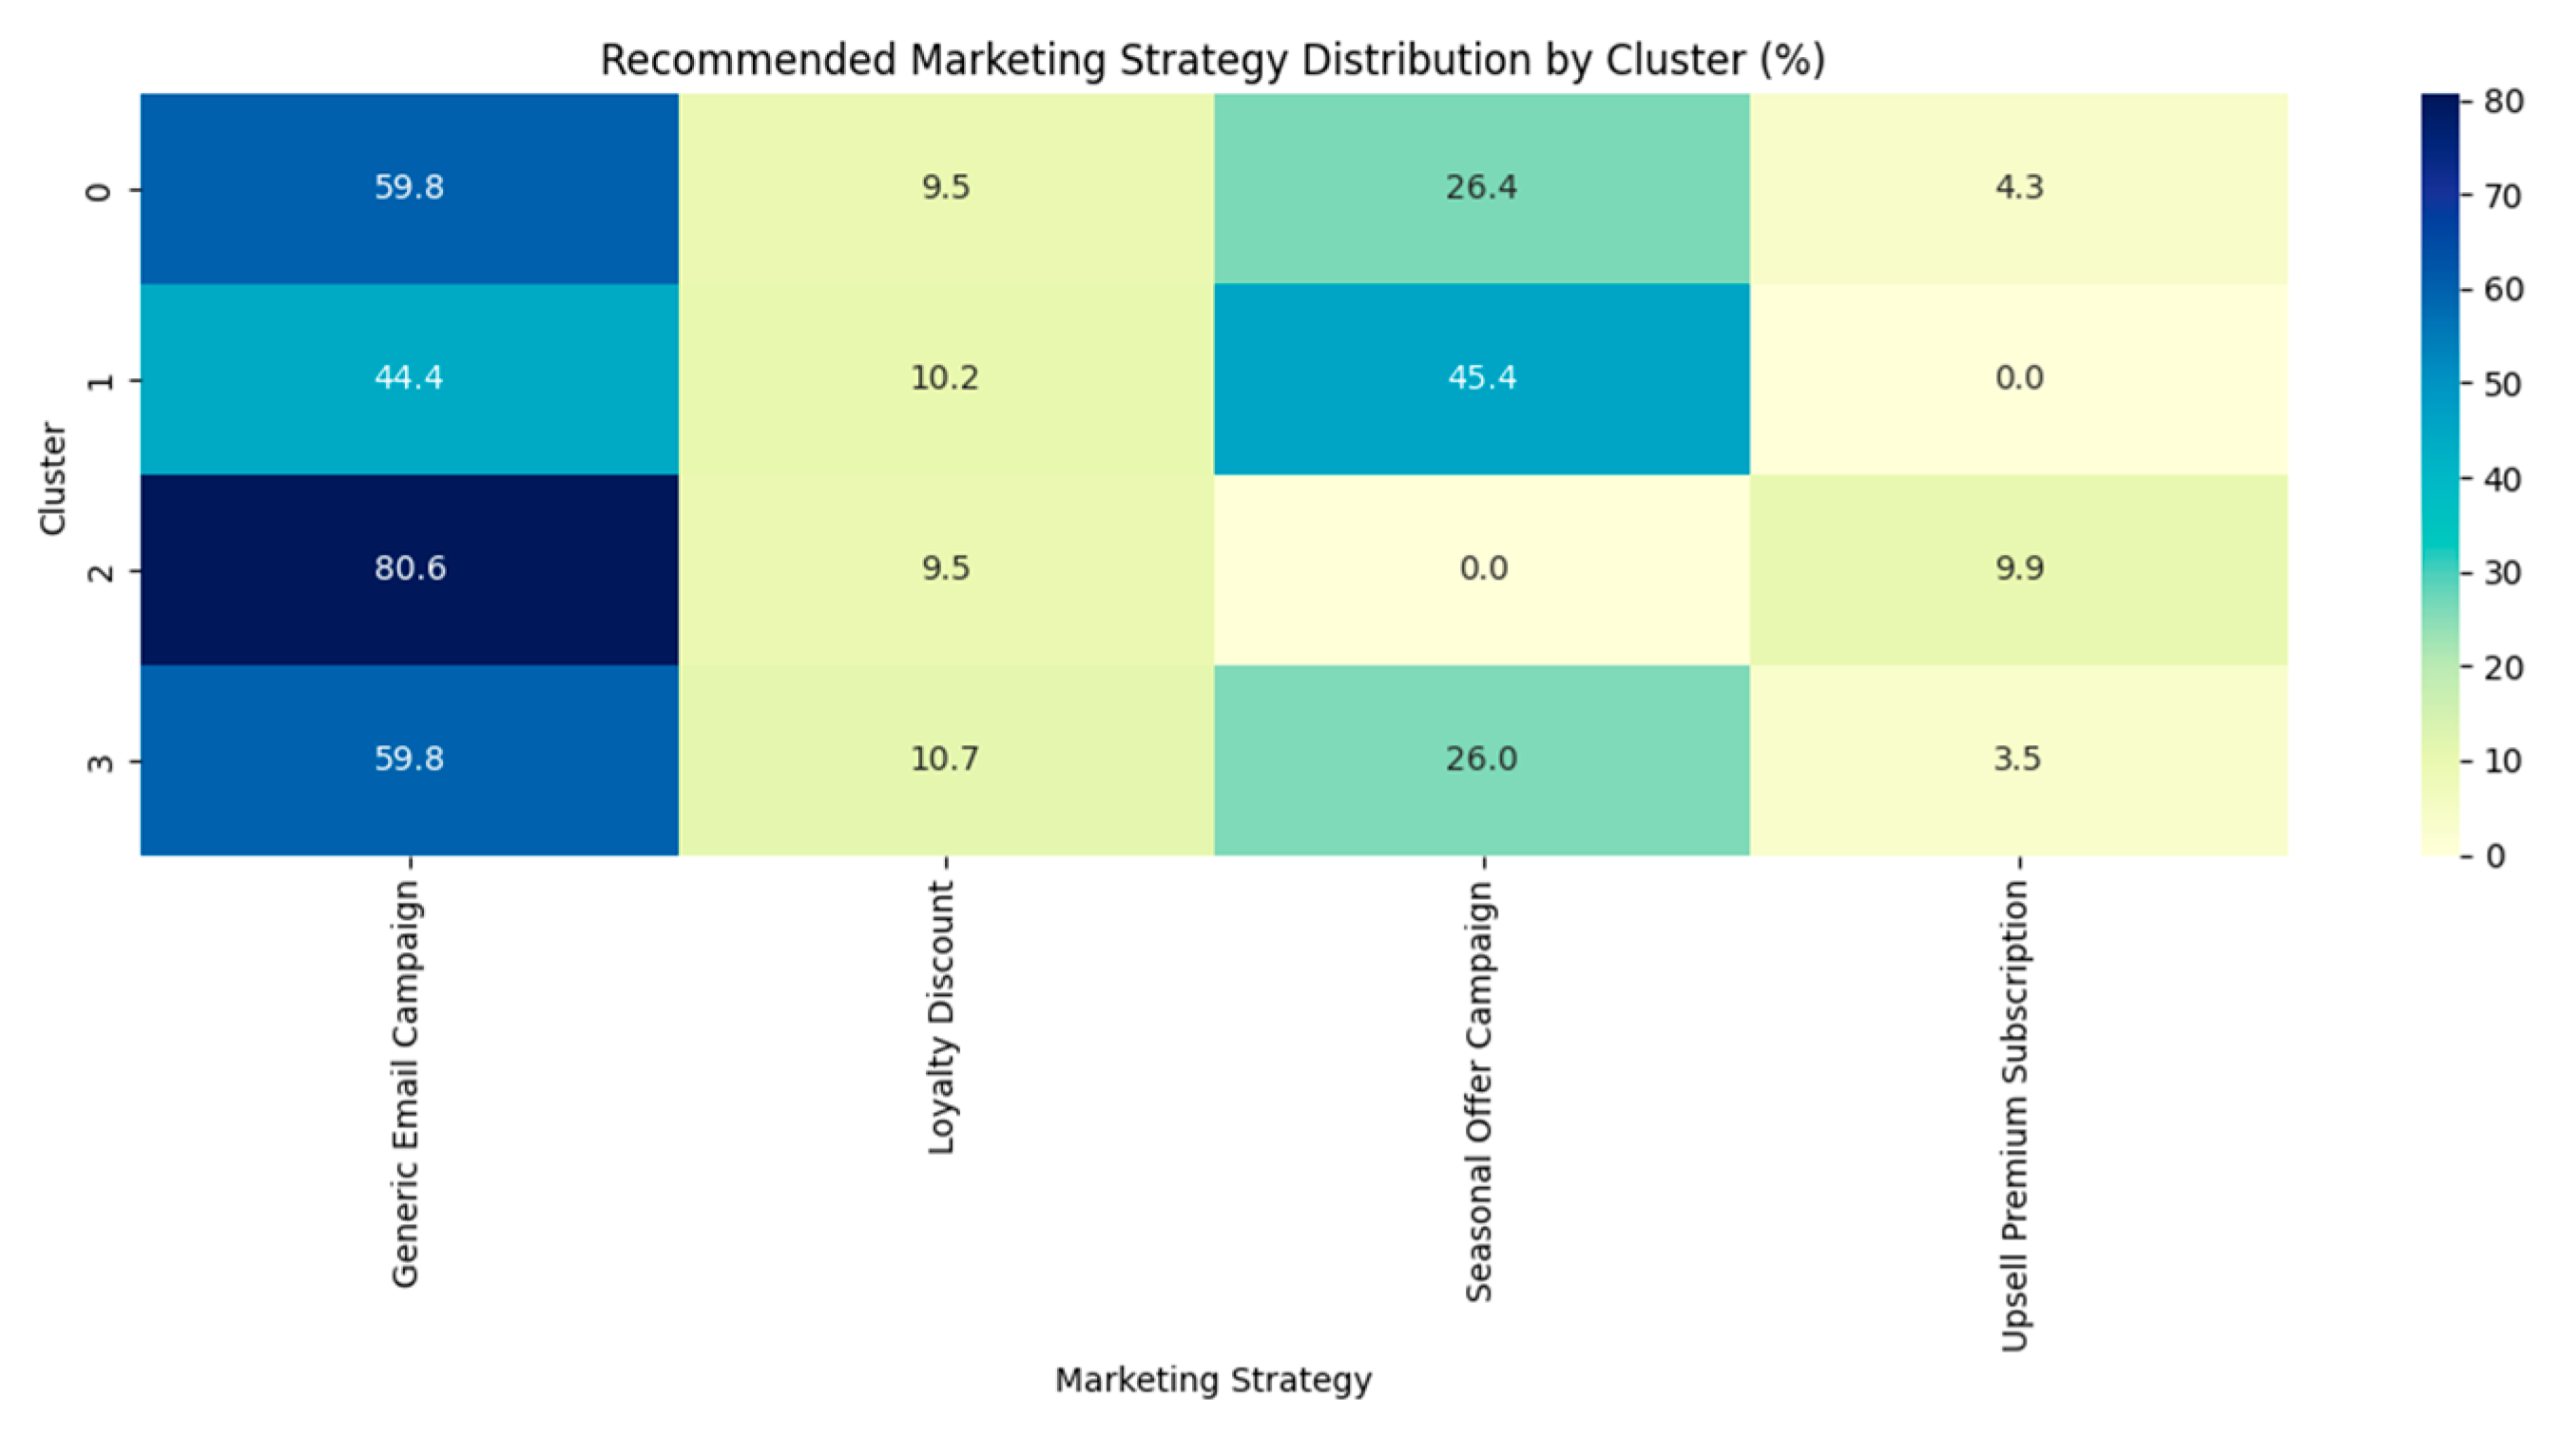
4.8.1. Cluster Profiling and Targeted Strategies
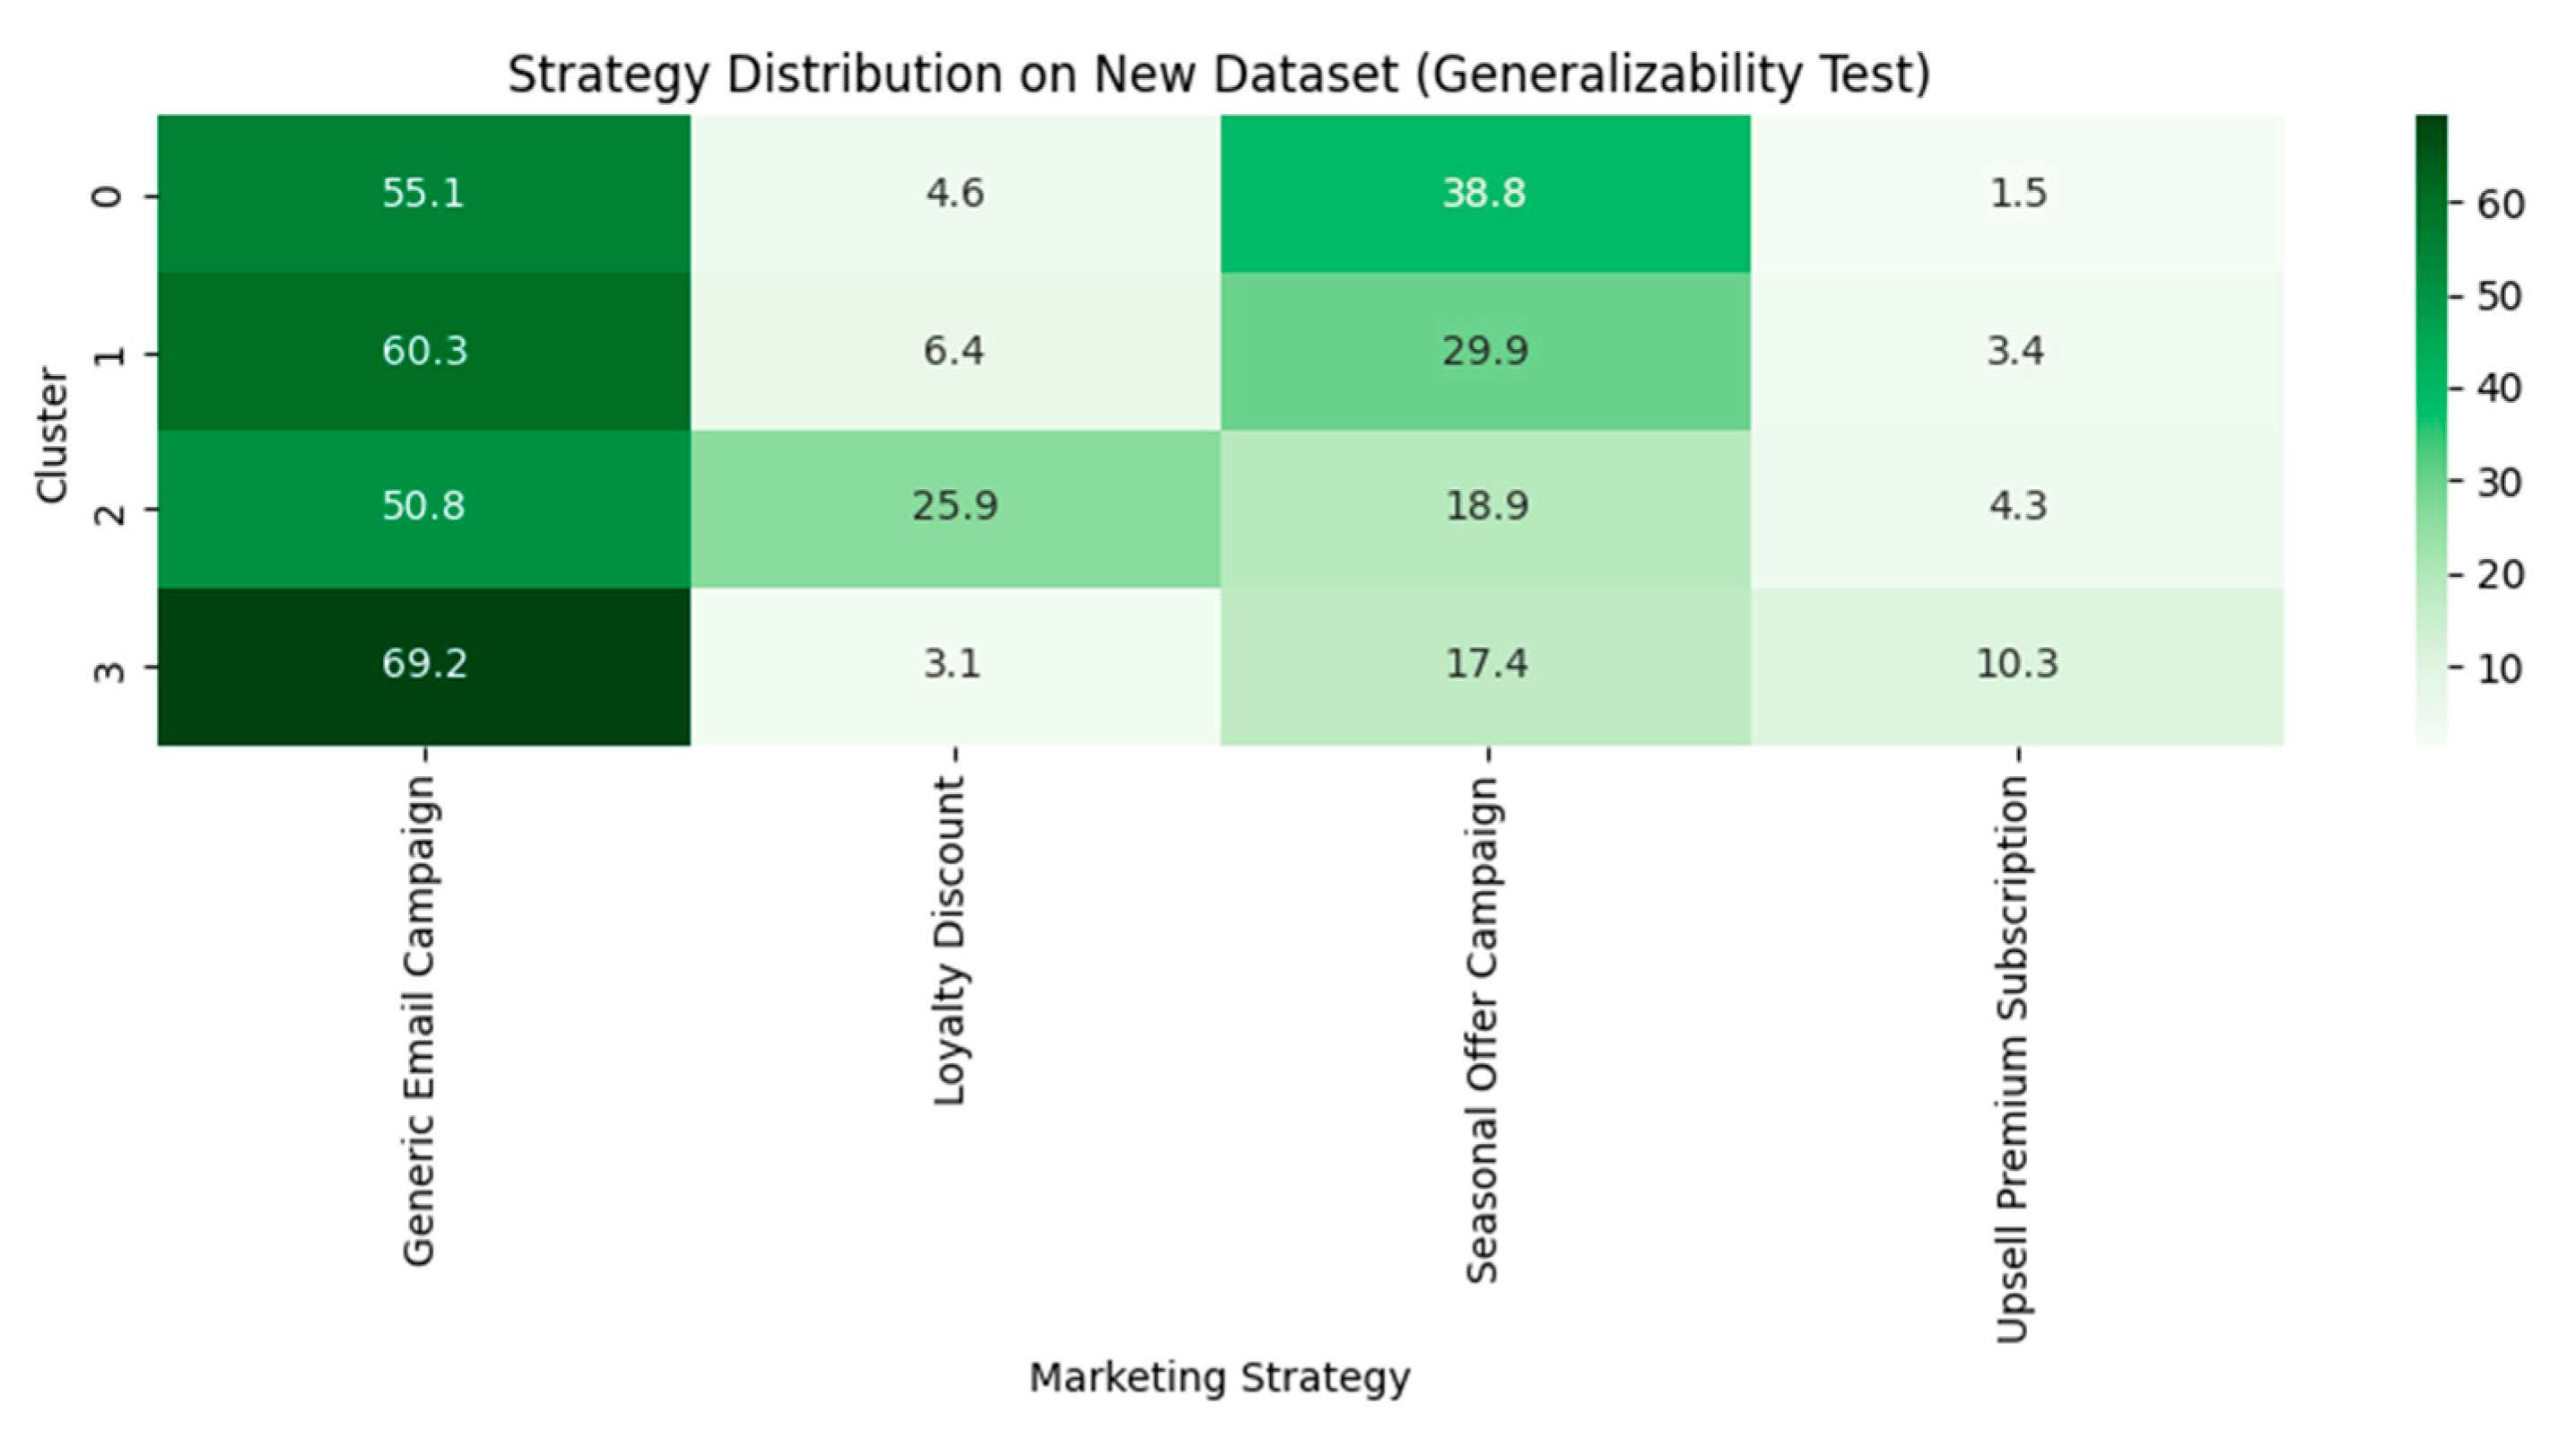
4.8.2. Generalizability Testing
5. Discussion
5.1. Clustering Algorithm Performance
5.2. Robustness and Generalizability
5.3. Impact of FAMD on Segmentation
5.4. Interpretability and Strategic Insight
5.5. Scalability Considerations
5.6. Generalizability and Regional Adaptation
6. Conclusions
Author Contributions
Funding
Institutional Review Board Statement
Informed Consent Statement
Data Availability Statement
Acknowledgments
Conflicts of Interest
References
- Alves Gomes, M.; Meisen, T. A review on customer segmentation methods for personalized customer targeting in e-commerce use cases. Inf. Syst. E-Bus. Manag. 2023, 21, 527–570. [Google Scholar] [CrossRef]
- Tabianan, K.; Velu, S.; Ravi, V. K-Means Clustering Approach for Intelligent Customer Segmentation Using Customer Purchase Behavior Data. Sustainability 2022, 14, 7243. [Google Scholar] [CrossRef]
- Miraftabzadeh, S.M.; Longo, M.; Brenna, M. Knowledge Extraction from PV Power Generation with Deep Learning Autoencoder and Clustering-Based Algorithms. IEEE Access 2023, 11, 69227–69240. [Google Scholar] [CrossRef]
- Miraftabzadeh, S.M.; Longo, M.; Foiadelli, F.; Pasetti, M.; Igual, R. Advances in the Application of Machine Learning Techniques for Power System Analytics: A Survey. Energies 2021, 14, 4776. [Google Scholar] [CrossRef]
- Qu, Y.; Xu, J.; Sun, Y.; Liu, D. A temporal distributed hybrid deep learning model for day-ahead distributed PV power forecasting. Appl. Energy 2021, 304, 117704. [Google Scholar] [CrossRef]
- Chong, B. K-means clustering algorithm: A brief review. Acad. J. Comput. Inf. Sci. 2021, 4, 37–40. [Google Scholar] [CrossRef]
- Ahmed, M.; Seraj, R.; Islam, S.M.S. The k-means Algorithm: A Comprehensive Survey and Performance Evaluation. Electronics 2020, 9, 1295. [Google Scholar] [CrossRef]
- Hicham, N.; Karim, S. Analysis of Unsupervised Machine Learning Techniques for an Efficient Customer Segmentation using Clustering Ensemble and Spectral Clustering. Int. J. Adv. Comput. Sci. Appl. 2022, 13, 122–131. [Google Scholar] [CrossRef]
- Apichottanakul, A.; Goto, M.; Piewthongngam, K.; Pathumnakul, S. Customer behaviour analysis based on buying-data sparsity for multi-category products in pork industry: A hybrid approach. Cogent Eng. 2021, 8, 1865598. [Google Scholar] [CrossRef]
- Ashabi, A.; Sahibuddin, S.B.; Salkhordeh Haghighi, M. The Systematic Review of K-Means Clustering Algorithm. In Proceedings of the 2020 The 9th International Conference on Networks, Communication and Computing, Tokyo, Japan, 18–20 December 2020; pp. 13–18. [Google Scholar] [CrossRef]
- Abdi, F.; Abolmakarem, S. Customer behavior mining framework (cbmf) using clustering and classification techniques. J. Ind. Eng. Int. 2019, 15, 1–18. [Google Scholar] [CrossRef]
- John, J.M.; Shobayo, O.; Ogunleye, B. An Exploration of Clustering Algorithms for Customer Segmentation in the UK Retail Market. Analytics 2023, 2, 809–823. [Google Scholar] [CrossRef]
- Rungruang, C.; Riyapan, P.; Intarasit, A.; Chuarkham, K.; Muangprathub, J. RFM model customer segmentation based on hierarchical approach using FCA. Expert Syst. Appl. 2024, 237, 121449. [Google Scholar] [CrossRef]
- Saxena, A.; Agarwal, A.; Pandey, B.K.; Pandey, D. Examination of the Criticality of Customer Segmentation Using Unsupervised Learning Methods. Circ. Econ. Sustain. 2024, 4, 1447–1460. [Google Scholar] [CrossRef]
- Rehman, A.; Khan, A.A.; Saeed, A.; Awan, S.H. Market Segmentation in Pakistan: A Mona Lisa Smile or a Big Fat Smile? Qlantic J. Soc. Sci. 2024, 5, 119–131. [Google Scholar] [CrossRef]
- Ansari, O.B. Geo-Marketing Segmentation with Deep Learning. Businesses 2021, 1, 51–71. [Google Scholar] [CrossRef]
- Christy, A.J.; Umamakeswari, A.; Priyatharsini, L.; Neyaa, A. RFM ranking—An effective approach to customer segmentation. J. King Saud. Univ. Comput. Inf. Sci. 2021, 33, 1251–1257. [Google Scholar] [CrossRef]
- Barrera, F.; Segura, M.; Maroto, C. Multiple criteria decision support system for customer segmentation using a sorting outranking method. Expert Syst. Appl. 2024, 238, 122310. [Google Scholar] [CrossRef]
- Fang, U.; Li, M.; Li, J.; Gao, L.; Jia, T.; Zhang, Y. A Comprehensive Survey on Multi-view Clustering. IEEE Trans. Knowl. Data Eng. 2023, 35, 1–20. [Google Scholar] [CrossRef]
- Dhall, D.; Kaur, R.; Juneja, M. Machine Learning: A Review of the Algorithms and Its Applications. Proc. ICRIC 2019 2019, 597, 47–63. [Google Scholar] [CrossRef]
- Cormen, T.H.; Leiserson, C.E.; Rivest, R.L.; Stein, C. Introduction to Algorithms, 4th ed.; The MIT Press: Cambridge, MA, USA; London, UK, 2022. [Google Scholar]
- Das, D.; Kayal, P.; Maiti, M. A K-means clustering model for analyzing the Bitcoin extreme value returns. Decis. Anal. J. 2023, 6, 1–11. [Google Scholar] [CrossRef]
- Sreekala, K.; Sridivya, R.; Rao, N.K.K.; Mandal, R.K.; Moses, G.J.; Lakshmanarao, A. A hybrid Kmeans and ML Classification Approach for Credit Card Fraud Detection. In Proceedings of the 2024 3rd International Conference for Innovation in Technology (INOCON), Bangalore, India, 1–3 March 2024; pp. 1–5. [Google Scholar] [CrossRef]
- Rajput, L.; Singh, S.N. Customer Segmentation of E-commerce data using K-means Clustering Algorithm. In Proceedings of the 2023 13th International Conference on Cloud Computing, Data Science & Engineering (Confluence), Noida, India, 19–20 January 2023; IEEE: Piscataway, NJ, USA, 2023; pp. 658–664. [Google Scholar]
- Kadarsah, D.; Heikal, J. Customer Segmentation With K-Means Clustering Suzuki Mobil Bandung Customer Case Study. J. Indones. Sos. Teknol. 2024, 5, 768–774. [Google Scholar] [CrossRef]
- Ho, T.; Nguyen, S.; Nguyen, H.; Nguyen, N.; Man, D.; Le, T. An Extended RFM Model for Customer Behaviour and Demographic Analysis in Retail Industry. Bus. Syst. Res. 2023, 14, 26–53. [Google Scholar] [CrossRef]
- Zhang, H.; Li, J.; Zhang, J.; Dong, Y. Speeding up k-means clustering in high dimensions by pruning unnecessary distance computations. Knowl. Based Syst. 2024, 284, 111262. [Google Scholar] [CrossRef]
- Afzal, A.; Khan, L.; Hussain, M.Z.; Zulkifl Hasan, M.; Mustafa, M.; Khalid, A.; Awan, R.; Ashraf, F.; Khan, Z.A.; Javaid, A. Customer Segmentation Using Hierarchical Clustering. In Proceedings of the 2024 IEEE 9th International Conference for Convergence in Technology (I2CT), Pune, India, 5–7 April 2024; IEEE: Piscataway, NJ, USA, 2024; pp. 1–6. [Google Scholar]
- Kim, Y.S.; Baker, M.A. I Earn It, But They Just Get It: Loyalty Program Customer Reactions to Unearned Preferential Treatment in the Social Servicescape. Cornell Hosp. Q. 2020, 61, 84–97. [Google Scholar] [CrossRef]
- Cottrell, M.; Olteanu, M.; Rossi, F.; Villa-Vialaneix, N. Self-Organizing Maps, theory and applications. Investig. Oper. 2018, 39, 1–22. [Google Scholar] [CrossRef]
- Awaliyah, D.A.; Prasetiyo, B.; Muzayanah, R.; Lestari, A.D. Optimizing Customer Segmentation in Online Retail Transactions through the Implementation of the K-Means Clustering Algorithm. Sci. J. Inform. 2024, 11, 539. [Google Scholar] [CrossRef]
- Narayana, V.L.; Sirisha, S.; Divya, G.; Pooja, N.L.S.; Nouf, S.A. Mall Customer Segmentation Using Machine Learning. In Proceedings of the 2022 International Conference on Electronics and Renewable Systems (ICEARS), Tuticorin, India, 16–18 March 2022; pp. 1280–1288. [Google Scholar] [CrossRef]
- Abednego, L.; Nugraheni, C.E.; Salsabina, A. Customer Segmentation: Transformation from Data to Marketing Strategy. Conf. Ser. 2023, 4, 139–152. [Google Scholar] [CrossRef]
- Ullah, A.; Mohmand, M.I.; Hussain, H.; Johar, S.; Khan, I.; Ahmad, S.; Mahmoud, H.A.; Huda, S. Customer Analysis Using Machine Learning-Based Classification Algorithms for Effective Segmentation Using Recency, Frequency, Monetary, and Time. Sensors 2023, 23, 3180. [Google Scholar] [CrossRef]
- Ashari, I.F.; Dwi Nugroho, E.; Baraku, R.; Novri Yanda, I.; Liwardana, R. Analysis of Elbow, Silhouette, Davies-Bouldin, Calinski-Harabasz, and Rand-Index Evaluation on K-Means Algorithm for Classifying Flood-Affected Areas in Jakarta. J. Appl. Inform. Comput. 2023, 7, 89–97. [Google Scholar] [CrossRef]


| Variable | Data Type | Unique Values | Summary |
|---|---|---|---|
| Customer ID | int64 | 3900 | Mean: 1950.50, Range: 1–3900, Std: 1125.98 |
| Age | int64 | 53 | Mean: 44.07, Range: 18–70, Std: 15.21 |
| Gender | object | 2 | Male (68.0%), Female (32.0%) |
| Item Purchased | object | 25 | Blouse (4.4%), Jewelry (4.4%), Pants (4.4%) |
| Category | object | 4 | Clothing (44.5%), Accessories (31.8%), Footwear (15.4%) |
| Purchase Amount (USD) | int64 | 81 | Mean: 59.76, Range: 20–100, Std: 23.69 |
| Location | object | 50 | Montana (2.5%), California (2.4%), Idaho (2.4%) |
| Size | object | 4 | M (45.0%), L (27.0%), S (17.0%) |
| Color | object | 25 | Olive (4.5%), Yellow (4.5%), Silver (4.4%) |
| Season | object | 4 | Spring (25.6%), Fall (25.0%), Winter (24.9%) |
| Review Rating | float64 | 26 | Mean: 3.75, Range: 2–5, Std: 0.72 |
| Subscription Status | object | 2 | No (73.0%), Yes (27.0%) |
| Shipping Type | object | 6 | Free Shipping (17.3%), Standard (16.8%), Store Pickup (16.7%) |
| Discount Applied | object | 2 | No (57.0%), Yes (43.0%) |
| Promo Code Used | object | 2 | No (57.0%), Yes (43.0%) |
| Previous Purchases | int64 | 50 | Mean: 25.35, Range: 1–50, Std: 14.45 |
| Payment Method | object | 6 | PayPal (17.4%), Credit Card (17.2%), Cash (17.2%) |
| Frequency of Purchases | object | 7 | Every 3 Months (15.0%), Annually (14.7%), Quarterly (14.4%) |
| Component | Eigenvalue | % of Variance | % of Variance (Cumulative) |
|---|---|---|---|
| 1 | 152.752125 | 33.350287 | 33.350287 |
| 2 | 132.574064 | 28.944822 | 62.295109 |
| 3 | 87.777265 | 19.164362 | 81.459470 |
| Clustering Algorithm | Values of K | Silhouette Score |
|---|---|---|
| K-means | 3 | 0.5641417203087317 |
| Agglomerative | 3 | 0.5641417203087317 |
| K-means | 4 | 0.511379685926011 |
| Agglomerative | 4 | 0.5176950827846802 |
| Study | Algorithm | Silhouette Score | Our Study (Agglomerative with FAMD) |
|---|---|---|---|
| Study 1 | K-Means | 0.6348 | 0.7033 |
| Gaussian Mixture Model | 0.6035 | ||
| Birch | 0.6828 | ||
| Study 2 | K-Means | 0.2996 | 0.5582 |
| DBSCAN | 1.19 | ||
| Study 3 | K-Means | 0.45 | 0.419220668 |
| Agglomerative | 0.38 | ||
| Mini Batch K-Means | 0.42 | ||
| Study 4 | K-Means | 0.3282 | 0.4888615 |
| Hierarchical | 0.3544 | ||
| Gaussian | 0.3544 | ||
| DBSCAN | 0.3986 |
| Study | Compared Against | p-Value | Significance |
|---|---|---|---|
| 1 | Birch | 0.03 | Significant |
| 2 | DBSCAN | 0.002 | Significant |
| 3 | K-Means | 0.12 | Not Significant |
| 4 | DBSCAN | 0.0005 | Significant |
| Metric | K-Means | Agglomerative Clustering |
|---|---|---|
| Davies–Bouldin Index (↓) 1 | 0.7333 | 0.7310 |
| Calinski–Harabasz Index (↑) 2 | 3364.45 | 3357.29 |
Disclaimer/Publisher’s Note: The statements, opinions and data contained in all publications are solely those of the individual author(s) and contributor(s) and not of MDPI and/or the editor(s). MDPI and/or the editor(s) disclaim responsibility for any injury to people or property resulting from any ideas, methods, instructions or products referred to in the content. |
© 2025 by the authors. Licensee MDPI, Basel, Switzerland. This article is an open access article distributed under the terms and conditions of the Creative Commons Attribution (CC BY) license (https://creativecommons.org/licenses/by/4.0/).
Share and Cite
Ufeli, C.P.; Sattar, M.U.; Hasan, R.; Mahmood, S. Enhancing Customer Segmentation Through Factor Analysis of Mixed Data (FAMD)-Based Approach Using K-Means and Hierarchical Clustering Algorithms. Information 2025, 16, 441. https://doi.org/10.3390/info16060441
Ufeli CP, Sattar MU, Hasan R, Mahmood S. Enhancing Customer Segmentation Through Factor Analysis of Mixed Data (FAMD)-Based Approach Using K-Means and Hierarchical Clustering Algorithms. Information. 2025; 16(6):441. https://doi.org/10.3390/info16060441
Chicago/Turabian StyleUfeli, Chukwutem Pinic, Mian Usman Sattar, Raza Hasan, and Salman Mahmood. 2025. "Enhancing Customer Segmentation Through Factor Analysis of Mixed Data (FAMD)-Based Approach Using K-Means and Hierarchical Clustering Algorithms" Information 16, no. 6: 441. https://doi.org/10.3390/info16060441
APA StyleUfeli, C. P., Sattar, M. U., Hasan, R., & Mahmood, S. (2025). Enhancing Customer Segmentation Through Factor Analysis of Mixed Data (FAMD)-Based Approach Using K-Means and Hierarchical Clustering Algorithms. Information, 16(6), 441. https://doi.org/10.3390/info16060441