Abstract
Effective incident detection is essential for emergency response and transportation management. Traditional methods relying on stationary technologies are often costly and provide limited coverage, prompting the exploration of crowdsourced data such as Waze. While Waze offers extensive coverage, its data can be unverified and unreliable. This study aims to identify factors affecting the reliability of Waze alerts and develop a predictive model to distinguish true incidents from false alerts using real-time Waze data, thereby improving emergency response times. Real crash data from the New Jersey Department of Transportation (NJDOT) and crowdsourced data from Waze were matched using the Density-Based Spatial Clustering of Applications with Noise (DBSCAN) algorithm to differentiate true and false alerts. A binary logit model was constructed to reveal significant predictors such as time categories around peak hours, road type, report ratings, and crash type. Findings indicate that the likelihood of accurate Waze alerts increases during peak hours, on streets, and with higher report ratings and major crashes. Additionally, multiple machine learning-based predictive models were developed and evaluated to forecast in real time whether Waze alerts correspond to actual incidents. Among those models, the Random Forest model achieved the highest overall accuracy (82.5%) and F1-score (82.8%), and an Area Under the Receiver Operating Characteristic Curve (AUC-ROC) of 0.90, demonstrating its robustness and reliability for real-time incident detection. Gradient Boosting, with an AUC-ROC of 0.90 and Area Under the Precision–Recall Curve (AUC-PR) of 0.90, also performed strongly, particularly excelling at predicting true alerts. The analysis further emphasized the importance of key predictors such as time of day, report ratings, and road type. These findings provide actionable insights for enhancing the accuracy of incident detection and improving the reliability of crowdsourced traffic alerts, supporting more effective traffic management and emergency response systems.
1. Introduction
Incident detection is crucial for effective emergency response and congestion management. Emergency response to incidents remains a significant challenge for communities worldwide, exacerbated by growing urbanization and the resulting strain on the limited resources of emergency management agencies [1,2]. Transportation professionals often rely on stationary data collection technologies, such as loop detectors, cameras, and microwave-based systems, for incident detection. However, these technologies are expensive not only for installation but also maintenance and offer limited coverage. Consequently, in recent years, researchers have increasingly focused on crowdsourced data for incident detection due to their cost-effectiveness and extensive coverage. Despite its potential, crowdsourced data are largely unregulated, as the contributors are not traditionally trained, and the data often lack verification [3]. Therefore, robust and effective methods are required to filter crowdsourced data to enhance their reliability and usefulness.
Among various sources of crowdsourced data, Waze is one of the most popular data sources. Waze is a crowd-sourced navigation application created in 2009 to help users navigate and avoid both literal and figurative bumps in the road through collaborative efforts [4]. It was originally developed by Waze Mobile [5]. Waze provides satellite navigation software on smartphones and other GPS-enabled devices. It efficiently guides users by leveraging information contributed by other users. Users can share information about traffic incidents such as accidents, congestion, speed, and police traps, providing valuable alerts and alternative routes for others. Users can also update roads, landmarks, house numbers, etc., from the online map editor. Waze incorporates data from state agencies on events like road construction, aiming for higher accuracy through collective input [6]. Currently, Waze collaborates with around 3000 partners worldwide to reduce traffic, guide infrastructure decisions, and enhance community safety [7].
In conventional methods, accident analysis predominantly relied on police-reported crash records (PRCRs). The issue with this approach is that the police report only major crashes, leaving minor crashes often underreported [8]. This deficiency in data affects the accuracy of the analysis. In such cases, crowdsourced data can complement official data if integrated properly and accurately, as they also cover minor crashes. Several studies have demonstrated the potential of Waze crowdsourced data for crash analysis, facilitating real-time traffic management [2,3,4,5,6,7,8,9,10,11,12,13,14,15]. However, most of these studies address the challenges of integrating Waze data with official data due to issues such as data redundancy, where multiple reports may be recorded for a single incident. Researchers have also examined factors affecting the trustworthiness of Waze data. Despite this, existing models cannot evaluate the trustworthiness of Waze data in real time and alert when a response is needed. A robust predictive model could facilitate quick emergency response, improve traffic management, alleviate congestion, and save resources and energy.
New Jersey Department of Transportation’s (NJDOT) Safety Service Patrol (SSP) assists nearly 70,000 motorists annually whose vehicles become disabled on state highways due to crashes, mechanical failures, and other issues [16]. SSP drivers are alerted to incidents by the New Jersey State Police (NJSP) when their operators receive 911 calls. SSP drivers then support the NJSP and other responders by ensuring safety, diverting traffic, and creating secure work zones, typically clearing incidents in under 40 min. To further enhance the response time and avoid congestion during incidents, leveraging Waze user-generated alerts has great potential. However, the challenge lies in the accuracy of Waze alerts, as false reports can occur.
This research first examines the overall matching rate of Waze crash alerts by comparing them with the actual crash records. Historical crash records from NJTR-1 and Waze alerts were matched using the Density-Based Spatial Clustering of Applications with Noise (DBSCAN) [17] algorithm to differentiate true and false alerts. Then, this research identified factors affecting the matching cases through a statistical analysis. A binary logit model was developed to determine the factors contributing to true alert cases. Furthermore, a machine learning-based predictive model was developed to forecast in real time whether a Waze alert corresponds to a true incident, enabling authorities to take timely action when a response is required. It is expected that the findings of this research can help agencies like NJDOT utilize Waze alerts for effective real-time traffic management and SSP deployment.
2. Literature Review
Several researchers have explored the potential integration of Waze data with official crash data to enhance the efficiency of crash analysis. This section provides an overview of the literature investigating the use of Waze data in accident research.
Crowdsourced data from Waze offer significant potential for revealing various aspects of road traffic. Senarath et al. [2] proposed a novel method to improve emergency incident detection by integrating crowdsourced Waze data with official incident reports from Nashville, Tennessee. The approach included spatial–temporal discretization of Waze reports into hexagonal grids and time steps, followed by clustering these reports to group data related to the same incident. Bayesian inference is then applied to calculate the probability of an incident occurring in each region based on the reliability and number of Waze reports. Threshold values for incident detection, determined using official incident data from the Enhanced Tennessee Roadway Information Management System (E-TRIMS), are used to decide when to alert emergency response authorities. If the calculated probability of an incident is higher than this threshold, an alert is sent to emergency response authorities; if it is lower, the system continues to collect and analyze additional Waze reports in subsequent time steps. Extensive experiments demonstrate that this method outperforms existing baselines in F1-score and AUC, highlighting its potential to enhance emergency response operations.
Sandt et al. [3] examined the potential of Waze crowdsourced data to enhance law enforcement and emergency response to disabled and abandoned vehicles (DAVs) on limited access freeways in Florida. By analyzing over 3.8 million Waze alerts and 329 DAV crashes from July 2019 to December 2020, they found that using spatiotemporal buffers of 0.5 km and 30 min could effectively match Waze alerts to DAV crashes. The results suggest that Waze alerts could be most beneficial during morning peak hours and in urban areas, particularly on interstates. The study estimates that earlier detection from Waze alerts could have reduced delays by over 3500 h, saving almost $110,000 in congestion costs, and potentially prevented 12 crashes, saving up to $23.3 million in comprehensive crash costs. While the findings demonstrate the promise of using crowdsourced data to improve DAV response, the authors emphasize the need for further research to develop effective real-time detection algorithms and filtering protocols.
Li et al. [8] explored the potential of using crowdsourced traffic incident reports from Waze to enhance highway safety analysis. Traditional reliance on police crash reports (PCRs) has limitations, such as underreporting minor incidents. The study proposed a methodology to eliminate redundant Waze incident reports (WIRs) and integrate WIRs with PCRs for a more comprehensive analysis. By analyzing data from the I-35 corridor in North Texas, the researchers found that WIRs and PCRs were spatially correlated but differed temporally, with WIRs providing broader coverage. The integration of both data sources identified more high-risk road segments than using PCRs alone, demonstrating the added value of crowdsourced data in identifying crash hot spots and improving roadway safety.
Perez et al. [9] investigated the spatial and temporal distribution of road traffic accidents in Mexico City in 2016 using crowdsourced data from the Waze navigation app. They compiled a database of accident reports using Waze data and identified high-accident zones and roads. They found that Waze could provide insights into traffic congestion and accident patterns.
Lin and Li [10] examined the utilization of crowdsourced data from Waze navigation apps to predict traffic conditions following accidents. The study categorized traffic congestion into four levels and proposed a hierarchical model using machine learning algorithms, such as Random Forest, Support Vector Machine, and Neural Network, to predict the severity and duration of traffic congestion after an accident. The model’s effectiveness is validated using real-time data from Beijing, showing that Neural Networks perform best in predicting congestion duration. The study demonstrates the potential of crowdsourcing data for real-time traffic management and highlights its advantages over traditional data sources in terms of coverage and timely information.
Apart from the crash analysis, Praharaj et al. [11] explored the reliability of crowdsourced flood incident reports from Waze in Norfolk, Virginia. They combined limited city-provided flood data with environmental and topographical factors to develop a logistic regression model predicting the likelihood of flooding. The model achieved a prediction accuracy of 90.5%, with 71.7% of Waze reports deemed trustworthy.
Zhang [12] evaluated the reliability and characteristics of Waze traffic data for traffic management purposes. Specifically, they compared Waze traffic speed data with data from traditional Remote Traffic Microwave Sensors (RTMSs) over a two-month period on a segment of I-40 in Knoxville, Tennessee. It aimed to understand how Waze data could complement traditional traffic data sources. The study identified factors affecting speed differences between Waze and RTMS data, such as time of day, traffic volume, and road segment length. It found that Waze data are particularly reliable during congested conditions and provide valuable real-time information that can enhance traffic management when integrated with traditional data sources.
Eriksson [13] attempted to seamlessly combine crowdsourced traffic data from Waze with official traffic data in Stockholm, Sweden, to effectively address any gaps in traffic coverage and enhance traffic management. It addresses the research gap of combining dynamic crowdsourced data with static governmental data sources. The methodology entails creating an artifact through design science research, tackling issues of data redundancy and reliability, which are resolved by incorporating temporal and spatial proximity constraints. The study found that the artifact significantly decreases redundancy and improves reliability. However, it is constrained by the inconsistency in data quality and their applicability, limited only to Stockholm’s circumstances.
Santos et al. [14] explored the integration of traffic accident data from Belo Horizonte’s municipal transit company (BHTrans) and Waze. They aimed to illustrate the benefits of combining detailed, police-reported BHTrans data with real-time, user-reported Waze data. Over a 52-day period in 2014, they matched accidents by time (within one hour) and location (within 50–150 m). Only 7% of accidents were reported in both datasets, underscoring their complementarity: BHTrans data focused on severe accidents in central areas, while Waze data included minor incidents on major roads and highways. The integrated dataset revealed accident hotspots and patterns not apparent from either source alone, highlighting the value of data integration for traffic safety analysis.
Amin-Naseri et al. [15] evaluated the reliability, coverage, and potential added value of crowdsourced traffic incident reports from the Waze navigation app compared to traditional sources such as Iowa’s Advanced Traffic Management System (ATMS) records, and third-party traffic services vendors (e.g., INRIX, Traffic Camera Images, and Twitter texts) used by ATMS. The study found that Waze reports covered 43.2% of ATMS records, detected incidents on average 9.8 min earlier than a probe-based alternative, and had reasonable geographic accuracy. The study estimated that 34.1% of Waze’s crash and congestion reports (about 7387 incidents annually) were potential incidents not recorded by current ATMS sources. The authors conclude that Waze reports could make significant contributions to incident detection and are found to have potential for further complementing the ATMS coverage of traffic conditions.
Moreover, Hoseinzadeh et al. [18] assessed the accuracy of Waze speed data by comparing them with Bluetooth-based ground truth data and found that Waze data demonstrated a prediction accuracy of nearly 85% during peak traffic hours. Goodall and Lee [19] assessed the accuracy of Waze crash reports by comparing them to video footage captured by traffic cameras along a 2.7-mile stretch of urban freeway. Their analysis demonstrated a high level of accuracy of the Waze crash reports supported by video evidence, revealing that Waze data can be a valuable tool for transportation management.
Recently, Al Krdy et al. [20] have investigated the integration of Waze data with Florida’s Computer-Aided Dispatch (CAD) system to enhance law enforcement and traffic incident management. The study highlights Waze’s potential to provide earlier incident notifications, particularly in rural areas and during nighttime hours. However, the use of a simplified 1-mile spatial and 30 min temporal buffer for event matching may overlook complexities associated with alerts from access roads, such as those near overpasses. Although the authors manually reviewed and excluded alerts from access roads, this approach may be impractical for areas with complex road geometries. Additionally, the study relies on pre-filtered Waze alerts that have already been screened by the Florida Department of Transportation (FDOT), limiting insights into how raw Waze data could improve modeling accuracy.
Upon reviewing the existing literature, it becomes evident that there is a significant research gap when it comes to accurately predicting the real-time accuracy of Waze reports. Current studies focus on addressing the challenges of matching the historical Waze crash reports with official data and identifying factors that affect the reliability of Waze crash data. However, there still remains an opportunity to develop a model capable of predicting the trustworthiness of Waze data in real time. This model would greatly improve the utilization of Waze data in a wide range of transportation applications, including effective and efficient incident response and traffic management.
3. Methodology
3.1. Data
3.1.1. Waze
Waze is a crowd-sourced navigation application that guides users by leveraging real-time information contributed by its user base. Users can report traffic incidents such as accidents, congestion, speed, and police traps, providing valuable alerts and alternative routes to others. Additionally, users can update roads, landmarks, and house numbers using the online map editor.
The Waze crash alert data capture incidents reported by users, including information such as unique system ID, date/time, geographic coordinates (latitude and longitude), road type, reliability, report description, report rating, confidence, and user feedback (“thumbs up”). According to the Waze data feed specifications [21], the columns are described as follows:
- Reliability: This score ranges from 0 to 10, reflecting the reliability of each alert based on user reactions (“thumbs up”, “not there”) and the reporting user’s level. Users gain levels (1 to 6) through contributions, with higher levels indicating more experienced and trustworthy users. Reliability scores start at 5 and will only drop below this threshold if a highly ranked editor submits a “not there” report, making it quite rare for the score to fall below 5.
- Confidence: This score ranges from 0 to 5, indicating the level of positive feedback from Waze users. Higher scores suggest higher confidence in the reported alert.
- Report Description: A description of the report provided when available.
- Road Type: This is an integer value ranging from 1 to 21, classifying different types of roads. In this study, roads are categorized as follows (the bracketed numbers represent these integer values, which are used to categorize and differentiate the types of roads in the Waze data):
- -
- Streets: Street (1), Primary Street (2), Secondary Street (6)
- -
- Highways and Ramps: Freeway (3), Ramp (4), Exit (11)
- -
- Trails and Walkways: Trail (5), 4 × 4 Trail (8 and 14), Walkway (9), Pedestrian (10), Stairway (16)
- -
- Transportation Facilities: Ferry Crossing (15), Private Road (17), Railroads (18), Runway/Taxiway (19), Parking Lot Road (20), Service Road (21)
- Report Rating: This is the user rank (1–6), based on the points they have accumulated through driving distances and map editing contributions [22]. The details of each rank (level) are as follows:
- -
- Level 1 (New Users): Users at this level can edit maps within a 1-mile radius. All users start at this level.
- -
- Level 2 (Beginner Editors): Users with over 3000 map edits or those who are IGN editors can edit maps within a 2-mile radius.
- -
- Level 3 (Proficient Editors): Users with over 25,000 map edits can edit maps within a 3-mile radius.
- -
- Level 4 (Advanced Editors): Users with over 100,000 map edits can edit maps within a 4-mile radius.
- -
- Level 5 (Expert Editors): Users with over 250,000 map edits can edit maps within a 4-mile radius.
- -
- Level 6 (Waze Champs): This level requires recommendations and approval by US Champs. Waze Champs have nationwide edited access.
- Thumbs Up: Number of positive reactions from users.
Waze crash alerts have three subtypes: (i) minor accident, (ii) major accident, and (iii) no subtype. Major crashes involve significant damage to vehicles, severe injuries, and potential fatalities, while minor crashes are characterized by fender benders with minor or no injuries and no fatalities [23]. In this research, alerts with no subtype are treated as the reference subtype for simplicity in interpretation. Moreover, the days of the week are classified into two distinct categories: weekdays and weekends. In addition, periods of the day are divided into distinct groups to enable a more comprehensive understanding of variations in traffic incidents. The categories are as follows:
- AM Peak: 7 am to 9 am
- Morning Non-Peak: 9 am to 12 pm
- Afternoon Non-Peak: 12 pm to 4 pm
- PM Peak: 4 pm to 7 pm
- Evening Non-Peak: 7 pm to 9 pm
- Nighttime Non-Peak: 9 pm to 7 am
The purpose of classifying days and times is to identify and analyze variations in traffic incidents and congestion. This should result in a more accurate understanding of traffic patterns and enhance traffic management strategies.
3.1.2. Crash Data
New Jersey Police Crash Report, a.k.a., NJTR-1 [24]. The NJTR-1 crash report attempts to systematically collect data regarding motor vehicle crashes in New Jersey, emphasizing critical elements such as the crash location, date/time, crash severity, driver details, vehicle information, involved individuals, and the roadway infrastructure. The structure is designed to guarantee the collection of thorough information regarding each crash, utilizing 153 data blocks. This comprehensive data collection enables entities such as the New Jersey Department of Transportation (NJDOT) and law enforcement agencies to study crash patterns, investigate underlying causes, and enhance traffic safety initiatives.
The crash data include crashes involving vehicles that are “in transport” and are applicable to crashes occurring on highways, private roads, and various other properties. Involvement of pedestrians and cyclists is recorded solely when a motor vehicle is involved in the crash. The NJTR-1 also addresses various scenarios, such as commercial vehicle involvement, and ensures that accurate and timely reports are submitted for every crash investigation. These data are critical for improving traffic safety policies and infrastructure development across the state. This helps agencies make data-driven decisions and allows for more targeted interventions, such as road improvements, enforcement of traffic laws, and public awareness campaigns aimed at reducing crash-related injuries and fatalities.
3.2. Methodological Framework
This section describes the comprehensive methodological framework employed in this study, as illustrated in Figure 1. The process begins with two primary data sources: Waze crowdsourced alerts and NJDOT’s official crash reports (NJTR-1) as discussed above in Section 3.1. These datasets are integrated through a Density-Based Spatial–Temporal Clustering of Applications with Noise (DBSCAN) algorithm [17] to identify matched and unmatched alerts, categorizing them as true and false alerts, respectively. This process is further elaborated in Section 3.3, Evaluation of Crash Alerts.
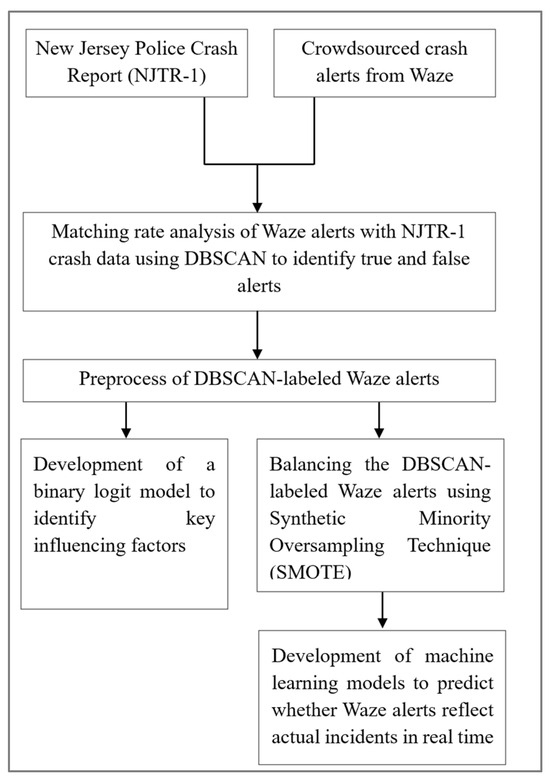
Figure 1.
Flowchart of methodology.
Following DBSCAN labeling, Waze data undergo data preprocessing, which includes the categorization and definition of variables, as outlined in Section 3.1.1. In the first stage of this study, the cleaned and labeled data are used to develop a binary logit model, aiming to identify significant factors that influence the likelihood of a Waze alert accurately reflecting a real incident. This step is further explored in Section 3.4, Alert-Crash Matches.
The DBSCAN-labeled data were highly imbalanced with a significant prevalence of false alerts. Therefore, in the second stage of the study, to address the class imbalance in the dataset, the Synthetic Minority Oversampling Technique (SMOTE) [25] is applied to balance the DBSCAN-labeled alerts. These balanced data are then used to train and evaluate various machine learning-based predictive models. Multiple classification algorithms—including Random Forest [26], Decision Tree [27], AdaBoost [28], Gradient Boosting [29], and Logistic Regression [30]—are trained and tested to forecast in real time whether a Waze alert corresponds to an actual crash. To ensure robust model performance, Stratified K-Fold cross-validation [31] is used for model optimization. This part is discussed in further detail in Section 3.5, Crash Alert Prediction Model.
This integrated methodological approach enables both interpretability through the logit model and predictive power via the machine learning model, significantly enhancing the practical application of crowdsourced traffic data in emergency response and transportation planning.
3.3. Evaluation of Waze Crash Alerts
Matching Rate Analysis
This section examines the overall matching rates of Waze crash alerts by cross-referencing each alert with historical crash data from NJTR-1. This research leverages incident alerts data from Waze for 2021, 2022, and 2023, cross-referenced with actual crash data from NJTR-1 to identify true (coded as 1) and false (coded as 0) Waze alerts.
Figure 2 depicts Waze accident alerts generated in October 2021 (a) and June 2023 (b) throughout New Jersey for an example. On average, between 20,000 and 30,000 accident alerts are reported each month, with numbers fluctuating throughout the year.
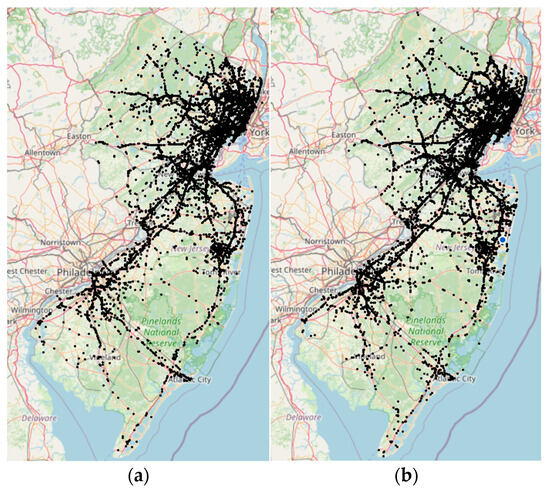
Figure 2.
Location of alerts: (a) October 2021; (b) June 2023.
Waze generates numerous alerts for the same crash, as reported by different Waze users in the vicinity of the crash at different times. Figure 3 shows individual crash alerts reported around the City of Newark and Newark Liberty Airport in January 2022. The alerts of the same color indicate that they are generated to report the same crash within an hour.
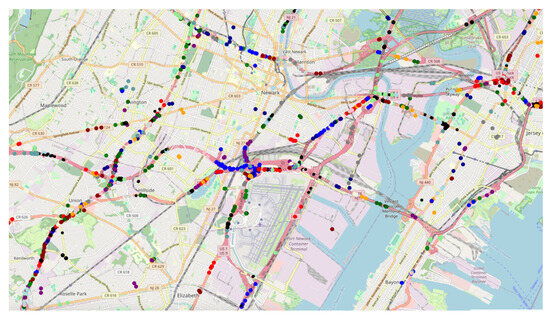
Figure 3.
Crash alerts near Newark and Liberty Airport.
Waze users may also report false alerts, which can be caused by a variety of reasons, including misuse of the Waze app, misrecognition of incidents, or even GPS error on their Waze devices. To address such practical issues, a data cleaning process is performed to correlate the Waze crash alerts with the actual crashes and filter out false alerts by using the Density-Based Spatial–Temporal Clustering of Applications with Noise (DBSCAN) algorithm [17].
The DBSCAN algorithm is a non-parametric clustering method. It is applied to cluster spatial data that contain noises. It clusters data points that are in close proximity to one another. The proximity is determined based on a specified number of neighboring data points within a defined radius from each individual data point. By applying this concept, the DBSCAN algorithm can also identify data points that exhibit significant deviations from the other datapoints within the dataset. This clustering approach effectively handles clusters that exhibit diverse shapes and levels of noise, in contrast to other clustering methods such as K-means and hierarchical clustering, which are more appropriate for compact and distinctly separated spherical clusters. The DBSCAN algorithm requires two inputs: (i) the radius of the neighborhood; (ii) the minimum number of neighbors needed within that radius. For each data point, the count of neighboring data points within the specified radius is determined. When the count meets or exceeds the minimum required neighboring datapoints, the datapoint is designated as a core point. If the count falls below the minimum number of neighboring required datapoints yet includes at least one core point, the datapoint is classified as a border point. When the count drops below the minimum threshold of neighboring datapoints needed and lacks any core point, the datapoint is marked as an outlier or noise. For each core point that is not assigned to a cluster, the DBSCAN algorithm initiates the creation of a new cluster, subsequently grouping the borders into the cluster associated with its core point. This establishes a sequence of interconnected points. This guarantees that all points in a cluster are connected via a chain of dense regions.
Figure 4 illustrates the workflow for detecting matched Waze alerts, though it is not drawn to scale. First, DBSCAN is applied for detecting Waze alerts within a specific radius and time window around actual crash locations from NJTR-1 crash data.
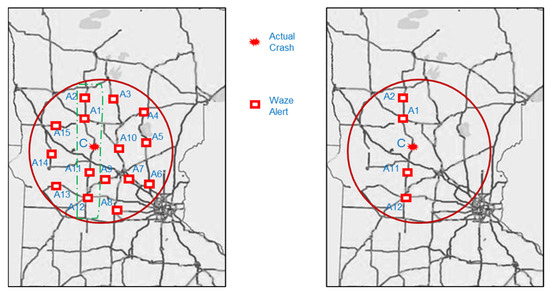
Figure 4.
Detection of matched Waze alerts.
In this study, DBSCAN operates with a 1 h time window to create a sphere with a 0.5-mile radius centered around the actual crash location. This spatial and temporal boundary encompasses all potential Waze crash alerts within the defined radius and time frame. For example, the actual crash happens at location C, and DBSCAN identifies Waze alerts A1, A2, A3, A4, …, A15 as being within the radius. Then, using OpenStreetMap, the actual roadway distance of these Waze alerts from the crash location is determined. Alerts that fall outside a quarter-mile distance from the actual crash location along the road network are filtered out. In this way, unrelated alerts are eliminated, and the matched alerts are retained, such as A1, A2, A11, and A12, which are likely related to the actual crash at C.
From September 2021 to April 2022, with the inclusion of June and July 2023, a total of 119,481 Waze alerts were recorded. Out of these, 18,667 alerts matched with actual crashes and 100,814 unmatched, resulting in an overall matching rate of 15.6%. Figure 5 demonstrates some selected matched cases obtained by the DBSCAN method. The pinpoints and the dots in Figure 5 represent the actual crash locations and alerts matched with the crash, respectively.
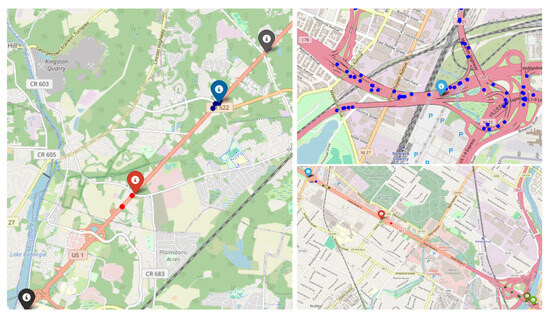
Figure 5.
Example of crash–alerts matched case.
The data distribution shows that 2021 and 2022 account for 42.9% and 33.6%, respectively, of the total alerts, while 2023 accounts for 23.4%. Table 1 shows the distribution of matched and unmatched alerts and provides insights into the crash matching rate across various months from 2021 to 2023. Throughout this time frame, Waze alert data show a consistent pattern of unmatched alerts outnumbering matched alerts with actual crashes. The highest matching rate of 19.4% was observed in December 2021, indicating that nearly 20% of Waze alerts in this month were confirmed to be actual crashes. Moreover, October 2021 and November 2021 also have relatively high matching rates of 19.0% and 18.5%, respectively. In contrast, the lowest matching rate of 12.4% was observed in February 2022. It suggests that a lower proportion of Waze alerts were matched with real crash data during this month. Additionally, March 2022 follows closely with a matching rate of 12.0%.

Table 1.
Waze alert accuracy.
The average matching rate in 2021 was 18.4%, whereas matching rates of 13.1% and 13.9% were observed in 2022 and 2023, respectively. This makes the overall matching rate across all months 15.6% out of the total 119,481 Waze alerts. It suggests that while Waze alerts are useful for detecting crashes, many alerts may not correspond to actual crash events (about 84.4% were unmatched). It highlights the need for enhancing the matching rate of Waze alerts to actual crashes.
Figure 6 depicts the percentage distribution of Waze crash types for matched cases, with the total percentage of alerts indicated in parentheses. Among the total alerts, approximately 48% were “No Subtype” crashes and they accounted for only 45% of the matched cases. In contrast, 21.6% of the total alerts were for “Major” crashes, which contributed to a higher 26.3% of matched cases. This indicates that Waze alerts for “Major” crashes are more likely to be matched to the actual crashes. On the other hand, “Minor” crashes, representing 30.4% of total alerts, matched 28.9% of the time, indicating a slightly lower matching rate.
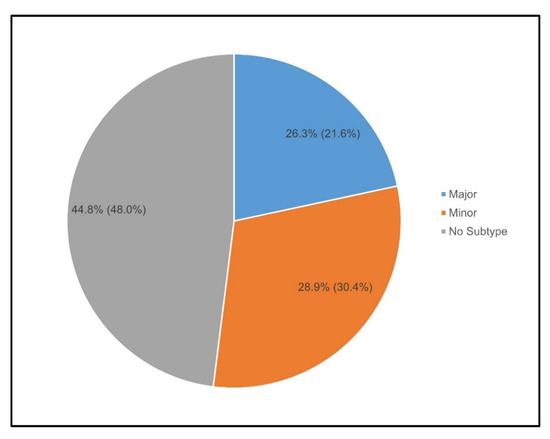
Figure 6.
Severity distribution in matched cases.
Moreover, Figure 7 illustrates that Waze alerts on primary streets have the highest matching rate, making up 30.6% of total alerts but accounting for 49.5% of matched crashes. In contrast, freeways have the highest share of total alerts (44.2%), but only 27.4% of matched crashes, indicating more False Positives. Ramps and streets have fewer alerts and lower matching rates, while secondary streets show moderate matching rates, with 10.9% of total alerts and 13.3% of matched crashes.
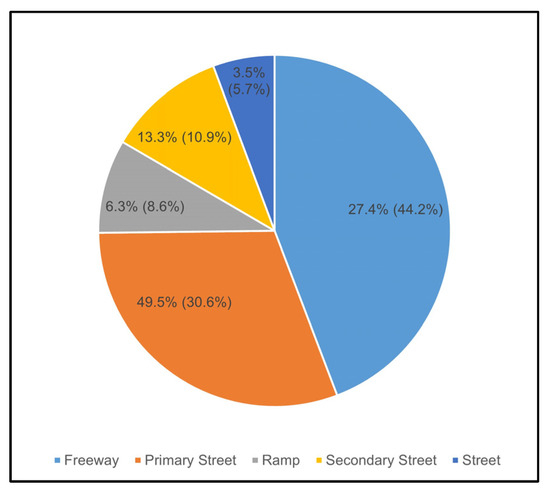
Figure 7.
Distribution of road types in matched cases.
In addition, Figure 8 shows the distribution of Waze alerts across report ratings 1 to 6, focusing on the percentages of total alerts (in parentheses) and matched alerts. Report ratings 1 and 5 represent 20.6% and 16.8% of total alerts, respectively, but both contribute only 18.2% of matched alerts. Rating 2 has the smallest share, with 7.1% of total alerts and 6.0% of matched alerts, while rating 4 has the highest proportion, accounting for 26.8% of total alerts and 28.5% of matched alerts. Ratings 3 and 6 show a close alignment, with 16.1% and 12.7% of total alerts and 16.2% and 12.9% of matched alerts, respectively, indicating a similar distribution for these two categories.
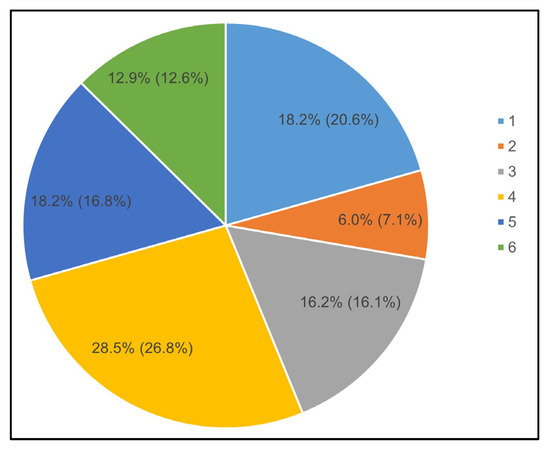
Figure 8.
Distribution of report ratings in matched cases.
Furthermore, Figure 9, based on matched cases only, shows that alerts with moderate reliability (e.g., reliability is 5.0) are the most frequent, particularly with report ratings between 3 and 5. As reliability increases from 5.0 to 10.0, the overall count of true alerts decreases significantly. Additionally, higher reliability scores are associated with moderate report ratings, suggesting that alerts with higher reliability scores are not always the most trustworthy. This supports the idea that the accuracy of crash alerts is primarily influenced by users’ report ratings, determined by their accumulated driving distance and map editing contributions, rather than the reliability derived from other user reactions. Furthermore, the data indicate that advanced editors (rating 4) are the most dependable due to their expertise and active participation, as they frequently contribute to more reliable crash reports.
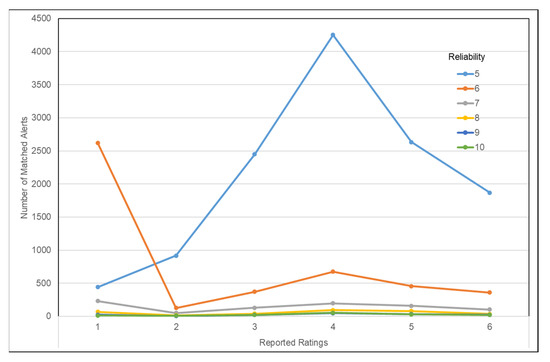
Figure 9.
Report ratings vs. reliability.
3.4. Alert–Crash Matches Analysis
To identify significant factors influencing the match of Waze alerts to crashes, a binary logit model was developed using data collected from September 2021 to April 2022, and from June to July 2023. The binary logit model is a type of regression model used to predict the outcome of a binary dependent variable, which has two possible outcomes. This model is commonly employed to analyze the relationship between a categorical response variable (with two categories or levels) and a set of predictor variables [32]. In binary logistic regression, the probability of success ranging from 0 to 1 is modeled. For example, in the context of Waze alerts, 1 represents a Waze alert matched with an actual crash, and 0 represents a Waze alert that does not match an actual crash. The model estimates these probabilities using the logit function and is described by Equation (1) [33]:
where P(Y = 1∣X) is the probability of the response variable Y being 1 given the predictors is the intercept; and are the coefficients for the predictor variables. This approach uses the maximum likelihood method to estimate the coefficients. The probability in Equation (1) can be calculated as follows:
For identifying significant factors, programming language R is utilized to fit the logit model to the data. The significance of each predictor variable is assessed by examining the p-values of the coefficients. Furthermore, the magnitude and direction of the coefficients indicate how each predictor influences the likelihood of the outcome.
Table 2 presents the output of the binary logit model. To identify significant factors contributing to the accuracy of Waze alerts, a 5% significance level was employed. This means that if the p-value in the table is less than 0.05, the corresponding variable has a statistically significant contribution to the accuracy of Waze alerts. The analysis reveals several significant factors influencing the matching of Waze alerts including weekdays, specific time categories (AM/PM peaks and non-peaks), certain road types (ramps, streets, primary streets), report ratings (Ratings 2–6), and crash type (minor and major).
Table 2.
Result of logit model.
The matching rate of Waze alerts is significantly influenced by the day of the week. Specifically, alerts reported on weekdays have a positive effect (coefficient = 0.105) and their odds ratio is 1.111, meaning that alerts on weekdays are 11.1% more likely to match real crashes compared to those on weekends. This could be due to higher traffic volumes and more consistent road usage patterns during weekdays, making crashes more noticeable and easier for users to report. Moreover, weekday commuters tend to be more regular drivers and are likely more engaged with reporting features compared to weekend drivers, who may include more casual or occasional travelers. Additionally, weekdays may involve more work-related and routine trips, leading to encouraged awareness of road conditions and more timely reporting of incidents.
Different time categories also significantly affect the Waze alert matching rate. Compared to nighttime non-peak hours, time periods around peak hours, including AM peak, morning non-peak, afternoon non-peak, and PM peak, positively increase the likelihood of Waze alerts being matched. For instance, alerts during AM peak hours are 48.4% more likely to be matched, while morning non-peak hours show a 23.5% increase, afternoon non-peak hours a 30% increase, and PM peak hours a 37.1% increase in matching actual crashes compared to nighttime non-peak hours. This highlights the importance of user engagement during these periods. The reason for this could be that during peak hours, roads are busier, and drivers are more attentive to traffic conditions, making crashes more noticeable and more likely to be reported accurately by a larger number of users.
Additionally, the type of road significantly impacts the matching rate of Waze alerts. Compared to secondary streets, alerts reported on primary streets have a positive effect (coefficient = 0.377) with an odds ratio of 1.458, meaning alerts on primary streets are 45.8% more likely to match real crashes. In contrast, alerts on ramps, streets, and freeways have negative effects, meaning those alerts are significantly less likely to match actual crashes. Alerts on ramps, streets, and freeways are, respectively, 43.8%, 52.0%, and 53.9% less likely to be matched compared to secondary streets. In summary, Waze alerts on primary streets tend to have a higher matching rate, while alerts on other road types, particularly freeways, tend to have a lower matching rate. This implies that users are more aware or active in reporting crashes on the primary streets. However, in the case of freeways, the higher speed limits make it more difficult for drivers to report crashes in real-time, as they have less time to observe and submit detailed reports while maintaining safe driving. Additionally, freeways lack frequent stopping points like traffic signals or stop signs, reducing opportunities for drivers to slow down or stop to make reports. Furthermore, drivers may be less inclined to engage with reporting features while navigating freeways, especially given the higher speeds and pressure to continue moving. This is particularly true for minor crashes, where the lack of significant disruption makes such crashes less noticeable and less likely to prompt reporting, further affecting the matching rate of Waze alerts.
The report rating also has a significant impact on matching rates. Compared to alerts with a report rating of 1, those with higher ratings are more likely to match real incidents. For example, a report rating of 2 has an odds ratio of 1.110, indicating an 11.0% increase in matching rate. Similarly, a report rating of 3 shows a 31.7% increase, while a report rating of 4, 5, and 6 increases the likelihood of matching rate by 38.8%, 41.5%, and 34.3%, respectively. Although the coefficient has dropped in the case of report rating 6 compare to report ratings 4 and 5, it can be generalized that higher report ratings are strongly correlated with more matched Waze alerts, as report ratings are determined based on the experience and expertise of the users.
Lastly, the type of crash reported significantly influences the Waze alert matching rate. Alerts for major crashes have a positive effect compared to the “No Subtype” crash type. Alerts for major crashes are 29.3% more likely to match real incidents. On the other hand, alerts for minor crashes have a negative effect (coefficient = −0.073, odds ratio = 0.929), indicating that they are 7.1% less likely to match real crashes. This suggests that reports involving major crashes tend to be more matched, while minor crash reports are slightly less reliable. It underscores the increased attention and matching rate for more severe crashes. The reason for this could be that major crashes are more visible and cause greater disruption, prompting more users to notice and report them, whereas minor crashes may go unnoticed or be seen as less urgent to report.
In summary, day of the week, time periods, road type, report rating, and crash type play a significant role in determining the matching rate of Waze alerts, with some factors positively influencing accuracy and others reducing it.
3.5. Crash Alert Prediction Model
In this study, multiple machine learning based-predictive models were developed and evaluated to forecast whether a Waze alert corresponds to a real incident. In this section, matched Waze alerts with actual crashes are referred to as “true alerts,” whereas unmatched alerts are termed “false alerts.” This setup frames the task as a binary classification problem.
The process involved careful data preprocessing, model selection, hyperparameter tuning, and performance evaluation to ensure the development of a robust and reliable predictive model.
Feature scaling was performed using Standard Scaler [34] to ensure that all input variables had a standard normal distribution. The training data were fitted and transformed, and the same scaling parameters were applied to the test data. Moreover, the Waze data utilized in this study were highly imbalanced, with a significant prevalence of false alerts. To deal with this, the Synthetic Minority Oversampling Technique (SMOTE) [25] was utilized to ensure a balanced distribution of Waze data. This method guarantees that the dataset maintains a balanced representation of true and false alerts. In addition, an 80–20 train–test split using the train–test-split function from the scikit learn package (version 1.6.1) in Python 3.11.7 [35] was utilized to create training and testing datasets while maintaining the class distribution through stratified sampling. To ensure the reproducibility of the model results, random seeds were set to 1 at each stage where necessary, providing consistency in the outcomes.
Multiple machine learning models including Random Forest [26], Decision Tree [27], AdaBoost [28], Gradient Boosting [29], and Logistic Regression [30] were developed, and then, their performance was evaluated. Each model was paired with a set of hyperparameters tailored to its specific characteristics. Considering computational efficiency, hyperparameter optimization was conducted using Randomized Search CV [36] with 10-fold Stratified K-Fold cross-validation [31] to ensure robustness. This step leveraged parallel processing and focused on hyperparameters with the most significant impact on model performance. The key hyperparameters explored for each model included the following:
- Random Forest: Number of estimators, splitting metric (criterion), maximum depth, minimum samples required for split and leaf, and class weight [37].
- Decision Tree: Splitting metric (criterion), maximum depth, and minimum samples required for split and leaf [38].
- AdaBoost: Number of estimators and learning rate [39].
- Gradient Boosting: Number of estimators, learning rate, maximum depth, maximum features, loss function, subsampling fraction, splitting metric, tolerance, minimum samples required for split and leaf, validation fraction, and early stopping threshold [40].
- Logistic Regression: Regularization strength (C), penalty type, solver, tolerance, maximum iterations, and class weight [41].
The prediction performance of the developed machine learning models with optimal hyperparameters was evaluated on the test dataset using several performance metrics including accuracy, precision, recall, and F1-score derived from confusion matrix (Table 3). Additionally, the Precision–Recall (PR) curve and the Receiver Operating Characteristic (ROC) curve [42], were used to further assess model performance. The metrics are defined as follows:
Table 3.
Confusion matrix.
- Accuracy: Accuracy refers to how many of the predictions made by a model are correct. It is the ratio of the number of correct predictions to all the predictions. It is calculated as follows:
- Precision: Precision indicates the proportion of instances predicted as positive by the model that are actually positive. It is given by the following:
- Recall: Recall measures the proportion of actual positive instances that the model correctly identified. It is calculated as follows:
- F1-Score: The F1-score is the harmonic mean of precision and recall, offering a single metric that weighs both precision and recall in a balanced way. The formula is as follows:
- Precision–Recall (PR) Curve: The PR curve is constructed by plotting precision against recall for various threshold values. The Area Under the PR curve (AUC-PR) is a common metric that summarizes the performance of the model across all possible thresholds. A higher AUC-PR score indicates a better performing model, with values closer to 1.0 indicating higher precision and recall.
- Receiver Operating Characteristic (ROC) Curve: This is another graphical representation utilized to assess the performance of a binary classifier. It is constructed by plotting the True Positive Rate (TPR), also known as recall, on the y-axis, against the False Positive Rate (FPR), defined as follows, on the x-axis. The Area Under the ROC curve (AUC-ROC) summarizes the ability of a classifier to distinguish between the positive and negative classes. An AUC-ROC value of 1 indicates perfect performance, while a value of 0.5 suggests that the model is no better than random guessing. The formulas for calculating TPR and FPR are as follows:
Among the models developed and validated, the optimal configurations of hyperparameters yielded varying levels of accuracy. The Random Forest and Gradient Boosting models emerged as top performers, achieving high F1-scores, indicating their suitability for this classification task. As demonstrated in Table 4, the Random Forest model achieved an accuracy of 82.5%, a precision of 81.4%, a recall of 84.1%, and an F1-score of 82.8%, indicating its capability to reliably classify true incidents and false alerts. Similarly, the Gradient Boosting model demonstrated competitive performance, with slightly lower metrics than Random Forest but still suitable for the classification task. Decision Tree also showed comparable predictive capabilities. In contrast, models such as Logistic Regression and Ada Boost exhibited lower recall and F1-scores. This suggests that while these models were capable of correctly predicting the majority of true alerts, they were less effective at identifying false alerts, leading to a drop in overall performance.
Table 4.
Summary of the evaluation metrics for all models.
Model Performance Analysis
The confusion matrix, classification metrics, feature importance, PR curve, and ROC curve results provide detailed insights into the ability of the three models—Random Forest, Gradient Boosting, and Decision Tree—to distinguish between true and false alerts effectively.
- Classification Metrics: The classification metrics for precision, recall, and F1-score for both true and false alerts on the test data obtained from the three models are summarized below. The results highlight the performance of each model in identifying true alerts (Class 1) and false alerts (Class 0), with performance across all metrics shown in Figure 10.
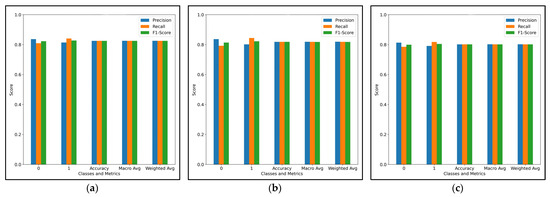 Figure 10. Classification report metrics. (a) Report metrics for Random Forest; (b) report metrics for Gradient Boosting; (c) report metrics for Decision Tree.
Based on classification metrics, Random Forest emerges as the best-performing model, achieving the highest overall accuracy of 83%. It excels in both precision and recall for Class 0 (false alerts) and Class 1 (true alerts). For Class 0, it achieves 84% precision and 81% recall, and for Class 1, it reaches 81% precision and 84% recall, with a strong F1-score of 82% for false alerts and 83% for true alerts. These results demonstrate a solid balance between minimizing False Positives and maximizing the detection of true alerts, making it the most reliable model among the three.
Gradient Boosting, with an overall accuracy of 82%, performs competitively but slightly lags behind Random Forest. For Class 0 (false alerts), it achieves 84% precision and 79% recall, resulting in an F1-score of 81% for false alerts. For Class 1 (true alerts), it reaches 80% precision and 84% recall, resulting in an F1-score of 82% for true alerts. Although it has similar recall performance for Class 1 to Random Forest, its slightly lower precision for Class 1 and slightly lower F1-score for Class 0 lead to a marginally lower overall performance compared to Random Forest.
Decision Tree, with an overall accuracy of 80%, has the lowest performance among the three models. For Class 0 (false alerts), it achieves 81% precision and 79% recall, while for Class 1 (true alerts), it achieves 79% precision and 82% recall, with an overall F1-score of 80%. While the Decision Tree model performs reasonably well, its overall lower precision and recall compared to the other two models make it less effective at both detecting true incidents and avoiding false alerts.
Therefore, based on the overall performance, Random Forest emerges as the best model, demonstrating superior accuracy, precision, recall, and F1-score compared to Gradient Boosting and Decision Tree. Random Forest consistently performs well in identifying true and false alerts, making it the most reliable model for this task. While Gradient Boosting provides competitive results, particularly in recall, Decision Tree has the lowest performance across all metrics, particularly in precision and F1-score for true alerts.
- Confusion Matrix: The confusion matrix as shown Figure 11 depicts the distribution of predictions for the test set across the three models. The Random Forest model demonstrates a strong ability to distinguish between true and false alerts. The matrix shows a high number of True Positives (TPs) for Class 1 (true alerts) (15,968), indicating that the model accurately identifies real incidents. Similarly, the True Negatives (TN) for Class 0 (false alerts) (15,459) are also high, demonstrating effective detection of false alerts. However, it still has some False Positives (FP) (3643) and False Negatives (FN) (3013), suggesting that there is some misclassification, particularly in predicting false alerts.
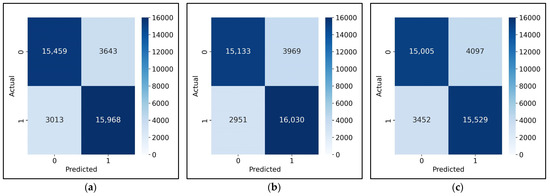 Figure 11. Confusion matrix. (a) Confusion matrix for Random Forest; (b) Confusion matrix for Gradient Boosting; (c) Confusion matrix for Decision Tree.
The Gradient Boosting model shows a similar trend but with slightly more False Positives (FP) (3969) compared to Random Forest. The number of True Positives (TP) (16,030) for Class 1 (true alerts) is almost identical to Random Forest, showing that the model also performs well in detecting true incidents. Additionally, it has slightly fewer False Negatives (FNs) (2951) than Random Forest, indicating that Gradient Boosting does fewer mistakes in identifying true alerts compared to Random Forest. True Negatives (TNs) (15,133) are also comparable to Random Forest, but the increase in False Positives (FPs) and a slight decrease in True Negatives (TNs) suggest slightly lower performance in correctly identifying false alerts compared to Random Forest.
The Decision Tree model, while effective, has a relatively weaker performance in comparison to Random Forest and Gradient Boosting. The True Positives (TPs) for Class 1 (15,529) are slightly lower than the other two models, and it also has the highest number of False Positives (FPs) (4097) and False Negatives (FNs) (3452). This indicates that the Decision Tree is less effective at both identifying true incidents and minimizing false alarms compared to Random Forest and Gradient Boosting. The True Negatives (TN) for Class 0 (15,005) are also the lowest among the three models.
Overall, based on the confusion matrices, Random Forest outperforms both Gradient Boosting and Decision Tree in terms of correctly identifying both true alerts and false alerts. Gradient Boosting follows closely but has a higher False Positive (FP) rate than Random Forest, suggesting it may misclassify a higher number of false alerts. Decision Tree lags behind, with more misclassifications in both classes, which makes it less effective for this task.
- Precision–Recall (PR) Curve: The Precision–Recall (PR) curves for the three models—Random Forest, Gradient Boosting, and Decision Tree—are shown in Figure 12. The Area Under the Curve (AUC) score for each model provides valuable insight into its overall performance in distinguishing between true and false alerts.
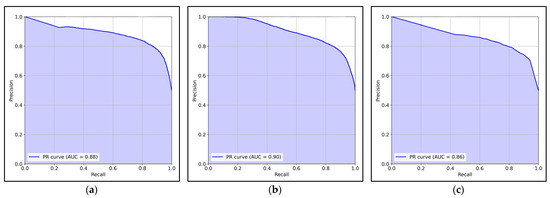 Figure 12. The Precision–Recall (PR) curves. (a) PR curve for Random Forest; (b) PR curve for Gradient Boosting; (c) PR curve for Decision Tree.
Random Forest shows a relatively high AUC score of 0.88, indicating good overall performance in balancing precision and recall. The PR curve for Random Forest demonstrates a smooth, gradual decline in precision as recall increases, which suggests that it can maintain a decent level of precision while detecting more true alerts. This model performs well in both minimizing False Positives and identifying True Positives.
Gradient Boosting exhibits the highest AUC score of 0.90, reflecting its superior ability to balance precision and recall. The PR curve shows a similarly smooth decline, but with a slightly better retention of precision at higher recall rates compared to Random Forest, which highlights its strength in identifying true alerts while maintaining a high precision. This model stands out with its slightly better performance in terms of recall, making it more effective in detecting true alerts.
Decision Tree has the lowest AUC score of 0.86 among the three models, which indicates that it is less effective in distinguishing true and false alerts. The PR curve for Decision Tree also declines more steeply compared to the other two models, suggesting that as recall increases, precision drops more significantly. This behavior indicates that Decision Tree is less efficient at identifying true alerts while keeping False Positives at bay, making it the least effective model for this task.
These findings suggest that Gradient Boosting is the most suitable model for this task, with Random Forest also performing well but slightly behind in precision–recall trade-offs. Decision Tree, while still useful, shows the least performance in this comparative analysis.
- Receiver Operating Characteristic (ROC) Curve: The Receiver Operating Characteristic (ROC) curves for Random Forest, Gradient Boosting, and Decision Tree, as shown in Figure 13, provide a clear picture of how well each model distinguishes between true and false alerts. The Area Under the Curve (AUC) for each model is used to evaluate the model’s ability to discriminate between the positive and negative classes, with higher AUC scores indicating better performance.
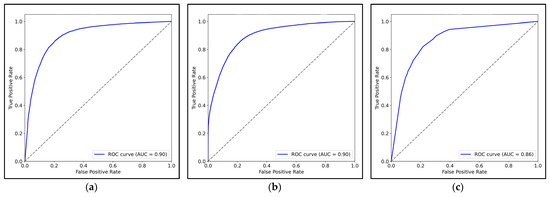 Figure 13. The Receiver Operating Characteristic (ROC) curves. (a) ROC curve for Random Forest; (b) ROC curve for Gradient Boosting; (c) ROC curve for Decision Tree.
Random Forest demonstrates a strong ROC curve with an AUC score of 0.90, which indicates excellent performance in distinguishing between true and false alerts. The curve is steep, showing that the model quickly achieves a high True Positive Rate (TPR) while keeping the False Positive Rate (FPR) low, which suggests high sensitivity and specificity in detecting true incidents.
Gradient Boosting also performs excellently, with an AUC score of 0.90, matching Random Forest. The ROC curve for Gradient Boosting closely resembles that of Random Forest, with a rapid increase in True Positive Rate (TPR) and a low False Positive Rate (FPR), demonstrating that it has similar capabilities in accurately identifying true alerts while minimizing false alarms.
Decision Tree has the lowest AUC score of 0.86, indicating a lower ability to discriminate between true and false alerts compared to Random Forest and Gradient Boosting. The ROC curve for Decision Tree shows a less steep rise in the True Positive Rate (TPR), with a more gradual increase, suggesting that it is less effective at achieving a high TPR while maintaining a low False Positive Rate (FPR).
Therefore, the analysis of the ROC curves highlights the robustness of Random Forest and Gradient Boosting while suggesting that Decision Tree may not perform as effectively, especially when dealing with more complex classification tasks.
- Feature Importance: Figure 14 represents the importance of individual features in predicting true and false alerts for all three models. The feature importance results for Random Forest, Gradient Boosting, and Decision Tree (Figure 14) show consistent trends, with the Hour feature dominating in importance across all three models. This suggests that the time of day is a key determinant in predicting true and false alerts. Report Rating and Day of Week are also among the top features for all models, highlighting their influence in distinguishing between alerts. On the other hand, lower-ranked features like Crash Subtype, Year, and Confidence contributed minimally, suggesting that they may be less relevant for this classification task. These findings provide actionable insights for refining data collection efforts and highlight the potential for reducing dimensionality in future models by focusing on the most impactful features.
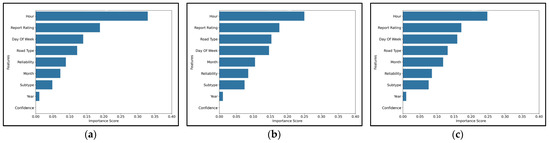 Figure 14. Importance of individual features. (a) Obtained from Random Forest; (b) obtained from Gradient Boosting; (c) obtained from Decision Tree.
However, differences in feature importance scores across models are evident. For example, Gradient Boosting assigns slightly more importance to Report Rating than Random Forest and Decision Tree, indicating that Gradient Boosting may place more weight on user-generated ratings in predicting alerts. Random Forest appears to prioritize Hour more than the other two models, suggesting it may capture temporal patterns more effectively. The Decision Tree model, while consistent with the top features, shows slightly less emphasis on Report Rating, which may be due to the model’s decision-making process, which is more prone to overfitting and might rely on simpler, more interpretable rules.
These differences in feature importance scores can be attributed to the distinct nature of each model: Random Forest aggregates multiple decision trees, Gradient Boosting optimizes sequentially, and Decision Tree builds a single tree, each affecting how features are weighted and interacted with during training.
To recapitulate, based on the results from various evaluation metrics, including precision, recall, F1-score, overall accuracy, confusion matrix, PR curve, and ROC curve, Random Forest emerges as the most reliable model, achieving the highest overall accuracy (83%) and demonstrating excellent performance in distinguishing between true and false alerts. Gradient Boosting closely follows, with a high AUC in both the PR curve and ROC curve (0.90), showing strong predictive power, particularly for true alerts. Decision Tree, while effective, lags behind with a lower AUC score (0.86) and lower precision and recall compared to the other models. These findings highlight that Random Forest and Gradient Boosting are the most robust models for this classification task, while Decision Tree provides a simpler but less effective approach.
4. Conclusions
This study presents a comprehensive framework for utilizing Waze crowdsourced crash alerts in conjunction with official crash reports (NJTR-1) from the New Jersey Department of Transportation (NJDOT) to improve real-time incident detection and prediction accuracy. The methodology incorporates several stages, beginning with the integration of Waze alerts and NJTR-1 crash reports through the Density-Based Spatial–Temporal Clustering of Applications with Noise (DBSCAN) algorithm to identify matched and unmatched alerts, categorizing them as true and false alerts, respectively. This DBSCAN labeling is followed by the development of a binary logit model to identify key predictors of alert accuracy. In the second stage, the study addresses class imbalance through the Synthetic Minority Oversampling Technique (SMOTE) and applies various machine learning algorithms, including Random Forest, Decision Tree, AdaBoost, Gradient Boosting, and Logistic Regression, to predict whether a Waze alert reflects an actual crash.
To identify significant factors influencing the match of Waze alerts and actual crashes, a binary logit model was constructed using data from September 2021 to April 2022 as well as from June and July 2023, revealing several significant predictors, including day of the week, time categories around peak hours, road type, report ratings, and crash type. Specifically, the likelihood of Waze alerts being matched increases during weekdays, peak hours, and on primary streets, while higher user report ratings and major crashes also contribute positively to alert matching rates. This suggests that user engagement is higher around peak hours, possibly due to increased traffic and the need for real-time information. The finding that alerts during weekdays and on primary streets are more matched may reflect users’ familiarity with street-level conditions and their ability to provide more precise information. Higher report ratings are strongly associated with improved alert matching rate, though the data suggest diminishing returns beyond a certain rating level, indicating a complex relationship between user ratings and matching rate. This emphasizes that while user ratings are valuable, their interpretation requires careful consideration. Additionally, the significant matching rate of alerts for major crashes underscores the importance of severity in user reporting. Major incidents likely draw more attention, cause more disruptions, and thereby prompt more matched and timely reports from users, enhancing the reliability of these alerts.
To further enhance the utility of Waze data, machine learning-based predictive models were developed to classify Waze alerts as true or false incidents. Among the models evaluated, Random Forest and Gradient Boosting emerged as the most robust models across various metrics for this classification task. The Random Forest model achieved the highest performance, with an accuracy of 83%, an F1-score of 82.8%, and an Area Under the ROC Curve (AUC-ROC) of 0.90, underscoring its suitability for this binary classification task. Gradient Boosting followed closely, with a high AUC score of 0.90 in both the PR curve and ROC curve, demonstrating its strong ability, particularly in predicting true alerts. However, it showed slightly lower precision for Class 1 (true alerts) at 80% and a lower F1-score for Class 0 (false alerts) at 81% compared to Random Forest, suggesting potential areas for improvement in reducing false alerts and further refining the model’s ability to distinguish between true and false incidents. Analysis of the feature importance revealed that factors such as time of day, report rating, and road type were critical for prediction accuracy across all the models. This predictive modeling framework not only complements the binary logit analysis but also provides a robust tool for real-time decision-making, enabling transportation agencies to deploy resources more effectively and improve traffic management systems.
While this study presents a solid foundation for leveraging crowdsourced data in traffic incident detection, several limitations must be acknowledged. First, the study is based on data from specific time periods (September 2021 to April 2022 and June to July 2023). This limited timeframe may not fully capture seasonal variations in traffic patterns or account for long-term trends. Second, despite the application of SMOTE, the inherent imbalance in the dataset (with a significant prevalence of false alerts) poses a challenge for model training and may affect model generalizability. Third, the study does not incorporate potential influencing factors such as weather conditions or user demographics, which may play a significant role in the accuracy of Waze alerts. Finally, the models developed in this study were trained on data from New Jersey and may not be directly applicable to other regions without further adaptation to local traffic patterns and reporting behaviors.
Overall, the findings underscore the value of user engagement and the critical role of specific contextual factors in enhancing the matching rate of Waze alerts. While the current study analyzes data from September 2021 to April 2022 and June to July 2023, future research could delve into the seasonality of Waze alerts to identify any temporal trends affecting the matching rate. Future work also could explore the integration of additional variables, such as weather conditions or user demographics, to further refine predictive models and improve real-time traffic incident reporting systems. Additionally, leveraging machine learning techniques to dynamically adjust the weight of user ratings based on historical matching rate could further optimize the reliability of crowdsourced traffic alerts. Moreover, the current study does not explicitly discuss the use of crowdsourced data as the primary basis for determining emergency vehicle dispatch. Therefore, future work could explore how the proposed predictive model can assist government agencies, such as NJDOT, in making rapid and precise data-driven decisions regarding the dispatch of Traffic Incident Management (TIM) units to alleviate the effects of non-recurrent congestion caused by unexpected events.
Author Contributions
Research idea development: J.L., D.B., B.D. and L.S.; Model development and data collection: J.L. and M.T.H.; Data analysis and interpretation of results: M.T.H., J.L., B.D. and D.B.; Draft manuscript preparation: M.T.H., J.L. and D.B. All authors have read and agreed to the published version of the manuscript.
Funding
The research was funded by NJDOT ITS Resource Center, grant number 2021 NJIT Task Order 118. The APC was funded by NJDOT ITS Resource Center.
Institutional Review Board Statement
Not applicable.
Informed Consent Statement
Not applicable.
Data Availability Statement
The data utilized in this study are available from the corresponding author upon reasonable request.
Conflicts of Interest
The authors declare no conflicts of interest. The funders had no role in the design of the study; in the collection, analyses, or interpretation of data; in the writing of the manuscript; or in the decision to publish the results.
Abbreviations
The following abbreviations are used in this manuscript:
| NJDOT | New Jersey Department of Transportation |
| SSP | Safety Service Patrol |
| NJSP | New Jersey State Police |
| NJTR-1 | State of New Jersey Police Crash Investigation Report |
| DBSCAN | Density-Based Spatial Clustering of Applications with Noise |
References
- Mukhopadhyay, A.; Pettet, G.; Vazirizade, S.M.; Lu, D.; Jaimes, A.; El Said, S.; Baroud, H.; Vorobeychik, Y.; Kochenderfer, M.; Dubey, A. A Review of Incident Prediction, Resource Allocation, and Dispatch Models for Emergency Management. Accid. Anal. Prev. 2022, 165, 106501. [Google Scholar] [CrossRef] [PubMed]
- Senarath, Y.; Nannapaneni, S.; Purohit, H.; Dubey, A. Emergency Incident Detection from Crowdsourced Waze Data Using Bayesian Information Fusion. In Proceedings of the 2020 IEEE/WIC/ACM International Joint Conference on Web Intelligence and Intelligent Agent Technology (WI-IAT), Melbourne, Australia, 14–17 December 2020; pp. 187–194. [Google Scholar]
- Sandt, A.; McCombs, J.; Al-Deek, H.; Carrick, G. Improving Law Enforcement and Emergency Response to Disabled Vehicle Crashes Using Waze Crowdsourced Data. Transp. Res. Rec. J. Transp. Res. Board 2024, 2678, 666–676. [Google Scholar] [CrossRef]
- About Waze—Waze Help. Available online: https://support.google.com/waze/answer/6071177?hl=en#zippy=%2Chow-does-waze-work (accessed on 22 July 2024).
- Rushe, D. Google Buys Waze Map App for $1.3bn. The Guardian. 11 June 2013. Available online: https://www.theguardian.com/technology/2013/jun/11/google-buys-waze-maps-billion (accessed on 19 May 2025).
- Pack, M.; Ivanov, N. Are You Gonna Go My Waze? Practical Advice for Working with 3rd Party Data Providers. ITE J. 2017, 87, 28–35. [Google Scholar]
- Driving Directions & Traffic Reports by Waze. Available online: https://www.waze.com/wazeforcities/ (accessed on 22 July 2024).
- Li, Z.; Kluger, R.; Hu, X.; Wu, Y.-J.; Zhu, X. Reconstructing Vehicle Trajectories to Support Travel Time Estimation. Transp. Res. Rec. 2018, 2672, 148–158. [Google Scholar] [CrossRef]
- Perez, G.V.A.; Lopez, J.C.; Cabello, A.L.R.; Grajales, E.B.; Espinosa, A.P.; Fabian, J.L.Q. Road Traffic Accidents Analysis in Mexico City through Crowdsourcing Data and Data Mining Techniques. Int. J. Comput. Inf. Eng. 2018, 12, 604–608. [Google Scholar]
- Lin, Y.; Li, R. Real-Time Traffic Accidents Post-Impact Prediction: Based on Crowdsourcing Data. Accid. Anal. Prev. 2020, 145, 105696. [Google Scholar] [CrossRef]
- Praharaj, S.; Zahura, F.T.; Chen, T.D.; Shen, Y.; Zeng, L.; Goodall, J.L. Assessing Trustworthiness of Crowdsourced Flood Incident Reports Using Waze Data: A Norfolk, Virginia Case Study. Transp. Res. Rec. 2021, 2675, 650–662. [Google Scholar] [CrossRef]
- Zhang, Z. Exploring the Potentials of Using Crowdsourced Waze Data in Traffic Management: Characteristics and Reliability. Ph.D. Thesis, Graduate School, Knoxville, TN, USA, 2020. [Google Scholar]
- Eriksson, I. Towards Integrating Crowdsourced and Official Traffic Data: A Study on the Integration of Data from Waze in Traffic Management in Stockholm, Sweden. Master’s Thesis, Uppsala University, Uppsala, Sweden, 2019. [Google Scholar]
- dos Santos, S.R.; Davis Jr, C.A.; Smarzaro, R. Analyzing Traffic Accidents Based on the Integration of Official and Crowdsourced Data. J. Inf. Data Manag. 2017, 8, 67–82. [Google Scholar]
- Amin-Naseri, M.; Chakraborty, P.; Sharma, A.; Gilbert, S.B.; Hong, M. Evaluating the Reliability, Coverage, and Added Value of Crowdsourced Traffic Incident Reports from Waze. Transp. Res. Rec. 2018, 2672, 34–43. [Google Scholar] [CrossRef]
- Safety Service Patrol, Highway Safety, About NJDOT. Available online: https://www.nj.gov/transportation/about/safety/ssp.shtm (accessed on 22 July 2024).
- Ester, M.; Kriegel, H.-P.; Sander, J.; Xu, X. A Density-Based Algorithm for Discovering Clusters in Large Spatial Databases with Noise. In Proceedings of the Second International Conference on Knowledge Discovery and Data Mining, Portland, OR, USA, 31 December 1996; Volume 96, pp. 226–231. [Google Scholar]
- Hoseinzadeh, N.; Liu, Y.; Han, L.D.; Brakewood, C.; Mohammadnazar, A. Quality of Location-Based Crowdsourced Speed Data on Surface Streets: A Case Study of Waze and Bluetooth Speed Data in Sevierville, TN. Comput. Environ. Urban Syst. 2020, 83, 101518. [Google Scholar] [CrossRef]
- Goodall, N.; Lee, E. Comparison of Waze Crash and Disabled Vehicle Records with Video Ground Truth. Transp. Res. Interdiscip. Perspect. 2019, 1, 100019. [Google Scholar] [CrossRef]
- Krdy, M.A.; Al-Ott, A.; Sandt, A.; Al-Deek, H.; Carrick, G.; Ibrahim, S. Improving Law Enforcement Response by Utilizing Crowdsourced Data to Complement Computer-Aided Dispatch Data. In Proceedings of the 104th Transportation Research Board (TRB) Annual Meeting, Washington, DC, USA, 5–9 January 2025. [Google Scholar]
- Waze Data Feed Specifications—Waze Partners Help. Available online: https://support.google.com/waze/partners/answer/13458165?hl=en#zippy=%2Ctraffic-alerts%2Cusing-waze-traffic-data%2Cretrieving-waze-traffic-data%2Cjson-format%2Cxml%2Creliability-and-confidence-scores%2Cdata-elements%2Cjson (accessed on 26 July 2024).
- Your Rank and Points—Wazeopedia. Available online: https://www.waze.com/wiki/Canada/Your_Rank_and_Points (accessed on 26 July 2024).
- Accident Type Descriptions—Waze Forum. Available online: https://www.waze.com/forum/viewtopic.php?t=79663 (accessed on 26 July 2024).
- New Jersey Njtr-1 Crash Report Manual; Motor Vehicle Comission: Trenton, NJ, USA, 2023.
- Chawla, N.V.; Bowyer, K.W.; Hall, L.O.; Kegelmeyer, W.P. SMOTE: Synthetic Minority over-Sampling Technique. J. Artif. Intell. Res. 2002, 16, 321–357. [Google Scholar] [CrossRef]
- Breiman, L. Random Forests. Mach. Learn. 2001, 45, 5–32. [Google Scholar] [CrossRef]
- Myles, A.J.; Feudale, R.N.; Liu, Y.; Woody, N.A.; Brown, S.D. An Introduction to Decision Tree Modeling. J. Chemom. 2004, 18, 275–285. [Google Scholar] [CrossRef]
- Schapire, R.E. Explaining AdaBoost. In Empirical Inference; Schölkopf, B., Luo, Z., Vovk, V., Eds.; Springer: Berlin/Heidelberg, Germany, 2013; pp. 37–52. ISBN 978-3-642-41135-9. [Google Scholar]
- Natekin, A.; Knoll, A. Gradient Boosting Machines, a Tutorial. Front. Neurorobot. 2013, 7, 21. [Google Scholar] [CrossRef] [PubMed]
- DeMaris, A. A Tutorial in Logistic Regression. J. Marriage Fam. 1995, 57, 956–968. [Google Scholar] [CrossRef]
- StratifiedKFold. Available online: https://scikit-learn.org/stable/modules/generated/sklearn.model_selection.StratifiedKFold.html (accessed on 15 January 2025).
- Alshehri, A.; Eustace, D.; Hovey, P. Analysis of Factors Affecting Crash Severity of Pedestrian and Bicycle Crashes Involving Vehicles at Intersections. In Proceedings of the International Conference on Transportation and Development 2020, Seattle, WA, USA, 26–29 May 2020; American Society of Civil Engineers: Reston, VA, USA, 2020; pp. 49–58. [Google Scholar]
- Agresti, A. An Introduction to Categorical Data Analysis; Wiley: Hoboken, NJ, USA, 1996. [Google Scholar]
- StandardScaler. Available online: https://scikit-learn.org/stable/modules/generated/sklearn.preprocessing.StandardScaler.html (accessed on 15 January 2025).
- Train_test_split. Available online: https://scikit-learn.org/stable/modules/generated/sklearn.model_selection.train_test_split.html (accessed on 15 January 2025).
- RandomizedSearchCV. Available online: https://scikit-learn.org/stable/modules/generated/sklearn.model_selection.RandomizedSearchCV.html (accessed on 15 January 2025).
- RandomForestClassifier. Available online: https://scikit-learn.org/stable/modules/generated/sklearn.ensemble.RandomForestClassifier.html (accessed on 16 January 2025).
- DecisionTreeClassifier. Available online: https://scikit-learn.org/stable/modules/generated/sklearn.tree.DecisionTreeClassifier.html (accessed on 16 January 2025).
- AdaBoostClassifier. Available online: https://scikit-learn.org/stable/modules/generated/sklearn.ensemble.AdaBoostClassifier.html (accessed on 16 January 2025).
- GradientBoostingClassifier. Available online: https://scikit-learn.org/stable/modules/generated/sklearn.ensemble.GradientBoostingClassifier.html (accessed on 16 January 2025).
- LogisticRegression. Available online: https://scikit-learn.org/stable/modules/generated/sklearn.linear_model.LogisticRegression.html (accessed on 16 January 2025).
- Fan, J.; Upadhye, S.; Worster, A. Understanding Receiver Operating Characteristic (ROC) Curves. Can. J. Emerg. Med. 2006, 8, 19–20. [Google Scholar] [CrossRef] [PubMed]
Disclaimer/Publisher’s Note: The statements, opinions and data contained in all publications are solely those of the individual author(s) and contributor(s) and not of MDPI and/or the editor(s). MDPI and/or the editor(s) disclaim responsibility for any injury to people or property resulting from any ideas, methods, instructions or products referred to in the content. |
© 2025 by the authors. Licensee MDPI, Basel, Switzerland. This article is an open access article distributed under the terms and conditions of the Creative Commons Attribution (CC BY) license (https://creativecommons.org/licenses/by/4.0/).