Article

Performance Variability in Public Clouds: An Empirical Assessment

School of Computing, University of North Florida, Jacksonville, FL 32224, USA
*
Author to whom correspondence should be addressed.
Information 2025, 16(5), 402; https://doi.org/10.3390/info16050402
Submission received: 13 April 2025 / Revised: 12 May 2025 / Accepted: 12 May 2025 / Published: 14 May 2025
(This article belongs to the Special Issue Performance Engineering in Cloud Computing)

Abstract

:
Cloud computing is now established as a viable alternative to on-premise infrastructure from both a system administration and cost perspective. This research provides insight into cluster computing performance and variability in cloud-provisioned infrastructure from two popular public cloud providers, Amazon Web Services (AWS) and Google Cloud Platform (GCP). In order to evaluate the perforance variability between these two providers, synthetic benchmarks including Memory bandwidth (STREAM), Interleave or Random (IoR) performance, and Computational CPU performance by NAS Parallel Benchmarks-Embarrassingly Parallel (NPB-EP) were used. A comparative examination of the two cloud platforms is provided in the context of our research methodology and design. We conclude with a discussion of the results of the experiment and an assessment of the suitability of public cloud platforms for certain types of computing workloads. Both AWS and GCP have their strong points, and this study provides recommendations depending on user needs for high throughput and/or performance predictability across CPU, memory, and Input/Output (I/O). In addition, the study discusses other factors to help users decide between cloud vendors such as ease of use, documentation, and types of instances offered.

1. Introduction

Cloud computing is now well established with characteristics such as on-demand-self-service, broad network access, resource pooling, rapid elasticity, and measured service [1]. Some of the leading Cloud Service Providers (CSPs) include Amazon, Google, Azure, Oracle, among others. When selecting between the different Cloud Service Providers (CSPs), consumers need to evaluate them based on their needs and factors such as performance, security, price, reliability, storage, etc.
CSPs generally offer three types of service models, including Infrastructure as a Service (IaaS), Platform as a Service (PaaS), and Software as a Service (SaaS). IaaS provides user access to the Application, Data, Runtime, Middleware, and OS layers in the stack. This would include access to virtual machines (VMs), storage, networking, etc. On the other hand, PaaS lets users manage the Application and Data layers and is suited to developers without being concerned about the underlying infrastructure. In SaaS, the provider provides access to their software and manages all underlying servers and networking.
This research provides a vendor-neutral performance assessment of IaaS cloud performance and variability using benchmarking to compare memory bandwidth, IO performance, and computational (CPU) performance of cloud-hosted clusters of VMs. We measure these metrics with an increasing number of nodes in the cluster. The benchmarks we used for memory bandwidth, IO performance, and computational performance are STREAM, IOR (Interleave or Random), and NPB-EP, respectively. The benchmark results were analyzed to determine the scalability, statistical significance, and performance unpredictability of AWS as compared to GCP. Due to the multi-tenant nature of public IaaS clouds, user applications may be impacted by the noisy neighbor scenario, leading to performance unpredictability. This research attempts to capture this impact. The Message Passing Interface (MPI) versions of the benchmarks were used in the cluster.
The rest of the paper is organized as follows. Section 2 provides a non-exhaustive overview of the services offered (subject to change by vendors) by AWS and GCP, while a literature review is provided in Section 3. Results are discussed in Section 4, and Section 5 provides the Conclusions.

2. Cloud Computing Platform

AWS—Elastic Cloud Computing (EC2) and Google Cloud Platform (GCP) Services

We researched the services provided by AWS Elastic Cloud Computing (EC2) and GCP. Factors such as architecture, types of instances offered, performance, security, and reliability were researched and documented here. Details regarding the two platforms are shown in Table 1. Please note that this is only intended as an introduction to services offered and certainly not intended to be an exhaustive list and is subject to change by cloud vendors at any time.

3. Related Work

Li et al. in [4] also performed a similar study to compare the performance of GCP with EC2. They measured four service features—communication, memory, storage, and computation [4]. For memory, they used data throughput as the capability metric and the STREAM benchmark [5]. For storage, they used transaction speed and data throughput as the capability metric and Bonnie++ as their benchmark [4]. For computation, they used transaction speed and performance/price ratio as the capability metric and NPB-MPI as their benchmark [4]. The authors revealed both potential advantages and disadvantages of applying GCP to scientific computing. They suggested that GCP may be better suited in comparison to EC2 for applications that require frequent disk operations [4]. However, GCP may not be best suited for VM-based parallel computing.
Villalpando et al. in [6] showcased a design of a performance analysis platform that included infrastructure and a framework for performance measurement for the design, validation, and comparison of performance models and algorithms for cloud computing [6]. The aim of this study was to help users better understand and compare the relationships between performance attributes of different cloud systems [6].
Shoeb et al. in [7] performed a comparative study on I/O performance between computing- and storage-optimized instances of Amazon EC2. The study compared the performance and cost of these instances. The authors concluded that the I/O performance of the same instance type varies over different time periods [7].
Prasetio et al. in [8] discuss the performance of distributed database systems in a cloud computing environment, since distributed database systems in cloud computing environments can cause performance issues. The objective of this study was to help users choose the most appropriate cloud computing platform for their needs. They used AWS as the cloud platform for their study and concluded that the choice between cloud and local hosting may depend on factors like query complexity, network latency, among other factors [8].
The research presented in this paper is comprehensive because we have used system-level benchmarks that capture performance metrics across memory, computing, and I/O tiers. It is known that public clouds that are multi-tenant and can show performance variability over a period of time. This study provides insight into the performance variability observed for these metrics across varying time periods spread over two weeks. For each experiment, the number of active nodes in the cloud cluster processing the benchmark varied. Five configurations (scenarios) were chosen: 1 node, 2 nodes, 4 nodes, 6 nodes, and 8 nodes, respectively. Furthermore, the research includes two of the leading public cloud providers to provide a more representative study of the major cloud providers.

4. Results

4.1. Test Bed

The virtual machine node specifications are provided in Table 2.

4.2. Benchmarks and Metrics

Each benchmark was compiled on the virtual machine instance from which the results were collected.

4.2.1. STREAM

This benchmark measures and outputs memory bandwidth or best rate in MB/s with 4 different functions (Add, Copy, Scale, Triad). According to [5], “The STREAM benchmark is a simple synthetic benchmark program that measures sustainable memory bandwidth (in MB/s) and the corresponding computation rate for simple vector kernels”.
Each execution of the benchmark performs four operations (Copy, Scale, Add, and Triad) and selects the best metrics from one of ten runs. The average memory bandwidth (MB/s), average time (microseconds), minimum time (microseconds), and maximum time (microseconds) are collected. This benchmark is important for measuring the memory capabilities of VMs and the effects of the ‘memory wall’ on high-performance computing capabilities in a cloud-provisioned cluster infrastructure.

4.2.2. NPB (NAS Parallel Benchmarks)

This benchmark is designed to measure the computing performance of cluster or grid supercomputers in highly parallel tasks [9]. While NPB has several execution modes, we are only concerned with the embarrassingly parallel, or EP, configuration. This benchmark measures and outputs the communication performance with two metrics for EP: Execution Time to Complete in seconds and Million operations per second (MOPS).
According to [8], “NPB are a small set of programs designed to help evaluate the performance of parallel supercomputers. This benchmark contains of eight programs: five kernels and three pseudo-applications” [9].

4.2.3. IOR (Interleave or Random)

I/O performance is increasingly important for data-intensive computing. IOR measures parallel I/O performance in HPC environments. It is an MPI-based application that can generate I/O workloads in interleaved or random patterns. The benchmark measures input/output performance in MiB/s (1 MiB/s = 1 MB/s × 1.048) or read/write operations per second (Op/s). The IOR software is used for benchmarking parallel file systems using POSIX, MPIIO, or HDF5 interfaces [10]. I/O performance in MB/s is collected for both read and write operations, as well as the number of Op/s.

4.3. Research Methodology

IaaS cloud platforms are generally multi-tenant, and user applications may be impacted by “noisy neighbors”. This occurs when one tenant’s excessive resource usage negatively impacts the performance or availability of other tenants using the same shared infrastructure. This can negatively impact other tenants in terms of slower performance and higher latency. The impact of the noisy neighbor tends to be random, and in order to capture some of this impact, the benchmarks were run over two random days at three different periods. It was ensured that the background processes within each VM used in the experiments were identical. Furthermore, to capture the performance of both a single node and a cluster of nodes in the cloud, the benchmarks were run using node counts of 1, 2, 4, 6, and 8.
A series of experiments was conducted on each cluster using the benchmarks described in Section 4.2. For each benchmark, there were 30 executions on each cluster. The experiments were split in half, and two random days were chosen for the execution. Each day, the benchmark was tested three times: early morning, mid-day (early afternoon), and late evening. For each experiment, the number of active nodes processing the test was varied. Five configurations were chosen: 1 node, 2 nodes, 4 nodes, 6 nodes, and 8 nodes, respectively. A test matrix is shown in Table 3.

4.4. Results

4.4.1. Stream Benchmark Results

The execution of the Stream Benchmarks on both EC2 and GCP showed that both platforms are capable of scaling to increase the computational throughput. There is, however, a marked difference in the total throughput (MBps), indicating that AWS EC2 provided a higher throughput. A graphical representation of the best rate in MBps is shown in Figure 1. Overall, AWS outperforms GCP irrespective of the number of nodes and measuring function.

4.4.2. Stream Benchmark Statistical Analysis

After executing the Stream Benchmark for the planned test bed, a basic statistical analysis was conducted and documented in Table 4 and Table 5, as shown below. It can be observed for both platforms that the standard deviation is very narrow.

4.4.3. Stream Benchmark Box-Plot Analysis

Figure 2 depicts the Inter-Quartile Range and Median as calculated with the data gathered during the statistical analysis. The box plots clearly show that both providers have a comparable behavior across both execution test sets. It is also visible that the MBps rate generated by AWS-EC2 is greater than that of GCP.

4.4.4. Stream Benchmark Significance Test

Further analysis uncovered that the difference in throughput (MBps) between the clouds is statistically significant when comparing AWS and GCP. The data used in performing T-Tests and deducing significance are shown in Table 6 along with the calculated p-value (test results were grouped by node count).

4.4.5. NP Benchmark Results

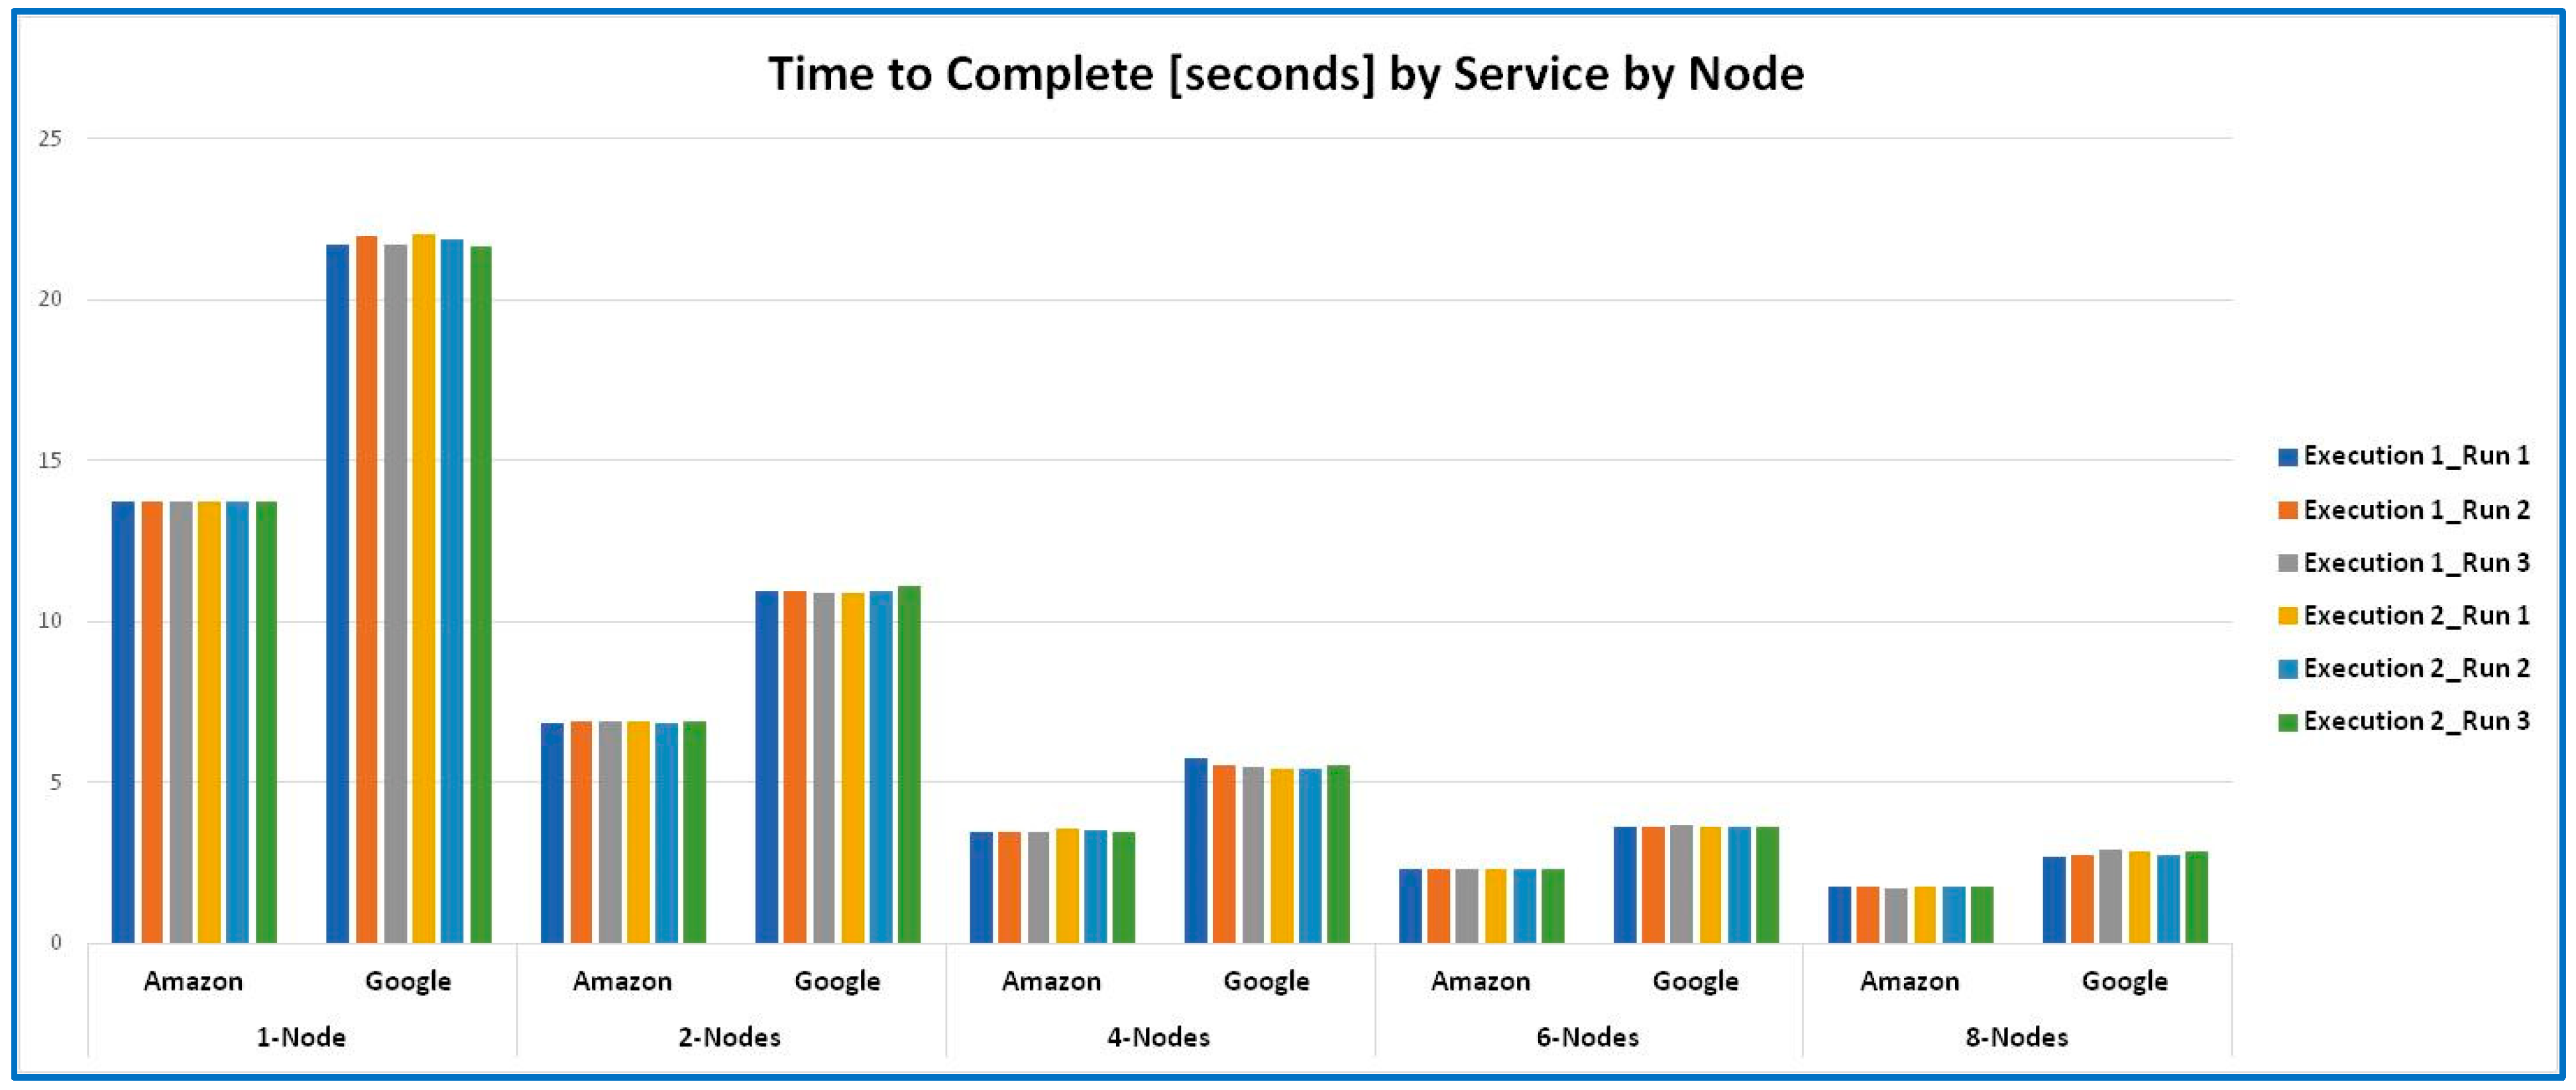
The results for the NP Benchmark were measured in millions of operations per second (MOPS) as well as the total time for completion. The number of tests performed matches those used for the other two benchmarks. Interestingly, Figure 3 shows an inverse relation between the EC2 and GCP results. While the total MOPs for EC2 gradually reduce as the number of nodes is increased, the total MOPs for GCP substantially increase as more nodes are added with each run. Regarding the total time in seconds for execution of the tests, this gradually reduced for both EC2 and GCP, as shown in Figure 4.

4.4.6. NP Benchmark Statistical Analysis

This is shown in Table 7. Unlike the Stream Benchmark, the statistical analysis performed over the NP Benchmark showed to be less predictable when comparing the corresponding standard deviations. Also noticeable is the wide difference between the means and medians of EC2 versus GCP.

4.4.7. NP Benchmark Significance Test

The results for execution time and MOPS were found to be statistically significant with p-values of 0.0125 and 0.0002, respectively.

4.4.8. IOR Benchmark Results

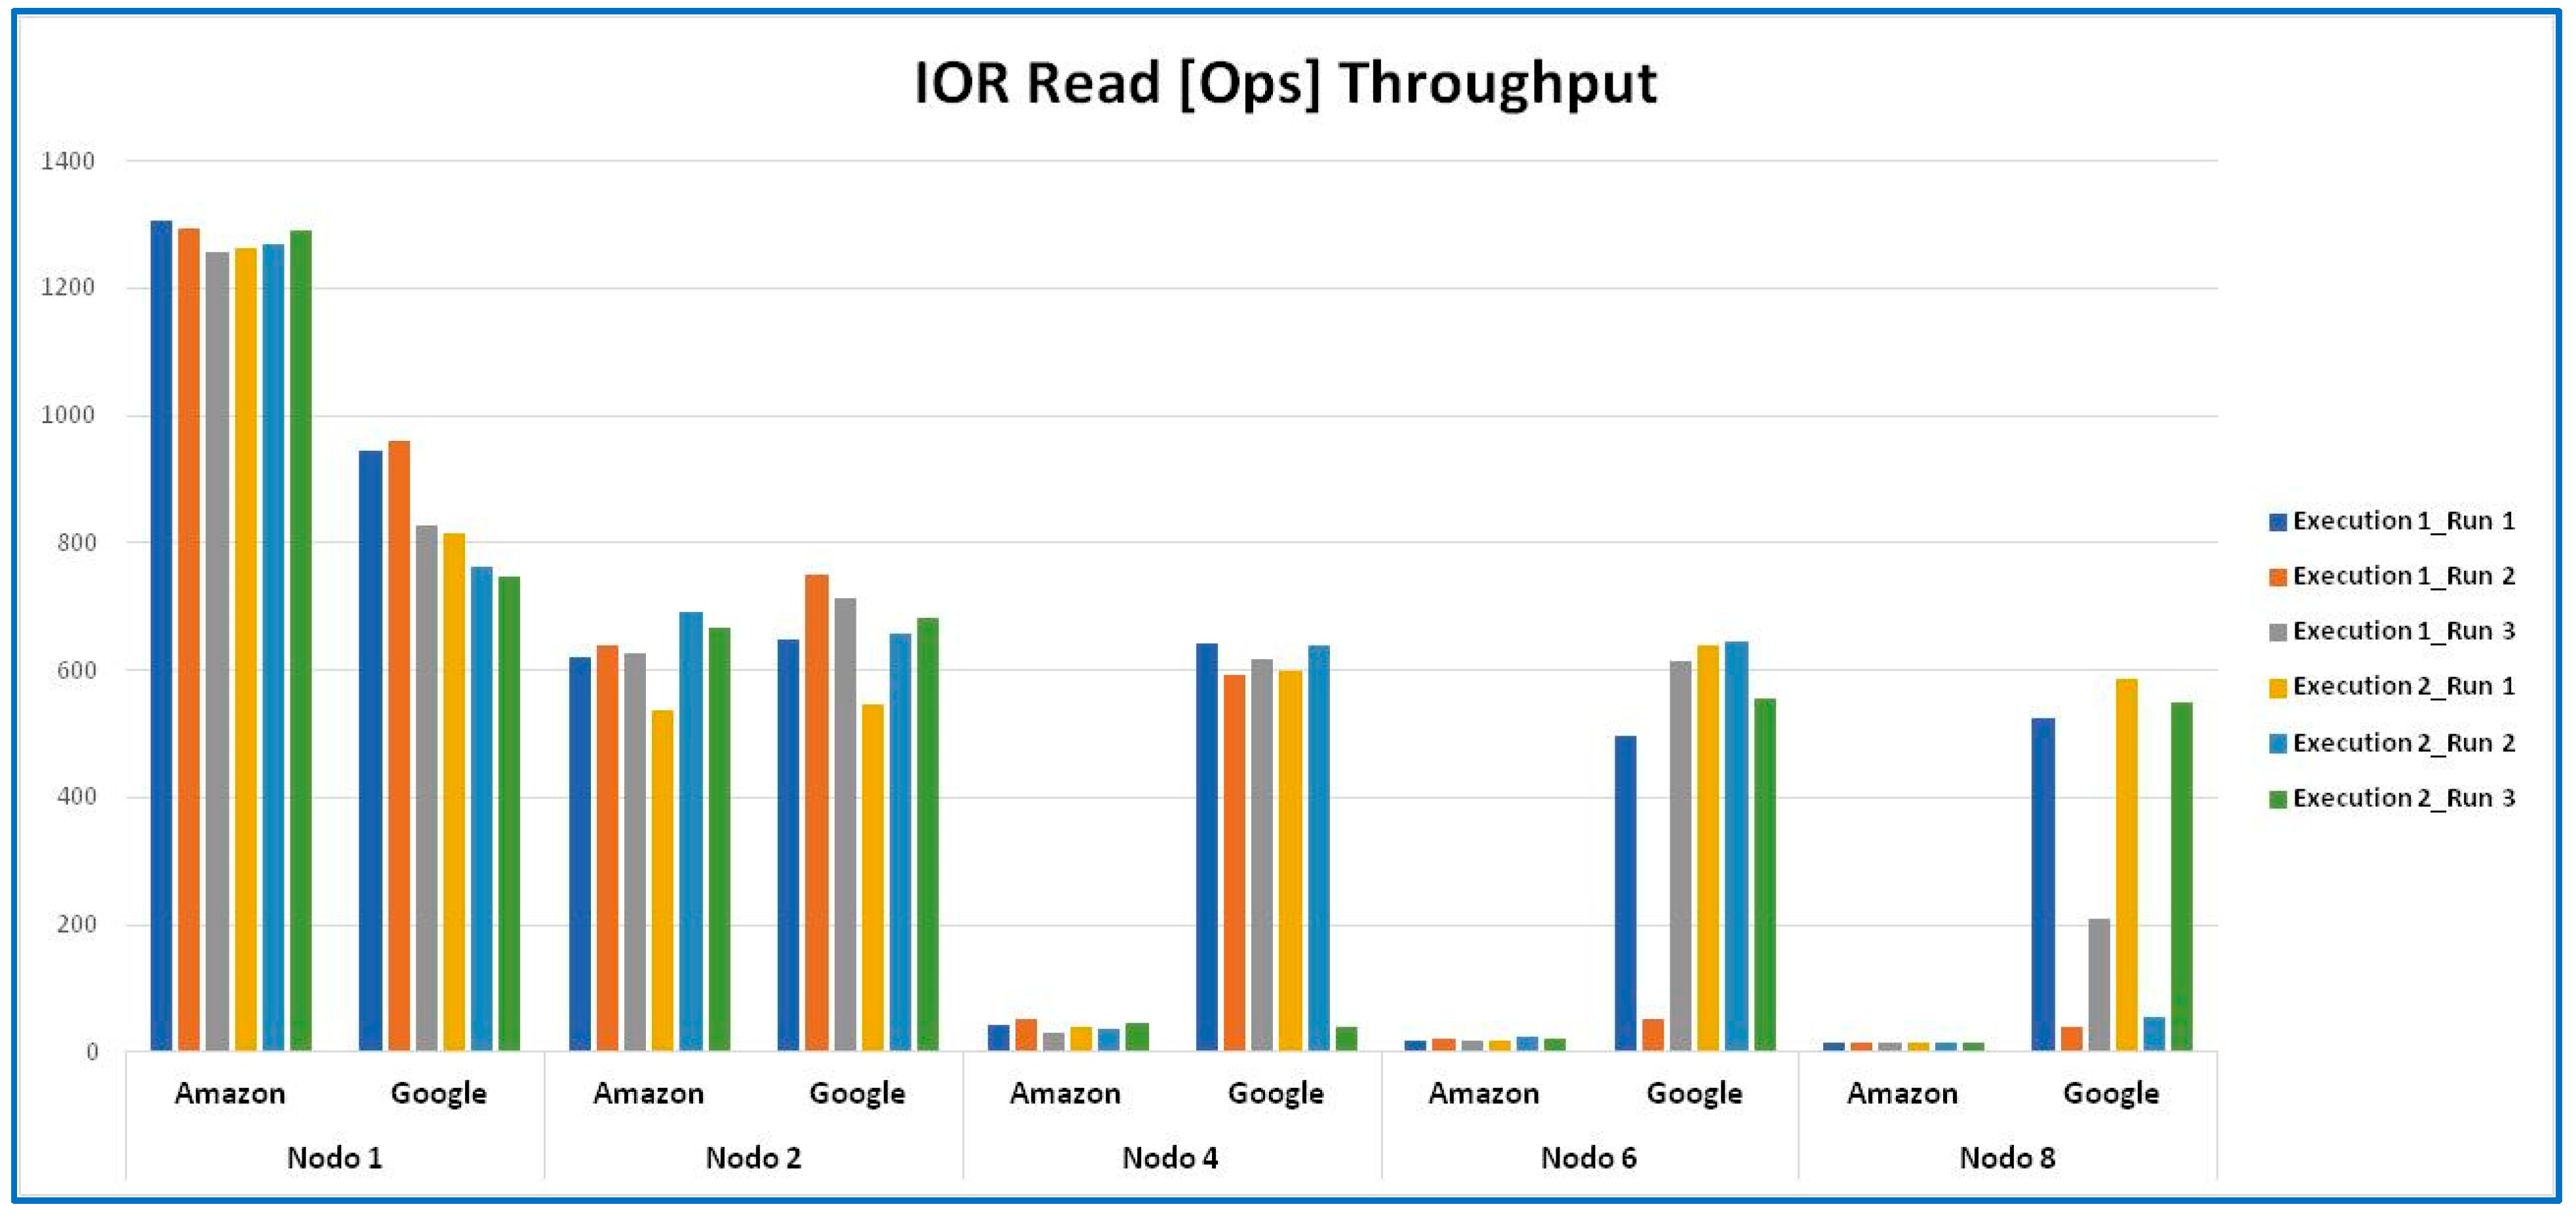
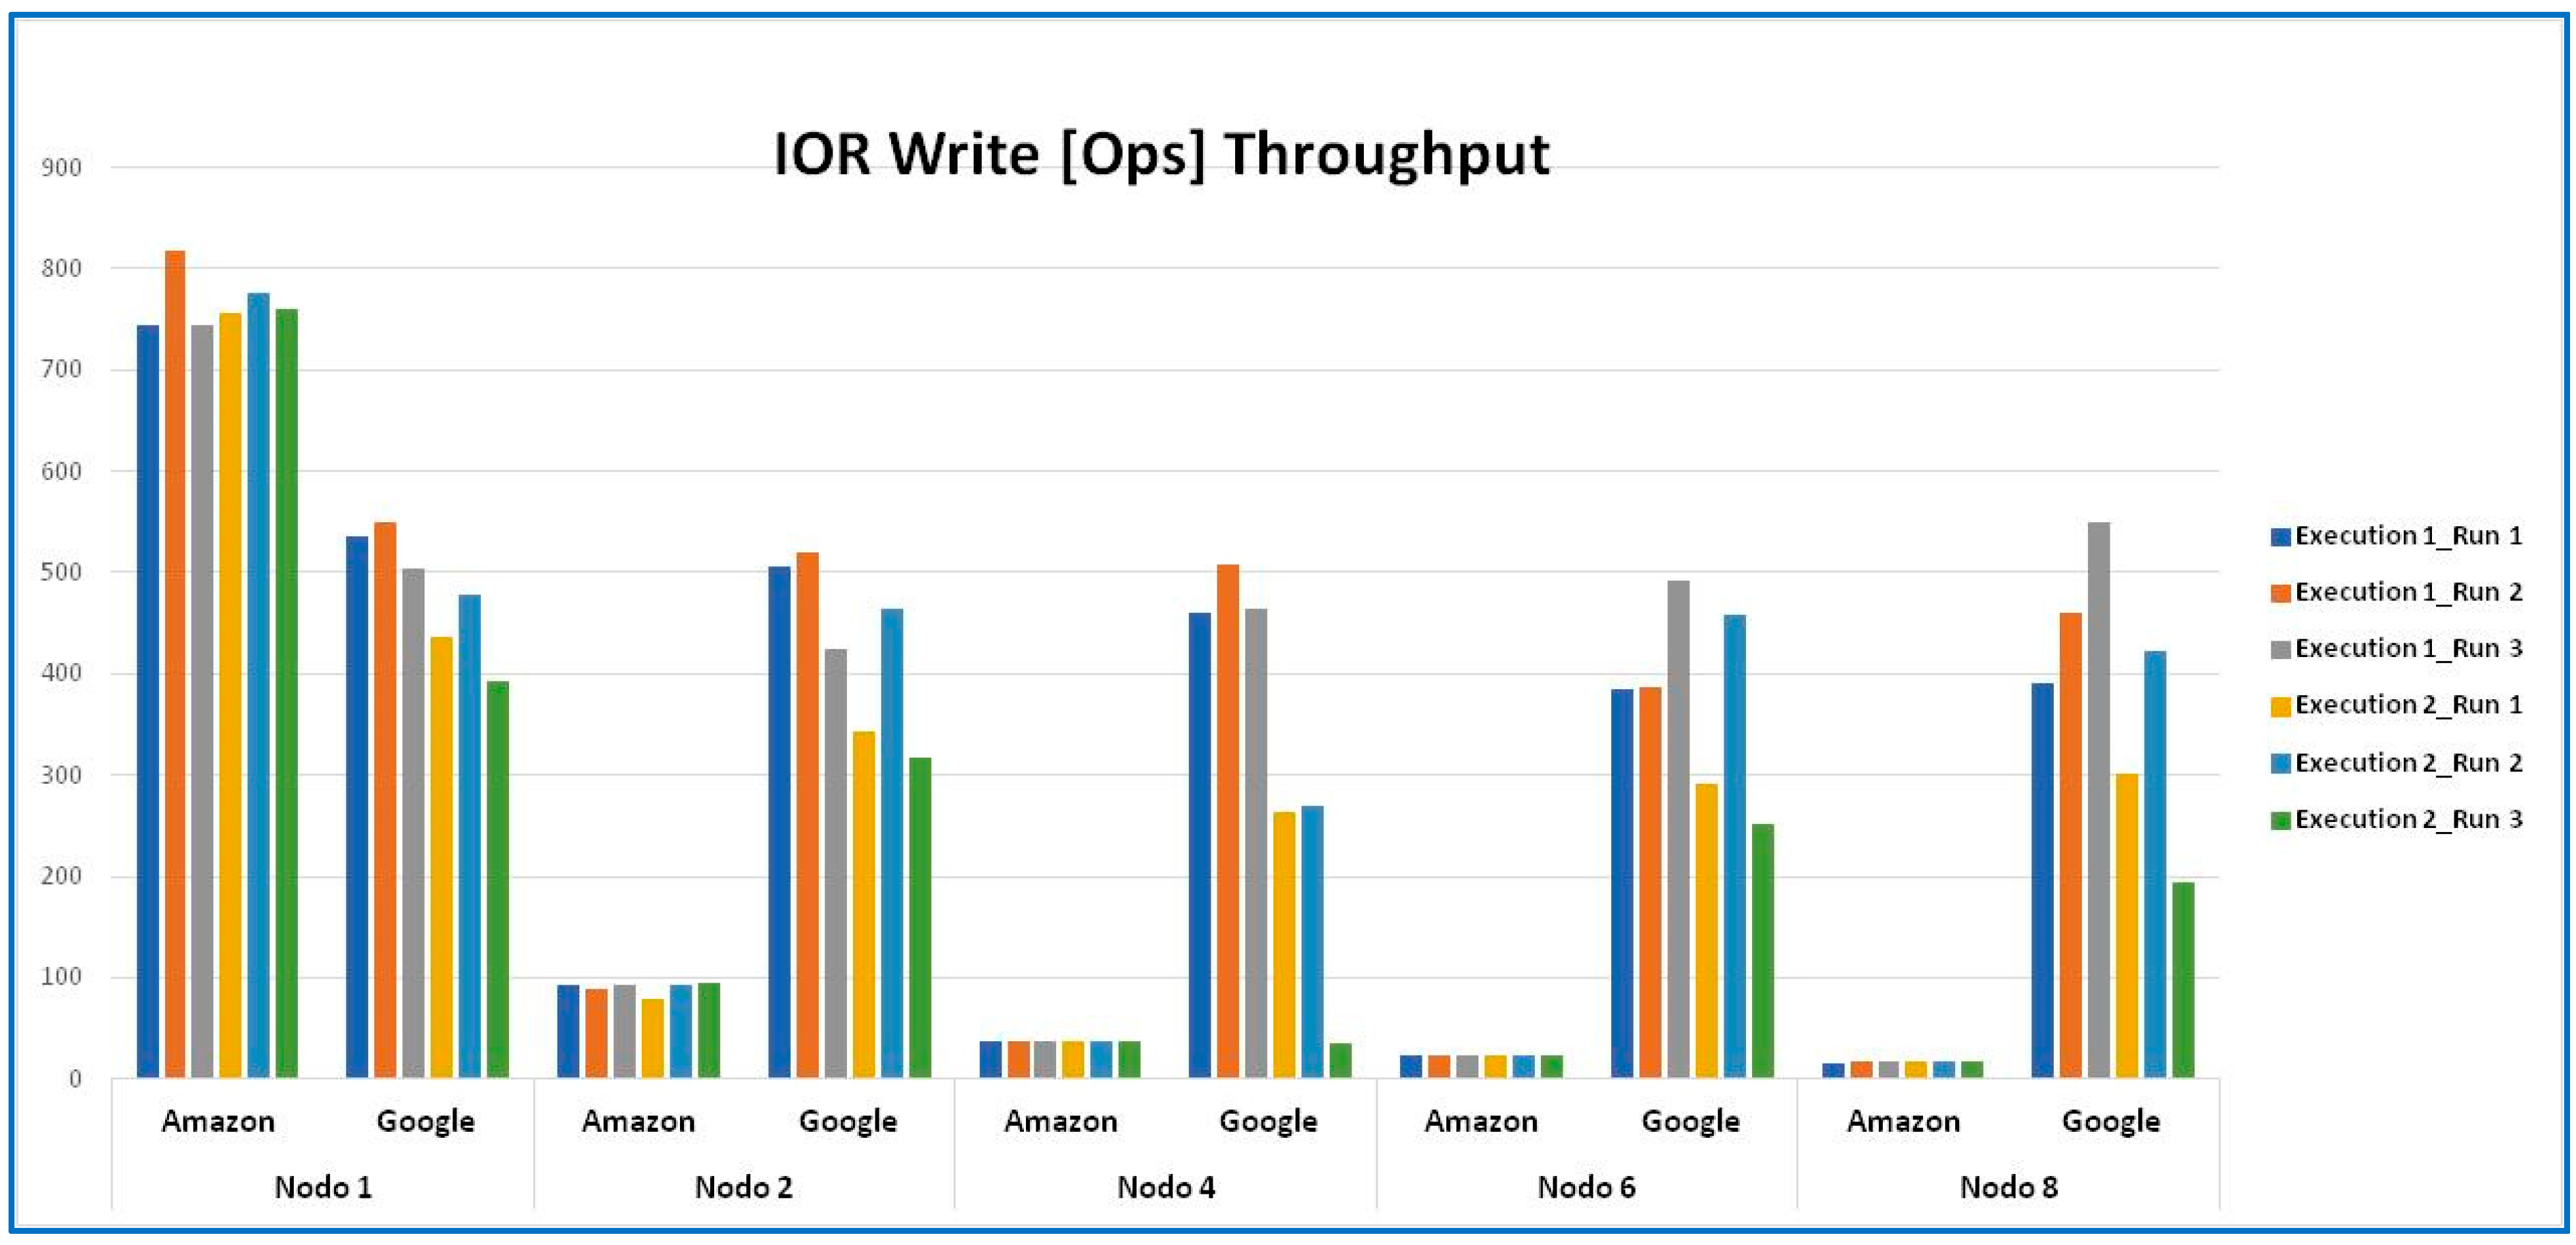
The results for the IOR Benchmark were measured in operations per second (OPs) for two functions: read and write. The number of tests performed matches those used in Stream and NP benchmarks. Like the NP Benchmark results, the EC2 total OPs decreased as the number of nodes increased. However, for the IOR benchmark, the GCP results were not inversed with respect to EC2. Rather, the total OPs for GCP also decreased as nodes were added to the execution. Figure 5 and Figure 6 show the decrease in total OPs for the read and write operations, respectively. Also noticeable in the graphs is the variability in the results generated by the execution on the GCP platform. Unlike GCP, Amazon’s EC2 performed consistently across all IOR executions.

4.4.9. IOR Benchmark Statistical Analysis

Like the findings in Figure 5 and Figure 6, the statistical analysis further supports the visuals. For both the read and write functions, it can be observed that the measured standard deviations for EC2 are quite similar and close to the mean, whereas the standard deviations for GCP are disparate. Table 8 lists the statistical analysis performed for the IOR benchmark.

4.4.10. IOR Benchmark Box-Plot Analysis

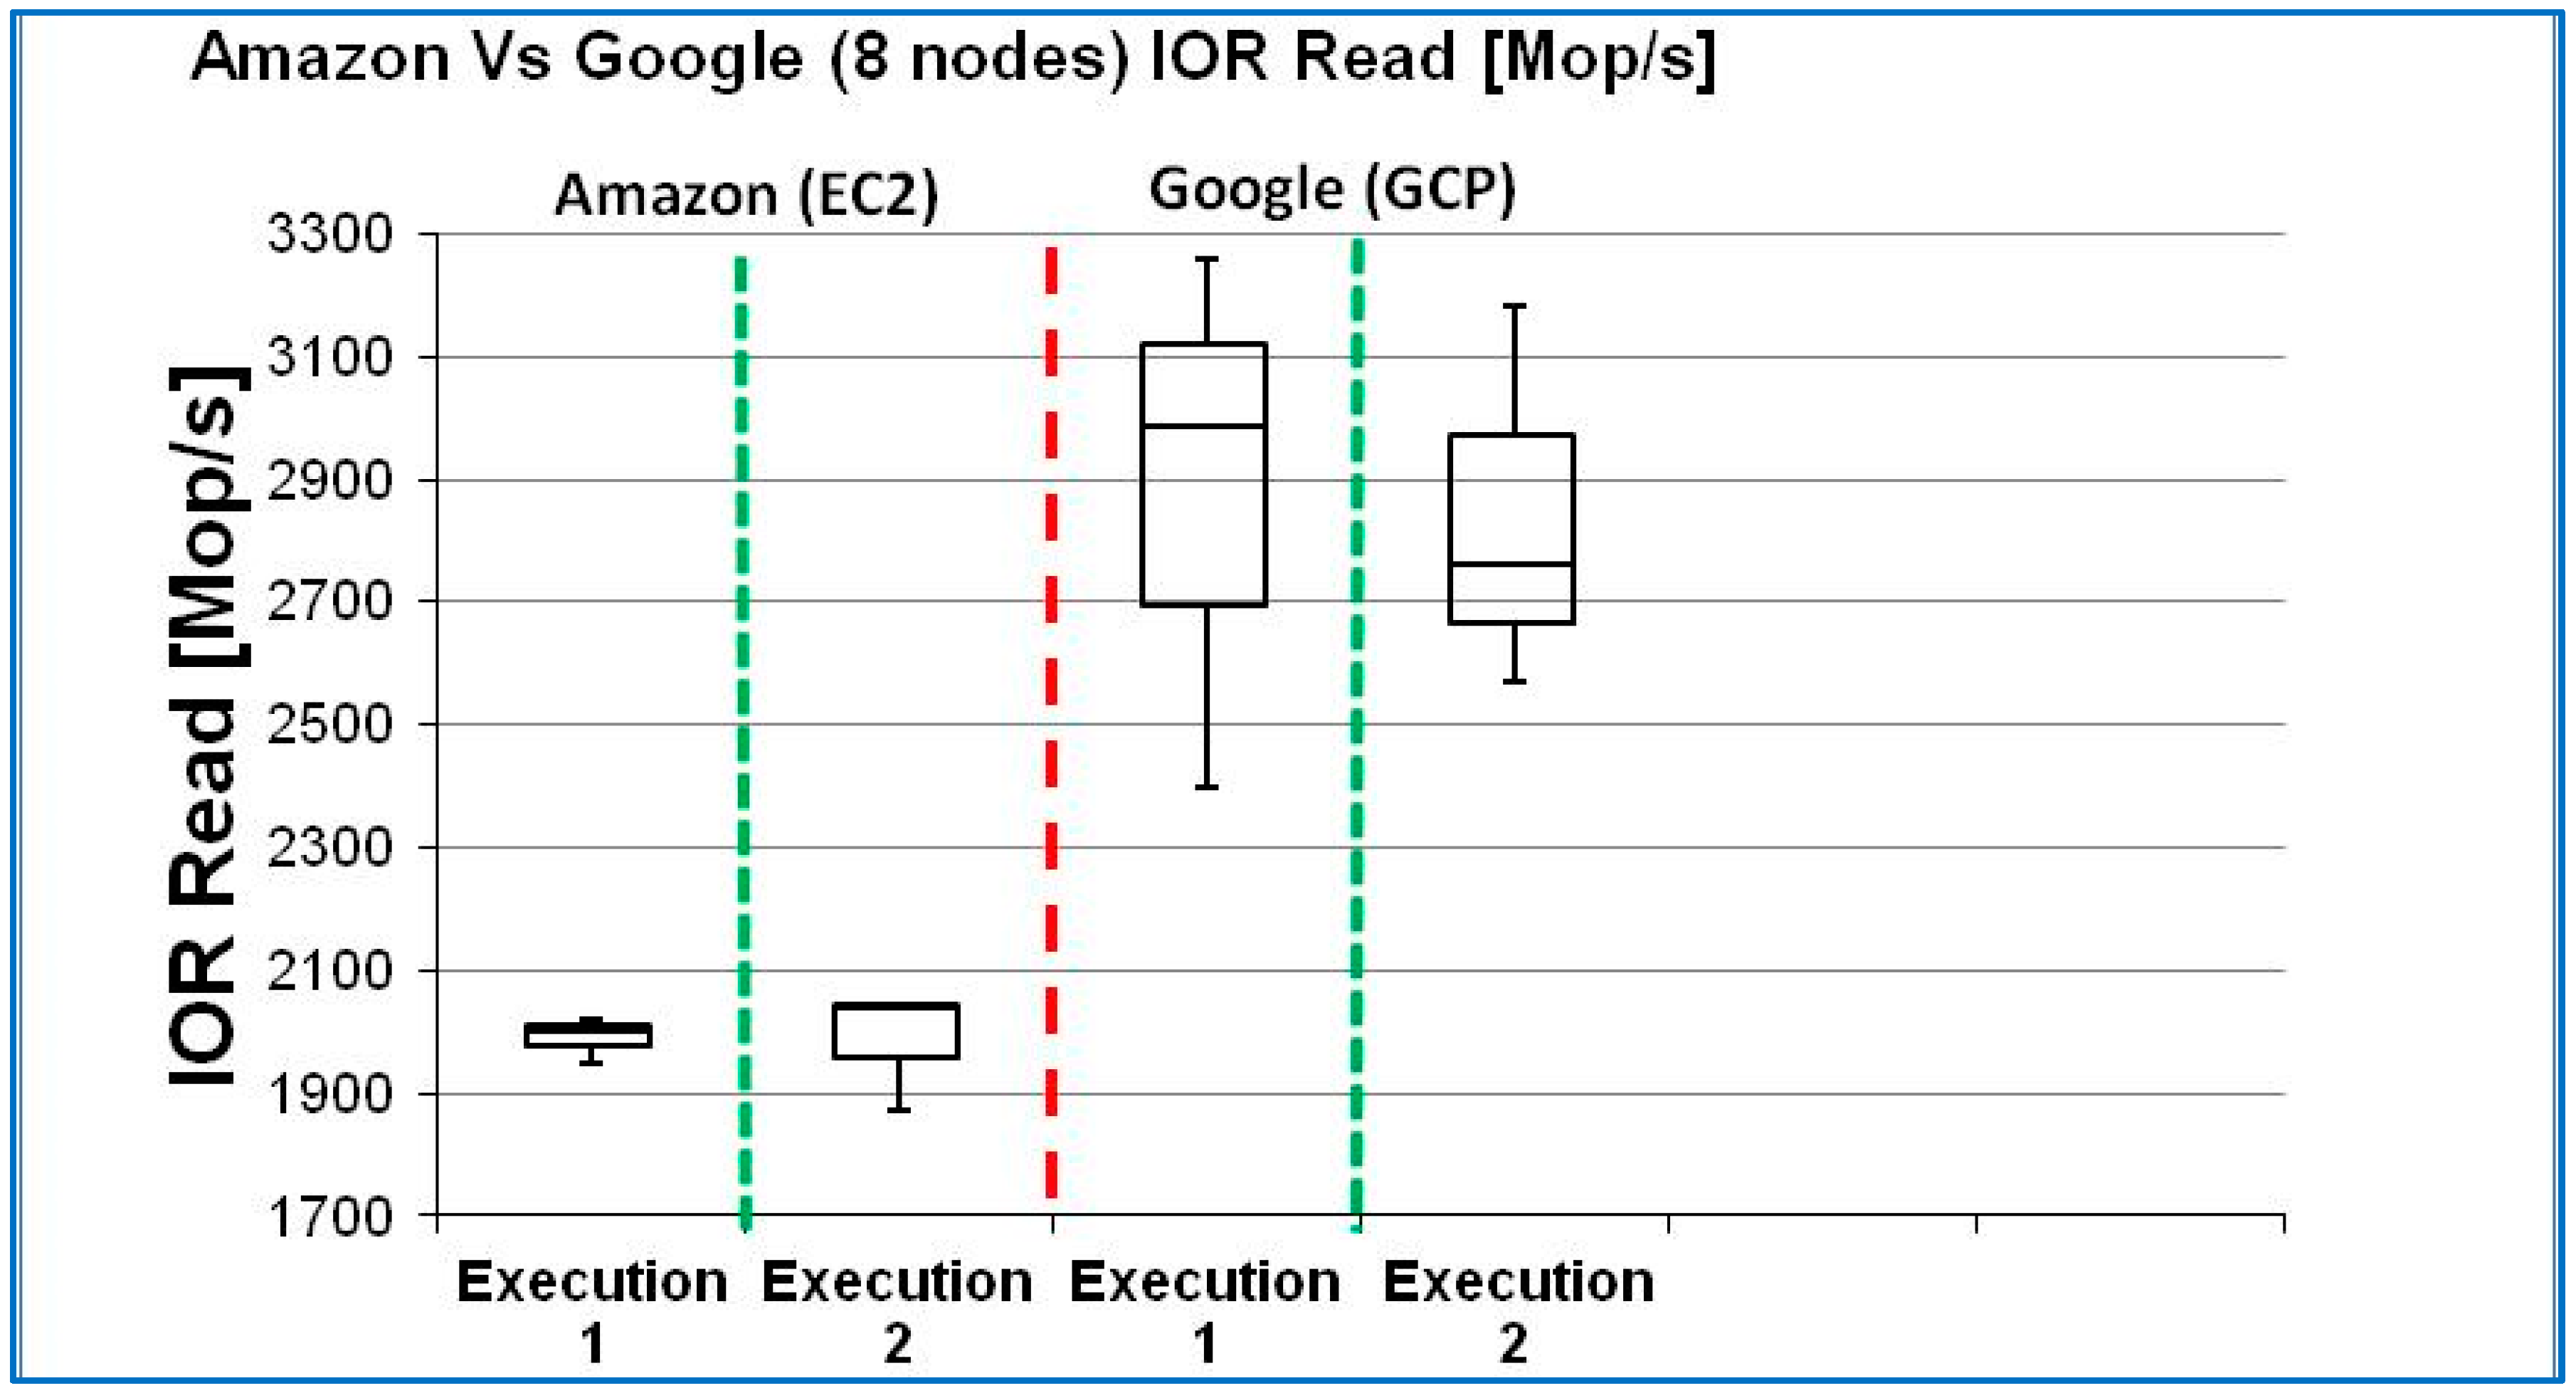
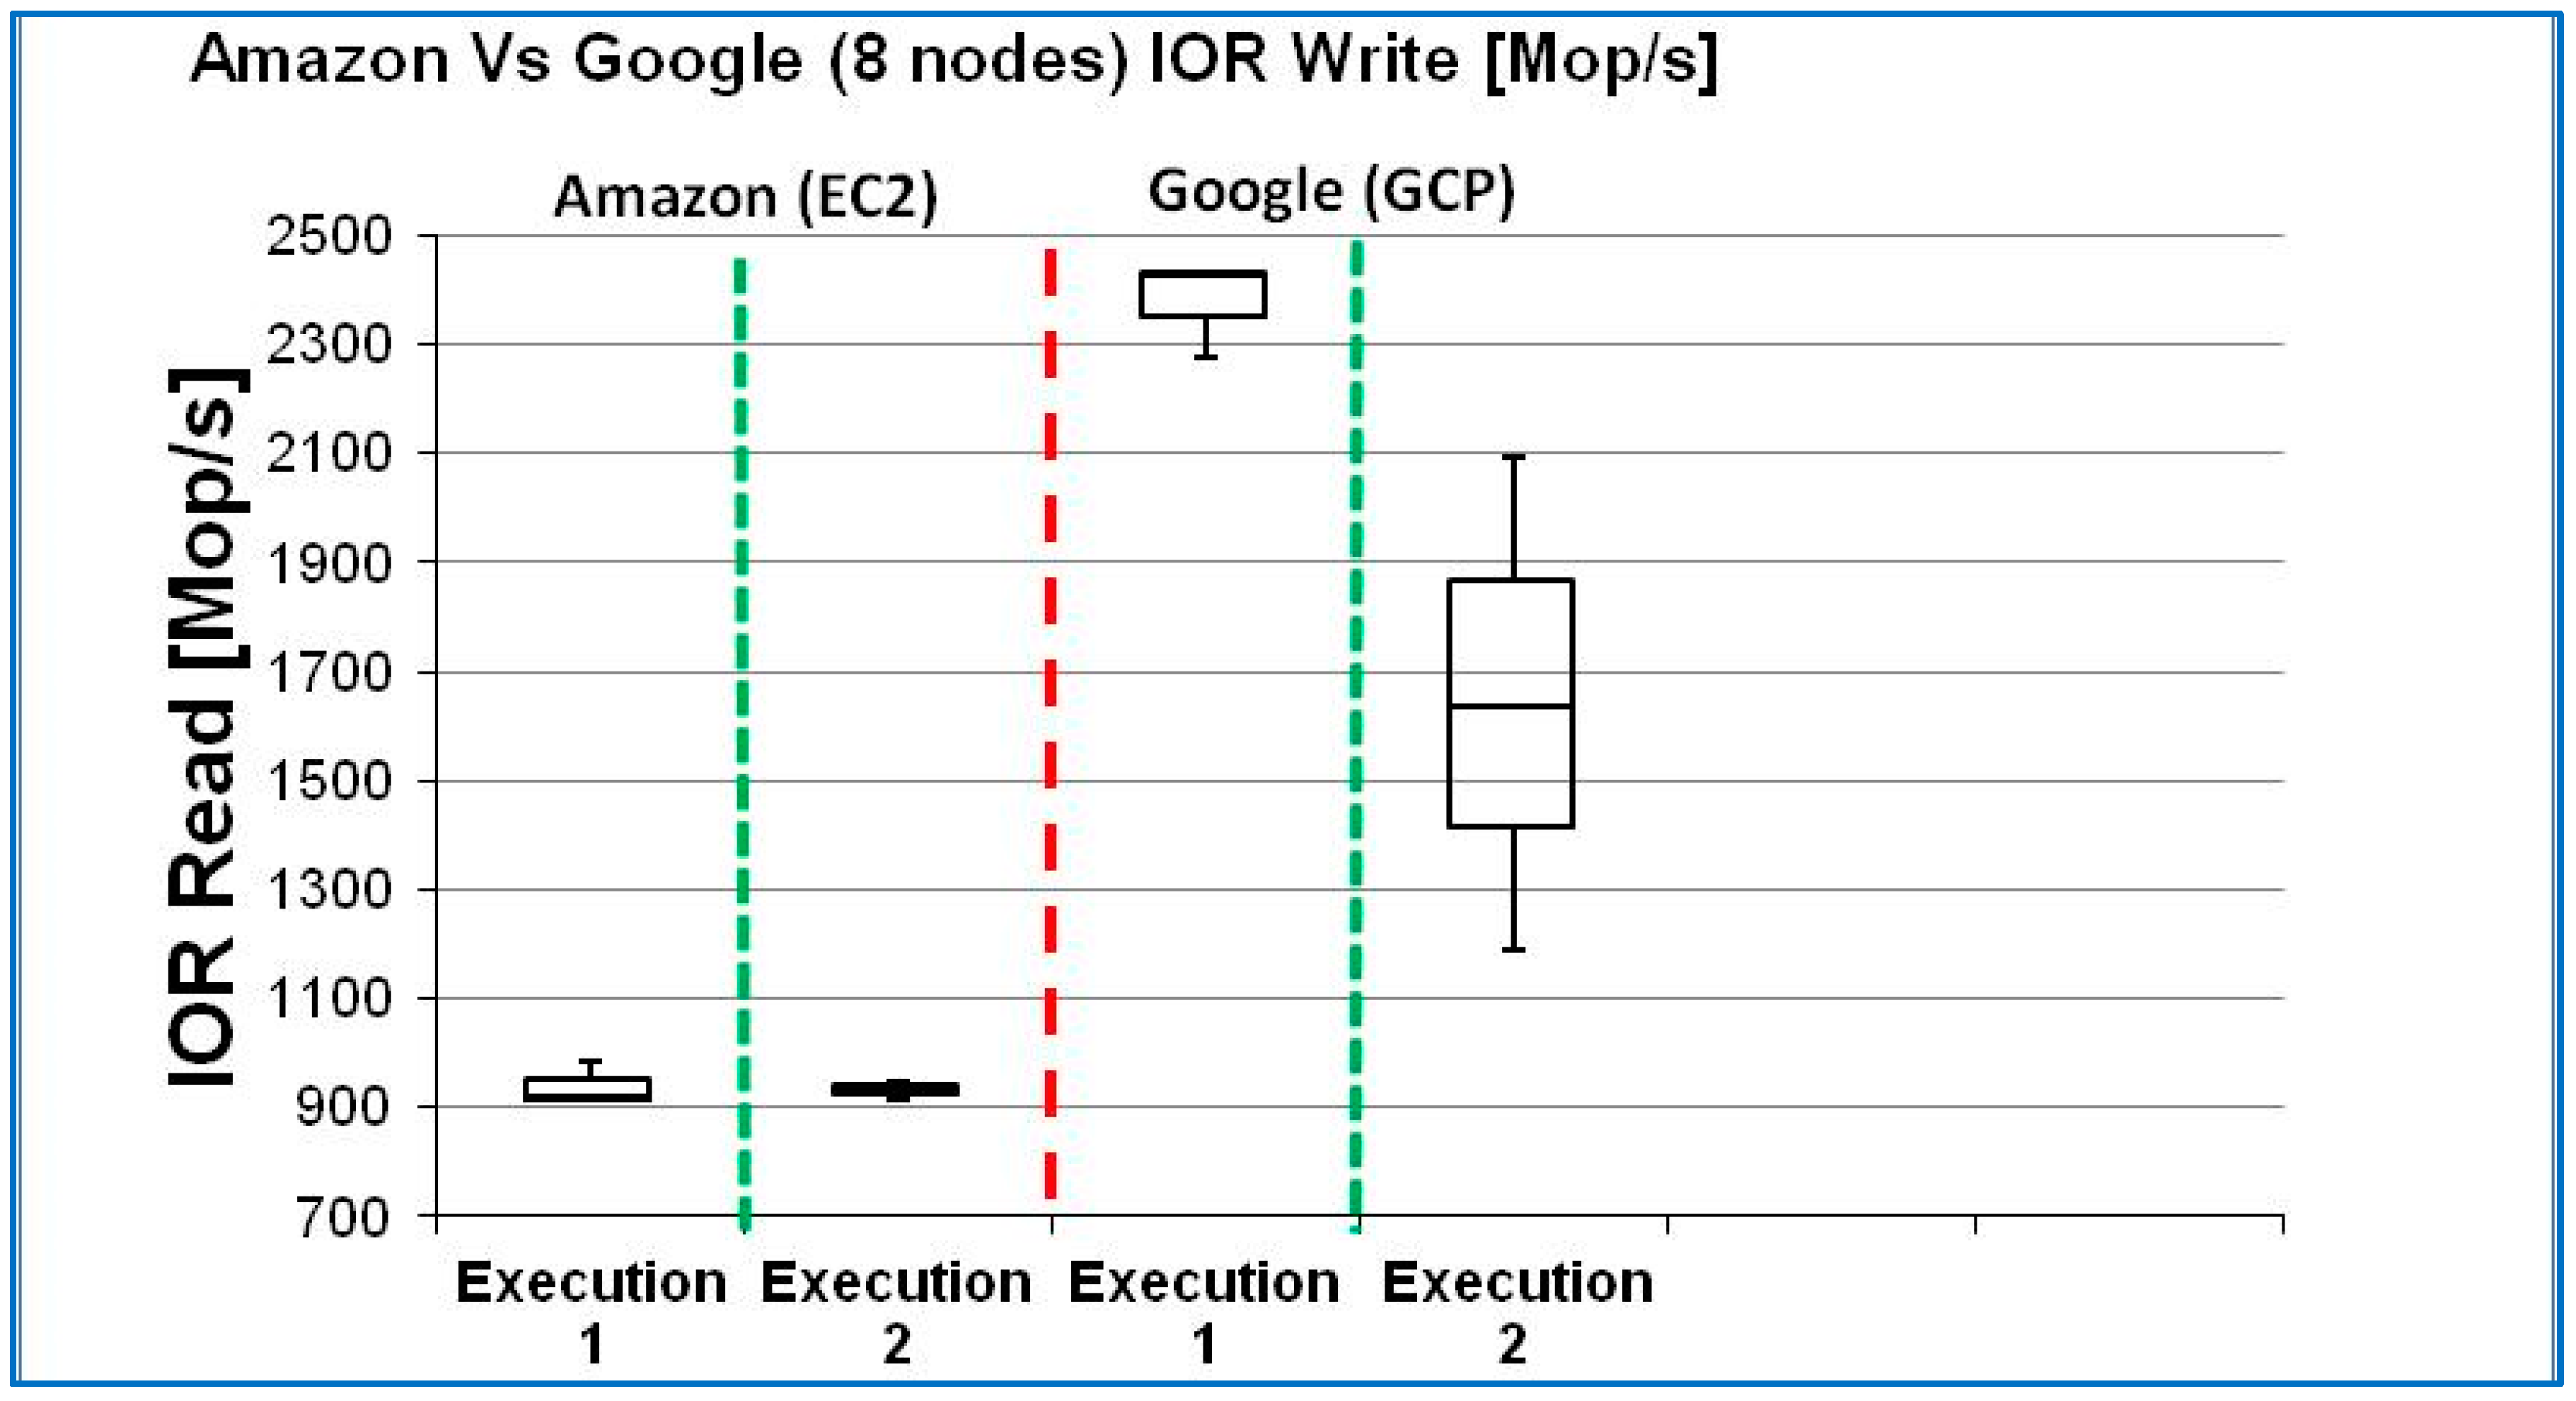
Figure 7 and Figure 8 clearly present the wide variability in the results of the IOR benchmark as executed on the GCP platform. While both the read and write operations have varying standard deviations within the inter-quartile ranges (IQRs), it is also notable that the IQRs for the write operation do not even overlap. AWS-EC2 is considerably more predictable than GCP, as shown by the IQR ranges recorded.
Given the proprietary nature of these cloud platforms, it is difficult to know the exact cause of performance variability. In terms of memory and CPU benchmarks, the two clouds did not show a significant difference in performance variability. For the IOR benchmark, AWS did show more predictable results than GCP. One possible factor could be I/O resource contention. It is known that I/O resource contention in the cloud occurs when multiple virtual machines (VMs) or workloads compete for limited storage or network I/O resources, leading to performance bottlenecks. This can manifest as increased latency and reduced throughput. When multiple VMs or applications simultaneously try to read from or write to the same storage or network resources, this can lead to contention. AWS does have more edge locations worldwide. The AWS global network achieves low latency and consistent performance across AWS services and EC2 instances. Optimized routes between regions deliver high transfer speeds.

4.4.11. IOR Benchmark Significance Test

Statistical significance analysis using T-Tests for the IOR read and write operations did not produce findings that meet the minimal significance criteria of p-value less than or equal to 0.05, except for 8-node clusters. As the number of nodes increased to 8 nodes, the p-value approximated the 0.05 threshold. The data used in performing T-Tests are shown in Table 9 along with the calculated p-values (test results were grouped by node count).

5. Conclusions

The results gathered from the experiments showed that AWS Elastic Cloud Computing (EC2) is relatively more predictable than Google’s Cloud Platform (GCP) across multiple executions at random times for the benchmarks used. Generally, AWS exhibited less performance variability across the benchmark runs conducted.
As an example, the IOR results showed that AWS is more predictable while performing read and write operations. In terms of net throughput, it is true that GCP outperformed AWS EC2. Hence, GCP is recommended if a large number of IO operations are needed, so long as the use case can tolerate a variance in the total time for execution. If the use case cannot tolerate variability in IO operations, then AWS is recommended.
As for scalability, both EC2 and GCP scaled accordingly when tested with the STREAM benchmark. However, the NPB results are more favorable to the GCP platform.
In terms of usability, the Google Cloud Platform proved to be slightly easier to use and administer the target nodes for the experiment. AWS also did not present major issues once the nodes were created and the code was compiled, showing a trouble-free execution and collection of results.
Looking at other points of comparison, GCP has a simple and transparent billing model while offering VMs ranging from basic to performance-driven configurations. AWS does have a comprehensive set of VMs and thorough documentation and best practice white papers to support the migration of traditional data center-based companies into cloud technology, which, when paired with excellent predictability, make it a good option for organizations that require control over the hosting and reliability of their information technology assets.
It is important to point out the limitations of this study. The testing approach entailed randomly choosing days and times for the execution of the test beds. Such tests were not synchronized, nor did the researchers have control over the collateral performance impacts of shared resources. Further research with hard constraints for external variables is necessary to firmly establish the predictability of one platform over the other. In addition, this study can be extended to other types of virtual machines to broaden the use cases to include memory-intensive or CPU-intensive instances. Performance testing with machine learning workloads is another approach to future research.

Author Contributions

S.A.: Conceptualization, methodology, formal analysis, investigation, resources, writing—original draft, writing—review and editing. H.R. and V.L.: Software, data curation, writing—original draft (in part). All authors have read and agreed to the published version of the manuscript.

Funding

This research received no external funding.

Institutional Review Board Statement

Not applicable.

Informed Consent Statement

Not applicable.

Data Availability Statement

No new data were created.

Conflicts of Interest

The authors declare no conflict of interest.

References

  1. Sandhiya, V.; Suresh, A. Analysis of Performance, Scalability, Availability and Security in Different Cloud Environments for Cloud Computing. In Proceedings of the 2023 International Conference on Computer Communication and Informatics (ICCCI), Coimbatore, India, 23–25 January 2023; pp. 1–7. [Google Scholar]
  2. Amazon Web Services, Inc. Available online: https://aws.amazon.com/ec2/ (accessed on 15 March 2024).
  3. Google Cloud. Available online: https://cloud.google.com/compute/docs/machine-resource (accessed on 15 April 2024).
  4. Li, Z.; OBrien, L.; Ranjan, R.; Zhang, M. Early observations on performance of google compute engine for scientific computing. In Proceedings of the 2013 IEEE 5th International Conference on Cloud Computing Technology and Science, Bristol, UK, 2–5 December 2013. [Google Scholar]
  5. University of Virginia. STREAM Benchmark Reference Information. Department of Computer Science, School of Engineering and Applied Science. Available online: http://www.cs.virginia.edu/stream/ref.html (accessed on 15 April 2024).
  6. Villalpando, L.E.B.; April, A.; Abran, A. CloudMeasure: A Platform for Performance Analysis of Cloud Computing Systems. In Proceedings of the 2016 IEEE 9th International Conference on Cloud Computing (CLOUD), San Francisco, CA, USA, 27 June–2 July 2016; pp. 975–979. [Google Scholar]
  7. Shoeb, A.A.M. A Comparative Study on I/O Performance between Compute and Storage Optimized Instances of Amazon EC2. In Proceedings of the IEEE International Conference on Cloud Computing, Anchorage, AK, USA, 27 June–2 July 2014. [Google Scholar]
  8. Prasetio, N.; Ferdinand, D.; Wijaya, B.C.; Anggreainy, M.S.; Kumiawan, A. Performance Analysis of Distributed Database System in Cloud Computing Environment. In Proceedings of the 2023 IEEE 9th International Conference on Computing, Engineering and Design (ICCED), Kuala Lumpur, Malaysia, 31 October 2023; pp. 1–6. [Google Scholar]
  9. NASA Website. NAS Parallel Benchmarks. NASA Advanced Supercomputing Division, 28 March 2019. Available online: https://www.nas.nasa.gov/publications/npb.html (accessed on 15 April 2024).
  10. Sourceforge.net. “IOR HPC Benchmark”. Available online: https://sourceforge.net/projects/ior-sio/ (accessed on 14 April 2024).
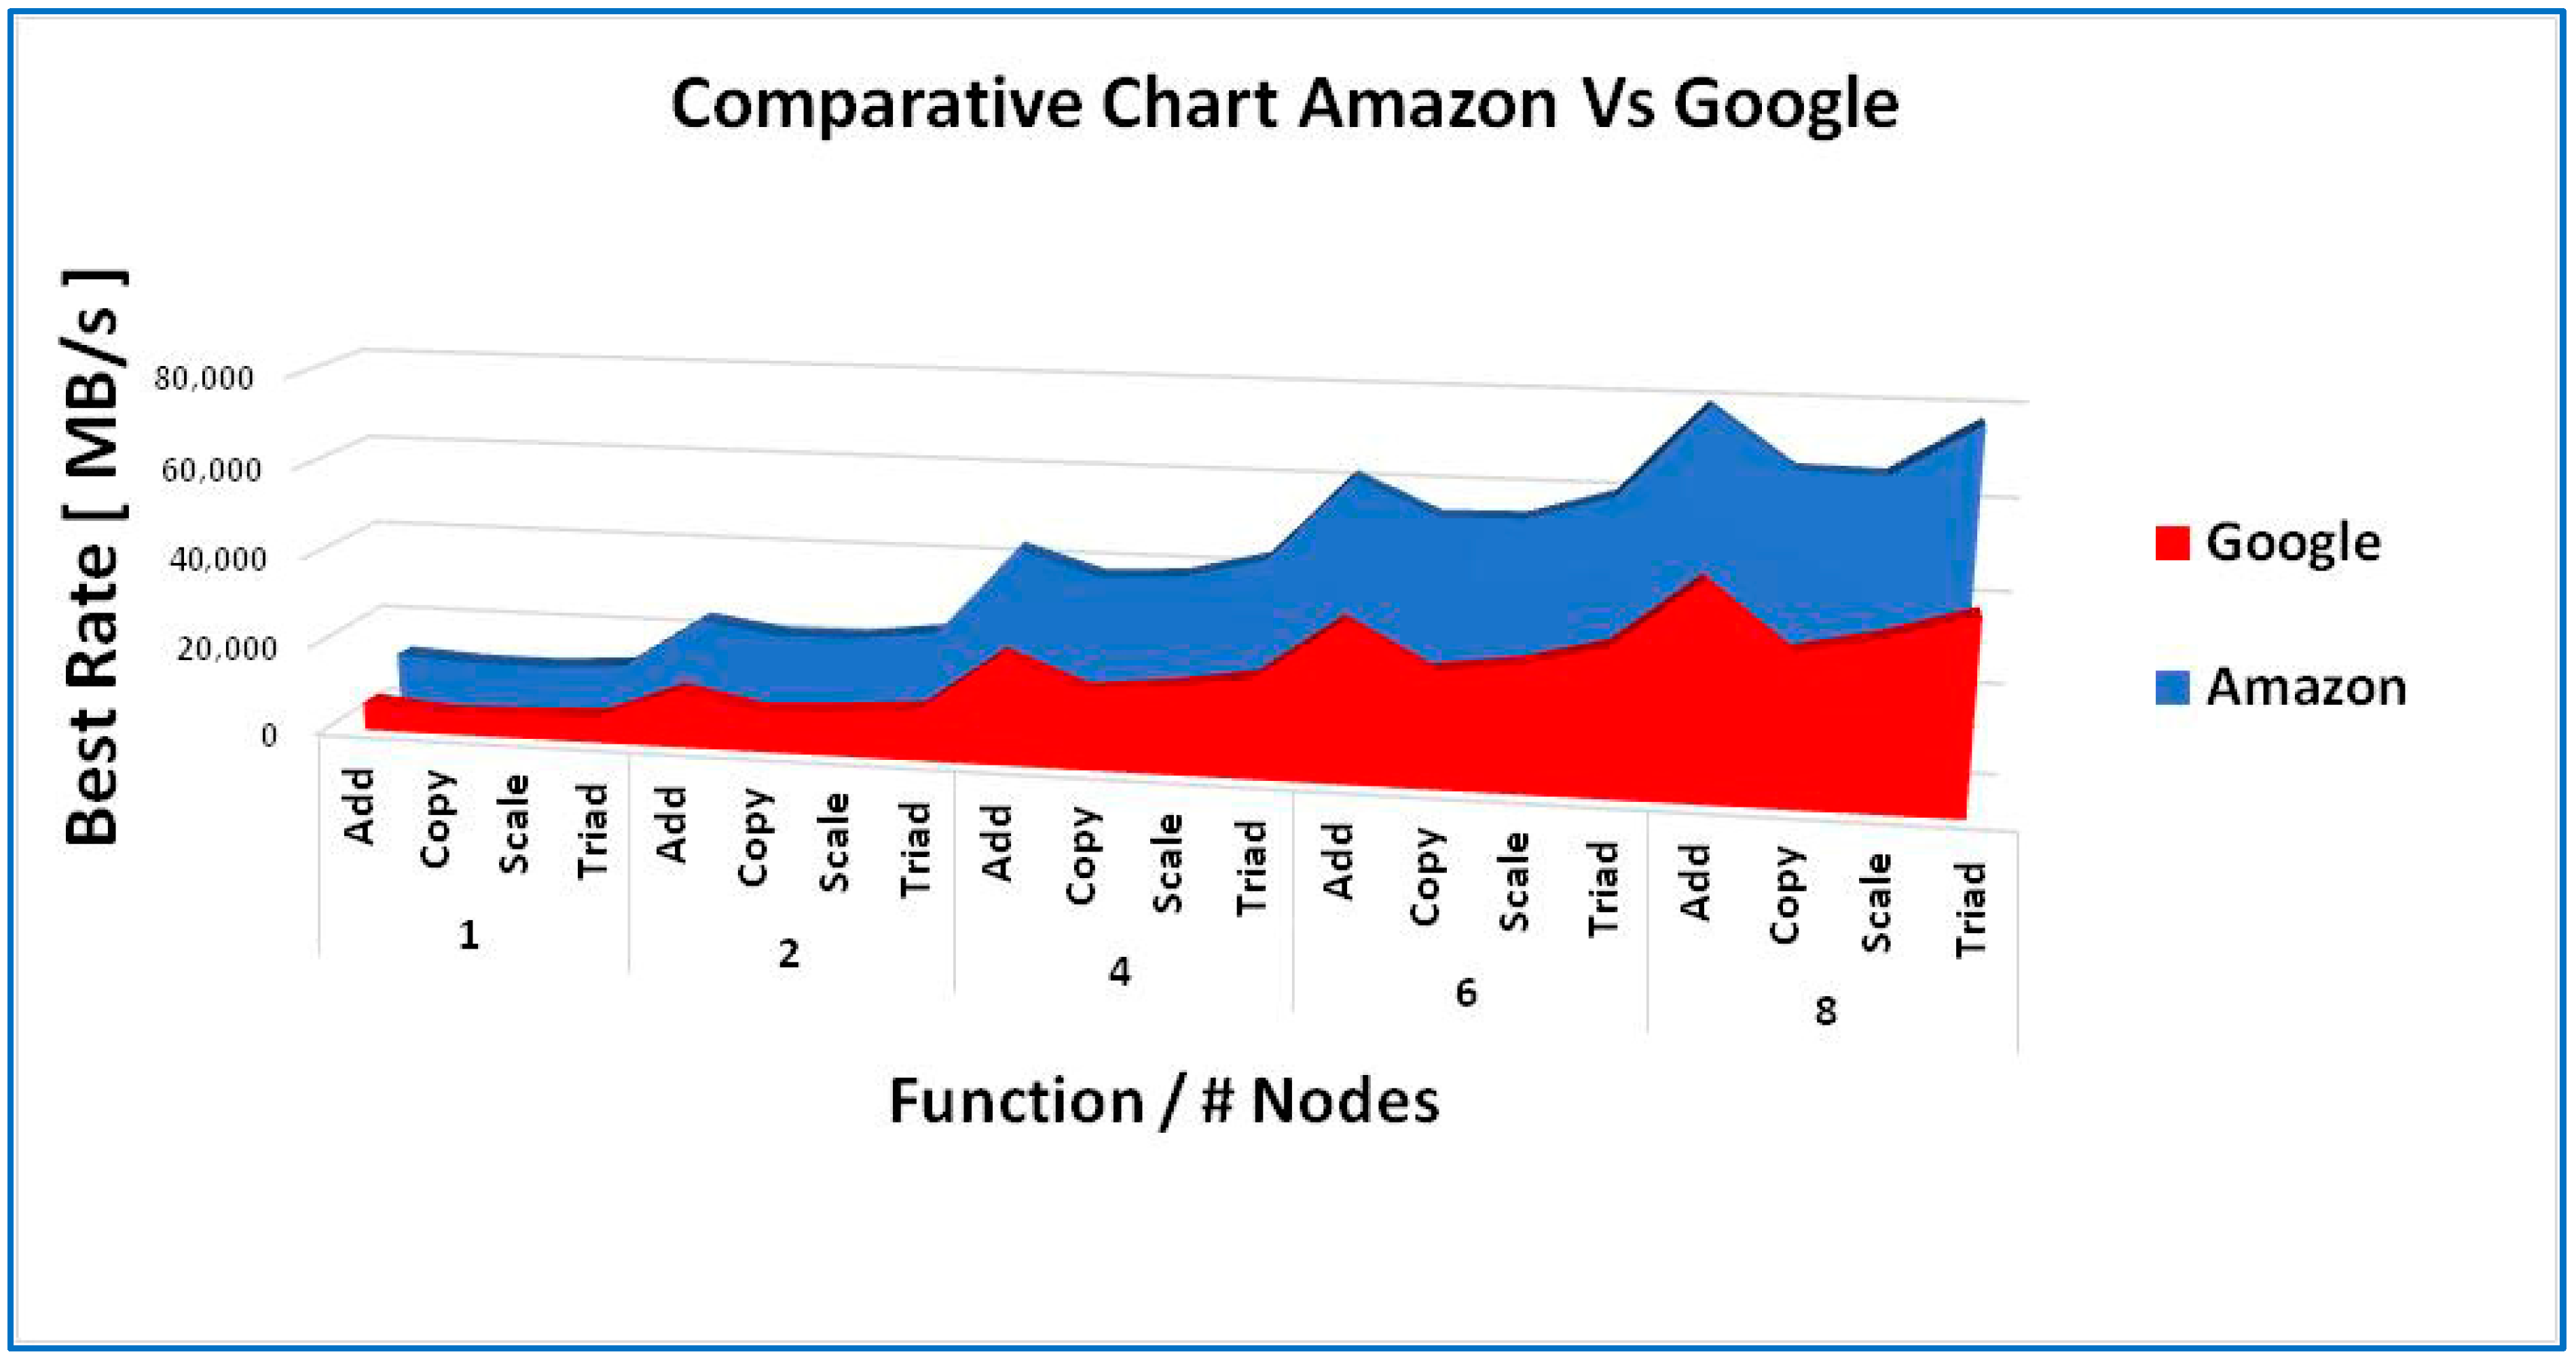
Figure 1. Scalability Comparison Across All Functions.
Information 16 00402 g001
Figure 2. Stream Benchmark Box-plot Analysis.
Information 16 00402 g002
Figure 3. NPB Benchmark Scalability—MOPS Throughput.
Information 16 00402 g003
Figure 4. NP Benchmark Scalability—Total Time in Seconds.
Information 16 00402 g004
Figure 5. IOR Benchmark Read Operation Throughput.
Information 16 00402 g005
Figure 6. IOR Benchmark Write Operation Throughput.
Information 16 00402 g006
Figure 7. IOR Read Box-plot Analysis.
Information 16 00402 g007
Figure 8. IOR Write Box-plot Analysis.
Information 16 00402 g008
Table 1. Cloud Services.
FeatureAWS EC2 [2]Google Cloud Platform [3]
aBusiness model Free entry-level VM instances for a limited use quota for 12 months. Multiple options of IaaS, PaaS, and SaaS at different pricing options to meet the customer’s operating environment.Free entry-level VM instances for a limited use quota for 12 months. Multiple options of IaaS, PaaS, and SaaS at different pricing options to meet the customer’s operating environment.
bVM instance types offered A1 (medium, large, xlarge, 2xlarge, 4xlarge)
T3 (nano, micro, small, medium, large, xlarge, 2xlarge)
T2 (nano, micro, small, medium, large, xlarge, 2xlarge)
M5 (large, xlarge, 2xlarge, 4xlarge, 12xlarge, 24xlarge, metal, d.large, d.xlarge, d.2xlarge, d.4xlarge, d.12xlarge, d.24xlarge, d.mental)
M5a (large, xlarge, 2xlarge, 4xlarge, 12xlarge, 24xlarge)
M4 (large, xlarge, 2xlarge, 4xlarge, 10xlarge, 16xlarge)
T3a (nano, micro, small, medium, large, xlarge, 2xlarge)
Standard machine (n1-standard-1, 2, 4, 8, 16, 32, 64, 96)
High-memory machine types (n1-highmem-2, 4, 8, 16, 32, 64, 96)
High-CPU machine types (n1-highcpu-2, 4,8,16,32,64,96)
Shared-core machine types (f1-micro, g1-small)
Memory-optimized machine types (n1-ultramem-40, 80, 160, n1-megamem-96)
b.1# vCPUs and memory sizes 128 and 3904 (GiB)96 and 1433 (GiB)
cStorageThroughput of up to 3.9 GB/s and provides customers with up to 48 TB of instance storage across 24 hard disk drivesMost instances can have up to 64 TB of total persistent disk space attached.
dDevelopment environment offered AWS CloudFormation:
Text files for modeling and provisioning cloud resources
Resource Manager: group, organize, and control access to resources; track and manage projects
Cloud Deployment Manager: template-driven deployment
eOS environments offered Windows, SLES, Centos, CoreOS, OpenSURE, RHEL, CloudLinux, Debian, FreeBSD, Ubuntu, Oracle LinuxWindows, SLES, Centos, CoreOS, OpenSUSE, RHEL, Debian, FreeBSD, Ubuntu
fSecurityGuardDuty
Macie
Shield
WAF
Cloud DLP
Cloud Security Scanner
gPerformance and scalability Provide high-performance network capability and can be programmatically launched into clusters, allowing applications to get the low-latency network performance required for tightly coupled, node-to-node communication.Scale your resources up or down with intelligent Autoscaling
Software-Defined Load Balancing
Over One Million Queries Per Second
Seamless Autoscaling
Internal Load Balancing
hReliability and fault tolerance Service Level Agreement commitment is 99.99% availability for each Amazon EC2 Region.There is no publicly available information regarding reliability for GCP.
iPricing model Per Hour, rounded upPer minute, rounded up (minimum 10 min)
i.1Model On demand, Spot, and ReservedOn demand—Sustained Use
jAuto-Scaling/Elasticity AWS Auto ScalingThrough managed instance groups
kMonitoring tools/service providedAmazon CloudWatch: real-time visibility into apps and infrastructure
AWS CloudTrail: logging and monitoring of AWS accounts
CloudWatch
CloudTrail
Google StackDriver, including monitoring, logging, error reporting, tracing, and debugging
Stackdriver
Table 2. VM Instance Specifications.
CharacteristicsAmazon EC2Google GCP
Machine Typet2.microf1.micro
Operating SystemUbuntuUbuntu
CPU1 CPU0.2 CPU
RAM1 GB0.6 GB
Table 3. Test Execution Matrix.
BenchmarkTimeframeFirst Execution SetSecond Execution SetMetrics
StreamMorning1-, 2-, 4-, 6- and 8-node1-, 2-, 4-, 6- and 8-nodeBest MBps Rate for Add, Copy Scale, and Triad
Mid-day1-, 2-, 4-, 6- and 8-node1-, 2-, 4-, 6- and 8-node
Evening1-, 2-, 4-, 6- and 8-node1-, 2-, 4-, 6- and 8-node
NPBMorning1-, 2-, 4-, 6- and 8-node1-, 2-, 4-, 6- and 8-nodeMOPS and Total Time (s) to completion
Mid-day1-, 2-, 4-, 6- and 8-node1-, 2-, 4-, 6- and 8-node
Evening1-, 2-, 4-, 6- and 8-node1-, 2-, 4-, 6- and 8-node
IORMorning1-, 2-, 4-, 6- and 8-node1-, 2-, 4-, 6- and 8-nodeRead and Write Operations per second
Mid-day1-, 2-, 4-, 6- and 8-node1-, 2-, 4-, 6- and 8-node
Evening1-, 2-, 4-, 6- and 8-node1-, 2-, 4-, 6- and 8-node
Table 4. EC2 Statistical Analysis (Stream).
PlatformExecutionFunctionMeanMedianDiff Mean & Median %RangeStd. DeviationStd. Deviation (%)
EC2Execution 1Add83,122.8382,653.200.56%7789.903916.12715%
EC2Execution 2Add79,901.8680,241.800.43%7404.403713.88625%
EC2Execution 1Copy68,926.3667,725.201.74%5530.502954.43874%
EC2Execution 2Copy67,319.6667,028.400.43%3267.201652.95982%
EC2Execution 1Scale68,623.0368,054.800.83%5122.502608.09674%
EC2Execution 2Scale67,773.9667,979.000.30%3225.901622.69422%
EC2Execution 1Triad80,490.5080,750.300.32%5568.202793.17643%
EC2Execution 2Triad78,112.5677,095.301.30%3909.202143.96473%
Table 5. GCP Statistical Analysis (Stream).
PlatformExecutionFunctionMeanMedianDiff Mean & Median %RangeStd. Dev.Std. Dev. (%)
GCPExecution 1Add46,432.7647,087.301.41%2875.401545.40983%
GCPExecution 2Add46,595.2046,592.600.01%1237.80618.90401%
GCPExecution 1Copy33,112.8032,969.200.43%1328.60675.84032%
GCPExecution 2Copy33,097.0333,112.400.05%295.30148.24850%
GCPExecution 1Scale36,784.2337,027.600.66%1879.50963.09423%
GCPExecution 2Scale36,623.4636,436.600.51%691.00381.52271%
GCPExecution 1Triad42,000.0342,719.101.71%2309.801312.09243%
GCPExecution 2Triad42,116.9342,083.300.08%1294.10647.70522%
Table 6. Stream Benchmark Significance Test.
NodesFunctionEC2 Mean ValueGCP Mean Valuep Value
1Add12,265.366311.800.000025
Copy11,030.654544.65
Scale11,176.485034.61
Triad12,242.715691.90
2Add23,653.5612,586.400.000034
Copy21,106.719000.33
Scale21,394.919943.43
Triad23,631.0311,285.93
4Add43,413.2524,014.550.000022
Copy37,799.9017,277.01
Scale38,570.1118,897.70
Triad43,139.9121,829.96
6Add60,411.3335,707.460.000014
Copy51,085.3325,686.30
Scale51,957.9828,284.40
Triad58,369.0032,596.50
8Add81,512.3546,820.750.000090
Copy68,123.0133,282.98
Scale68,198.5036,931.85
Triad79,301.5342,288.10
Table 7. NPB Millions of Operations Per Second.
PlatformExecutionMeanMedianDiff Mean and Median %MaxMinRangeStd. Dev.Std. Dev. (%)
Amazon12.792.742.03%2.932.720.210.11594.23%
Amazon22.832.850.59%2.882.770.110.05682.00%
Google1192.04195.781.95%197.3183.114.197.79813.98%
Google2189.41188.320.58%193.8186.17.733.97992.11%
Table 8. NP benchmark.
PlatformExecutionMeanMedianDiff Mean and Median %MaxMinRangeStd. Dev.Std. Dev. (%)
READ
Amazon113.9913.930.41%14.1513.880.270.14361.03%
Amazon214.0114.030.12%14.3513.660.690.34532.46%
Google1258.49210.5418.55%523.841.12482.7244.8914116.32%
Google2396.62549.9838.67%585.354.57530.7296.750253.96%
WRITE
Amazon116.7116.790.48%16.8116.530.280.15620.93%
Amazon216.7616.780.10%16.816.710.090.04730.28%
Google1466.81461.21.20%549.1390.115979.648117.27%
Google2306.35300.581.88%423.5194.9228.6114.419038.07%
Table 9. IOR Benchmark Significance Test.
Node CountFunctionAmazonGooglep Value
1IOR Read1279.465842.2770.1340
IOR Write766.310483.022
2IOR Read630.567666.6250.4325
IOR Write90.525429.345
4IOR Read41.353521.5900.1483
IOR Write37.335333.420
6IOR Read20.400500.5100.0956
IOR Write23.220377.102
8IOR Read14.000327.5550.0523
IOR Write16.737386.577
Disclaimer/Publisher’s Note: The statements, opinions and data contained in all publications are solely those of the individual author(s) and contributor(s) and not of MDPI and/or the editor(s). MDPI and/or the editor(s) disclaim responsibility for any injury to people or property resulting from any ideas, methods, instructions or products referred to in the content.