Review

Machine Learning in Baseball Analytics: Sabermetrics and Beyond

1
Department of Electrical and Computer Engineering, Cleveland State University, Cleveland, OH 44115, USA
2
School of Reliability and Systems Engineering, Beihang University, 37 Xueyuan Road, Beijing 100191, China
3
School of Computer and Communication Engineering, University of Science and Technology Beijing, Beijing 100083, China
*
Author to whom correspondence should be addressed.
Information 2025, 16(5), 361; https://doi.org/10.3390/info16050361
Submission received: 1 March 2025 / Revised: 21 April 2025 / Accepted: 28 April 2025 / Published: 29 April 2025
(This article belongs to the Special Issue Machine Learning and Data Mining: Innovations in Big Data Analytics)

Abstract

:
In this article, we provide a comprehensive review of machine learning-based sports analytics in baseball. This review is primarily guided by the following three research questions: (1) What baseball analytics problems have been studied using machine learning? (2) What data repositories have been used? (3) What and how machine learning techniques have been employed for these studies? The findings of these research questions lead to several research contributions. First, we provide a taxonomy for baseball analytics problems. According to the proposed taxonomy, machine learning has been employed to (1) predict individual game plays; (2) determine player performance; (3) estimate player valuation; (4) predict future player injuries; and (5) project future game outcomes. Second, we identify a set of data repositories for baseball analytics studies. The most popular data repositories are Baseball Savant and Baseball Reference. Third, we conduct an in-depth analysis of the machine learning models applied in baseball analytics. The most popular machine learning models are random forest and support vector machine. Furthermore, only a small fraction of studies have rigorously followed the best practices in data preprocessing, machine learning model training, testing, and prediction outcome interpretation.

1. Introduction

The term sabermetrics [1] originally referred to a new generation of statistical metrics developed to objectively characterize the performance of players in the US Major League Baseball (MLB). Such metrics are instrumental to the growth of the league in a multifaceted manner. On the one hand, they can be used to modernize game planning, in-game decision making, post-game analysis, player recruiting and contracts, and other team management objectives. On the other hand, they empower the fans of the sports (and the general public) to better understand the games and more effectively participate in fantasy games. Inspired by sabermetrics, data-driven analytics has also been adopted by other sports [2,3,4,5,6,7,8].
Due to the tremendous success of using sabermetrics for player evaluation, game planning, and team management in MLB, the term has been used synonymously to “performance metrics” in many fields beyond professional sports to evaluate the performance of personnels, such as surgeons [9], faculty members [10], general workers [11], politicians  (from a journalistic reporting point of view [12] and from a ranking point of view [13]), and patrol officers [14]. Furthermore, the transition from simple box scores to sophisticated sabermetrics itself is regarded as a revolution in data analytics, and the lessons learned have inspired the research and practice in other disciplines, such as genetic toxicology [15] and law practice [16].
MLB keeps track of player and team performance data since its inception. Furthermore, all 30 MLB stadiums have been equipped with cutting-edge technologies to track the player and ball movements [17]. Such lower-level data could be used to perform more in-depth analysis of player performance [18,19,20,21,22]. Furthermore, MLB has posted most of MLB games on youtube.com, which has facilitated researchers to study some aspects of game playing in MLB from the computer vision perspective [23,24]. The rich multimodality data compiled in MLB could be used to make various predictions, where machine learning could play a big role. Hence, it is interesting to review the use of machine learning in the broader field of baseball. We are aware of only a single review paper on the topic of machine learning applications in baseball [25]. That review was published in 2017, and it presented the findings in terms of binary classification, multiclass classification, and regression in the context of baseball analytics. More specifically, our study differs from [25] in the following two aspects:
  • Scope. In Ref. [25], the focus is on how various forms of machine learning, i.e., binary classification, multiclass classification, and regression, have been used in baseball analytics. The scope of our review is much broader, including not only machine learning-based baseball analytics but also the baseball analytics problems that have been addressed, and the data repositories available for machine learning-based baseball analytics.
  • Depth. In Ref. [25], each study reviewed is simply summarized. In contrast, in our review, each study is analyzed in depth from several perspectives as follows: (1) dataset used; (2) specific baseball analytics problems; (3) how machine learning is used, particularly if the best practice is followed; and (4) prediction performance.
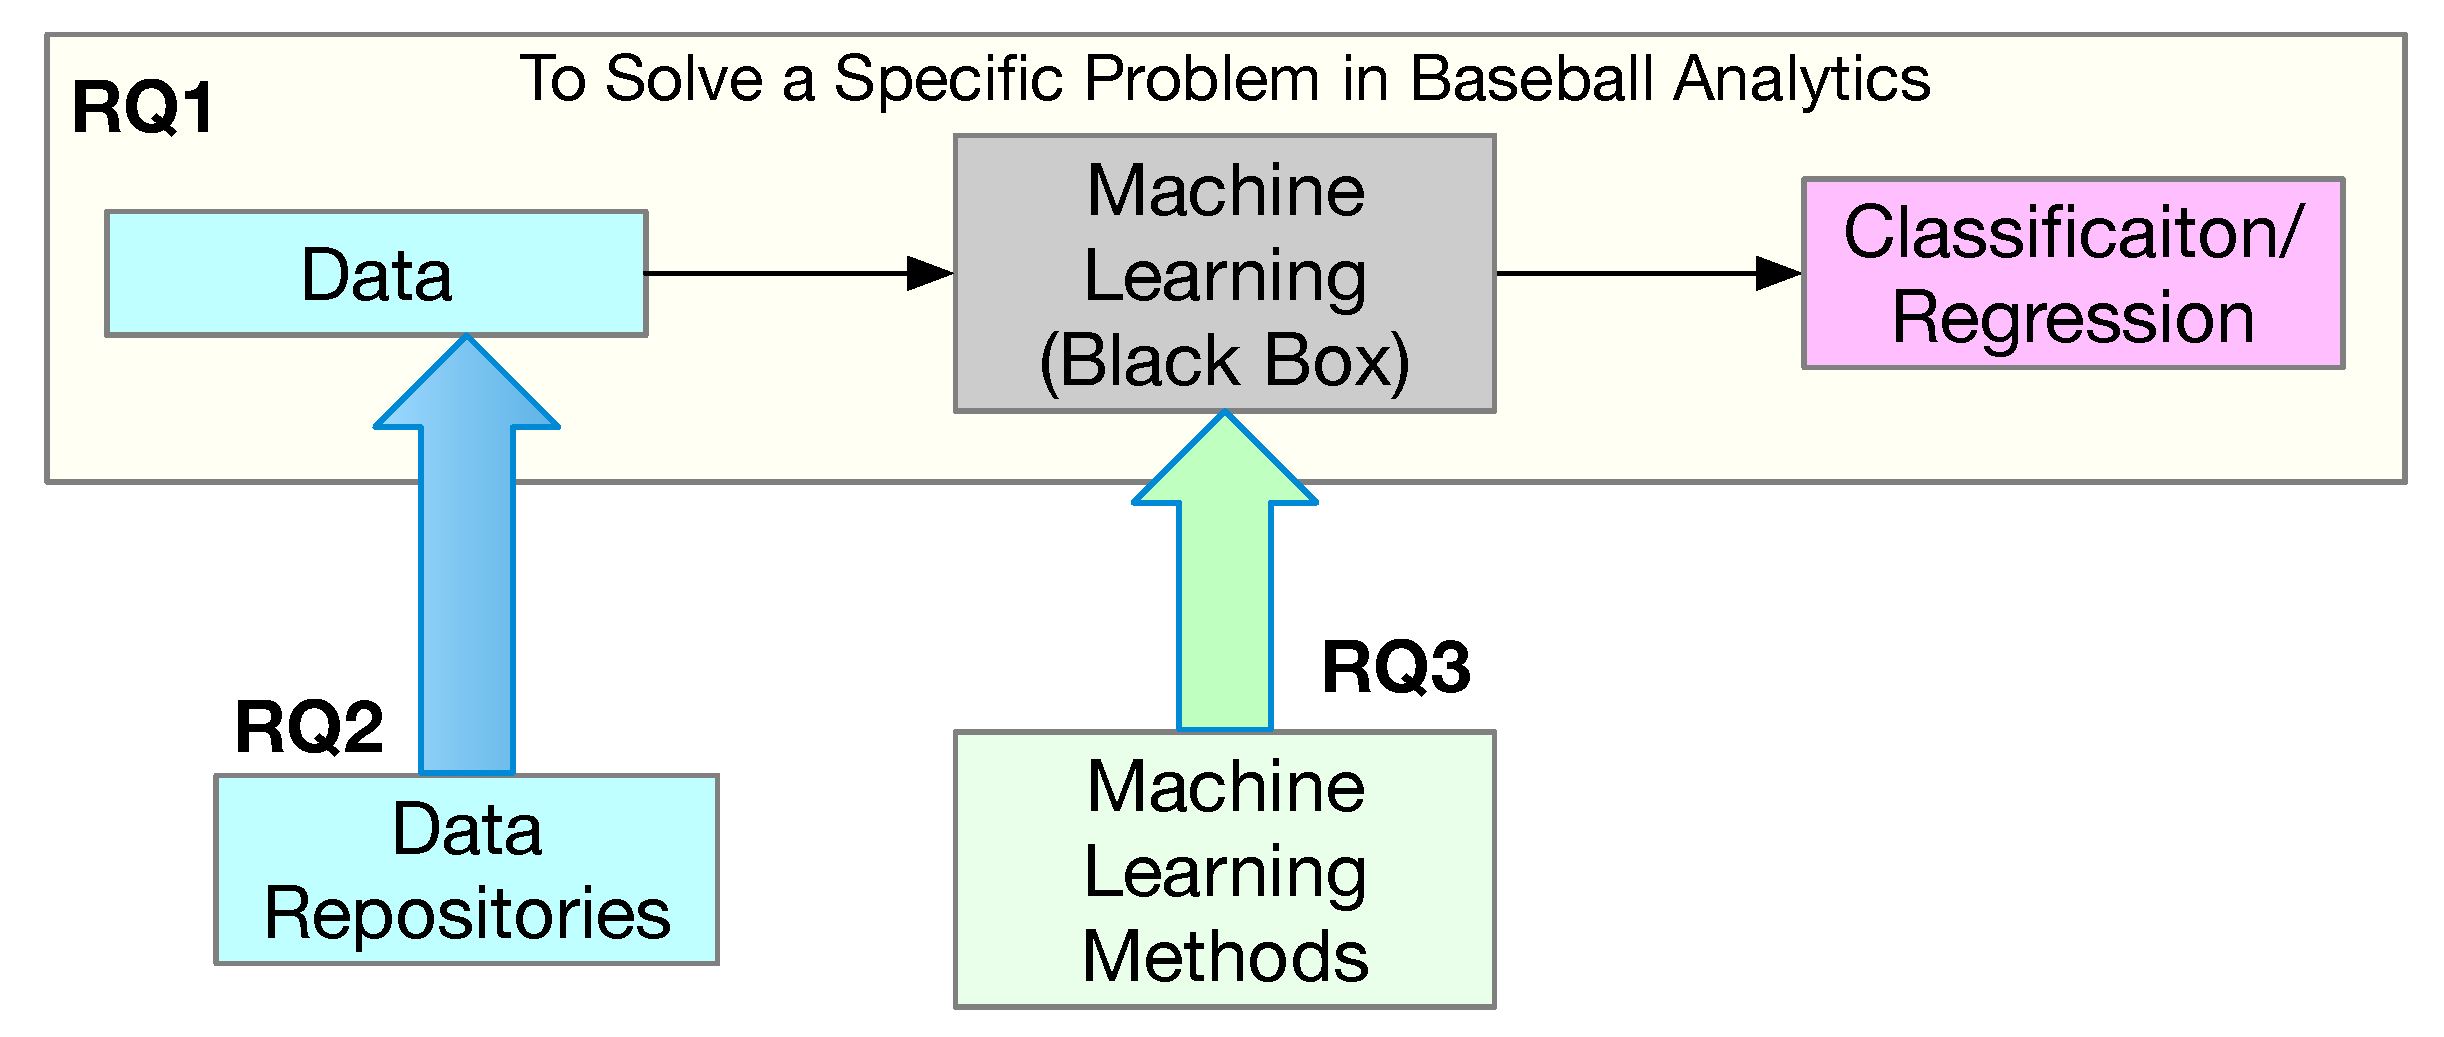
This systematic review is guided by the following research questions: (1) What baseball analytics problems have been studied using machine learning? (2) What data repositories have been used? (3) What and how machine learning techniques have been employed for the studies? The first research question is concerned with finding the specific problems in baseball analytics that have been addressed via machine learning. In the context of this research question, we intentionally treat the machine learning component as a blackbox and highlight the data being used in the analytics and the outcome of the classification or regression. The second research question is to document the data repositories that have been used in the studies. There are numerous repositories for baseball. The findings to this research question would help researchers and developers in baseball analysis understand where to find specific data for their research. The third research question is to investigate the technical details of what and how machine learning methods have been used in the studies. The relationship between these research questions is illustrated in Figure 1.
This study makes the following contributions: (1) As part of the findings for the first research question, we provide a taxonomy for the applications of machine learning in baseball analytics, including prediction of individual game play, player performance evaluation (i.e., better sabermetrics than existing ones), player valuation (i.e., contract values and salary), prediction of player injuries, and prediction of game outcome (i.e., projections). (2) As part of the findings for the second research question, we identify the set of main data repositories for baseball analytics with a concise description for each of them, which could be helpful for researchers and practitioners who are interested in conducting baseball analytics. (3) As part of the findings for the third research question, we report the machine learning models that have been used in baseball analytics, and how they are used and evaluated. We further rank the studies based on the extent to which the best practice in machine learning has been followed in terms of data preprocessing, model training, testing, and interpretation of the prediction outcomes.
The remaining of this article is organized as follows. Section 2 describes how we collect the literature for this comprehensive review. Section 3 reports the findings for the first research question regarding the applications of machine learning in the context of baseball analytics. Section 4 elaborates on the findings for the second research question regarding the data repositories that have been used in these studies. Section 5 presents the findings for the third research question on what machine learning models have been used and how they have been used in these studies. Section 6 concludes this article.

2. Methods on Literature Collection

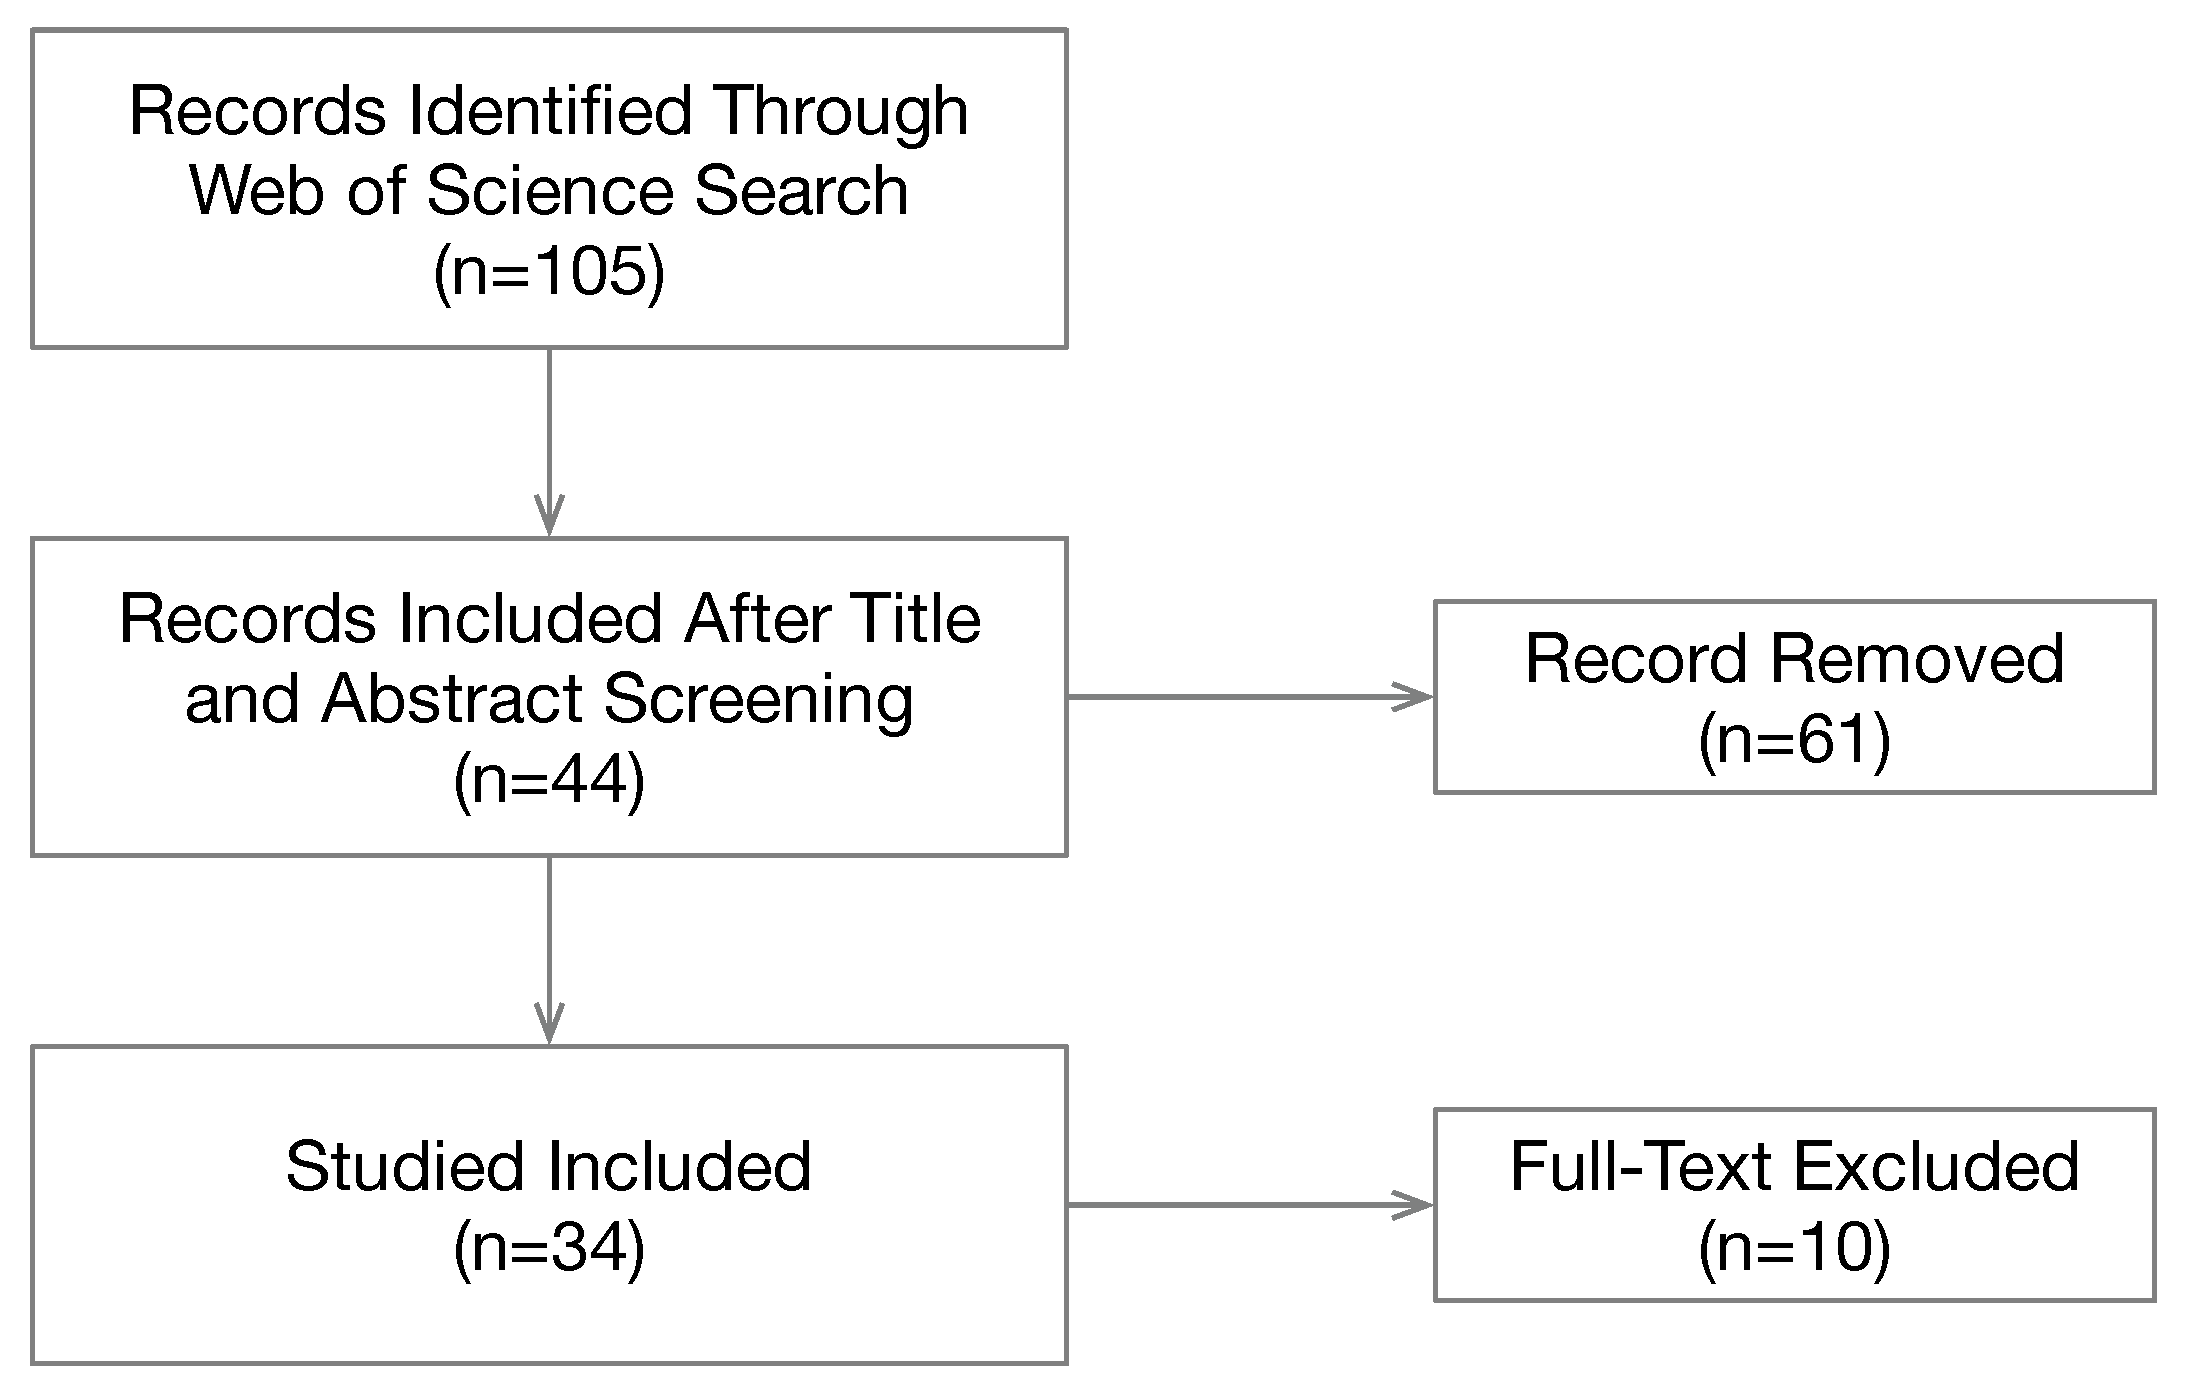
The Web of Science core collection is used as the sole academic paper repository for the literature collection because it is both comprehensive and highly selective (only the most reputable peer-reviewed conference papers and journal articles are indexed). We first used “machine learning” and “baseball” for topic search. The search returned 105 records. We examined the titles and abstracts to exclude unrelated publications (e.g., even if baseball is mentioned, the focus of the paper is actually basketball or something else). A total of 44 publications appear to be relevant and the full papers are then retrieved. These papers are further filtered based on the following inclusion criteria: (1) baseball analytics should be the focus of the paper (i.e., papers that briefly mentioned baseball are excluded); (2) the paper should report a specific study using machine learning as a way to conduct baseball analytics with performance evaluation (i.e., review papers are excluded, one of which is a review paper that we have compared with Ref. [25]); (3) the study should focus on baseball game play, ideally at the professional league level or at least at the elite college level. This step excluded 9 papers, which resulted in 34 papers for review. The literature selection protocol is illustrated in Figure 2.
Next, we used “machine learning” and “sabermetrics” for topic search. Only 6 records were returned, and they all overlap with those returned from the first search. Finally, we also searched with a single term “sabermetrics” to see if there are any publications that we might have missed. This search returned 39 records. These publications provided interesting perspectives regarding the impact of sabermetrics on all other sports and society, which we have outlined in the introduction of this article.

3. RQ1: What Baseball Analytics Problems Have Been Studied Using Machine Learning?

To organize the 34 studies, we propose a taxonomy that consists of the following five categories: (1) prediction of individual game play; (2) determination of player performance (in terms of improved sabermetrics); (3) estimation of player valuation (in terms of salary or contract); (4) prediction of player future injuries; and (5) projection of future game outcomes.

3.1. Individual Game Play

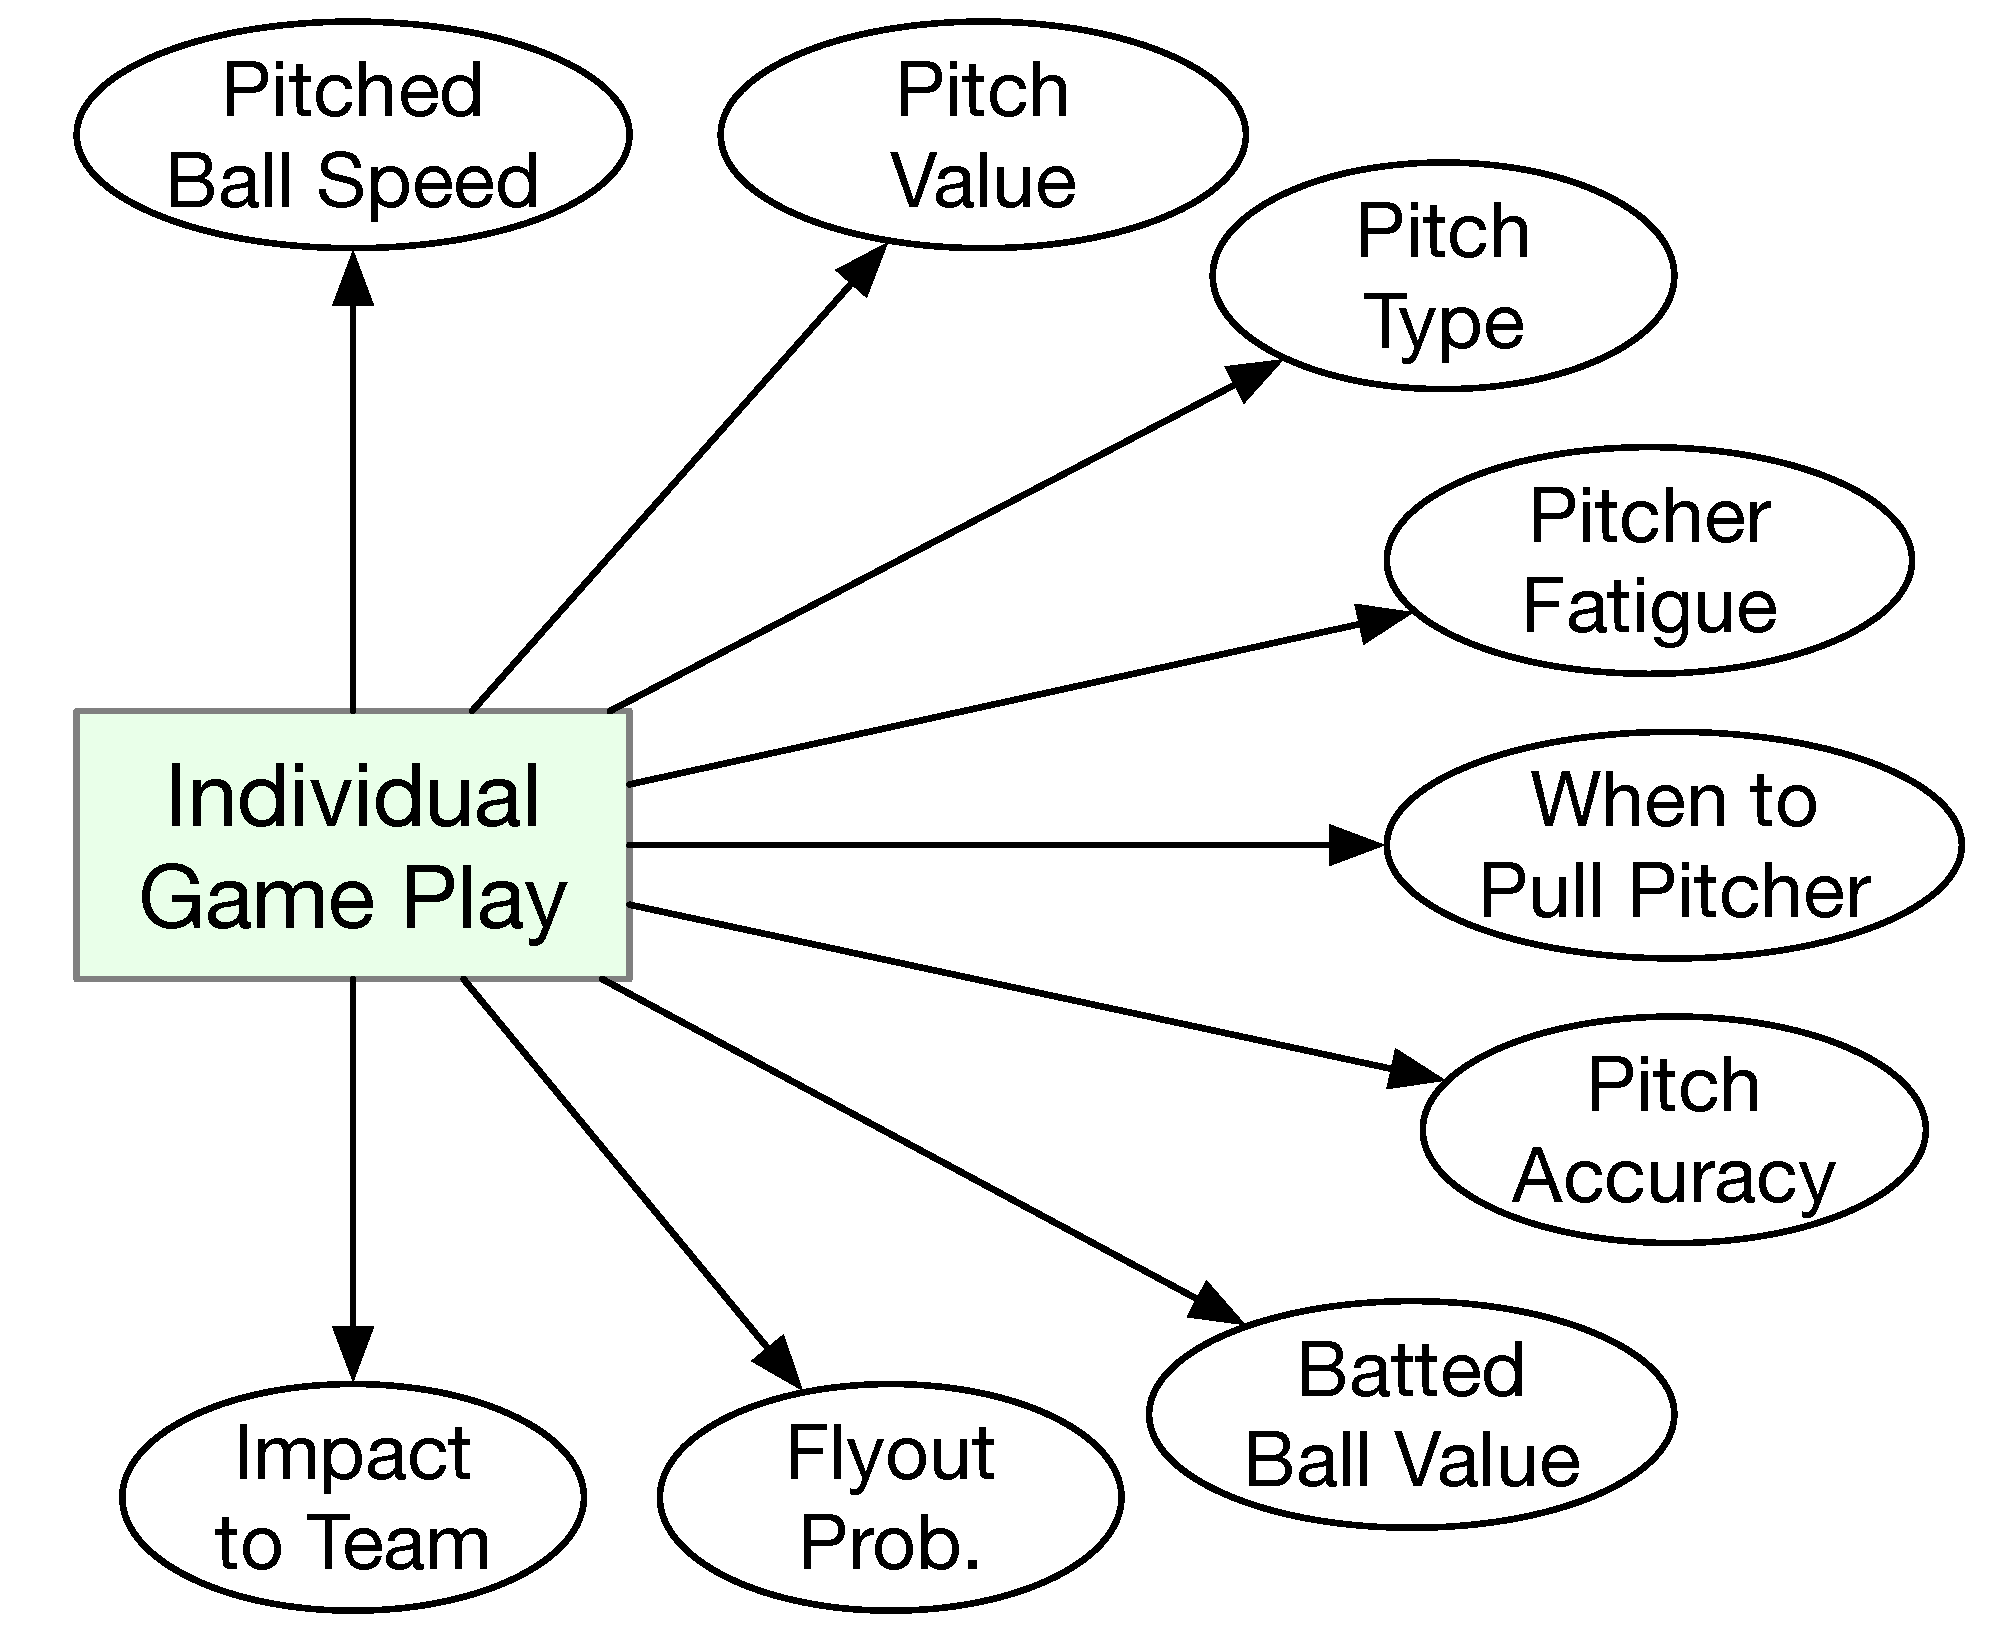
Various aspects of individual game play have been studied with machine learning. The types of individual game play are illustrated in Figure 3. These include predictions and evaluations such as pitch speed, type, accuracy in the strike zone, fatigue, and overall impact on the team. The individual studies are summarized in Table 1. This category has attracted 15 studies.
In Ref. [26], machine learning is used to predict if the next pitch is going to be a fastball as a binary classification problem. The capability of being able to correctly predict the next pitch could give the batter a significant advantage by allowing the batter to decide on the right strategy at the plate towards making a hit. Details about the features used for making the prediction are elaborated on. Furthermore, the context of the prediction is considered in terms of the pitcher and the game play situation referred to as count (i.e., the number of balls and strikes have been thrown, a total of 12 scenarios). A total of 18 features (i.e., statistical metrics) are extracted from the data repository, and they are transitioned into 59 features in 6 groups. The data are taken from 2008 (used for training), 2009 (used for testing), 2010 (used for training), 2011 (used for training), and 2012 (used for testing) seasons in MLB. All pitchers that had 750 or more pitches are considered. The accuracy of the prediction ranges between 76.27% and 77.97%.
In Ref. [27], the same problem (i.e., whether or not the next pitch is a fastball) as that of Ref. [26] is addressed with a different machine learning method. The data used consist of about 85,000 observations, which are pitch-by-pitch statistics for all the pitchers of the four teams (Cincinnati Reds, New York Yankees, New York Mets, and Toronto Blue Jays) in two seasons (2016 and 2017). The 2016 season data are used as training data, and the 2017 season data are used to test the model performance. The paper reported only the overall accuracy of the prediction, which is 71.36%. Despite being published four years later, the authors of Ref. [27] were not aware of the study in Ref. [26].
The next pitch prediction problem is also studied three years later in Ref. [28] with yet another machine learning model. Eight features are used for prediction, including the previous pitch type, the location the previous pitch is thrown to, the number of pitches made in the game by the pitcher, the current inning in the game, the number of runners currently on base, the current score difference, the number of balls and strikes so far, and the current number of outs. The data used are taken from 201 pitchers in MLB in the seasons of 2015, 2016, 2017, 2018, and 2021. The average accuracy is 76.7%.
Pitch prediction is studied in Ref. [29] from a totally different perspective. Instead of using game-related data and player preference/performance statistics, the study focused on determining the pitch type based on the player movement data acquired via two inertial measurement instruments (IMUs) [39]. The motion data collected in this study in conjunction with the pitch type prediction outcomes could enhance pitcher training. From the pitcher’s perspective, it is advantageous to keep the same form of motions when throwing different types of pitches because this would prevent the batter from anticipating a specific type of pitch. On the other hand, it is inevitable to use a distinctive form of motion when throwing different types of pitches, which is the foundation for making predictions based on motion data. Furthermore, having the right pitching mechanics is also instrumental to minimize injuries. Due to the nature of the study, the authors acquired data via a human subject trial with 19 elite youth academic pitchers in Europe. The pitcher would wear two IMUs, one on the front (in the chest area) and the other on the back (in the lower spine area). The prediction performance is evaluated in terms of a set of metrics, including accuracy, sensitivity, precision, and F1 score. Both binary and multiclass classification are carried out. The average accuracy for binary classification is 71.0%. This study addressed the class imbalance issue with under or over-sampling.
Pitch type prediction is also studied in Ref. [30] from yet another perspective. The objective of the study is to determine the pitch type correctly and correlate the impact of pitch types to batter performance. The training data are obtained from the Nippon Professional Baseball (NPB) 2017 and 2018 seasons, and the pitch types are labeled by experts. The classification accuracy is reported graphically. Due to the two-step classification approach, the mean accuracy for pitch type prediction is higher than 95%.
In Ref. [32], the velocity of the pitched fastball is predicted using machine learning based on pitcher kinematics data. Similar to Refs. [29,33], the data are acquired from a human subject trial where the pitchers are at the high school and college levels. The primary research objective of the study is to establish a relationship between biomechanical variables with the velocity of the pitch. Due to the goal of the study, machine learning-based regression (instead of classification) is used to predict pitch velocity. The study focused on only a single type of pitch, fastball, which is the most popular type. Motion data are acquired using a 12-camera motion analysis system, as well as three multicomponent force plates. The performance of the prediction is in terms of the root mean square error (RMSE). The best machine learning model produces a rather small RMSE of less than 0.001. Several significant kinematic variables with respect to the pitch velocity have been identified.
In Ref. [33], the association between pitcher pitching kinematics and the pitch outcome in terms of whether or not the ball hits the strike zone (instead of conventional pitch type) is studied. Similar to the study in Ref. [29], the data are collected via a human subject trial with professional-level baseball pitchers. The pitching kinematics are captured via an 8-camera motion analysis system. The pitcher would need to wear 42 reflective marker placed at specific locations on their body. The participating pitchers are required to pitch towards the center of the strike zone. Because no one has perfect control over the pitching target location, it is inevitable that the pitched ball would sometimes go outside the strike zone, which is called a ball. In this study, machine learning is used to predict the pitched ball location (within the strike zone or outside) based on the measured pitcher body kinematics. The prediction accuracy is 70.0%.
In Ref. [19], the intrinsic value of an individual pitch is investigated. The value of a pitch is determined based on a set of five variables that are captured by the PITCHf/x system and transformed from the data, including one variable for the ball speed, two variables for the pitch location relative to the strike zone, and two other variables that are calculated to reflect the impact to the trajectory of the pitched ball due to ball spinning in terms of the displacement of the ball. The value of the pitch is measured in terms of how successful the batter performs with this pitch. The value is expressed in the unit of a modern sabermetric called weighted on base average (wOBA). The study then calculated the aggregated pitch values for each pitcher as a more accurate intrinsic measure of performance. The performance of the proposed regression method is evaluated in terms of the predictive power for pitchers in MLB in the 2015 season based on the 2014 season data.
In Ref. [18], a machine learning method is proposed to determine the intrinsic value of individual batted balls based on the HITf/x data. A simple three-dimensional feature vector is used to estimate the intrinsic value of the batted ball. The three features include the initial speed of the batted ball, the vertical launch angle, and the horizontal spray angle. The intrinsic value of the batted ball is also expressed in terms of the wOBA. The proposed method is validated using Cronbach’s alpha, which shows that statistics derived from proposed intrinsic values for batted balls have a higher reliability than existing sabermetrics based on the MLB 2014 season data.
In Ref. [31], the intrinsic value of an individual pitch is also studied. The basic idea is rather similar to that of Ref. [19], where the value of a pitch is determined by the following three components: (1) context of the pitch in terms of the count; (2) pitch descriptor (i.e., characteristics of the pitcher and the batter, and the characteristics of the pitched ball); (3) the outcome of the pitch. The treatment of the three components in Ref. [31] is slightly different in Ref. [19]. The handedness of the pitcher and the batter is considered as part of the pitch description in Ref. [31], while such information is considered as part of the context in Ref. [19]. The two approaches are summarized in Table 2. The study used the PITCHf/x data from the MLB 2013, 2014, and 2015 seasons.
In Ref. [34], the focus is also on individual play actions that are pertaining to both batters and fielders regarding what types of fly balls are harder to catch in terms of the probability of flyout. Although there are abundant data in baseball, they are not enough for some specific problems such as the one investigated in this study. To resolve this issue, a machine learning model is trained using actual game data, and then the trained model is used to generate as much synthetic data as needed to validate the research questions, as shown in Figure 4. The findings confirmed the following hypotheses of the authors: (1) the motion of the fly balls differs between the pull side from that of the opposite side due to aerodynamic effects, and (2) if the first hypothesis holds, then the probability for the outcome of the batted balls would be different (flyout or base hit) for the batted in the pull size and for the opposite side.
In Ref. [35], the pitching decision is modeled as a Markov decision process where the pitcher’s decision is assumed only dependent on the current count. The main hypothesis of this study is that a batter could exploit the knowledge of the pitcher decision for better outcomes. Simulated games are used to validate the hypothesis. Furthermore, reinforcement learning is used with the data from the MLB 2010 season and tested the batting performance using the data from the MLB 2009 season. A spatial component is introduced in the model and it is essential to calculate how a batter could exploit the knowledge of the anticipated pitch. The study showed that normal batters would see improved performance if the knowledge of the next pitch can be gained with reinforcement learning while elite batter would not see any improvements.
In Ref. [36], the issue of pitcher fatigue detection is studied. The fatigue detection is based on the following three factors: (1) elbow vagus angle, (2) trunk flexion angle, and (3) time between pitch. A machine learning model is used to predict the fatigue point. The data used for the study are obtained from the games played by a particular pitcher of the Futon Titans baseball team during the 2018 season in the Chinese Professional Baseball League (CPBL in Taiwan).
In Ref. [37], the authors attempted to tackle a very challenging in-game decision making problem, i.e., when to pull the starting pitcher. The problem is formulated as a regression problem and the decision whether or not to pull the starting pitcher is translated into an observable event as follows: if the pitcher is not pulled in the current inning, the pitcher would give up at least one run in the next inning. Due to the complexity of the problem, traditional evaluation metrics are redefined. Data from the MLB 2006–2010 season are used for the study. The study obtained the data from a website that is no longer available (but the data are now available in many repositories).
In Ref. [38], a method of evaluating the impact of a player is proposed. The method is based on the transformer-based large language model [40]. It aims to describe the impact of a player to the game using a small set of game activities, which would demonstrate how a player performs instead of what the player’s statistics are. A key idea is to first define the state of the game and then determine the state change as the result of the play made by a particular play. The game state is defined by the following four variables: (1) pitch count; (2) base occupancy; (3) number of outs; and (4) the game score. To measure the impact of a player, a sequence of activities, which is referred to as a window, is considered. The window of activities consists of two views. This study used the pitch-by-pitch data from the MLB 2015–2018 seasons, and the season-by-season data of the MLB 1995–2018 seasons. The output of the proposed model is shown visually without any quantitative analysis.

3.2. Player Performance Evaluation

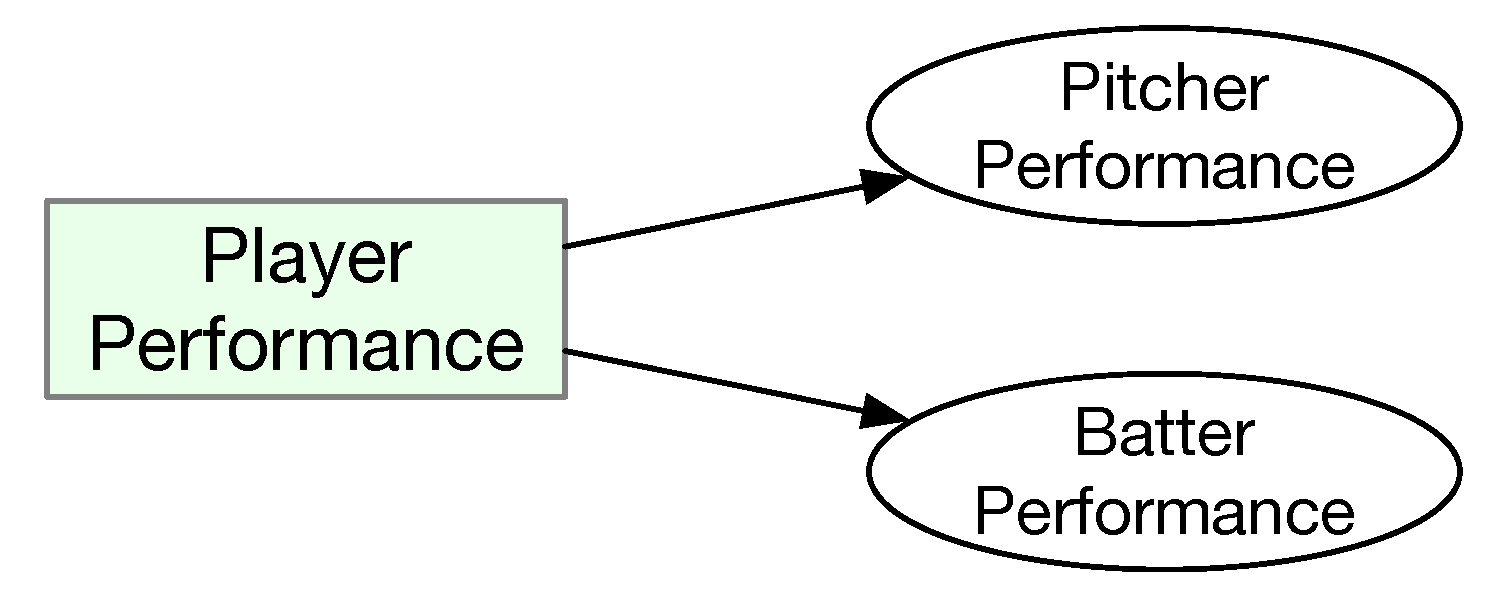
Four studies focused on predicting the batter and pitcher performance (as shown in Figure 5) based on typically low-level player and ball motion data (such as PITCHf/x and HITf/x, and later Statcast). The goal is to introduce more accurate sabermetrics [20,21,22] or a new way of estimating some exiting metrics [41]. The four studies are summarized in Table 3.
A methodology for evaluating a batter (in terms of his performance) is proposed in Ref. [22]. It is a follow-up study of Ref. [18]. The fundamental assumption is that a value can be associated with each batted ball depending on the outcome of the game (e.g., a home run would have the highest value of a batted ball). If the aggregated value for the batted balls from the same batter is higher than that for another, then the former batter is a better player than the latter. Machine learning regression is then proposed to learn this association. This method can be used to formulate another sabermetric to evaluate the intrinsic value of batters. The MLB 2019 season data are used to evaluate the prediction accuracy of the batter value. The accuracy of the regression is evaluated in terms of the sum of squared errors (SSE) and compared against a sabermetric called xwOBAcon (short for expected weighted on-base average on contact) that is considered the most cutting-edge metric for batters. The study shows that the SSE is noticeably smaller than that for xwOBAcon (0.578 vs. 0.736).
Another study on batter value determination was conducted by the same author [20] and followed the same approach, using the batter data from the MLB 2018 season. The study proposed determining the batter’s performance using wOBA (weighted on base average) based on a function of b in two different forms, one is a three-dimensional method, consisting of the initial speed of the ball, the vertical launch angle, and the horizontal spray angle, and the other is a four-dimension method, consisting of the previous three plus the running speed of the batter. The resulting three-dimensional wOBA is referred to as the wOBA cube, and the four-dimensional wOBA is referred to as the wOBA tesseract. The focus of this study is to make improvements to the model for batter valuation by considering an additional parameter about the batter running speed.
The study presented in Ref. [21] provides an in-depth investigation regarding the performance of pitchers. Instead of trying to quantify a player’s talent level (or performance) using a scalar value, the distribution of the pitch signatures for each pitcher is constructed, and then, the function that captures the relationship between the pitch signature distribution and the resulting strikeout rates is learned based on existing pitch-by-pitch data. Once the function is learned, one can experiment with making some alterations on the pitch distribution to optimize the strikeout rates. This in-depth model could also explain why an elite pitcher possesses higher strikeout rates. The MLB 2016 season data for pitchers are used for validation.
In [41], the batting performance is predicted using machine learning based on data collected in two seasons of the Appalachian League’s summer program, which consist of batting data acquired by the TrackMan system and physical test results as part of the Prospect Development Pipeline assessment administered by USA Baseball. The study used the data to predict the zone-contact percentage and hard-hit percentage as metrics for batting performance. The prediction performance is evaluated using the coefficient of determination R 2 (about 50–60% depending on the machine learning models used). The interpretability of the prediction result is also analyzed using Shapley additive explanations.

3.3. Player Valuation

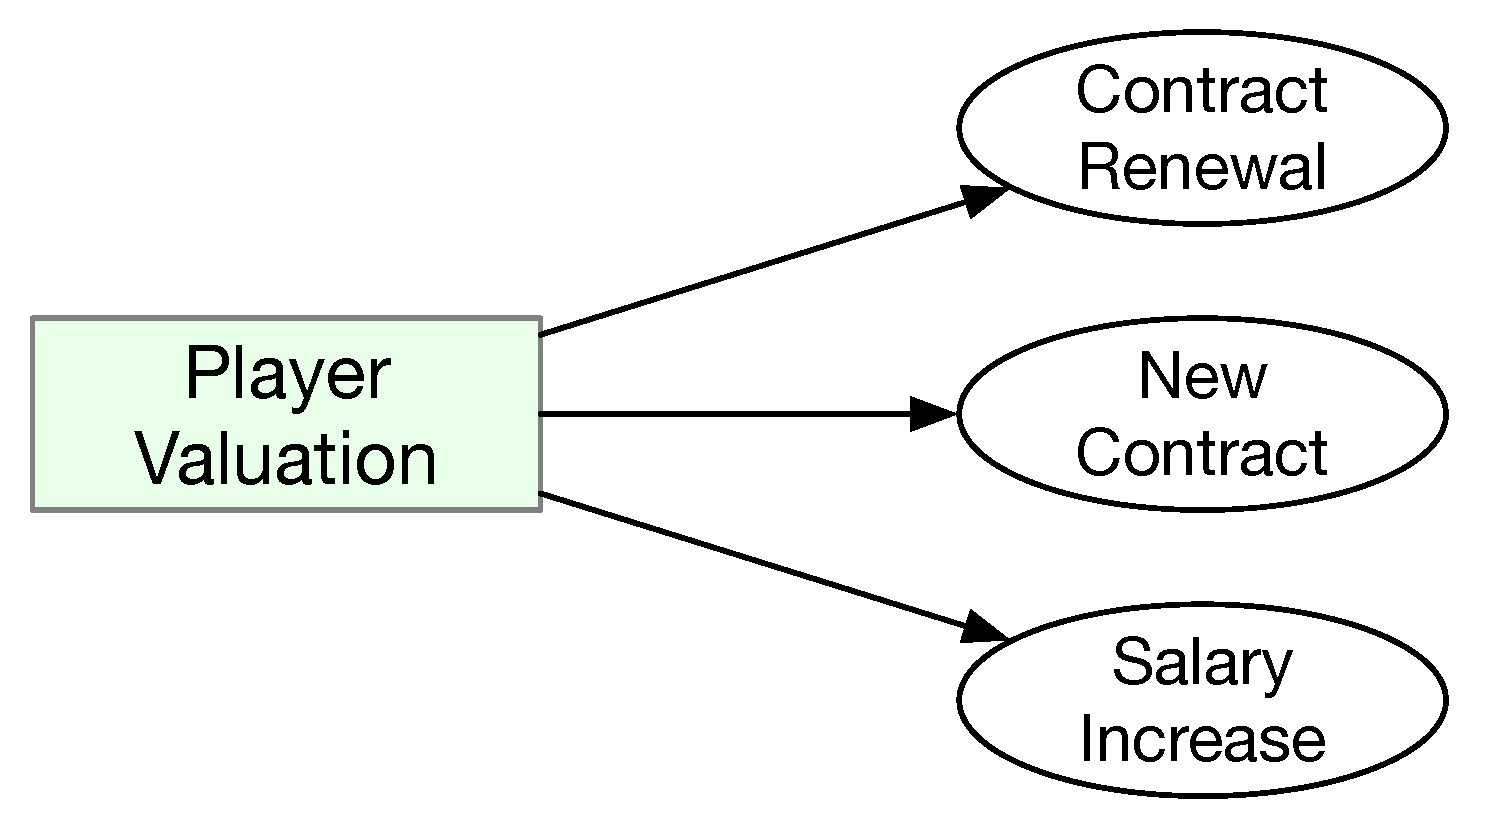
Three studies focused on predicting the value of a player in terms of salary and contract, as shown in Figure 6 and summarized in Table 4.
In Ref. [44], machine learning is used to predict the fraction of foreign baseball players who are playing (or played) in the Korea Baseball Organization (KBO) that could be granted a renewal of their contracts. The prediction for contract renewal in the next season is based on the available data of the past three years for foreign players, including the game playing data in the US Minor League Baseball (MiLB), MLB, or KBO. Various features are considered and a set of classifiers are used to make the predication. Although the prediction problem is for contract renewal, the essence is the value of the players. In KBO, each team is limited to hiring up to two foreign pitchers and one foreign batter. Hence, contract renewal depends on the available candidates. These candidates would compete for a very limited number of positions. This study only considered foreign players who played in KBO with a contract. The prediction accuracy is evaluated using accuracy, area under the receiver operating characteristic curve (AUC), and precision. Although the source code provided by the authors (https://github.com/Ptaeshin/Prediction-of-Re-signing-Foreign-Players/tree/master (accessed on 1 March 2025)) appears to be correct, the paper made a confusing statement regarding precision, “precision represents the ratio of players predicted to be eligible for contract renewal to those whose contracts were actually renewed” (page 12 of Ref. [44]). In several places, the paper compared the precision of the prediction with the percentage of foreign players who received renewed contracts (34% of pitchers and 36% of batters). The authors experimented with different features and found that by combining KBO player performance data, player injury data, and KBO team rankings, predication precision would be the best. In general, logistic regression is the best classifier among the group of classifiers experimented with and the prediction for batters is significantly higher than that for pitchers (93.3% vs. 78.3%).
In Ref. [42], a machine learning model (i.e., XGBoost) is used to predict whether an MLB player’s salary for the next season is going to be increased based on the performance of the previous season and some other information. The main contribution is the addition of a few selected features for prediction. Data from the MLB 2016–2019 seasons were used for validation. The reported prediction accuracy is between 50% and about 62%. No details are mentioned regarding how many players were considered.
In Ref. [43], machine learning is used to predict if a free agent in MLB would receive a new contract. The study used data from the MLB 2013–2017 seasons to validate the prediction accuracy. The study finds that the most significant features include the age of the player, the team on which the player last played, and the player’s performance metric called “Wins above replacement” (WAR). The study chooses to use the AUC as the metric for the prediction. The best prediction result is 73.4% in the AUC.

3.4. Player Injury Prediction

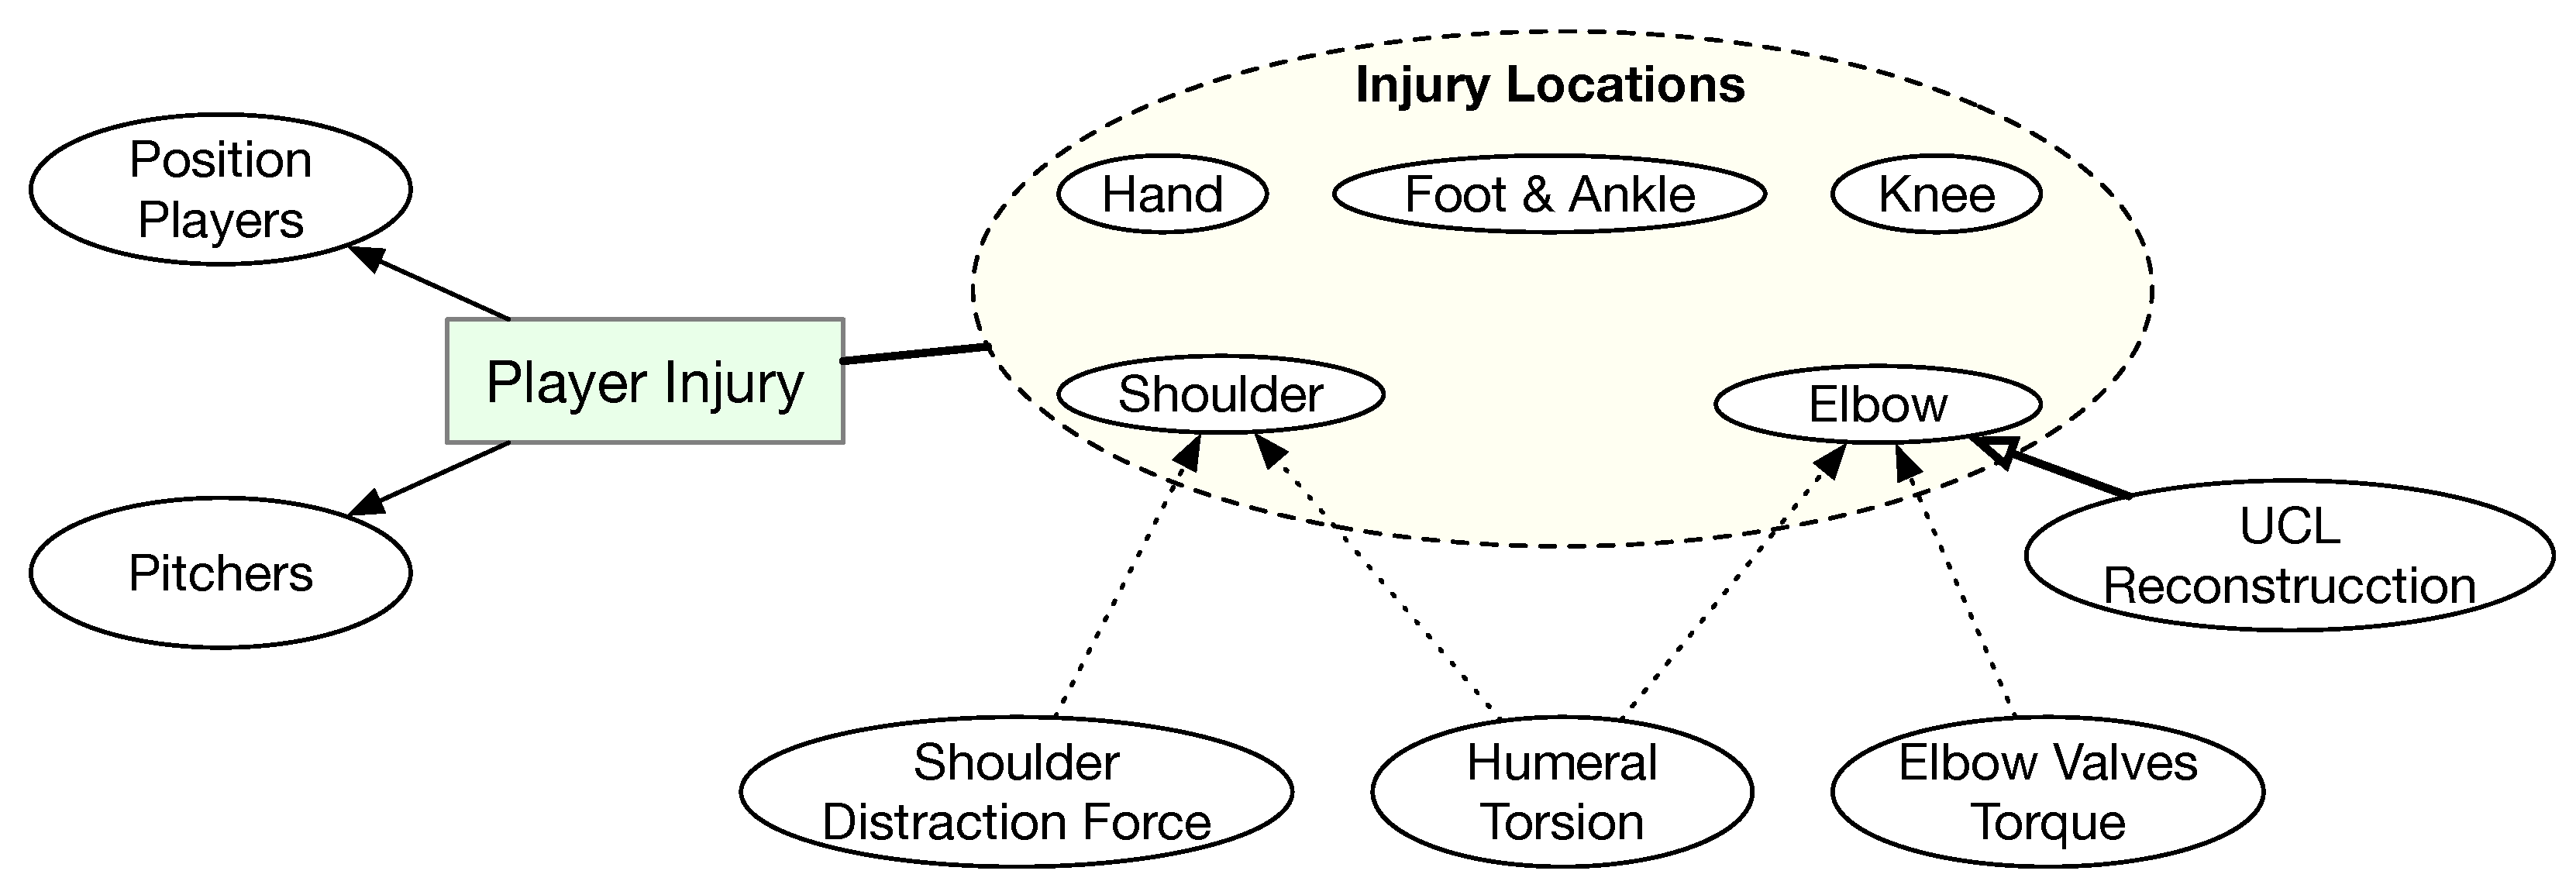
Five studies belong to this category. Although these studies may be considered as a form of projection of future outcomes, we prefer to put them in a separate category because whether or not a player will experience injury in the future is not entirely related to the performance statistics, which is quite different from predicting whether a team will win the next game. As shown in Figure 7, some studies focused on estimating some critical parameters that might indicate high likelihood of future injuries instead of directly predicting injuries [45,46], and some focused on establishing the predictors for player injury [47]. These studies are summarized in Table 5.
In Ref. [47], instead of predicting the likelihood of future injuries, the predictors for one form of injury, called ulnar collateral ligament (UCL) reconstruction, for pitchers are examined using a machine learning-based approach. Hence, strictly speaking, the study itself is projecting future outcomes. However, the predictors identified in this study may be used to predict future injuries (i.e., before a pitcher sustains the injury). That is why we still categorize this study here. The way the study is structured is to first identify MLB pitchers who have experienced UCL reconstruction between 2010–2015 and then match them with pitchers who have not undergone this surgery (i.e., position-matched controls). By making the prediction of which pitcher would receive UCL reconstruction surgery, the most significant features that enable the prediction can then be identified. The best prediction accuracy is 75%. The strongest predictors for UCL reconstruction include mean days between consecutive games, the number of pitch types in the pitcher’s repertoire, the mean pitch speed, the mean pitch count per game, stature of the pitcher, and the mean horizontal release location.
In Ref. [48], future injuries for baseball players are predicted as a binary classification problem with a set of traditional classifiers. This study compiled data from four data repositories for the MLB 2000–2017 seasons. The dataset contains performance and injury related data for 1931 position players and 1245 pitchers. This study separately predicted the future injuries for position players and pitchers. The injury locations considered include knee, back, hand, foot and ankle, shoulder, and elbow. The prediction accuracy is moderate, generally between 60–70%.
In Ref. [49], future injuries (shoulder or elbow injuries) for pitchers are predicted with a machine learning model using data for the MLB 2017–2022 seasons. Although the study reported the average prediction accuracy (84%) and AUC value (66%), the focus of the study is to determine the most important risk factors with preliminary feature ranking (using recursive feature elimination [50], coefficient ranking [51], Gini importance [52]), and Shapley additive explanation (SHAP) [53].
In Ref. [45], machine learning models are used to predict the humeral torsion for pitchers. Humeral torsion is said to be an osseous adaptation among throwing athletes (such as baseball pitchers), which can lead to arm injuries. The study spanned 11 years from 2009 to 2019 to collect data of 470 minor league pitchers in one baseball organization. The data used to make the prediction are collected by measuring the pitchers prior to each season, including current height, mass, shoulder passive range of motion, and humeral torsion, in conjunction with player demographics, previous baseball participation, injury history, position played, and continent of origin. The accuracy of the regression prediction result is evaluated using the root mean square error (RMSE), which ranges from 9 degrees to 15 degrees.
In Ref. [46], machine learning models are used to predict elbow valves’ torque and shoulder distraction force based on a set of 18 biomechanical variables. The goal of the study is to investigate the relationship between throwing-related injuries and arm stress. Elbow valves’ torque and shoulder distraction force are regarded as good indicators for arm stress. 168 high school and collegiate pitchers participated in the study, and the biomechanical variables, as well as the elbow valves’ torque and shoulder distraction force are measured using a multicamera motion-tracking system while the participants are making pitches. The prediction performance is evaluated using root mean square error (RMSE) and calibration slope. The RMSE is smaller than 1.0 for the elbow valves’ torque, and between 1.0 and 21 for shoulder distraction force. The strongest predictor is pitching velocity.

3.5. Game Outcome Prediction

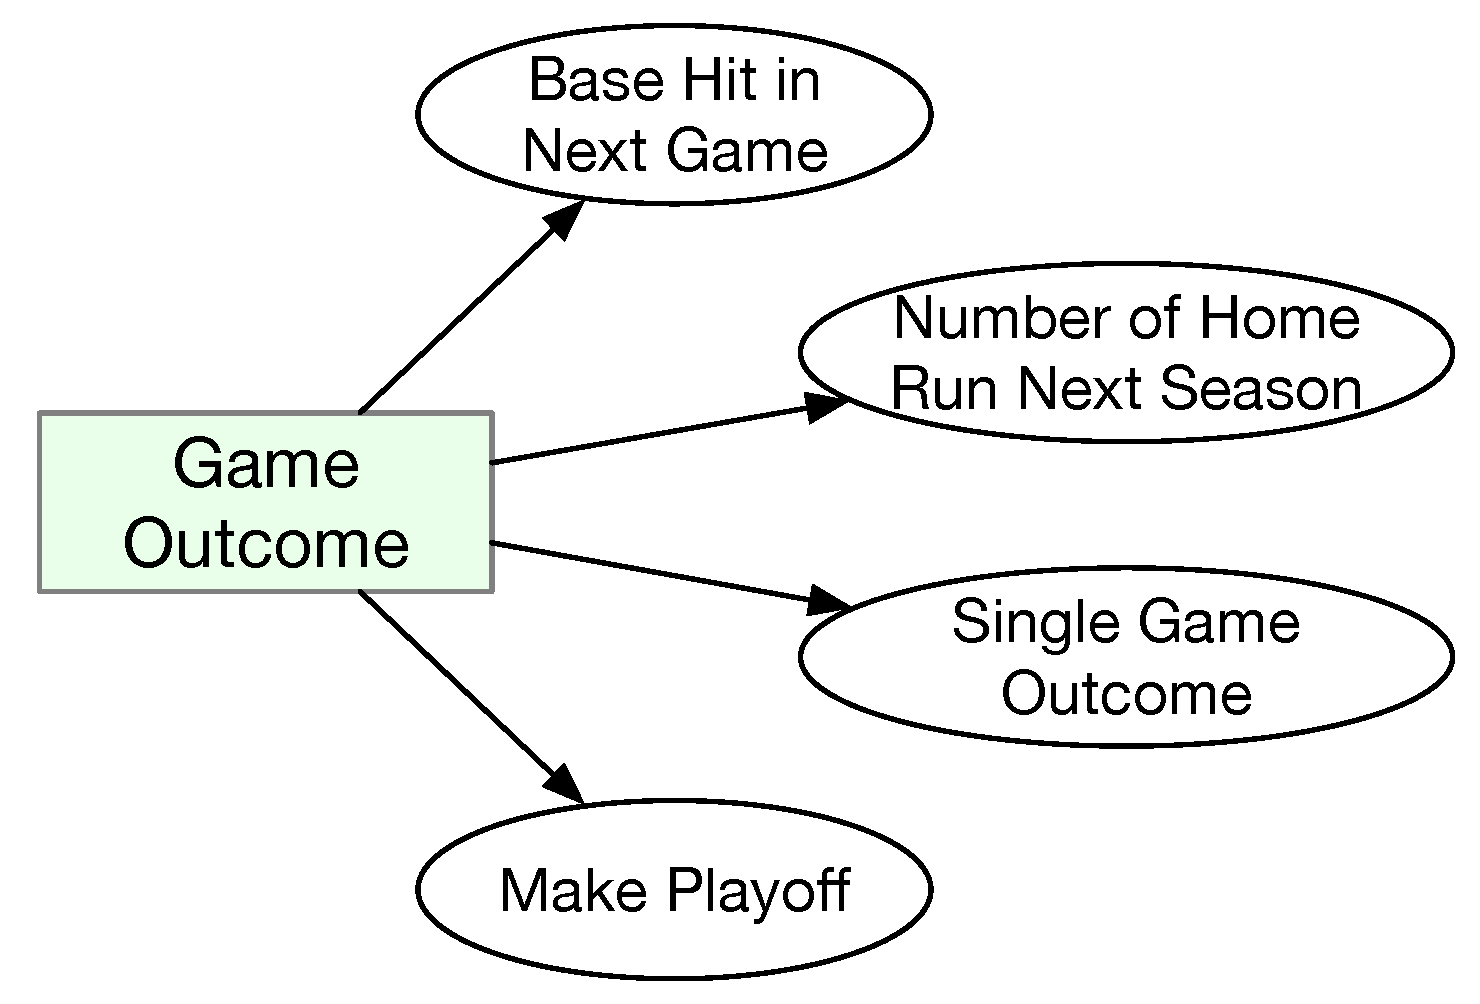
In the world of sports, betting is an important component. Sports analytics has been heavily used to improve the betting odds [54]. There are a few studies that focused on using machine learning to make predictions related to baseball betting. These studies attempted to project the likelihood of a batter to make a hit, which team would win a particular game, which teams would make playoff, or even which team would win the championship in MLB. This type of prediction is referred to as projection. Various projection algorithms have been proposed. The projection results are published online. However, the exact algorithms are usually not publicly available. In Ref. [54], several such algorithms are mentioned, including Marcel, PECOTA (short for Player Empirical Comparison and Optimization Test Algorithm), Steamer, and ZiPS. Seven studies are included in this category, and they have focused on various aspects of the game outcomes, as shown in Figure 8 and Table 6.
In Ref. [54], several machine learning models are used to predict which batter would most likely make a base hit in a game. The challenge is to make the right choice in picking batters that could make a base hit consecutively. MLB offers an online game called “Beat the Streak” for MLB fans to make the predictions, offering cash prizes for those who could make the right picks 5 times in a row or more. To make the prediction, data from four MLB seasons (2015–2018) are retrieved from three sources (Baseball Reference, Baseball Savant, and ESPN). A total of 155,521 samples are obtained. The prediction performance is evaluated with several metrics. The most prominent ones are the precision for the 100 and 250 highest probability of making base hits as predicted by the machine learning models. For top-100, the highest precision obtained in 85%.
In [55], the number of home runs that a batter will make in the next season is predicted based on historical data using a deep learning model. Batter data from the MLB 1961–2019 seasons are retrieved for the study, where the data from the 2018 and 2019 seasons are used for testing, and data from the previous years are used for training the machine learning model. Obviously, it is unreasonable to expect highly accurate prediction on the number of home runs for a batter in a future season. The authors introduced a series of ranges for the predicted number, e.g., ± 1 , ± 3 , ± 5 , and ± 10 , centered around the ground truth. The accuracy is defined as the ratio of the predicted number within each range. The accuracy can exceed 80% for the ± 10 range.
In Ref. [56], the single-game outcomes of the 2019 regular season games are predicted using three machine learning models. Although the stated prediction accuracy is significantly higher than other similar studies (94.18% vs. 73.7% or lower), we have serious concerns over the soundness of the study. The study claimed that there are 4858 games in the 2019 season (two teams played 161 games instead of 162). In fact, the actual number of games is half that (i.e., 2429). The study mentioned a number of times that the outcome of some games is win and some is loss. In fact, for each game, the only outcome is one team would win and the other team would loss. Hence, it is quite likely that the dataset contains duplicate games. Compounding the issue is the fact that the same dataset is used for both training the model parameters and testing. Normally, the testing dataset should not be used to train the model parameters.
A follow-up study of Ref. [56] is reported in Ref. [57]. The game outcome prediction accuracy reported in Ref. [57] is much more realistic (around 65%). The prediction of single-game outcomes is structured on a per-team basis, and there is no clear issue of double-counting games as in Ref. [56]. The data used also expanded from a single 2019 MLB season to all games in the 2015–2019 MLB seasons.
In [58], the outcomes of games in KBO (2012–2021 seasons) are predicted with a deep learning model based on player statistics for the home team and the away team, as well as the team features (in terms of the winning percentage). In addition to the proposed deep learning model, the study was also compared with three baseline machine learning models. In addition to binary classification, the study also experimented with prediction based on regression. The prediction accuracy of the outcomes is around 60%, which is significantly below that of Ref. [56] but much more realistic.
Another study on KBO game outcome prediction is reported in Ref. [59]. A deep learning model is used to make predictions based on the team, stadium, and player features. The paper is rather short, with little details provided on the features used, how the model is trained, and how testing is performed. Nevertheless, the reported prediction accuracy can exceed 70%.
In Ref. [60], machine learning models are used to predict which teams could make the playoffs in MLB. Records from the MLB seasons (1998–2018) are used to train the models, and the 2019 season is used to test the performance of the models. Team-based batting and pitching data are used as the features. The probability of each team to make the playoff is predicted based on the features. The overall average accuracy is about 83%, but only six out of the ten teams are correctly predicted. The discrepancy is due to the fact that there are far more teams that will not make the playoff.
4. RQ2: What Data Repositories Have Been Used?

Numerous data repositories for professional baseballs have been developed. Although there could be overlaps, these data repositories usually focus on different aspects for the baseball players, teams, and stadiums. We summarize these data repositories in Table 7. For each data repository, we provide the name, the link to the repository, the types of data provided by the repository, and references to the studies that used the repository. In general, these repositories may be accessed via World Wide Web, via Python 3.9.18, through some libraries such as pybaseball [38], via Mathlab [47], and via R (a popular language for the data science community) [41].
For MLB, the most authoritative data repositories are managed by MLB. All 30 MLB stadiums have been equipped with a sophisticated tracking system to track baseball player movements and baseball motions (such as speed, spinning, and trajectory) [17]. Such low-level motion and movement data are referred to as PITCHf/x for pitching-related data and HITf/x for hitting-related data. Recently, such data are collectively referred to as Statcast data. In addition to these low-level data, high-level data related to the players, teams, and stadiums (such as box scores, player statistics, and team statistics) are also compiled. These data are collectively stored in a repository called Baseball Savant, and the data can be viewed as public webpages. Baseball Savant is the official online data repository of MLB (and hence the most detailed and most comprehensive). The repository allows anyone to query specific statistical data and records for any player or team in MLB. The query result can be downloaded via a comma-separated value (csv) file. The repository also provided leaderboards and some analytics results visually (such as bat speed distribution, pitch locations, home run hit tracks, etc.). Many studies used Baseball Savant as the repository [23,27,38,54]. One study focused on lower-level motion data related to baseball game plays (PITCHf/x, HITf/x, and Statcast), and it retrieved the data which are now part of Baseball Savant [18,19,22,26,28,31,35].
MLB also offers access to its data repository via an API service (https://statsapi.mlb.com (accessed on 1 March 2025)) [49]. Unfortunately, the service does not appear to be freely available to the public because registration requires an MLB contact.
There are several independent data repositories in addition to the official MLB data repositories. Baseball Reference is one such repository. According to [42], Baseball Reference was founded in 2004 and has become the third-largest baseball website worldwide, measured in network traffic, only behind MLB.com and MLBtradeRumors.com. In addition to MLB data, Baseball Reference include statistics for several other baseball leagues, including MiLB, NPB, KBO, Mexican League, and CPBL. Baseball Reference also records MLB player contract data. In Refs. [42,43,54,55,56,57,60], the data are fetched from Baseball Reference.
In some cases, particularly the projection of a game outcome, ballpark factors could play an important role. ESPN has a page about ballpark factors for hitting and pitching, which is used as one of the data sources in Ref. [54]. Unfortunately, the online article was posted in 2018, and only 2013–2017 park factors are presented. It does not appear to have been updated.
In addition to the above, some repositories are set up for some specific data. Brooks Baseball is a repository for pitch tracking for MLB games. Retrosheet is a repository for play-by-play data for MLB games. The Pro Sports Transactions Archive is another repository for professional baseball, basketball, football, hockey, and soccer. In this archive, the types of transactions include player trade, draft pick, free agent signing, injury, suspension, among other information (such as dates of franchise births). For baseball, the Pro Sports Transactions Archive has 153,000 distinct entries. In Ref. [21], the authors used both Brooks Baseball and Retrosheet data. The Pro Sports Transactions Archive is used in [48] for player injury data.
Yet another type of data repositories are focused on predicting player and team future performance (historical data are also available). Fan Graphs is one such repository. A reader may examine the prediction for all MLB players for different stages of the season (pre-season projection, in-season projection, 3-year projection, and on-pace leaders’ prediction) in the “Projections” tab (https://www.fangraphs.com/projections (accessed on 1 March 2025)). Several prediction methods have been developed. The most popular method is perhaps the Zymborski Projection System (ZiPS). Although there is some a description of ZiPS on the MLB website (https://www.mlb.com/glossary/projection-systems/szymborski-projection-system (accessed on 1 March 2025)), no technical details on the system are available publicly. Some other methods have also been proposed. Unfortunately, most of them are no longer operational. Fan Graphs is used as the data repository in [31,47].
Baseball Prospectus is also a data repository for MLB players and teams. It shows the statistics for MLB baseball players and teams in terms of leaderboards for pitchers, hitters, catching, and teams. In addition, it also offers its own projections on future player and team performance (PECOTA projection system mentioned earlier), fantasy baseball information, as well as MLB player contract and injury records. The player contract records (https://legacy.baseballprospectus.com/compensation/cots/ (accessed on 1 March 2025)) are used in Ref. [42] as one of the data repositories.
In addition to MLB, some studies used data compiled for lower-level leagues. To build up a pipeline for MLB players, MLB teams also manage the minor league (MiLB), and the data for MiLB can be retrieved from the same authoritative repository of MLB and is also available on some other repositories. One study used the MiLB data [44]. College-level data have also been used in one study [41], where data collected from the Appalachian League’s summer program are used to predict the batting performance of collegiate baseball players. It is unclear whether such data are publicly available.
Some studies used baseball data outside the United States, including Japan, the Republic of Korea, and Taiwan. In Ref. [44], data for MiLB and MLB, as well as the KBO, are used in the study. KBO has 10 teams, and the official website for KBO with player statistics appears to be https://mykbostats.com (accessed on 1 March 2025). This study also used another data repository for KBO called Statiz (https://statiz.sporki.com (accessed on 1 March 2025)).
In Ref. [48], the data are compiled from four data repositories, including Baseball Savant, Baseball Reference, FanGraphs, and Professional Baseball Transactions Archive. The authors used the pybaseball Python library to retrieve data from Baseball Reference and FanGraphs, and a custom Python script was used to download data from Baseball Savant and the Pro Sports Transactions Archive.
The data used in Ref. [30] are take from the 2017 and 2018 NPB seasons. Ten out of eleven stadium teams in NPB (NPB has 12 teams) are equipped with TrackMan as part of StatCast, the same tracking technology used in MLB stadiums. The paper did not disclose how to access the data from NPB. In [34], the predictive model is trained using the 2018–2019 season data obtained from NPB. There is also a study that used data from CPBL.
The data in Ref. [29] were obtained via a human-subject trial with 19 youth pitchers. Similarly, the data in Ref. [33] were acquired via a human-subject trial with 318 young professional-level pitchers. The total number of pitches that hit the strike zone is 3503, and the total number of balls thrown is 1067. The human subject trial in Ref. [32] included 165 high school pitchers and 62 college pitchers. Each participating pitcher would throw four fastballs, three of which are used for analysis. The data used in Ref. [45] are also compiled by the authors (some by measuring the baseball players directly).

5. RQ3: What and How Machine Learning Techniques Have Been Employed for the Studies?

In this section, we report our findings regarding what and how machine learning techniques have been used in the studies. We aim to provide deeper insight to these studies by examining the following aspects: (1) the machine learning models used; (2) the features used, pre-processing of features, and model training techniques; and (3) the evaluation metrics for the classification or regression performance.

5.1. Machine Learning Models

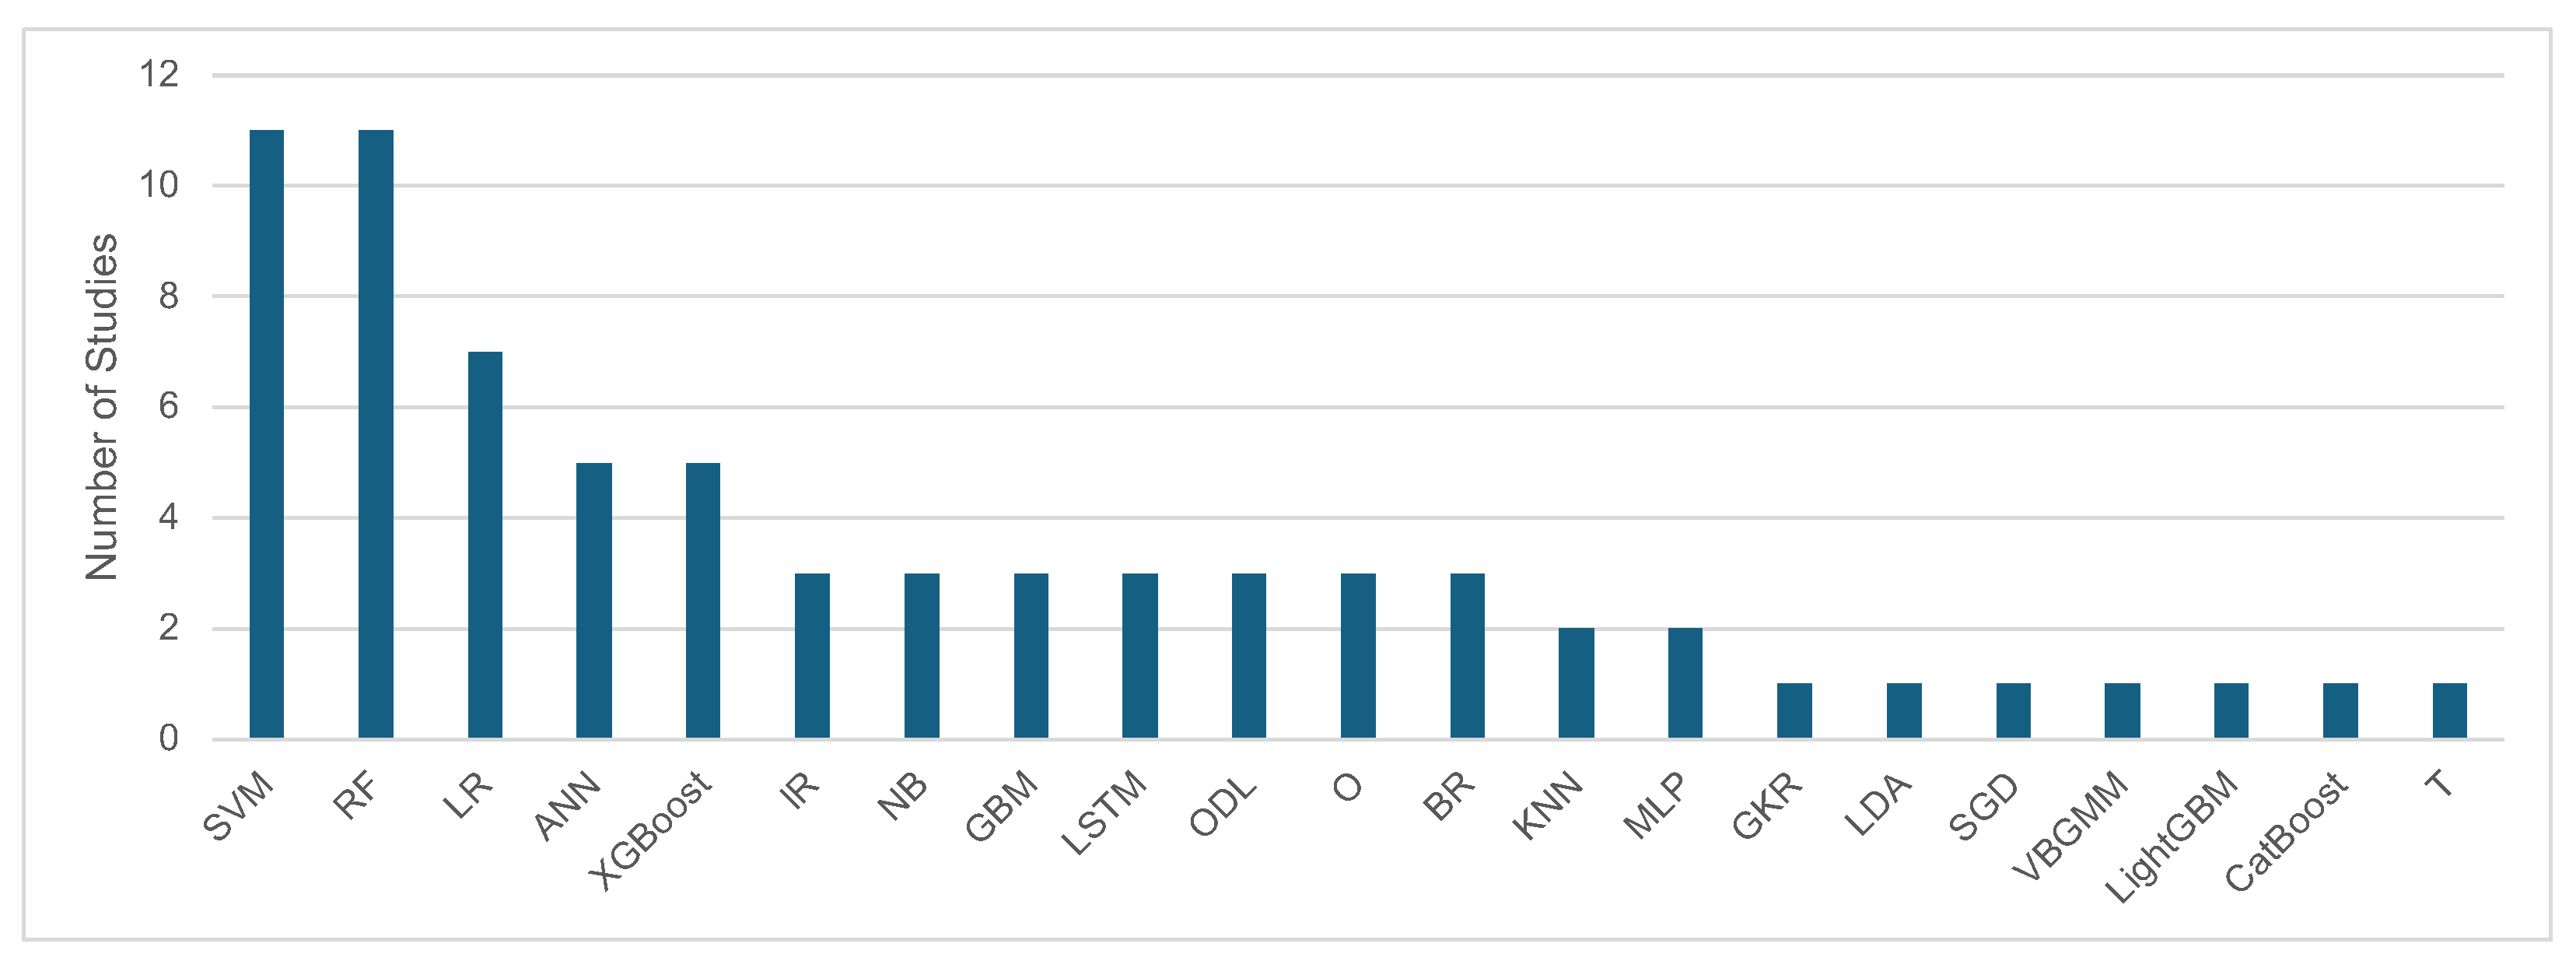
A variety of machine learning models are used in these studies, ranging from traditional classifiers/regressors to deep learning models, as shown in Figure 9. First, we present a summary of the machine learning models used in the studies in Table 8. Then, we provide a concise introduction to each of the models for completeness. The last row in Table 8 indicates the number of studies that have been included in each of the models. The information is additionally illustrated in Figure 10. As can be seen, the top three most popular machine learning models are Support Vector Machine, Random Forest, and Logistic Regression. Note that the sum of these numbers is higher than the total number of studies because many studies used several models.

5.1.1. Linear Regression

Linear regression (we use the term lR with a lower-case “l” in Table 8 to differentiate from logistic regression) is perhaps the most intuitive machine learning model. In general, the model aims to capture the linear relationship between one or more independent variables and a dependent variable (also referred to as a scalar response). The parameters for the model can be estimated with training data. A key to the model is the metric used to determine the discrepancy between the predicted value using the model and the actual data. The goal of the training (or fitting) process is to determine the best parameters that result in the least value of the metric. One such metric is the least square, but other, more advanced forms of metrics that are more robust to outliers have been introduced in recent years, such as the L1 norm and L2 norm [61]. As can be seen in Table 8, linear regression is used in [22] to estimate the talent level of a batter, and in [37] to predict when to pull the starting pitcher. A variation of linear regression is called elastic net regression, which integrates with L1 and L2 regularization, and it is used in [41] as one of the machine learning models to predict batter performance.

5.1.2. Bayesian-Based Regression

Unlike linear regression, Bayesian-Based Regression (denoted as BR in Table 8) provides a probability distribution for each parameter, which reflects the uncertainty about the parameter values [62]. The distribution is computed based on Bayesian principles with prior distribution, likelihood, posterior distribution, and Markov chain Monte Carlo. BR is used in Refs. [18,19,20] to estimate the intrinsic values of pitches and batted balls.

5.1.3. Generalized Kernel Regression

Generalized Kernel Regression (denoted as GKR in Table 8) uses kernel functions to model complex and non-linear relationships between the parameters by mapping input data into a higher-dimensional space where linear separation can be performed. The kernel functions available for use in GKR are rather similar to those for use in SVM, including linear, polynomial, radial basis function, and sigmoid. GKR is used in [21] to estimate the pitching behaviors of pitchers.

5.1.4. Logistic Regression

Logistic regression is a different model from linear regression, even though they are somewhat related [63]. In a way, logistic regression applies linear regression to address the binary classification problem [44]. Unfortunately, in the literature, the acronym LR has been used to refer to both models. In Table 8, we used the term “LOGR” to refer to logistic regression. We note that this is to completely differentiate the two models, and the acronym LOGR is not used in the literature. Unlike linear regression, logistic regression is focused on a much more specific problem, where the dependent variable is binary, denoting the probability that a certain event would take place (the value of the variable would be 1 if the event takes place and 0 if the event does not) [63]. Essentially, logistic regression would map one or more independent variables of an arbitrary range to a range between 0 and 1. Due to this requirement, a sigmoid function is used as part of logistic regression. The training (or fitting) of the logistic model is to determine the parameter for the sigmoid function based on training data. As can be seen in Table 8, logistic regression is reasonably popular as a model for baseball analytics where it is used in seven studies [29,44,48,54,58,60] because many baseball analytics problems consist of a binary dependent variable (such as whether the next pitch is going to be a fastball, or whether a team would win the next game).

5.1.5. Linear Discriminant Analysis

Linear Discriminant Analysis (LDA) aims to find a linear combination of features that lead to the maximum separation of different classes [64]. More specifically, LDA would maximize the distance between the means of different classes while minimizing the variance within each class. This is done via a linear discriminant function that projects the features onto a lower-dimensional space. The dimension of the space is one less than the number of classes. The space is used to separate the classes. LDA makes a number of assumptions as follows: (1) the relationship between the features is linear; (2) the features for each class are normally distributed; (3) all classes have the same covariance; and (4) the samples are independent of each other. LDA is used in Ref. [26] to predict whether the next pitch is a fastball.

5.1.6. Random Forest

Random forest (RF) is an ensemble learning method based on the construction of multiple decision trees [65]. By ensemble, we mean the model would involve voting or averaging the results produced from individual decision trees. To mitigate the overfitting problem, a random subset of the training data is used to construct a decision tree (i.e., random sampling), and a random subset of features (instead of using all features) is chosen to determine the best split for each decision tree (i.e., random feature selection). RF is also a popular model in baseball analytics, with seven studies employing RF [29,30,31,32,33,41,43,44,48,54], presumably because there are plenty of features to consider when making predictions.

5.1.7. Naive Bayes

Naive Bayes (NB) is a probabilistic classification model based on the Bayes’ Theorem where the posterior probability of some event to take place (such as the probability of the result to be a particular class) given an input [66]. A significant assumption for using NB is that features are independent. Considering that the performance statistics for players and teams are often correlated, NB might not be the best choice if they are used as features. Nevertheless, NB is used in Ref. [29] to predict the pitch type, and it is used in Ref. [48] to predict whether a player would be injured in the next season. NB is said to have the best prediction performance in Ref. [29], where indeed the four features used appear to be independent (they are not player performance statistics).

5.1.8. Support Vector Machine

The Support Vector Machine (SVM) formulates the classification problem into finding the best hyperplane that not only separates the training data (in the form of support vectors), but creates the maximum margin between the hyperplane and the support vectors [67]. For high-dimensional non-linear data, it is necessary to use a kernel to transform the training data into a higher-dimensional space where the transformed support vectors can be linearly separable. As such, training an SVM becomes an optimization problem, which typically takes longer time than simpler models such as LR, LOGR, and NB. SVM is used in 11 studies [29,32,36,43,45,46,47,56,58,60,68] to predict pitch type, fastball velocity, pitcher fatigue, and the likelihood of contract renewal, respectively.

5.1.9. K-Nearest Neighbors

The K-Nearest Neighbors (KNN) formulate the classification or regression problem into comparing the distance between the test data points and the stored training data points [69]. Distance calculations can be based on Euclidean distance, or some other distance calculation methods such as Manhattan distance. KNN has only a single tunable parameter, referred to as k, which presents the number of neighbors of the testing data points to consider. For classification, the prediction is made based on the majority voting for the k-nearest neighbors. For regression, the predicted value is determined by averaging the values of the k neighbors. KNN is used in Ref. [29] to predict the pitch type, and in Ref. [48], it is used to predict the likelihood of injury in the next season.

5.1.10. Artificial Neural Network

An artificial neural network (ANN) is a model inspired by biological neural networks [70]. An ANN consists of interconnected neurons organized into layers. An ANN usually consists of an input layer, one or more hidden layers, and an output layer. In an ANN, input data are passed through the three layers. To mimimic the signal propagation in biological neural networks, each neuron in the ANN would perform a transformation (two important parameters include the weight and bias) on the input data and then pass the transformed data to the next layer through an activation function. Several activation functions are available for the user to choose from, such as sigmoid (i.e., a similar function used in the logistic regression), rectified linear unit, and tanh(). The parameters in the ANN are determined with a back-propagation process using a predefined loss function. The loss function measures the distance between the predicted output and the actual outcome. During back-propagation, the weight and bias for each neuron are adjusted to minimize the loss, which is also an optimization problem. An ANN is used in [43,45,46,56,57] to predict contract renewal in the next season.

5.1.11. Multilayer Perceptron

Multilayer Perceptron is a specific type of ANN where each neuron in one layer is connected to every neuron in the next layer, which is why MLP is said to be a fully connected network [71]. By using a fully connected network, any continuous function may be approximated, provided that there is a sufficient number of neurons and layers, and such a network is said to be able to automatically learn and extract features from raw data. MLP is used in Ref. [54] to predict the base hits of batters. It is also used in Ref. [58] as one of the base machine learning models to predict game outcomes.

5.1.12. Stochastic Gradient Descent

Stochastic Gradient Descent (SGD) is an optimization algorithm minimizing the loss function during parameter fitting instead of using a machine learning model [72]. Nevertheless, the Python scikit library offers SGD as a classifier. As the name suggests, the algorithms consists of the following two key elements: (1) gradient descent, which refers to the method of finding the minimum of the loss function by iteratively moving in the direction of the steepest descent; and (2) stochastic, which means that a random subset of the training dataset (instead of the entire dataset) is used in each iteration of the training process. When used as a standalone classifier (using Python scikit), choosing log_loss would make the classifier equivalent to logistic regression. SGD works best with large-scale and sparse machine learning problems due to the stochastic approach [72]. As such, in the context of baseball analytics, SGD could be a good fit if a large set of player statics are used as features, which is indeed the case in Ref. [54], where SGD is used to predict base hits.

5.1.13. Variational Bayesian Gaussian Mixture Mode

Variational Bayesian Gaussian Mixture Mode (VBGMM) is also based on Bayes’ Theorem. It employs variational inference to estimate the model parameters [73]. VBGMM assumes that the data are generated from a mixture of several Gaussian distributions. As more data are used to train the model, the posterior distribution is updated by incorporating prior knowledge. VBGMM is an effective method for clustering, which is exactly why it is chosen in Ref. [30] for pitch type classification based on low-level motion tracking data.

5.1.14. Gradient Boosting Machine

A Gradient Boosting Machine (GBM) is an ensemble learning method combining multiple weak learners (usually decision trees) to create a strong predictive model in a sequential manner [74]. As the name suggests, GBM uses gradient descent as a way to solve the optimization problem of minimizing the loss function. In [32], GBM is used as one of several machine learning models to predict the fastball velocity as a regression problem. GBM is used in Refs. [45,46] to predict future player injuries.

5.1.15. Light Gradient Boosting Machine

Light Gradient Boosting Machine (LightGBM) is a recently introduced boosting framework based on a decision tree [75]. LightGBM adopts a histogram-based algorithm to speed up the training process and to reduce memory usage. In addition, LightGBM uses gradient boosting to enhance the model performance by combining multiple weaker classifiers in the form of decision trees to form a possibly stronger learner. LightGBM is used in Ref. [44] to predict future contract renewal for foreign baseball players in KBO.

5.1.16. CatBoost

CatBoost is designed to support the use of categorical features [76]. In addition, it incorporates several mechanisms to improve performance. It uses ordered boosting to prevent the use of the same data point in both training and validation. It uses symmetric trees for faster training and prediction. Furthermore, CatBoost mitigates overfitting by using ordered target statistics and strong regularization. CatBoost is also used in Ref. [44].

5.1.17. XGBoost

XGBoost is designed as a scalable tree boosting framework [77]. XGBoost has been warmly embraced by the community, as indicated by the heavy citations for the original publication due to its excellent performance. As a boosting framework, XGBoost also combines multiple weak classifiers (usually in the form of decision trees) to form a strong classifier. It incorporates gradient descent to minimize the loss function during the learning process. To support scalability, XGBoost supports parallel processing. Although the original publication did not explain what XGBoost represents, it is often assumed to be short for extreme gradient boosting. XGBoost is used in Ref. [44]. XGBoost is used in five studies, where it is used to predict the likelihood of future injuries [48] and the likelihood of contract renewal [44], to generate synthetic data of fly balls with the trained model [34], to predict whether the player’s salary is going to be increased in the next season [42], and to predict future injuries [49].

5.1.18. Long Short-Term Memory

Long Short-Term Memory (LSTM) is a type of recurrent neural network (RNN) designed to model temporal or other types of sequences [78]. LSTM aims to capture long-term dependencies. As such, LSTM is often used for predicting tasks based on sequential data, such as time series. In Ref. [55], LSTM is used to predict the number of home runs in a future season based on historical data for a batter. The performance statistics for a baseball player do form a sequence season over season; hence, the use of LSTM appears to be justified. However, the prediction performance with LSTM is not better than that with traditional classifiers in Ref. [55]. In Ref. [28], LSTM with attention is used to predict whether the next pitch is fastball based on historical data of the pitcher. In deep learning, it is often integrated with an attention mechanism [79] to focus on relevant parts of the input sequence when making predictions. In Ref. [59], LSTM is used to predict the game outcome in terms of a two-step sequence.

5.1.19. The Transformer Model

The transformer model (denoted as T in Table 8) is introduced in Ref. [79] and it serves as the backbone architecture for various large language models. The transformer model relies on self-attention mechanisms to handle dependencies between words in a sequence. Additionally, an encoder and a decoder are incorporated into the layers of self-attention and feed-forward neural networks. In Ref. [38], many aspects of the game-related information are encoded into tokens in a way similar to natural language, and a transformer model with eight transformer layers and eight attention heads in each layer is used to predict the form of a player with a 72-dimensional vector. The form describes the impact of the player to the game play.

5.1.20. Other Deep Learning Models

This category is denoted as ODL in Table 8. Several additional deep learning models are used in some of the studies, including 1DCNN [56,57], and a custom architecture called CompeteNet [58]. 1DCNN is short for one-dimensional convolutional neural network [80], which is designed to make predictions based on one-dimensional data, such as time-sequence features. Similar to other types of convolutional neural networks, 1DCNN consists of convolutional layers, pooling layers, and fully connected layers. CompeteNet integrates two MLP-based architectures called MLP-encoder and MLP-compete [58].

5.1.21. Other

This category is denoted as O in Table 8. In Ref. [48], a classifier called Ensemble is used. In general, an ensemble classifier uses a set of weak classifiers to built a strong one. There is a vast array of ensemble classifiers. Hence, it is unclear which one is used. In Ref. [35], a Markov decision process is used to predict if a batter would perform better given the pitcher’s behavior. The Markov decision process provides a formal way to describe an environment in reinforcement learning where decisions will be made sequentially over time [81]. In Ref. [25], the way for predicting if the next pitch is a fastball is a non-standard way.

5.2. Data Preprocessing, Model Training, and Testing

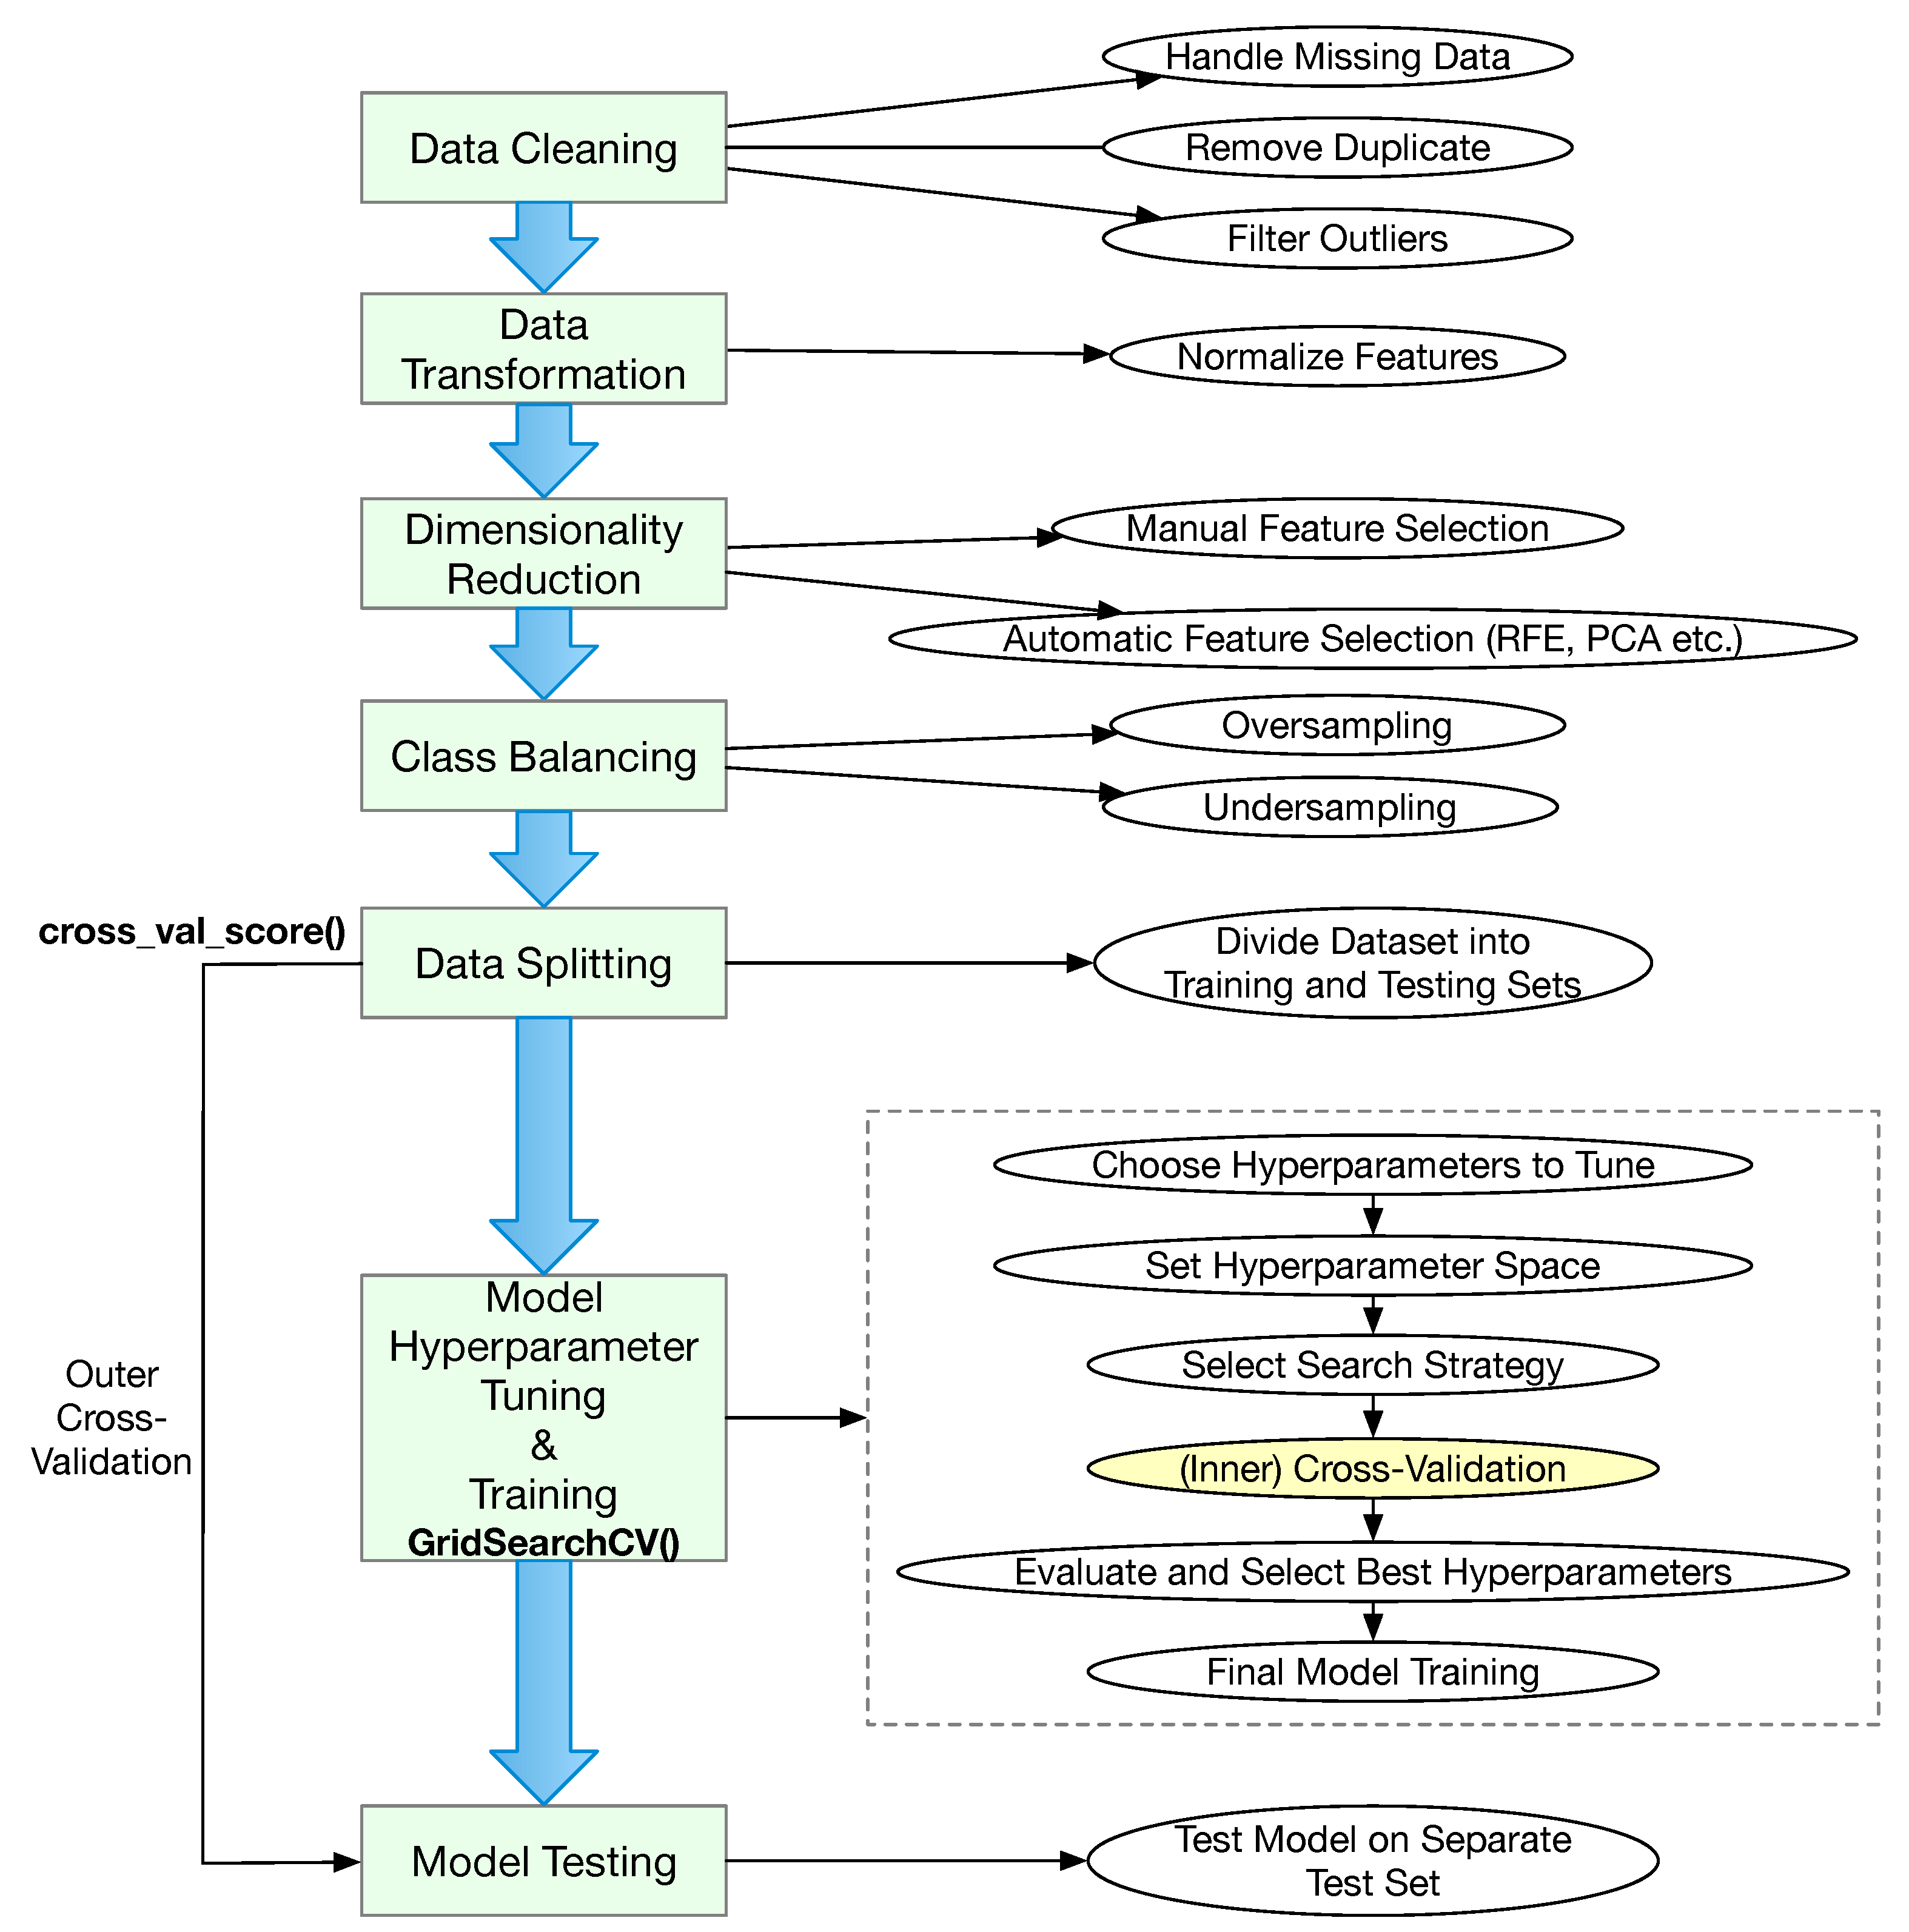
Best practices for data preprocessing, model training, and testing are illustrated in Figure 11. We include steps that are relevant to the studies that we review. In particular, we assume the dataset is readily available and can be easily put together from data retrieved from different data repositories. We then rank the studies based on how closely they have followed the best practices presented in Table 9.
As shown in Figure 11, we define seven steps in data processing, model training, and testing according to the best practice in machine learning. Data cleaning usually include identifying missing data and taking the appropriate actions, such as filling the missing data by interpolation when appropriate, removing duplicates, and filtering out outliers. The next step is to perform the transformation of the data. Typically, this means the features should be normalized (or standardized) so that statistics for different players can be compared. For example, a starting pitcher will normally not play the entire nine-inning game. The earned runs against this pitcher should be normalized for nine innings regardless of how many innings this pitcher actually played. If categorical features are used, they may also need to be converted into numerical values. Another key step is to reduce the dimensions of the features. This step is usually referred to as feature selection. Although features are often selected heuristically by the researchers based on their domain knowledge, several automated feature selection algorithms have been developed, such as principal component analysis (PCA) and recursive feature elimination (RFE). It is also possible to use linear regression to detect correlated features and thus eliminate some features. For classification, it is necessary to ensure that the number of samples for each class should be similar to each other. Typically approaches for balancing classes include oversampling and undersampling. In the context of sports analysis, undersampling is typically used. The first four steps are data preprocessing.
The processed data are then separated into two sets, one set is used to train the machine learning model, and the other set is used for testing. It is necessary to separate them because there could be leakage from training to testing, which would artificially boost testing performance. It may be desirable to perform cross-validation at this step so that all data are used for testing, which would make the testing result more fair. This type of cross-validation is referred to as outer cross-validation. In Python, one may use the function cross_val_score() to perform outer cross-validation (this function can also be used for inner cross-validation without hyperparameter tuning).
The training dataset is then used to train the machine learning model. Most machine learning models contain hyperparameters and they should be tuned based on the training data so that the model can achieve the optimal testing result. This includes choosing the hyperparameters that are important for the prediction problem, and for each hyperparameter, the range and increment step should be defined to facilitate the search for the most optimal value. Even for searching the optimal hyperparameters, several search strategies are available for the user to select. Once the above have been determined, cross-validation is then used to see which set of hyperparameters are the optimal combinations given the training dataset. This type of cross-validation is often referred to as inner cross-validation. In Python, one may use the function GridSearchCV() to perform inner cross-validation. Note that is is possible to conduct inner cross-validation with a predetermined set of hyperparameters, i.e., without hyperparameter tuning. After the inner cross-validation, the machine learning model with optimal hyperparameters is used for training using the entire training set. This is followed by testing with the fully trained model using the testing dataset.
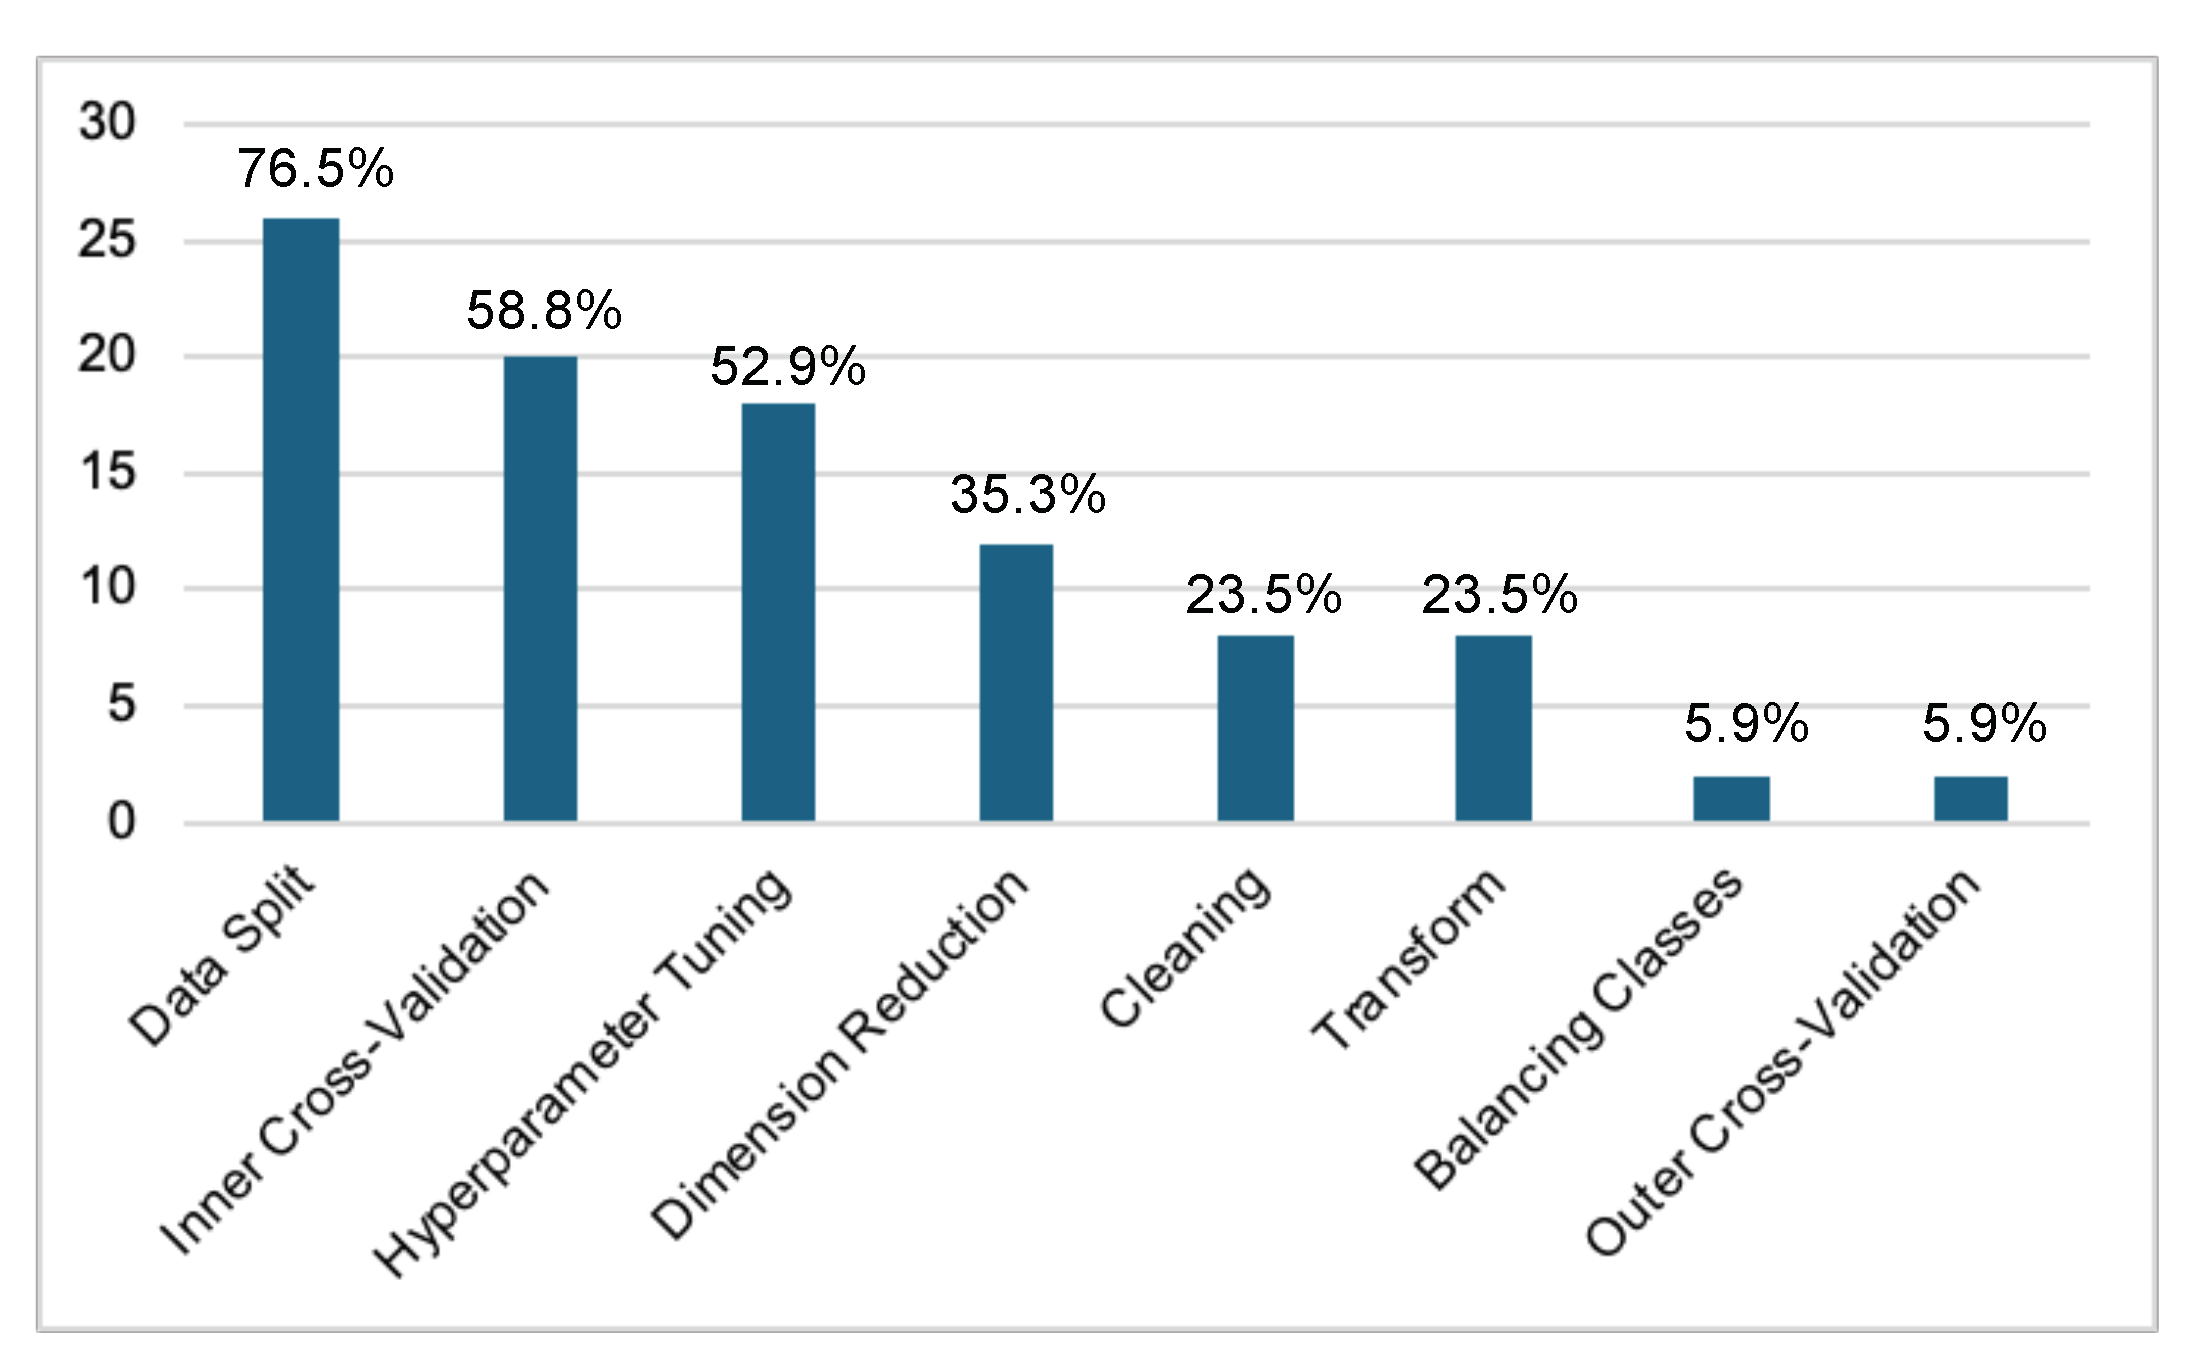
According to the best practice in machine learning, the following steps should be conducted in machine learning-based sports analytics, including data cleaning, data transformation, automatic dimensionality reduction, class balancing (for classification), data splitting, hyperparameter tuning, inner cross-validation, and outer cross-validation. Hence, we give each step a value of 1. The maximum score is 8. For studies that rely on regression, the balancing class step is irrelevant, and then, the maximum score is 7. The right-most column in Table 9 displays the scores for individual studies. The top three studies earned 7, 7, and 6 scores [41,49,54], having applied machine learning to predict the pitcher’s performance, to predict if a batter could make a base hit in the next game, and to predict future shoulder and elbow injuries for pitchers, respectively. The average score for all 34 studies is 2.8, which is 35.3% of the full score. This indicates that most studies failed to follow the best practices for data preprocessing, model training, and testing.
The last row in Table 9 shows the number of studies that have included each of the steps in data processing, model training, and testing. The information is also visually displayed in Figure 12. One would have expected that at least the data used for training the machine learning model should be different from those for testing. Eight out of 34 studies used the entire dataset for the training model. These studies mostly used regression instead of classification, and some cited insufficient number of samples as the reason for using all data to train the model [32]. Nevertheless, 28 out of the 34 studies adopted data splitting, which is the highest among all steps. Inner cross-validation ranks the second, which is incorporated in 20 studies. More than half of the studies (18 studies or 52.9%) incorporated hyperparameter tuning. Many of the baseball analytics problems, such as predicting the type of the next pitch, are significantly imbalanced, with fastball being by far the most popular type. Despite this fact, only two studies (a mere 5.9%) made an effort to balance the classes. A total of 12 studies adopted some methodology to reduce the dimensionality (i.e., selecting the most important features). Eight studies incorporated data cleaning and data transformation.

5.3. Prediction Performance Evaluation and Interpretation

Prediction performance is usually evaluated with a set of well-defined metrics. For classification, common metrics include the accuracy, precision, recall (also referred to as sensitivity), F1 score, and AUC. Some disciplines (such as medicine and healthcare) also use specificity as a metric. For multiclass classification, it is often necessary to visually present the classification performance via a confusion matrix. Although these terms are common knowledge, we provide a concise definition for each for completeness.
Accuracy represents the fraction of predictions that are correct, which is applicable to both binary classification and multiclass classification. Although accuracy is very intuitive and appears to be a compelling metric for prediction performance, it does not provide insight to the details, particularly in cases when the prediction is wrong. A classifier may make two different mistakes in binary classification as follows: (1) false positive (FP), which means a test sample is predicted to be positive when in fact it is a negative case; and (2) false negative (FN), which means a test sample is predicted to be negative when in fact it is a positive case.
Precision is usually defined for binary classification that is calculated as the fraction of true positive (TP) prediction among all the positive predictions (i.e., TP/(TP + FP)). Recall or sensitivity in binary classification is calculated as the fraction of true positive predictions among all actual positive cases (i.e., TP/(TP + FN)). The higher false positive rate, the lower the precision (false negative predictions do not impact precision). On the other hand, the higher the false negative rate, the lower the recall/sensitivity. In some cases, it is more desirable to focus on the negative class, in which case, specificity is a metric used as the ratio between the number of true negative (TN) predictions and the total negative samples (i.e., sum of TN and FP).
To provide a well-rounded assessment that considers both false positive and false negative mistakes, the F1 score is defined as the harmonic mean of precision and recall (i.e., F1 score = 2 × precision × recall precision + recall ). Another well-rounded metric is the AUC, which is short for area under the receiver operating characteristic curve, which measures the trade-off between the true positive rate and the false negative rate.
Precision, recall, specificity, F1 score, and AUC can be extended from binary classification to multiclass classification by carrying out the calculation for each class.
For regression, common metrics include the mean absolute error (MAE), mean squared error (MSE), root mean squared error (RMSE), sum of squared errors (SSE), and coefficient of determination R 2 . The MAE, MSE, RMSE, and SSE are self-explainable, and the smaller value the better it is with 0 being the best outcome. R 2 represents the fraction of variance in the dependent variable that is predicted with regression from the independent variables (i.e., the features included in the regression model). Unlike other regression metrics, R 2 ranges from 0 to 1, with 1 being the best, which means that the regression model fully explains all the variability of the response data.
To enhance the interpretability of the prediction results, a variety of different techniques have been used to identify the importance of features used for prediction, some of which are used to select the most significant features for dimensionality reduction. Traditional techniques, such as sensitivity analysis, usually considers the importance of each feature individually. A more cutting-edge technique, SHAP [53], provides a unified measure of feature importance based on game theory. As such, SHAP is generally regarded as more robust and consistent because it considers the interactions between features.
While convenient, using accuracy as the only metric to evaluate classification performance can be misleading because it fails to disclose information about false positive and false negative mistakes. Furthermore, when the classes are not balanced, the accuracy would be biased. Hence, it is important to use additional metrics to fully characterize the performance of classification. As previously recognized, it is also important to interpret the prediction results using SHAP or equivalent techniques. Hence, we rank the studies based on how thoroughly the prediction performance is evaluated and if the results are interpreted. For classification, we give one point if at least a metric that fully characterizes the performance is used. For regression, we give one point if any of the established metrics is used. The study will earn one point if some technique is used to determine feature importance, and another point if SHAP is used to interpret the prediction result. Hence, for both regression and classification studies, the highest score is 3.
In Table 10, we document the metrics used in the classification studies (22 of them) to evaluate the classification prediction performance, techniques used to interpret prediction results, and also include the score for each of the studies. For these studies, accuracy is by far the most popular metric, with all but one used it as the metric or one of the metrics. We note that 12 of the 22 studies (more than half!) used accuracy as the only metric to evaluate prediction performance. Only three studies analyzed the feature importance and three studies used SHAP to interpret the prediction outcomes.
In Table 11, we document the metrics used in the regression studies (12 of them) to evaluate regression performance, the techniques used to interpret prediction results, and we also include the score for each of the studies. Among the regression studies, three used RMSE as the metric to evaluate how close the predicted value is to the actual value, three studies used R 2 as the metric, and one study used SSE as the metric. Five regression studies analyzed the feature importance, and two of them also used SHAP to interpret the prediction outcomes. Five studies did not use any conventional quantitative metrics to evaluate the regression performance.
As can be seen in Table 10 and Table 11, two regression studies [41,49,54] and one classification study earned the full score. These three studies also earned the top three highest scores on data preprocessing, model training, and testing, as shown in Table 9.

6. Concluding Remarks

In this article, we presented a comprehensive review of 34 studies on machine learning-based baseball analytics. This review is guided by the following three research questions: (1) What baseball analytics problems have been studied using machine learning? (2) What data repositories have been used? (3) What and how machine learning techniques have been employed for the studies? The findings of these research questions lead to several research contributions. First, we provided a taxonomy for baseball analytics problems. Second, we compiled a set of data repositories for baseball analytics studies. Third, we performed an in-depth analysis on the machine learning models used and how they are used in these studies.
For machine-learned based studies, it is important to follow the best practice for optimal prediction performance, for the transferability of the results, and for the understanding the prediction results. According to the best practice, the data should be properly preprocessed, the hyperparameters should be systematically tuned with inner cross-validation, the prediction performance is thoroughly assessed, and the prediction outcomes are interpreted using feature importance analysis and/or SHAP. Unfortunately, less than a handful of studies have rigorously followed the best practices in machine learning. By ranking these studies based on the extent to which the best practice in machine learning has been followed, we find that many studies lack scientific rigorousness. It is also interesting to note that compared with informal studies on baseball analytics posted on the Web, formally published papers in this field rarely make the source code and data publicly available. Nevertheless, considering the abundant public data for MLB and other professional sports, conducting machine learning-based research in this field could be very fruitful. We sincerely hope more data scientists and practitioners pay attention to this opportunity.
A primary limitation of the current study is the use of only formally published academic publications. In baseball analytics, and sports analytics, in general, far more work has been done outside of academia. Compared with the huge publicity of sabermatrics (such as popular movies and books on the topic), the number of academic publications on baseball analytics is very limited. As we have outlined in Section 4, numerous dedicated websites have been setup and maintained. In addition to serving as data repositories, almost all such websites integrate some elements of projection, where machine learning plays a critical role. Unfortunately, usually only the projection results are published on the websites, without any technical details on how the projection is done. As such, it is impossible to carry out in-depth analysis of such work, even if we expand our review to such websites. Furthermore, a large number of GitHub projects on baseball analytics is available. Unfortunately, we do not have the resources to conduct a critical and in-depth analysis on these projects. Another limitation is that none of the authors have extensive experience in baseball analytics. The lack of expertise on baseball game play and planning would inevitably limit our insights for the application of machine learning in baseball analytics.
Although it is difficult to speculate the future of baseball analytics, one apparent open research issue is to develop better performance metrics for baseball players. There are over 100 metrics each for pitcher and batters. There are also numerous team-based metrics. These metrics are often correlated with each to some extent. Furthermore, newly introduced metrics are becoming far more complicated than traditional box scores. Some metrics, such as win-over-replacement, are tied to a specific season average of all players for the same position. Such metrics imply ranking information is provided [82], instead of the objective evaluation of a player’s performance independent of the other players. As such, when making predictions, it is challenging to select relevant metrics as features. Another challenge is how to exploit the cutting-edge large language models [83] in baseball analytics. Such large language models [83] have exhibited superior classification performance, and it is desirable to use such models to perform baseball analytics. However, doing so would be challenging because the amount of data for training the models is quite limited and could lead to the overfitting problems. There are only 30 teams in MLB and each team only plays 162 games per season. Although there are a lot games, the features produced from these games are far fewer than those of natural languages. Ways to overcome this limitation are an open research issue.

Author Contributions

Conceptualization, W.Z., V.S.A., S.Y., and X.L.; methodology, W.Z., V.S.A., S.Y., and X.L.; literature selection, W.Z. and V.S.A.; investigation, W.Z., V.S.A., S.Y., and X.L.; writing—original draft preparation, W.Z., V.S.A., S.Y., and X.L.; writing—review and editing, W.Z., V.S.A., S.Y., and X.L.; visualization, W.Z. All authors have read and agreed to the published version of the manuscript.

Funding

This work was supported in part by the US NSF grant 2215388.

Institutional Review Board Statement

Not applicable.

Informed Consent Statement

Not applicable.

Data Availability Statement

Not applicable.

Conflicts of Interest

The authors declare no conflict of interest.

Abbreviations

The following abbreviations are used in this manuscript:
MLBMajor League Baseball
MiLBMinor League Baseball
KBOKorea Baseball Organization
NPBNippon Professional Baseball
CPBLTaiwan called Chinese Professional Baseball League
ZiPSZymborski Projection System
PECOTAPlayer Empirical Comparison and Optimization Test Algorithm
WARWins Above Replacement
ERAEarned Run Average
wOBAWeighted On Base Average
UCLUlnar Collateral Ligament
LRLogistic Regression
RFRandom Forest
BRBayes-Based Regression
GKRGeneral Kernel Regression
LDALinear Discriminant Analysis
NBNaive Bayes
SVMSupport Vector Machine
KNNK-Nearest Neighbors
ANNArtificial Neural Network
MLPMulti-Layer Perception
SGDStochastic Gradient Descent
VBGMMVariational Bayesian Gaussian Mixture Mode
GBMGradient Boosting Machine
XGBoostExtreme Gradient Boosting
LSTMLong Short-Term Memory
FPFalse Positive
FNFalse Negative
TPTrue Positive
TNTrue Negative
AUCArea Under the Receiver Operating Characteristic Curve
RMSERoot Mean Squared Error
SSESum of Squared Errors
RFERecursive Feature Elimination
PCAPrincipal Component Analysis
SHAPShapley Additive Explanations
IMUInertial Measurement Instrument

References

  1. Burroughs, B. Statistics and baseball fandom: Sabermetric infrastructure of expertise. Games Cult. 2020, 15, 248–265. [Google Scholar] [CrossRef]
  2. Mason, D.S.; Foster, W.M. Putting moneyball on ice? Int. J. Sport Financ. 2007, 2, 206. [Google Scholar]
  3. Mertz, J.; Hoover, L.D.; Burke, J.M.; Bellar, D.; Jones, M.L.; Leitzelar, B.; Judge, W.L. Ranking the greatest NBA players: A sport metrics analysis. Int. J. Perform. Anal. Sport 2016, 16, 737–759. [Google Scholar] [CrossRef]
  4. Lin, S.H.; Chen, M.Y.; Chiang, H.S. Forecasting Results of Sport Events Through Deep Learning. In Proceedings of the 2018 International Conference on Machine Learning and Cybernetics (ICMLC), Chengdu, China, 15–18 July 2018; Volume 2, pp. 501–506. [Google Scholar]
  5. Pelechrinis, K.; Papalexakis, E. Athlytics: Winning in Sports with Data. In Proceedings of the Eleventh ACM International Conference on Web Search and Data Mining, Los Angeles, CA, USA, 5–9 February 2018; pp. 787–788. [Google Scholar]
  6. Hatharasinghe, M.M.; Poravi, G. Data mining and machine learning in cricket match outcome prediction: Missing links. In Proceedings of the 2019 IEEE 5th International Conference for Convergence in Technology (I2CT), Bombay, India, 29–31 March 2019; pp. 1–4. [Google Scholar]
  7. Foster, G.; O’Reilly, N.; Naidu, Z. Playing-side analytics in team sports: Multiple directions, opportunities, and challenges. Front. Sports Act. Living 2021, 3, 671601. [Google Scholar] [CrossRef]
  8. de la Torre, R.; Calvet, L.O.; Lopez-Lopez, D.; Juan, A.A.; Hatami, S. Business Analytics in Sport Talent Acquisition: Methods, Experiences, and Open Research Opportunities. Int. J. Bus. Anal. (IJBAN) 2022, 9, 1–20. [Google Scholar] [CrossRef]
  9. Howie, E.E.; Ambler, O.; Gunn, E.G.; Dias, R.D.; Wigmore, S.J.; Skipworth, R.J.; Yule, S.J. Surgical Sabermetrics: A Scoping Review of Technology-enhanced Assessment of Nontechnical Skills in the Operating Room. Ann. Surg. 2024, 279, 973–984. [Google Scholar] [CrossRef]
  10. Nocka, A.; Zheng, D.; Hu, T.; Luo, J. Moneyball for academia: Toward measuring and maximizing faculty performance and impact. In Proceedings of the 2014 IEEE International Conference on Data Mining Workshop, Shenzhen, China, 14–17 December 2014; pp. 193–197. [Google Scholar]
  11. Okuda, T. Assessing knowledge worker outcome: Performance assessment using a method inspired by baseball and sabermetrics. In Proceedings of the 2010 IEEE International Professional Comunication Conference, Twente, The Netherlands, 7–9 July 2010; pp. 218–221. [Google Scholar]
  12. Marx, G. Challenges to Mainstream Journalism in Baseball and Politics. Forum 2011, 9, 0000102202154088841427. [Google Scholar] [CrossRef]
  13. Teodoro, M.P.; Bond, J.R. Presidents, Baseball, and Wins above Expectations: What Can Sabermetrics Tell Us about Presidential Success?: Why Ronald Reagan is like Bobby Cox and Lyndon Johnson is like Joe Torre. PS Political Sci. Politics 2017, 50, 339–346. [Google Scholar] [CrossRef]
  14. Bonkiewicz, L. Bobbies and baseball players: Evaluating patrol officer productivity using sabermetrics. Police Q. 2015, 18, 55–78. [Google Scholar] [CrossRef]
  15. Dertinger, S.D. Three lessons for genetic toxicology from baseball analytics. Environ. Mol. Mutagen. 2017, 58, 390–397. [Google Scholar] [CrossRef]
  16. Author, N. Losing Sight of Hindsight: The Unrealized Traditionalism of Law and Sabermetrics. Harv. Law Rev. 2004, 117, 1703–1724. [Google Scholar]
  17. Healey, G. The new Moneyball: How ballpark sensors are changing baseball. Proc. IEEE 2017, 105, 1999–2002. [Google Scholar] [CrossRef]
  18. Healey, G. Learning, visualizing, and assessing a model for the intrinsic value of a batted ball. IEEE Access 2017, 5, 13811–13822. [Google Scholar] [CrossRef]
  19. Healey, G. A Bayesian method for computing intrinsic pitch values using kernel density and nonparametric regression estimates. J. Quant. Anal. Sports 2019, 15, 59–74. [Google Scholar] [CrossRef]
  20. Healey, G. Combining radar and optical sensor data to measure player value in baseball. Sensors 2020, 21, 64. [Google Scholar] [CrossRef]
  21. Healey, G.; Zhao, S. Learning and applying a function over distributions. IEEE Access 2020, 8, 172196–172203. [Google Scholar] [CrossRef]
  22. Healey, G.; Zhao, S. Measurement Space Partitioning for Estimation and Prediction. IEEE Access 2021, 9, 137419–137429. [Google Scholar] [CrossRef]
  23. Siegler, D.; Chen, R.; Fasko, M.; Yang, S.; Luo, X.; Zhao, W. Semi-automated development of a dataset for baseball pitch type recognition. In Cyberspace Data and Intelligence, and Cyber-Living, Syndrome, and Health, Proceedings of the International 2019 Cyberspace Congress, CyberDI and CyberLife, Beijing, China, 16–18 December 2019; Proceedings, Part II; Springer: Singapore, 2019; Volume 3, pp. 345–359. [Google Scholar]
  24. Chen, R.; Siegler, D.; Fasko, M.; Yang, S.; Luo, X.; Zhao, W. Baseball pitch type recognition based on broadcast videos. In Cyberspace Data and Intelligence, and Cyber-Living, Syndrome, and Health, Proceedings of the International 2019 Cyberspace Congress, CyberDI and CyberLife, Beijing, China, 16–18 December 2019; Proceedings, Part II; Springer: Singapore, 2019; Volume 3, pp. 328–344. [Google Scholar]
  25. Koseler, K.; Stephan, M. Machine learning applications in baseball: A systematic literature review. Appl. Artif. Intell. 2017, 31, 745–763. [Google Scholar] [CrossRef]
  26. Hoang, P.; Hamilton, M.; Murray, J.; Stafford, C.; Tran, H. A Dynamic Feature Selection Based LDA Approach to Baseball Pitch Prediction. In Lecture Notes in Artificial Intelligence, Proceedings of the Trends And Applications in Knowledge Discovery and Data Mining, PAKDD 2015, Ho Chi Minh City, Vietnam, 19–21 May 2015; Li, X., Cao, T., Lim, E., Zhou, Z., Ho, T., Cheung, D., Motoda, H., Eds.; Springer International Publishing: Cham, Switzerland, 2015; Volume 9441, pp. 125–137. [Google Scholar]
  27. Koseler, K.; McGraw, K.; Stephan, M. Realization of a Machine Learning Domain Specific Modeling Language: A Baseball Analytics Case Study. In Proceedings of the 7th International Conference on Model-Driven Engineering and Software Development, Prague, Czech Republic, 20–22 February 2019; pp. 13–24. [Google Scholar]
  28. Yu, C.C.; Chang, C.C.; Cheng, H.Y. Decide the next pitch: A pitch prediction model using attention-based LSTM. In Proceedings of the 2022 IEEE International Conference on Multimedia and Expo Workshops (ICMEW), Taipei City, Taiwan, 18–22 July 2022; pp. 1–4. [Google Scholar]
  29. Gomaz, L.; Bouwmeester, C.; van der Graaff, E.; van Trigt, B.; Veeger, D. Machine Learning Approach for Pitch Type Classification Based on Pelvis and Trunk Kinematics Captured with Wearable Sensors. Sensors 2023, 23, 9373. [Google Scholar] [CrossRef]
  30. Umemura, K.; Yanai, T.; Nagata, Y. Application of VBGMM for pitch type classification: Analysis of TrackMan’s pitch tracking data. Jpn. J. Stat. Data Sci. 2021, 4, 41–71. [Google Scholar] [CrossRef]
  31. Swartz, P.; Grosskopf, M.; Bingham, D.; Swartz, T.B. The quality of pitches in Major League Baseball. Am. Stat. 2017, 71, 148–154. [Google Scholar] [CrossRef]
  32. Nicholson, K.; Collins, G.; Waterman, B.; Bullock, G. Machine learning and statistical prediction of fastball velocity with biomechanical predictors. J. Biomech. 2022, 134, 110999. [Google Scholar] [CrossRef]
  33. Manzi, J.E.; Dowling, B.; Krichevsky, S.; Roberts, N.L.; Sudah, S.Y.; Moran, J.; Chen, F.R.; Quan, T.; Morse, K.W.; Dines, J.S. Pitch-classifier model for professional pitchers utilizing 3D motion capture and machine learning algorithms. J. Orthop. 2024, 49, 140–147. [Google Scholar] [CrossRef]
  34. Kato, M.; Yanai, T. Pulled fly balls are harder to catch: A game analysis with a machine learning approach. Sports Eng. 2022, 25, 11. [Google Scholar] [CrossRef]
  35. Sidhu, G.; Caffo, B. MONEYBARL: Exploiting pitcher decision-making using reinforcement learning. Ann. Appl. Stat. 2014, 8, 926–955. [Google Scholar] [CrossRef]
  36. Ma, Y.W.; Chen, J.L.; Hsu, C.C.; Lai, Y.H. Design and Analysis of a Pitch Fatigue Detection System for Adaptive Baseball Learning. Front. Psychol. 2021, 12, 741805. [Google Scholar] [CrossRef]
  37. Gartheeban, G.; Guttag, J. A data-driven method for in-game decision making in mlb: When to pull a starting pitcher. In Proceedings of the 19th ACM SIGKDD International Conference on Knowledge Discovery and Data Mining, Chicago, IL, USA, 11–14 August 2013; pp. 973–979. [Google Scholar]
  38. Heaton, C.; Mitra, P. Learning to describe player form in the mlb. In Proceedings of the International Workshop on Machine Learning and Data Mining for Sports Analytics, Virtual Event, 13 September 2021; pp. 93–102. [Google Scholar]
  39. Zhao, W. Technology-Enabled Motion Sensing and Activity Tracking for Rehabilitation; IET: London, UK, 2022. [Google Scholar]
  40. Devlin, J.; Chang, M.W.; Lee, K.; Toutanova, K. BERT: Pre-training of Deep Bidirectional Transformers for Language Understanding. In Proceedings of the 2019 Conference of the North American Chapter of the Association for Computational Linguistics: Human Language Technologies, Minneapolis, MN, USA, 2–7 June 2019; Volume 1 (Long and Short Papers). pp. 4171–4186. [Google Scholar]
  41. Kohn, J.N.; Lochhead, L.; Feng, J.; Bobb, R.; Appelbaum, L.G. Strength, speed, and anthropometric predictors of in-game batting performance in baseball. J. Sports Sci. 2024, 42, 1–8. [Google Scholar] [CrossRef]
  42. Lee, C.Y.; Hsu, P.Y.; Cheng, M.S.; Leu, J.D.; Xu, N.; Kan, B.L. Using Machine Learning to Predict Salaries of Major League Baseball Players. In Advances and Trends in Artificial Intelligence. From Theory to Practice, Proceedings of the 34th International Conference on Industrial, Engineering and Other Applications of Applied Intelligent Systems, IEA/AIE 2021, Kuala Lumpur, Malaysia, 26–29 July 2021; Proceedings, Part II; Springer: Cham, Switzerland, 2021; Volume 34, pp. 28–33. [Google Scholar]
  43. Simsek, S.; Albizri, A.; Johnson, M.; Custis, T.; Weikert, S. Predictive data analytics for contract renewals: A decision support tool for managerial decision-making. J. Enterp. Inf. Manag. 2021, 34, 718–732. [Google Scholar] [CrossRef]
  44. Park, T.; Kim, J. Machine learning-based optimization of contract renewal predictions in Korea Baseball organization. Heliyon 2023, 9, e23231. [Google Scholar] [CrossRef]
  45. Bullock, G.S.; Thigpen, C.A.; Collins, G.S.; Arden, N.K.; Noonan, T.K.; Kissenberth, M.J.; Shanley, E. Machine learning does not improve humeral torsion prediction compared to regression in baseball pitchers. Int. J. Sports Phys. Ther. 2022, 17, 390. [Google Scholar] [CrossRef]
  46. Nicholson, K.F.; Collins, G.S.; Waterman, B.R.; Bullock, G.S. Machine learning and statistical prediction of pitching arm kinetics. Am. J. Sports Med. 2022, 50, 238–247. [Google Scholar] [CrossRef]
  47. Whiteside, D.; Martini, D.N.; Lepley, A.S.; Zernicke, R.F.; Goulet, G.C. Predictors of ulnar collateral ligament reconstruction in Major League Baseball pitchers. Am. J. Sports Med. 2016, 44, 2202–2209. [Google Scholar] [CrossRef] [PubMed]
  48. Karnuta, J.M.; Luu, B.C.; Haeberle, H.S.; Saluan, P.M.; Frangiamore, S.J.; Stearns, K.L.; Farrow, L.D.; Nwachukwu, B.U.; Verma, N.N.; Makhni, E.C.; et al. Machine learning outperforms regression analysis to predict next-season Major League Baseball player injuries: Epidemiology and validation of 13,982 player-years from performance and injury profile trends, 2000–2017. Orthop. J. Sports Med. 2020, 8, 2325967120963046. [Google Scholar] [CrossRef] [PubMed]
  49. Oeding, J.F.; Boos, A.M.; Kalk, J.R.; Sorenson, D.; Verhooven, F.M.; Moatshe, G.; Camp, C.L. Pitch-tracking metrics as a predictor of future shoulder and elbow injuries in major league baseball pitchers: A machine-learning and game-theory based analysis. Orthop. J. Sports Med. 2024, 12, 23259671241264260. [Google Scholar] [CrossRef]
  50. Guyon, I.; Weston, J.; Barnhill, S.; Vapnik, V. Gene selection for cancer classification using support vector machines. Mach. Learn. 2002, 46, 389–422. [Google Scholar] [CrossRef]
  51. Efron, B.; Hastie, T.; Johnstone, I.; Tibshirani, R. Least angle regression. Ann. Stat. 2004, 32, 407–499. [Google Scholar] [CrossRef]
  52. Breiman, L.; Friedman, J.; Olshen, R.A.; Stone, C.J. Classification and Regression Trees; Routledge: Boca Raton, FL, USA, 2017. [Google Scholar]
  53. Lundberg, S.M.; Lee, S.I. A Unified Approach to Interpreting Model Predictions. In Proceedings of the Advances in Neural Information Processing Systems, Long Beach, CA, USA, 4–9 December 2017; Guyon, I., Luxburg, U.V., Bengio, S., Wallach, H., Fergus, R., Vishwanathan, S., Garnett, R., Eds.; Curran Associates, Inc.: New York, NY, USA, 2017; Volume 30. [Google Scholar]
  54. Alceo, P.; Henriques, R. Sports Analytics: Maximizing Precision in Predicting MLB Base Hits. In Proceedings of the 11th International Joint Conference on Knowledge Discovery, Knowledge Engineering and Knowledge Management (IC3K 2019), Vienna, Austria, 17–19 September 2019; pp. 190–201. [Google Scholar]
  55. Sun, H.C.; Lin, T.Y.; Tsai, Y.L. Performance prediction in major league baseball by long short-term memory networks. Int. J. Data Sci. Anal. 2023, 15, 93–104. [Google Scholar] [CrossRef]
  56. Huang, M.L.; Li, Y.Z. Use of machine learning and deep learning to predict the outcomes of major league baseball matches. Appl. Sci. 2021, 11, 4499. [Google Scholar] [CrossRef]
  57. Li, S.F.; Huang, M.L.; Li, Y.Z. Exploring and selecting features to predict the next outcomes of MLB games. Entropy 2022, 24, 288. [Google Scholar] [CrossRef]
  58. Mun, K.; Cha, B.; Lee, J.; Kim, J.; Jo, H. CompeteNet: Siamese Networks for Predicting Win-Loss Outcomes in Baseball Games. In Proceedings of the 2023 IEEE International Conference on Big Data and Smart Computing (BigComp), Jeju, Republic of Korea, 13–16 February 2023; pp. 1–8. [Google Scholar]
  59. Chun, S.; Son, C.H.; Choo, H. Inter-dependent lstm: Baseball game prediction with starting and finishing lineups. In Proceedings of the 2021 15th International Conference on Ubiquitous Information Management and Communication (IMCOM), Seoul, Republic of Korea, 4–6 January 2021; pp. 1–4. [Google Scholar]
  60. Yaseen, A.S.; Marhoon, A.F.; Saleem, S.A. Multimodal machine learning for major league baseball playoff prediction. Informatica 2022, 46, 1–7. [Google Scholar] [CrossRef]
  61. Brunton, S.L.; Kutz, J.N. Data-Driven Science and Engineering: Machine Learning, Dynamical Systems, and Control; Cambridge University Press: Cambridge, UK, 2022. [Google Scholar]
  62. Gelman, A.; Carlin, J.B.; Stern, H.S.; Rubin, D.B. Bayesian Data Analysis; Chapman and Hall/CRC: Boca Raton, FL, USA, 1995. [Google Scholar]
  63. Hosmer Jr, D.W.; Lemeshow, S.; Sturdivant, R.X. Applied Logistic Regression; John Wiley & Sons: Hoboken, NJ, USA, 2013. [Google Scholar]
  64. Balakrishnama, S.; Ganapathiraju, A. Linear discriminant analysis-a brief tutorial. Inst. Signal Inf. Process. 1998, 18, 1–8. [Google Scholar]
  65. Breiman, L. Random forests. Mach. Learn. 2001, 45, 5–32. [Google Scholar] [CrossRef]
  66. Rish, I. An empirical study of the naive Bayes classifier. In Proceedings of the IJCAI 2001 Workshop on Empirical Methods in Artificial Intelligence, Seattle, WA, USA, 4–6 August 2001; pp. 41–46. [Google Scholar]
  67. Burges, C.J. A tutorial on support vector machines for pattern recognition. Data Min. Knowl. Discov. 1998, 2, 121–167. [Google Scholar] [CrossRef]
  68. Yu, T.C.; Hung, J.C. Forecasting MLB playoff teams using GA-SVM. In Proceedings of the 2017 International Conference on Applied System Innovation (ICASI), Sapporo, Japan, 13–17 May 2017; pp. 446–448. [Google Scholar]
  69. Cover, T.; Hart, P. Nearest neighbor pattern classification. IEEE Trans. Inf. Theory 1967, 13, 21–27. [Google Scholar] [CrossRef]
  70. Hassoun, M. Fundamentals of Artificial Neural Networks; The MIT Press: Cambridge, MA, USA, 1995. [Google Scholar]
  71. Rumelhart, D.E.; Hinton, G.E.; Williams, R.J. Learning representations by back-propagating errors. Nature 1986, 323, 533–536. [Google Scholar] [CrossRef]
  72. Bottou, L. Large-scale machine learning with stochastic gradient descent. In Keynote, Invited and Contributed Papers, Proceedings of the COMPSTAT’2010: 19th International Conference on Computational Statistics, Paris, France, 22–27 August 2010; Springer: Berlin/Heidelberg, Germany, 2010; pp. 177–186. [Google Scholar]
  73. Corduneanu, A.; Bishop, C.M. Variational Bayesian model selection for mixture distributions. In Proceedings of the Artificial intelligence and Statistics, Key West, FL, USA, 4–7 January 2001; Morgan Kaufmann: Waltham, MA, USA, 2001; Volume 2001, pp. 27–34. [Google Scholar]
  74. Friedman, J.H. Greedy function approximation: A gradient boosting machine. Ann. Stat. 2001, 29, 1189–1232. [Google Scholar] [CrossRef]
  75. Ke, G.; Meng, Q.; Finley, T.; Wang, T.; Chen, W.; Ma, W.; Ye, Q.; Liu, T.Y. LightGBM: A highly efficient gradient boosting decision tree. In Advances in Neural Information Processing Systems, Proceedings of the Annual Conference on Neural Information Processing Systems 2017, Long Beach, CA, USA, 4–9 December 2017; The MIT Press: Cambridge, MA, USA, 2017; Volume 30. [Google Scholar]
  76. Prokhorenkova, L.; Gusev, G.; Vorobev, A.; Dorogush, A.V.; Gulin, A. CatBoost: Unbiased boosting with categorical features. In Advances in Neural Information Processing Systems, Proceedings of the Annual Conference on Neural Information Processing Systems 2018, Montreal, QC, Canada, 3–8 December 2018; The MIT Press: Cambridge, MA, USA, 2018; Volume 31. [Google Scholar]
  77. Chen, T.; Guestrin, C. Xgboost: A scalable tree boosting system. In Proceedings of the 22nd ACM Sigkdd International Conference on Knowledge Discovery and Data Mining, San Francisco, CA, USA, 13–17 August 2016; pp. 785–794. [Google Scholar]
  78. Hochreiter, S.; Schmidhuber, J. Long Short-term Memory. Neural Comput. 1997, 9, 1735–1780. [Google Scholar] [CrossRef]
  79. Vaswani, A.; Shazeer, N.; Parmar, N.; Uszkoreit, J.; Jones, L.; Gomez, A.N.; Kaiser, L.; Polosukhin, I. Attention is all you need. In Proceedings of the NIPS’17: 31st International Conference on Neural Information Processing Systems, Long Beach, CA, USA, 4–9 December 2017; pp. 6000–6010. [Google Scholar]
  80. Kiranyaz, S.; Avci, O.; Abdeljaber, O.; Ince, T.; Gabbouj, M.; Inman, D.J. 1D convolutional neural networks and applications: A survey. Mech. Syst. Signal Process. 2021, 151, 107398. [Google Scholar] [CrossRef]
  81. Feinberg, E.A.; Shwartz, A. Handbook of Markov decision processes: Methods and Applications; Springer Science & Business Media: New York, NY, USA, 2012; Volume 40. [Google Scholar]
  82. Zhao, W.; Yang, S.; Luo, X. Formulating Major League Baseball Playoff Prediction as a Ranking Problem. In Proceedings of the 2024 6th International Conference on Pattern Recognition and Intelligent Systems, Hong Kong, China, 25–27 July 2024; pp. 74–81. [Google Scholar]
  83. Chang, Y.; Wang, X.; Wang, J.; Wu, Y.; Yang, L.; Zhu, K.; Chen, H.; Yi, X.; Wang, C.; Wang, Y.; et al. A survey on evaluation of large language models. ACM Trans. Intell. Syst. Technol. 2024, 15, 1–45. [Google Scholar] [CrossRef]
Figure 1. Research questions and their relationship.
Information 16 00361 g001
Figure 2. Literature selection protocol.
Information 16 00361 g002
Figure 3. Various individual game plays have been studied using machine learning, including the prediction and evaluation of pitch type, pitch value, pitched ball speed, batted ball value, the accuracy of the pitched ball, and the impact to the team, etc.
Information 16 00361 g003
Figure 4. Trained predictive model used to generate synthetic data to validate the research questions.
Information 16 00361 g004
Figure 5. Four studies focused on characterizing the performance metrics for pitchers and batter.
Information 16 00361 g005
Figure 6. Three studies focused on predicting the value of a player in terms of salary and contract.
Information 16 00361 g006
Figure 7. Predicting player future injuries and determining the predictors that could lead to future injuries.
Information 16 00361 g007
Figure 8. Game outcomes considered include whether a batter would make a base hit in the next game, the total number of home runs that batter would make in the next season, whether a team would win the next game, and whether a team could make the playoff in the next season.
Information 16 00361 g008
Figure 9. Machine learning models used in baseball analytics.
Information 16 00361 g009
Figure 10. Number of studies that used each of the machine learning models.
Information 16 00361 g010
Figure 11. Main steps in data preprocessing, model training, and testing.
Information 16 00361 g011
Figure 12. Number of studies (and percentage of studies) that have followed individual steps defined in the best practices in data preprocessing, model training, and testing.
Information 16 00361 g012
Table 1. Studies on individual game play prediction with machine learning.
PurposeDataPrediction PerformanceReferences
Next pitch prediction (fastball or not)Pitching-related data in MLB 2008, 2009, 2010, 2011, and 2011 seasonsAccuracy ranges between 76.27% and 77.97%[26]
Next pitch prediction (fastball or not)Pitching-related data from four teams in MLB 2016 and 2017 seasonsAccuracy at 71.36%[27]
Next pitch prediction (fastball or not)Pitching-related data in MLB 2015, 2016, 2017, 2018, and 2021 seasonsAverage accuracy at 76.7%[28]
Pitch type prediction (binary: fastball or not; multiclass: fastball, curveball, or change-up)Motion data are obtained via human-subject trialBinary classification accuracy 71.0%; Multiclass classification results vary[29]
Pitch type classification (7 types)Pitching data from the 2017 and 2018 seasons in Nippon Professional BaseballAccuracy > 90%[30]
Pitch valuePITCHf/x and HITf/x data from MLB 2014 seasonCorrelation between predicted intrinsic value in 2014 and ERA in 2015[19]
Pitch valuePITCHf/x data from the MLB 2013, 2014, and 2015 seasonsEvaluated in terms of the number of bases conceded[31]
Batted ball valueHITf/x data from MLB 2014 seasonReliability using Cronbach’s alpha[18]
Velocity of pitched fastballPitcher kinematic data collected via a human-subject trialRMSE < 0.001[32]
Whether or not the pitched ball would hit the strike zonePitcher kinematic data collected via a human-subject trialAccuracy at 70%[33]
Probability of flyoutSynthesized data generated by trained modelF-1 score at 0.92[34]
Pitch decision modelingMLB 2009 and 2010 seasonsAccuracy varies significantly for different pitchers[35]
Pitcher fatigue detectionCPBL 2018 seasonAccuracy ranges between 72% and 89%[36]
When to pull the starting pitcherMLB 2006–2010 seasonAccuracy at 81%[37]
Player (pitcher) impact to teamMLB 1995–2018 seasonsVisually displayed[38]
Table 2. Contrast between two studies on pitch value.
2017 Study [31]2019 Study [19]
ContextCount (12 scenarios)Count and handedness of pitcher and batter
Pitch DescriptorHandedness for pitcher and batter (4 scenarios); pitch location (9 within strike zone and 4 outside strike zone); pitched ball speed (in six intervals); pitch types (8 types)A pitch vector of 5 dimension (reflecting the speed of pitched ball, pitch location, and the impact of spinning to the trajectory)
Pitch OutcomeThe total number bases yielded because of the pitch, i.e., the sum of 7 outcomes: (1) out; (2) single or non-intentional walk; (3) double; (4) triple; (5) home run; (6) ball but not walk; and (7) strike but not outA matrix of five outcomes: (1) ball in play; (2) called ball; (3) swinging strike; (4) foul ball; and (5) batter hit-by-pitch
Table 3. Player performance evaluation with machine learning.
PurposeDataPrediction PerformanceReferences
Batter value (performance)MLB 2018 seasonNo obvious comparison is done[20]
Pitcher value (performance)MLB 2016 seasonNo obvious comparison is done[21]
Batter talent levelMLB 2019 seasonSSE for proposed regression method is better than that of xwOBAcon (0.578 vs. 0.736)[22]
Batter performanceAppalachian League 2022 and 2023 seasons R 2 about 0.5–0.6[41]
Table 4. Player valuation prediction with machine learning.
PurposeDataPrediction PerformanceReferences
Salary increase2016–2019 MLB seasonsAccuracy between 50% to 62%[42]
New contractMLB 2013–2017 seasonsAUC at 73.4%[43]
Contract renewalMiLB, MLB, KBO 2014–2022 seasonsPrecision for pitchers > 78% and for batters > 93%[44]
Table 5. Player injury prediction with machine learning.
PurposeDataPrediction PerformanceReferences
Determine the predictors for UCL reconstruction for pitchersMLB 2010–2015 seasonsAccuracy about 75%[47]
Predicting player future injury at different locationsMLB 2000–2017 seasonsAccuracy in the range of 60–70%[48]
Predicting future elbow and shoulder injuries for pitchersMLB 2017–2022 seasonsAverage accuracy at 84% and AUC at 66%[49]
Predicting humeral torsion for pitchersOne MiLB club 2009–2019 seasonsRMSE in range of 9–15 degrees[45]
Predicting elbow valves’ torque and shoulder distraction force high school and college pitchersData collected in in-house motion tracking facilityRMSE < 1.0 for elbow valves’ torque, and between 1.0 and 21 for shoulder distraction force[46]
Table 6. Game outcome prediction with machine learning.
PurposeDataPrediction PerformanceReferences
If batter would make a base hitData in MLB 2015–2018 seasonsTop-100 base hit prediction at 85%[54]
Number of homers that a batter will make next seasonMLB data (1961–2017 for training, 2018–2019 for testing)Accuracy for range ( ± 10 ) of home runs at around 80%[55]
Single-game outcome (win or lose)MLB 2019 seasonAccuracy at 94.18%[56]
Single-game outcome (win or lose)MLB 2015–2019 seasonsAccuracy about 65%[57]
Single-game outcome (win or lose)KBO 2012–2021 seasonsAccuracy about 60%[58]
Single-game outcome (win or lose)KBO 2019 seasonAccuracy about 70%[59]
If a team would make playoff next seasonMLB 1998–2018 seasonsAverage accuracy about 83%[60]
Table 7. Baseball data repositories.
NameURLTypes of Data in the RepositoryReferences
Baseball Savanthttps://baseballsavant.mlb.com (accessed on 1 March 2025)The authoritative data repository for MLB players and teams, including PITCHf/x, HITf/x, Statcast, traditional box scores and statistics, sabermetrics, etc.[18,19,22,23,26,27,28,31,35,38,54]
StatsAPIhttps://statsapi.mlb.com (accessed on 1 March 2025)Presumably the same data in Baseball Savant. Access requires MLB approval.[49]
Baseball Referencehttps://www.baseball-reference.com (accessed on 1 March 2025)Statistics; sabmetrics; and player contract data for MLB, MiLB, NPB, KBO, Mexican League, and CPBL.[42,43,54,55,56,57,60]
ESPNhttps://www.espn.com/fantasy/baseball/story/_/id/22542055/fantasy-baseball-park-factors-which-stadiums-best-hitting-pitching (accessed on 1 March 2025)MLB ballpark factors for hitting and pitching[54]
Brooks Baseballhttps://www.brooksbaseball.net (accessed on 1 March 2025)Pitch tracking for MLB games[21]
Retrosheethttps://www.retrosheet.org (accessed on 1 March 2025)Play-by-play data for MLB games[21]
Pro Sports Transactions Archivehttps://www.prosportstransactions.com (accessed on 1 March 2025)Transactions records in professional sports, including player trade, draft pick, free agent signing, injury, and suspension[48]
Fan Graphshttps://www.fangraphs.com (accessed on 1 March 2025)Projected records for players and teams in the next season, past and current statistics for MLB[31,47]
Baseball Prospectushttps://www.baseballprospectus.com (accessed on 1 March 2025)Projected records for MLB players and teams, as well as player contract and injury records[42]
Table 8. Machine learning models used in baseball analytics. The checkmark (✓) indicates that the particular model is used in the study. The last row shows the number of studies that used a particular model. The acronyms for the models will be explained in the text.
lRBRGKRLRLDARFNBSVMKNNANNMLPSGDVBGMMGBMLightGBMCatBoostXGBoostLSTMTODLORefs.
[22]
[37]
[41]
[18]
[19]
[20]
[21]
[29]
[54]
[60]
[48]
[44]
[58]
[57]
[30]
[31]
[33]
[46]
[32]
[45]
[43]
[56]
[26]
[47]
[36]
[34]
[49]
[42]
[55]
[28]
[59]
[38]
[27]
[35]
33171113112521131153133
Table 9. Extent to which the best practices in data preprocessing, training, and testing have been followed. The checkmark (✓) indicates that the particular step is used in the study. The last row shows the number of studies (and percentage of studies) that have included each of the steps in data processing, model training, and testing.
Data CleaningData Transform.Dimen. ReductionBalance ClassesData SplitHyperparameter TuningInner Cross-Valid.Outer Cross-Valid.ScoreRef.
7Kohn [41]
7Alceo [54]
6Oeding [49]
5Li [57]
5Huang [56]
4Park [44]
4Nicholson [32]
4Nicholson [46]
4Whiteside [47]
3Hoang [26]
3Ma [36]
3Ganeshapillai [37]
3Healey [22]
3Healey [18]
3Healey [19]
3Mun [58]
2Healey [20]
3Healey [21]
3Gomaz [29]
3Yaseen [60]
2Karnuta [48]
2Sun [55]
2Umemura [30]
2Manzi [33]
2Bullock [45]
2Simsek [43]
1Swartz [31]
1Kato [34]
1Lee [42]
1Yu [28]
1Koseler [27]
1Sidhu [35]
0Chun [59]
0Heaton [38]
8 (23.5%)8 (23.5%)12 (34.3%)2 (5.9%)26 (76.5%)18 (52.9%)20 (58.8%)2 (5.9%)2.8 (35.3%)
Table 10. Summary of the metrics used in the studies to evaluate classification prediction performance, techniques used to interpret the prediction results, and the score for each classification study. The checkmark (✓) indicates that the particular metric is used in the study.
AccuracyPrecisionRecallF1-ScoreAUCSpecifityConfusion MatrixFeature ImportanceSHAPScoreRefs.
3Oeding [49]
2Karnuta [48]
2Park [44]
2Manzi [33]
2Whiteside [47]
1Ganeshapillai [37]
1Gomez [29]
1Yassen [60]
1Li [57]
1Kato [34]
0Umemura [30]
0Mun [58]
0Simsek [43]
0Huang [56]
0Hoang [26]
0Ma [36]
0Lee [42]
0Sun [55]
0Yu [28]
0Chun [59]
0Koseler [27]
0Sidhu [35]
Table 11. Summary of the metrics used in the studies to evaluate regression performance, techniques used to interpret the prediction results, and the score for each regression study. The checkmark (✓) indicates that the particular metric or step is used in the study.
RMSESSE R 2 Feature ImportanceSHAPScoreRefs.
3Alceo [54]
3Kohn [41]
2Nicholson [46]
2Nicholson [32]
1Swartz [31]
1Bullock [45]
1Healey [22]
0Healey [18]
0Healey [19]
0Healey [20]
0Healey [21]
0Heaton [38]
Disclaimer/Publisher’s Note: The statements, opinions and data contained in all publications are solely those of the individual author(s) and contributor(s) and not of MDPI and/or the editor(s). MDPI and/or the editor(s) disclaim responsibility for any injury to people or property resulting from any ideas, methods, instructions or products referred to in the content.