Article

MLRec: A Machine Learning-Based Recommendation System for High School Students Context of Bangladesh

1
Department of Computer Science and Engineering, Dhaka University of Engineering & Technology (DUET), Gazipur 1707, Bangladesh
2
AI and Big Data Department, Endicott College, Woosong University, Daejeon 34606, Republic of Korea
*
Author to whom correspondence should be addressed.
Information 2025, 16(4), 280; https://doi.org/10.3390/info16040280
Submission received: 13 February 2025 / Revised: 25 March 2025 / Accepted: 27 March 2025 / Published: 30 March 2025
(This article belongs to the Special Issue Recent Advances in Social Media Mining and Analysis)

Abstract

:
Social media and mobile devices, commonly referred to as socimedevices, have become integral to students’ daily lives, influencing both their academic performance and overall well-being. Depending on usage patterns, these technologies can positively or negatively impact students’ education. In recent years, many researchers have introduced several models, including neural networks (NNs), machine learning (ML), and deep learning (DL), to identify the impact on student academic performance using a socimedevice. Here, we propose a comparative model named the MLRec model, where we assess how well different machine learning methods predict the dynamics of student life and provide a recommendation to society, parents, and academic advisors. Here, we have preprocessed our real dataset by various methods, which is collected from 10 schools and has 25 features totaling 275 instances from different districts of Bangladesh. After that, we applied 15 ML algorithms for training and testing. Then, we compared the algorithms using criteria such as accuracy, Mean Squared Error (MSE), Root Mean Squared Error (RMSE), coefficient of determination (R2), Explained Variance (EV), and Tweedie Deviance Score (D2). Subsequently, we selected the Extra Tree Classifier (ETC) algorithm based on its superior performance, achieving an accuracy of 86%, an MSE of 25%, and an EV of 40%. We also used Explainable AI (LIME and SHAP) techniques to visualize the root causes of social networks’ effects on students’ school performance. Our results show that using social media excessively adversely affects academic pursuits.

1. Introduction

Technology’s universality in daily life has entirely changed how individuals interact, share information, and navigate the world. Among the most technologically immersed demographics are high school students, for whom the fusion of social devices has become an integral aspect of their daily routine. Here, we can mention that various social media sites, including WhatsApp, Facebook, Instagram, TikTok, and others, have different effects on people of different ages. As high school students (ages 13 to 18) are considered the future of a nation [1,2], it is essential to examine how the Internet affects their lives.
Numerous studies have been undertaken on social media’s impact on students, and each research study showed different results. While some researchers argued that social media negatively affects students’ performance in school, others demonstrated how it aids users in learning and improving their communication abilities [2,3,4]. The major objectives of youth using social media are outlined in [5], and an effort has been made to determine the amount of time spent by young people on exploring social networking sites. Their research has demonstrated that using social media excessively drives young individuals toward addiction.
To examine social media’s impacts on students, Ali et al. [6] conducted questionnaire-based research. They used simple random selection to pick 380 students from Punjab, Pakistan’s University of Sargodha, who were enrolled in the sample. Moreover, they analyzed the significance of social media in providing learning and job opportunities to students. Barkhuus et al. [7] examined the offline socializing structures that revolve around an online social network, such as Facebook, and explored how these structures might enhance face-to-face social interactions among students. Additionally, this article determined that online social networks are potent for fostering peripheral connections, which have special significance for students.
Social media may serve as a convenient and effective tool for both teachers and students to enhance the teaching and learning process [8]. They analyzed variations in academic performance among students enrolled in small liberal arts institutions, focusing on their engagement with social media platforms. Additionally, they discussed determining how much time students use social media regularly and whether there is an overall shift in use patterns. Furthermore, the authors [9] analyze variations in academic performance among students attending small, liberal arts universities, considering their use of social media. This study distinguishes itself by developing an ML-based model specifically for Bangladeshi high school students, integrating explainable AI (LIME and SHAP) to derive interpretable insights and translating findings into actionable educational recommendations, which is a contribution not addressed in prior research. We present the subsequent contribution:
  • We implemented an MLRec model that focuses on improving generalization and simplifying the discovery of significant academic impact factors in students using social media.
  • We split our study into two separate sections. In the first section, we use fifteen ML models for predictions. In addition, according to the model performance, we have selected the ETC ML model for the subsequent evaluation. The ensuing experiment highlighted the fundamental factors influencing student achievement.
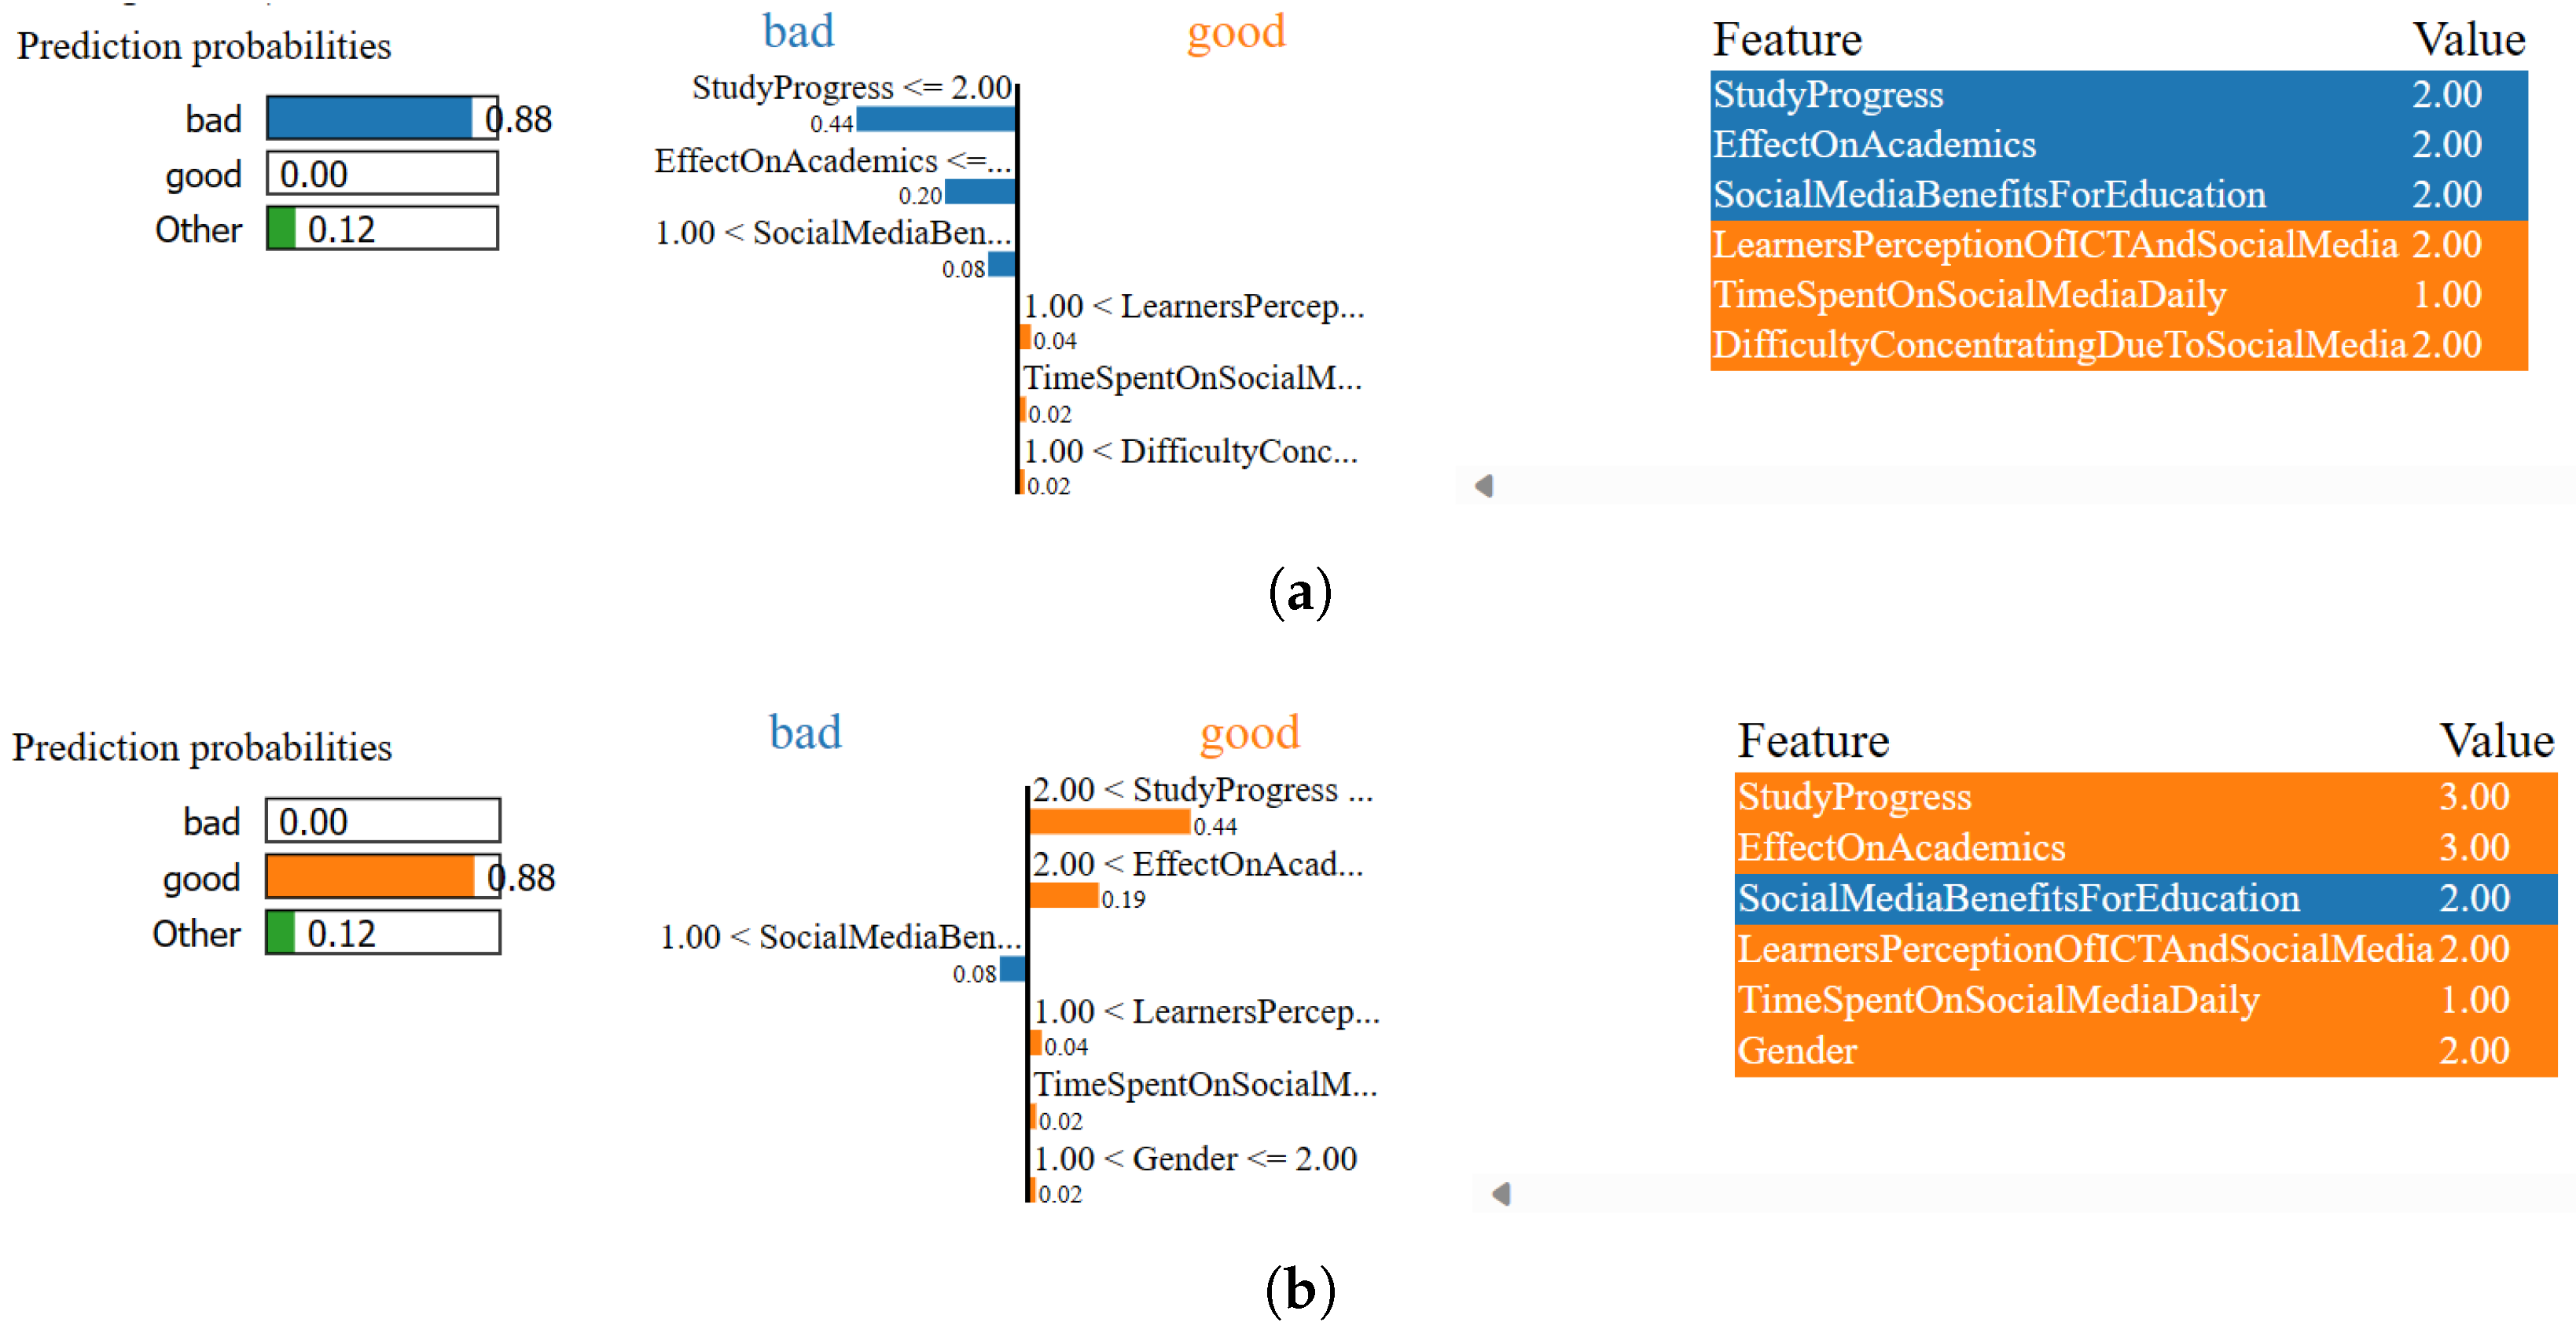
  • LIME is an approach that provides precise estimations of the predictions made by any classifier via a locally interpretable model. This enables the generation of accurate and reliable explanations.
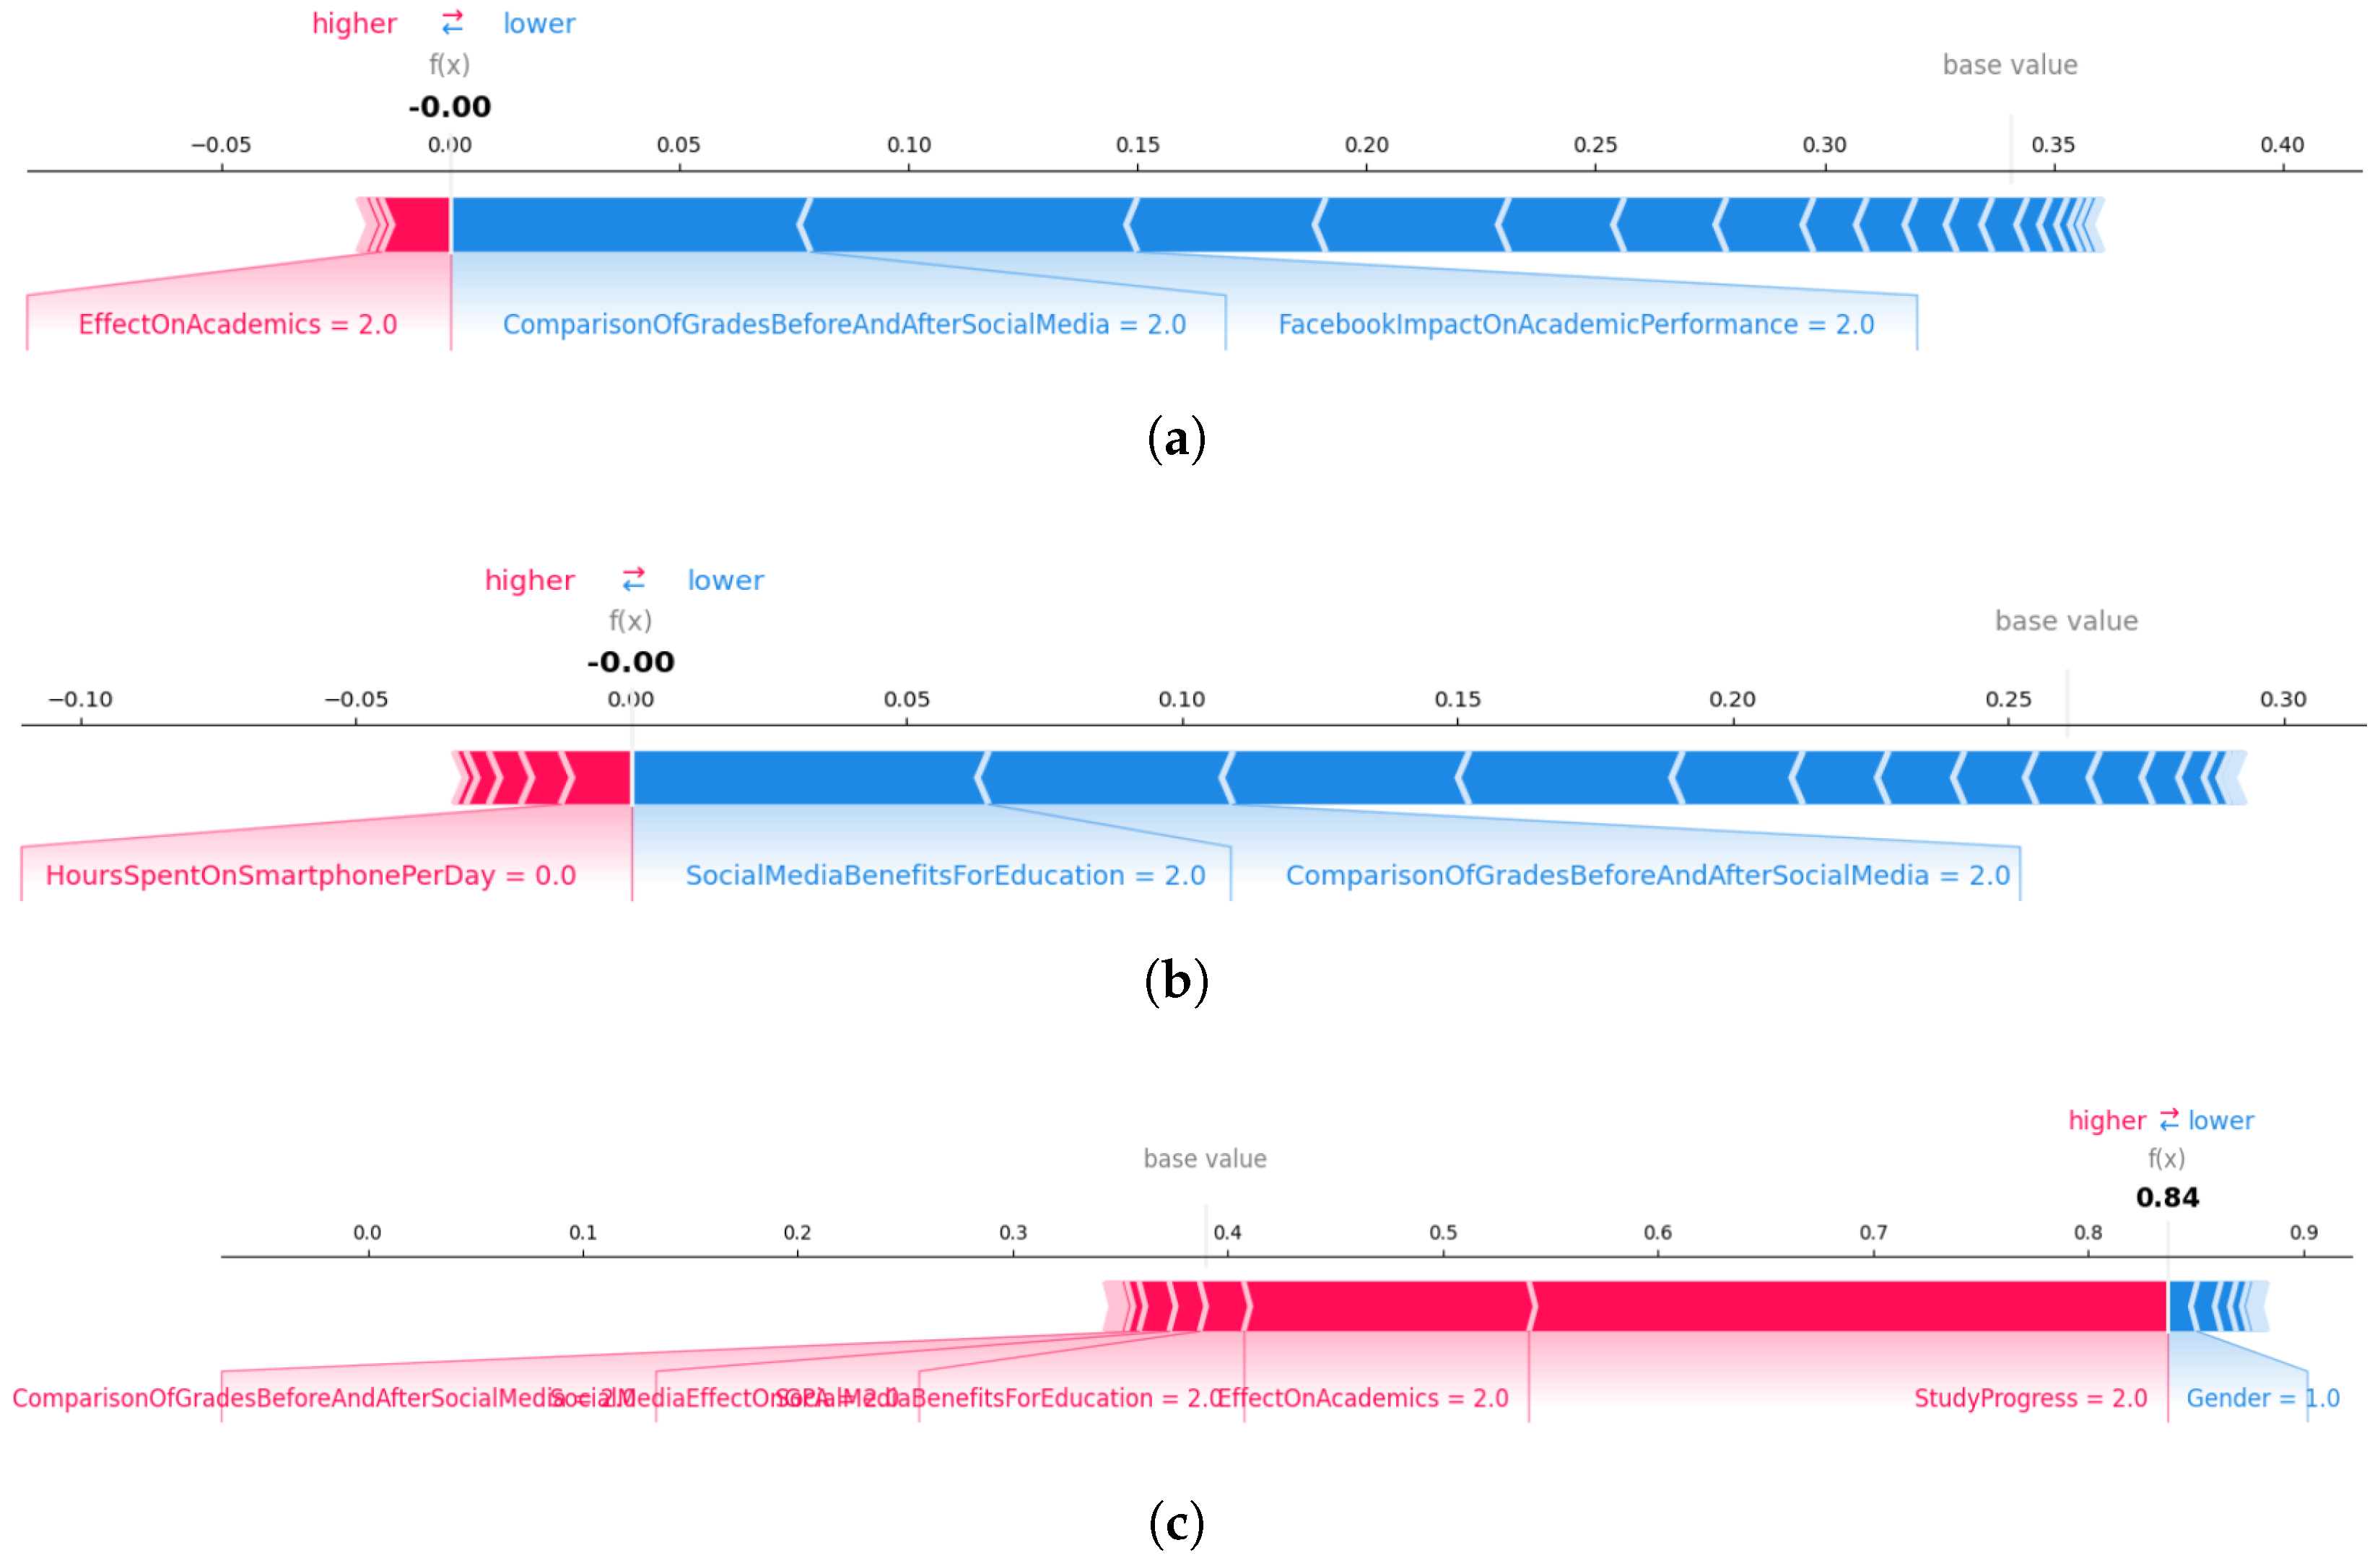
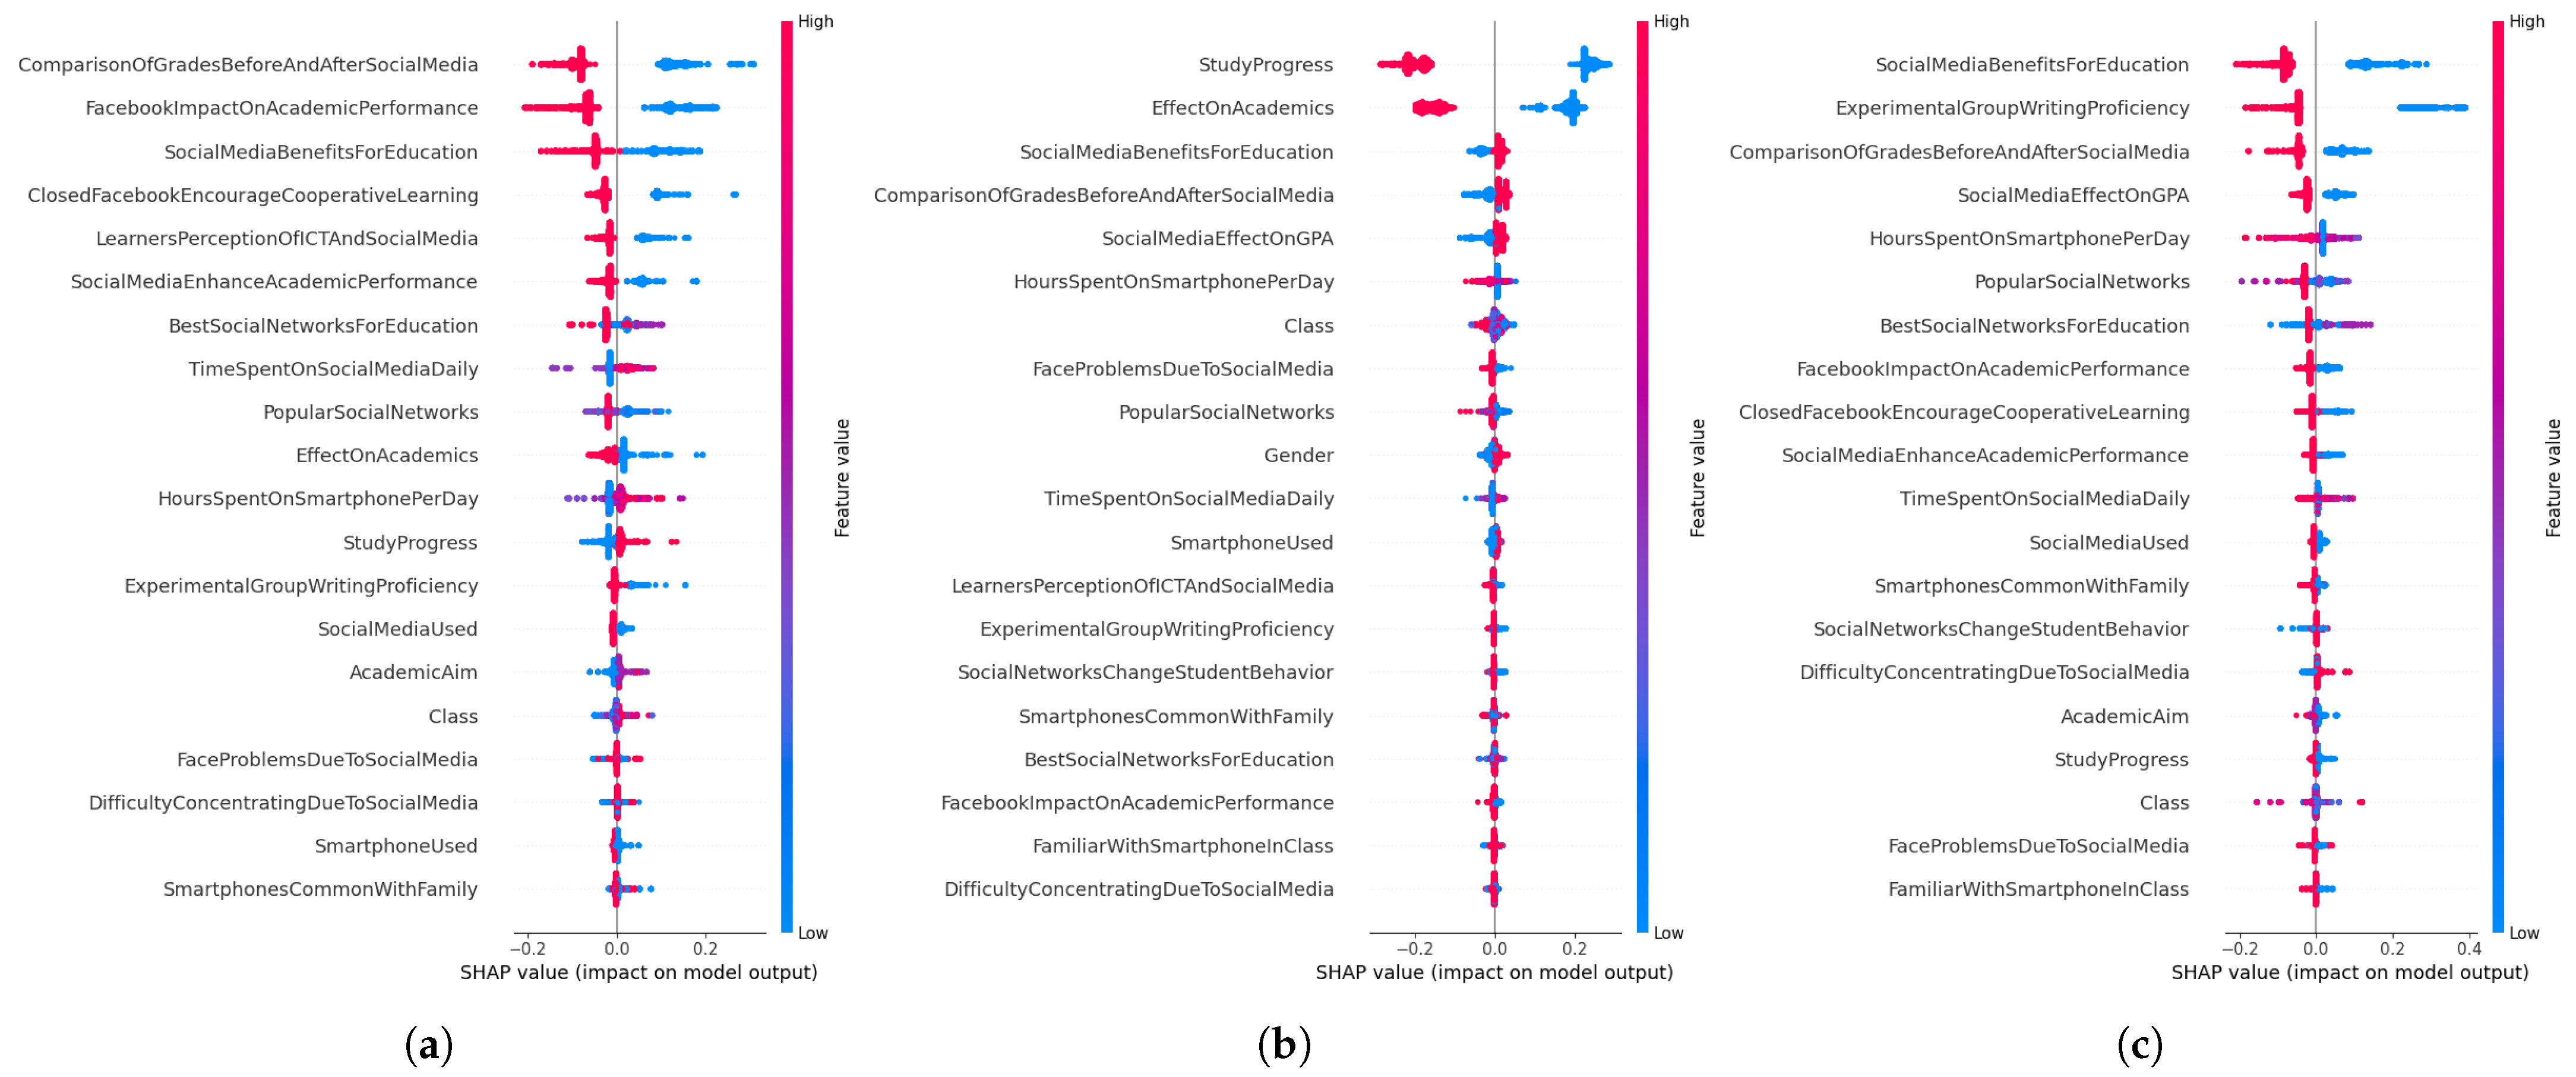
  • We present an approach based on SHAP, which improves the interpretability of ML models and provides a more transparent understanding of the value of features.
  • In conclusion, we have determined that the XAI techniques of LIME and SHAP provide us with a precise comprehension of the underlying factors influencing student performance and provide recommendations to parents, educators, and society. However, when comparing the two, we discovered that LIME yielded superior outcomes compared to SHAP.
We provide our research questions, which are addressed in an analysis section using LIME and SHAP methodologies.
  • RQ1: What is the current level of awareness and utilization of socimedevices among Bangladeshi high school students, and how does it influence their interaction with Explainable AI?
  • RQ2: How does the MLRec model influence the learning outcomes and academic performance of Bangladeshi high school students when integrated into their educational environment?
  • RQ3: What are the social and cultural implications of integrating Explainable AI, specifically MLRec, into the educational experience of Bangladeshi high school students, and how do socimedevices mediate these implications?
  • RQ4: How do privacy and ethical considerations manifest in the implementation of MLRec within the educational context for high school students in Bangladesh, taking into account the use of socimedevices?
The remainder of our proposed system is as follows: Section 2 summarizes and critically evaluates the existing literature relevant to the research question. We explain how the research was planned, including the different statistical and ML methods used, in Section 3 to find out how social media and smart devices affect high school students in Bangladesh, using the right block diagrams. Section 4 goes into detail about the theoretical formulation of all ML algorithms, participants, and material information. Section 5 gives a brief overview of our proposed systems through numbers and includes an evaluation of the outcomes by various metrics of performance. In the last section, we summarized the key findings and their significance as well as provided suggestions for more study.

2. Literature Review

Social media such as Facebook, Instagram, and so on in particular create online communities where individuals may connect with friends and family wherever they may be. Through private messages and images, users may now showcase themselves and share life events with others due to advancements in social media technologies. However, it can help people keep informed about the happenings in their friends’ lives.
The authors in [10] demonstrated that there is a notable increase in teens’ sentiments of jealousy that is correlated with how much they use social media. This growth is particularly pronounced in teenagers whose parents tend to compare them to their peers in a group that is known for its high levels of competitiveness within the group. However, only among teens who belonged to a peer group that stood out for intense intragroup competition did the correlation between the intensity of social media use and social comparison become noticeably stronger. Furthermore, the authors of [11] proposed that it is advisable to refrain from excessive smartphone use and instead promote social consciousness via health initiatives. To minimize the possible hazards associated with mobile phones and smart devices, it is advisable to restrict their use. Various definitions and explanations of social media exist, all of which highlight its growing role and importance. On the other hand, web-based platforms facilitate social communication, enabling users to establish online communities and exchange information. In regard to [12,13], the researchers include facilitating communication between educators and learners, generating instructional resources, and enabling students to exchange materials with their instructors.
In the present day, high school students have transitioned from being passive recipients of knowledge to being active agents in constructing their understanding. Therefore, using social media for learning has increased drastically. Furthermore, it serves as an integral component of a comprehensive educational experience, facilitating the informal aspects of teacher–student interactions as well as promoting self-direction and autonomy among learners [14,15]. Social media provides a conducive learning environment for learners to effectively and consistently manage their learning. Also, learners have a flexible and autonomous chance to communicate with their peers and oversee their learning activities [15,16]. Table 1 additionally indicates that most scientists in Bangladesh assert that COVID-19 adversely affected educational systems and institutions.
Jose et al. introduced that social media distracts students by consuming excessive time with 84.5% spending over four hours daily on it [27]. This reduces focus on academic tasks, as 39.4% of students acknowledge its negative impact on assignment completion, particularly among first-year students. On the other hand, Taimoor et al. declare that social media distracts students from academic responsibilities by increasing academic distraction through engagement and romantic relationships [28]. Emotional attachment mediates this distraction, as students with higher emotional ties may struggle to focus on their studies, impacting their academic performance. In [29], the authors introduced how social media can distract students through time displacement, leading to procrastination and decreased focus on studies. It may also cause sleep deprivation and mental health issues, such as anxiety from cyberbullying or social pressure, further hindering academic responsibilities. Excessive social media use leads to distractions, reduced focus, and decreased productivity, resulting in poorer academic performance and diminished engagement with educational responsibilities [30].
Recent studies have investigated intelligent systems to improve student performance across various educational contexts. Hemal et al. [31] examined the impact of internet usage on academic performance in Bangladesh, utilizing machine learning methods to forecast outcomes and discern behavioral patterns, including the adverse effects of excessive social media engagement. Tariq and Habib [32] proposed a reinforcement learning-based recommendation system designed for Outcome-Based Education (OBE) to enhance students’ Course Learning Outcomes (CLOs) through the suggestion of personalized online resources. Both works underscore the importance of data-driven educational tools in mitigating performance disparities and facilitating learner-centered approaches.
Social media distracts students by causing a loss of eagerness, behavioral interruptions, and barriers to self-improvement [33,34]. Engaging notifications and personal interests lead to neglecting academic tasks, ultimately hindering productivity and the ability to focus on learning during virtual classes. Additionally, late-night browsing can cause sleep deprivation, impair cognitive functioning, and negatively impact academic performance [35]. In the same way, authors [36] state that social media can distract students by providing entertainment, fostering procrastination, and interrupting study sessions, ultimately affecting their focus and academic performance. Using social media impacts academic performance. The authors declare that in [37], spending more time on social media in 24 h negatively affects the study timings, thus affecting the study outcome and academic results. Similarly, students of higher institutions widely use social media, and participants support the idea that social media contributes a significant quota to the development of their academic life [38].
In [39], the authors declare that social media enhances mental health and mediates the link between social media and the academic performance of university students in Bangladesh; they also found that it has practical ramifications. In the same way, the authors [40] compare the relationship between social media and students’ academic performance in Pakistan. Their results suggest that social media has an inverse relationship with academic performance. They also find that if social media is used positively, it can help students and youth gain knowledge that can be used to enhance their academic performance. Haviv et al. [41] introduced principal component analysis (PCA) to infer student engagement patterns in self-directed learning systems in e-learning environments. They categorize student cohorts based on the evolution of their trajectories over time (e.g., consistently increasing, consistently decreasing, and stable). Each cohort demonstrated unique behavioral dynamics and significantly varied users’ engagement duration within the e-learning system.
For the virtual education environments in [42], the authors showed that a student’s time on knowledge level is unrelated to belonging to the high-knowledge group. On the other hand, in educational data mining for scholarship prediction, the authors [43] showed how decision tree algorithms, specifically ID3 and J48, can be applied to student academic and extracurricular data to predict scholarship eligibility. By implementing these algorithms into the Scholarship Calculator system, the research demonstrates that ID3, despite producing an enormous tree, yields more accurate predictions due to its comprehensive rule generation. Burman et al. [44] present a data mining approach that utilizes psychological features and support vector machine classifiers to categorize students into high, average, and low academic performers. The study finds that the radial basis function kernel outperforms the linear kernel, offering more accurate predictions to aid institutions and students in improving educational outcomes.
Several researchers have presented findings indicating a detrimental impact of social networking sites on student performance. Wang et al. [45] suggest that despite the common usage and extensive time spent by college students on social media platforms, there exists a deleterious element associated with their engagement. The authors of the study [46] focused on K–12 education and examined many drawbacks associated with social media. The proliferation of social networking platforms has given rise to concerns ranging from addiction and excessive time consumption to cyberbullying and privacy breaches. Additionally, the unchecked dissemination of disinformation on these platforms poses a threat to mental well-being and societal harmony. The study conducted by Rostaminezhad et al. [47] revealed an unfavorable correlation between social networking and students’ academic achievement. This aligns with previous research that has also shown the adverse how social networking affects learning. The key reasons for this adverse impact are time wastage and insufficient allocation of time for learning. In Table 2, we discussed the contributions and constraints of various research found in the literature.
This study’s main goal is to increase the precision of literature studies with a particular focus on investigating the impact of socimedevices on teenage and high school students in Bangladesh. Researchers in this field are deeply committed to identifying the problem definition within this domain. Their central concerns revolve around the development of methodologies, tools, and approaches that can efficiently and accurately pinpoint the root causes associated with their use. The overarching goal of this research endeavor is to provide valuable insights to society regarding the utilization of socimedevices among teenagers. In doing so, it aims to reduce the excessive use of it for entertainment purposes and, conversely, promote its effective utilization for educational and learning purposes. By addressing the challenges associated with the use of socimedevices among teenagers, this research intends to contribute to the betterment of society. The research methodology follows a systematic approach. Initially, we subjected our datasets to preprocessing techniques, including the SMOTE technique and LE. This preprocessing was carried out after a comprehensive examination of the processed data using various machine learning algorithms. Subsequently, we assessed the effectiveness of these algorithms for machine learning depending on several simulation criteria. The best-performing model was then utilized in XAI to identify specific key features related to its impact. In this phase, we leveraged advanced XAI techniques.

3. Proposed Methodology

In Bangladesh, the COVID-19 pandemic (2020–2022) accelerated students’ Internet usage, particularly among high school students, due to the shift to online classes. For this reason, many students have engaged in online gaming as well as social media platforms like Free Fire, PUBG, TikTok, Facebook, Instagram, YouTube, and many more. Simultaneously, they have leveraged smart devices for skill development. Evaluating the combined impact of these factors is crucial for understanding the evolution of Bangladeshi high school students. This study employs an advanced ML methodology by using XAI to identify the primary issues behind the usage of smart devices among teenage and high school students. In Figure 1, we illustrate the proposed methodology to identify the top K features influencing the effects of social networking devices on high school students within the framework of Bangladesh.
We first collected datasets from a survey on the “Impact of Social Media in the Context of Bangladeshi High School Students”. Thereafter, we performed data preprocessing using SMOTTech and LE methods. We divided our data into two separate groups. Firstly, 20% of the datasets are for testing, and the other 80% are for training data. We are working on fifteen ML techniques for analysis. As a result, when evaluating our models, we took into account a wide range of measures, including accuracy, MSE, RMSE, R2, EV, and D2. We picked the most ideal model and determined that ETC was the best model after carefully weighing every alternative. The influence of socimedevices is then examined using LIME and SHAP methodologies. We then compare the most appropriate techniques with each other. Finally, we select the top k attributes for the influence of the socimedevice based on technique accuracy with LIME offering the highest accuracy. To provide a structured overview of this methodology, we have included Algorithm 1, which outlines the step-by-step process of data preprocessing, model training, evaluation, and recommendation generation in the MLRec system.
Algorithm 1 MLRec—Machine Learning-Based Recommendation Workflow
  1:
Input: Raw dataset (student responses)
  2:
Output: Optimized recommendation system
  3:
Step 1: Load dataset from 10 schools
  4:
Step 2: Apply preprocessing:
  5:
     (a) Handle missing values
  6:
     (b) Convert categorical variables using label encoding
  7:
     (c) Balance data using SMOTE
  8:
Step 3: Split dataset into training and test sets
  9:
Step 4: Train 15 ML models and evaluate performance
10:
Step 5: Select the best-performing model (ETC) based on
11:
     Accuracy, MSE, RMSE, R2, EV, and D2
12:
Step 6: Apply Explainable AI (LIME and SHAP) for interpretability
13:
Step 7: Generate recommendations for students, parents, and academic advisors
14:
Step 8: Output final MLRec results

3.1. Dataset

We gathered our dataset from 10 schools across 5 districts in Bangladesh and uploaded it to IEEEDataPort [54]. This dataset highlights the pandemic-induced increase in high school students’ Internet engagement, social media usage, and skill development. We gathered a total of 275 pieces of data, spanning 25 questions, in post-consent from authorities using defined questionnaires. In addition, our dataset includes classes 6 to 10 and diverse age groups and sexes, and the main goal was to identify a holistic picture of societal impact. For accuracy and trenchancy, we have used Google Forms and taken student interviews at schools, which have garnered comprehensive insights. Notably, the dataset maintains a balanced representation with a 55:45 male-to-female ratio.

3.1.1. Participant Distribution and Categories

Table 3 provides a detailed breakdown, showcasing participant counts categorized by gender and academic year. By encompassing a broad spectrum of participants and districts, this study embraces a holistic perspective on the evolving dynamics of digital interaction in Bangladeshi high schools. The extensive dataset enhances the likelihood of uncovering valuable insights into the nuanced impact of digital engagement within this diverse educational context.

3.1.2. Features Description

This study takes into account one target feature along with an overall total of 25 predictive features. Table 4 displays feature titles with the possible values for each feature as well as feature groups with feature numbers. The questions, which are divided into five groups, yield the input features. The first group is entitled Personal Information (PI), and it consists of five features that request participants answer very personal questions about things like name, gender, and so on. The second group is referred to as Digital Connectivity Metrics (DCM), and it consists of four features that ask participants how using smartphones has affected everyday interactions in the family and the classroom.
The third group is identified as the Unveiling Social Media’s Educational Impact Group (USMEI), which uses twelve features to illustrate the educational value of social media. The fourth category, “examining online distractions in education” (EODE), shows how easily accessible websites and games affect their ability to concentrate during study sessions as well as how many hours a day they spend playing games or engaging in other forms of entertainment—both online and offline. We would like to know what the students in the experimental group think about using ICT and social media to improve writing versus the control group’s traditional teaching method. This is the last group analyzing non-traditional methods for the writing proficiency group (ANMWP), which consists of the last two features. Every attribute relates to a distinct aspect of the student’s socimedevice usage, and each aspect has some influence over the student’s everyday activities and moods. A weight (W) among 0 (no), 1 (yes), 2 (good), 3 (average), and 4 (bad) is assigned to each attribute.

3.2. Prepossessing

We used SMOTTech and LE methods throughout this study to preprocess our datasets and normalize and balance the data. The SMOTTech regular technique was presented by Chawla et al. in their publication [55]. This method entails creating artificial samples of the underrepresented class uniformly spread around the initial advantageous cases. SMOTTech first selects the data points that are most similar to those in the smaller group. This research then introduces a new point entirely independent of the earlier points. The marginalized group comprises numerical values represented by novel dots. It will continue to generate new data until the data imbalance issue is resolved.
Equation (1) represents the sample of our dataset, denoted as fnew, where fi represents the attribute vector for the sample from the smaller class that is being studied, and fnear is one of the K nearest neighbors of fi.
f new = f i + ( f new f near ) × R
Let i be an integer that ranges from 1 to n, where n represents the total number of data points. Let R denote a random variable uniformly distributed between 0 and 1. Additionally, we utilized the label encoding (LE) method to transform categorical data into numeric forms. The approach allocates a distinct numerical identifier to every category or label inside a category-based variable [56]. In Table 4, we have presented the categorical variables in our dataset, such as Gender, Study in Class, Study Progress, and Familiar With Smartphone In Class. Additionally, Table 3 illustrates the participant distribution and categories, indicating that our dataset contains class imbalance issues, particularly regarding student academic years and gender distribution.

3.3. ML Models

3.3.1. Linear Regression (LR) [57]

Linear Regression refers to a particular modeling situation when there is only one independent variable. LR differentiates between dependent variables on each other and independent variables on each other.

3.3.2. Ridge Regression (RR)

Ridge Regression, a regularization technique for LR, introduces a regularization concept to the least squares objective, preventing overfitting. The algorithm minimizes the SSR while adding a penalty term proportional to the square of the coefficients’ magnitudes. This penalty, which the hyperparameter alpha controls, promotes lower coefficient values to address multicollinearity. It is particularly useful when predictors are highly correlated, enhancing the stability of the model. The optimization problem is solved using linear algebra or iterative methods, providing a robust solution to LR in the presence of collinearity.

3.3.3. Random Forest Regression (RFR)

Random Forest Regression is an ML algorithm that combines several decision trees to make more accurate predictions. The way it works is by making a “forest” of trees with each one trained on a different set of data and features. Then, the final prediction is made by taking the average of all the trees’ predictions. This method makes the model more stable and less likely to overfit.

3.3.4. Decision Tree Classifier (DTC) and Decision Tree Regression (DTR) [58]

The DTC approach involves partitioning the predictor variable field into separate subsets according to the similarity of their respective target variables. The structure formed is akin to a tree with the core nodes denoting features and leaf nodes indicating class labels. Its popularity stems from its straightforwardness and capacity to process both numerical and categorical data. Conversely, a random variable is used to identify the most effective way to divide the data in each individual node that makes up a randomized decision tree.
In addition, the DTR algorithm utilizes a tree-like model to predict continuous values. It recursively splits the dataset based on feature conditions, optimizing for the best split at each node to minimize variance. The terminal nodes represent predicted values. This algorithm is adept at capturing non-linear relationships and is widely employed in regression tasks, demonstrating robust performance in diverse domains.

3.3.5. Support Vector Machine (SVM) and Support Vector Classifier (SVC) [59]

SVM operates by identifying the ideal hyperplane in a higher-dimensional space that best represents the relationship between input data and their continuous output values. Its primary objective is twofold: to minimize the disparity between predicted and actual values and to maximize the margin, which refers to the gap between the nearest data points and this hyperplane.
For linear SVM, given a set of input vectors x i and corresponding binary labels y i where y i { 1 , 1 } for a binary classification problem, the equation for the decision function of a linear SVM is
f ( x ) = sign ( w · x + b )
where w represents the weight vector orthogonal to the hyperplane, x denotes the input feature vector, and b refers to the bias term.
On the other hand, SVC is a robust machine learning algorithm designed for binary and multiclass classification jobs. It operates by finding the optimal hyperplane that maximally separates different classes in a high-dimensional feature space. Through kernel functions, it does a great job of handling complex, non-linear relationships, which makes it easy to classify data even when it cannot be separated in a straight line.

3.3.6. Naive Bayes (NB)

The Naive Bayes classifier is a kind of supervised ML algorithm often used for tasks involving classification, such as text categorization. Furthermore, it has several benefits, such as a simple approach and exceptional dependability.

3.3.7. Adaptive Boosting (AdaBoost) [60]

AdaBoost (Adaptive Boosting) is an ML ensemble method that combines weak classifiers to produce a stronger one. It iteratively trains the classifiers, giving more weight to misclassified data points in each round. Subsequent classifiers concentrate on difficult cases, gradually increasing overall performance. AdaBoost increases the influence of the most accurate classifiers by adjusting their weights. It is widely used in many fields because of its simplicity and effectiveness in dealing with complex classification problems.

3.3.8. Gradient Boosting Classifier (GBC) [61] and Gradient Boosting Regression (GBR) [62]

The Gradient Boosting Classifier, often known as GBC, is an ensemble ML technique that is particularly successful in solving regression and classification issues. The algorithm employs the boosting technique, which combines many weak learners to create a powerful learner. The execution of this method may quickly lead to overfitting on a training dataset. Regularization approaches that perform different components of the computation might provide a potential benefit. Ultimately, it improves the way computation is shown by minimizing the problem of overfitting.
Conversely, a GBR is a composite model of many tree models arranged sequentially. Each successive model in the series obtains knowledge from the errors made by the preceding model. The algorithm employs the technique of “boosting” to produce predictions by combining numerous weak prediction models. Finally, it generates decision trees to produce a model that is both robust and precise. For a specific input x, the function f n ( x ) is calculated as the cumulative result of n trees:
f n x = i n γ i h i x
In this context, hi refers to an average learner who demonstrates individual performance, whereas γ i acts as a coefficient that reports on the influence of each tree within the considered collective structure. The GBR algorithm utilizes the gradient descent loss function to lessen inaccuracies by repeatedly refining the previous estimate with the latest data.

3.3.9. Extreme Gradient Boosting (XGBoost) [63]

XGBoost is an implementation of gradient boost machine (GBM), which is a widely used approach in supervised learning. This methodology may be used for both regression and classification events. Researchers use XGBoost because of its exceptional ability to perform high-speed computations using out-of-core techniques. It is very efficient and may be implemented in several distribution systems. Moreover, the XGBoost archives exhibit superior speed compared to existing gradient-boosting libraries, thereby providing a significant benefit. XGBoost, a system, exhibits resilience and adaptability, making it appropriate for many scenarios, and it is extensively used in research contexts.

3.3.10. Extra Tree Classifier (ETC) [64]

Extra Trees Classifier (ETC) is an ensemble learning method that generates a large number of DTs and aggregates their predictions. What separates ETC is its randomness in feature selection and threshold splitting, which makes it computationally efficient. Unlike RF, ETC does not bootstrap samples. Instead, it applies the entire dataset to each tree, potentially reducing variance while increasing bias. This randomness helps to prevent overfitting and makes ETC robust to noisy data. It is especially useful for multidimensional datasets. However, interpretability may be sacrificed due to inherent randomness.

3.3.11. K-Nearest Neighbors (KNN) [65]

K-Nearest Neighbors (KNN) is a straightforward but effective supervised learning algorithm used for classification and regression tasks. It works by determining the ‘k’ closest data points in the training set to a given input data point and assigning a label or value based on the most common label (for classification) or average value (for regression) among its neighbors. KNN is simple to understand and implement, but its performance can vary depending on the distance metric and the value of ‘k’.

3.3.12. Isotonic Regression (IR)

IR is a non-parametric optimization algorithm used for fitting a monotonic function to noisy data. It ensures a non-decreasing relationship between input and output variables. By minimizing the sum of squared differences between predicted and observed values, it offers a robust approach to preserving the inherent order of data points. This method finds applications in various fields, including statistics, ML, and bioinformatics, providing a valuable tool for modeling monotonic trends in datasets with noise.

3.3.13. Gaussian Naive Bayes (GNB)

The GNB, a probabilistic classification method, assumes that features are normally distributed within each class. Leveraging Bayes’ theorem, it calculates the likelihood of a class given observed features. Despite its simplicity and the naive assumption of feature independence, it often performs well in practice, particularly with continuous data.

3.3.14. Multinomial Naive Bayes (MNB)

The MNB algorithm is a probabilistic classification method widely used in natural language processing. It assumes feature independence and models the likelihood of multiple discrete features. Suited for text classification tasks, it calculates conditional probabilities of word occurrences in each class, making it efficient for large datasets. Despite its simplicity, it often achieves competitive performance, especially in document classification and spam-filtering applications.

4. Experiment Result and Analysis

Throughout the experimental results analysis, diverse evaluation techniques, including MAE, RMSE, R2 score, EV, D2 score, and accuracy, were employed. Firstly, we focus on the criteria utilized for performance measurement, laying the groundwork for the subsequent assessment of ML algorithms. After that, we are applied to scrutinize the ML algorithms, enabling a comprehensive evaluation based on multiple metrics. The goal is to identify the most optimal algorithm by discerning the strengths and weaknesses of each algorithm in relation to the established criteria.

4.1. Performance Metrics

4.1.1. Mean Absolute Error (MAE)

The Mean Absolute Error (MAE) is a commonly used metric to evaluate predictive models. It quantifies the average magnitude of the errors in forecasts relative to the actual outcomes. The term MAE is defined as follows:
M A E = 1 n i = 1 n y i y ^ i
where i denotes the actual value ( y i ), the forecasted value ( y ^ i ), and the count of observations (n).

4.1.2. Root Mean Square Error (RMSE)

RMSE [66] serves as a measure in ML to calculate the average discrepancy between the actual values and the predictions. The process involves squaring the differences, calculating the mean, and subsequently taking the square root. This results in a singular measure that quantifies the accuracy of the model’s predictions. It is widely used because of its simplicity and effectiveness in assessing model performance. The representation is as follows:
R M S E = 1 n i = 1 n y i y ^ i 2

4.1.3. Explained Variance (EV)

As measured by statistics, Explained Variance (EV) indicates what percentage of the variance in the dependent variable can be anticipated based on the independent variables. It evaluates the extent to which the model incorporates the differences in the data. Assigning the proportion of variance that the model explains in relation to the total variance, EV is critical when assessing the efficacy of regression models. A higher EV signifies a better fit between the model and the data, indicating the model’s effectiveness in capturing underlying patterns and relationships. The R2 statistic is often used to quantify the proportion of variance in a dataset that is accounted for by a regression model, as outlined in [67].
EV ( y i , y ^ i ) = 1 Var ( y i y ^ i ) / Var ( y i )
The expressions Var ( y i y ^ i ) and Var ( y i ) denote the variances of the errors in prediction and the actual values, respectively. A high EV value, which is nearly 1.0, is indicative of a model that is satisfactory in terms of fit and reliability.

4.1.4. Coefficient of Determination Score ( R 2 )

The R 2 statistic is utilized to quantify the extent to which the independent variables account for the variability observed in the dependent variable within a regression model. The value is between the range of zero and one with one indicating a comprehensive explanation of the variation and zero indicating no explanation of any variance.
R 2 = S S R S S T = y ^ i y ¯ 2 / y i y ¯ 2
where y ¯ denotes the average of the real value. The symbol SSR quantifies how much level to which the observed values differ from the predicted values. The SST is determined by adding the mean square deviations between the predicted and observed values. Coefficient R 2 is often used to measure the level of suitability in linear regression models, but it can also be used for other types of models. The metric quantifies the degree to which a model accurately represents the data. An elevated R 2 value indicates a more strong association between the predicted model and the actual observations, while a reduced value indicates a less substantial correlation.

4.1.5. Tweedie Deviance Score ( D 2 )

The D 2 score is a metric used in ML to evaluate clustering performance. It measures the dispersion of data points within clusters relative to their centroids. A lower D 2 score indicates tighter clustering, suggesting better separation between clusters. This metric helps assess the compactness and separability of clusters, which is crucial for cluster analysis tasks.

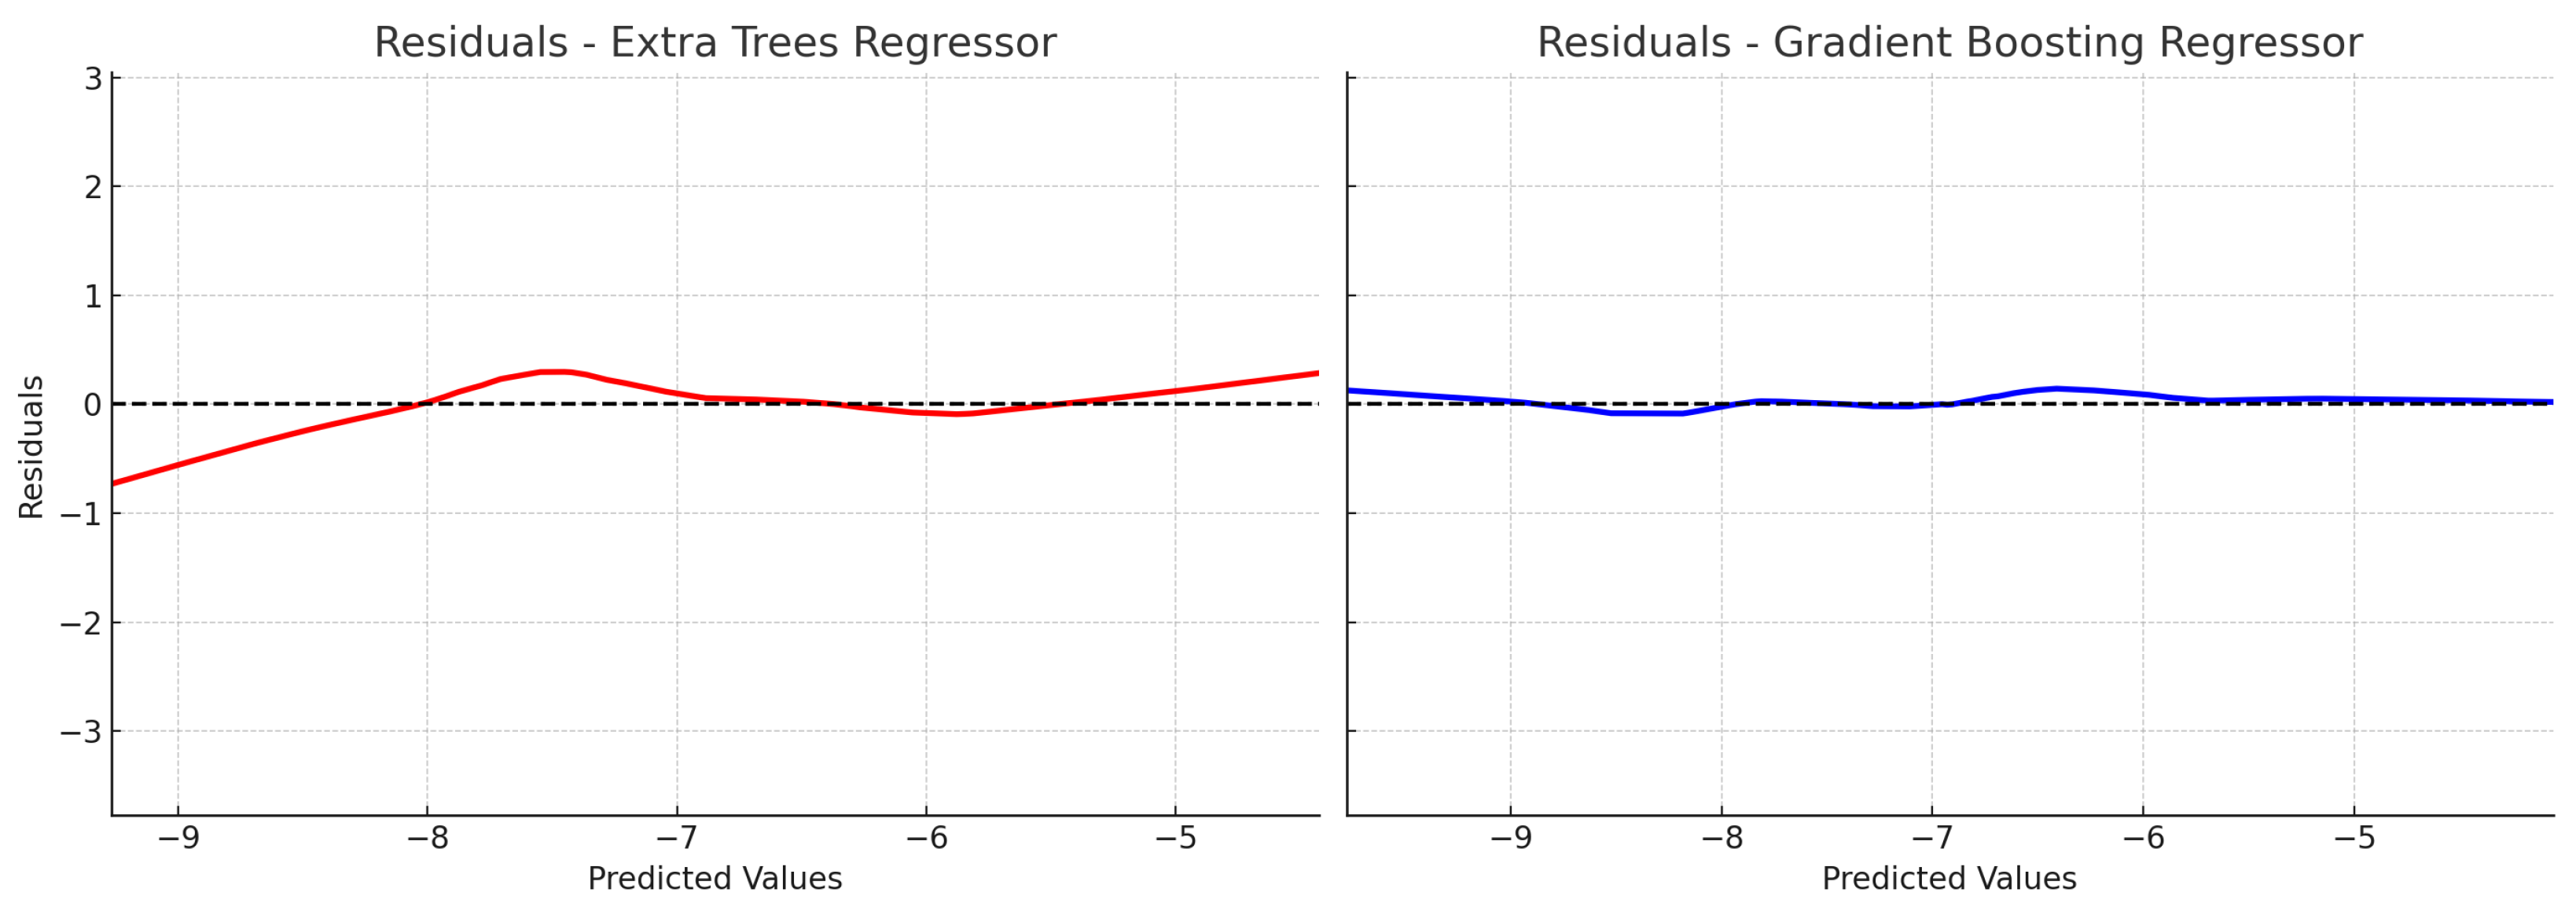
4.2. Performance Analysis

We implemented a comprehensive analysis by using the Python 3.13.2. code on each dataset individually, utilizing a total of fifteen machine learning techniques. We have presented the results in Table 5, where we found that GBC and ETC models exhibit the highest accuracy and MSE values of the dataset. Nevertheless, GNB and ABoostC exhibited satisfactory performance. The table indicated that LR, DTR, RR, RFR, KNN, and SVR had the most substantial Mean Squared Error. Nonetheless, the RMSE and coefficient of determination R2 score are somewhat increased. Here, we can see the highest R2 value, which is 82.50% for the multinomial NB. Based on the concepts of the EV and D2 score, the obtained score falls into the moderate category. Finally, the ETC model exhibits exceptional performance based on a thorough review of many factors. To further support this selection, residual (Figure 2) and Q-Q plot (Figure 3) analyses demonstrate that ETC produces more stable, normally distributed errors compared to competing models, confirming its suitability for our dataset.

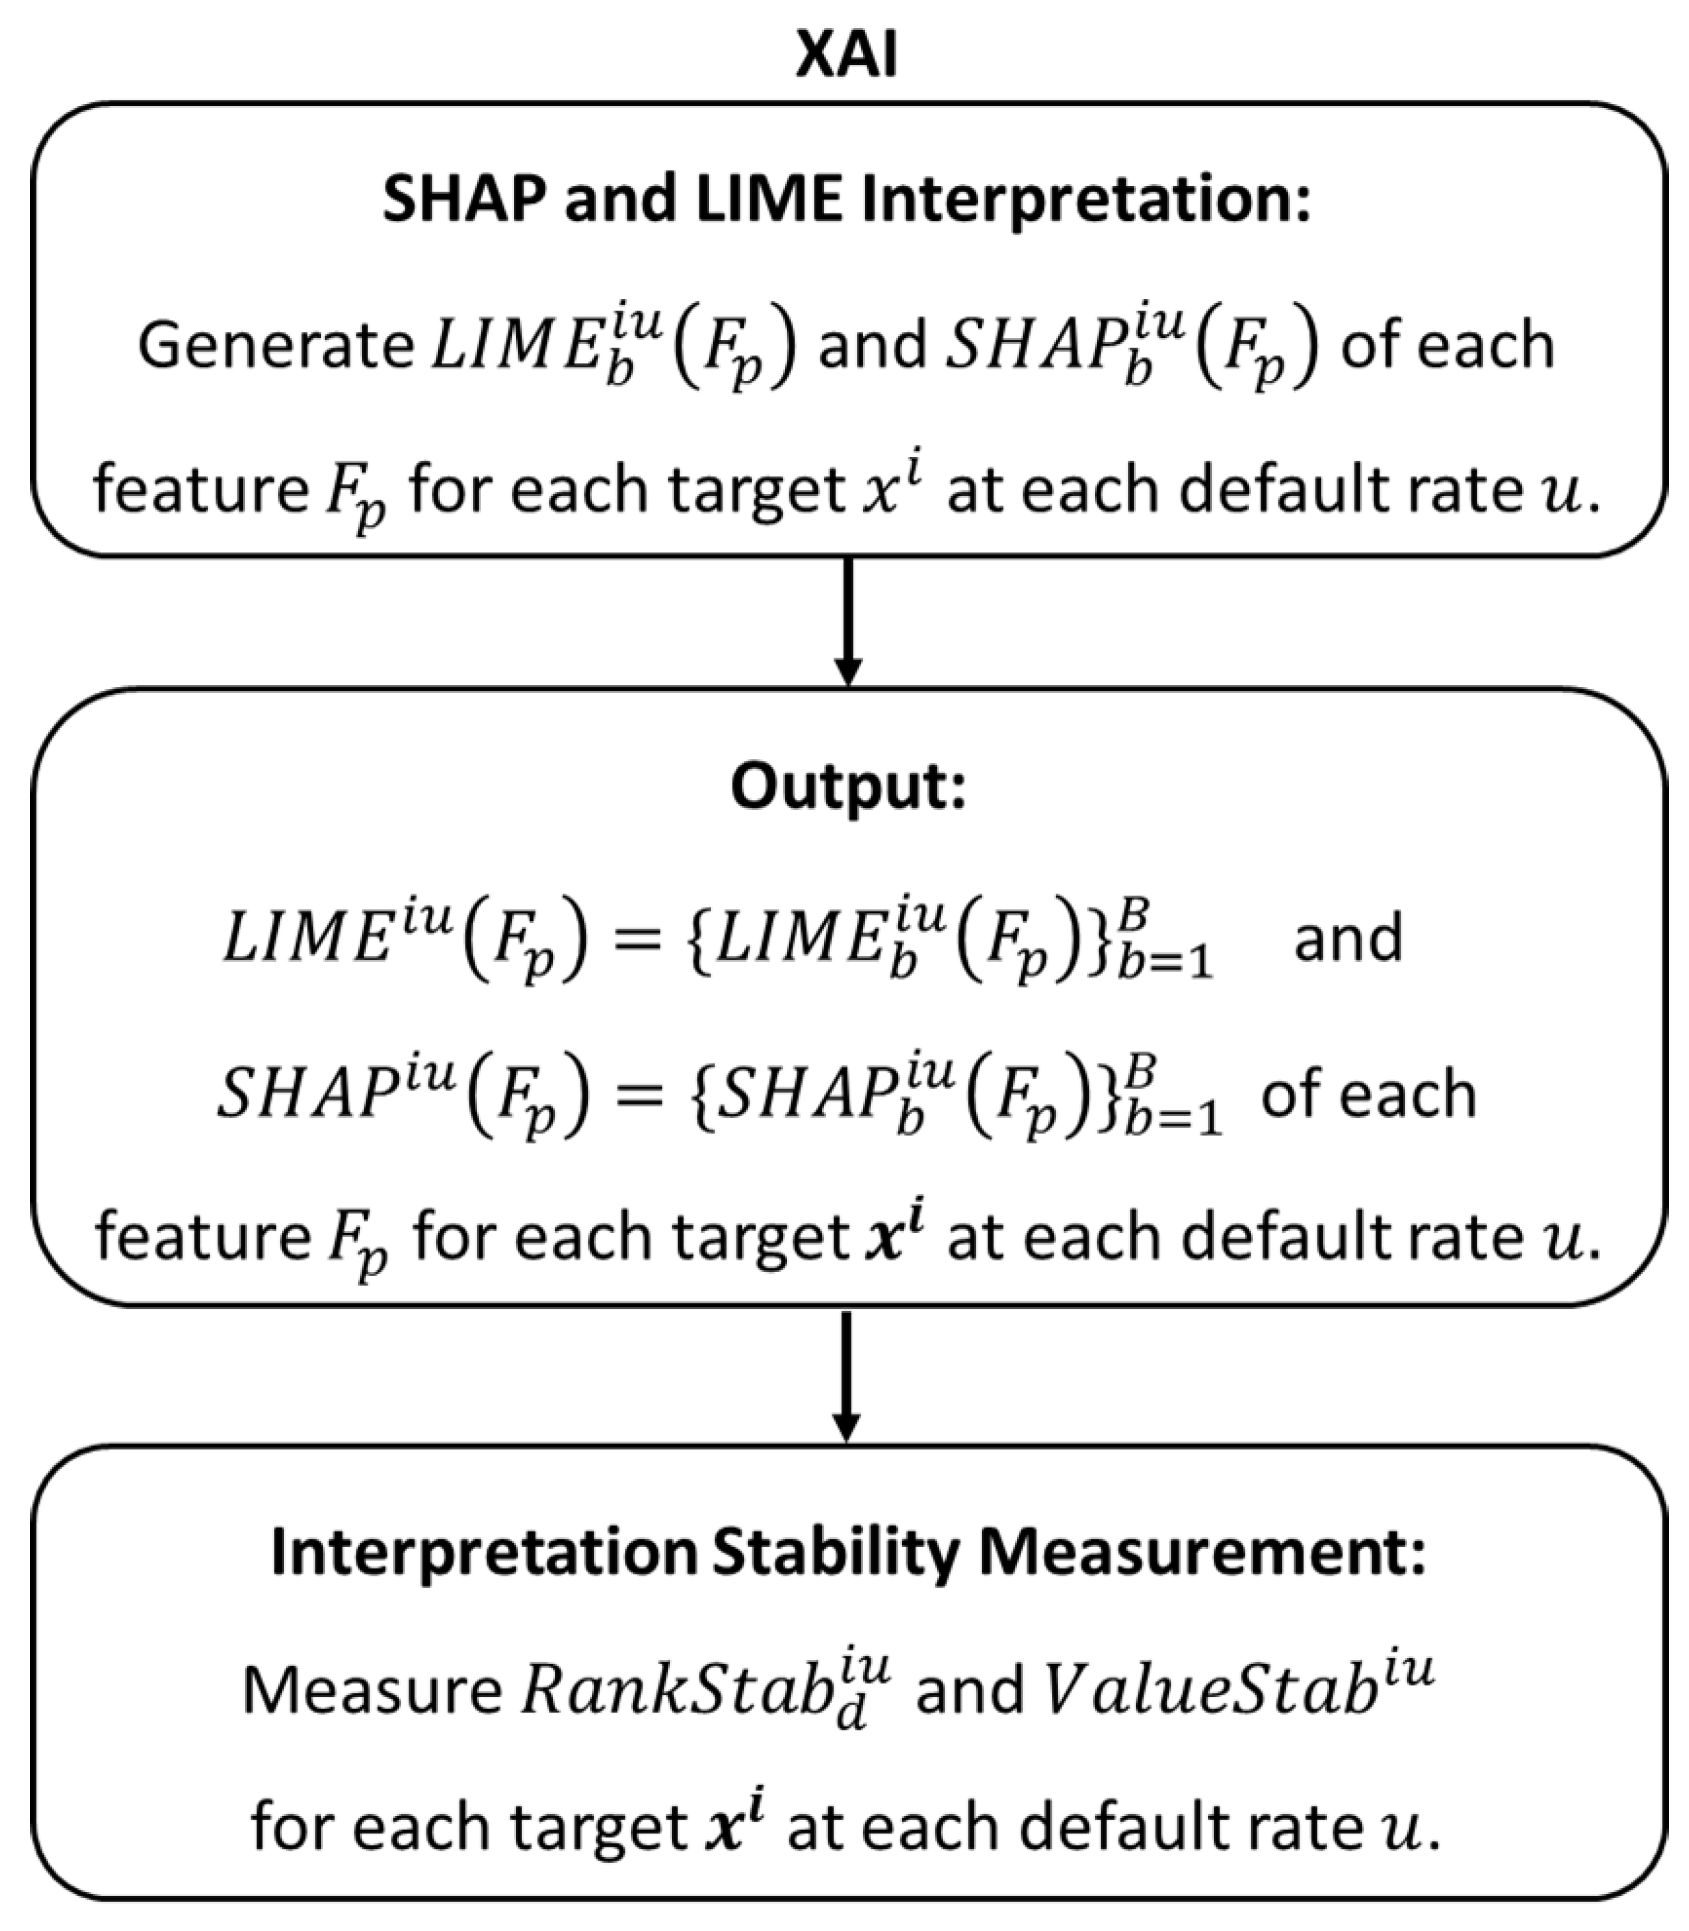
4.3. Explainable Artificial Intelligence (XAI)

The technique XAI seeks to enhance the audience’s understanding of the reasoning processes used by AI-driven systems, thus improving their performance in implementing these systems [68]. It can function as a tangible manifestation of the social hierarchy of understanding. Although XAI integration is not mandatory, it can significantly enhance user interaction with a specific service. XAI offers clarity and understanding of the judgment processes and procedures of the AI system’s foundational mechanisms. XAI aims to provide a complete explanation of past, current, and future actions together with the underlying knowledge that supports these activities. Moreover, it may facilitate the comprehension of a model’s operational characteristics and still provide confidence in the model’s reliability. Numerous recognized methodologies in the area of XAI consist of SHAP, LIME, and many more. The present paper represents an extensive examination of the LIME and SHAP techniques.
To enhance clarity and illustrate the interpretability workflow, we added Figure 4, which visually represents how we applied the XAI techniques, LIME and SHAP, in our analysis [69]. In particular, LIME creates local surrogate models around each student’s predictions to determine how categorical factors (like Gender, SocialMediaEffectOnGPA, and AcademicAim) affect those predictions. In contrast, SHAP calculates Shapley values for these features, quantifying their contributions to predictions across all instances. We explicitly compared both methods and found that SHAP provides more stable and globally consistent explanations across categorical variables. However, LIME offers more straightforward, intuitive explanations suitable for individual-level interpretation.

4.3.1. Shapley Additive Explanations (SHAP)

SHAP [70] is a method in XAI that provides insights into how the predictions of machine learning models are influenced by individual features. It assigns each feature an importance score based on its contribution to the model’s output, allowing users to understand the model’s decision-making process. This model’s values offer a comprehensive explanation of model predictions, aiding in interpretation and trust building in AI systems. This interpretation is obtained by adding the Shapley values, as specified in Equation (8):
f x = 0 + j = 1 M j
Let f x represent the value predicted by the ML model, 0 represents the average prediction for the training dataset, and j represents the Shapley value for feature j.

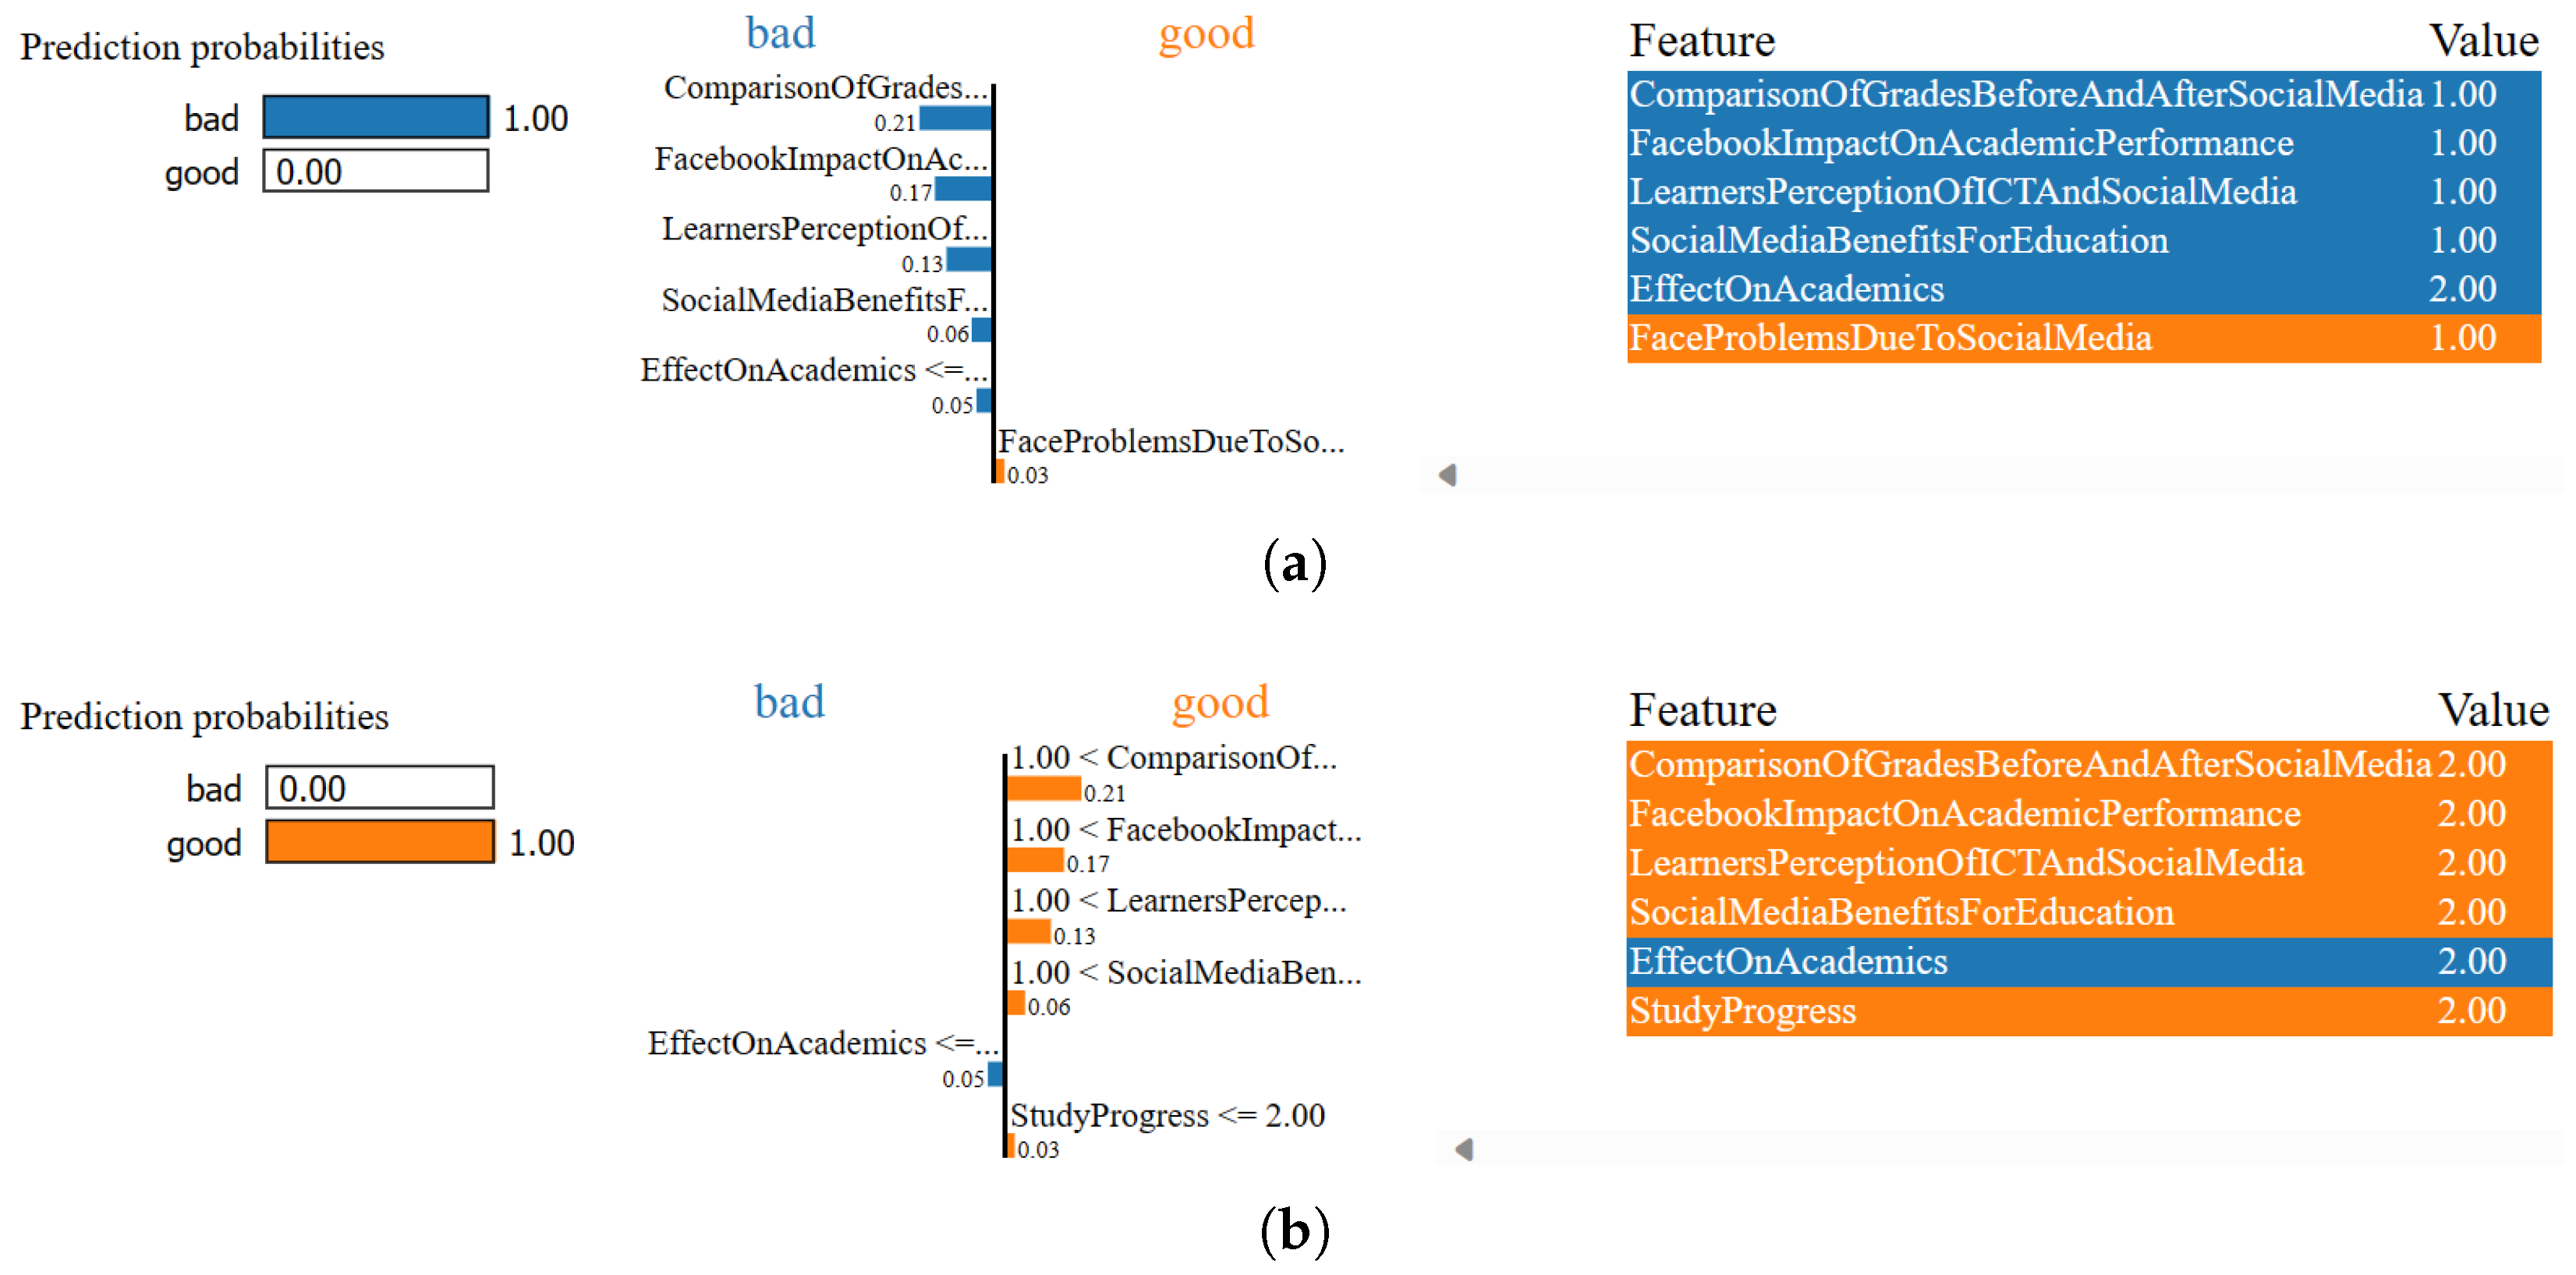
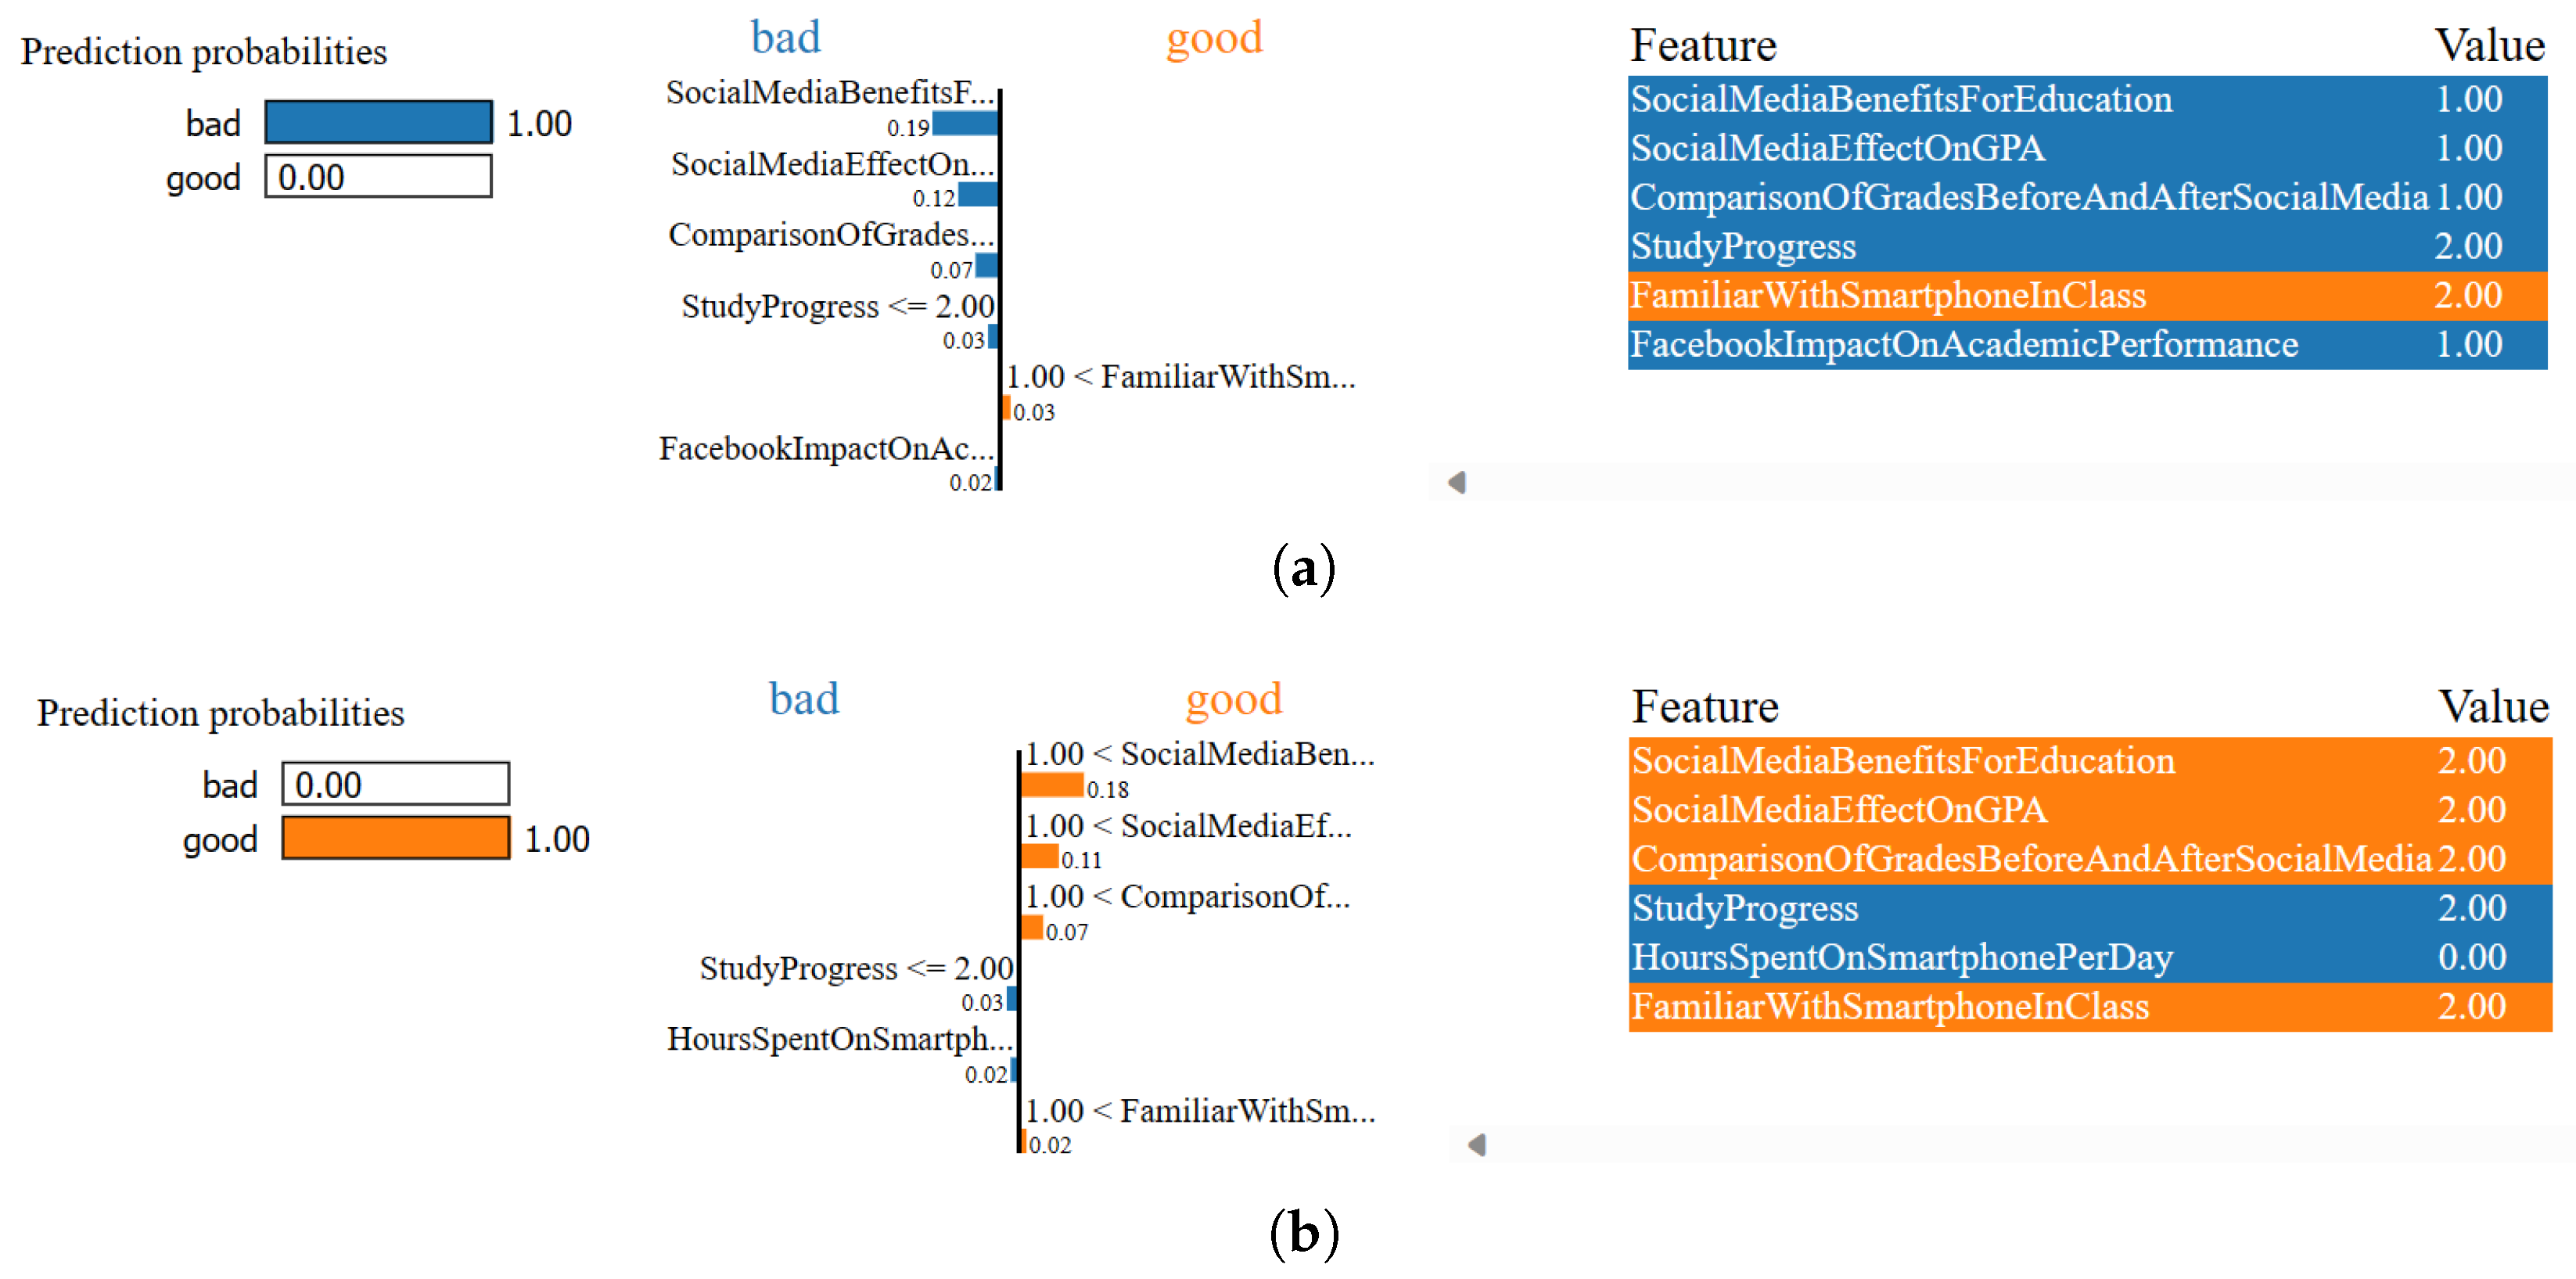
4.3.2. Local Interpretable Model-Agnostic Explanations (LIME)

LIME is a technique designed to provide transparent explanations for individual predictions made by complex machine learning models. LIME works by approximating the decision boundary of a model in the vicinity of a specific data point, enabling local interpretation. The key idea behind LIME is to fit a simpler, interpretable model, such as linear regression or decision trees, to mimic the behavior of the complex model locally. This local approximation is obtained by sampling around the data point of interest and fitting the interpretable model to these samples. Mathematically, LIME can be represented as follows:
arg   min g G L ( f , g , π x ) + Ω ( g )
where f is the complex model being explained, g is the interpretable model, π x represents the sampling distribution around the data point x, L is the loss function measuring the fidelity of the explanation, and Ω is a complexity penalty to ensure the interpretability of g. By providing insights into how individual predictions are made, LIME enhances the trustworthiness and interpretability of black-box models, making them more accessible for real-world applications.

4.3.3. Result Analysis of LIME

Figure 5 represents the discovery of the characteristics of the impact of social media and suggests the impact of parents on academics using LIME. We demonstrated the top six features for this reason.
In Figure 6a,b, we depict the major features for reasoning about the social media impact on the academic performance of our dataset and finally provide an exact reason.
Additionally, Figure 7a,b show the impact of social media and suggest the school teacher’s exact root causes.

4.3.4. Result Analysis of SHAP

In Figure 8a, the mean value of all the model’s predictions on the training dataset is referred to as the null approach prediction (a model that does not include any features). Red-colored features have a positive impact, causing the forecast value to approach 0. If we remove the EffectOnAcadeics feature, the forecast will increase from −0.05 to 0.00. In contrast, characteristics that are colored blue have a negative effect, meaning they pull the prediction value toward 0. Removing the ComparisonOfGradesBeforeAndAfterSocialMedia feature will result in a decrease in the prediction rate from 0.05 to 0. Consequently, the absence of social media problems in academic life will result in benefits for practitioners and stakeholders. In Figure 8b, when the feature HoursSpendOnSartPhonePerDay is removed, the forecast will rise from −0.02 to 0.00. Similarly, if the feature SocialMediaBenefitsForEducation is excluded, the prediction will decrease from 0.06 to 0. The output result in Figure 8c is 0.84, and removing the StudyProgress feature will increase the prediction from 0.55 to 0.84. Figure 9 presents a summary plot of Shapley’s additive explanations for prediction for parents, school teachers, and society. It highlights the impact of social media on parents, specifically concerning the comparison of grades before and after social media usage. However, we discovered that school teachers can have the greatest influence on academic life by utilizing “socimedevices” to monitor students’ “study progress”. Likewise, in the context of society, the most significant impact can be observed in the “Social Media Benefit of Education”.

4.3.5. Evaluation of LIME and SHAP in Comparison

Our study has demonstrated that LIME is more effective than SHAP in identifying the underlying factors that contribute to the influence of social media on academic life in our dataset. Both are effective algorithms for elucidating the inner workings of any model. On one side, LIME constructs localized information by developing a straightforward model based on a prediction. This model is less accurate than the complex model but easier to comprehend. In addition, SHAP uses game theory to assess the significance of each element in a model.

4.3.6. Recommendation of Authorities

Our paper explores the intersection of MLRec and the socimedevice among Bangladeshi high school students. The recommendations of this study have significant implications for understanding how technology and social media influence the learning environment, academic performance, and overall well-being of students in the context of Bangladesh.
Parents ought to realize both the negative and positive effects of mobile device and social media use among schoolchildren. This paper confirms that the overuse of social media is inversely correlated with academic performance, as evidenced in our SHAP importance feature analysis and LIME. As an example, students who used Facebook heavily had poorer grades, stressing the need for parents to monitor device usage and impose time management. In support of this argument, comparative grade performance before and after introducing social media has been shown to degrade over time. Parents can foster balance in digital life by imposing screen time limits and ensuring appropriate technology use, including academic apps or directed online learning systems.
While excessive social media consumption can be undesirable to society, our work also reflects that moderation-controlled consumption can have academic benefits. Machine learning results suggest that students who engage in ICT-based communities or academic online forums have improved cognitive engagement and problem-solving ability. Accordingly, society should not wholly ban social media but launch awareness programs to inculcate responsible consumption among individuals. Policymakers can also launch community-run programs where students can be trained in efficient social media consumption to aid learning rather than diversion. Our research reveals that when teachers appropriately utilize ICT and social media, students’ perceptions of these resources remain generally positive.
Our observation shows that learners who use online learning systems, attend online courses, and engage in online scholarly communities through social media perform better. Teachers can leverage this by integrating online-based teaching practices into school curricula. Schools can incorporate controlled programs in digital literacy, where children gain time management skills for appropriately working with technology. Teachers can be trained to integrate ICT tools in lesson practices to stimulate engagement and performance.
We have explained our methodology by discussing the research question and response, which can be found in Table 6.

5. Conclusions

In an era dominated by digital connectivity, the impact of social media on adolescent behavior and academic performance has garnered significant attention. Through rigorous analysis and empirical investigation, the MLRec model sheds light on the intricate dynamics between socimedevice usage, academic performance, and adolescent social interactions. Our survey dataset underwent preprocessing using diverse methods, and the dataset, sourced from 10 schools in various districts of Bangladesh, comprises 25 features and a total of 275 instances. Subsequently, we employed fifteen ML algorithms for both the training and testing phases.
After that, we applied 15 ML algorithms for training and testing. Then, we compared the algorithms using criteria such as accuracy, MSE, RMSE, R2, EV, and D2. Our findings show that ETC demonstrates substantial predictive accuracy, as well as MSE and EV, regarding dataset outcomes. Afterwards, we used the LIME and SHAP techniques in XAI to analyze the root cause of the impact of social media on student academic performance. LIME is the key aspect for analysis of the educational effect of using social media for our datasets. Finally, our findings indicate that excessive social media use hurts academic endeavors. The limitation of our research is the potential bias in data collection due to the reliance on self-reporting, which may result in social desirability bias or underreporting of sensitive information, affecting the accuracy and generalizability of findings.

Author Contributions

Conceptualization, M.B. and M.H.S.; methodology, M.H.S.; software, M.H.S.; validation, M.B. and J.U.; formal analysis, M.H.S.; investigation, M.B. and J.U.; resources, M.H.S.; data curation, M.H.S.; writing—original draft preparation, M.B. and M.H.S.; writing—review and editing, J.U.; visualization, M.H.S.; supervision, M.B. and J.U.; project administration, J.U.; funding acquisition, J.U. All authors have read and agreed to the published version of the manuscript.

Funding

This research is funded by Woosong University Academic Research 2025.

Data Availability Statement

The datasets used in this study are made available on the url https://ieee-dataport.org/documents/survey-impact-social-media-context-bangladeshi-high-school-students accessed on 3 February 2025.

Conflicts of Interest

The authors declare no conflicts of interest.

Abbreviations

List of Abbreviations
MLRecMachine Learning Recommender
socimedevicesocial media networks or devices
NNneural network
MLmachine learning
DLdeep learning
XAIExplainable AI
LIMELocal Interpretable Model
SHAPSHapley Additive exPlanations
MSEMean Squared Error
RMSERoot Mean Squared Error
R2R-Squared
EVExplained Variance
D2D2 Tweedie Score
SMOTTechSynthetic Minority Oversampling Technique
LElabel encoding
SSRSum of Squared Residuals
SSTTotal Sum of Squares
LRLinear Regression
DTRDecision Tree Regression
DTCDecision Tree Classifier
RRRidge Regression
GBCGradient Boosting Classifier
GBRGradient Boosting Regression
KNNK-Nearest Neighbors
IRIsotonic Regression
AdaBoostAdaBoost Classifier
ETCExtra Trees Classifier
RFRRandom Forest Regression
RFCRandom Forest Classifier
SVRSupport Vectors Regression
SVCSupport Vectors Classifier
GNBGaussian Naïve Bayes
MNBMultinomial Naïve Bayes
List of used symbols
Ra random number that ranges from 0 to 1.
ntotal number of data points.
i 1 , 2 , 3 , . . . , n Number of iteration.
f i feature vector of the under-investigated minority class sample.
f n e a r f i ’s is K closest neighbors.
h i average learner that exhibits an individual performance.
γ i scaling factor that accounts for the effect of a tree on the overall model.
y i actual value of Y.
y ^ i predicted value of Y.
y ¯ mean of actual value.

References

  1. Anjum, R.; Naeem, Z.; Chaudhary, A.A.; Asif, Q.-u.-a.; Rehman, A. The Impact of Social Media Use on Adolescent Well-Being and Academic Performance. J. Educ. Soc. Stud. 2024, 5, 426–434. [Google Scholar] [CrossRef]
  2. Henderson, J.; Social Media Use and Academic Achievement. UDaily 12 March 2024. Available online: https://www.udel.edu/udaily/2024/march/social-media-academic-achievement-research (accessed on 28 February 2025).
  3. Ashraf, M.A.; Khan, M.N.; Chohan, S.R.; Khan, M.; Rafique, W.; Farid, M.F.; Khan, A.U. Social Media Improves Students’ Academic Performance: Exploring the Role of Social Media Adoption in the Open Learning Environment among International Medical Students in China. Healthcare 2021, 9, 1272. [Google Scholar] [CrossRef] [PubMed]
  4. Giunchiglia, F.; Zeni, M.; Gobbi, E.; Bignotti, E.; Bison, I. Mobile social media usage and academic performance. Comput. Hum. Behav. 2018, 82, 177–185. [Google Scholar] [CrossRef]
  5. Singh, M.; Amiri, M.; Sabbarwal, S. Social media usage: Positive and negative effects on the life style of Indian youth. Iran. J. Soc. Sci. Humanit. Res. 2017, 5, 123–127. [Google Scholar]
  6. Ali, A.; Iqbal, K.; Iqbal, A. EFFECTS OF SOCIAL MEDIA ON YOUTH: A CASE STUDY IN UNIVERSITY OF SARGODHA. Int. J. Adv. Res. 2016, 4, 369–372. [Google Scholar] [CrossRef]
  7. Barkhuus, L.; Tashiro, J. Student Socialization in the Age of Facebook. In Proceedings of the SIGCHI Conference on Human Factors in Computing Systems, Atlanta, GA, USA, 10–15 April 2010; Volume 1, pp. 133–142. [Google Scholar] [CrossRef]
  8. Phauk, S.; Okazaki, T. Developing Web-based Support Systems for Predicting Poor-performing Students using Educational Data Mining Techniques. Int. J. Adv. Comput. Sci. Appl. 2020, 11, 23–32. [Google Scholar] [CrossRef]
  9. Stollak, M.; Vandenberg, A.; Burklund, A.; Weiss, S. Getting Social: The Impact of Social Networking Usage on Grades Amongst College Students. Proc. ASBBS Annu. Conf. 2011, 18, 859–865. [Google Scholar]
  10. Charoensukmongkol, P. The Impact of Social Media on Social Comparison and Envy in Teenagers: The Moderating Role of the Parent Comparing Children and In-group Competition among Friends. J. Child. Fam. Stud. 2018, 27, 69–79. [Google Scholar] [CrossRef]
  11. Mushroor, S.; Haque, S.; Amir, R.A. The impact of smart phones and mobile devices on human health and life. Int. J. Community Med. Public Health 2019, 7, 9–15. [Google Scholar] [CrossRef]
  12. Boyd, D.M.; Ellison, N.B. Social Network Sites: Definition, History, and Scholarship. J. Comput.-Mediat. Commun. 2007, 13, 210–230. [Google Scholar] [CrossRef]
  13. Dabbagh, N.; Reo, R. Back to the Future: Tracing the Roots and Learning Affordances of Social Software. Web 2.0-Based E-Learn. Appl. Soc. Inform. Tert. Teach. 2010, 1–20. Available online: https://www.igi-global.com/gateway/chapter/45014 (accessed on 3 February 2025).
  14. Dabbagh, N.; Kitsantas, A. Personal Learning Environments, social media, and self-regulated learning: A natural formula for connecting formal and informal learning. Internet High. Educ. 2012, 15, 3–8. [Google Scholar] [CrossRef]
  15. Solomon, G.; Schrum, L. Web 2.0: New Tools, New Schools. 2007. Available online: https://www.slideshare.net/slideshow/web-20-new-tools-new-schools/51473705 (accessed on 3 February 2025).
  16. Selwyn, N. Faceworking: Exploring students’ education-related use of Facebook. Learn. Media Technol. 2009, 34, 157–174. [Google Scholar] [CrossRef]
  17. Hosen, M.; Uddin, M.N.; Hossain, S.; Islam, M.A.; Ahmad, A. The impact of COVID-19 on tertiary educational institutions and students in Bangladesh. Heliyon 2022, 8, e08806. [Google Scholar]
  18. Saha, B.; Atiqul Haq, S.M.; Ahmed, K.J. How does the COVID-19 pandemic influence students’ academic activities? An explorative study in a public university in Bangladesh. Humanit. Soc. Sci. Commun. 2023, 10, 1–10. [Google Scholar]
  19. Sakib, F. Online Education Trajectory during the COVID-19 Pandemic Among the Bangladeshi Adolescent Children. Res. Sq. 2022. [Google Scholar] [CrossRef]
  20. Arefin, A.S.; Chowdhury, S.A.; Roy, R.C.; Rahaman, M.M.; Cross, B. Education system in Bangladesh amid COVID-19: Traditional scenario, emergency protocols, challenges and a proposed sustainable conceptual framework. Sustainability 2023, 15, 8126. [Google Scholar] [CrossRef]
  21. Al Masud, A.; Hossain, M.A.; Biswas, S.; Ruma, A.P.; Rahman, K.S.; Tagore, S. The emergence of digital learning in higher education: A lesson from the COVID-19 pandemic. Int. J. Inf. Learn. Technol. 2023, 40, 202–224. [Google Scholar] [CrossRef]
  22. Islam, M.R.; Apu, M.M.H.; Akter, R.; Tultul, P.S.; Anjum, R.; Nahar, Z.; Shahriar, M.; Bhuiyan, M.A. Internet addiction and loneliness among school-going adolescents in Bangladesh in the context of the COVID-19 pandemic: Findings from a cross-sectional study. Heliyon 2023, 9, e13340. [Google Scholar]
  23. Chowdhury, M.K.; Behak, F.B.P. Online higher education in Bangladesh during Covid-19: Its challenges and prospects. Utamax: J. Ultim. Res. Trends Educ. 2022, 4, 15–28. [Google Scholar]
  24. Islam, M.T.; Habib, T.I. Barriers of adopting online learning among the university students in Bangladesh during COVID-19. Indones. J. Learn. Adv. Educ. (IJOLAE) 2022, 4, 71–91. [Google Scholar] [CrossRef]
  25. Sayeed, A.; Islam, M.S.; Christopher, E.; Zubayer, A.A.; Kundu, S.; Tariq, M.R.; Sultana, M.S.; Banna, M.H.A.; Rahman, M.H.; Khan, M.S.I.; et al. Investigating problematic uses of Facebook and other Internet activities among university students in Bangladesh during the COVID-19 pandemic. Sci. Rep. 2023, 13, 1307. [Google Scholar] [CrossRef] [PubMed]
  26. Rahman, Z.; Haque, M.A.; Aziz, D.A.B. Internet Usage During and Post COVID-19 Pandemic: A Study on the Students of Information Science and Library Management in the University of Rajshahi, Bangladesh. Bangladesh. Libr. Philos. Pract. 2023, 1–15. [Google Scholar]
  27. Lukose, J.M.; Agbeyangi, A.O. Is social media hindering or helping Academic Performance? A case study of Walter Sisulu University Buffalo City Campus. arXiv 2025, arXiv:2501.03611. [Google Scholar]
  28. Tabasum, T.; Jabeen, M. Effects of Social Media Engagement and Romantic Relationships on Academic Distraction with Emotional Attachment as a Mediator. J. Child. Lit. Soc. Issues 2024, 3, 17–37. [Google Scholar]
  29. Srivastava, R.; Srivastava, A.K. TO STUDY THE IMPACT OF SOCIAL MEDIA ON THE ACADEMIC ACHIEVEMENT OF SECONDARY SCHOOL STUDENT. Int. J. Nov. Res. Dev. (IJNRD) 2022, 7, 51–60. [Google Scholar]
  30. Sharma, S.; Behl, R. Analysing the Impact of Social Media on Students’ Academic Performance: A Comparative Study of Extraversion and Introversion Personality. Psychol. Stud. 2022, 67, 549–559. [Google Scholar] [CrossRef]
  31. Hemal, S.H.; Khan, M.A.R.; Ahammad, I.; Rahman, M.; Khan, M.A.S.; Ejaz, S. Predicting the impact of internet usage on students’ academic performance using machine learning techniques in Bangladesh perspective. Soc. Netw. Anal. Min. 2024, 14, 66. [Google Scholar]
  32. Tariq, M.B.; Habib, H.A. A Reinforcement Learning Based RecommendationSystem to Improve Performance of Students in Outcome Based Education Model. IEEE Access 2024, 12, 36586–36605. [Google Scholar] [CrossRef]
  33. Sagabala, M.O.; Regidor, S.M.A.; Torre, M.C.M.D.; Monteza, A.M.M. A qualitative inquiry on the behavior of english major students towards social media distractions. Eur. J. Educ. Stud. 2023, 10, 77–98. [Google Scholar]
  34. Panchanathan, S.; Raj, K. A Study on Impact of Social Media Among Students of Adolescent Age Group on Individual Performance. Int. J. Prof. Bus. Rev. 2022, 7, e0505. [Google Scholar] [CrossRef]
  35. Thelma, C.C.; Mubemba, B.N.; Chitondo, L. Social media and pupils’ academic performance: A case of selected secondary schools in Lusaka District, Zambia. World J. Adv. Res. Rev. 2023, 20, 1028–1035. [Google Scholar] [CrossRef]
  36. Muslikah, M.; Mulawarman, M.; Andriyani, A. Social Media User Students’ Academic Procrastination. PSIKOPEDAGOGIA J. Bimbing. Konseling 2018, 7, 53–57. [Google Scholar]
  37. Jamil, M.; ul Ain, Q.; Batool, S.; Saadat, S.; Malik, S.; Arshad, M.; Nagra, R.N.; Haider, M.; Shameem, R.; Latif, B. Impact of social media on academic performance. Eur. J. Med. Health Sci. 2020, 2. Available online: https://www.ej-med.org/index.php/ejmed/article/view/512 (accessed on 3 February 2025).
  38. Boateng, R.O.; Amankwaa, A. The impact of social media on student academic life in higher education. Glob. J. Hum.-Soc. Sci. 2016, 16, 1–8. [Google Scholar]
  39. Mosharrafa, R.A.; Akther, T.; Siddique, F.K. Impact of social media usage on academic performance of university students: Mediating role of mental health under a cross-sectional study in Bangladesh. Health Sci. Rep. 2024, 7, e1788. [Google Scholar] [CrossRef]
  40. Hasnain, H.; Nasreen, A.; Ijaz, H. Impact of social media usage on academic performance of university students. In Proceedings of the 2nd International Research Management & Innovation Conference (IRMIC), Langkawi, Malaysia, 26–27 August 2015; pp. 26–27. [Google Scholar]
  41. Hershcovits, H.; Vilenchik, D.; Gal, K. Modeling engagement in self-directed learning systems using principal component analysis. IEEE Trans. Learn. Technol. 2019, 13, 164–171. [Google Scholar]
  42. De la Hoz Domínguez, E.J.; Fontalvo Herrera, T.J. Methodology of Machine Learning for the classification and Prediction of users in Virtual Education Environments. Inf. Tecnol. 2019, 30, 247–254. [Google Scholar]
  43. Khan, I.A.; Choi, J.T. An application of educational data mining (EDM) technique for scholarship prediction. Int. J. Softw. Eng. Its Appl. 2014, 8, 31–42. [Google Scholar]
  44. Burman, I.; Som, S. Predicting Students Academic Performance Using Support Vector Machine. In Proceedings of the 2019 Amity International Conference on Artificial Intelligence (AICAI), Dubai, United Arab Emirates, 4–6 February 2019; pp. 756–759. [Google Scholar] [CrossRef]
  45. Wang, Q.; Chen, W.; Liang, Y. The Effects of Social Media on College Students. MBA Student Scholarship 2011. Available online: https://scholarsarchive.jwu.edu/mba_student/5/ (accessed on 3 February 2025).
  46. Güney, K. Considering the Advantages and Disadvantages of Utilizing Social Media to Enhance Learning and Engagement in K-12 Education. Res. Soc. Sci. Technol. 2023, 8, 83–100. [Google Scholar] [CrossRef]
  47. Rostaminezhad, M.A.; Porshafei, H.; Ahamdi, A.A. Can effective study approaches mediate the negative effect of social networking on academic performance? Educ. Inf. Technol. 2019, 24, 205–217. [Google Scholar] [CrossRef]
  48. Nti, I.K.; Akyeramfo-Sam, S.; Bediako-Kyeremeh, B.; Agyemang, S. Prediction of social media effects on students’ academic performance using Machine Learning Algorithms (MLAs). J. Comput. Educ. 2022, 9, 195–223. [Google Scholar] [CrossRef]
  49. Kaspersen, M.H.; Bilstrup, K.E.K.; Mechelen, M.V.; Hjort, A.; Bouvin, N.O.; Petersen, M.G. High school students exploring machine learning and its societal implications: Opportunities and challenges. Int. J. Child-Comput. Interact. 2022, 34, 100539. [Google Scholar] [CrossRef]
  50. Hussain, S.; Khan, M.Q. Student-Performulator: Predicting Students’ Academic Performance at Secondary and Intermediate Level Using Machine Learning. Ann. Data. Sci. 2023, 10, 637–655. [Google Scholar] [CrossRef]
  51. Lai, T.; Xie, C.; Ruan, M.; Wang, Z.; Lu, H.; Fu, S. Influence of artificial intelligence in education on adolescents’ social adaptability: The mediatory role of social support. PLoS ONE 2023, 18, e0283170. [Google Scholar] [CrossRef]
  52. Tran, M.; Draeger, C.; Wang, X.; Nikbakht, A. Monitoring the well-being of vulnerable transit riders using machine learning based sentiment analysis and social media: Lessons from COVID-19. Environ. Plan. B Urban Anal. City Sci. 2023, 50, 60–75. [Google Scholar] [CrossRef]
  53. Salim, S.; Turnbull, B.; Moustafa, N. Data analytics of social media 3.0: Privacy protection perspectives for integrating social media and Internet of Things (SM-IoT) systems. Ad Hoc Netw. 2022, 128, 102786. [Google Scholar] [CrossRef]
  54. Shuvo, M.H.; Begum, M. Survey for Impact of social media in the context of Bangladeshi High school students. IEEE Dataport 2024. [Google Scholar] [CrossRef]
  55. Chawla, N.V.; Bowyer, K.W.; Hall, L.O.; Kegelmeyer, W.P. SMOTE: Synthetic Minority Over-sampling Technique. J. Artif. Intell. Res. 2002, 16, 321–357. [Google Scholar] [CrossRef]
  56. Hancock, J.T.; Khoshgoftaar, T.M. Survey on categorical data for neural networks. J. Big Data 2020, 7, 28. [Google Scholar] [CrossRef]
  57. Maulud, D.; Abdulazeez, A.M. A Review on Linear Regression Comprehensive in Machine Learning. J. Appl. Sci. Technol. Trends 2020, 1, 140–147. [Google Scholar] [CrossRef]
  58. Begum, M.; Shuvo, M.H.; Ashraf, I.; Mamun, A.A.; Uddin, J.; Samad, M.A. Software Defects Identification: Results Using Machine Learning and Explainable Artificial Intelligence Techniques. IEEE Access 2023, 11, 132750–132765. [Google Scholar] [CrossRef]
  59. Costa-Mendes, R.; Oliveira, T.; Castelli, M.; Cruz-Jesus, F. A machine learning approximation of the 2015 Portuguese high school student grades: A hybrid approach. Educ. Inf. Technol. 2021, 26, 1527–1547. [Google Scholar] [CrossRef]
  60. Solomatine, D.; Shrestha, D. AdaBoost.RT: A boosting algorithm for regression problems. In Proceedings of the 2004 IEEE International Joint Conference on Neural Networks (IEEE Cat. No. 04CH37541), Budapest, Hungary, 25–29 July 2004; Volume 2, pp. 1163–1168. [Google Scholar] [CrossRef]
  61. Natekin, A.; Knoll, A. Gradient boosting machines, a tutorial. Front. Neurorobot. 2013, 7, 21. [Google Scholar]
  62. Otchere, D.A.; Ganat, T.O.A.; Ojero, J.O.; Tackie-Otoo, B.N.; Taki, M.Y. Application of gradient boosting regression model for the evaluation of feature selection techniques in improving reservoir characterisation predictions. J. Pet. Sci. Eng. 2022, 208, 109244. [Google Scholar] [CrossRef]
  63. Lee, S.; Park, J.; Kim, N.; Lee, T.; Quagliato, L. Extreme Gradient Boosting-inspired process optimization algorithm for manufacturing engineering applications. Mater. Des. 2023, 226, 111625. [Google Scholar] [CrossRef]
  64. Sanmorino, A.; Marnisah, L.; Sunardi, H. Feature Selection Using Extra Trees Classifier for Research Productivity Framework in Indonesia. 2023. In Proceedings of the 3rd International Conference on Electronics, Biomedical Engineering, and Health Informatics, Surabaya, Indonesia, 5–6 October 2020; pp. 13–21. [Google Scholar] [CrossRef]
  65. Valero-Mas, J.J.; Gallego, A.J.; Alonso-Jiménez, P.; Serra, X. Multilabel Prototype Generation for data reduction in K-Nearest Neighbour classification. Pattern Recognit. 2023, 135, 109190. [Google Scholar] [CrossRef]
  66. Tyagi, K.; Rane, C.; Harshvardhan; Manry, M. Chapter 4—Regression analysis. In Artificial Intelligence and Machine Learning for EDGE Computing; Academic Press: New York, NY, USA, 2022; pp. 53–63. [Google Scholar] [CrossRef]
  67. O’Grady, K.E. Measures of explained variance: Cautions and limitations. Psychol. Bull. 1982, 92, 766–777. [Google Scholar] [CrossRef]
  68. Roussel, C.; Böhm, K. Geospatial XAI: A Review. ISPRS Int. J. Geo-Inf. 2023, 12, 355. [Google Scholar] [CrossRef]
  69. Interpretable machine learning for imbalanced credit scoring datasets. Eur. J. Oper. Res. 2024, 312, 357–372. [CrossRef]
  70. Lundberg, S.; Lee, S.I. A Unified Approach to Interpreting Model Predictions. arXiv 2017, arXiv:1705.07874. [Google Scholar] [CrossRef]
Figure 1. Proposed machine learning framework for student data analysis and recommendations.
Information 16 00280 g001
Figure 2. Residual plot comparison between ETC and GBR models.
Information 16 00280 g002
Figure 3. Q-Q plot comparison of residuals for ETC and GBR models.
Information 16 00280 g003
Figure 4. Workflow for extracting interpretability insights using LIME and SHAP techniques.
Information 16 00280 g004
Figure 5. LIME agnostic explanations prediction for parents. (a) demonstrates the worst effect on the academic person and provides us with the highest impact of ComparisonOfGradesBeforeAndAfterSocialMedia on the model’s estimation ability. Then, FacebookImpactOnAcademicPerformance shows a bad effect on academic life, and lastly, FaceProblemsDueToSocialMedia has shown positive results for good academicians. (b) shows the good scores for academicians, except that EffectOnAcademics shows a bad effect on academic performance.
Information 16 00280 g005
Figure 6. LIME agnostic explanations prediction for society. (a) shows that the worst effect on performance is SocialMediaBenefitsForEducation followed by SocialMediaEffectOnGPA, and finally, FamiliarWithSmartphoneInClass shows good results. (b) demonstrates that SocialMediaBenefitsForEducation is good for academia but StudyProgress and HoursSpendOnSmartphonePerDay show bad effects on academic life.
Information 16 00280 g006
Figure 7. LIME agnostic explanations prediction for school teachers. The worst effect is StudyProgress and the good reason is LearnersPerceptionOfICTAndSocialMedia, which is shown in (a), and (b) demonstrates EffectOnAcademics as the second-best reason for a good impact on social media.
Information 16 00280 g007
Figure 8. SHAP analysis identifies the most influential features of students using socimedevices: (a) for parents, (b) for society, and (c) for school teachers.
Information 16 00280 g008
Figure 9. Summary plotting of SHapley Additive exPlanations Prediction for (a) parents, (b) school teachers, and (c) society.
Information 16 00280 g009
Table 1. Summary of COVID-19 impact studies on education in Bangladesh.
ContributorsCovered AreaMethodologyKey Findings
Hosen et al. (2022) [17]Bangladesh (tertiary education)Mixed methods: content analysis (interviews) + frequency distribution (questionnaire survey)Students faced significant challenges, including 88% having mental health issues, 79% experiencing financial hardship, 72% reporting tech problems, and 21% lacking electronic devices. Over 55% studied less during COVID-19. Online education adoption was difficult due to lack of access, training, and interaction.
Saha et al. (2023) [18]Public university in BangladeshQualitative: semi-structured interviews with 30 students; thematic analysisThe study identified significant disruptions in education resulting from insufficient resources, the closure of libraries and dormitories, and difficulties associated with online classes. Students encountered psychological strain, physical inactivity, financial difficulties, and diminished peer interaction. They acquired digital skills, participated in online courses (e.g., Coursera), and pursued creative and volunteer activities, demonstrating enhanced adaptability.
Sakib (2022) [19]Adolescent children in BangladeshMixed method: in-depth interviews, focus groups, case studies; 1013 survey responsesThe COVID-19 pandemic transitioned education to digital platforms, yet it revealed disparities in access, the digital divide, and socio-emotional repercussions. Students encountered psychological stress, reliance on smartphones, impaired social interactions, and difficulties with accent and language transitions. Nevertheless, certain individuals gained advantages from adaptable access, self-directed learning, and enhanced exposure to educational technology.
Arefin et al. (2023) [20]All education levels in BangladeshConvergent parallel mixed-methods: surveys (205 students, 50 teachers), 11 parent interviews, 12 expert KIIsObstacles to online education comprised inadequate training, unreliable Internet access, shortages of information and communication technology, and electricity disruptions. Recommended utilizing television/radio, learning management systems, and mobile applications. Proposed a sustainable emergency framework for formal education contingent upon educational attainment.
Masud et al. (2023) [21]Higher education in BangladeshQuantitative: Structural Equation Modeling (SEM) with 392 university studentsFaculty readiness, student preparedness, economic viability, and assessment frameworks substantially impact students’ propensity to embrace technology. The preparedness of faculty exerted the most significant positive influence, whereas challenges associated with online assessment adversely impacted technology adoption. Students from economically disadvantaged backgrounds encountered obstacles related to financial resources and digital accessibility. A blended learning model is advocated for enduring sustainability.
Islam et al. (2023) [22]School-going adolescents in BangladeshOnline cross-sectional survey (n = 502); IAT and UCLA Loneliness Scale-388.25% exhibit internet addiction, while 72.51% experience loneliness; social media users are three times more susceptible to loneliness; individuals utilizing English medium and mobile platforms are disproportionately affected.
Chowdhury and Behak (2022) [23]Higher education in BangladeshSystematic literature review of 42 sourcesDigital divide and adverse perceptions; blended learning is suggested to enhance access and equity.
Islam and Habib (2022) [24]University students in DhakaQuantitative: semi-structured online survey with 394 responses analyzed via SPSSv30Barriers categorized as environmental, e-learning, and psychological; all substantially impeded learning.
Sayeed et al. (2023) [25]University students in BangladeshOnline survey (n = 1101); IAT and Facebook Addiction Scale39.3% exhibited problematic internet usage; 37.1% demonstrated Facebook addiction; associated with rural demographics, art majors, unsuccessful relationships, and prolonged usage durations.
Rahman et al. (2023) [26]ISLM students, Rajshahi UniversityQuantitative survey (199 students); SPSS and Biblioshiny analysis57% utilized the Internet for over 4 h per day; advantages: acquisition of skills (IT, language); disadvantages: sleep disturbances; ambivalent opinions regarding online classes; Facebook is the most utilized platform.
Table 2. Contributions and constraints of various research found in the literature.
Ref.ContributionsConstraints
[48]The paper’s contributions lie in its data-driven, predictive, and methodologically innovative approach to assessing social media’s effect on students’ educational performanceThe choice of machine learning algorithms may not be exhaustive or may not consider the latest advancements in the field. Different algorithms have varying strengths and weaknesses, and not all of them may be suitable for the specific context of the study.
[49]The paper describes the design and implementation of VotestratesML, which is a learning method that helps students explore ML and its societal implications through the lens of participatory elections.The study was conducted with only two high school classes, which limits the generalizability of the findings
[50]The author proposed a framework that educators can use to recognize risky students early on and give them the assistance they need to succeed. Policymakers can also use the framework to inform decisions about resource allocation and educational policy.The study used two supervised learning algorithms, a regression model and a decision tree classifier, which may not be the most accurate or appropriate models for predicting student performance.
[51]It provides important insights into the potential impacts of AI on social development and suggests ways to mitigate these impacts.This limits the findings’ applicability to different countries/cultures. In addition, the small sample size may not be large enough to detect all of the possible effects of AIEd on social adaptability.
[52]The paper demonstrates the feasibility of using social media sentiment analysis powered by machine learning data to monitor the security of susceptible transportation users.The study focuses on sentiment analysis, which provides a general sense of positive or negative emotions, but it does not delve into specific well-being indicators such as stress levels, anxiety, or feelings of safety and security.
[53]The study delves into the wider societal consequences of merging social media and IoT, contributing to the ethical and social dialogue on these technologies by examining the implications of SM-IoT systems for both individuals and society at large.It does not adequately address the broader social, ethical, and legal implications of integrating social media and IoT data. For instance, the paper does not discuss the potential for data misuse or the lack of transparency in data collection and processing practices.
Table 3. Participant distribution and categories.
PrinciplesCategoryNumber of ParticipantsParticipants(%)
GenderMale15255%
Female12345%
Academic YearClass Six3312%
Class Seven4617%
Class Eight5018%
Class Nine6624%
Class Ten8029%
Table 4. Features table [FN = feature name, FG = feature group, PV = possible values, 0 (no), 1 (yes), 2 (good), 3 (average), 4 (bad)].
FNFGFeature DescriptionPV
F1Personal InformationNameText
F3GenderText
F4Study in classText
F5Study progress?2, 3, 4
F6Aim?Text
F7Digital Connectivity MetricsSmartphones used?0, 1
F8Familiar with smartphones in class?Text
F9Smartphone used per day (hour).0, 1
F10Smartphones are common with family?0, 1
F11Unveiling Social Media’s
Educational Impact
Social media used?Text
F12Problem face?Text
F13Top social platform in Bangladesh?Text
F14How often do you scroll?Text
F15Does social media aid education?0, 1
F16Top educational social networking platforms.Text
F17Facebook’s effect on student grades?0, 1
F18Can social media alter student behavior effectively?2, 3, 4
F19Does social media impact GPA?0, 1
F20Do social platforms boost academic performance?0, 1
F21How does the use of social networking sites affect students’ academics?Text
F22Does a private Facebook group promote collaborative learning and engagement?Text
F23Examining Online
Distractions in Education
Does easy access to online games and websites hinder studying/focus?0, 1
F24How many hours a day do you play online or offline games for entertainment purposes?Text
F25Analyzing Non-Traditional
Methods for Writing
Proficiency
Does the experimental group outperform the control group in writing proficiency through a non-traditional teaching approach?0, 1
F26How do students in the test group view the possible gains from combining ICT and social media for improving their writing abilities?Text
Table 5. Assessment of dataset performance.
SLModel NameScoreMSERMSER2EVD2
1Linear R.0.40770.26500.40770.51480.40860.4077
2Decision Tree R.0.38000.27740.38000.52670.38070.3800
3Ridge R.0.40770.26500.40770.51480.40860.4077
4Random Forest R.0.38630.27460.38630.52400.38700.3863
5Gradient Boosting R.0.40770.26500.40770.51480.40870.4077
6Kneighbors R.0.31110.30820.31110.55520.31110.3111
7Isotonic R.0.40730.26510.40730.51490.40830.4073
8Decision Tree C.0.86090.31120.30450.55780.38150.3045
9Ada Boost C.0.85560.31650.29250.56260.35670.2925
10Gradient Boosting C.0.86180.31030.30650.5570.38280.3065
11Extra Trees C.0.86180.25760.31250.55460.40950.3125
12SVR0.37200.28100.37200.53010.39790.3720
13SVC0.86170.30940.30850.55620.38700.3085
14Gaussian NB0.85910.31300.30050.55940.37170.3005
15Multinomial NB0.50220.6807−0.52110.8250−0.3625−0.5211
Table 6. Research question and answer based on our research.
SL.QuestionAnswer
RQ1What is the current level of awareness and utilization of socimedevices among Bangladeshi high school students, and how does it influence their interaction with XAI?Investigating the extent to which high school students in Bangladesh are familiar with and actively use socimedevices such as smartphones, tablets, and laptops. Examining the relationship between their device usage patterns and engagement with Explainable AI and how this impacts their academic and social experiences.
RQ2How does the MLRec model influence the learning outcomes and academic performance of Bangladeshi high school students when integrated into their educational environment?Assessing the impact of the MLRec model on the educational landscape in Bangladesh, particularly its effects on the academic achievements of high school students. Exploring the ways in which personalized recommendations and adaptive learning through MLRec contribute to improved learning outcomes and student performance.
RQ3What are the social and cultural implications of integrating Explainable AI, specifically MLRec, into the educational experience of Bangladeshi high school students, and how do socimedevices mediate these implications?Analyzing the broader societal and cultural effects of incorporating MLRec into the educational system. Investigating how the use of socimedevices as intermediaries influences social interactions, cultural norms, and the overall fabric of student life both inside and outside the classroom.
RQ4How do privacy and ethical considerations manifest in the implementation of MLRec within the educational context for high school students in Bangladesh, taking into account the use of socimedevices?Delving into the ethical dimensions of utilizing MLRec in education, particularly focusing on privacy concerns and ethical considerations. Examining how the integration of socimedevices as conduits for MLRec impacts data security, student privacy, and the ethical framework surrounding the use of AI in the educational context.
Disclaimer/Publisher’s Note: The statements, opinions and data contained in all publications are solely those of the individual author(s) and contributor(s) and not of MDPI and/or the editor(s). MDPI and/or the editor(s) disclaim responsibility for any injury to people or property resulting from any ideas, methods, instructions or products referred to in the content.

