Article

From Pixels to Diagnosis: Implementing and Evaluating a CNN Model for Tomato Leaf Disease Detection

by
Zamir Osmenaj
1,
Evgenia-Maria Tseliki
2,
Sofia H. Kapellaki
1,
George Tselikis
3 and
Nikolaos D. Tselikas
1,*
1
Department of Informatics and Telecommunications, University of the Peloponnese, 221 31 Tripoli, Greece
2
Department of Informatics, Athens University of Economics Business, 104 34 Athens, Greece
3
Department of Electrical and Electronics Engineering, University of West Attica, 122 41 Athens-Egaleo, Greece
*
Author to whom correspondence should be addressed.
Information 2025, 16(3), 231; https://doi.org/10.3390/info16030231
Submission received: 6 February 2025 / Revised: 10 March 2025 / Accepted: 14 March 2025 / Published: 16 March 2025
(This article belongs to the Special Issue AI-Based Image Processing and Computer Vision)

Abstract

:
The frequent emergence of multiple diseases in tomato plants poses a significant challenge to agriculture, requiring innovative solutions to deal with this problem. The paper explores the application of machine learning (ML) technologies to develop a model capable of identifying and classifying diseases in tomato leaves. Our work involved the implementation of a custom convolutional neural network (CNN) trained on a diverse dataset of tomato leaf images. The performance of the proposed CNN model was evaluated and compared against the performance of existing pre-trained CNN models, i.e., the VGG16 and VGG19 models, which are extensively used for image classification tasks. The proposed CNN model was further tested with images of tomato leaves captured from a real-world garden setting in Greece. The captured images were carefully preprocessed and an in-depth study was conducted on how either each image preprocessing step or a different—not supported by the dataset used—strain of tomato affects the accuracy and confidence in detecting tomato leaf diseases.

Graphical Abstract

1. Introduction

Tomatoes are one of the most widely cultivated and consumed vegetables globally, used as the basic ingredient in numerous diets and cuisines. The presence of several diseases in tomato plants poses a significant challenge to agricultural productivity. Tomato plants are especially vulnerable to many diseases, which can affect both yield and quality. Traditional methods for identifying and treating these diseases are often manual, labor-intensive, time-consuming, and error-prone, making them impractical for large crops. To protect their crops and address problems early, farmers are looking for more efficient, reliable, and scalable solutions.
Machine learning (ML) and artificial intelligence (AI) have emerged as promising technologies to solve problems in various sectors, including agriculture. By automating and enhancing the accuracy of disease detection, these technologies can play a vital role in improving crop health and productivity. A ML model is a mathematical or computational representation designed to make predictions or decisions without being explicitly programmed for a specific task [1]. It is educated through the training process, where the model learns patterns, relationships, and behaviors from available data. Once trained, the model can apply this knowledge to new, unseen data to perform tasks like classification, regression, and clustering.
This paper explores the application of ML and AI, specifically in the form of convolutional neural networks (CNNs), to develop a model that can accurately identify and classify diseases in tomato leaves. The main objectives of this paper are:
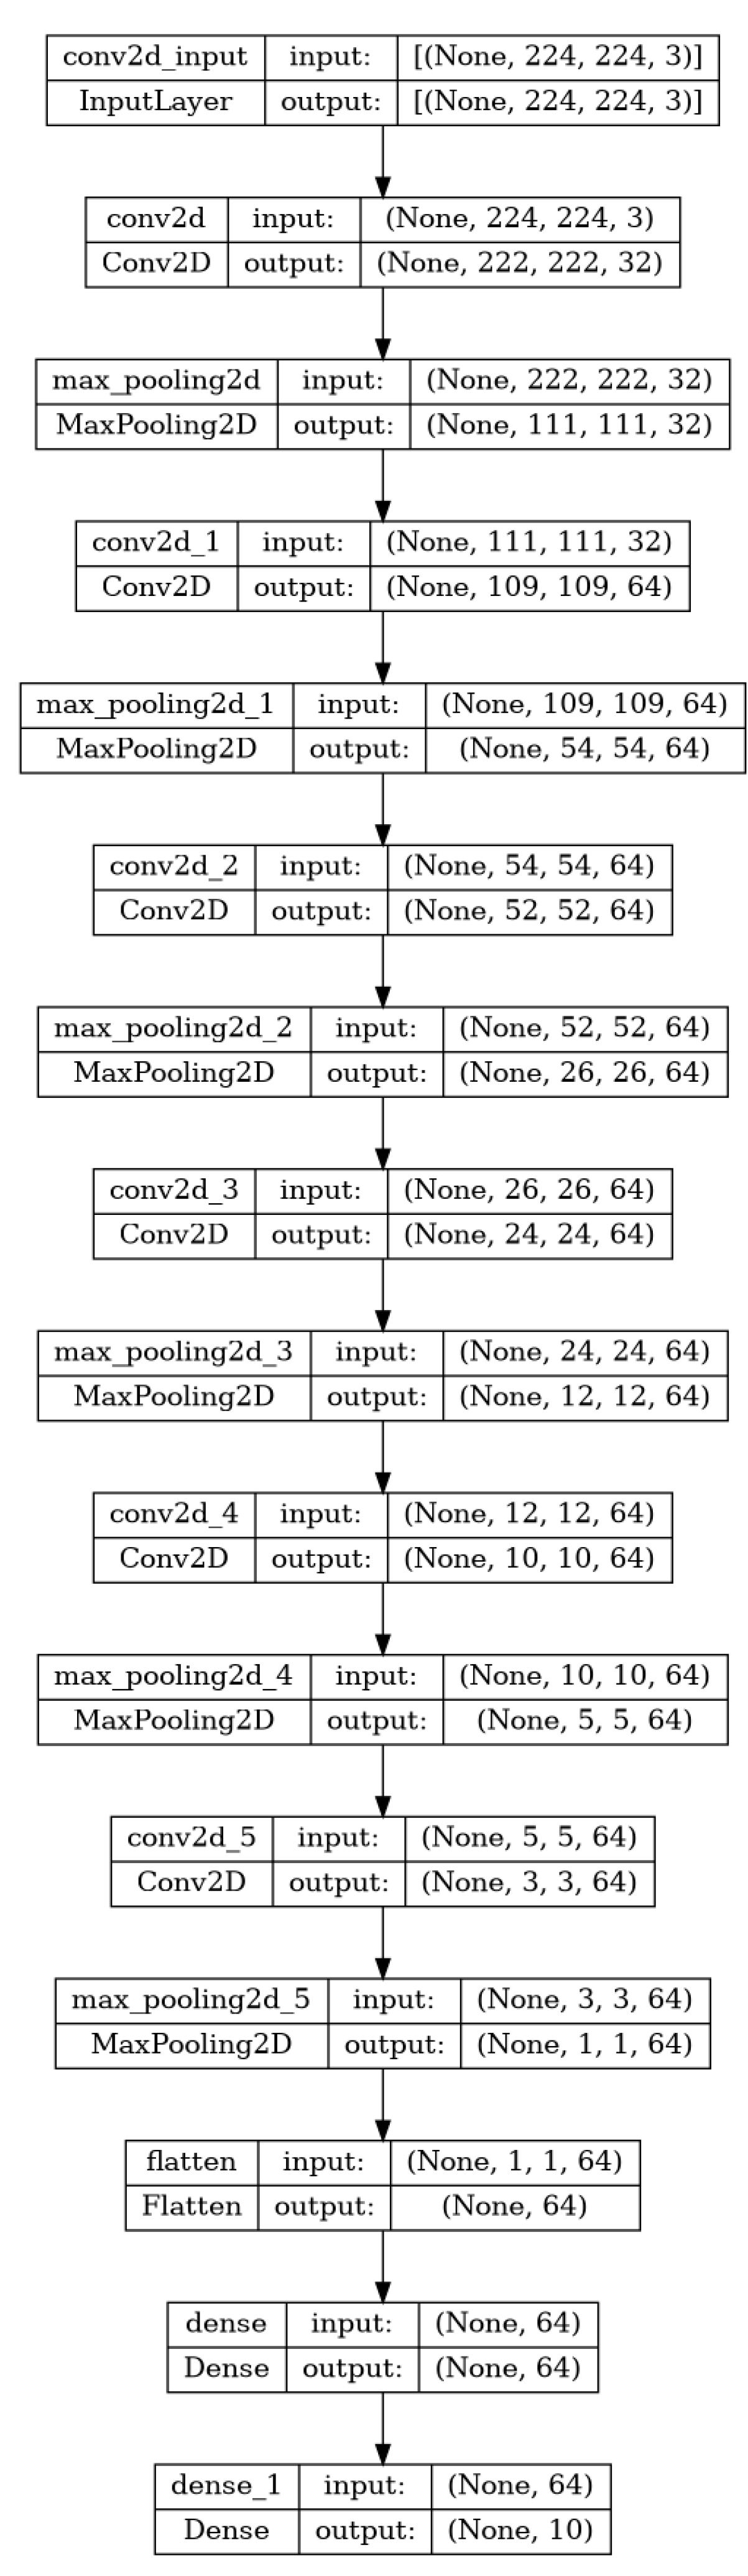
  • Develop a Custom CNN: CNNs are a class of deep learning models particularly effective for image identification tasks [2]. They use convolutional layers to extract features from images, followed by fully connected layers to make predictions. Our custom CNN model was trained on a large dataset of tomato leaf images to effectively distinguish healthy leaves and those affected by disease.
  • Fine-tune pre-trained models: VGG16 and VGG19 are pre-trained models used in image classification tasks. They are based on deep convolutional architectures trained on the ImageNet dataset. By fine-tuning these models on our specific dataset, we aimed to exploit their pre-learned features and adjust them for the task to identify diseases in tomato plants.
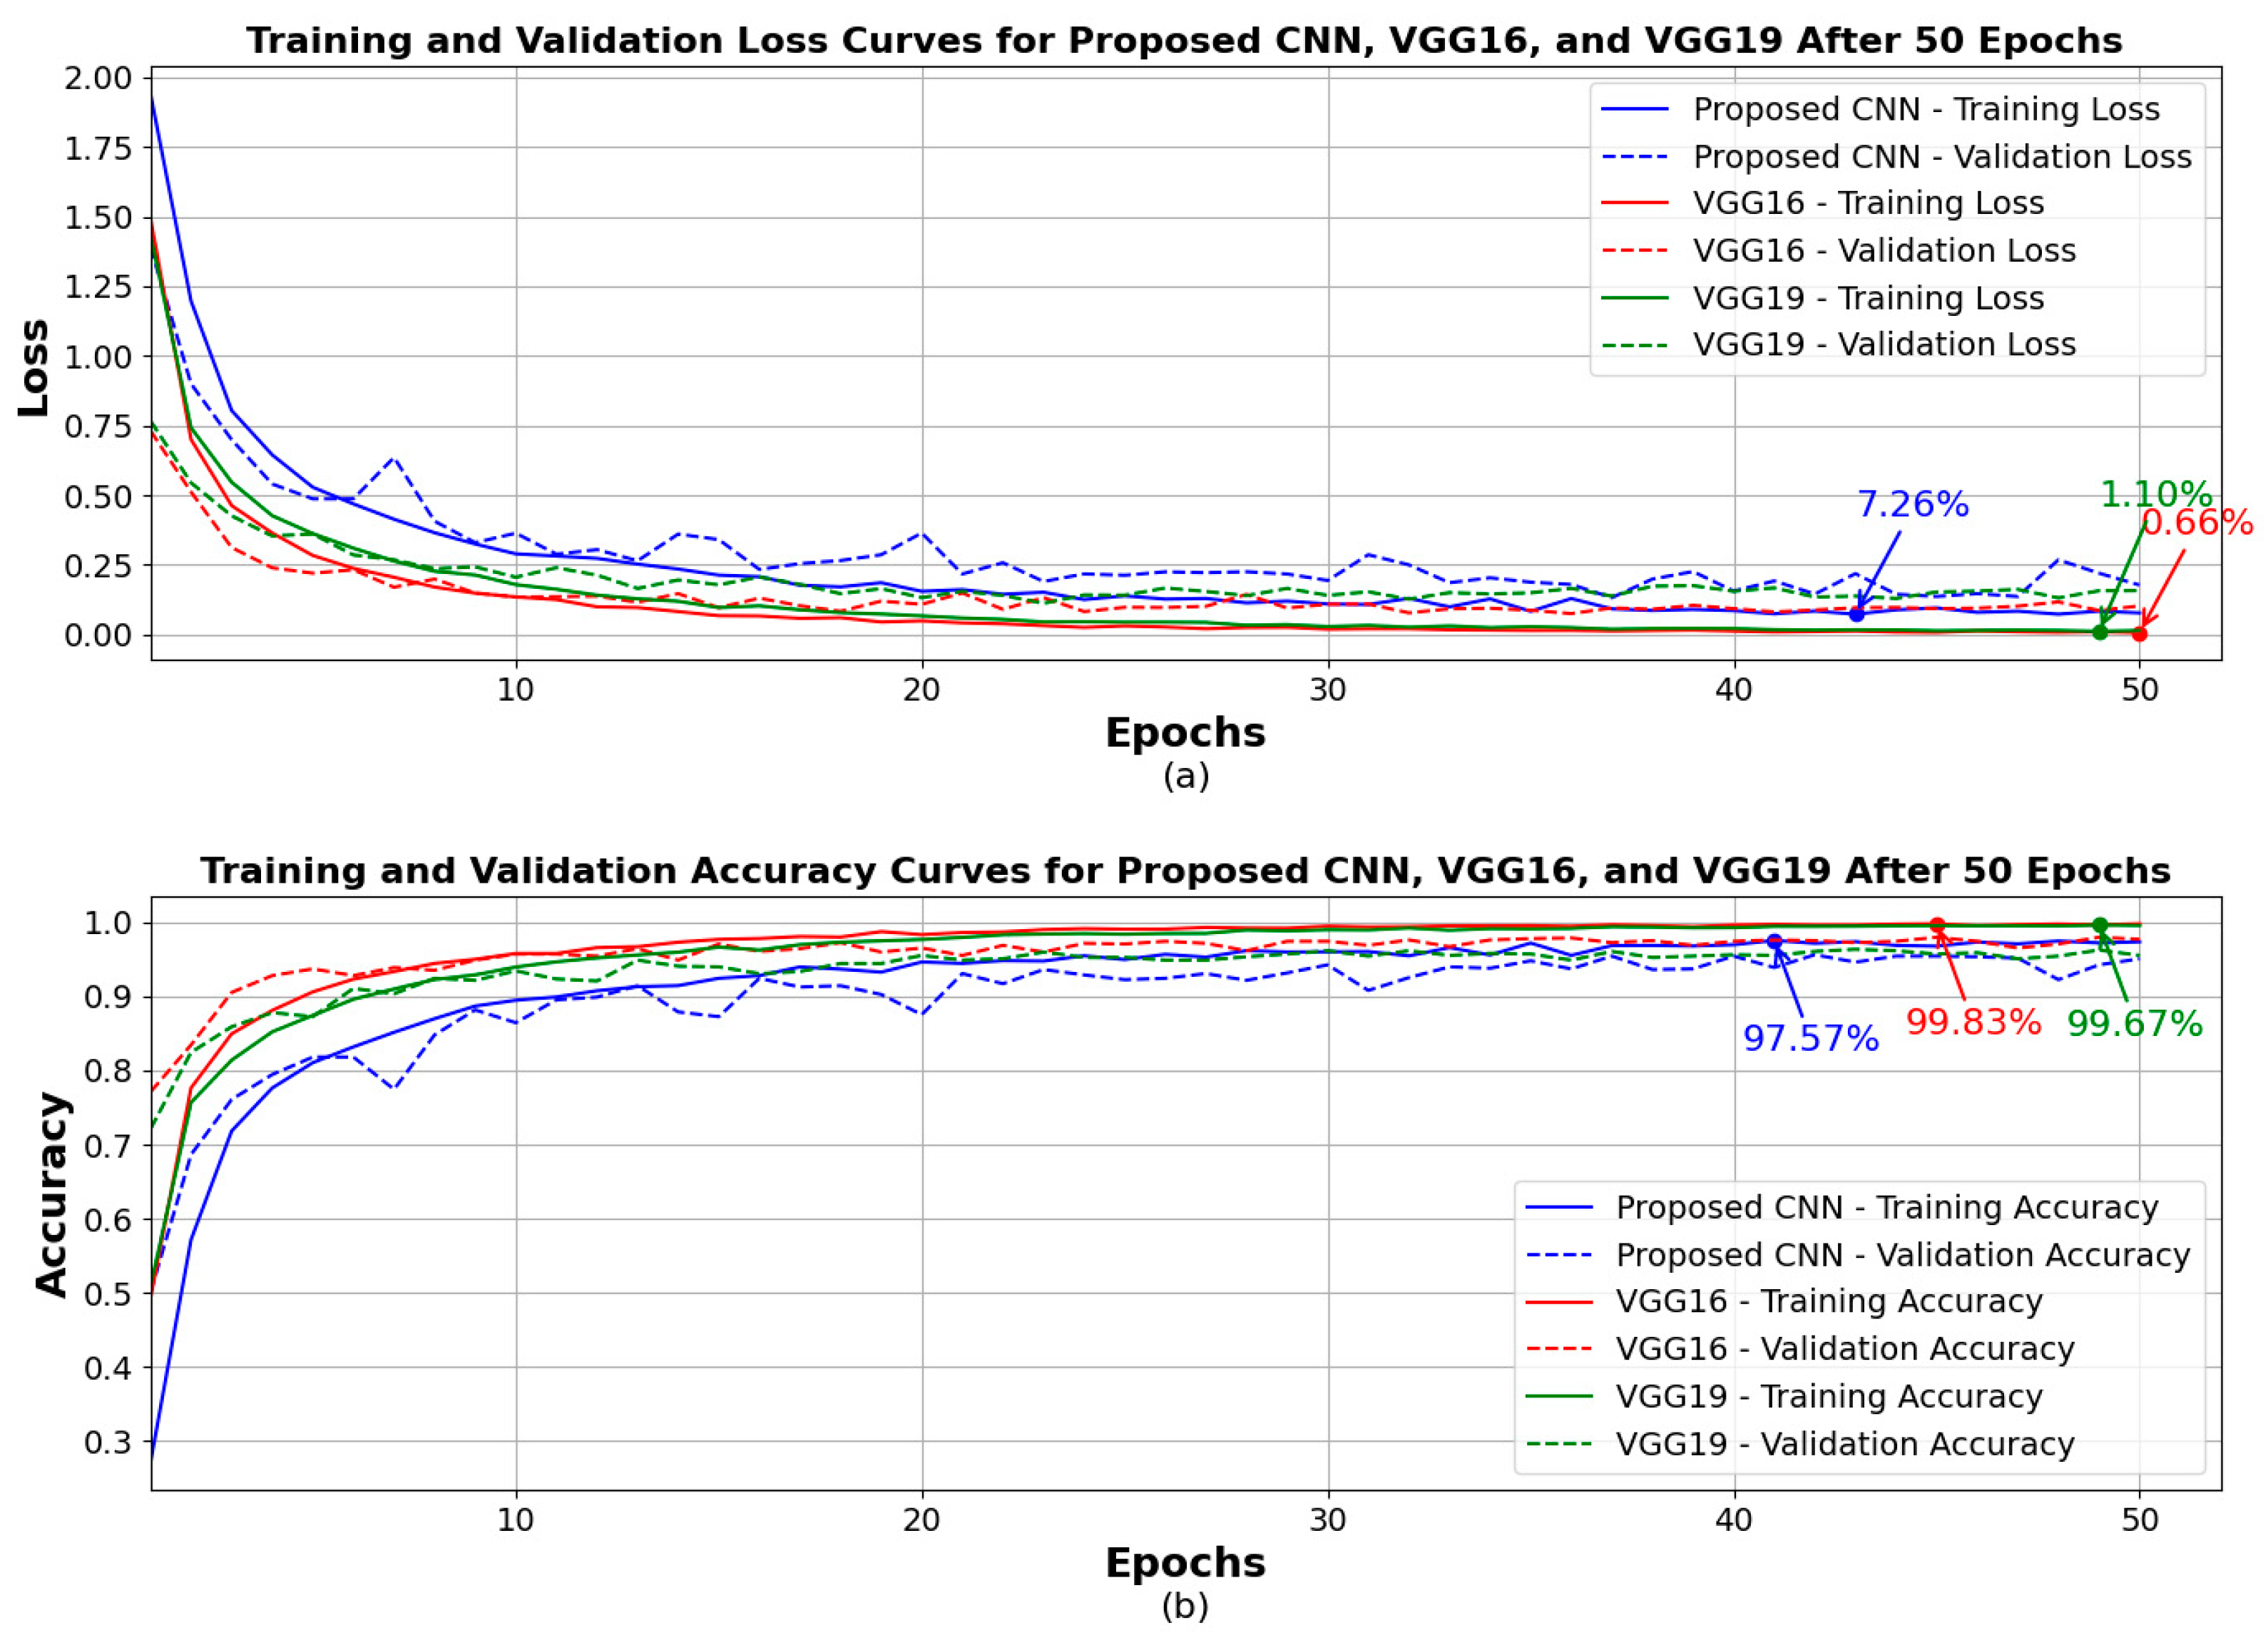
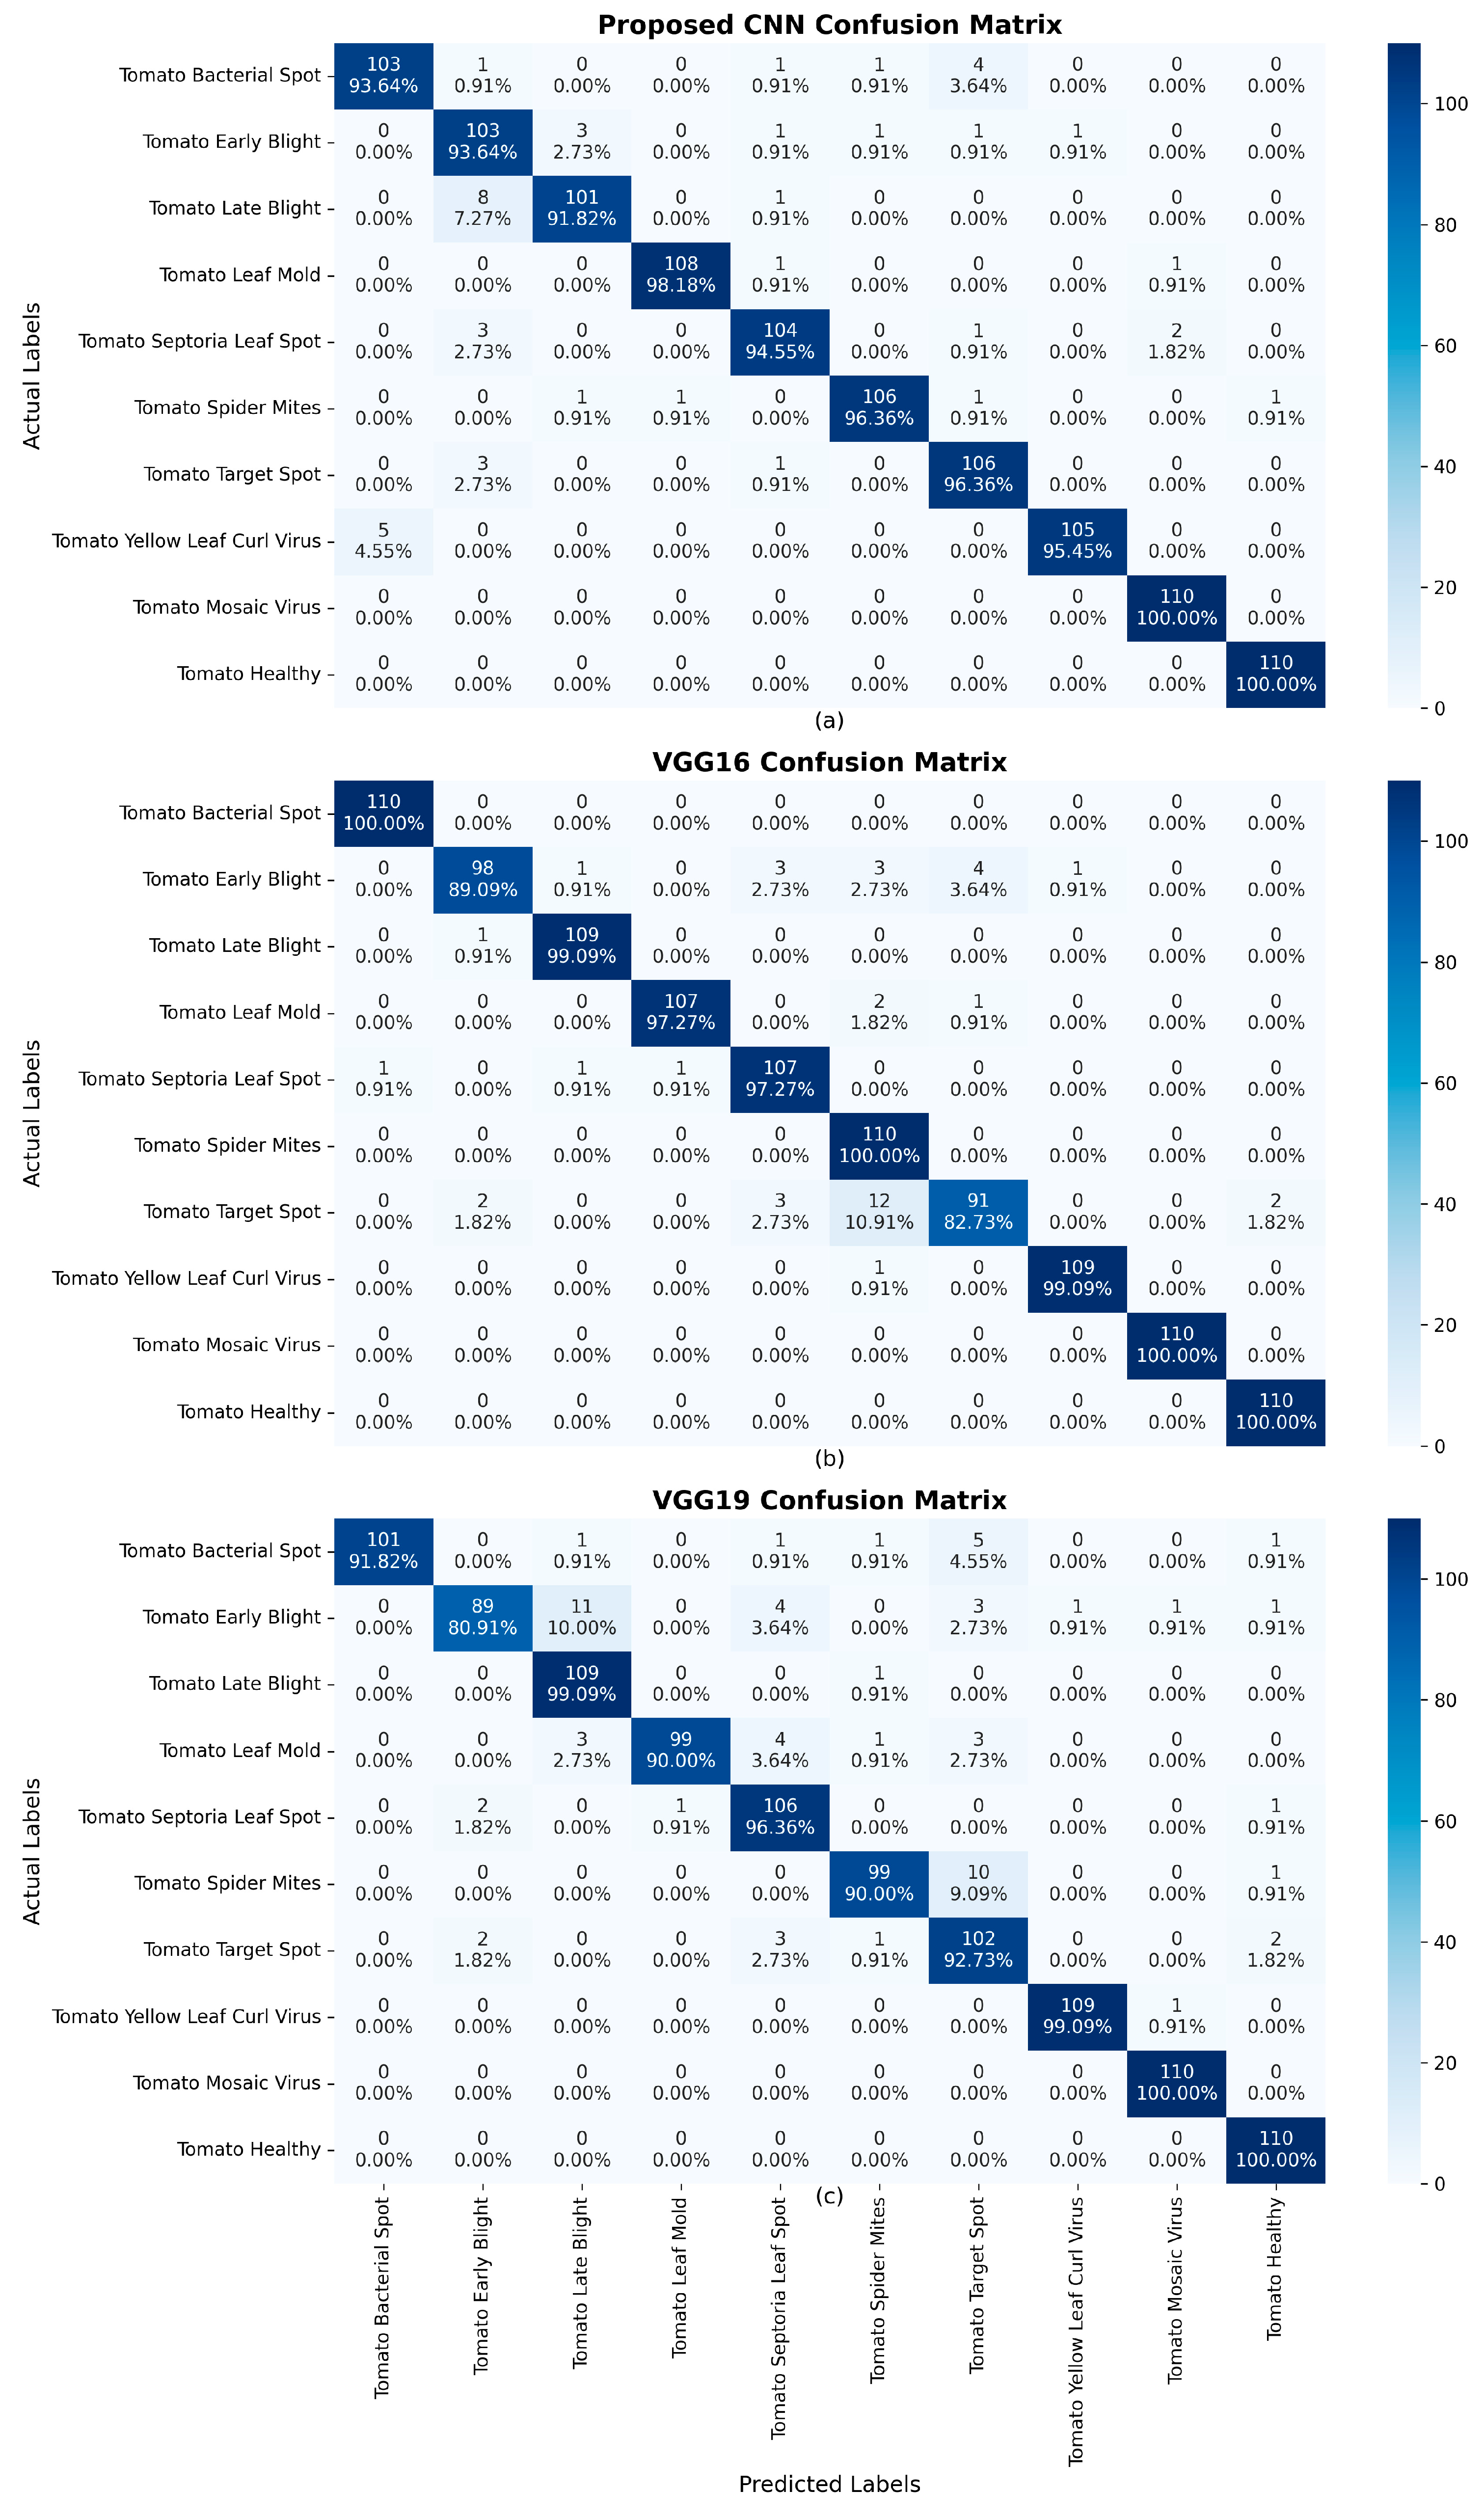
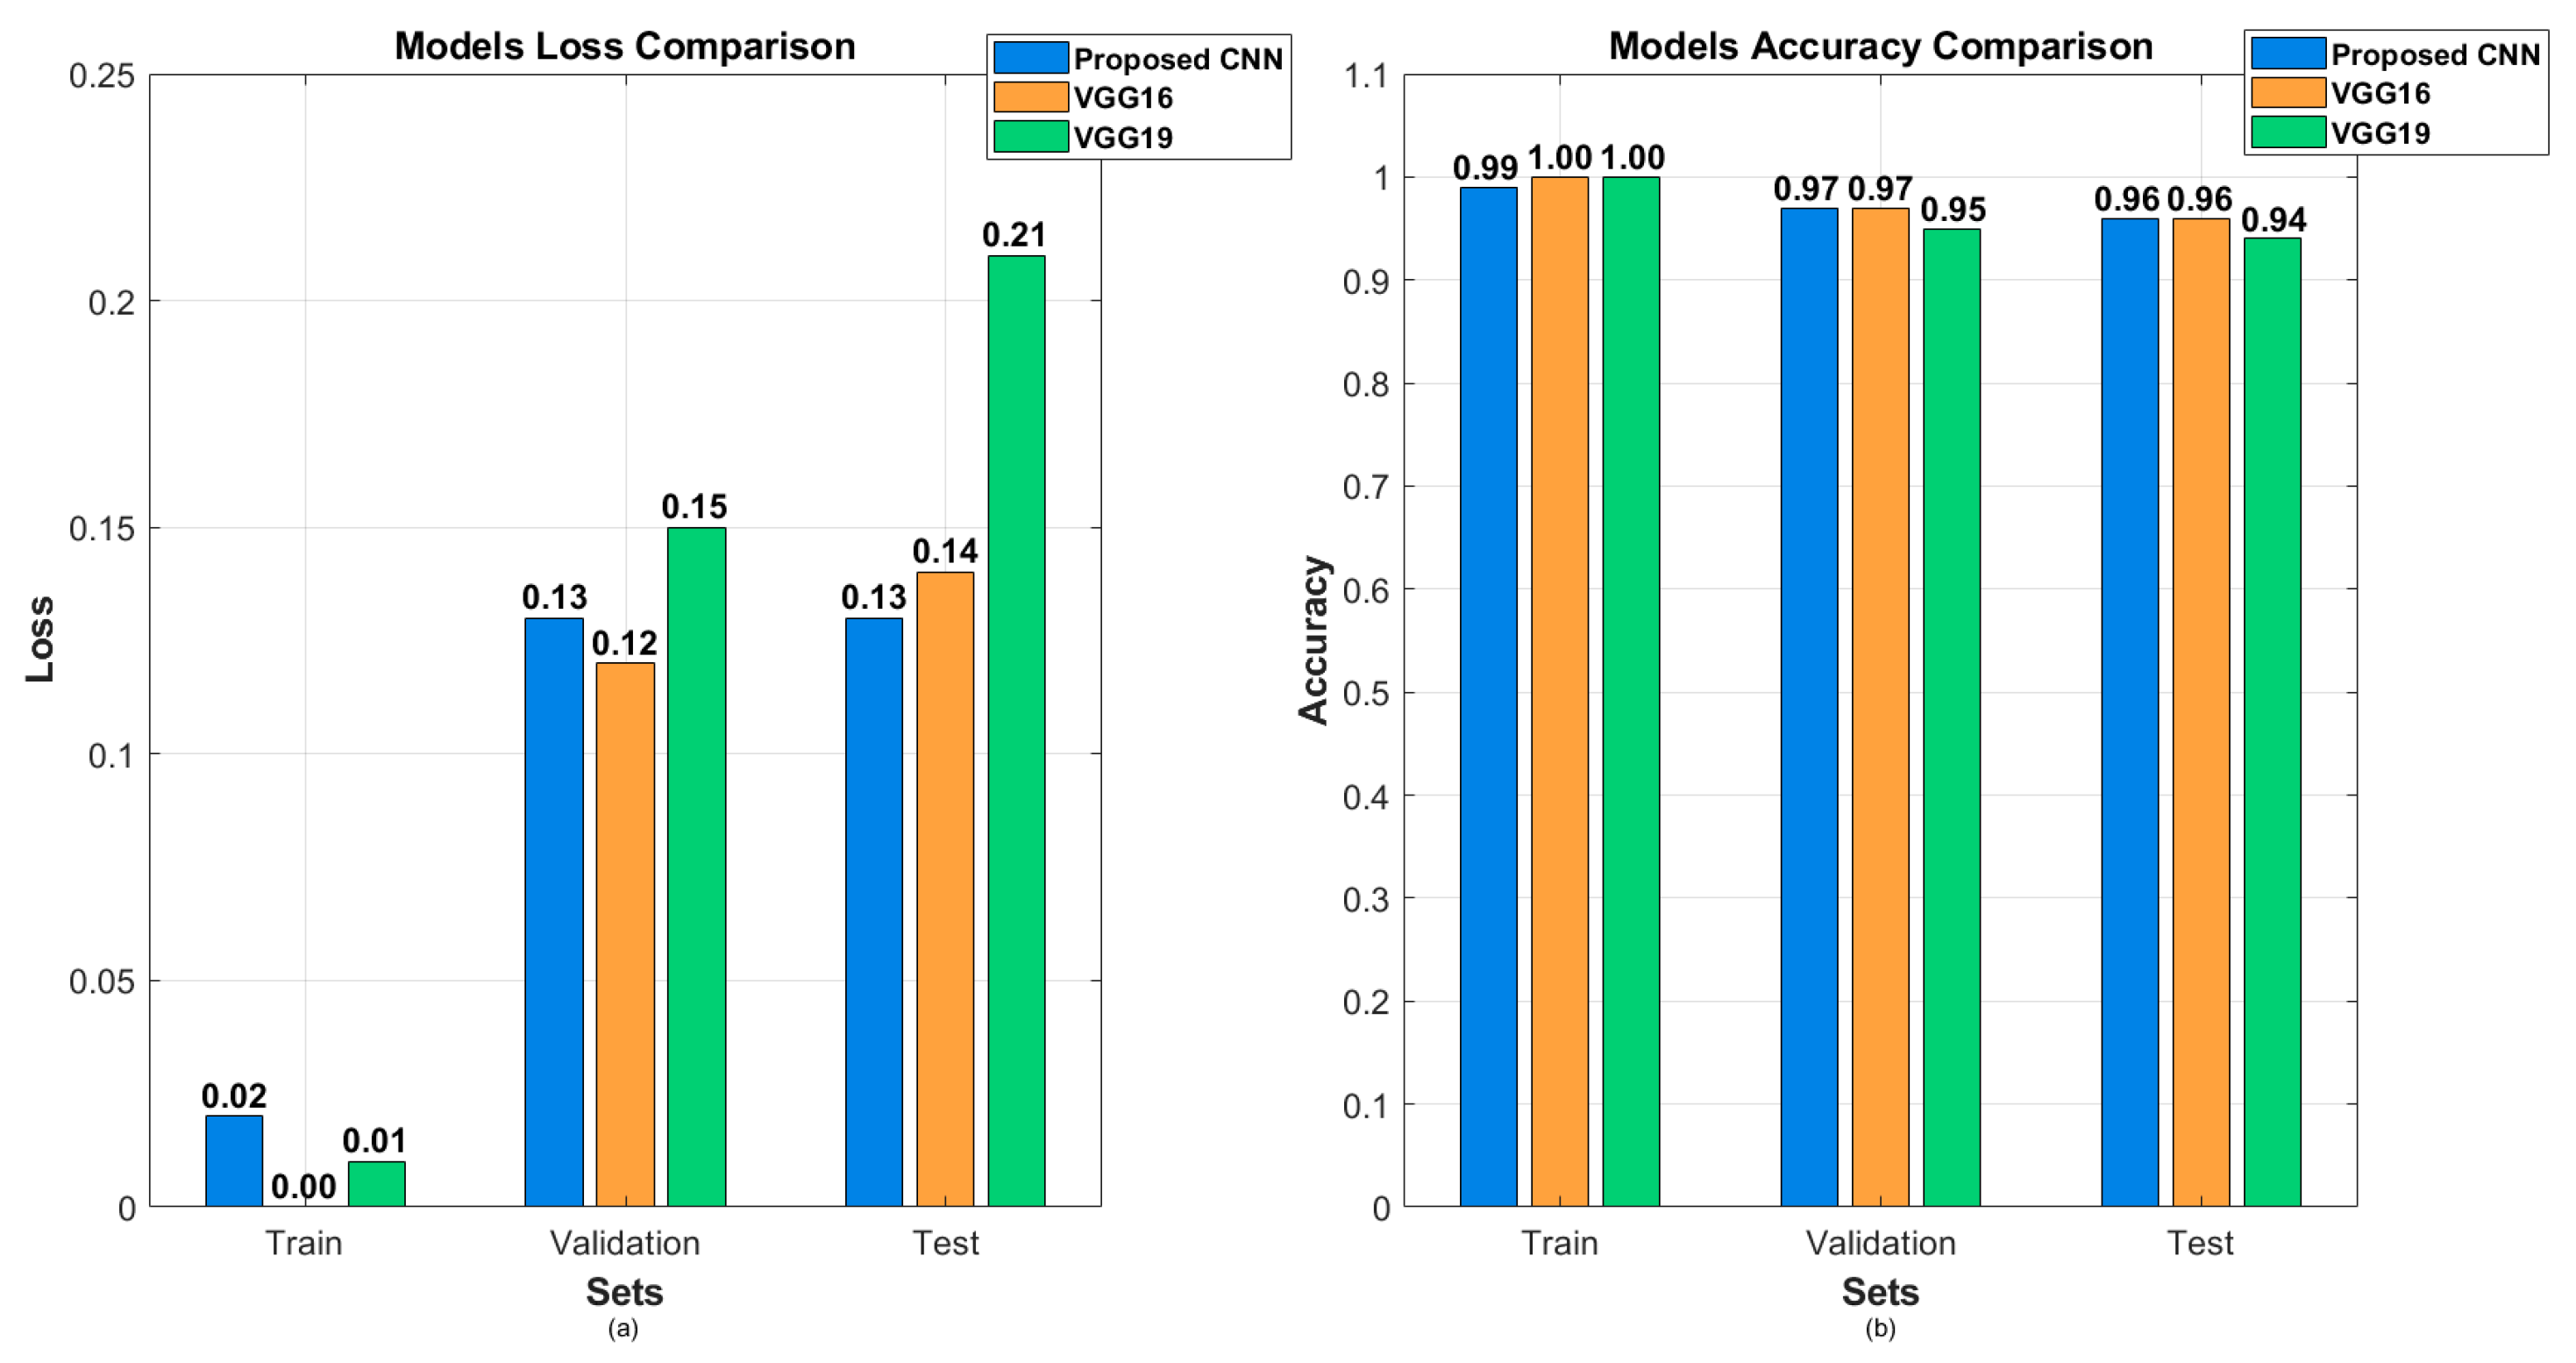
  • Performance evaluation: Evaluate the performance of the proposed CNN, VGG16, and VGG19 models and compare their performance metrics.
The structure of the remainder of the paper is as follows: Section 2 provides an overview of the latest ML approaches for tomato leaf disease detection, along with the technologies and dataset utilized in this study. Section 3 covers both the proposed and existing CNN models employed in the research, along with the methodology implemented. Section 4 presents the evaluation results of all models, while Section 5 discusses the real-world implementation of the proposed model in a tomato garden, highlighting key findings and insights. Section 6 summarizes the main contributions and advantages of the proposed approach in comparison to related research. Finally, Section 7 concludes the paper.

2. State of the Art

2.1. Machine Learning in Tomato Leaf Disease Detection

Many research activities focus on using ML techniques for detecting plant diseases and numerous studies have been conducted exploring various algorithms and methodologies to improve the accuracy and efficiency of disease detection in tomato leaves, reinforcing the potential of ML and DL for agricultural disease detection [3,4,5,6,7,8,9,10,11,12,13,14].
Tang et al. developed a machine learning model, based on perceptual adaptive convolution (PAC) backbone, location reinforcement attention mechanism (LRAM) and proximity feature aggregation network (PFAN), named PLPNet, to detect five common diseases affecting tomato leaves [3]. The model was trained using a curated dataset comprising 3524 images from the PlantVillage dataset and an additional 1909 images sourced from the internet. After training, PLPNet achieved a mean average precision (mAP) of 94.5% at a 50% threshold (mAP50), an average recall (AR) of 54.4%, and processed images at a speed of 25.45 frames per second (FPS). Nawaz et al. developed a model to detect and classify various diseases in tomato plant leaves [4]. The model was trained on the PlantVillage dataset from Kaggle, which contains images of tomato leaves categorized into 10 classes (9 disease categories and 1 healthy category). The proposed method achieved a mAP of 0.981 and an accuracy of 99.97%, with a test time of 0.23 s per image. The study utilized the ResNet-34 architecture with a convolutional block attention module (CBAM) as a feature extractor within the faster region-based convolutional neural network (FR-CNN) framework. This combination enhanced the model’s ability to focus on relevant features, improving disease localization and classification. The authors applied image annotation to specify regions of interest and employed data augmentation techniques to increase the robustness of the model, too. These preprocessing steps contributed to the model’s high performance in accurately identifying and localizing tomato leaf diseases. The authors developed the LDAMNet model for the classification and recognition of tomato leaf diseases in [5]. The model was trained on the Plant Disease Classification Merged Dataset from Kaggle, which contains tomato leaves categorized into 10 classes (9 disease categories and 1 healthy category). In addition, it was also enhanced using a piecewise linear transformation method and oversampling techniques to address issues of imbalanced data and unclear disease features. LDAMNet incorporates a convolutional block with a dual attention mechanism, which utilizes hybrid channel attention (HCA) and coordinate space attention (CSA) to process channel and spatial information of input images, respectively. This design enhances the model’s feature extraction capabilities. Additionally, a robust cross-entropy (RCE) loss function was employed to mitigate the impact of noisy labels during training. Experimental results demonstrate that LDAMNet achieved an average recognition accuracy of 98.71% on the tomato disease dataset. The model also exhibited strong recognition capabilities on rice crop disease datasets, indicating good generalization performance across different crops. Kahn et al. propose a system to identify nine distinct tomato leaf diseases using PlantVillage dataset from Kaggle [6]. The model utilized a support vector machine (SVM) classifier, leveraging features extracted through gray level co-occurrence matrix (GLCM) and scale-invariant feature transform (SIFT) techniques. The dataset comprised 2700 images, with at least 300 images per disease class. The proposed approach compared against several deep learning models and achieved an accuracy of 92.3% in classifying the various diseases. An automated system to identify various diseases affecting tomato plants is presented in [7]. The model utilized the EfficientNetV2B2 architecture, enhanced with transfer learning and an additional dense layer of 256 nodes, and achieved an average weighted training accuracy of 99.02%, validation accuracy of 99.22%, and test accuracy of 98.96% using a five-fold cross-validation method. The model was deployed as a smartphone and web application, enabling users to accurately diagnose tomato leaf diseases in real-time. Attallah developed a deep learning model to identify and classify various diseases affecting tomato leaves [8]. The model was trained on the Kaustubh B. Tomato Leaf Disease Detection 2020 dataset comprising images of tomato leaves, both healthy and diseased, sourced from the PlantVillage dataset. A CNN architecture for the classification task was employed and the CNN model was trained using the Adam optimizer with a learning rate of 0.001 and a batch size of 32. Data augmentation techniques, such as rotation, scaling, and flipping, were applied to increase the diversity of the training data and improve model’s robustness. The model’s performance was evaluated by using metrics such as accuracy, precision, recall, and F1 score. The CNN model achieved an accuracy of 98.95% on the test set, demonstrating its effectiveness in classifying tomato leaf diseases. Another CNN model for tomato leaf diseases’ identification and classification is presented in [9]. The dataset used in this research was a compilation of publicly accessible datasets from Kaggle, comprising 14,531 images across 10 different classes. The proposed two-dimensional CNN model included two max-pooling layers and a fully connected layer. Experimental results demonstrate that this model achieved an accuracy of 96% in detecting and classifying tomato leaf diseases. The study also compared the performance of the CNN model with other classification models such as SVM, VGG16, Inception V3, and MobileNet, highlighting the effectiveness of the CNN approach in this context. A neural network-based model to detect early-stage diseases in tomato plants is presented by Guerrero-Ibañez and Reyes-Muñoz in [10]. A CNN was designed for classification, balancing accuracy and computational efficiency for real-time applications. The model was trained on a dataset comprising images of tomato leaves, both healthy and diseased, collected under various environmental conditions to ensure robustness, while data augmentation techniques like rotation, scaling, and flipping were applied to enhance model generalization. The CNN achieved 98.3% accuracy on the test set. It was also assessed through metrics including precision, recall, and F1 score, to ensure reliable disease detection. Hossain et al. demonstrate the effectiveness of deep convolutional neural networks (DCNN) in tomato leaf disease detection by exploring various preprocessing techniques and applying different filtering methods and color models to identify the optimal combination that enhances classification accuracy [11]. TomatoDet, a novel approach for tomato disease detection in complex agricultural environments, is presented in [12]. The authors integrate Swin-DDETR’s self-attention mechanism, the Meta-ACON activation function, and an improved bidirectional weighted feature pyramid network in their model, which achieves a mAP of 92.3% and a detection speed of 46.6 FPS. Another study compares Fuzzy-SVM, CNN, and R-CNN classifiers, to evaluate their effectiveness in classifying six tomato diseases and healthy samples [13]. By using advanced image processing techniques for feature extraction and segmentation, the R-CNN-based classifier achieves the highest accuracy of 96.735%. Trivedi et al. propose another CNN model that effectively identifies and classifies nine tomato diseases and healthy leaves, by using a dataset of 3000 images and achieving 98.49% accuracy [14].

2.2. Technologies and Dataset Used

Graphics processing units (GPUs) have become an essential component in the field of machine learning, particularly for tasks involving deep learning and large-scale data processing. In our study, we used the GPU from NVIDIA and accompanying tools such as the compute unified device architecture (CUDA) toolkit to develop the proposed CNN [15]. The CUDA toolkit v.12.8 is a suite of software development tools and libraries, such as the CUDA deep neural network (CuDNN) library, that allow developers to exploit the power of NVIDIA GPUs for parallel computing tasks. In our case, we used the CUDA toolkit to train and run machine learning models for the identification and classification of tomato leaf diseases.
We used Python v.3.13.1 programming language, which enables the fast development of sophisticated machine learning models and simplifies the complex task of image handling through its extensive set of tools and libraries. In particular, we used the OpenCV and Pandas libraries to load, resize, and transform images of tomato leaves, making them suitable for the training process [16,17]. The Keras library enabled the easy adaptation of the Visual Geometry Group 16 and 19 (VGG16 and VGG19, respectively) pre-trained models, speeding up the training process while maintaining accuracy. To increase the strength of the model, libraries such as NumPy, Albumentations, and ImageDataGenerator were also used for enriching the dataset by applying transformations like rotation, scaling, and flipping [18,19]. After training, we used Scikitlearn and Matplotlib v.3.10.1 libraries to evaluate the performance of the models [20,21].
CuDNN integrates seamlessly with popular ML frameworks such as the TensorFlow. TensorFlow, developed by Google, is a powerful open-source framework that offers tools, libraries, and resources for building and deploying ML applications [22]. In our case, we used TensorFlow to develop the proposed CNN architecture tailored for image classification tasks. The code repository is available at Github [23] under MIT license.
The tomato leaves dataset used is available in Kaggle [24]. This dataset contains about 11,000 images of tomato leaves, categorized into ten different classes, each representing a specific type of disease. Each class contains about 1100 images depicting symptoms of the respective disease. All disease types are shown in Figure 1, in accordance to the list below:
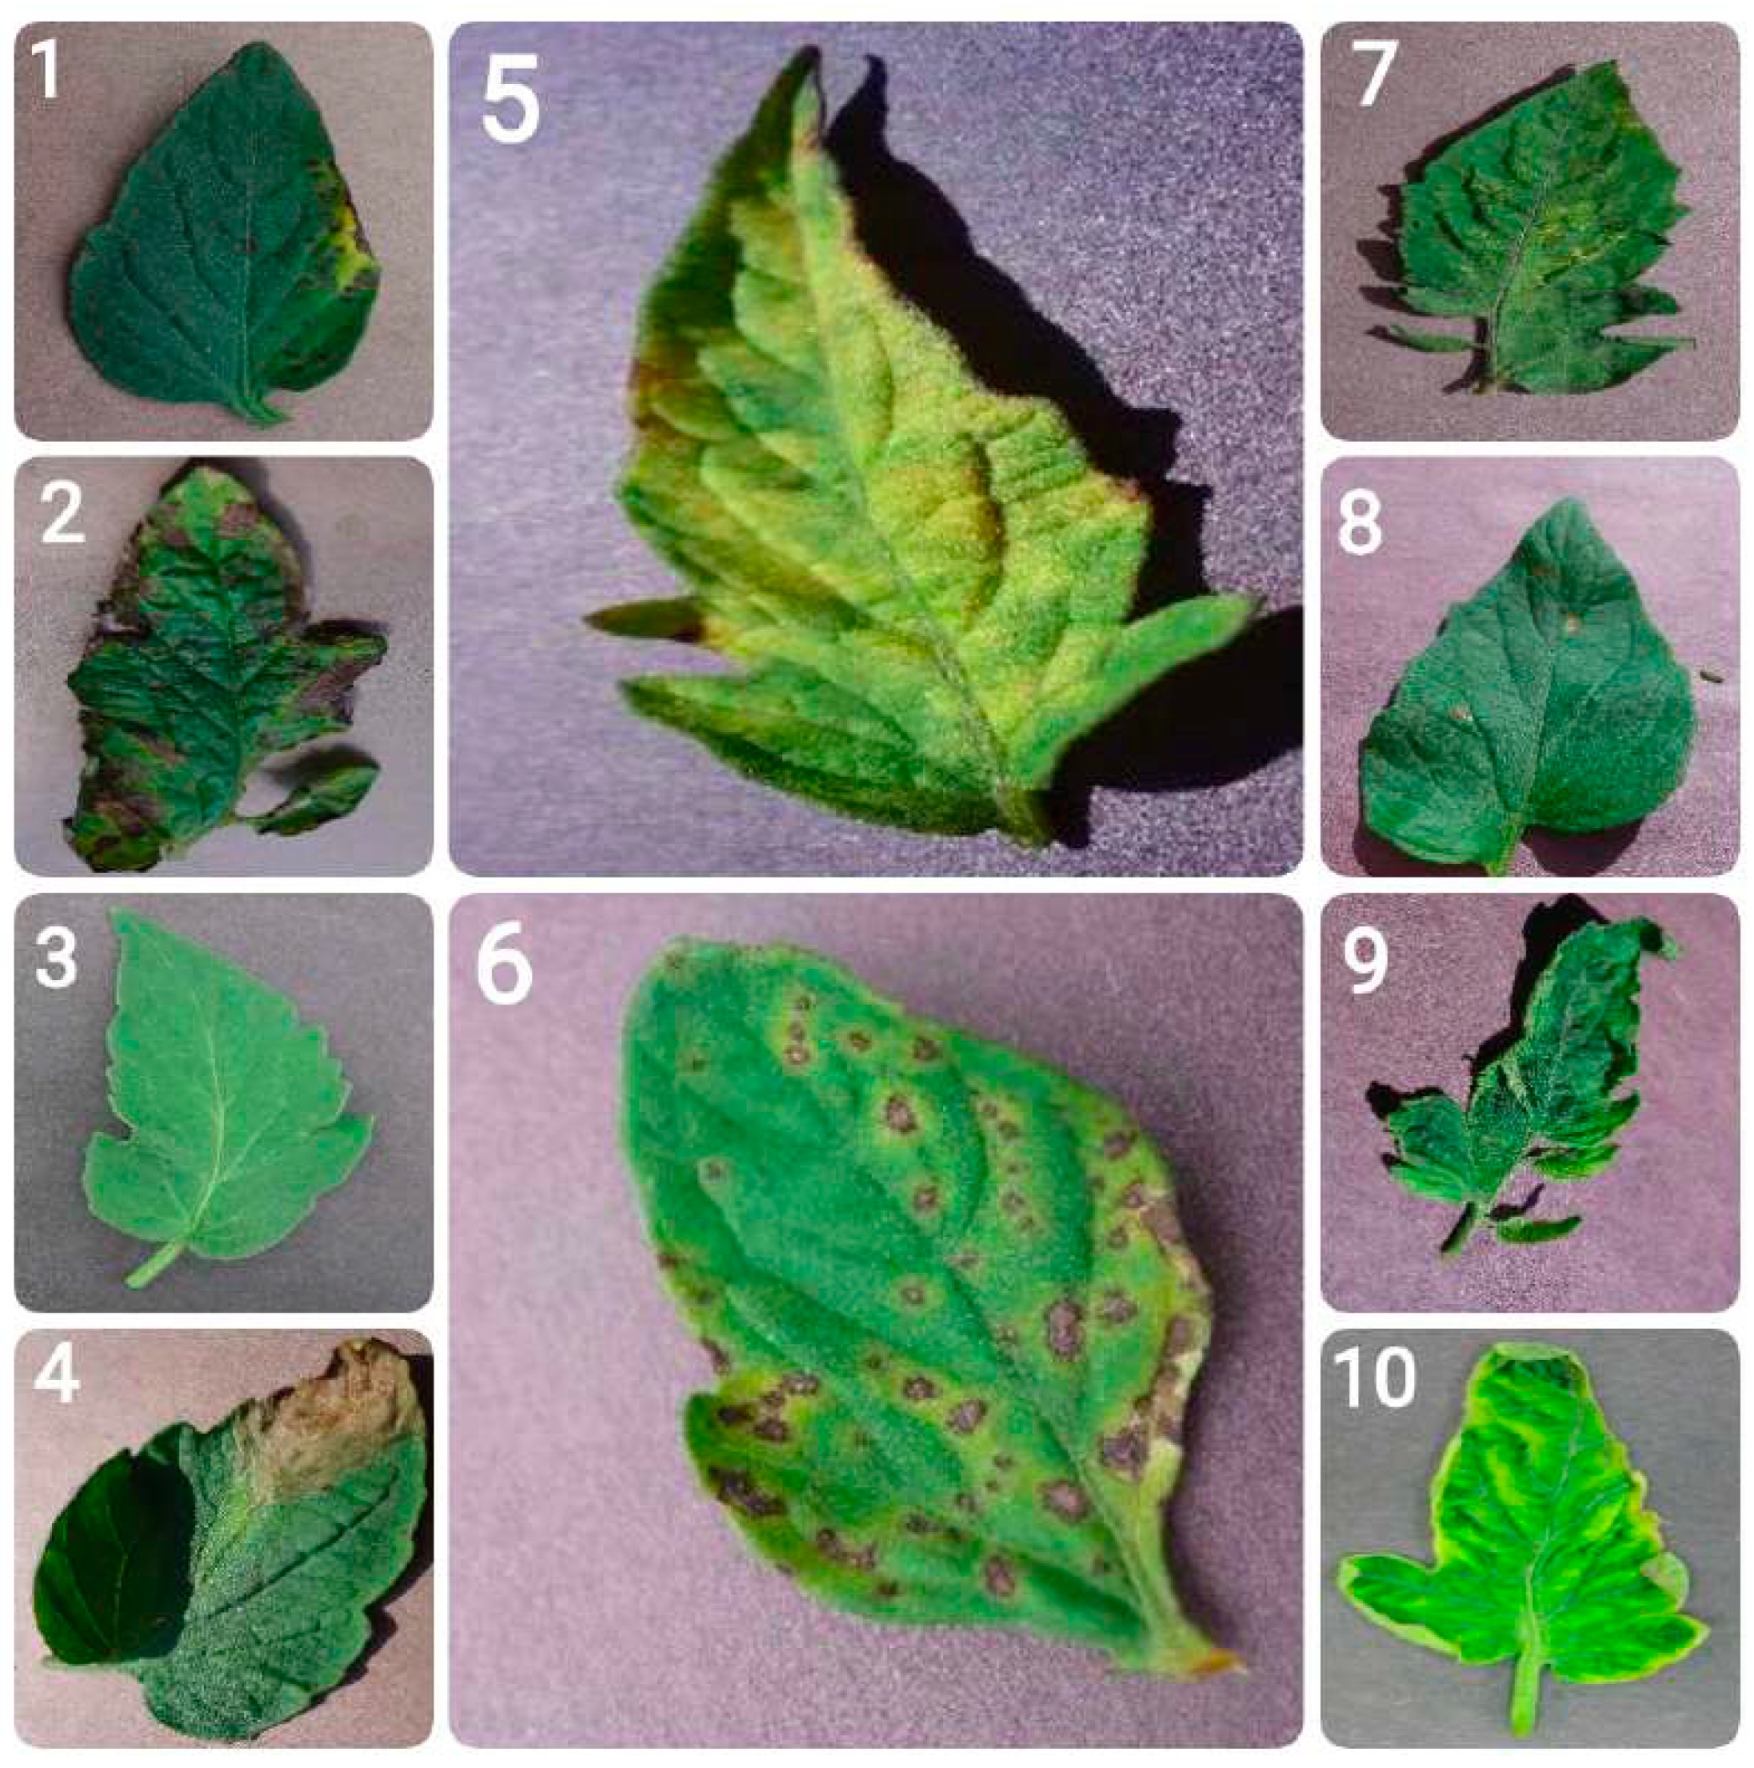
  • Bacterial spot: Bacterial spot is caused by the bacterium Xanthomonas campestris pv. vesicatoria, and appears as small, water-soaked spots on leaves. Over time, these spots turn brown and necrotic. In severe cases, the infection can result in leaf drop and reduced fruit quality.
  • Early blight: Early blight, caused by the fungus Alternaria solani, is marked by the appearance of concentric rings resembling a ”bullseye” pattern on older leaves. It typically begins as small, dark spots and can result in extensive defoliation, impairing the plant’s ability to carry out photosynthesis.
  • Healthy leaves: Tomato leaves in good health exhibit a vibrant green color with a smooth and uniform texture. They show no signs of spots, lesions, discoloration, or pest presence. They are free from wilting or deformities, reflecting proper plant care and maintenance.
  • Late blight: This destructive disease, caused by the oomycete Phytophthora infestans, can affect all parts of the tomato plant. It appears as water-soaked lesions that rapidly turn brown and under conditions favorable to the pathogen can lead to the plant’s total collapse.
  • Leaf mold: Caused by the fungus Passalora fulva, leaf mold is characterized by yellow spots on the upper surface of leaves and a velvety, olive-green mold on the underside. It thrives in high humidity conditions and can significantly hinder the plant’s ability to photosynthesize.
  • Septoria leaf spot: This disease, caused by the fungus Septoria lycopersici, is characterized by small, round spots with dark borders and grayish centers. It mainly affects the lower leaves and often leads to premature defoliation.
  • Spider mites (two-spotted spider mite): The two-spotted spider mite, Tetranychus urticae, feeds on leaves, causing stippling and a bronzed appearance. In cases of severe infestation, webbing may form, leading to extensive leaf damage and affecting the plant’s strength overall.
  • Target spot: Caused by the fungus Corynespora cassiicola, target spot presents as small, water-soaked spots that enlarge into concentric rings with a pale center. It can lead to leaf drop and reduced plant productivity.
  • Tomato mosaic virus: This virus causes mottled or mosaic patterns on leaves, along with leaf distortion and reduced fruit quality. It spreads through infected tools, seeds, and human handling.
  • Tomato yellow leaf curl virus: This disease, caused by the whitefly Bemisia tabaci, leads to upward curling and yellowing of leaves, stunted plant growth, and reduced fruit production.
To build a comprehensive dataset that includes training, validation, and testing sets, we split the given dataset into three distinct subsets:
  • Training set (80%): This is the primary dataset used to train the model. This set should be large enough to allow the model to learn the underlying patterns. It consists of a large number of labeled images that the model uses to learn the features and patterns associated with each class. The model’s parameters are adjusted based on this data to minimize the errors in predictions.
  • Validation set (10%): This subset of the dataset is used to evaluate the model’s performance during the training process. It is used to fine-tune the model’s parameters and make decisions about changes in the model architecture. For example, changes are necessary in case of overfitting or underfitting [25]. Overfitting occurs when the model performs well on the training data but poorly on unseen data. It suggests that the model has learned the specific patterns of the training set but not general patterns. Underfitting occurs when the model performs poorly on both training and unseen data. It suggests that the model is too simple to capture the underlying patterns in the data.
  • Testing set (10%): This part of the dataset is used for the final evaluation of the model after it has been trained and validated. If the model performs well on the test set, it suggests that the model has learned effectively and can make accurate predictions on new data. Conversely, if there is a significant drop in performance on the test set compared to the training and validation sets, it may indicate that the model has overfitted the training data.
It is common practice to split the dataset in this proportion, that is, 80% of the images for training and 20% (split equally) for validation and testing experiments in order to ensure that the model is trained on a diverse set of data and validated on enough patterns [26]. The test set is completely separate from both the training and validation sets and it is only used once at the end to provide a reliable assessment of the model’s performance.

3. Design and Methodology

Our proposed CNN model was developed from scratch and consists of multiple layers. Each layer progressively learns more complex features from the input images. A short description for each layer of the proposed CNN model follows:
First convolutional layer: The first convolutional layer focuses on extracting basic features like edges, shapes, and boundaries. At this stage, the model might detect edges around the tomato leaf, identifying the basic outline of the leaf, veins, or any color shifts that may indicate disease spots.
Second convolutional layer: As the model progresses, it starts to identify more complex patterns. The second convolutional layer might now detect specific patterns related to diseases, such as discolored spots, mold growth, or leaf deformation, which are more subtle and intricate features compared to simple edges.
Third convolutional layer: By the third layer, the model becomes capable of differentiating between more specific features, such as small lesions or subtle color differences associated with distinct tomato diseases. It starts identifying specific patterns that are crucial for differentiating between disease classes.
Fourth convolutional layer: At this stage, the model is capable of recognizing textures such as fungal growth or bacterial clusters, which serve as key indicators for specific tomato diseases. As the features grow more intricate, the model becomes proficient at managing patterns unique to each disease.
Fifth convolutional layer: The fifth convolutional layer may focus on disease-specific patterns like viral spots, leaf necrosis, or distinct fungal growth. At this point, the model has developed a clear ability to distinguish between different types of damage or disease symptoms in the leaves.
Sixth convolutional layer: By the final convolutional layer, the model is fine-tuning its analysis of highly detailed and disease-specific features, such as the exact shape, color variation of lesions, or the spread of fungal infections. The CNN is now prepared to make classifications into the various diseases.
Pooling layers: Pooling layers reduce the spatial dimensions of the output from the previous layers. They help to make the detection of features invariant to scale and orientation changes. Typically, a pooling layer is added after one or more convolutional layers.
Flattening and dense layers: After extracting features through the convolutional layers, the model flattens the output into a one-dimensional vector. These flattened data are then fed into dense, fully connected layers, which enable the model to make precise predictions and classify tomato leaves into ten distinct classes, each representing a specific disease or condition.
As described above and depicted in Figure 2, the proposed CNN model utilizes six convolutional layers with increasing complexity to extract hierarchical features from tomato leaf images. The 3 × 3 kernel size was chosen based on empirical results; smaller kernels (e.g., 1 × 1) were too localized, missing broader patterns, while larger ones (e.g., 5 × 5) led to overfitting without significantly improving feature extraction. The increasing number of filters (32 to 64) allows the network to progressively capture simple edges and textures in earlier layers and more complex disease-specific patterns (e.g., necrotic spots, fungal growth) in deeper layers. We applied MaxPooling 2 × 2 after every convolutional layer to reduce spatial dimensions and retain the most important features. Experiments show that removing some pooling layers resulted in slower convergence and more noise in feature maps, affecting accuracy. A dense layer, 64 neurons, rectified linear unit (ReLU) activation, serves as a feature aggregator before classification. The final softmax layer (10 neurons) maps extracted features to one of the ten disease categories. Regarding dropout regularization, earlier experiments with dropout rates between 0.3 and 0.5 showed no significant improvement in generalization, since batch normalization and max pooling already provided effective regularization. Regarding optimization, the Adam optimizer was chosen with a learning rate of 0.001 due to its adaptive learning capabilities, outperforming the slower convergence observed with stochastic gradient descent (SGD). Increasing the learning rate (e.g., 0.01) led to instability, whereas decreasing it (e.g., 0.0001) slowed training without noticeable improvements.
In order to evaluate the performance of our proposed CNN model, we compared it against existing pre-trained models. In particular, we fine-tuned the VGG16 and VGG19 pre-trained CNN models to classify tomato leaf diseases [27]. Fine-tuning these models involves adjusting them to the tomato leaf dataset, which is achieved by adding new layers, freezing some pre-trained layers, or both [27]. The decision of using VGG16 and VGG19 models is based on their powerful feature extraction capabilities and popularity in image classification tasks [28,29]. Although the two models differ slightly in depth (VGG16 has 16 layers, while VGG19 has 19), the overall approach of fine-tuning them was consistent. In particular:
  • We loaded the pre-trained VGG16 and VGG19 models, excluding their top (fully connected) layers.
  • The first layers of both models were frozen to retain their feature extraction capabilities while adapting to the new dataset.
  • New layers were added on top of each base model, including fully connected layers, a dropout layer to prevent overfitting, and the final output layer to classify the tomato leaves.
This fine-tuning approach allowed both models to deal with the disease-specific patterns within the tomato leaves, without losing their generic feature-extraction capabilities. The same architecture and methodology were applied to both models, ensuring consistency in our experiments. Finally, we opted against fine-tuning more advanced, although robust, architectures, such as ResNet, EfficientNet, or MobileNet. This decision was driven by several critical factors, including computational efficiency, hardware limitations, dataset constraints, and the overall complexity of the training process against our proposed CNN model [30].

4. Results

Table 1 summarizes the average values achieved in critical evaluation metrics regarding performance and reliability of predictions of each model, i.e., accuracy, loss, precision, recall, and F1 score, across 110 images per class, spanning 10 classes.
A first observation is that the proposed CNN and VGG16 are the top-performing models, each achieving an overall 96% average across all results per category. Despite being a deeper model with more convolutional layers, VGG19 lags behind by 2%, highlighting an important insight: that a deeper architecture does not necessarily guarantee better performance. Instead, factors such as parameter tuning and model optimization play a more decisive role.
Additionally, the table presents results for a model ensemble, where we combined all three models, leveraging their individual strengths. This ensemble approach significantly improves performance, achieving 98% accuracy, precision, recall, and F1 score. This finding is noteworthy, as such an approach has not been extensively explored in previous studies presented in Section 2.
Statistical analysis with analysis of variance (ANOVA) test was also used to determine whether observed variations in models’ accuracy are due to random fluctuations or represent meaningful, i.e., statistically significant, differences in performance metrics. The hypotheses for our ANOVA test were as follows:
Null Hypothesis (H0): All three models perform equally well (i.e., proposed CNN accuracy = VGG16 accuracy = VGG19 accuracy), and any observed differences are due to chance.
Alternative Hypothesis (H1): At least one model exhibits a statistically significant difference in accuracy.
To test the above hypotheses, we performed the ANOVA analysis at the 50th epoch, where the maximum accuracy for all models has been observed (as illustrated in Figure 3 with the following results: F-statistic: 4.1918 and p-value: 0.017. Since the p-value is less than 0.05, we can reject the Null Hypothesis and conclude that at least one model exhibits a meaningful performance difference compared to the others.
The confusion matrix depicted in Figure 4 is also crucial in our case, as it provides a detailed breakdown of how well each model classifies different categories, revealing patterns of misclassification that accuracy cannot capture by itself.
By comparing the three confusion matrices in Figure 4, we observe that overall, the proposed CNN model achieves the best classification performance across all classes. The VGG16 model follows closely, with only minor deviations from the proposed CNN, as indicated by the relatively small differences in misclassifications. On average, out of 110 images per class (with 10 belonging to a different category), the proposed CNN classifies approximately 105 images correctly, demonstrating strong predictive capability. However, the other two models show more noticeable classification errors for specific classes. For instance, in VGG16, the “Tomato Target Spot” is correctly classified 91 times, while the remaining 19 images are misclassified, with 12 of them incorrectly assigned to “Tomato Spider Mites” class. A similar issue arises with VGG19 model, where “Tomato Early Blight” is frequently confused with “Tomato Late Blight”, since only 89 images are correctly classified in “Tomato Early Blight”, while 11 are misclassified into “Tomato Late Blight”.
The misclassification patterns observed in the confusion matrices arise due to two primary reasons, i.e., model limitations and inherent similarities between certain disease classes. Most of misclassifications occur in “Tomato Early blight” and “Tomato Target Spot” classes. This issue is prominent in both VGG16 and VGG19 models, whereas the proposed CNN model performs better in classifying these categories. The reason for misclassification of “Tomato Early blight” and “Tomato Target Spot” in the VGG models lies in the architectural similarities between VGG16 and VGG19. VGG19 is an extension of VGG16 with three additional layers. Since both models were fine-tuned identically for a fair comparison with each other and the proposed CNN one, the fact that they both struggle with these two specific classes suggests a limitation of the VGG architecture itself. The comparable performance between VGG16 and VGG19, despite the latter’s increased depth, reinforces the idea that depth alone does not necessarily improve classification performance. To mitigate this issue, further fine-tuning of these models would be necessary to enhance their ability to distinguish between these two classes. Beyond model limitations, we must also consider the inherent similarities between certain disease classes. A closer look at the confusion matrices reveals that “Tomato Early Blight” is frequently misclassified as “Tomato Late Blight”, more so in VGG19 than in VGG16. While the proposed CNN model classifies “Tomato Early Blight” well, it makes errors when categorizing “Tomato Late Blight”, often misclassifying several images (eight out of nine misclassified images) as “Tomato Early Blight”. This pattern suggests a high degree of visual similarity between these two diseases. A manual inspection of the dataset confirms this suspicion, as both diseases share overlapping visual characteristics such as dark, concentric leaf lesions and yellowing around affected areas, making them challenging to differentiate. The same happens with the “Tomato Spider Mites” and “Tomato Target Spot” diseases, since both conditions lead to small, yellow or brown spots on the leaves. “Tomato Target Spot” can sometimes resemble the stippling damage caused by spider mites, especially in early stages. The presence of webbing, which is the main characteristic of spider mites, is the key distinguishing feature, but this may not always be visible in images used for classification.
This issue highlights one of the primary challenges in medical image classification: the resemblance between different diseases and the variations within the same disease. Addressing these classification ambiguities is crucial for improving model performance and ensuring reliable diagnostics.
Figure 3 depicts the behavior of both loss and accuracy of each model during training as well as during validation, too. Regarding the training phase, the primary purpose of this representation visually tracks each model’s learning progress at different stages. The first noticeable pattern is in the loss curves (Figure 3a), where all models exhibit a gradual decline toward zero, an essential criterion for ensuring model reliability. The corresponding accuracy curves for all three models (Figure 3b) show an upward trajectory, approaching 1 (i.e., 100% success), which is another key indicator of a well-performing model.
Beyond monitoring training loss and training accuracy, these figures also depict validation loss and validation accuracy at each epoch. This allows for a more rigorous evaluation of the model’s ability to generalize. A common issue in training deep learning models is overfitting, where a model memorizes training data instead of learning meaningful patterns, which results in performing well on training data, but struggling with unseen ones. By examining validation metrics alongside training metrics, we can detect overfitting early and ensure the model generalizes effectively.
Ideally, the validation curves should closely follow the training curves, with a slight lag, which indicates consistency. This behavior is observed in our results. In the initial epochs, deviations between training and validation curves are observed. However, as training progresses, the loss curves show a downward trend, reaching below 2% for training and around 15% for validation, while accuracy exceeds 99% in training and 96% in validation.
The graph in Figure 5 presents the average loss and accuracy across the training, validation, and test sets for each model. These results align with the training and validation curves in Figure 3, now quantified to provide exact evaluation rates.
Examining the training results, we see that the pre-trained models (i.e., VGG16 and VGG19) achieve slightly higher accuracy, making more correct classifications with greater confidence, as reflected in their lower loss values. This advantage is expected, as these models have been pre-trained on large datasets, allowing them to recognize features more effectively. Our CNN model, while slightly below in training performance, demonstrates a stronger ability to generalize.
This is particularly evident in the validation set, where the proposed CNN shows an increase in accuracy and a decrease in loss, suggesting it adapts well to unseen images. In contrast, VGG19, despite excelling in training, struggles with generalization—leading to higher loss and lower accuracy on validation data.
On the test set, which consists of entirely unseen images of tomato leaves, our CNN model outperforms both pre-trained models in terms of loss, indicating higher confidence in its predictions. VGG16 achieves the highest test accuracy, but with a negligible difference against our CNN (i.e., 96.45% vs. 96.00%). However, the proposed CNN compensates with a 1.01% lower loss (13.00% vs. 14.01%), suggesting it makes more confident classifications.
Further parameters, such as the inference speed and the computational requirements of each model, are also critical and should be taken into account. During training, the proposed CNN model demonstrated notable advantages in memory consumption and thermal efficiency compared to VGG16 and VGG19 architectures. The proposed CNN model needs 1.8 GB of RAM, while both VGG16 and VGG19 models require 33% more, i.e., 2.4 GB of RAM. Furthermore, regarding GPU temperature, the proposed CNN model maintained a stable range of 45–50 °C, ensuring lower hardware strain, while VGG16 and VGG19 models reached 65–70 °C, imposing a heavier computational load and increasing the risk of thermal throttling or long-term hardware degradation. The temperatures were recorded with an external laptop cooling fan to aid heat dissipation, particularly from the GPU. Without additional cooling, these temperatures could be even higher. Given that GPUs typically have a thermal limit of 90 °C, these differences highlight the efficiency of our proposed CNN in managing system resources. Another key advantage of the proposed CNN model is its faster training time per epoch, i.e., 62 s, compared to 80 and 95 s for VGG16 and VGG19, respectively. While the time differences per epoch may seem minor at first glance, they accumulate significantly over multiple training iterations. For instance, over 50 epochs, the proposed CNN reduces training time by approximately 15 min compared to VGG16 and 27.5 min compared to VGG19.
This kind of efficiency makes the proposed CNN model more practical for iterative training and experimentation, particularly for researchers or users with limited computational resources. Additionally, its lower power consumption and reduced heat generation make it a more suitable choice for deployment on resource-constrained environments, such as laptops, mobile devices, or embedded systems.

5. Applying Our Model in a Real-World Tomato Garden

As part of our effort to develop a reliable model for detecting tomato leaf diseases, we collected images from a typical garden environment in Greece, ensuring the dataset reflects real-world conditions. This well-maintained garden provided an excellent setting during the tomato season, allowing us to document a diverse range of tomato leaf conditions for our study. Using a Xiaomi Poco X4 GT smartphone (Changping, Beijing, China), we captured a total of 102 photos, including both diseased and healthy tomato leaves. The photos were taken under different lighting conditions, with 71 captured in the morning and the remaining 31 in the afternoon.
The captured images underwent careful preprocessing to improve the accuracy of disease detection. This step was essential in removing background noise and ensuring the focus remained exclusively on the targeted leaf. We organized the images into three separate folders, each corresponding to the preprocessing techniques applied:
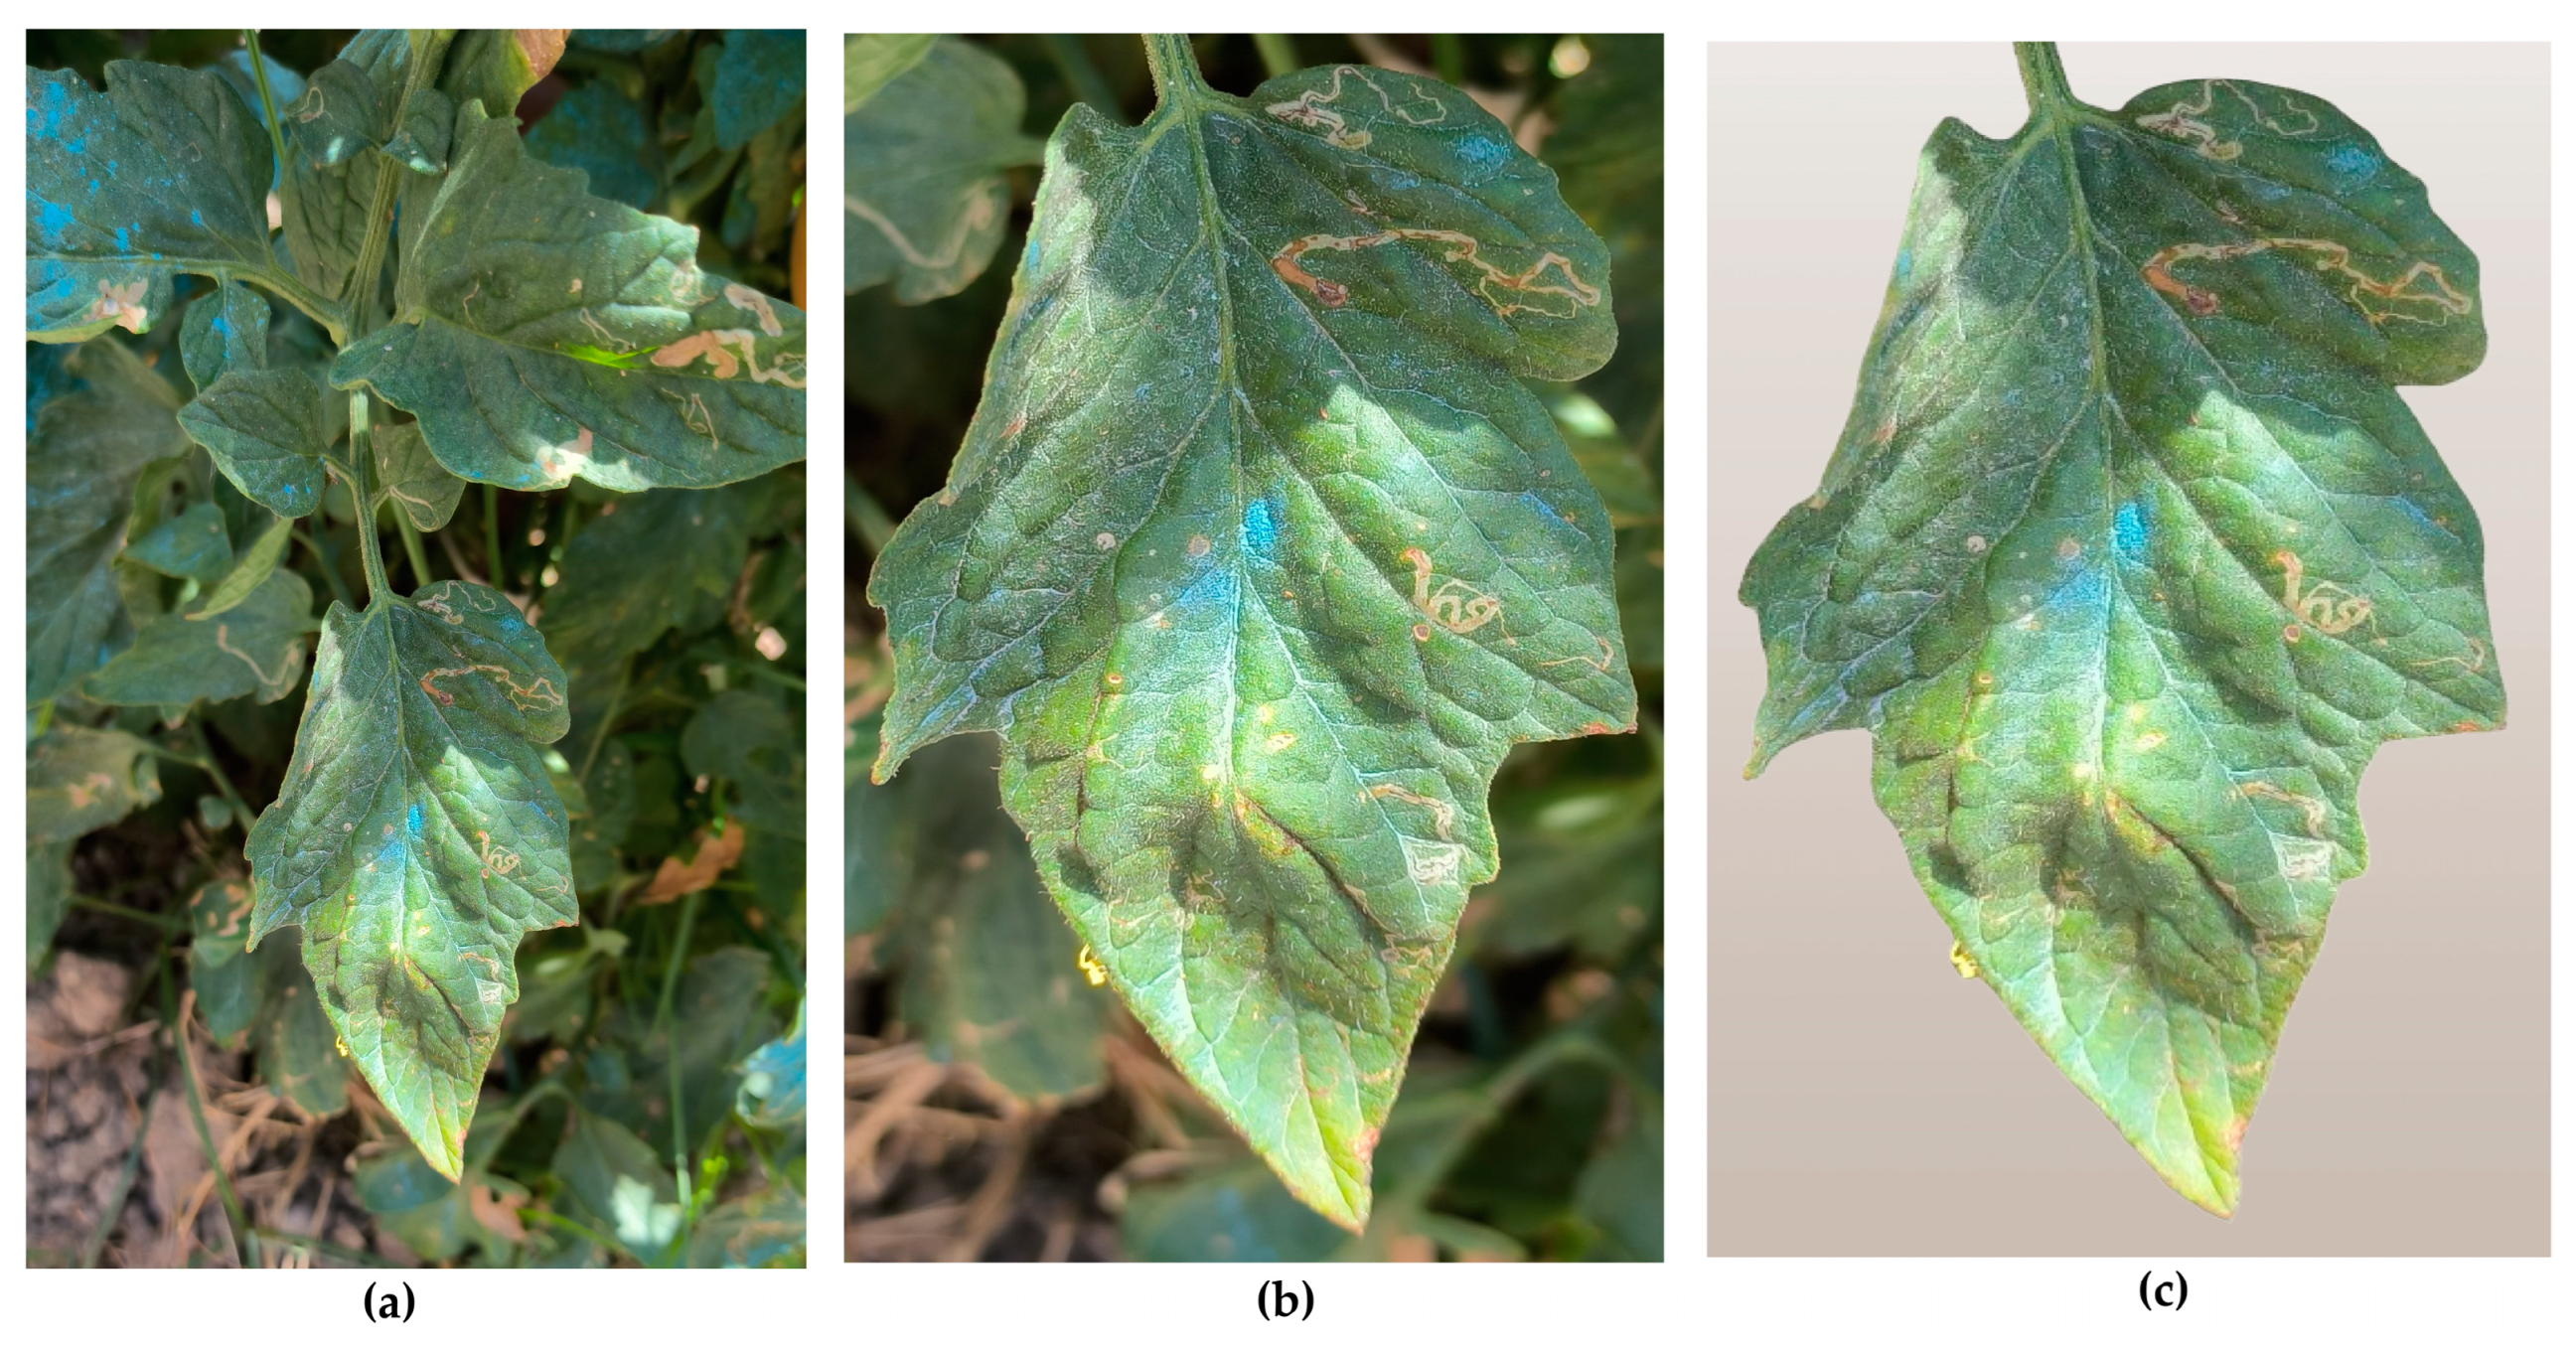
  • Original images: this folder contains the raw images as captured by the smartphone, without any modifications.
  • Cropped images: this is the same set of images, but with manually cropped photos, in order to focus as much as possible on the specific leaf intended for disease detection. This step was essential to reduce interference from other leaves and background elements present in the original images.
  • Background-removed images: this set contains the same images with the previous one, but all images were further processed to remove any remaining background elements, ensuring that only the tomato leaf was present. This step aimed to completely eliminate any distractions and provide the most accurate input for the model. The removed background was replaced by a neutral background. This background was intentionally chosen to be a very pale beige or light brown, in order to prevent any distractions or elements that might interfere with or confuse the model, during the analysis process. By using this neutral background behind the central image of the tomato leaf, the focus was solely on the leaf itself. This approach was consistent with the already defined training, validation, and testing sets, ensuring that the model concentrated on the critical features of the leaf without being influenced by any irrelevant background details.
Figure 6 depicts the differences between (a) an original image, (b) the corresponding cropped one, and (c) the corresponding background-removed one.
The experiments compared the model’s performance across three distinct image sets: cropped, cropped and background removed, and original, to assess how various preprocessing steps affected the accuracy and confidence of tomato leaf disease detection and focus on how these preprocessing techniques influenced prediction consistency and confidence. The corresponding results are presented in Table 2.

5.1. Experiment 1: Background-Removed Images vs. Original Images

Results: 72 images (out of 102 in total) had different predictions when comparing the background-removed images with the original unprocessed ones. The changes in confidence were as follows:
  • – A total of 21 images showed a rise in confidence, with an average increase of 21.01%.
  • – A total of 80 images showed a confidence drop, with an average decrease of 17.80%.
While the majority of images showed a decrease in confidence, it is important to note that the rise in confidence, though less frequent, was often more significant than the drops. The larger rise in confidence suggests that background removal, while occasionally stripping away useful context, generally provides more clarity to the model in terms of distinguishing leaf diseases. The fact that confidence improvements were more pronounced in this comparison, particularly when contrasted with the cropped vs. original dataset (discussed next), highlights the potential benefit of background removal as a preprocessing step.

5.2. Experiment 2: Cropped Images vs. Original Images

Results: 57 images (out of 102 in total) showed different predictions between the cropped images and the original unprocessed ones. Confidence levels fluctuated as follows:
  • – A total of 32 images saw a rise in confidence, with an average increase of 17.85%.
  • – A total of 66 images experienced a confidence drop, with an average decrease of 14.76%.
The differences between the cropped and original sets were relatively smaller compared to the background-removed comparisons. While cropping helped focus the model on the leaf, it did not lead to significant improvements. The fact that both the number of images with increased confidence and the magnitude of those rises were less pronounced than in the background removed vs. original comparison, suggests that simply cropping the images did not provide the same level of benefit. This indicates that while cropping was somewhat helpful, it was not enough to make a substantial difference in model confidence or accuracy.

5.3. Experiment 3. Cropped Images vs. Background-Removed Images

Results: 43 images (out of 102 in total) exhibited different predictions between the cropped and background-removed sets. Notably, there was a more significant rise in confidence for many images:
  • – A total of 35 images experienced a confidence increase, with an average rise of 26.46%.
  • – A total of 64 images saw a confidence drop, with an average decrease of 16.47%.
Even though more images showed a drop in confidence, the magnitude of the confidence rise was more substantial than the decrease. A manual inspection revealed that the confidence drops were generally small, suggesting the model retained certainty in most of its predictions despite losing some background context. On the other hand, the confidence gains were significant in several images, indicating that removing the background often allowed the model to focus more precisely on leaf features. This trend suggests that while background removal can occasionally reduce confidence, it often results in a more focused and confident prediction where the rise is meaningful.

5.4. Findings and Insights

Based on the experiments’ results, several significant conclusions can be made.
  • Magnitude of confidence rise vs. drop: even though more images showed confidence decreases, the confidence rises were more significant in magnitude. A manual inspection confirmed that the confidence drops were relatively small, often not affecting the model’s certainty in a meaningful way. On the other hand, the confidence rises, especially after background removal, were much more substantial, indicating that this preprocessing step provided the model with clearer information on disease features.
  • Cropped vs. original performance: the comparison between cropped and original images showed no substantial improvement in model performance, suggesting that while cropping the image helps by focusing the model on the leaf, it does not significantly enhance prediction confidence or accuracy.
  • Background removal’s impact: the largest confidence rise occurred in the comparison between background removed and initial images, demonstrating that background removal can greatly help the model focus on the relevant parts of the image. Even though more images showed a drop in confidence, the fact that the rises were larger in magnitude suggests that background removal is an effective preprocessing step, even though it occasionally strips away useful context.
  • Cropped vs. background removed: the largest difference in predictions was observed in the comparison between cropped and background removed images. This suggests that cropping alone is not sufficient to maximize model confidence, and that removing the background entirely allows the model to perform more effectively, with greater confidence in key cases. In summary, while background removal sometimes reduces confidence, it generally leads to a more significant rise in confidence where it matters. Cropping alone offers limited improvement, but the combination of careful cropping and background removal appears to provide the most significant boost in model performance.
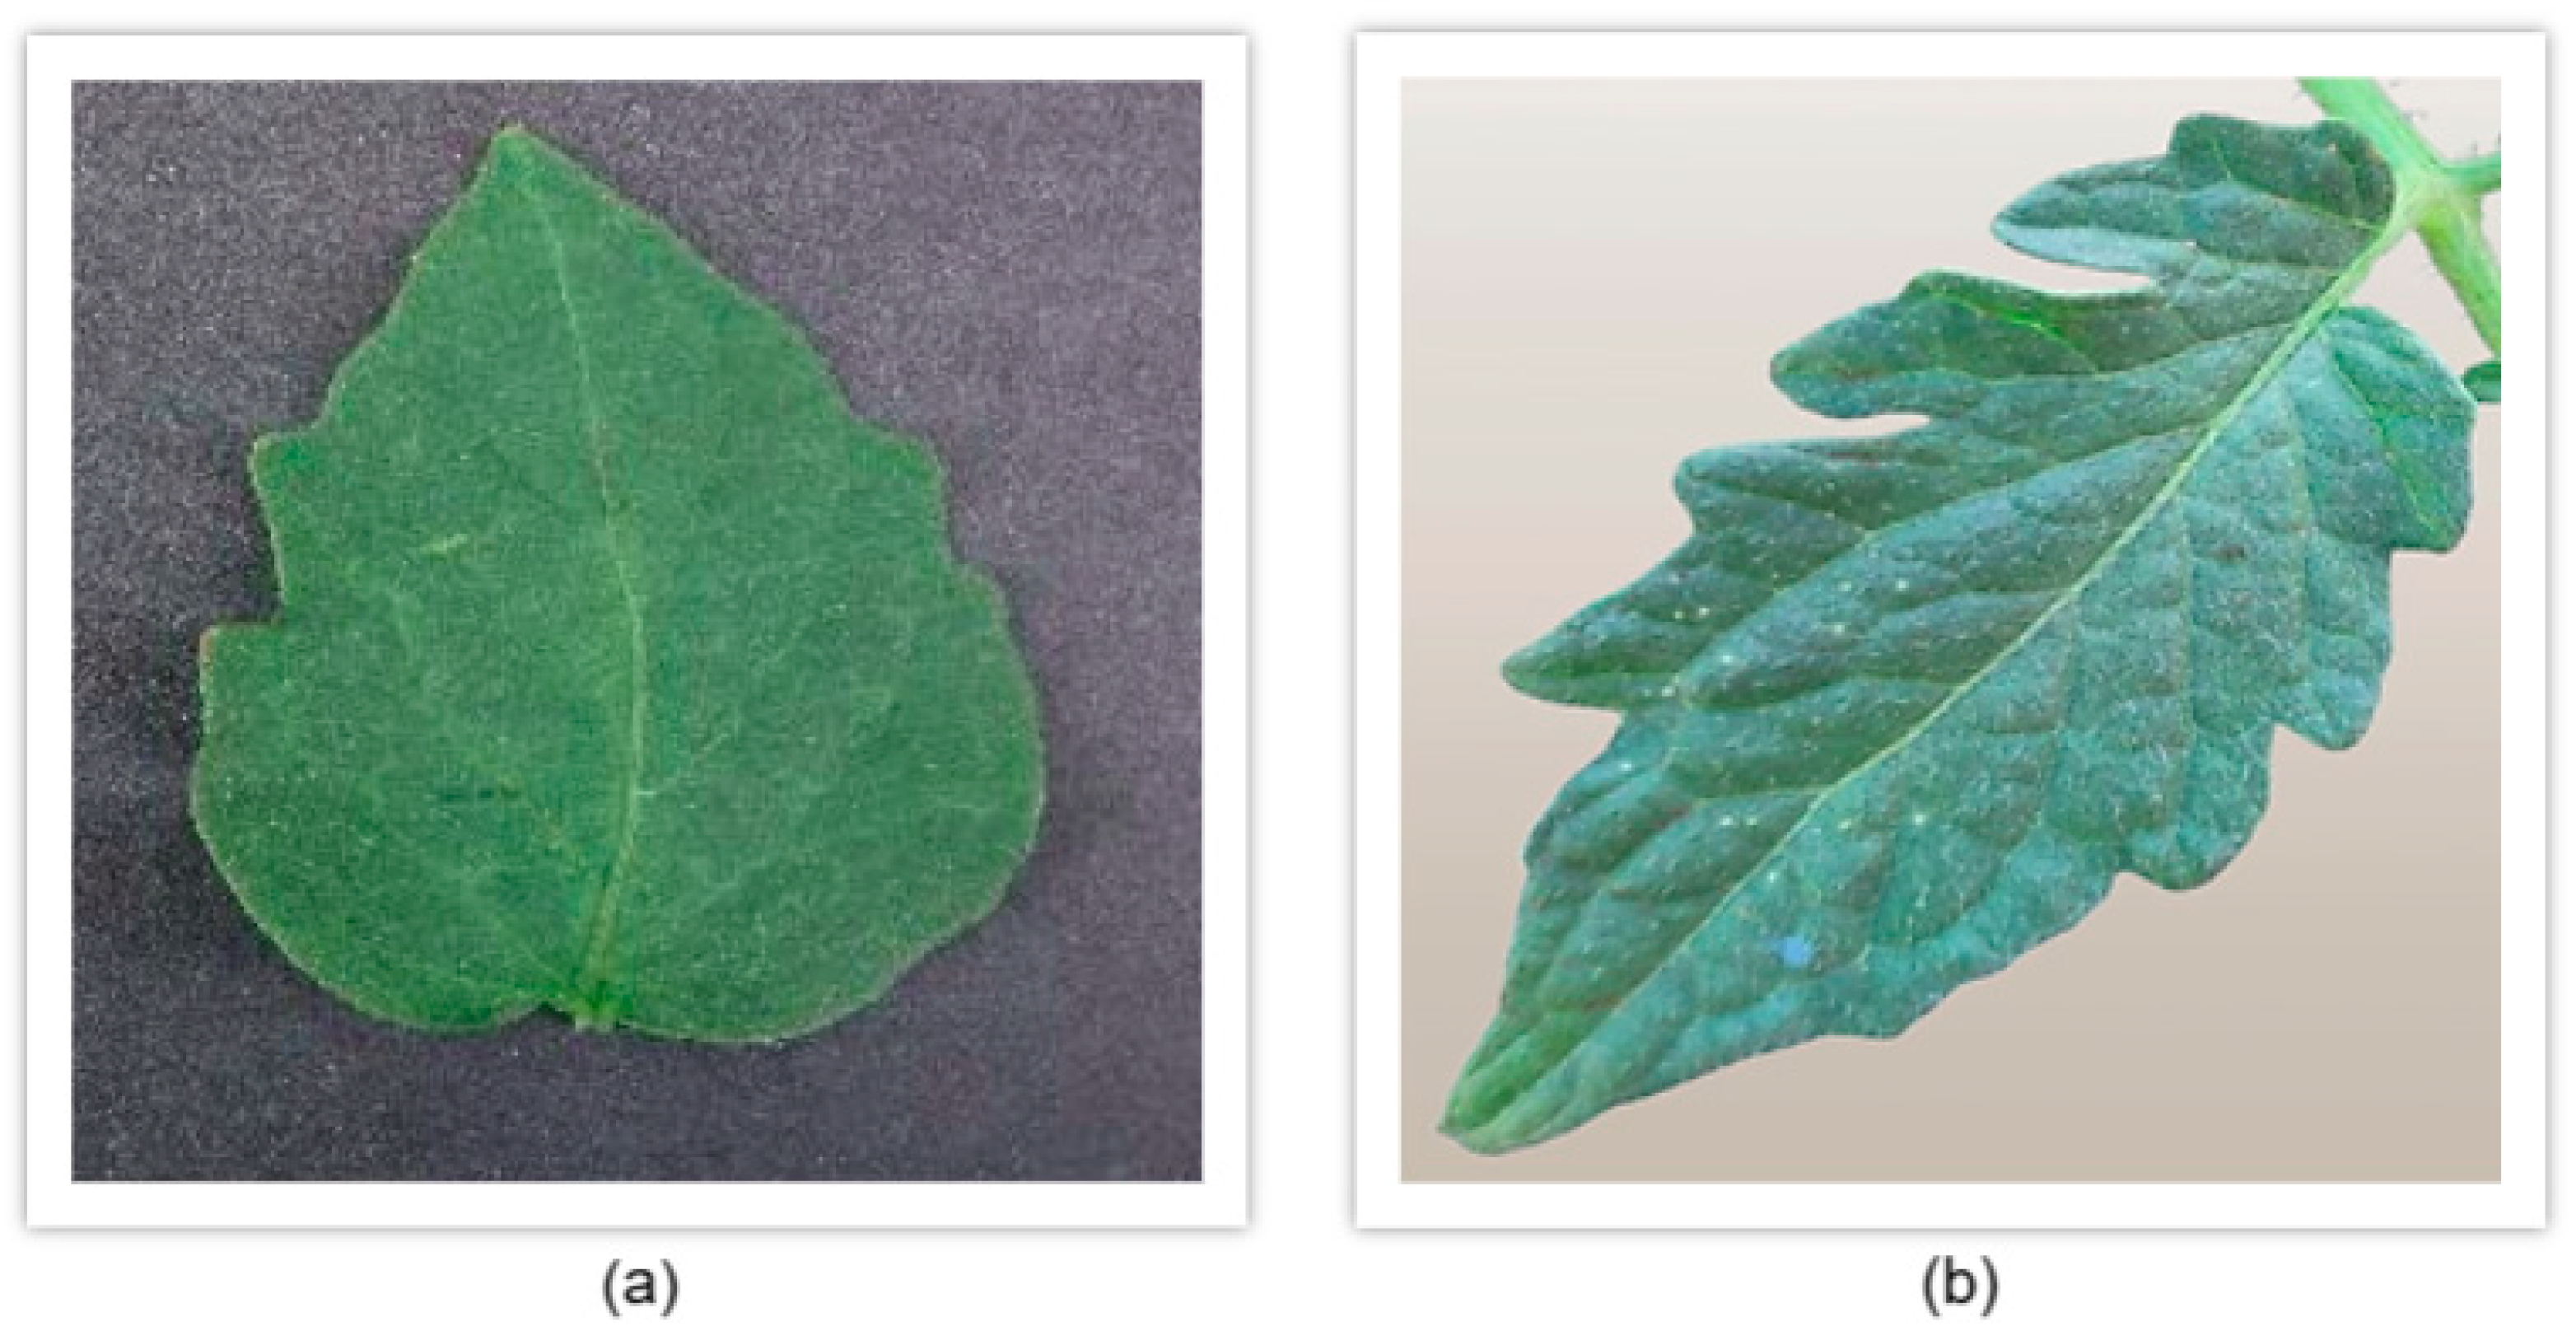
  • Dataset variations and their impact on model performance: another critical observation that emerged during our analysis relates to the dataset used for training compared to the dataset we created through our own image collection and preprocessing. Specifically, we noticed that the model struggled to accurately classify leaves from our custom dataset with high confidence, often failing to correctly identify the leaf category. This occurred despite the preprocessing techniques we applied, as discussed in earlier sections. Upon further investigation into the differences between the two datasets, we identified a key factor contributing to this discrepancy. The issue was not related to image resolution or technical specifications but rather to the intrinsic characteristics of the tomato leaves themselves. In particular, we observed that the tomato leaves in Greece, where our custom dataset was sourced, have distinct morphological differences compared to those in the original dataset. In Greece, the tomato plants commonly cultivated tend to have thinner and narrower leaves, whereas the leaves in the original dataset are typically thicker and broader. This variance in leaf shape, shown in Figure 7, could account for the model’s difficulty in generalizing predictions across both datasets. The model was trained on leaf images with a specific shape and thickness, which limited its ability to recognize the narrower leaf shapes commonly found in our local dataset. This finding underscores the importance of building a more diverse and representative dataset. Although the model achieved respectable confidence levels in certain cases, its performance highlighted the need for greater variability in the training data. As we previously discussed, having a diverse dataset is essential to developing a robust model capable of making accurate predictions across different environmental conditions, leaf variations, and tomato breeds. To improve future performance, it will be crucial to expand the dataset by incorporating images of tomato leaves from a variety of sources, including: (a) different tomato breeds (e.g., cherry tomatoes, heirloom tomatoes, beefsteak tomatoes), (b) various countries and regions, to account for geographical variations in leaf morphology, (c) different stages of growth and health conditions (e.g., diseased vs. healthy leaves, different disease severities), and (d) diverse environmental settings, including different lighting conditions, angles of capture, and weather effects (e.g., dry vs. humid climates).
This expansion will enable us to develop a more versatile and accurate model, adaptable to a wide range of scenarios and capable of performing optimally across diverse datasets. Such improvements are vital not only for this project but also for future analyses aimed at enhancing the accuracy and generalizability of tomato leaf disease detection models.
In order to make accessible the proposed CNN model for tomato leaf disease detection, we created a user-friendly web application using Streamlit [31]. Running predictions manually is impractical, so this application allows users to upload an image of a tomato leaf and instantly receive a diagnosis. The model processes the image through automated steps, including preprocessing and inference, to identify diseases with confidence scores. Additionally, it provides treatment recommendations based on extensive research, ensuring users receive reliable guidance for disease management. Designed for ease of use, the application benefits farmers, agricultural practitioners and researchers by offering real-time disease identification and validation of model accuracy. By making this tool publicly available, we aim to enhance practical usability and support early intervention strategies for effective plant health management.

6. Discussion

In this section, we summarize the main key points and advantages of our approach compared to other similar research approaches.
Dataset selection and processing: unlike most studies relying on PlantVillage [32], i.e., a heavily augmented and a little bit outdated dataset [33,34], we utilized the Kaustubh B. Tomato Leaf Disease Detection 2020 dataset [35], consisting of 11,000 unaugmented images. This scenario presented a valuable opportunity for us to process and augment the data by ourselves, ensuring realistic adaptations akin to images captured via drones, cameras, or anthropologists in real-world scenarios. By preparing the dataset in this way, we created a model that is more robust and adaptable to real-world use cases, setting our approach apart from studies that depend solely on pre-processed datasets.
User accessibility and practicality: a user-friendly web application was developed, allowing individuals, even with minimal technical expertise, to upload images for predictions [31]. This tool not only predicts diseases with a confidence score, but also offers treatment recommendations. Furthermore, unlike pure theoretical studies, our application aims to serve farmers and practitioners in real-time disease identification and early intervention, providing practical value beyond academic insights. Additionally, the robustness of the proposed CNN model can be easily verified by experts in the field, by uploading images with specific diseases to the web application to test whether the model correctly identifies them, effectively serving as a form of cross-validation. This feature adds significant value by providing an objective means of assessing the model’s reliability.
Comprehensive and objective analysis: we rigorously evaluated the model’s reliability using extensive metrics, like accuracy, loss, precision, recall, F1 score, confusion matrix, and learning and validation curves. Unlike most studies that omit key metrics such as loss, we ensured that every aspect of the model’s performance was transparently documented [3].
Real-world testing beyond theory: a significant number of studies rely on theoretical frameworks or pre-existing datasets, which may not fully capture the complexities of real-world applications. This reliance can limit the practical applicability of research findings [35]. Our work goes a step further, since we tested the proposed CNN model on real-world images, considering variations in tomato leaves across regions, countries, and continents. Observations included how image processing (e.g., cropping, resizing, normalizing) impacts results, while the real-world experiments enabled us to draw practical, actionable conclusions rather than relying solely on controlled dataset outcomes.
Innovative ensemble approach: while individually the proposed CNN, VGG16, and VGG19 models achieved strong results, we also analyzed their ensemble, which yielded an accuracy of 98% alongside improvements in all major metrics (i.e., precision, recall, F1 score). Notably, VGG16 and VGG19 models were fine-tuned rather than used in their original form, pushing us to develop a custom CNN model that was even more robust and optimized. The comparison between the fine-tuned pre-defined models and our custom CNN model provided additional insights into the strengths and weaknesses of each approach, highlighting our commitment to pushing boundaries and refining the model’s overall robustness.
Simplicity and deployability: one of the primary strengths of the proposed CNN model is its simplicity. Unlike VGG16, which consists of 13 convolutional layers and 3 fully connected layers (16 layers in total), the proposed CNN features a much lighter architecture with 6 convolutional layers and 2 fully connected layers (8 layers in total). This makes it easier to study, understand, and modify, providing a strong starting point for researchers or practitioners looking to develop custom models. Furthermore, despite its simplicity, the proposed CNN model still achieves competitive performance against extensively pre-trained models like VGG16 and VGG19, which have been trained on very large datasets. This demonstrates that a carefully designed, lightweight model can hold its own against deeper architectures while being more efficient. Moreover, the compact nature of the proposed CNN makes it more suitable for deployment on resource-constrained devices, such as mobile phones or embedded systems, a task that is significantly more challenging with larger architectures, such as VGG16 and VGG19. Thus, while the accuracy gap may not be substantial, the benefits in terms of interpretability, efficiency, and deployability make the proposed CNN a practical and valuable alternative to heavier pre-trained models.

7. Conclusions and Future Work

We introduced a CNN-based approach for the early detection of tomato leaf diseases, demonstrating high accuracy and reliability. While the proposed model has proven effective, there are several opportunities for further enhancement to expand its applicability, improve performance, and increase its impact on precision agriculture.
One key area for improvement could be dataset expansion. Incorporating additional tomato varieties, such as cherry, heirloom, and beefsteak tomatoes, can enhance the model’s versatility. Increasing the number of disease classes by including a wider range of infections and pest infestations would further improve classification accuracy. Additionally, collecting images from diverse geographical regions, different seasons, and varying environmental conditions would ensure the model’s robustness in real-world agricultural settings. Collaboration with agronomists and plant pathologists could also refine the dataset and optimize the model’s effectiveness in practical farming applications.
The integration of the model with IoT-based smart farming systems, such as drones and smart cameras, could enable continuous crop monitoring and automated disease detection alerts. Incorporating environmental factors, such as weather data and soil conditions, could also allow for predictive analytics, enabling early intervention and disease prevention strategies.
By addressing these areas, the research can make significant contributions to AI-driven plant disease management, fostering more efficient and sustainable agricultural practices.

Author Contributions

Conceptualization, Z.O. and N.D.T.; methodology, Z.O., E.-M.T., S.H.K., G.T. and N.D.T.; software, Z.O.; validation, Z.O., E.-M.T. and S.H.K.; formal analysis, Z.O., E.-M.T., S.H.K., G.T. and N.D.T.; investigation, Z.O., E.-M.T. and S.H.K.; resources, Z.O. and E.-M.T.; data curation, Z.O., E.-M.T. and S.H.K.; writing—original draft preparation, Z.O., E.-M.T., S.H.K., G.T. and N.D.T.; writing—review and editing, Z.O. and N.D.T.; visualization, Z.O.; supervision, N.D.T.; project administration, N.D.T. All authors have read and agreed to the published version of the manuscript.

Funding

This research received no external funding.

Institutional Review Board Statement

Not applicable.

Informed Consent Statement

Not applicable.

Data Availability Statement

Data supporting the reported results can be found at ref. [23].

Conflicts of Interest

The authors declare no conflicts of interest.

Abbreviations

The following abbreviations are used in this manuscript:
AIArtificial intelligence
ANOVAAnalysis of variance
ARAverage recall
CNNConvolutional neural network
CSACoordinate space attention
CUDACompute unified device architecture
CuDNNCUDA deep neural network
DCNNDeep convolutional neural networks
FR-CNNFaster region-based convolutional neural network
FPSFrames per second
GLCMGray level co-occurrence matrix
GPUGraphics processing unit
HCAHybrid channel attention
LRAMLocation reinforcement attention mechanism
mAPMean average precision
mAP50Mean average precision (mAP) at a 50% threshold
MLMachine learning
PACPerceptual adaptive convolution
PFANProximity feature aggregation network
RCERobust cross-entropy
R-CNNRegion-based convolutional neural network
ReLURectified linear unit
SGDStochastic gradient descent
SIFTScale-invariant feature transform
SVMSupport vector machine
VGGVisual geometry group

References

  1. Talaei Khoei, T.; Kaabouch, N. Machine Learning: Models, Challenges, and Research Directions. Future Internet 2023, 15, 332. [Google Scholar] [CrossRef]
  2. De Andrade, A. Best Practices for Convolutional Neural Networks Applied to Object Recognition in Images. arXiv 2019, arXiv:1910.13029. [Google Scholar] [CrossRef]
  3. Tang, Z.; He, X.; Zhou, G.; Chen, A.; Wang, Y.; Li, L.; Hu, Y. A Precise Image-Based Tomato Leaf Disease Detection Approach Using PLPNet. Plant Phenomics 2023, 5, 42. [Google Scholar] [CrossRef] [PubMed]
  4. Nawaz, M.; Nazir, T.; Javed, A.; Masood, M.; Rashid, J.; Kim, J.; Hussain, A. A robust deep learning approach for tomato plant leaf disease localization and classification. Sci Rep. 2022, 12, 18568. [Google Scholar] [CrossRef]
  5. Zhang, E.; Zhang, N.; Li, F.; Lv, C. A Lightweight Dual-Attention Network for Tomato Leaf Disease Identification. Front. Plant Sci. 2024, 15, 1420584. [Google Scholar] [CrossRef]
  6. Khan, R.; Ud Din, N.; Zaman, A.; Huang, B. Automated Tomato Leaf Disease Detection Using Image Processing: An SVM-Based Approach with GLCM and SIFT Features. J. Eng. 2024, 2024, 9918296. [Google Scholar] [CrossRef]
  7. Debnath, A.; Hasan, M.M.; Raihan, M.; Samrat, N.; Alsulami, M.M.; Masud, M.; Bairagi, A.K. A Smartphone-Based Detection System for Tomato Leaf Disease Using EfficientNetV2B2 and Its Explainability with Artificial Intelligence (AI). Sensors 2023, 23, 8685. [Google Scholar] [CrossRef]
  8. Attallah, O. Tomato Leaf Disease Classification via Compact Convolutional Neural Networks with Transfer Learning and Feature Selection. Horticulturae 2023, 9, 149. [Google Scholar] [CrossRef]
  9. Pushpa, B.R.; Aiswarya, V.V. Tomato Leaf Disease Detection and Classification Using CNN. Math. Stat. Eng. Appl. 2022, 71, 2921–2930. [Google Scholar]
  10. Guerrero-Ibañez, A.; Reyes-Muñoz, A. Monitoring Tomato Leaf Disease through Convolutional Neural Networks. Electronics 2023, 12, 229. [Google Scholar] [CrossRef]
  11. Hossain, M.I.; Jahan, S.; Al Asif, M.R.; Samsuddoha, M.; Ahmed, K. Detecting tomato leaf diseases by image processing through deep convolutional neural networks. Smart Agric. Technol. 2023, 5, 100301. [Google Scholar] [CrossRef]
  12. Wang, X.; Liu, J. An efficient deep learning model for tomato disease detection. Plant Methods 2024, 20, 61. [Google Scholar] [CrossRef] [PubMed]
  13. Nagamani, H.S.; Sarojadevi, H. Tomato Leaf Disease Detection using Deep Learning Techniques. Int. J. Adv. Comput. Sci. Appl. 2022, 13, 305–311. [Google Scholar] [CrossRef]
  14. Trivedi, N.K.; Gautam, V.; Anand, A.; Aljahdali, H.M.; Villar, S.G.; Anand, D.; Goyal, N.; Kadry, S. Early Detection and Classification of Tomato Leaf Disease Using High-Performance Deep Neural Network. Sensors 2021, 21, 7987. [Google Scholar] [CrossRef]
  15. NVIDIA CUDA Toolkit. Available online: https://developer.nvidia.com/cuda-toolkit (accessed on 4 February 2025).
  16. OpenCV. Available online: https://opencv.org/ (accessed on 4 February 2025).
  17. Pandas Library. Available online: https://pandas.pydata.org/ (accessed on 4 February 2025).
  18. Keras. Available online: https://keras.io/ (accessed on 4 February 2025).
  19. NymPy. Available online: https://numpy.org/ (accessed on 4 February 2025).
  20. Scikit-Learn. Available online: https://scikit-learn.org/stable/ (accessed on 4 February 2025).
  21. Matplotlib. Available online: https://matplotlib.org/ (accessed on 4 February 2025).
  22. TensorFlow. Available online: https://www.tensorflow.org/ (accessed on 4 February 2025).
  23. Github Code Repository. Available online: https://github.com/ZamirOsmenaj/tomato-leaf-disease-detection-and-classification (accessed on 4 February 2025).
  24. Tomato Leaf Disease Detection Dataset. Available online: https://www.kaggle.com/datasets/kaustubhb999/tomatoleaf (accessed on 4 February 2025).
  25. Filipi, C.; Dos Santos, G.; Papa, J.P. Avoiding Overfitting: A Survey on Regularization Methods for Convolutional Neural Networks. ACM Comput. Surv. 2022, 54, 213. [Google Scholar] [CrossRef]
  26. Xu, Y.; Goodacre, R. On Splitting Training and Validation Set: A Comparative Study of Cross-Validation, Bootstrap and Systematic Sampling for Estimating the Generalization Performance of Supervised Learning. J. Anal. Test. 2018, 2, 249–262. [Google Scholar] [CrossRef]
  27. Mishra, A.; Mishra, A.; Tewari, A.K.; Gangrade, J. Deep Transfer Learning for Tomato Leaf Diseases Detection and Classification using Pretrained Models. In Proceedings of the 9th International Conference on Signal Processing and Communication (ICSC), Noida, India, 21–23 December 2023; pp. 290–295. [Google Scholar] [CrossRef]
  28. Dhivyaa, C.R.; Nithya, K.; Vignesh, T.; Sudhakar, R.; Kumar, K.S.; Janani, T. An Enhanced Deep Learning Model for Tomato Leaf Disease Prediction. In Proceedings of the 8th International Conference on Communication and Electronics Systems (ICCES), Coimbatore, India, 1–3 June 2023; pp. 1322–1331. [Google Scholar] [CrossRef]
  29. Nguyen, T.-H.; Nguyen, T.-N.; Ngo, B.-V. A VGG-19 Model with Transfer Learning and Image Segmentation for Classification of Tomato Leaf Disease. AgriEngineering 2022, 4, 871–887. [Google Scholar] [CrossRef]
  30. Wang, Y.; Han, Y.; Wang, C.; Song, S.; Tian, Q.; Huang, G. Computation-Efficient Deep Learning for Computer Vision: A Survey. Cybern. Intell. 2024, 1–24. [Google Scholar]
  31. Web App. Available online: https://tomato-leaves-prediction-app.streamlit.app/ (accessed on 4 February 2025).
  32. PlantVillage Dataset. Available online: https://www.kaggle.com/datasets/emmarex/plantdisease (accessed on 4 February 2025).
  33. Fenu, G.; Malloci, F.M. Evaluating Impacts between Laboratory and Field-Collected Datasets for Plant Disease Classification. Agronomy 2022, 12, 2359. [Google Scholar] [CrossRef]
  34. Noyan, M.A. Uncovering bias in the PlantVillage dataset. arXiv 2022, arXiv:2206.04374v1. [Google Scholar] [CrossRef]
  35. Saebi, M.; Nan, B.; Herr, J.E.; Wahlers, J.; Guo, Z.; Zurański, A.M.; Kogej, T.; Norrby, P.-O.; Doyle, A.G.; Chawla, N.V.; et al. On the use of real-world datasets for reaction yield prediction. Chem. Sci. 2023, 14, 4997–5005. [Google Scholar] [CrossRef] [PubMed]
Figure 1. Tomato leaves disease types (classes).
Information 16 00231 g001
Figure 2. The proposed CNN model’s architecture.
Information 16 00231 g002
Figure 3. (a) Loss and (b) accuracy evaluation for each model during training and validation.
Information 16 00231 g003
Figure 4. Confusion matrices for (a) the proposed CNN model, (b) VGG16 model, and (c) VGG19 model.
Information 16 00231 g004
Figure 5. (a) Average loss and (b) average accuracy comparison across models and different sets.
Information 16 00231 g005
Figure 6. (a) An original image captured in a typical garden in Greece, (b) the corresponding cropped image, focused on the tomato leaf intended for disease detection, and (c) the corresponding background-removed image.
Information 16 00231 g006
Figure 7. Comparison of tomato leaf morphology: (a) the left image shows a broader, thicker tomato leaf from the original dataset, (b) while the right image displays a thinner, narrower leaf from the custom dataset sourced in Greece.
Information 16 00231 g007
Table 1. Critical evaluation metrics (average values).
ModelAccuracyLossPrecisionRecallF1 Score
Proposed CNN96.00%12.54%96.00%96.00%96.00%
VGG16 (fine-tuned)96.45%13.55%97.00%96.00%96.00%
VGG19 (fine-tuned)94.00%20.59%94.00%94.00%94.00%
Ensemble (three models)98.00%N/A98.00%98.00%98.00%
Table 2. Preprocessing images’ adjustments affect in confidence.
ComparisonNumber of Images with Different PredictionsAverage Confidence RiseAverage Confidence Drop
Background removed vs. original7221.01%17.80%
Cropped vs. original5717.85%14.76%
Cropped vs. background removed4326.46%16.47%
Disclaimer/Publisher’s Note: The statements, opinions and data contained in all publications are solely those of the individual author(s) and contributor(s) and not of MDPI and/or the editor(s). MDPI and/or the editor(s) disclaim responsibility for any injury to people or property resulting from any ideas, methods, instructions or products referred to in the content.

