Article

Automatic Reading Method for Analog Dial Gauges with Different Measurement Ranges in Outdoor Substation Scenarios

1
State Grid Sichuan Electric Power Research Institute, Chengdu 610041, China
2
School of Information Science & Technology, Southwest Jiaotong University, Chengdu 610031, China
*
Author to whom correspondence should be addressed.
Information 2025, 16(3), 226; https://doi.org/10.3390/info16030226
Submission received: 26 January 2025 / Revised: 23 February 2025 / Accepted: 5 March 2025 / Published: 14 March 2025

Abstract

:
In substation working environments, analog dial gauges are widely used for equipment monitoring. Accurate reading of dial values is crucial for real-time understanding of equipment operational status and enhancing the intelligence of substation equipment operation and maintenance. However, existing dial reading recognition algorithms face significant errors in complex scenarios and struggle to adapt to dials with different measurement ranges. To address these issues, this paper proposes an automatic reading method for analog dial gauges consisting of two stages: dial segmentation and reading recognition. In the dial segmentation stage, an improved DeepLabv3+ network is used to achieve precise segmentation of the dial scale and pointer, and the network is made lightweight to meet real-time requirements. In the reading recognition stage, the distorted image is first corrected, and PGNet is used to obtain scale information for scale matching. Finally, an angle-based method is employed to achieve automatic reading recognition of the analog dial gauge. The experimental results show that the improved Deeplabv3+ network has 4.25 M parameters, with an average detection time of 19 ms per image, an average Pixel Accuracy of 92.7%, and an average Intersection over Union (IoU) of 79.7%. The reading recognition algorithm achieves a reading accuracy of 92.3% across dial images in various scenarios, effectively improving reading recognition accuracy and providing strong support for the development of intelligent operation and maintenance in substations.

1. Introduction

Substations are usually equipped with a large number of pressure gauges, temperature gauges, and ammeters to monitor the equipment’s operating status. Staff must manually read the meters periodically to check that the equipment is working properly. However, due to the presence of high magnetic fields and high radiation in the substation environment, the frequent entry and exit of personnel tends to increase the risk of accidents [1]. At the same time, manual meter reading consumes a lot of human and material resources, is inefficient, and is easily affected by the working status of inspectors and the complex environment, resulting in data errors [2]. In recent years, with the rapid development of the application of deep learning technology in the power industry, the application of intelligent inspection of meter readings through drones, cameras, and inspection robots is increasing. However, the substation environment is complex and can easily lead to reading errors due to factors such as shooting angles, complex lighting conditions, and diverse dial ranges. Therefore, it is crucial to utilize image-based technologies to overcome the interferences mentioned above and obtain accurate readings of pointer-type dials with different scales in the intricate settings of substations [3].
At present, with the advancement of deep learning in image processing, domestic and foreign scholars have conducted extensive research on the automatic reading and recognition of pointer-type dials. Early research primarily relied on traditional machine learning methods, such as the Hough transform, watershed algorithm, and adaptive iterative algorithms. Generally, these methods require high-quality image data from the instruments, which often compromises their robustness and results in suboptimal accuracy when reading pointer-type dials. Yang et al. identified the dial pointer, scale lines, and center position through edge detection technology and then obtained the scale line and pointer information using binarization and the Hough transform. However, this method is not suitable for distorted images [4]. Xu et al. employed color space transformation to localize the starting and ending points of the oil-level gauge scale ring. However, they did not account for the influence of lighting variations, which leads to certain reliability and robustness issues in practical applications [5]. Shi et al. utilized the traditional Kirchhoff line detection algorithm to identify the position of the pointer, which performs well only in high-definition images [6]. These methods typically rely on manually designed feature extraction for the dial and pointer information. Furthermore, the processing of these features often relies on fixed image data under specific environmental and lighting conditions, leading to certain limitations.
Deep learning technologies have widely applied convolutional neural networks (CNNs) to the task of reading pointer-type dials. In 2019, Fang et al. utilized Mask R-CNN to detect the key points of pointers and scales [7], although this method is susceptible to reflections and uneven lighting. In 2022, Geng et al. enhanced the segmentation accuracy of instrument scale lines by improving the U-Net architecture [8]. However, this method suffers from a large number of parameters and slow computational speed. Jin Aiping et al. employed U-Net to obtain the contour of the pointer [9]. However, due to the relatively ideal shooting conditions of the instrument dataset, the robustness of the network is insufficient. Further advancements have been made in the field of pointer-type instrument reading using object detection and image segmentation techniques such as YOLOv5 and the Hough transform, achieving promising results under certain conditions [10]. In 2021, Wang et al. aimed to improve the efficiency of reading by utilizing YOLOv5 and the Hough transform [11]. However, their results demonstrated that under complex background interference conditions, the pointer is prone to false detections. In 2022, Yang et al. proposed an automatic recognition method for pointer-type instrument readings based on object detection and image segmentation techniques [12]. Their method showed potential for accurate readings, but the reading accuracy still needs to be improved under complex outdoor lighting conditions.
The aforementioned studies indicate that there are still several challenges associated with the automatic reading methods for pointer-type dials. First, the segmentation networks currently in use often have a large number of parameters, high network complexity, and slow computational speed, which fail to meet the real-time recognition requirements of substations. Second, due to the impact of lighting on images, the segmentation effect of the segmentation networks on dial scales and pointers is still not satisfactory, especially in the segmentation of fine pointers and scale areas, which needs to be improved. Third, in terms of reading algorithms, instrument distortion images are prone to significant errors in the final readings, and most current reading algorithms are limited to the readings of instruments with fixed ranges [13]. To address these challenges, this paper proposes a method for reading dials with different ranges that is suitable for outdoor substation scenarios. Initially, the dataset is subjected to data augmentation techniques, including color transformations, to enhance its diversity and robustness. Thereafter, an enhanced segmentation network is employed to augment the precision of segmentation. Ultimately, the accuracy of reading dials with varying ranges in outdoor substation scenarios is significantly improved through image rectification and text information recognition.

2. An Adaptive Framework for Automated Reading of Pointer-Type Meters with Diverse Ranges in Substations

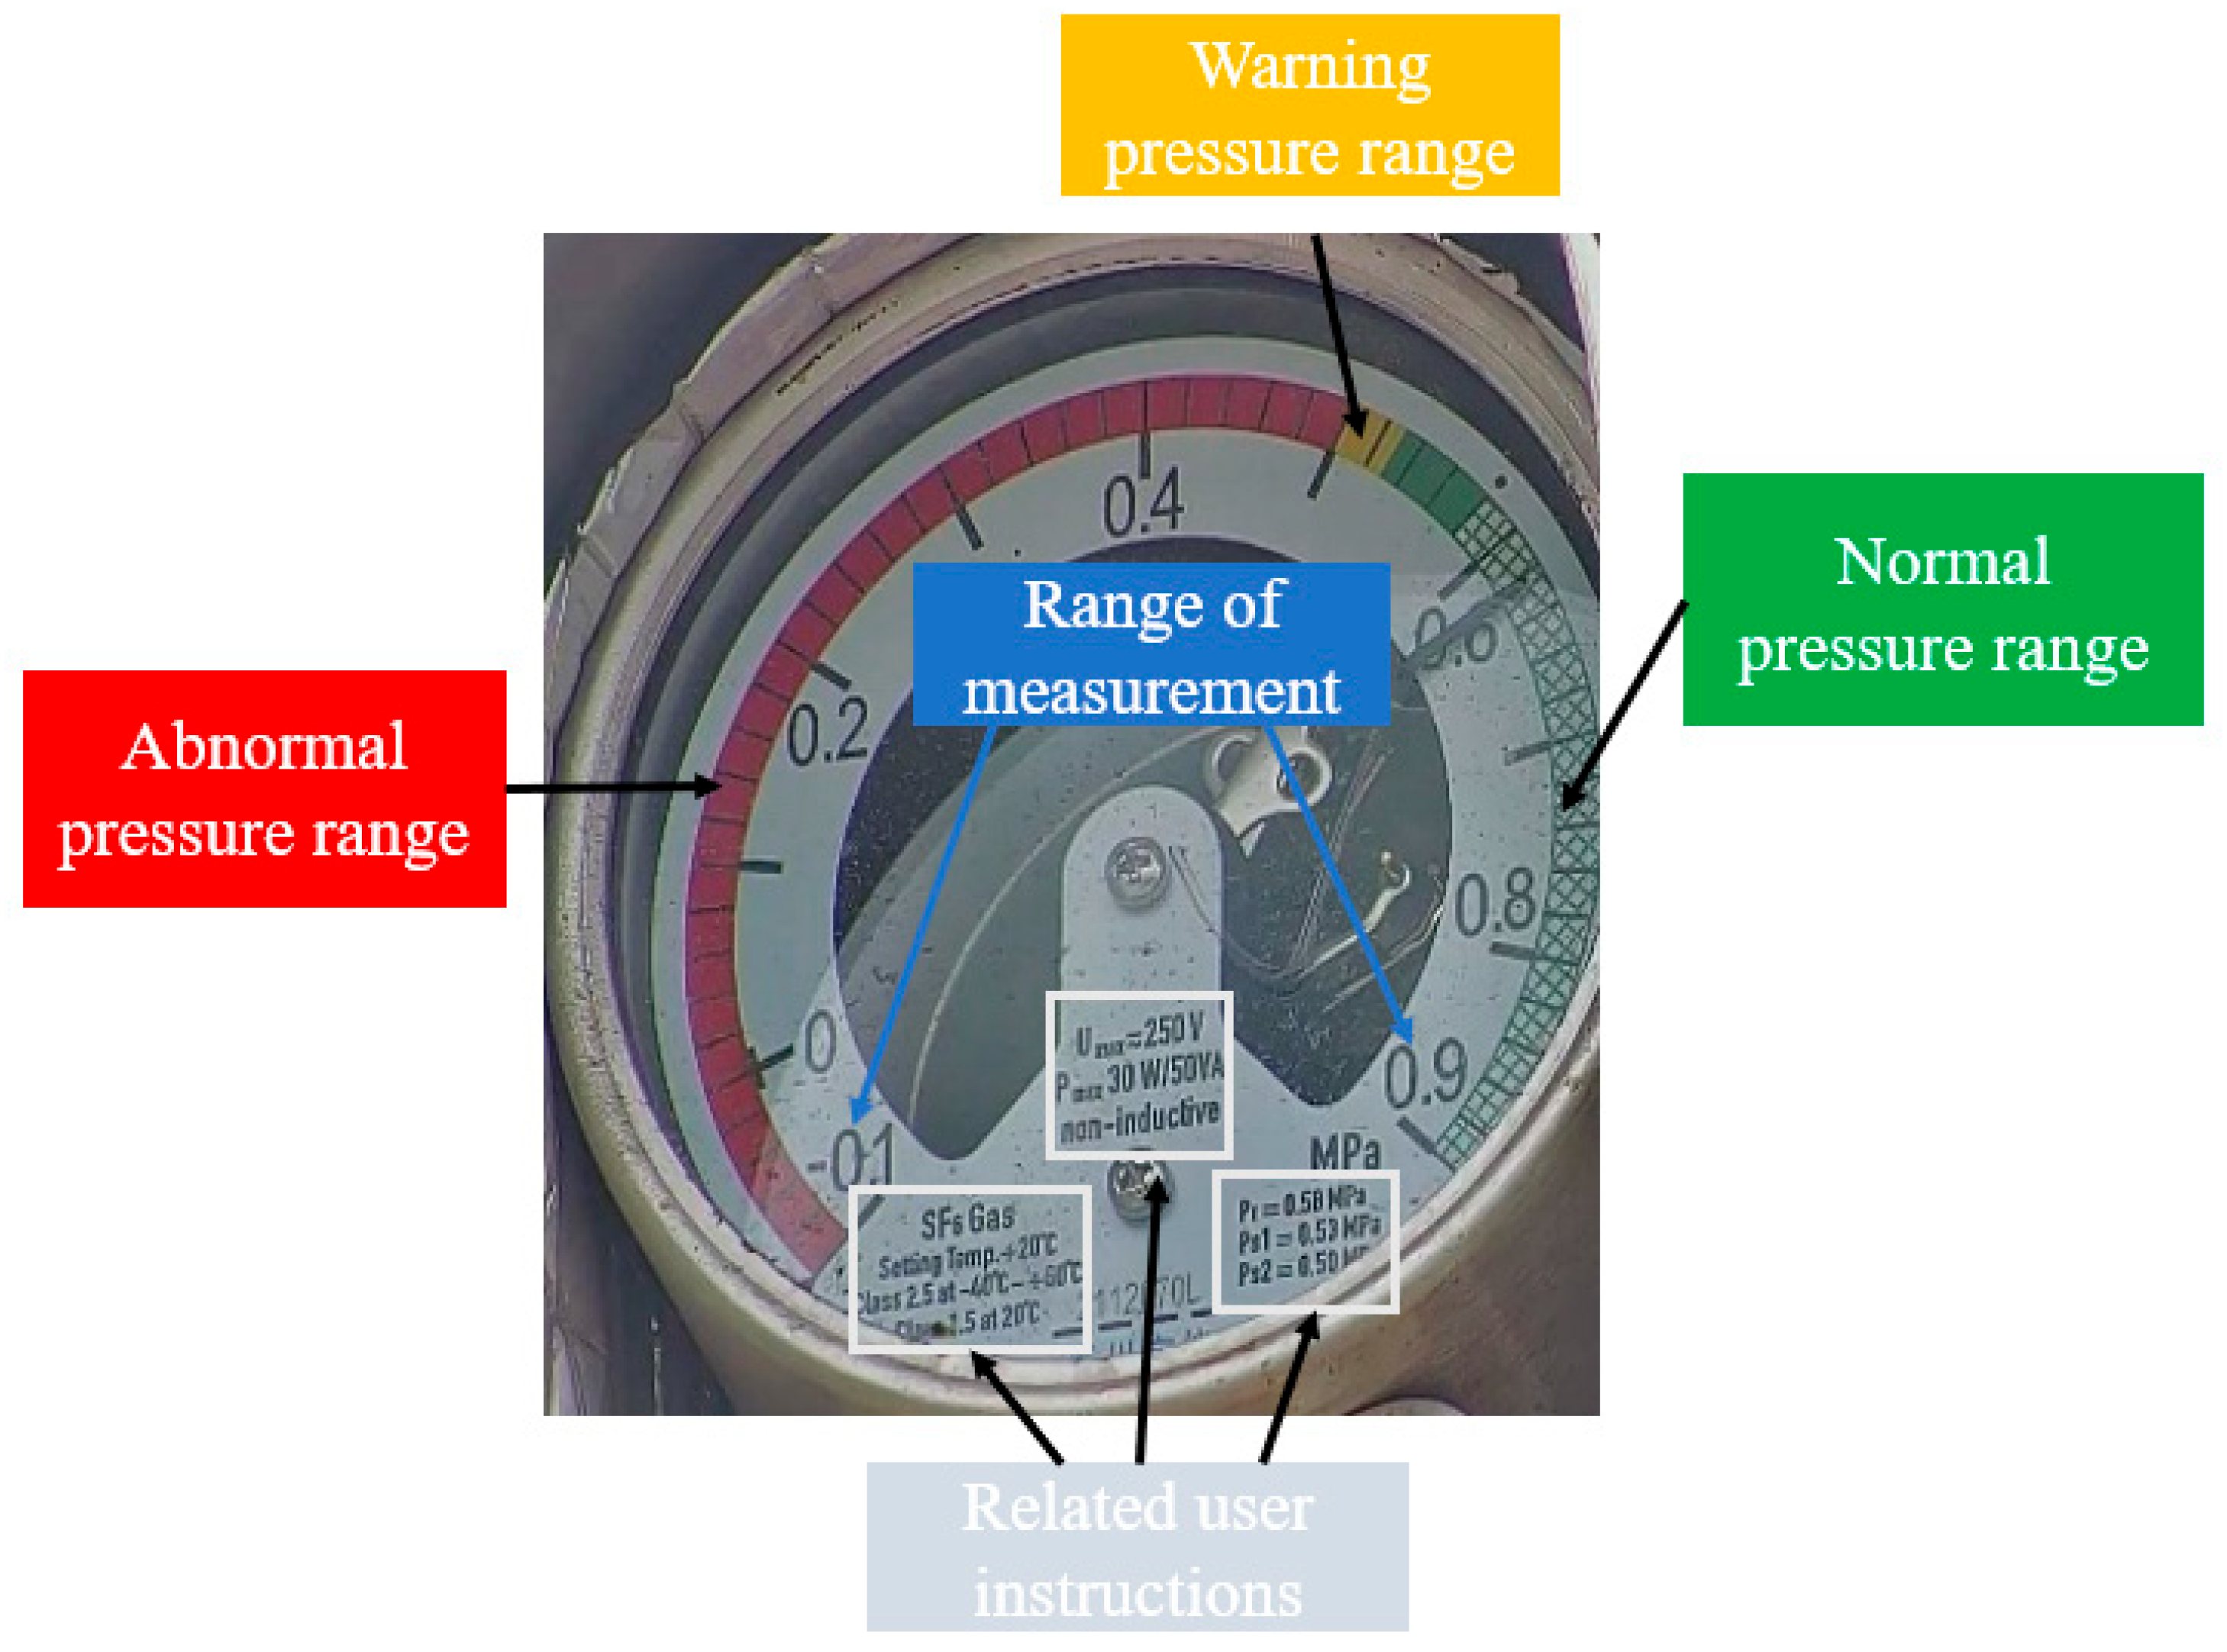
2.1. Analysis of Meter Reading Solutions

This study focuses on the meter dial images acquired from a GIS substation in Xichang and investigates the requirements for accurate dial reading. As depicted in Figure 1, the dial information of the substation meters is highly complex, containing both textual information and numerical scale markings. Automating the reading of these dial values can provide a direct indication of the operational status of the equipment. However, the outdoor environment poses significant challenges due to variable lighting conditions and shooting angles, which often result in blurred or distorted dial images, thereby affecting the accuracy of the readings. Moreover, the dials feature extensive textual and numerical information, and the substation employs meters with varying ranges. Consequently, many existing reading algorithms are limited to meters with fixed ranges and exhibit poor performance in terms of reading accuracy. To address these challenges, this paper proposes a novel reading method that integrates three key techniques: image segmentation, image distortion correction, and character recognition. This integrated approach is capable of adaptively reading the values of meters with different ranges in the complex outdoor substation environment. Specifically, image segmentation is utilized to precisely delineate the scales and pointers on the dial, thereby obtaining their exact coordinate positions. Image distortion correction is employed to rectify distortions caused by improper shooting angles. Finally, character recognition is applied to identify the textual information on the dial, thus enabling the acquisition of accurate scale information.

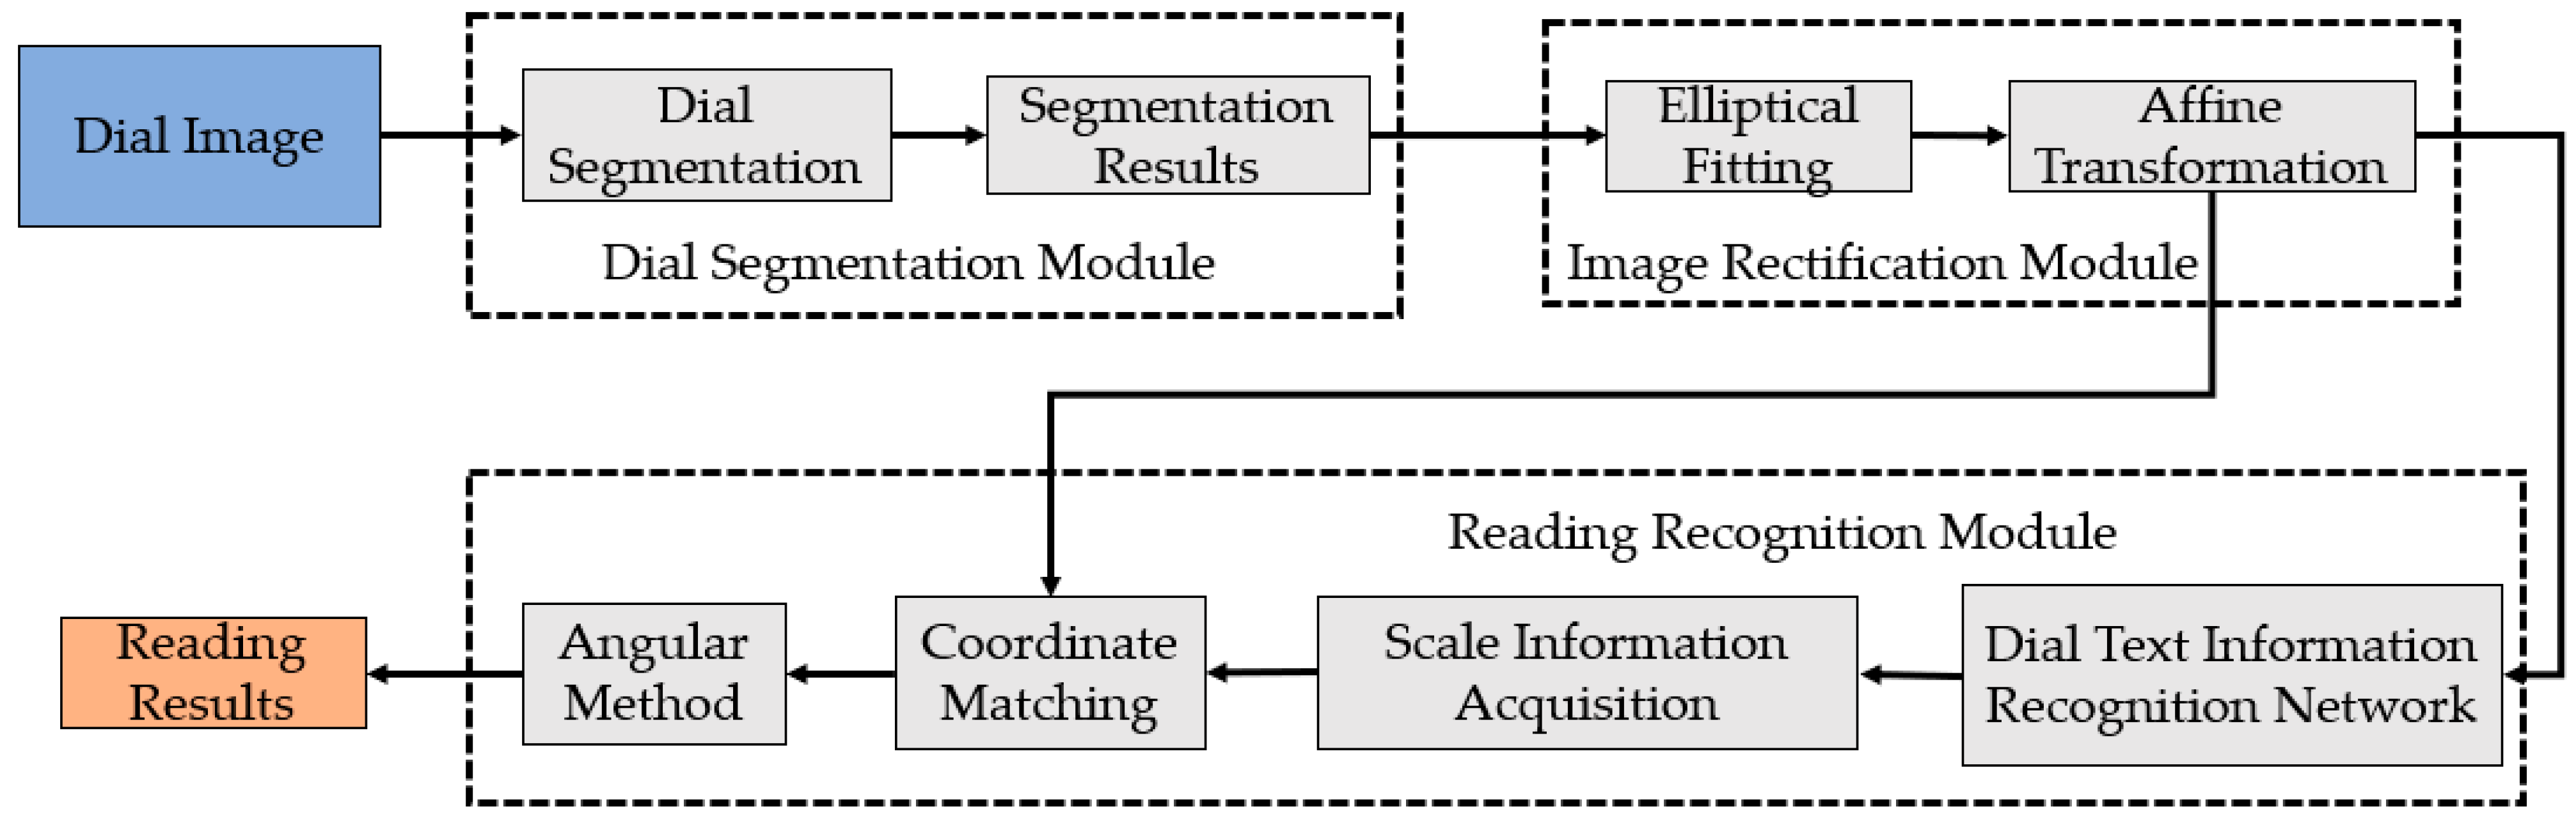
2.2. Framework for Meter Reading

The meter reading algorithm presented in this paper, which is specifically tailored for outdoor substation environments with varying meter ranges, is depicted in Figure 2. The algorithm comprises three primary modules. Initially, the scale and pointer segmentation module leverages an enhanced DeepLabV3+ network to improve the precision of dial scale and pointer segmentation. Subsequently, the dial image rectification module employs elliptical fitting based on the least squares method and affine transformation to correct the dial image data, thereby enhancing reading accuracy. Lastly, the reading recognition module utilizes PGNet to identify the textual information on the dial, filters out the scale information, and matches coordinates to obtain the parameters required for angular reading. The dial value is ultimately determined through angular computation.

3. Method

3.1. Improvement of the Dial Pointer Segmentation Model for Pointer-Type Instruments

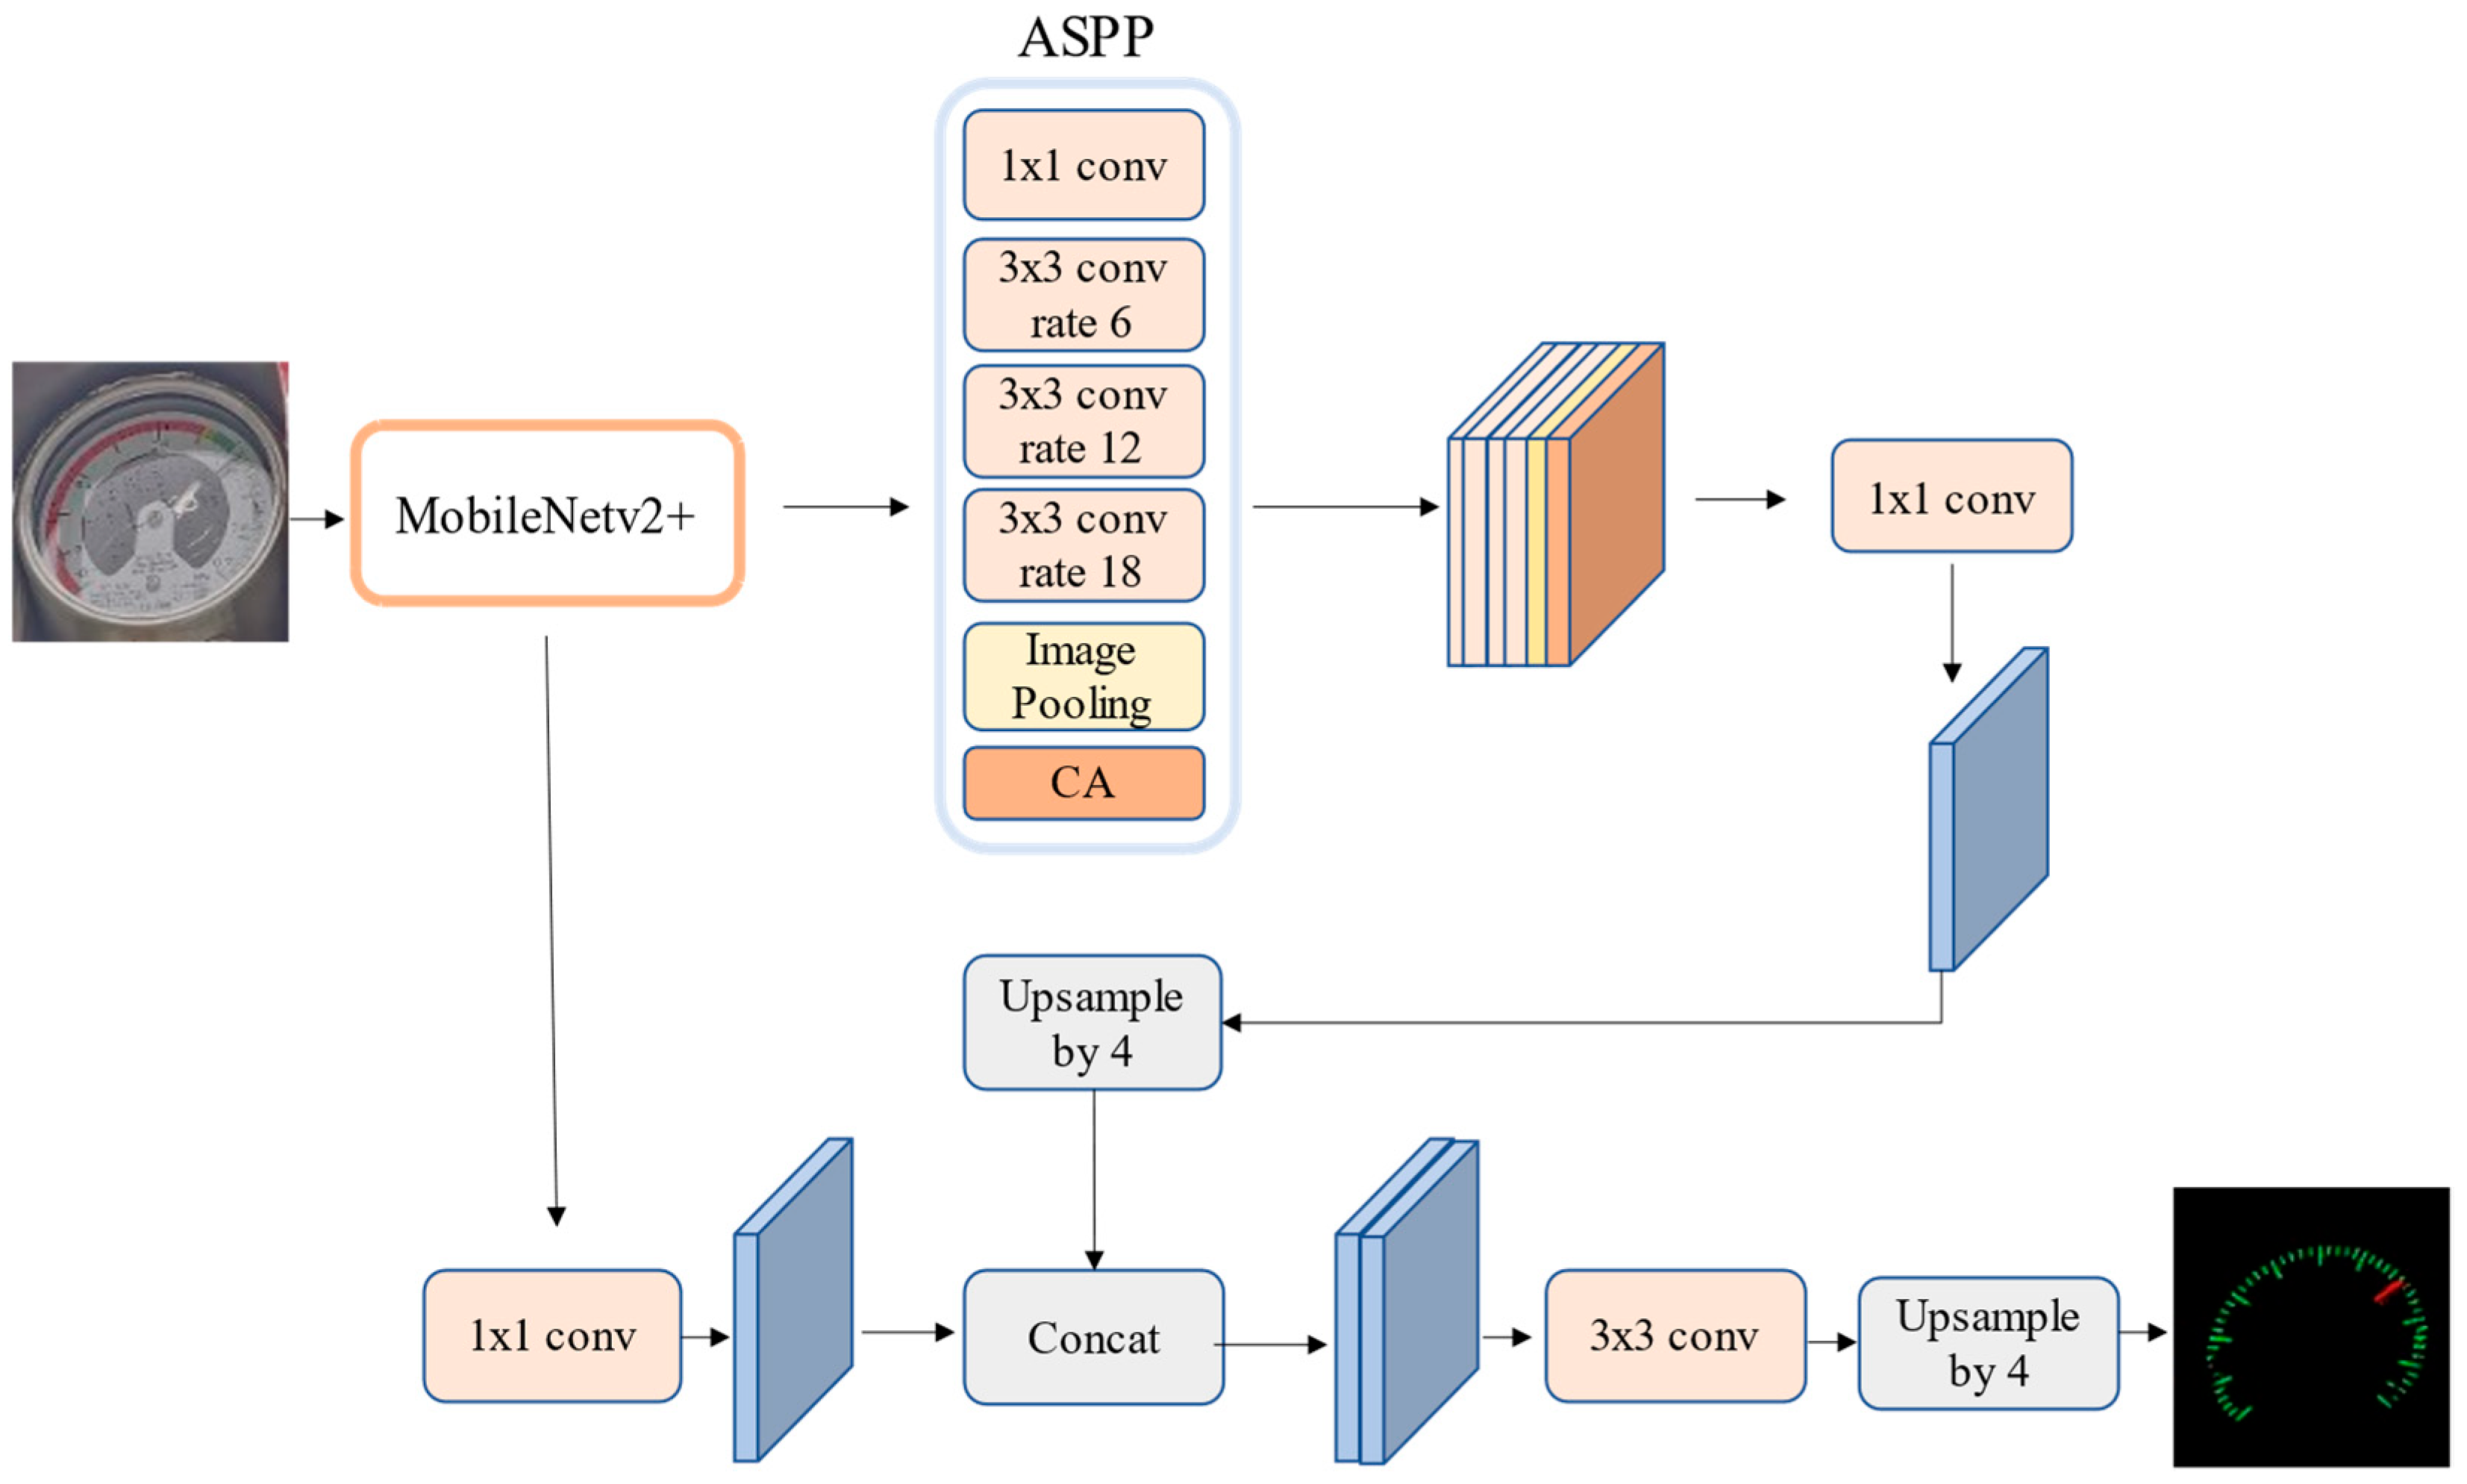
3.1.1. Replacement of the Feature Extraction Network

Given that the substantial parameter count of the original segmentation network is incompatible with the real-time requirements of industrial applications, we propose to replace the feature extraction network with the more compact MobileNetV2 architecture. The core structural component of MobileNetV2 is the inverted residual block, as depicted in Figure 3b. While the inverted residual block incorporates depthwise separable convolution to reduce the model’s parameter count and employs shortcut connections in the low-dimensional bottleneck layer to preserve effective feature extraction capabilities, it also presents certain limitations [14,15]. Specifically, the compression of feature channels in the bottleneck layer may result in the loss of critical information, and the reduced feature dimensionality can induce gradient confusion, adversely affecting the training outcomes [16,17]. To mitigate these issues, we introduce the SG (Sand Glass) module as an alternative to the inverted residual block, forming the MobileNetV2+ architecture. The structure of the SG module is illustrated in Figure 3c. In this module, the initial and terminal convolutional layers of the main branch utilize channel-preserving spatial depthwise convolution to extract more spatial information. Additionally, to emulate the bottleneck structure, the SG module employs two consecutive pointwise convolutions to modulate the channel dimensions. By configuring a wider intermediate layer, the SG module effectively circumvents the loss of critical information during feature compression. Moreover, the larger intermediate feature dimensionality facilitates reduced gradient confusion during backpropagation and achieves a more balanced computational load [18].
The architecture of the MobileNetV2+ network is detailed in Table 1. In this table, t denotes the expansion factor, where t = 1 signifies no channel expansion, while other values indicate channel expansion; c represents the number of output channels; n indicates the number of repetitions of the residual block; and s specifies whether the input feature layer undergoes spatial compression. If s = 1, no spatial compression is applied.

3.1.2. CA Module

To facilitate the precise segmentation of fine pointers and scales within the dial, the feature extraction capability of the network must be augmented. The attention mechanism allows the network to concentrate on the scale regions and pointers within the dial, thereby improving the accuracy of segmentation. The CA (coordinate attention) mechanism is incorporated into the ASPP structure, enabling the network to adaptively focus on pointer targets and thereby enhancing segmentation performance [19]. The working principle of the CA mechanism primarily consists of two parts: the embedding of coordinate information and the generation of coordinate attention.
  • Embedding of Coordinate Information
To preclude the total compression of spatial information into the channel dimension, the CA mechanism employs a decomposed global average pooling strategy. This approach facilitates the attention module in capturing long-range spatial interactions that retain precise positional information. The specific operation involves pooling the input feature map along the horizontal and vertical axes separately. The network generates direction-aware feature maps by aggregating features along different directions, enabling more accurate localization of the targets of interest. Specifically, two pooling kernels with different spatial ranges, (H, 1) and (1, W), are applied to the input × to encode each channel along the horizontal and vertical coordinate directions, respectively. Formula (1) represents the output at height h for the c-th channel, while Formula (2) represents the output at width w for the c-th channel.
z c h h = 1 W 0 < < i < < W x c h , i ,
z c ω w = 1 H 0 < < j < < H x c j , w
2.
Generation of Coordinate Attention
To fully capitalize on the positional information captured during the coordinate information embedding phase, the precise capture of regions of interest must be ensured. During the coordinate attention generation phase, the coordinate information feature maps derived from two distinct directions are subjected to concatenation and subsequently transformed into new feature maps through a convolutional transformation function. The corresponding formula is presented as follows:
f = δ F 1 Z h , Z ω ,
In Equation (3), δ represents a nonlinear activation function. After generating the new feature map, it is split along the spatial dimension into height-direction features f h R C × H r and width-direction features f ω R C × W r through a Split operation, where r is the channel reduction rate, which is used to reduce the computational load. Subsequently, after dimensionality expansion, attention weights g h and g ω are generated through an activation function. Finally, the output coordinate attention formula is as follows:
y c i , j = x c i , j × g c h i × g c ω j
In Equation (4), y c ( i , j ) signifies the value of the c-th channel of the output feature map at the spatial location ( i , j ) ; x c ( i , j ) represents the original value of the c-th channel of the input feature map at the position ( i , j ) ; and g c h ( i ) denotes the attention weight of the c-th channel at the height position ( i ) , while g c w ( j ) represents the attention weight of the c-th channel at the width position ( j ) .
In conclusion, by integrating coordinate information (i.e., the positional information of each pixel), the CA mechanism enables the model to more effectively capture subtle variations and local features within images, thereby enhancing the segmentation efficacy for fine-grained targets. The structure of the CA mechanism is illustrated in Figure 4.

3.1.3. Improvement of the Loss Function

The original DeepLabV3+ model conventionally utilizes the cross-entropy loss function as its principal loss function. However, the substantial discrepancy in the number of pixel labels between dial scales and dial pointers within the dataset renders the cross-entropy loss function incapable of effectively managing the class imbalance problem, which consequently leads to suboptimal segmentation outcomes. To mitigate this issue, the Equalized Focal Loss (EFL) function is utilized. By incorporating a category-specific modulating factor into the Focal Loss (FL) function, it enables independent processing of pixel labels across different classes, thereby alleviating the impact of class imbalance [20]. By augmenting the weights of pixel labels corresponding to rare categories, this method ensures that the loss contributions of minority classes are not overshadowed by those of frequent classes, thereby enhancing the segmentation performance of minority targets [21]. The mathematical expression of the EFL function is given as follows:
E F L ( p t ) = j = 1 c α t γ b + γ v j γ b 1 p t γ b + γ v j ln p t
In the formula, γ b and γ v j collectively form the class frequency modulation factor, which is designed to address the imbalance between positive and negative samples. Here, γ b is a constant that constrains the fundamental behavior of the classifier, while γ v j is an adjustable parameter that denotes the degree of imbalance for the class j. The term γ b + γ v j γ b serves as a weighting factor to mitigate the influence of minority classes in the loss function.
The overall architecture of the dial segmentation model proposed in this paper is illustrated in Figure 5, showing the aforementioned improvements. Given the replacement of the backbone network with a more lightweight architecture, the introduction of the CA mechanism, and the adoption of the EFL function, the proposed model is more adept at addressing the application scenarios described in this paper, which are characterized by low image pixel resolution, substantial interference, and complex environmental conditions.

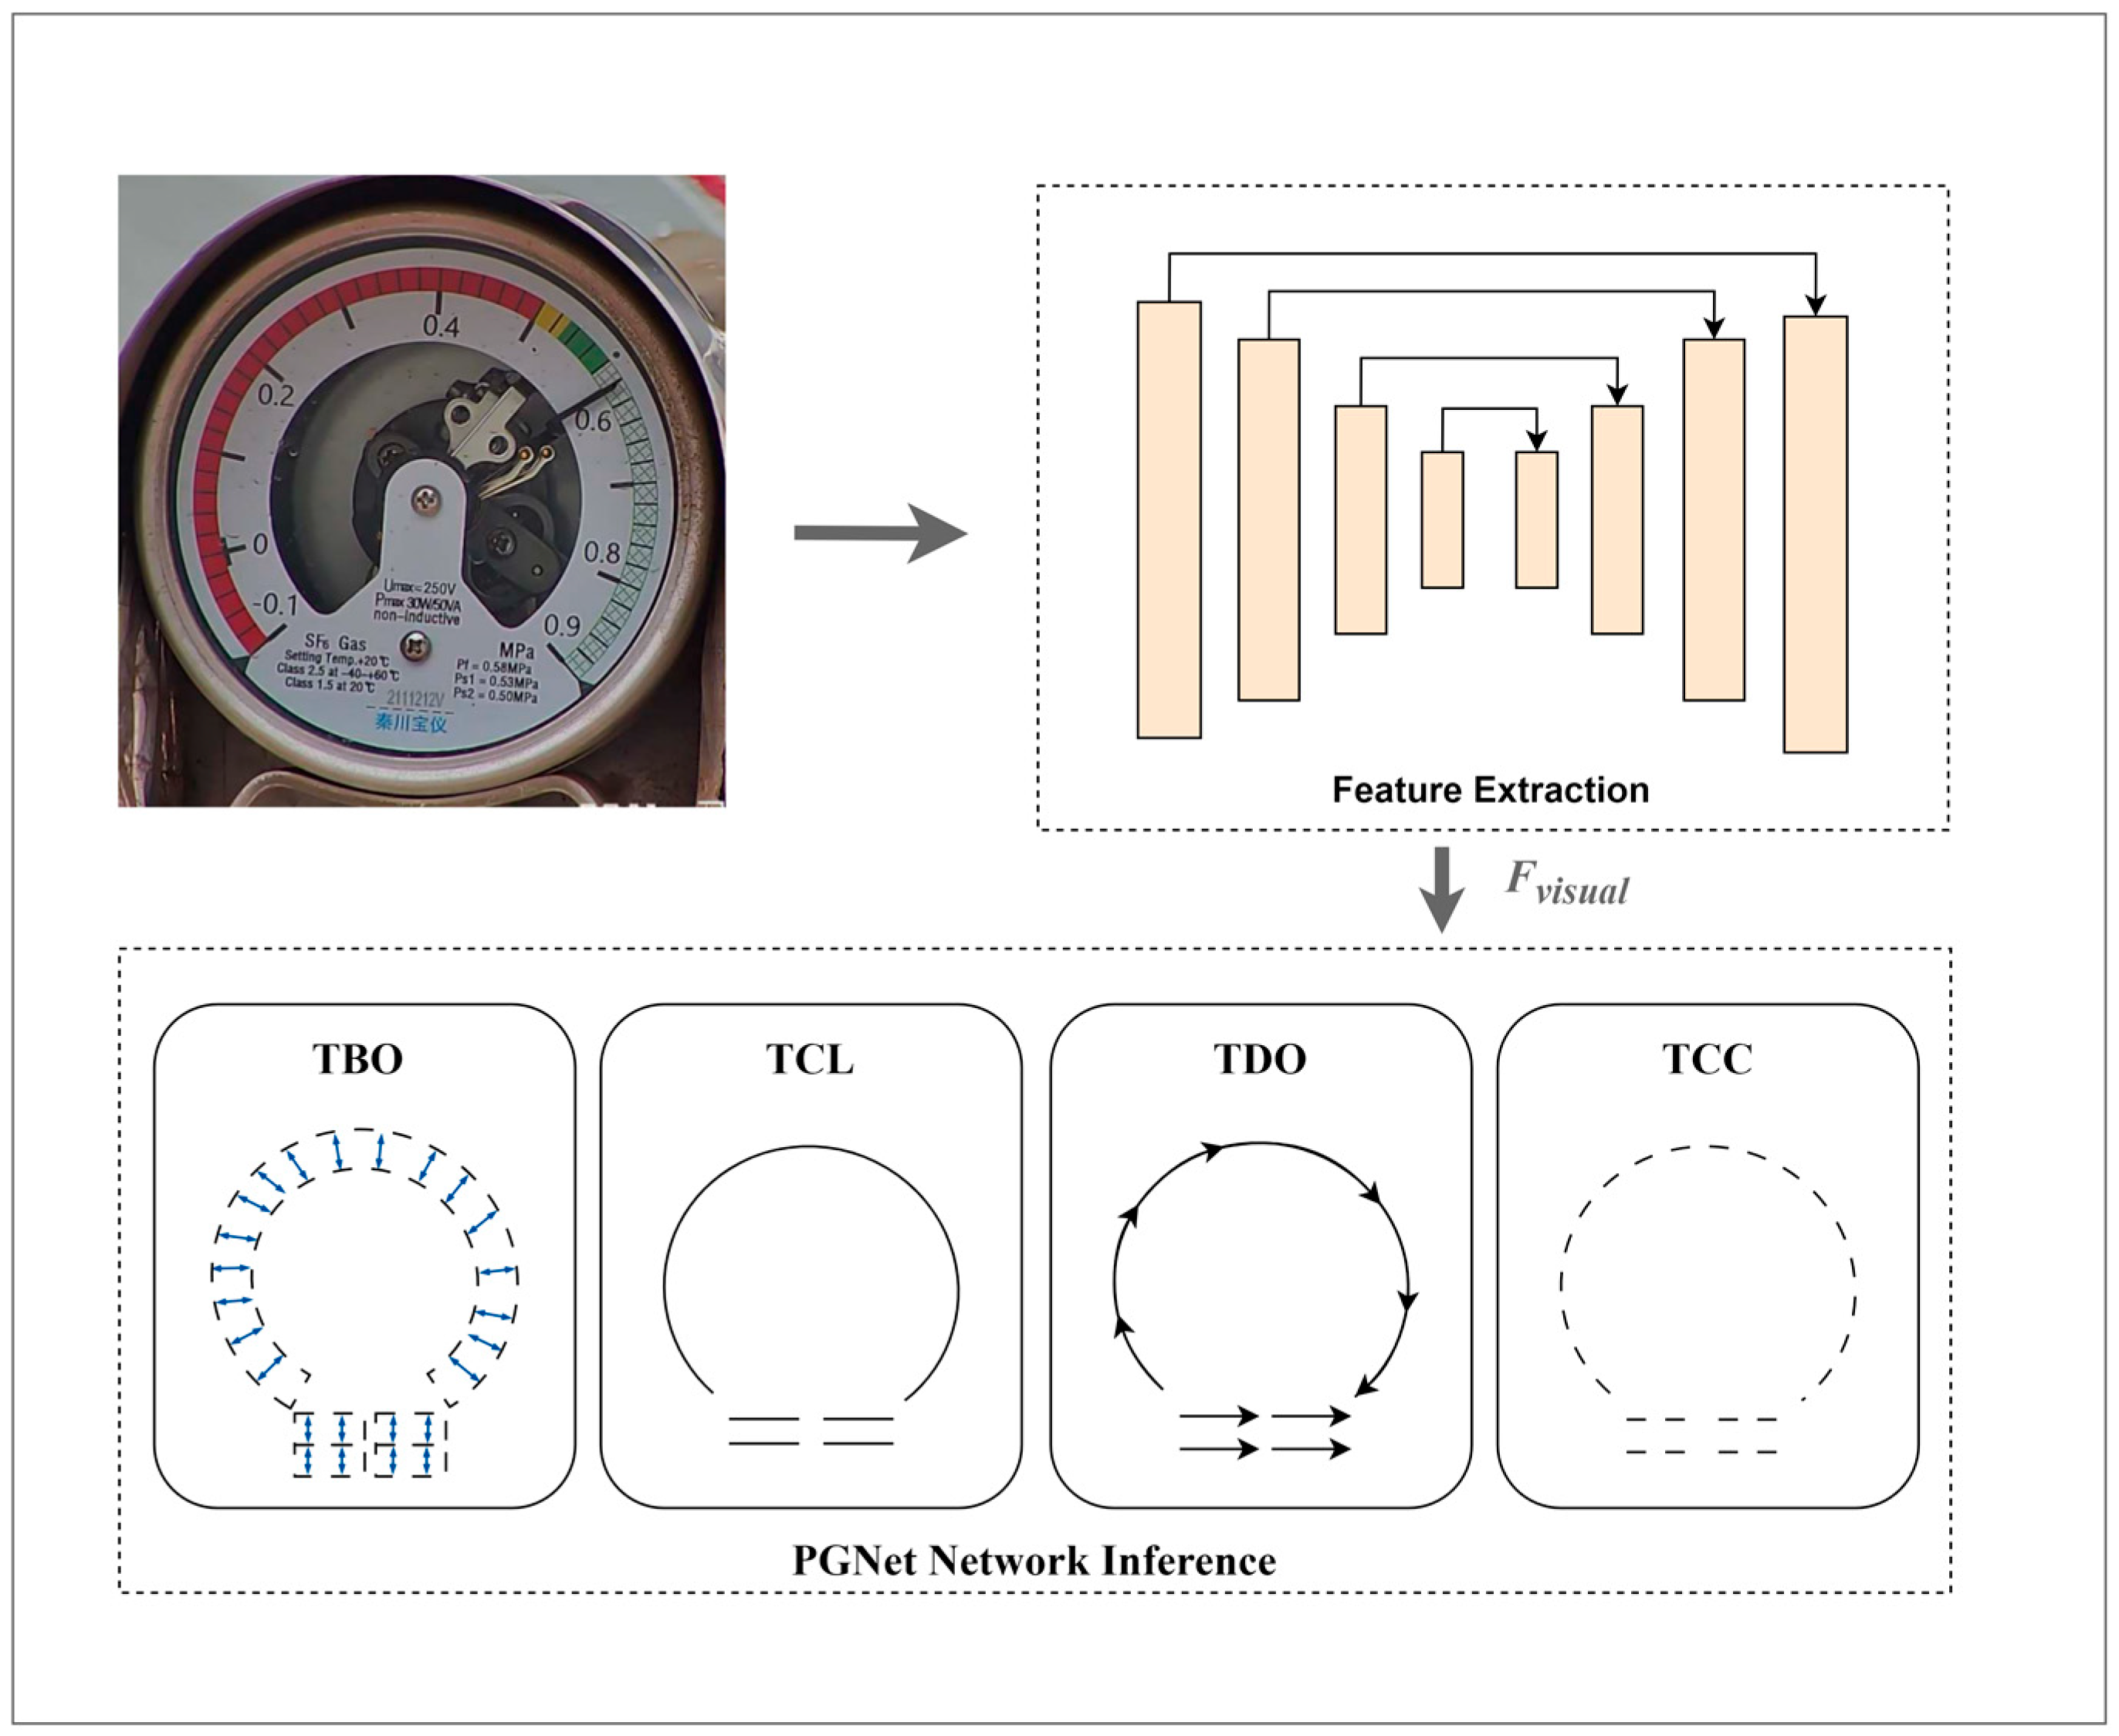
3.2. Automatic Recognition of Pointer-Type Instrument Dial Readings

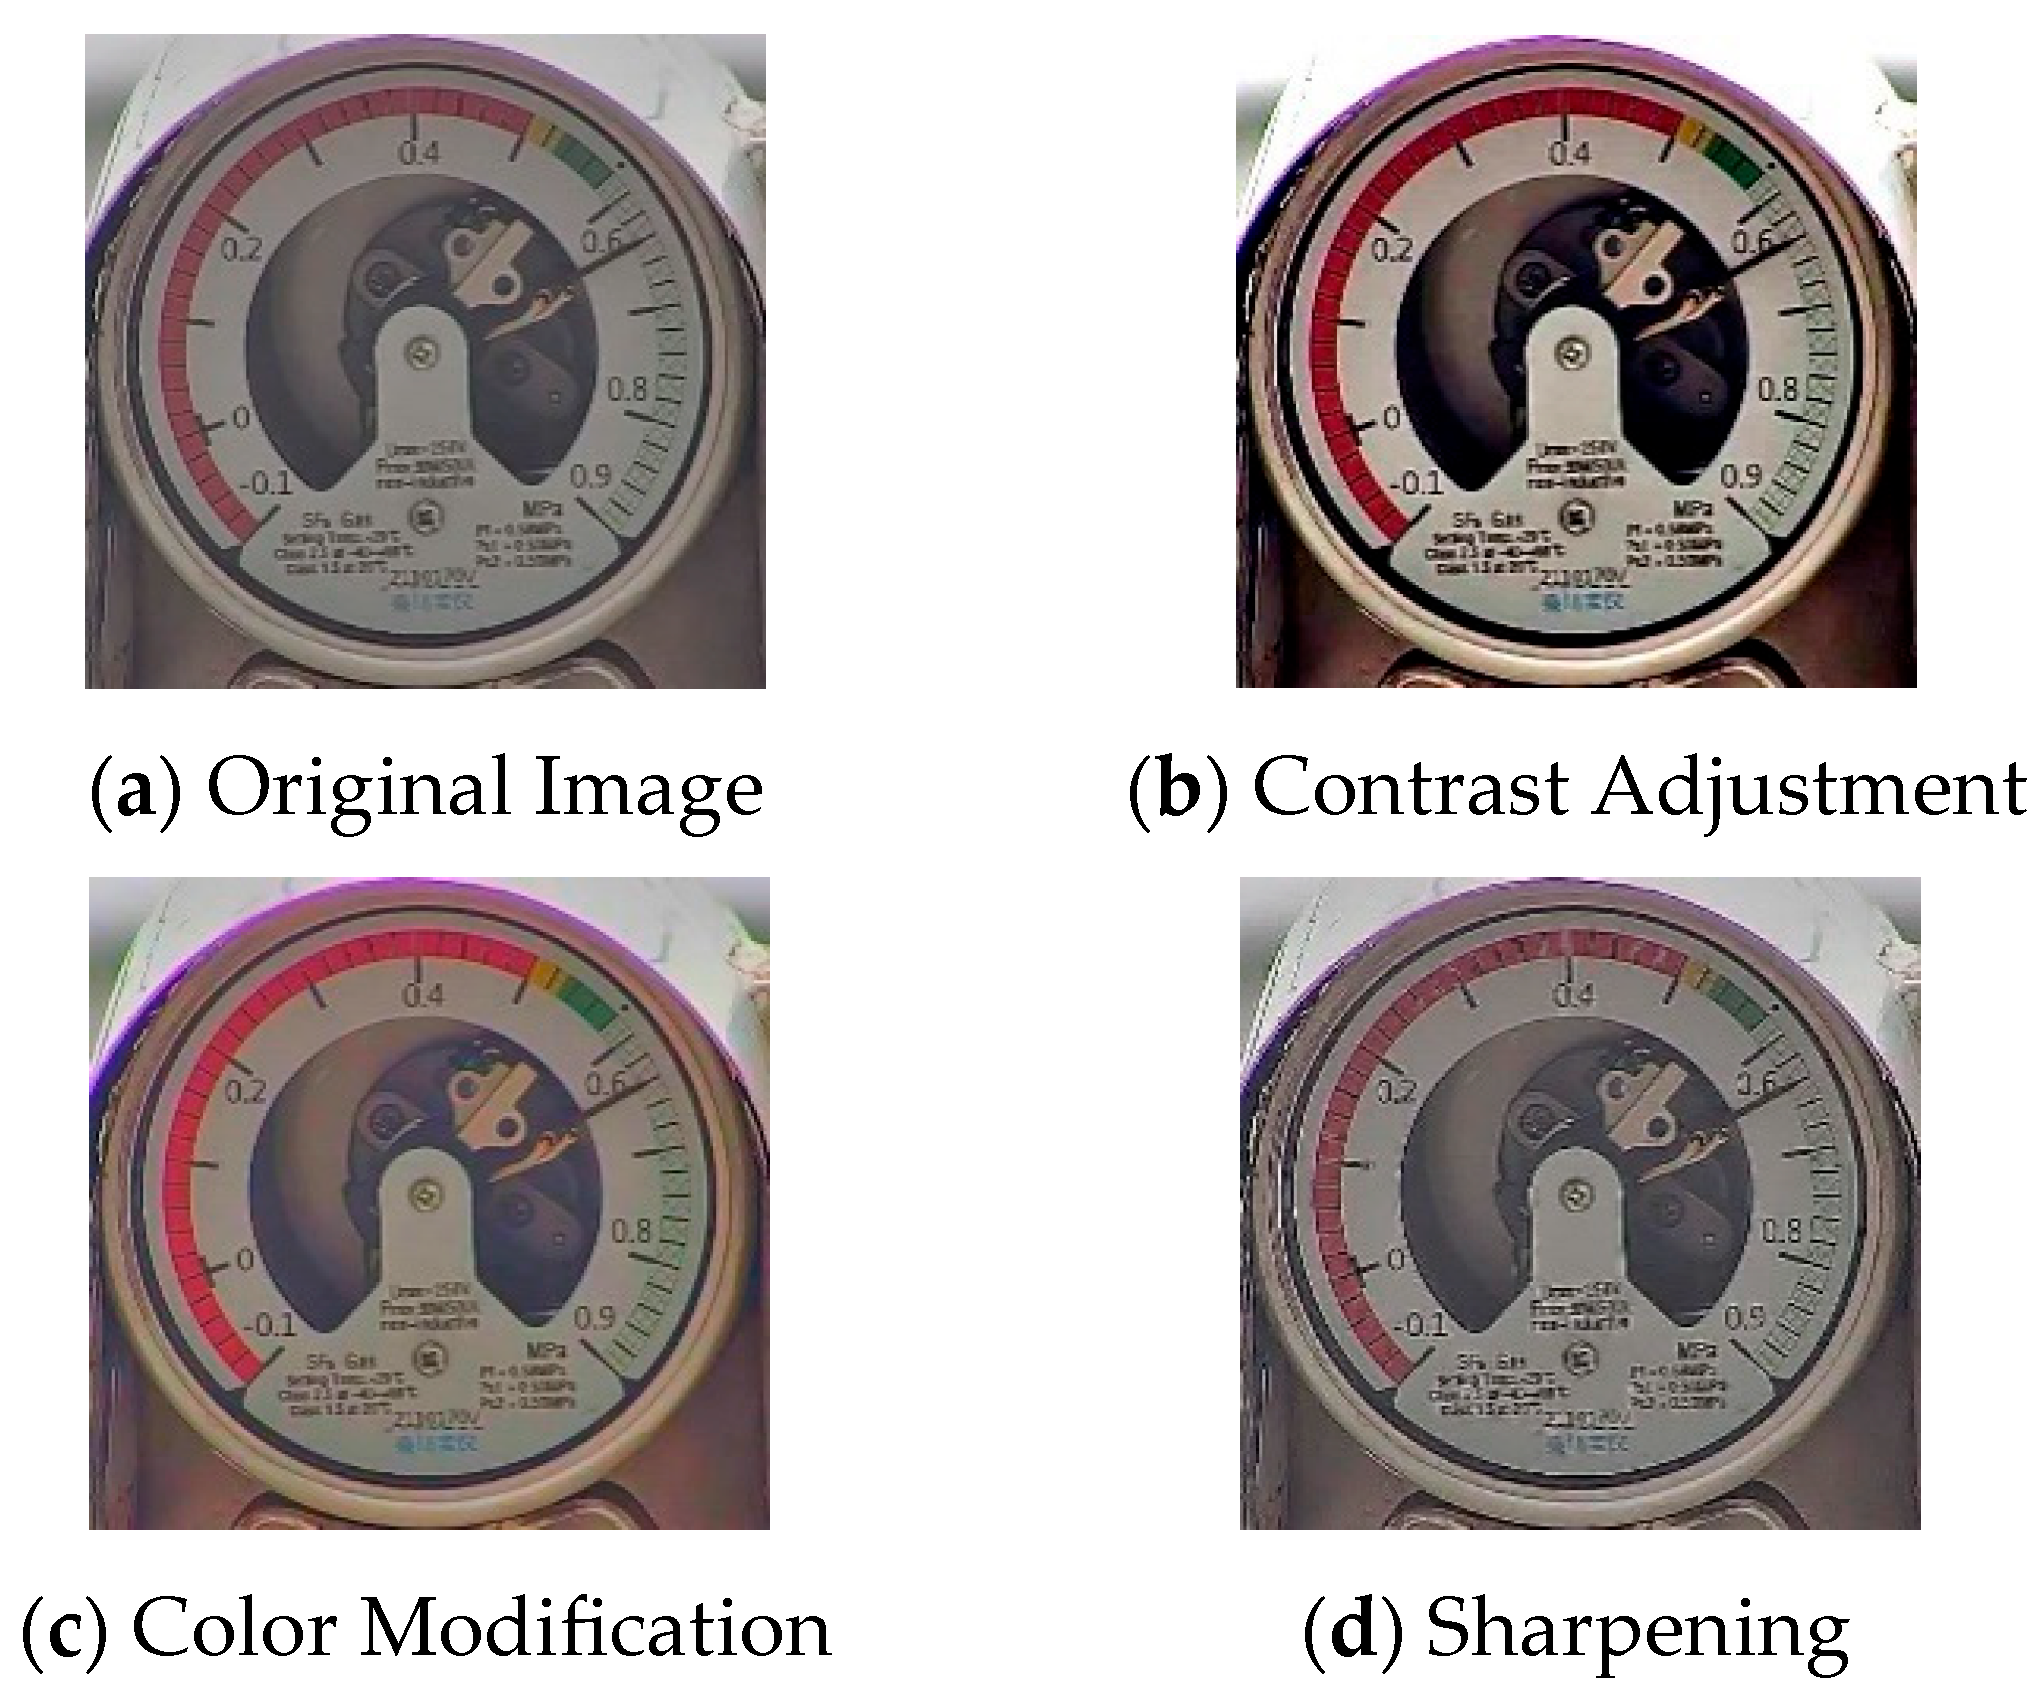
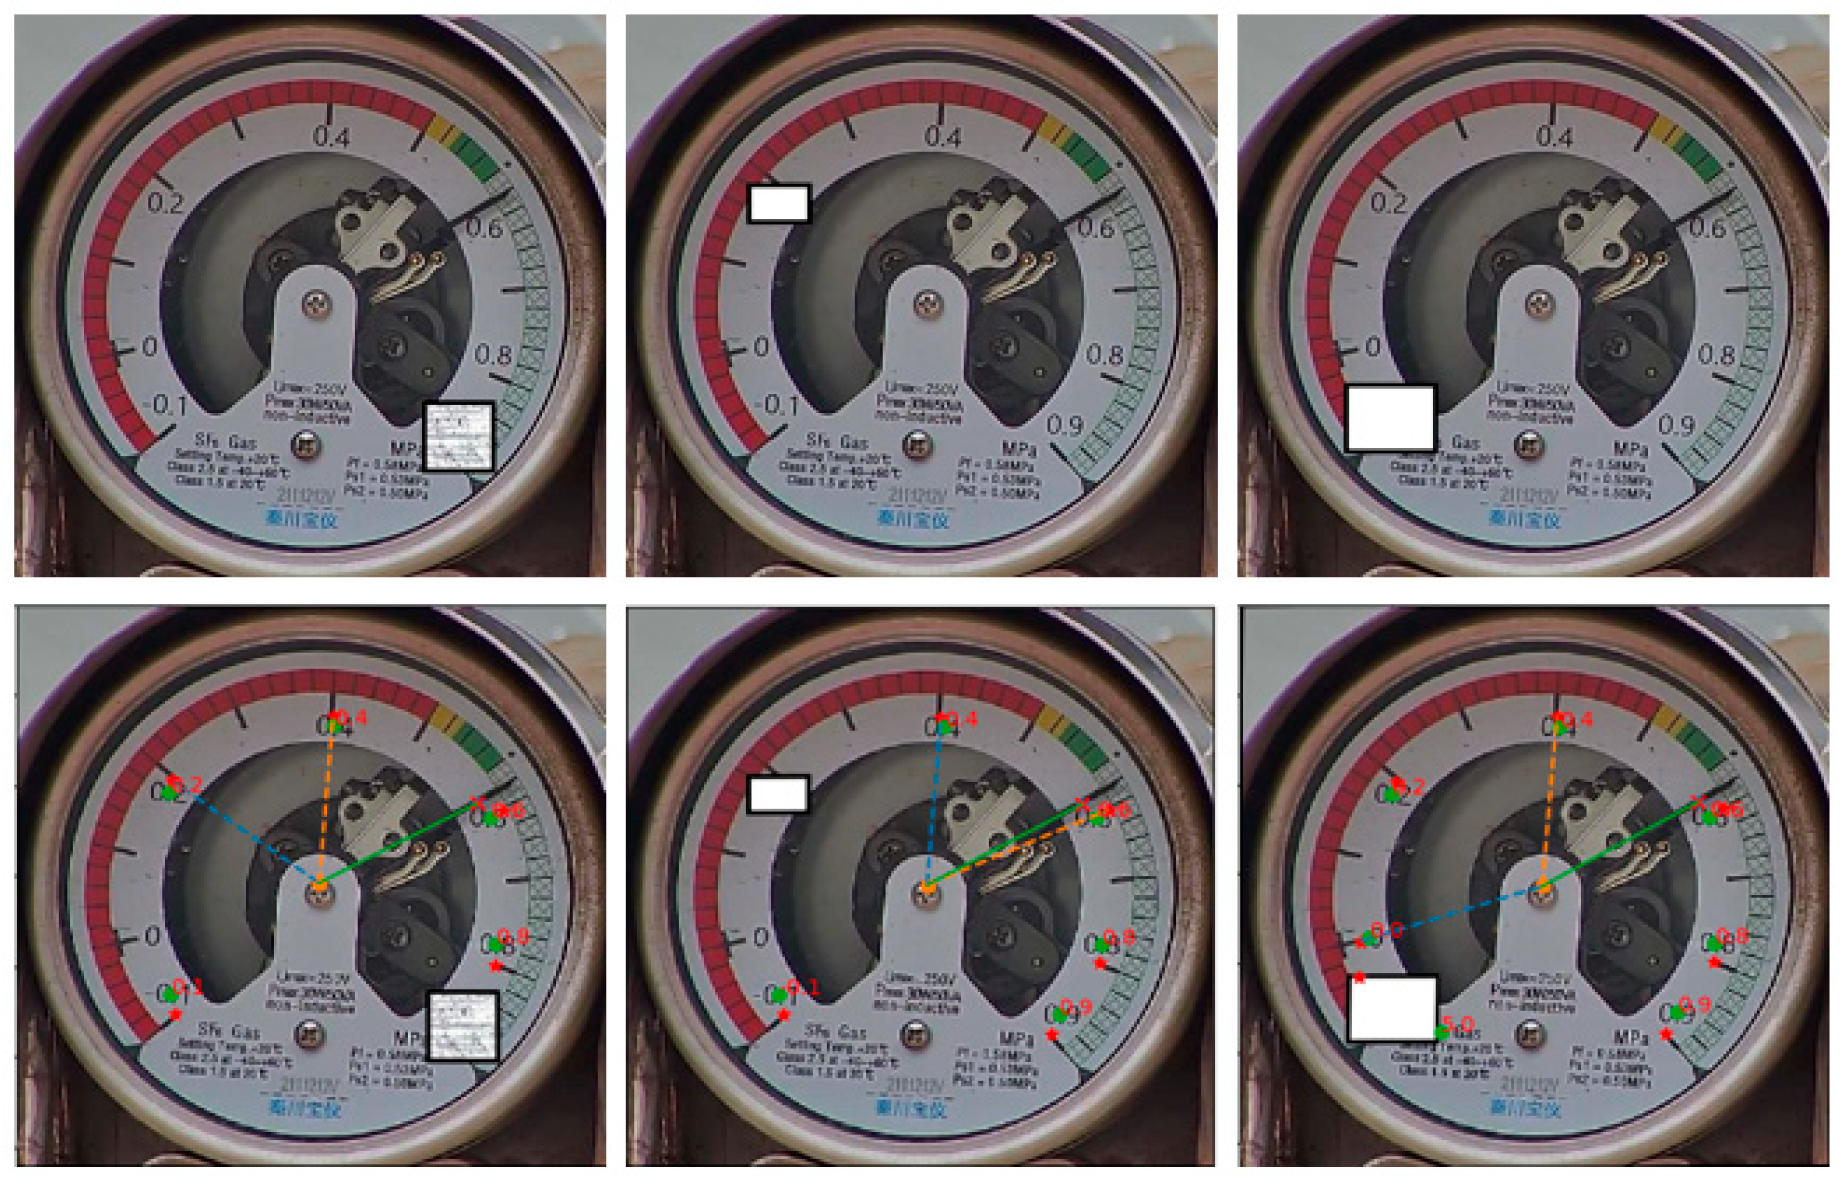
3.2.1. Distortion Image Rectification

Given that the majority of the collected dial images exhibit distortion, to ensure the accuracy of subsequent reading recognition, ellipse fitting and affine transformation based on direct least squares are utilized to rectify the distorted images. The general equation of an ellipse is
A x 2 + B x y + C y 2 + D x + E y + F = 0
Here, A, B, C, D, E, and F are the parameters of the ellipse to be determined, while x , y represents the points in the image. Subsequently, an error function is constructed for each point x i , y i and minimized to obtain the optimal parameters, thereby enabling the fitted ellipse to closely approximate the distorted region in the image. The construction formula is presented as follows:
min = i = 1 N ( A x i 2 + B x i y i + C y i 2 + D x i + E y i + F ) 2
Following the ellipse fitting via the least squares method, the geometric attributes of the ellipse, including its center, orientation, and semi-major and semi-minor axes, are accurately extracted. Subsequently, an affine transformation is applied. This transformation adjusts the scale of the coordinate system, equalizing the semi-major and semi-minor axes of the ellipse, thereby converting the fitted ellipse into a circle. Ultimately, the distorted dial image is rectified to obtain an upright dial image. The mathematical expression for the affine transformation is given as follows:
x y 1 = a 11 a 12 t x a 21 a 22 t y 0 0 1 x y 1
In the formula, x , y signifies the original coordinates, while x , y represents the transformed coordinates. The parameters t x and t y denote the translation vectors, and a i j represents the elements of the matrix that encapsulate rotation, scaling, and shearing transformations.

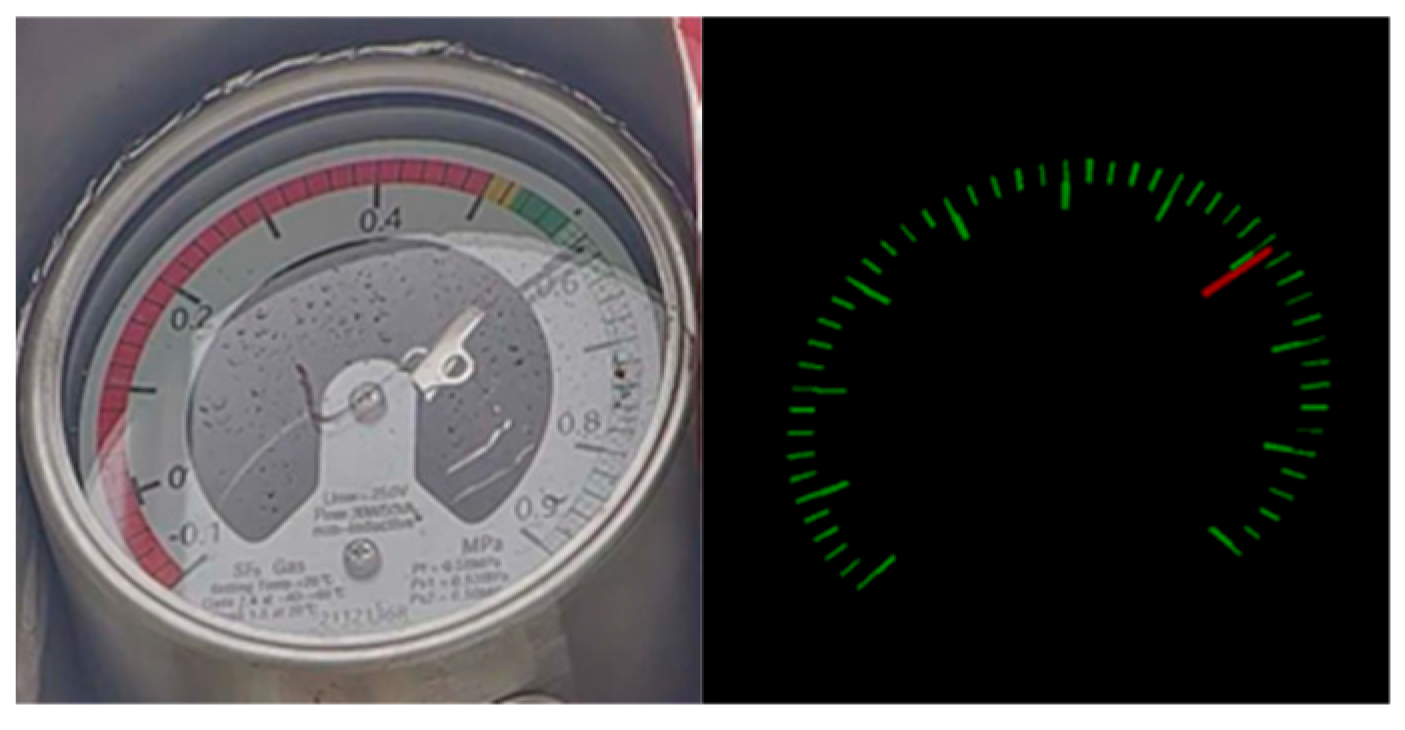
3.2.2. Identification of Scale Information on Pointer-Type Instrument Dials

Traditional OCR technologies generally involve two distinct stages: text detection and recognition. However, factors such as image distortion, font diversity, and camera angle can often result in inaccurate information recognition. Especially in the context of recognizing text information within dial images, image blurring or distortion often results in inaccurate identification of critical information such as the range. To mitigate this issue, PGNet is utilized in this study for the recognition of characters on the dial. PGNet is an end-to-end neural network that utilizes a fully convolutional neural network (FCN) for feature extraction and accomplishes text detection and recognition through four key tasks: Text Boundary Offset (TBO) identification, Text Center Line (TCL) recognition, Text Direction Offset (TDO) recognition, and Text Character Classification (TCC) feature extraction. During the recognition process, the center point sequence of each text instance is initially extracted from the Text Center Line (TCL). Subsequently, the text is sorted based on the Text Direction Offset (TDO) information to restore the correct reading order, thereby facilitating the recognition of text in non-traditional reading directions. Additionally, the precise localization of each text instance is achieved through polygonal restoration, leveraging the boundary offset information (TBO). Ultimately, the PG-CTC decoder converts the sequence of Text Character Classification (TCC) features into a sequence of character probabilities, thereby completing the decoding process to yield the final recognition result [22]. PGNet is capable of directly recognizing text of various shapes and curved forms, thereby circumventing the stepwise processing inherent in traditional OCR technologies. Its unique text direction reconstruction mechanism enables it to maintain high recognition accuracy even when confronted with text that is rotated, curved, or irregularly arranged, thus accommodating variations in dial images and shooting angles. The specific structure of PGNet is shown in Figure 6.

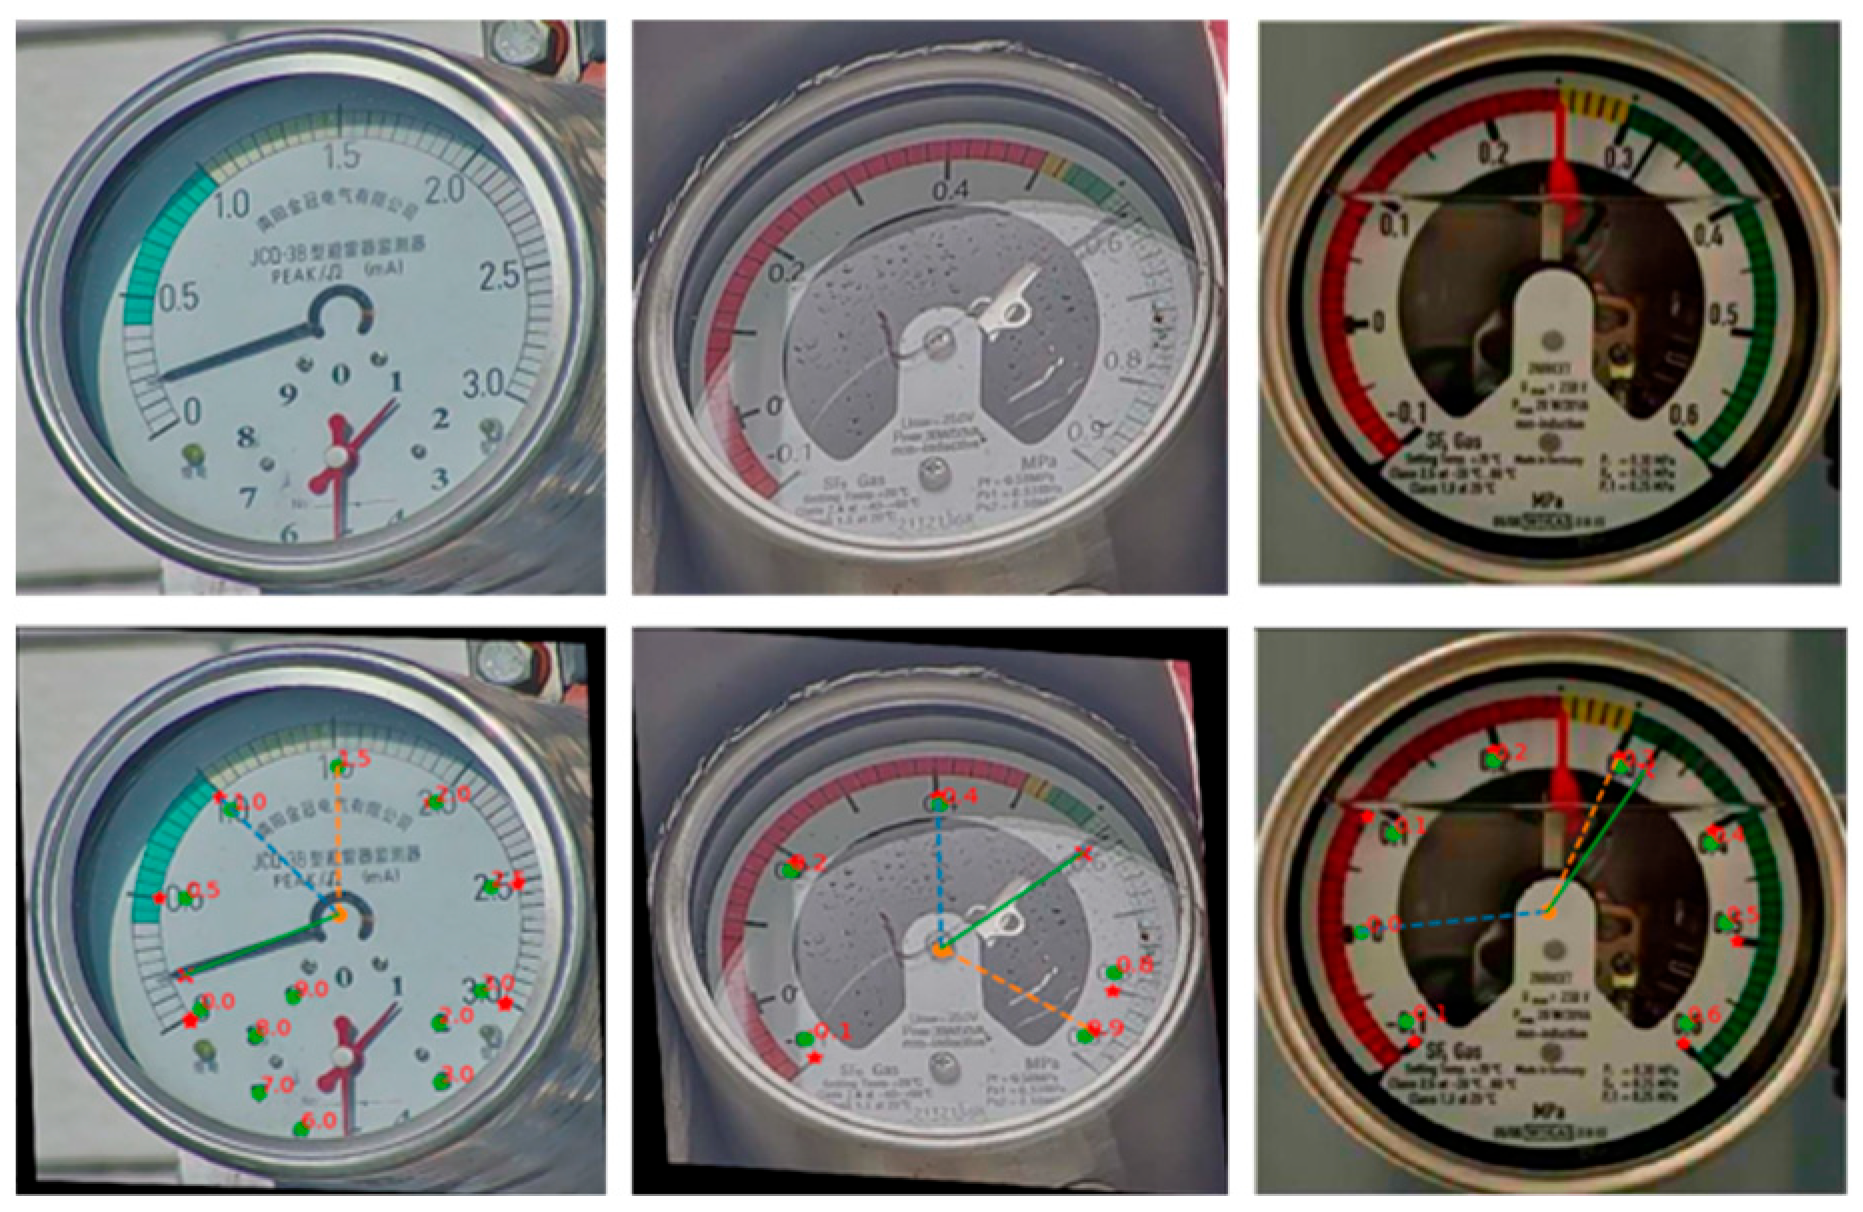
3.2.3. Coordinate Matching

Owing to the exposure of the dials to outdoor environments, the numerical information at the starting position of the scale range may be occluded. This condition presents a significant challenge to traditional reading algorithms, which find it difficult to accurately acquire the scale range information when the complete scale range of the dial cannot be fully identified. Although the majority of current reading algorithms depend on text recognition models to extract the scale range information from dials, these algorithms generally necessitate the complete display of the scale range on the dial. To tackle this problem, this paper introduces a coordinate matching method based on the nearest neighbor approach, which can effectively match the dial scales with the scale text information even in the presence of occlusions, thereby accurately obtaining the scale positions required for angular reading.
The procedures for scale text coordinate matching based on the nearest neighbor and optimized point selection are as follows:
  • Initialize the matching set following the acquisition of the set of pixel coordinates for the segmented dial scales and the set of center coordinates for the dial numerical text;
  • Traverse each text center to identify the nearest scale point, computing the Euclidean distance between the current scale point and the text center;
  • If the computed distance is less than the established minimum distance, update the minimum distance and designate the current scale point as the nearest scale point;
  • Document each text center and its nearest scale point, along with their distance, in the matching pairs, and sort these pairs in ascending order of distance;
  • Extract the two matching pairs with the smallest distances.

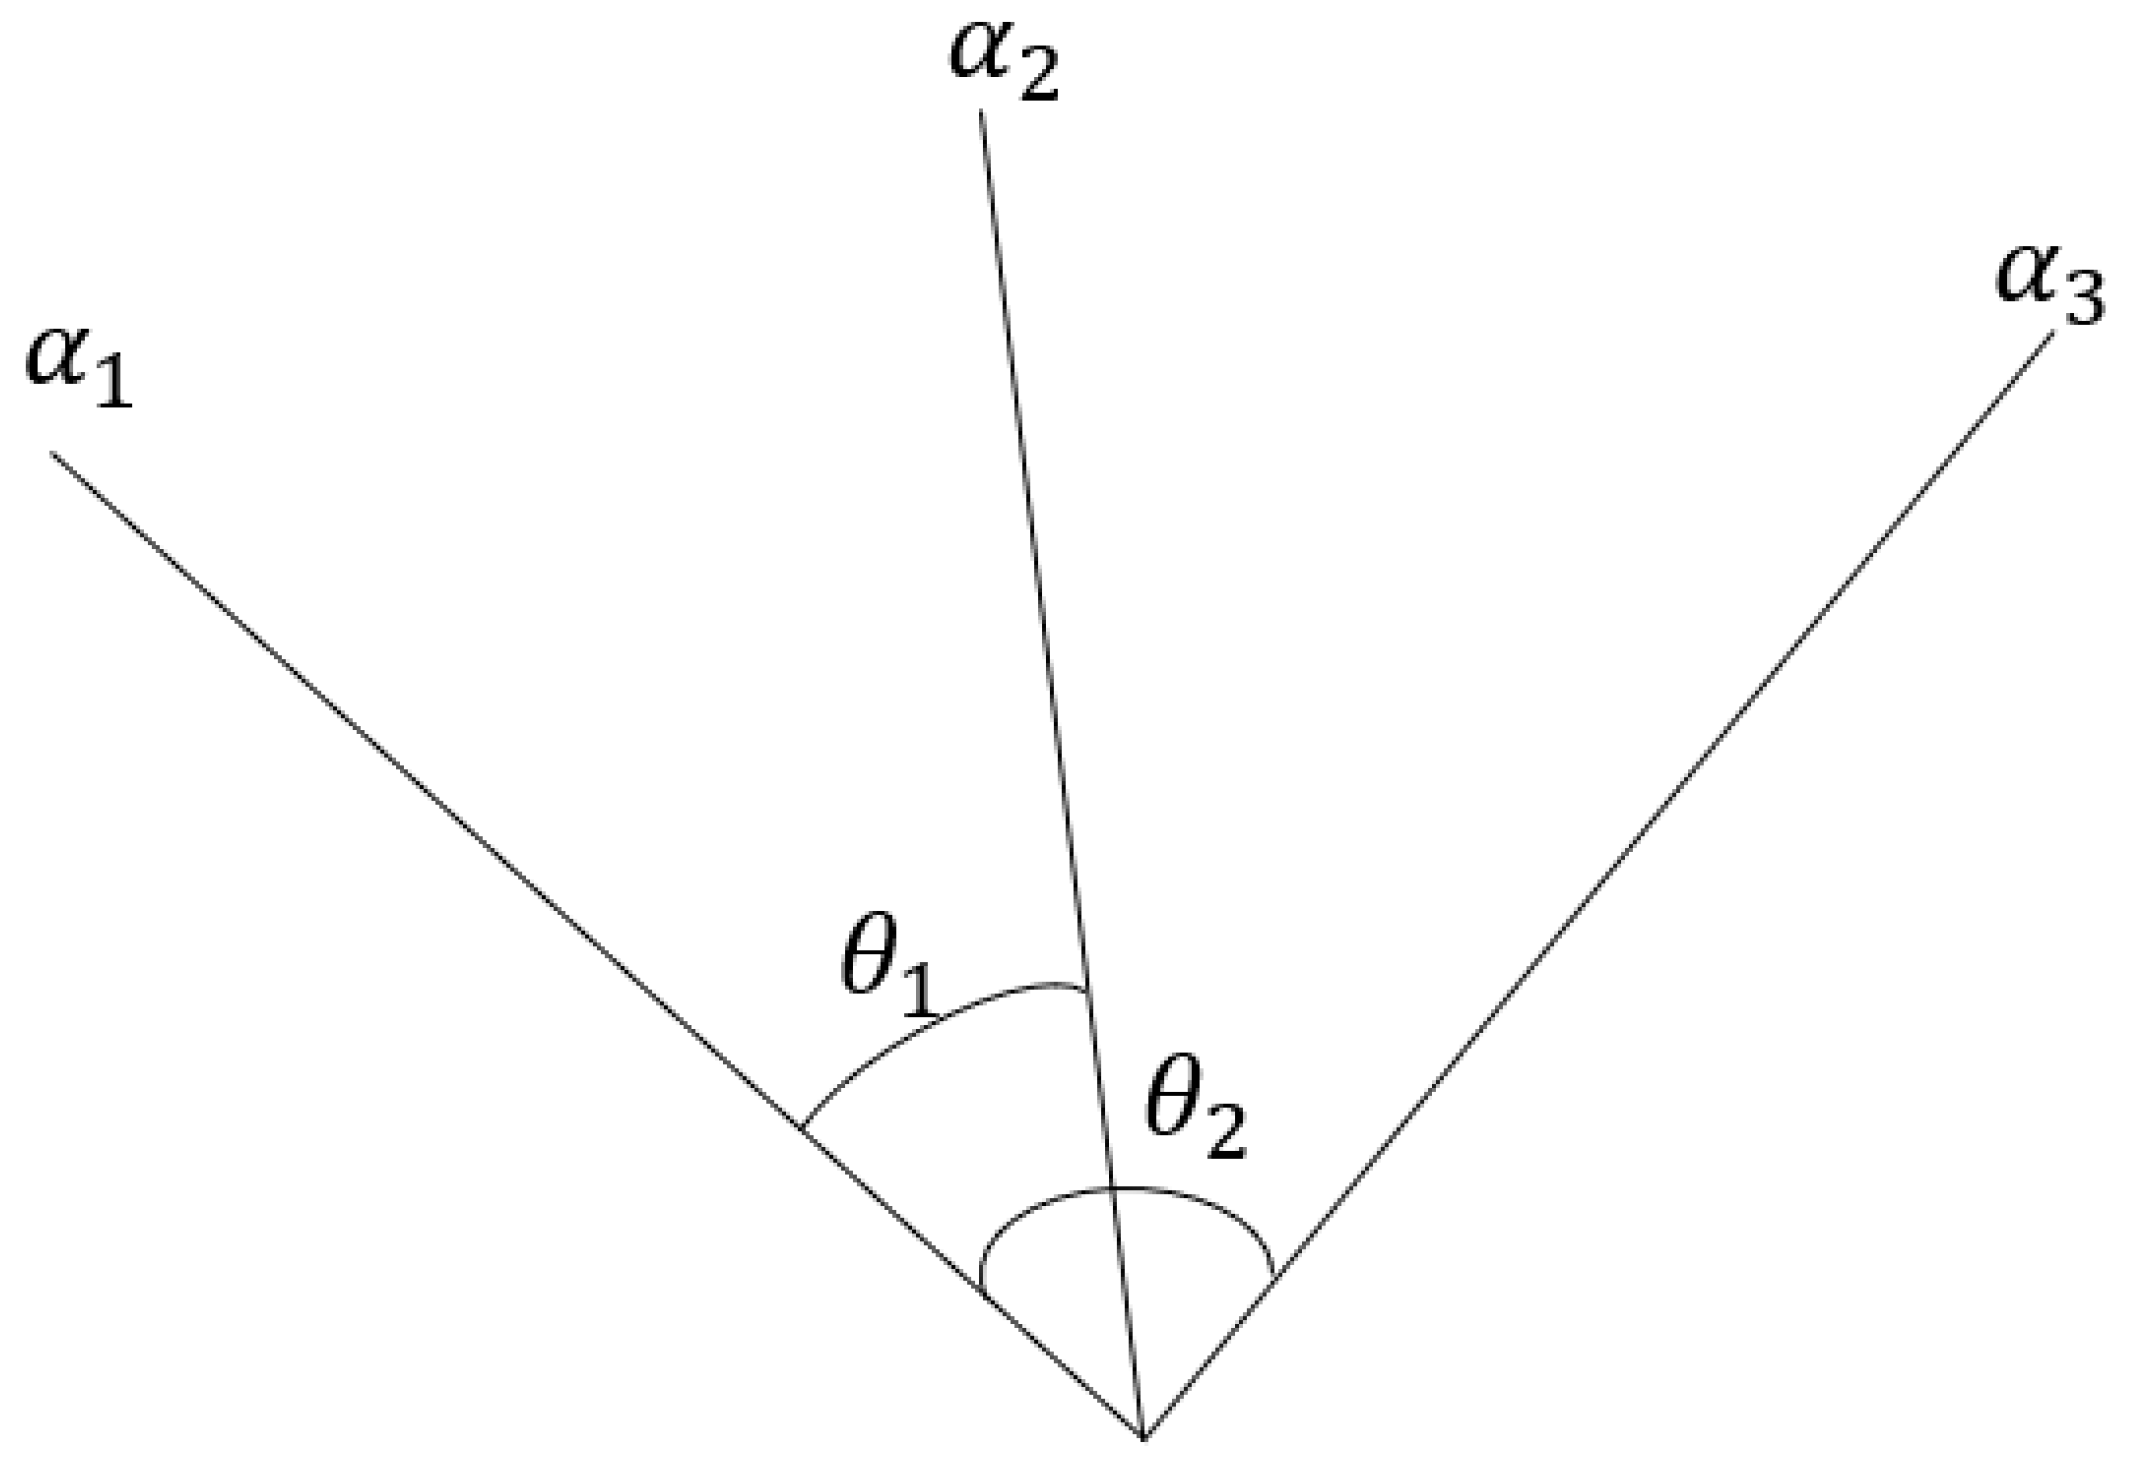
3.2.4. Angular Measurement Method for Reading

The angular method calculates the value by identifying three line segments and the two angles formed between them within the dial image. The endpoints of these line segments are defined as follows: the first line segment extends from the center of the dial to the pixel point of the first scale mark, the second line segment extends from the center of the dial to the pixel point of the second scale mark, and the third line segment extends from the center of the dial to the pixel point of the pointer.
The two angles are specifically defined as θ 1 , which is the angle formed between the line segment connecting the dial center to the first scale mark and the line segment connecting the dial center to the pointer, and θ 2 , which is the angle formed between the line segment connecting the dial center to the first scale mark and the line segment connecting the dial center to the second scale mark. These angular relationships are depicted in Figure 7.
After the acquisition of the angular relationships illustrated in the above figure, the current dial reading is determined by employing the formula of the angular method:
y = x 1 + θ 1 θ 2 x 2 x 1
y = x 1 θ 1 θ 2 x 2 x 1
In the formula, θ 1 and θ 2 signify the angles, x 1 represents the scale value corresponding to the pixel point of the first scale mark, x 2 represents the scale value corresponding to the pixel point of the second scale mark, and y denotes the current dial value obtained. The numerical reading is computed using Equation (9) when the detected pointer position is situated to the right of scale mark one. In contrast, Equation (10) is employed for calculating the numerical reading when the pointer position is located to the left of scale mark one.

4. Experiments

The experiments were conducted on a platform equipped with an Intel Core i7-6800k CPU, a GeForce GTX 1080Ti GPU, and 31.3 GB of memory (Intel/NVIDIA, Santa Clara, CA, USA). The software environment for the ADPR algorithm experiments included Ubuntu 16.04 as the operating system, Python 3.7.16 as the programming language, PyTorch 2.0.1 as the deep learning framework, Torchvision 0.15.2 as the computer vision library, and CUDA 10.2 for GPU acceleration.

4.1. Dataset

The experiment utilized substation dial images collected by a power company in Sichuan. The initial dataset comprised 440 cropped dial images. Data augmentation methods, including color adjustment, contrast variation, and brightness alteration, were employed to expand the dataset. Examples of data augmentation are illustrated in Figure 8. By training the network model using these augmented methods, it is enabled to perform effective dial segmentation under various lighting conditions, thereby enhancing its applicability in real-world scenarios.
During the image labeling process, the images were meticulously categorized into three distinct classes: scale, pointer, and background. Each image was accompanied by corresponding manually annotated labels. The augmented dataset, comprising a total of 1760 images, was randomly partitioned into training, validation, and test sets in a ratio of 7:1:2. An example of the data labeling is presented in Figure 9, where the background is denoted by black, the scale by green, and the pointer by red.

4.2. Evaluation Metrics

  • Pointer-Type Instrument Dial Segmentation
To substantiate the efficacy of the segmentation network proposed in this study, a comprehensive set of metrics was employed to assess the segmentation performance of the network. These metrics encompass Pixel Accuracy (PA), Mean Pixel Accuracy (MPA), Mean Intersection over Union (MIoU), Precision, and Recall. The mathematical formulations for these evaluation metrics are delineated as follows:
P A = T P + T N T P + T N + F T + F N
I o U = T P T P + T N + F N
M I o U = 1 k + 1 i = 0 k T P T P + T N + F N
P r e c i s i o n = T P T P + F P
R e c a l l = T P T P + F N
In the formulas, TP denotes the number of samples correctly classified as positive, TN denotes the number of samples correctly classified as negative, FP denotes the number of negative samples incorrectly classified as positive, and FN denotes the number of positive samples incorrectly classified as negative.
2.
Recognition of Readings
The evaluation criteria for reading recognition are defined as follows: a reading is deemed accurate if the relative error between the algorithmic reading result and the manual reading result is within ±3%; a reading is considered biased if the relative error is between ±3% and ±5%; and a reading is classified as incorrect if the relative error exceeds ±5%.

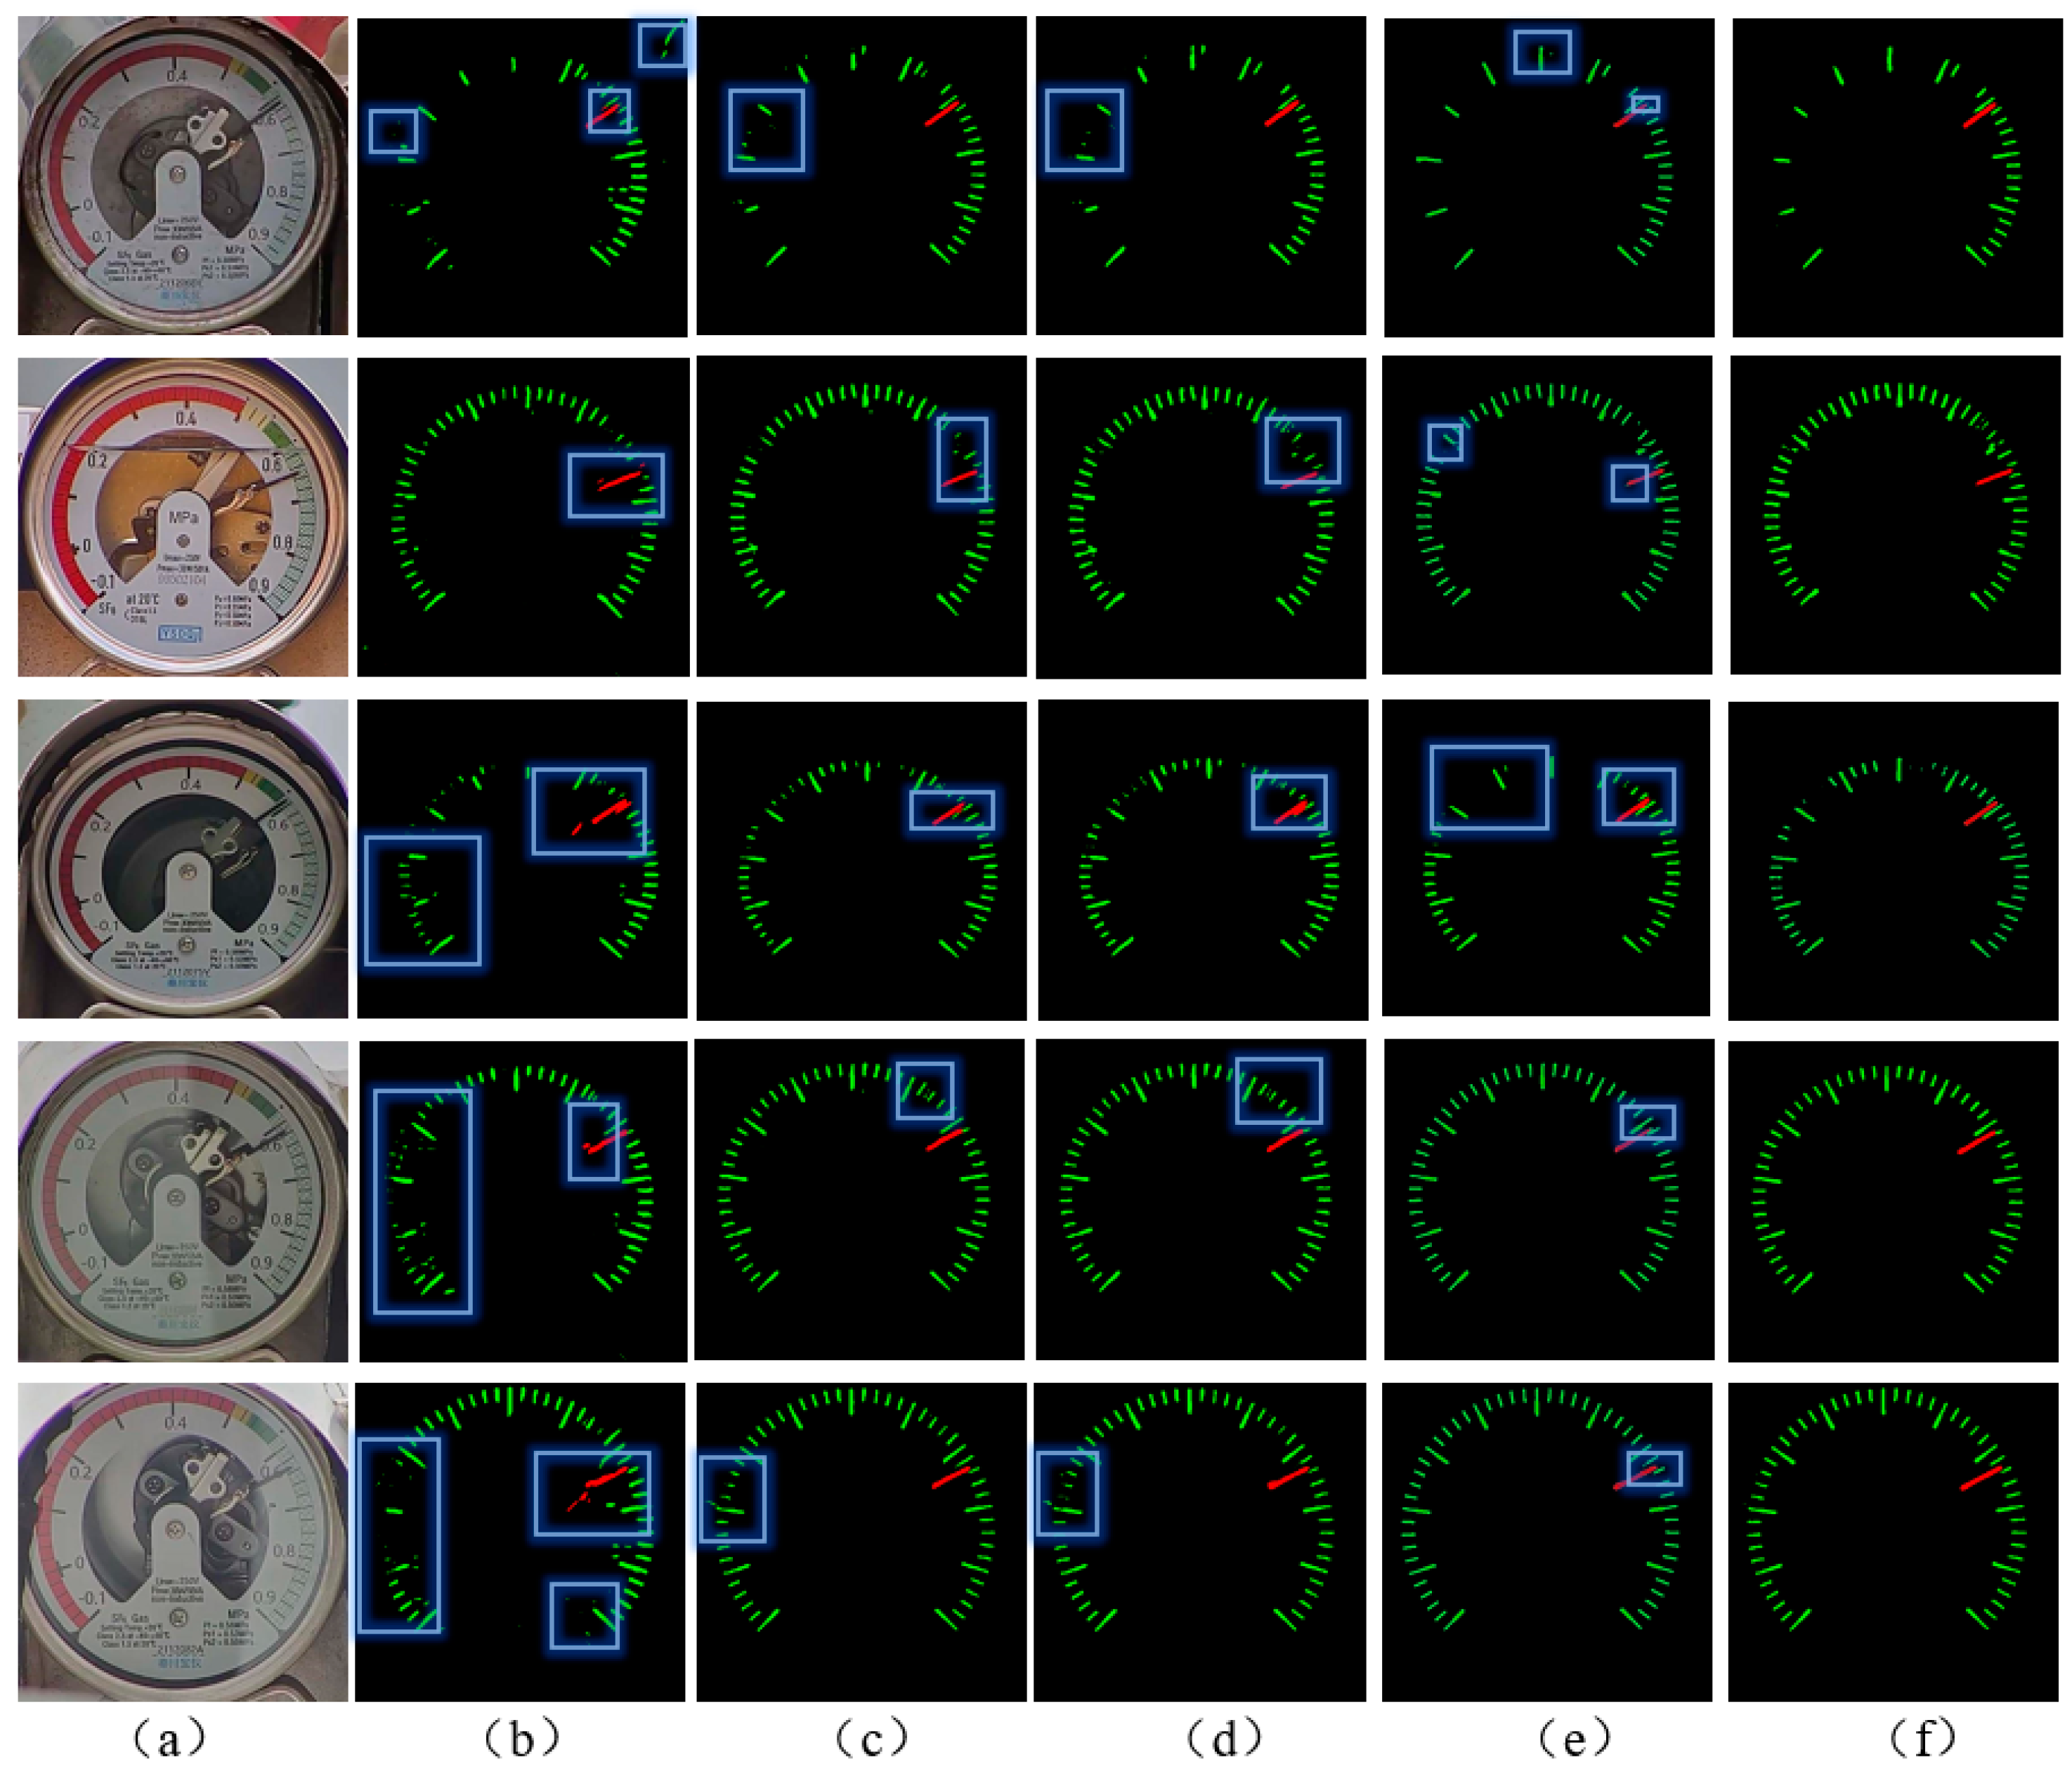
4.3. Results of Pointer-Type Instrument Dial Segmentation Experiments

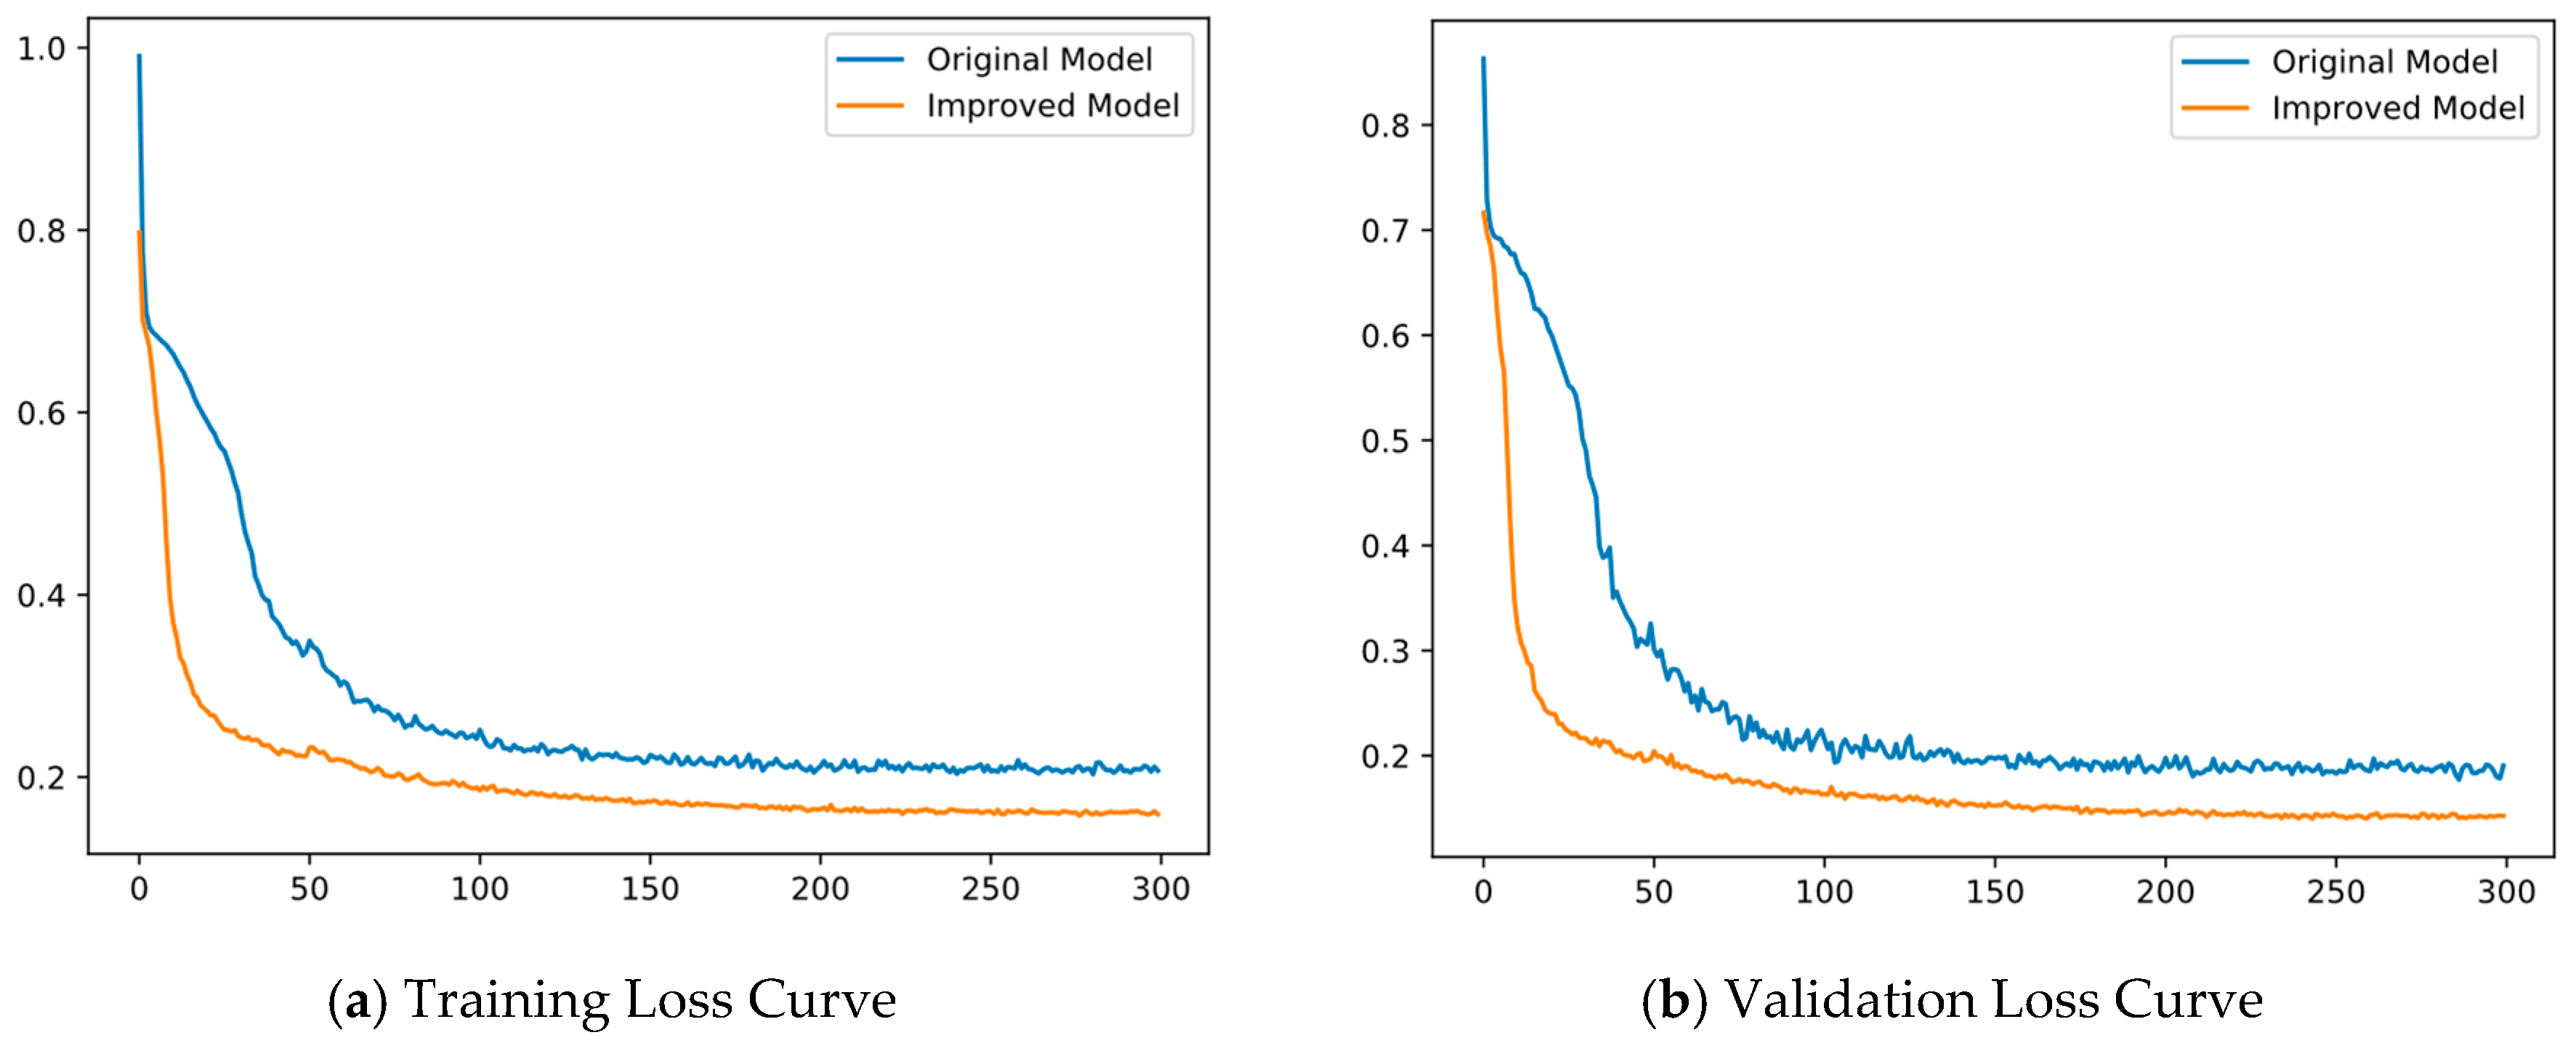
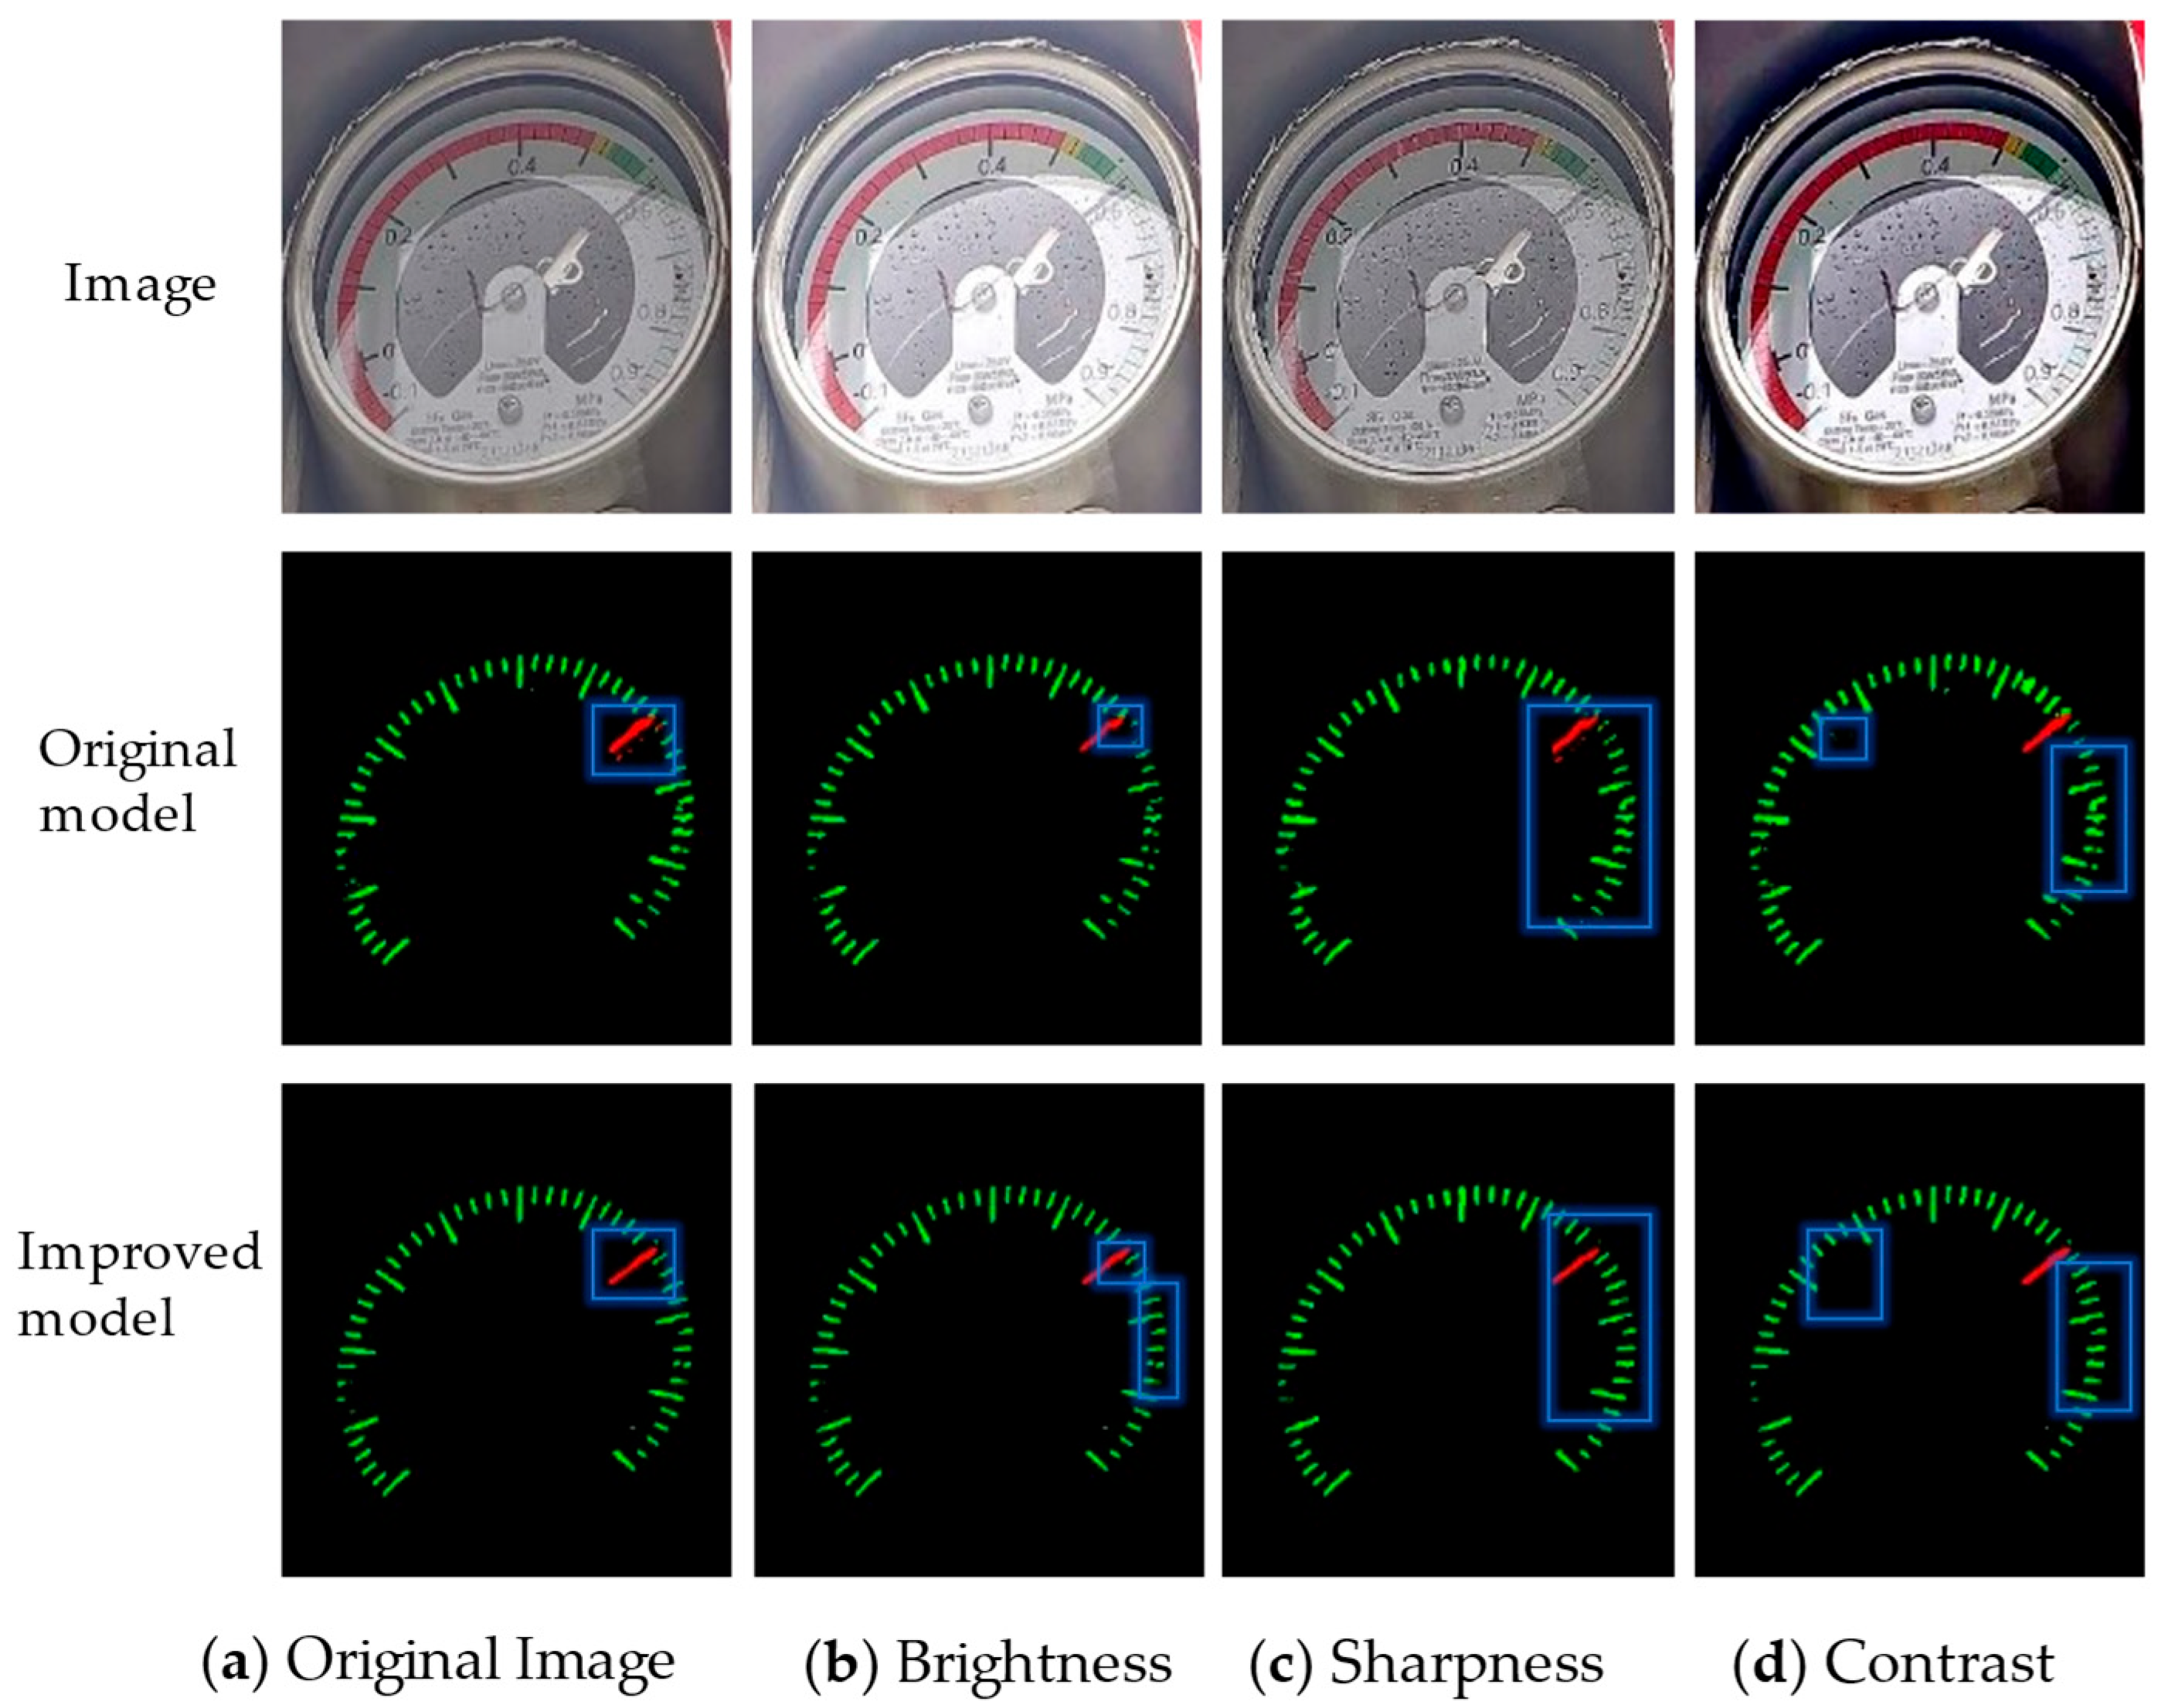
4.3.1. Comparative Analysis of Segmentation Network Performance: Pre- and Post-Improvement

Figure 10 illustrates the variations in loss values during the training process of the DeepLabv3+ network for dial scales and pointers, both before and after the improvements. The results depicted in the figure reveal that the initial training and validation loss values of the improved network are lower than those of the original network. This suggests that the improved network exhibits enhanced learning capabilities and can more effectively adapt to the data at the beginning of training. Moreover, as the number of iterations increases, the convergence of the training and validation loss curves of the improved network is markedly superior to that of the original network, thereby substantiating the improved network’s superiority.
To elucidate the influence of various attention mechanisms on segmentation accuracy, this study systematically evaluated the performance of the CA, SE, CBAM [23], and FcaNet [24] attention mechanisms integrated into the ASPP module of the DeepLabv3+ network, following the replacement of the feature extraction network. The experimental outcomes are detailed in Table 2. Notably, the CA mechanism exhibited the most pronounced enhancement in segmentation accuracy while maintaining a lower parameter count compared to the other three mechanisms.
The original CE loss function in the baseline network is looked at in this paper, along with the EFL function. We conducted comparative experiments using different loss functions to validate the effectiveness of the EFL function. Table 3 presents the experimental results.
To further validate the effectiveness of each module within the improved DeepLabV3+ network in the dial segmentation module, a series of ablation experiments were conducted. These experiments tested the effects of individual improved modules and their combinations. Experiment 1 employed the baseline network. Experiment 2 involved the substitution of the backbone network in the baseline network. Experiment 3 introduced the CA mechanism based on Experiment 2. Experiment 4 replaced the CE loss function with the EFL function based on Experiment 2. Experiment 5 implemented the final improvement method proposed in this chapter, which integrates the baseline network, lightweight backbone network, CA mechanism, and EFL function. In the table, “√” signifies the incorporation of the respective module, whereas “—” indicates its omission. Table 4 delineates the detailed experimental results.
The results presented in Table 4 indicate that each of the improved modules has a positive effect on the baseline network. Experiment 1 employed the baseline model, which featured a parameter count of 41.20 M, an MIoU of 74.2%, and an MPA of 88.8%. In Experiment 2, the original Xception feature extraction network was substituted with the MobileNetV2 backbone network. This replacement resulted in a reduction in the parameter count from 41.20 M to 4.09 M, while the MIoU increased from 74.2% to 76.7%, and the MPA improved from 88.8% to 90.6%. In Experiment 3, the introduction of the CA mechanism based on Experiment 2 further enhanced the MIoU to 78.3% and the MPA to 91.7%. Experiment 4 saw improvements in both MIoU and MPA, which increased to 77.8% and 91.1%, respectively, after incorporating the EFL function from Experiment 2. Ultimately, when the MobileNetV2 backbone, CA mechanism, and EFL function were simultaneously applied to the baseline network, the parameter count was reduced to 4.25M, the MIoU increased to 79.7%, and the MPA improved to 92.7%. The experimental results demonstrate the significant efficacy of the improved modules in reducing computational load and enhancing segmentation performance.
Due to the outdoor environment of substations, this paper considers how changes in lighting intensity can affect the collected dial image data, degrading the segmentation outcomes for pointers and scales. We subjected the collected dial data to brightness adjustment, sharpening, and contrast modification to simulate different lighting scenarios and investigate the robustness of the improved network under varying lighting conditions. Figure 11 shows the visual comparison of segmentation results under varying lighting conditions, both before and after the network improvement. When the lighting intensity fluctuates, the original model exhibits inferior robustness against interference, particularly when subjected to sharpening and contrast adjustment, resulting in pronounced inaccuracies in the segmentation of the pointer. In contrast, the improved model consistently maintains accurate segmentation results across different lighting conditions, thereby demonstrating enhanced robustness against interference compared to the original model.

4.3.2. Comparative Analysis of Segmentation Network Performance

To further substantiate the efficacy of the proposed improved network, a comprehensive comparative analysis was conducted against several state-of-the-art segmentation networks, namely the original DeepLabV3+, PSPNet [25], SwiftNet [26], and Mask2Former [27]. The detailed experimental results are summarized in Table 5.
In terms of the Mean Pixel Accuracy (MPA), the traditional DeepLabV3+ network achieved an accuracy of 88.8%, PSPNet reached 90.8%, SwiftNet attained 91.1%, and Mask2Former achieved 91.9%. In contrast, the proposed improved network demonstrated a superior performance with an MPA of 92.7%. This represents a relative improvement of 3.9 percentage points over the traditional DeepLabV3+, 1.9 percentage points over PSPNet, 1.6 percentage points over SwiftNet, and 0.6 percentage points over Mask2Former. Regarding the Mean Intersection over Union (MIoU), the traditional DeepLabV3+ network achieved a score of 74.2%, PSPNet achieved 77.1%, SwiftNet achieved 77.8%, and Mask2Former achieved 78.8%. The proposed improved network achieved an MIoU of 79.7%, thereby outperforming the traditional DeepLabV3+ by 5.5 percentage points, PSPNet by 2.6 percentage points, SwiftNet by 1.9 percentage points, and Mask2Former by 0.9 percentage points. Moreover, the proposed improved network exhibited significant enhancements in terms of model complexity and computational efficiency. Compared with the original DeepLabV3+, the number of parameters was substantially reduced from 41.2 million to 4.25 million, while the Frames Per Second (FPS) was notably increased. These experimental results collectively demonstrate that the proposed improved algorithm effectively enhances segmentation accuracy while significantly alleviating computational burden, thereby achieving a favorable trade-off between performance and efficiency.
To more intuitively illustrate the performance of the improved network proposed in this study, a subset of images from the test set was selected for testing to compare the proposed network with other segmentation networks through visualized segmentation results. The visualization comparison results are depicted in Figure 12.
Figure 12 shows the segmentation results for the traditional DeepLabV3+, PSPNet, and SwiftNet networks. These networks can basically finish the segmentation task of dial lines and pointers. However, these models still encounter several issues, such as breakpoints in pointer segmentation, misclassification of background pixels as scale pixels, and noisy artifacts in scale segmentation. For example, in the first group, where the dial is contaminated, the segmentation results of the traditional DeepLabV3+ display noisy artifacts and misclassification of background pixels as scale pixels in both pointer and scale regions. Although PSPNet and SwiftNet do not produce errors in pointer segmentation, their scale segmentation still exhibits noisy artifacts and discontinuities. Mask2Former, despite its superior segmentation performance, still shows unclear segmentation at the pointer tips. In the third group, the traditional DeepLabV3+, PSPNet, and SwiftNet all exhibit errors in pointer segmentation, while Mask2Former, although successful in pointer segmentation, demonstrates poor segmentation performance for the scales. In the remaining groups, the segmentation results of the improved network presented in this study are significantly superior to those of the comparison networks.

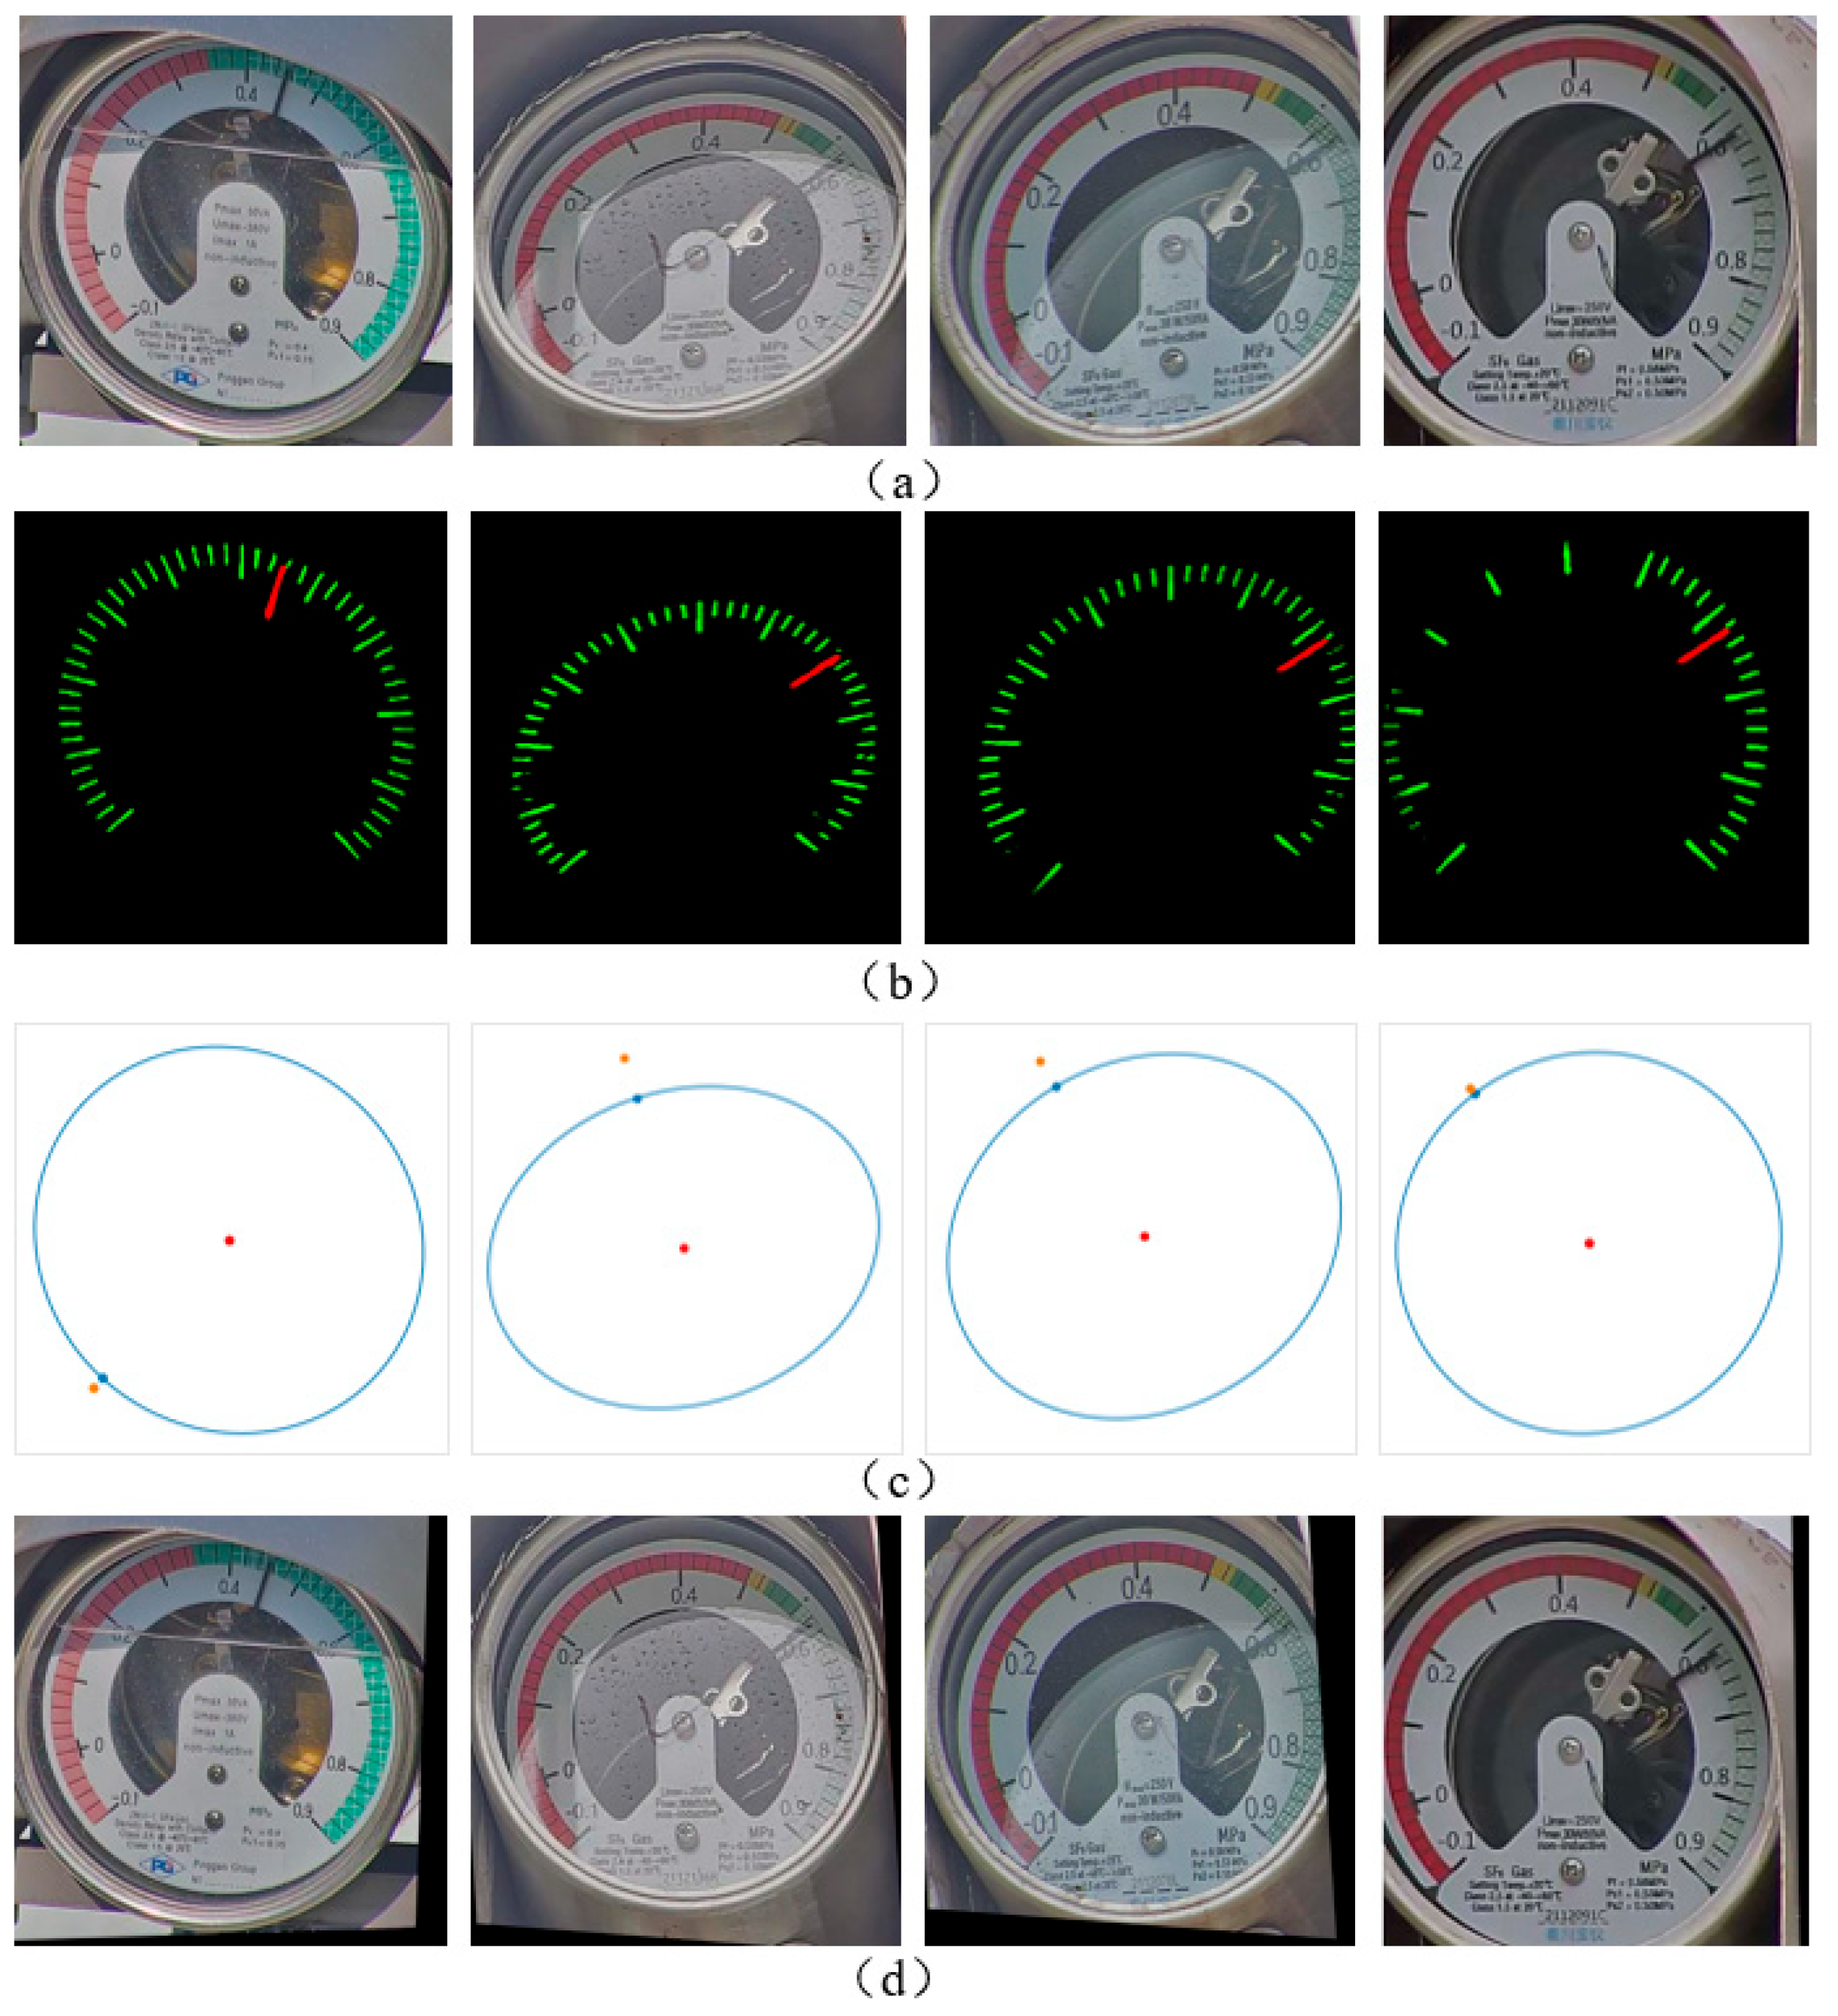
4.4. Experimental Results of Distortion Image Rectification

Dial images are frequently subject to distortion, which can significantly compromise the accuracy of subsequent reading tasks. To mitigate this issue and enhance reading precision, this paper employs a rectification method based on elliptical fitting using the least squares method and affine transformation. The rectification process for distorted images is outlined as follows: Initially, the segmentation result of the dial region is obtained through a segmentation network. Subsequently, elliptical fitting is performed to extract parameters such as the center, major axis, and minor axis. Finally, affine transformation is applied to correct the distorted image. When compared with other image rectification methods, the algorithm from [28] directly performs circular detection, which may be susceptible to background interference, leading to fitting failure. The algorithm from [29] relies on the precise localization of corner points for perspective transformation; if the selected points are inaccurate or contain errors, the rectification effect can be significantly compromised. Moreover, perspective transformation requires at least four pairs of matching points, and the parameter estimation process is complex and computationally intensive.
In contrast, the method proposed in this paper first effectively excludes background interference through segmentation, focusing the elliptical fitting on the dial region and reducing errors caused by noise and complex factors. Second, affine transformation can efficiently handle geometric distortions such as rotation, shearing, and scaling, making it particularly suitable for complex deformations caused by perspective tilt or lens distortion, with a relatively simpler computational process. The rectified results are illustrated in Figure 13.
To demonstrate the effectiveness of the image rectification for distorted images, a comparative experiment of dial reading before and after rectification was conducted. The results are presented in Table 6. As can be seen from the table, the relative error in dial reading was significantly higher before rectification. However, after the rectification process, the relative error in the algorithm’s reading was substantially reduced, thereby validating the efficacy of the image rectification step in enhancing the accuracy of the reading algorithm.

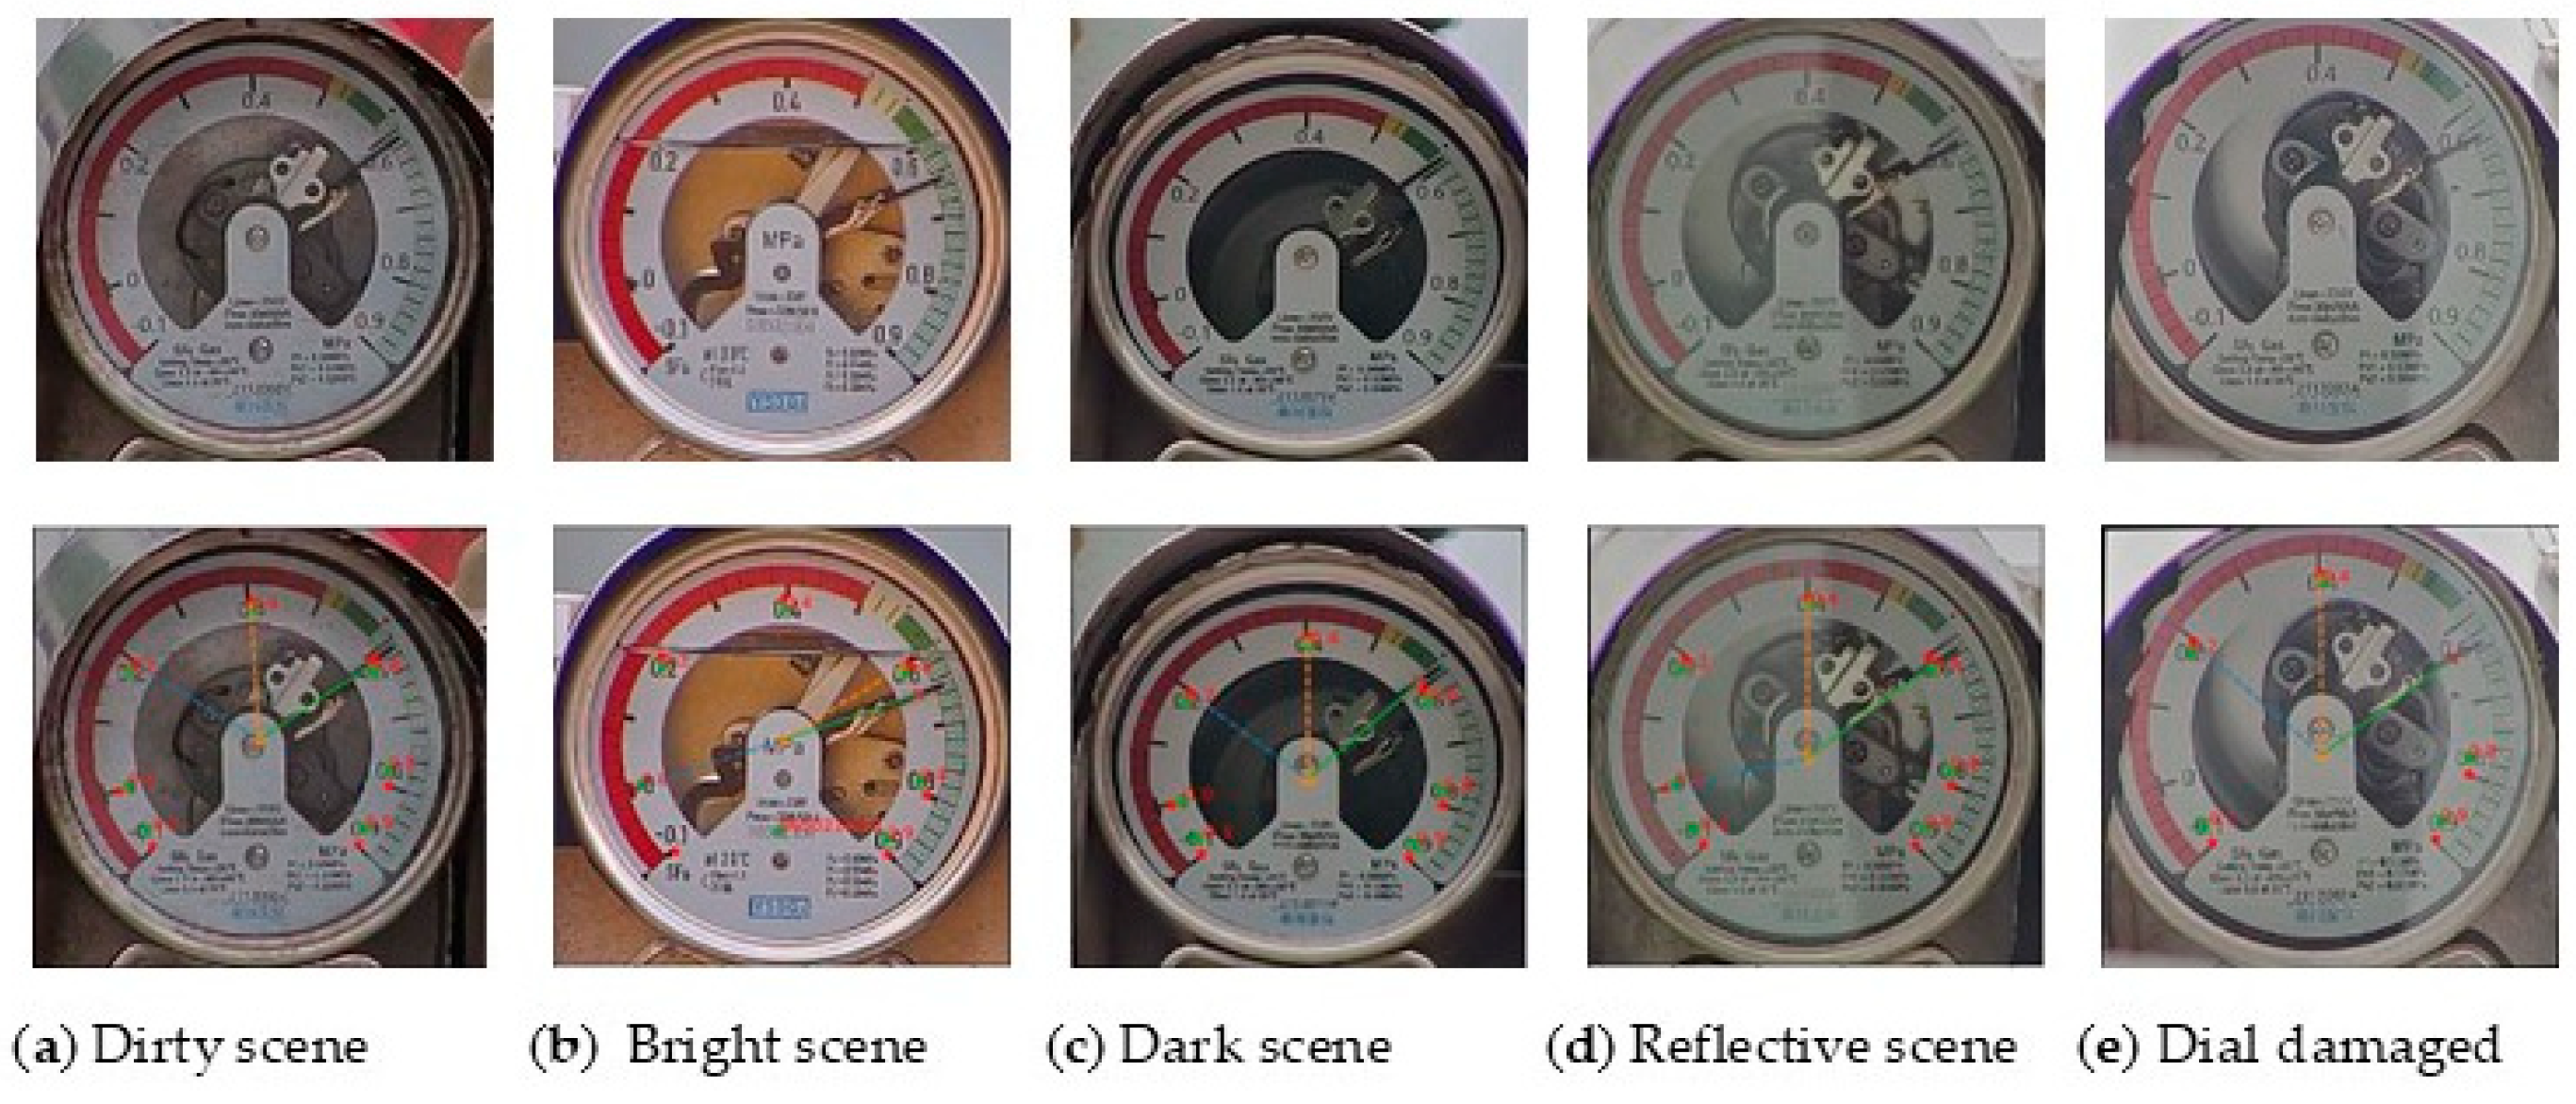
4.5. Experimental Results of Pointer-Type Instrument Dial Reading Recognition

To facilitate the reading recognition of dials with varying ranges, PGNet was utilized in this study to extract scale value information from the rectified dial images. Initially, PGNet was employed to identify information on the dial and to filter out scale data that solely contained numerical information, such as −0.1, 0.2, 0.4, and 0.6. The performance metrics of PGNet, specifically its accuracy and speed, when applied to the dial dataset are delineated in Table 7. After obtaining the scale values and their corresponding coordinates, the nearest neighbor method was used to match the scales with the text information, thereby acquiring the coordinates of the two scales for angular calculation. Subsequently, three lines were constructed: one connecting the center of the dial to each of the two scale coordinates, and another connecting the center to the pointer coordinate. The angular method formula was then applied to achieve automatic reading recognition. A selection of dial images from complex scenarios was chosen for reading, including scenes with dial contamination, bright lighting, dark reflection, and dial damage. The reading effects of dials in different scenarios are depicted in Figure 14.
Additionally, to further substantiate the efficacy of the automatic reading algorithm proposed in this study, dials with different ranges were randomly selected for reading. Figure 15 presents the reading results for dials with different ranges. Existing algorithms are contingent upon the recognition of the complete scale range. To assess the robustness of the automatic reading algorithm proposed in this paper under scenarios with incomplete scale information, images featuring partial occlusion of the starting scale of the dial were selected for testing, with the results presented in Figure 16. The experimental outcomes indicate that the algorithm proposed in this paper can achieve precise reading by matching only two key scales, even when the scale information is incomplete.
Furthermore, statistical analysis of the reading results for 352 images in the test set reveals that 325 images exhibited a relative reading error within the range of 1–3%, corresponding to a reading recognition accuracy of 92.33%. Seventeen images demonstrated a relative reading error between 3% and 5%, resulting in a relative reading recognition accuracy of 4.82%. Ten images had a relative reading error exceeding 5%, leading to a reading recognition error rate of 2.85%. In the test results, the reading accuracy of some images did not meet the standard. The main reasons include the blurriness of the dial images, image distortion caused by color changes, and the presence of occlusions in the images. These issues led to the inability to clearly segment the dial scales and pointers, or the misrecognition of scale information, thereby affecting the final reading accuracy. Additionally, some of the selected dial reading recognition results are presented in Table 8. The average reading time for a single image was 2.008 s, with an average relative error of 0.84%. The experiments demonstrate that the adaptive range automatic reading method for pointer-type dials proposed in this paper can effectively process dial images collected in the complex environment of substations and achieve satisfactory results in terms of reading accuracy.

5. Conclusions

This paper presents an adaptive automatic reading algorithm for pointer-type dials with varying ranges in substations under diverse complex scenarios, addressing the limitations of existing automatic reading recognition algorithms for pointer-type dials in substations, which exhibit low reading accuracy and an inability to accommodate different dial ranges under complex conditions. During the dial scale pointer division stage, the DeepLabv3+ division network is designed to be lightweight to meet the real-time demands of substation reading recognition. We transform the original feature extraction network into a lighter MobileNetV2+ network. Simultaneously, we introduce an attention mechanism and change the loss function to improve the accuracy of the dial scale pointer’s division. The improved network parameter is 4.25 m, the MIoU is 79.7%, and the average Pixel Accuracy is 92.7%. First, to address the impact of a distorted image on the accuracy of dial reading recognition, we correct the distorted image using ellipse fitting and an affine transformation based on least squares. Second, to address the issue of the current reading recognition algorithm’s inability to adapt to various dial ranges, we utilize a neural network to identify the dial scale information, and then apply the nearest neighbor method to align the scale information with the closest scale. Ultimately, the angle method achieves the recognition of different dial ranges. The accuracy of reading recognition is 92.33%, which is applicable and effective for the reading of substation pointer meters in actual scenes.

Author Contributions

Conceptualization, Y.Y. and W.L.; methodology, J.H.; validation, S.F., Y.Y. and H.T.; formal analysis, S.F.; writing—original draft preparation, H.T.; writing—review and editing, H.T., Y.Y. and J.H.; visualization, H.T. All authors have read and agreed to the published version of the manuscript.

Funding

This research was funded by the State Grid Sichuan Electric Power Company Science and Technology Program, grant number 521997230014 and the funding of Southwest Jiaotong University’s first batch of English-taught quality courses for international students in China, grant number LHJP[2023]07.

Institutional Review Board Statement

Not applicable.

Informed Consent Statement

Not applicable.

Data Availability Statement

Substation instrumentation image data are not available due to privacy. PASCAL VOC 2012 public datasets can be downloaded from http://host.robots.ox.ac.uk/pascal/VOC/voc2012/ (accessed on 4 March 2025).

Conflicts of Interest

Authors Yueping Yang, Wenlong Liao and Songhai Fan were employed by State Grid Sichuan Electric Power Research Institute. The remaining authors declare that the research was conducted in the absence of any commercial or financial relationships that could be construed as a potential conflict of interest.

References

  1. Zhang, X.F.; Huang, S. Research on pointer identifying and number reading of multiple pointer instruments. Electr. Meas. Instrum. 2020, 57, 147–152. [Google Scholar]
  2. Zhai, Y.J.; Zhao, Z.Y.; Wang, Q.M.; Bai, K. Pointer meter detection method based on artificial-real sample metric learning. Electr. Meas. Instrum. 2022, 59, 174–183. [Google Scholar]
  3. Hu, X.; Ouyang, H.; Yin, Y.; Hou, Z.C. An improved method for recognizing readings of pointer meters. Electron. Meas. Technol. 2021, 44, 132–137. [Google Scholar]
  4. Yang, Y.Q.; Zhao, Y.Q.; He, X.Y. Automatic Calibration of Analog Measuring Instruments Using Computer Vision; North China Electric Power University: Beijing, China, 2001; p. 3. [Google Scholar]
  5. Xu, P.; Zeng, W.M.; Shi, Y.H.; Zhang, Y. A reading recognition algorithm of pointer type oil-level meter. Comput. Technol. Dev. 2018, 28, 189–193. [Google Scholar]
  6. Shi, W.; Wang, C.L.; Chen, J.S.; Hou, X.H. Substation pointer instrument reading based on image processing. Electron. Sci. Technol. 2016, 29, 118–120. [Google Scholar]
  7. Fang, Y.X.; Dai, Y.; He, G.L.; Qi, D. A mask RCNN based automatic reading method for pointer meter. In Proceedings of the 2019 Chinese Control Conference (CCC), Guangzhou, China, 27–30 July 2019; pp. 8466–8471. [Google Scholar]
  8. Geng, L.; Shi, R.Z.; Liu, Y.B.; Xiao, Z.; Wu, J.; Zhang, F. Instrument image segmentation method based on UNet with multi-scale receptive field. Comput. Eng. Des. 2022, 43, 771–777. [Google Scholar]
  9. Jin, A.P.; Yuan, L.; Zhou, D.Q.; Yang, K. Identification Method for Reading of Pointer Instruments Based on YOLOv5 and U-net. Instrum. Tech. Sens. 2022, 11, 29–33. [Google Scholar]
  10. Mao, A.K.; Liu, X.M.; Chen, W.Z.; Song, S.L. Improved substation instrument target detection method for YOLOv5 algorithm. J. Graph. 2023, 44, 448–455. [Google Scholar]
  11. Wang, K.; Lu, S.H.; Chen, C.; Chen, Z.B.; Qiang, S.; Chen, B. Research on Detection and Reading Recognition Algorithm of Pointer Instrument Based on YOLOv5. J. China Three Gorges Univ. (Nat. Sci.) 2022, 44, 42–47. [Google Scholar]
  12. Yang, S.Q.; Wu, J.Y.; Chen, M.N.; Fu, C.X.; Zhao, N.; Wang, J. Automatic identification for reading of pointer-type meters based on deep learning. Electron. Meas. Technol. 2023, 46, 149–156. [Google Scholar]
  13. Zhang, H.; Zhang, D.X.; Chen, P. Application of Parallel Attention Mechanism in Image Semantic Segmentation. Comput. Eng. Appl. 2022, 58, 151–160. [Google Scholar]
  14. Hu, J.; Shen, L.; Sun, G. Squeeze-and-Excitation Networks. In Proceedings of the IEEE Conference on Computer Vision and Pattern Recognition (CVPR), Salt Lake City, UT, USA, 18–23 June 2018; pp. 7132–7141. [Google Scholar]
  15. Chen, L.C.; Zhu, Y.; Papandreou, G.; Schroff, F.; Adam, H. Encoder-Decoder with Atrous Separable Convolution for Semantic Image Segmentation. In Proceedings of the European Conference on Computer Vision (ECCV), Munich, Germany, 8–14 September 2018; pp. 801–818. [Google Scholar]
  16. Sandler, M.; Howard, A.; Zhu, M.; Zhmoginov, A.; Chen, L.C. MobileNetV2: Inverted Residuals and Linear Bottlenecks. In Proceedings of the IEEE Conference on Computer Vision and Pattern Recognition (CVPR), Salt Lake City, UT, USA, 18–23 June 2018; pp. 4510–4520. [Google Scholar]
  17. Zhou, D.; Hou, Q.; Chen, Y.; Feng, J.; Yan, S. Rethinking Bottleneck Structure for Efficient Mobile Network Design. In Computer Vision—ECCV 2020, Proceedings of the 16th European Conference, Glasgow, UK, 23–28 August 2020; Springer: Cham, Switzerland, 2020; pp. 680–697. [Google Scholar]
  18. Howard, A.G.; Zhu, M.; Chen, B.; Kalenichenko, D.; Wang, W.; Weyand, T.; Andreetto, M.; Adam, H. MobileNets: Efficient Convolutional Neural Networks for Mobile Vision Applications. arXiv 2017, arXiv:1704.04861. [Google Scholar]
  19. Hou, Q.; Zhou, D.; Feng, J. Coordinate Attention for Efficient Mobile Network Design. In Proceedings of the IEEE/CVF Conference on Computer Vision and Pattern Recognition (CVPR), Nashville, TN, USA, 19–25 June 2021; pp. 13713–13722. [Google Scholar]
  20. Lin, T.Y.; Goyal, P.; Girshick, R.; He, K.; Dollár, P. Focal Loss for Dense Object Detection. In Proceedings of the IEEE International Conference on Computer Vision (ICCV), Venice, Italy, 22–29 October 2017; pp. 2980–2988. [Google Scholar]
  21. Li, B.; Yao, Y.; Tan, J.; Zhang, G.; Yu, F.; Lu, J. Equalized focal loss for dense long-tailed object detection. In Proceedings of the IEEE/CVF Conference on Computer Vision and Pattern Recognition, New Orleans, LA, USA, 18–24 June 2022; pp. 6990–6999. [Google Scholar]
  22. Wang, P.; Zhang, C.; Qi, F.; Liu, S.; Zhang, X.; Lyu, P.; Han, J.; Liu, J.; Ding, E.; Shi, G. PGNet: Real-time Arbitrarily-Shaped Text Spotting with Point Gathering Network. Proc. AAAI Conf. Artif. Intell. 2021, 35, 2782–2790. [Google Scholar] [CrossRef]
  23. Woo, S.; Park, J.; Lee, J.Y.; Kwon, I. CBAM: Convolutional Block Attention Module. In Proceedings of the European Conference on Computer Vision (ECCV), Munich, Germany, 8–14 September 2018; pp. 3–19. [Google Scholar]
  24. Qin, Z.; Zhang, P.; Wu, F.; Li, X. FCANet: Frequency Channel Attention Networks. In Proceedings of the IEEE/CVF International Conference on Computer Vision (ICCV), Virtual, 11–17 October 2021; pp. 783–792. [Google Scholar]
  25. Zhao, H.; Shi, J.; Qi, X.; Wang, X.; Jia, J. Pyramid Scene Parsing Network. In Proceedings of the IEEE Conference on Computer Vision and Pattern Recognition (CVPR), Honolulu, HI, USA, 21–26 July 2017; pp. 2881–2890. [Google Scholar]
  26. Wang, H.; Jiang, X.; Ren, H.; Hu, Y.; Bai, S. SwiftNet: Real-time Video Object Segmentation. In Proceedings of the IEEE/CVF Conference on Computer Vision and Pattern Recognition (CVPR), Nashville, TN, USA, 20–25 June 2021; pp. 1296–1305. [Google Scholar]
  27. Cheng, B.; Misra, I.; Schwing, A.G.; Kirillov, A.; Girdhar, R. Masked-attention mask transformer for universal image segmentation. In Proceedings of the IEEE/CVF Conference on Computer Vision and Pattern Recognition, New Orleans, LA, USA, 18–24 June 2022; pp. 1290–1299. [Google Scholar]
  28. Li, D.; Li, W.; Yu, X.; Gao, Q.; Song, Y. Automatic reading algorithm of substation dial gauges based on coordinate positioning. Appl. Sci. 2021, 11, 6059. [Google Scholar] [CrossRef]
  29. Zheng, C.; Wang, S.; Zhang, Y.; Zhang, P.; Zhao, Y. A robust and automatic recognition system of analog instruments in power system by using computer vision. Measurement 2016, 92, 413–420. [Google Scholar] [CrossRef]
Figure 1. Dial information annotation.
Information 16 00226 g001
Figure 2. Schematic diagram of the algorithm.
Information 16 00226 g002
Figure 3. Comparison of residual block structures.
Information 16 00226 g003
Figure 4. Structure of CA module.
Information 16 00226 g004
Figure 5. Improved DeepLabV3+ network architecture diagram.
Information 16 00226 g005
Figure 6. PGNet architecture diagram.
Information 16 00226 g006
Figure 7. Angular relationship acquisition diagram.
Information 16 00226 g007
Figure 8. Visualization of data augmentation for image dataset.
Information 16 00226 g008
Figure 9. Diagram of data annotation results.
Information 16 00226 g009
Figure 10. Loss value comparison chart during network training.
Information 16 00226 g010
Figure 11. Comparison of segmentation results under different lighting simulation conditions.
Information 16 00226 g011
Figure 12. Comparison of segmentation effects of different models. (a) Dial image; (b) DeepLabV3+ segmentation result; (c) PSPNet segmentation result; (d) SwiftNet segmentation result; (e) Mask2Former segmentation result; (f) segmentation result of the proposed algorithm.
Information 16 00226 g012
Figure 13. Figures of the rectified distorted images. (a) Original dial figures exhibiting distortion angle; (b) figures of dial segmentation results; (c) figures of ellipse fitting results derived from segmentation; (d) figures of the final rectified results.
Information 16 00226 g013
Figure 14. Effect diagram of dial reading in different scenes.
Information 16 00226 g014
Figure 15. Reading effect diagram of dial with different ranges.
Information 16 00226 g015
Figure 16. Figures of dial reading results under different occlusion conditions.
Information 16 00226 g016
Table 1. MobileNetV2+ network architecture.
InputOperatortcns
256 × 256 × 3Conv2d3212
128 × 128 × 32SG-block11611
128 × 128 × 16SG-block62422
64 × 64 × 24SG-block63232
32 × 32 × 32SG-block66442
3 × 32 × 64SG-block69631
16 × 16 × 96SG-block616032
8 × 8 × 160SG-block632011
Table 2. Comparison of experimental results of different attention mechanisms.
Attention MechanismMIoU%MPA%PrecisionRecallParameters/M
SE76.988.479.589.85.99
CBAM77.990.280.390.76.02
FcaNet77.489.879.990.55.97
CA78.391.180.791.15.97
Table 3. Comparison of experimental results with different loss functions.
Loss FuctionMIoU%MPA%PrecisionRecall
CE76.790.479.689.9
FL77.190.880.190.4
EFL77.891.180.490.9
Table 4. Comparison of ablation experiments results.
Ablation ExperimentsBackboneCAEFLMIoU%MPA%Parameters/M
Experiment 1Xception74.288.841.20
Experiment 2MobileNetV2+76.790.64.09
Experiment 3MobileNetV2+78.391.74.25
Experiment 4MobileNetV2+77.891.14.09
Experiment 5MobileNetV2+79.792.74.25
Table 5. Comparison of segmentation results of different algorithms.
Network ModelBackboneMIoU%MPA%Parameters/MFPS
DeepLabV3+Xception74.288.841.2022.2
PSPNetResNet-5077.190.828.5030.0
SwiftNetResNet-1877.891.111.8039.9
Mask2FormerViT78.891.910515.2
OursMobileNetV2+79.792.74.2552.6
Table 6. Comparison of reading results pre- and post-rectification.
SampleManual Reading ResultsBefore CorrectionAfter Correction
Reading
Results
Absolute
Error
Relative
Error/%
Reading
Results
Absolute
Error
Relative
Error/%
Sample 10.4500.4150.0357.70.4490.0010.2
Sample 20.6100.6580.0386.20.6130.0030.5
Sample 30.6300.6010.0294.60.6390.0091.4
Sample 40.6000.5140.08213.60.5920.0081.3
Sample 50.6200.5260.09415.10.6150.0050.8
Table 7. Effectiveness of the text recognition model.
AccuracyTime/ms
Detection97.885
Recognition96.419
Table 8. Reading recognition results.
Partial DialReading by HumanReading by Our MethodAbsolute ErrorRelative Error/%Time/s
dial 10.4500.4490.0010.22.04
dial 20.6100.6130.0030.51.95
dial 30.6300.6390.0091.41.99
dial 40.6000.5920.0081.32.02
dial 50.6200.6150.0050.82.04
Disclaimer/Publisher’s Note: The statements, opinions and data contained in all publications are solely those of the individual author(s) and contributor(s) and not of MDPI and/or the editor(s). MDPI and/or the editor(s) disclaim responsibility for any injury to people or property resulting from any ideas, methods, instructions or products referred to in the content.

