Article

The Correlation Between Self-Assessment and Observation in Driving Style Classification: An On-Road Case Study

by
Muhammad Zainul Abidin Kamaludin
1,
Juffrizal Karjanto
1,2,*,
Noryani Muhammad
1,2,
Nidzamuddin Md Yusof
1,2,
Muhammad Zahir Hassan
1,2,
Mohamad Zairi Baharom
3,
Zulhaidi Mohd Jawi
4 and
Matthias Rauterberg
5
1
Fakulti Teknologi dan Kejuruteraan Mekanikal, Universiti Teknikal Malaysia Melaka, Durian Tunggal 76100, Melaka, Malaysia
2
Centre for Advanced Research on Energy, Universiti Teknikal Malaysia Melaka, Durian Tunggal 76100, Melaka, Malaysia
3
Faculty of Mechanical & Automotive Engineering Technology, Universiti Malaysia Pahang Al-Sultan Abdullah, Pekan 26600, Pahang, Malaysia
4
Malaysian Institute of Road Safety Research (MIROS), Kajang 43000, Selangor, Malaysia
5
Department of Industrial Design, Eindhoven University of Technology, P.O. Box 513, 5600 MB Eindhoven, The Netherlands
*
Author to whom correspondence should be addressed.
Information 2025, 16(2), 140; https://doi.org/10.3390/info16020140
Submission received: 8 January 2025 / Revised: 4 February 2025 / Accepted: 6 February 2025 / Published: 14 February 2025

Abstract

:
A typical classification of driving style from a human driver is conducted via self-assessment, which begs the question of the possibility of bias from the respondents. Although some research has been carried out validating the questionnaire, no controlled studies have yet to be reported to validate the Malaysian driving style. This study aimed to validate the Malaysian driver using the Multidimensional Driving Style Inventory (MDSI) with five-factor driving styles (careful, risky, angry, anxious, and dissociative) in on-road situations. Forty-one respondents completed the experiment on two designated routes recorded over 45 min of driving. A modest correlation existed between the MDSI and the score retrieved from the on-road observation assessment. The result showed a low-to-medium correlation collected from acceleration in longitudinal directions compared with correlation analysis utilizing the MDSI scale. Exploring such latent traits is essential for precisely classifying human driver styles without bias.

Graphical Abstract

1. Introduction

Driving style can be defined as the way or method a driver chooses to drive, and it depends on the physical and emotional conditions of the driver while driving [1,2,3]. For example, the way a driver drives a vehicle when overtaking a vehicle on the road, approaching a junction, accelerating when a traffic light changes from red to green, or a driver’s reaction when following a slower vehicle ahead depends on their driving style. All these examples can be seen in daily life. Some people drive vehicles hastily and riskily, such as following too closely behind another vehicle. But some people drive a vehicle slowly and carefully.
Some of the importance of identifying human driving style is improving the riding experience [4], enhancing trust in humans and machines [5], and improving road and vehicle safety [6,7].
Several existing studies in the literature have attempted to objectify the human driving style. Some approaches have a simple recognition of driving styles, such as studying the steering wheel angle [8]. One study characterized the driving style of Moroccan drivers using vehicle sensor data collected from the steering wheel angle. Another approach is implementing more complex and expensive equipment inside the designated instrumented vehicle. The approach was designed to detect the sensitive parts of the human body, such as biosensors, retina scans, and fingerprints, to investigate driving style [9]. Recent studies have proven that the best way to classify driving style is from objective driving data derived from acceleration [10,11,12].
In contrast, many previous studies have shown that self-assessment can also be used to identify driving styles because it is easier to access and economical for collecting a larger respondent group [10,11,12,13]. For example, several self-report measures of driver behavior and driving styles have been constructed in the last decade, such as the driving behavior inventory (DBI) [14], driving style questionnaire (DSQ) [15], attitudes to driving violations (ADVSs) [16] and the driver behavior questionnaire (DBQ) [13]. Hence, Taubman-Ben-Ari [10] created the multidimensional driving style inventory (MDSI) to incorporate all the driving styles into one questionnaire. Since then, MDSI has been widely translated in various countries and has found different driving styles based on these countries. For example, in Romania, the researcher found seven driving styles [17], while in China, Spain, and the Netherlands, they found six driving styles [11,18,19], and in Malaysia, they discovered five driving styles [20]. Although, understandably, different countries might have different driving styles, these dissimilar outcomes raise the question of whether a self-assessment (questionnaire) is a proper means to identify a person’s driving style or whether there is bias from the respondents. The possibility of bias might arise from the respondents being unaware of the questionnaire objective [21,22,23]. It could be that the respondents completed the self-assessment without performing the actual task, with the possibility that the respondents just answered the questionnaire based on their point of view at that moment. Therefore, such predicted performance evaluations may have a hazy reference point problem since drivers lack objective feedback directly linked to their driving activities [24,25].
Several studies have suggested a method to validate the self-assessment of driving styles by comparing self-reported driving data with actual driving performance in a simulation. Interestingly, only a few studies have shown a more significant proportion of driving performance with a positive correlation [26]. Meanwhile, most studies have shown moderate and low correlations [24,27,28]. In addition, other studies have used a different approach to tackle the specificity of the driver, such as using a designated observer to validate self-assessment through the observation measure [28]. So far, most studies have stated that the simulator studies validated the application. However, when using a simulator, the disadvantages include limited physical, perceptual, and behavioral fidelity and a lack of research demonstrating the simulation’s validity [29].
Recently, ref. [20] validated the fact that Malaysian drivers can be classified into five (5) categories of drivers (careful, risky, angry, anxious, and dissociative), with 27 items using the MDSI self-assessment. Motivated by the recent literature, this paper aims to validate the Malaysian driving style by comparing the results of self-assessment using the MDSI questionnaire from [20] and on-road driving styles observed by a designated observer. This study also investigates drivers’ self-conception of driving skills based on objective driving data collected using the self-assessment [28] and the vehicle’s acceleration [28,30,31,32,33,34]. According to recent literature, subjective judgments are reliable in supporting the formulation of a driver’s driving style [8,24,29,35,36]. Two hypotheses were considered for this study: First, this study was expected to find correlations between self-assessments and the designated observer on driving skills/behavior evaluations. The second hypothesis is about the correlations between the driving style from the MDSI scale and the acceleration data collected. Assuming that the participant’s driving styles have relative validity, the expectation from the MDSI is that it will have the most robust connection with self-assessment after driving activities and acceleration choice [24]. This study attempted to validate the significance of the self-assessment of the Malaysian driving style [20] with the driver’s behavior in on-road experiments.

2. Method

The general methodology can be divided into two (2) phases. The first phase began with the classification of the driving styles of participants. The classification of THE driving style was performed by instructing the participant to answer a Multidimensional Driving Style Inventory (MDSI) self-assessment questionnaire. Since all the potential participants were Malaysian, the MDSI for Malaysian (MDMI-M) drivers was answered [20] to determine whether the participants were careful, risky, angry, anxious, or dissociative drivers. The driving style is determined before the experiment (second phase). For the second phase, 43 participants (from various types of drivers, i.e., careful, risky, angry, anxious, or dissociative) were invited to perform the driving task on-road while being evaluated by the designated observer.
On the experiment day, a brief explanation of the rules, tasks, and ethical review with written informed consent was given following the approval of the Human Committee of Universiti Teknikal Malaysia Melaka (UTeM) on a study with human subjects (UTeM.23.01/500/25/4Jilid5(30)). The participant was then escorted to the instrumented vehicle, where another briefing was given about the task and the driving route for the experiment. An experimenter sat in the back and directed the participant (if needed) during the experiment phase (see Figure 1). At the same time, another experimenter (designated observer) evaluated the participant’s driving performance during the driving session using a dedicated questionnaire (see Figure 1). The designated observer was an experienced driver with a vehicle safety background (>10 years) and was accustomed to the instrumented vehicle used in this study. The participant needed to perform two (2) sessions: the familiarization and experiment session. Only the acceleration from the experiment session was analyzed. In addition, during the briefing process, the participants were instructed to drive naturally on the defined route while obeying all the traffic rules. After the driving session, the participant needed to answer a questionnaire to self-evaluate their performance in the driving task.
This study collected data from a self-assessment questionnaire (from both the designated observer and participant) and the acceleration data from the accelerometer and programmable Data Acquisition System (DAQ). The gathered acceleration data were later processed and analyzed using LabVIEW Diadem (2018) with a 250 Hz sampling rate. SPSS software (version 26) was used to analyze the correlation between the data.
At the end of the experiment, a debriefing session was performed, and the participant was rewarded as a token of appreciation with Ringgit Malaysia 30 (RM 30~USD 6).

2.1. Participant

The participants consisted of 30 males and 11 females. The study focused on young drivers aged 17 to 29 (Mean age = 22.67, SD = 1.59). They had valid driving licenses from at least three months to nine years (Mean = 4.96, SD = 1.84). Based on the duration of the driving license, the participants were categorized into three types of drivers. First, those who had a driving license below three years were considered novice drivers (23.81%). Second, those with a driving license between four and six years were considered moderate drivers (59.52%). Third, those with over seven years of licenses were categorized as expert drivers (16.67%). The driving mileage per year was up to 100,000 km with a minimum of 5000 km (Mean age = 390.86, SD = 1702.78).

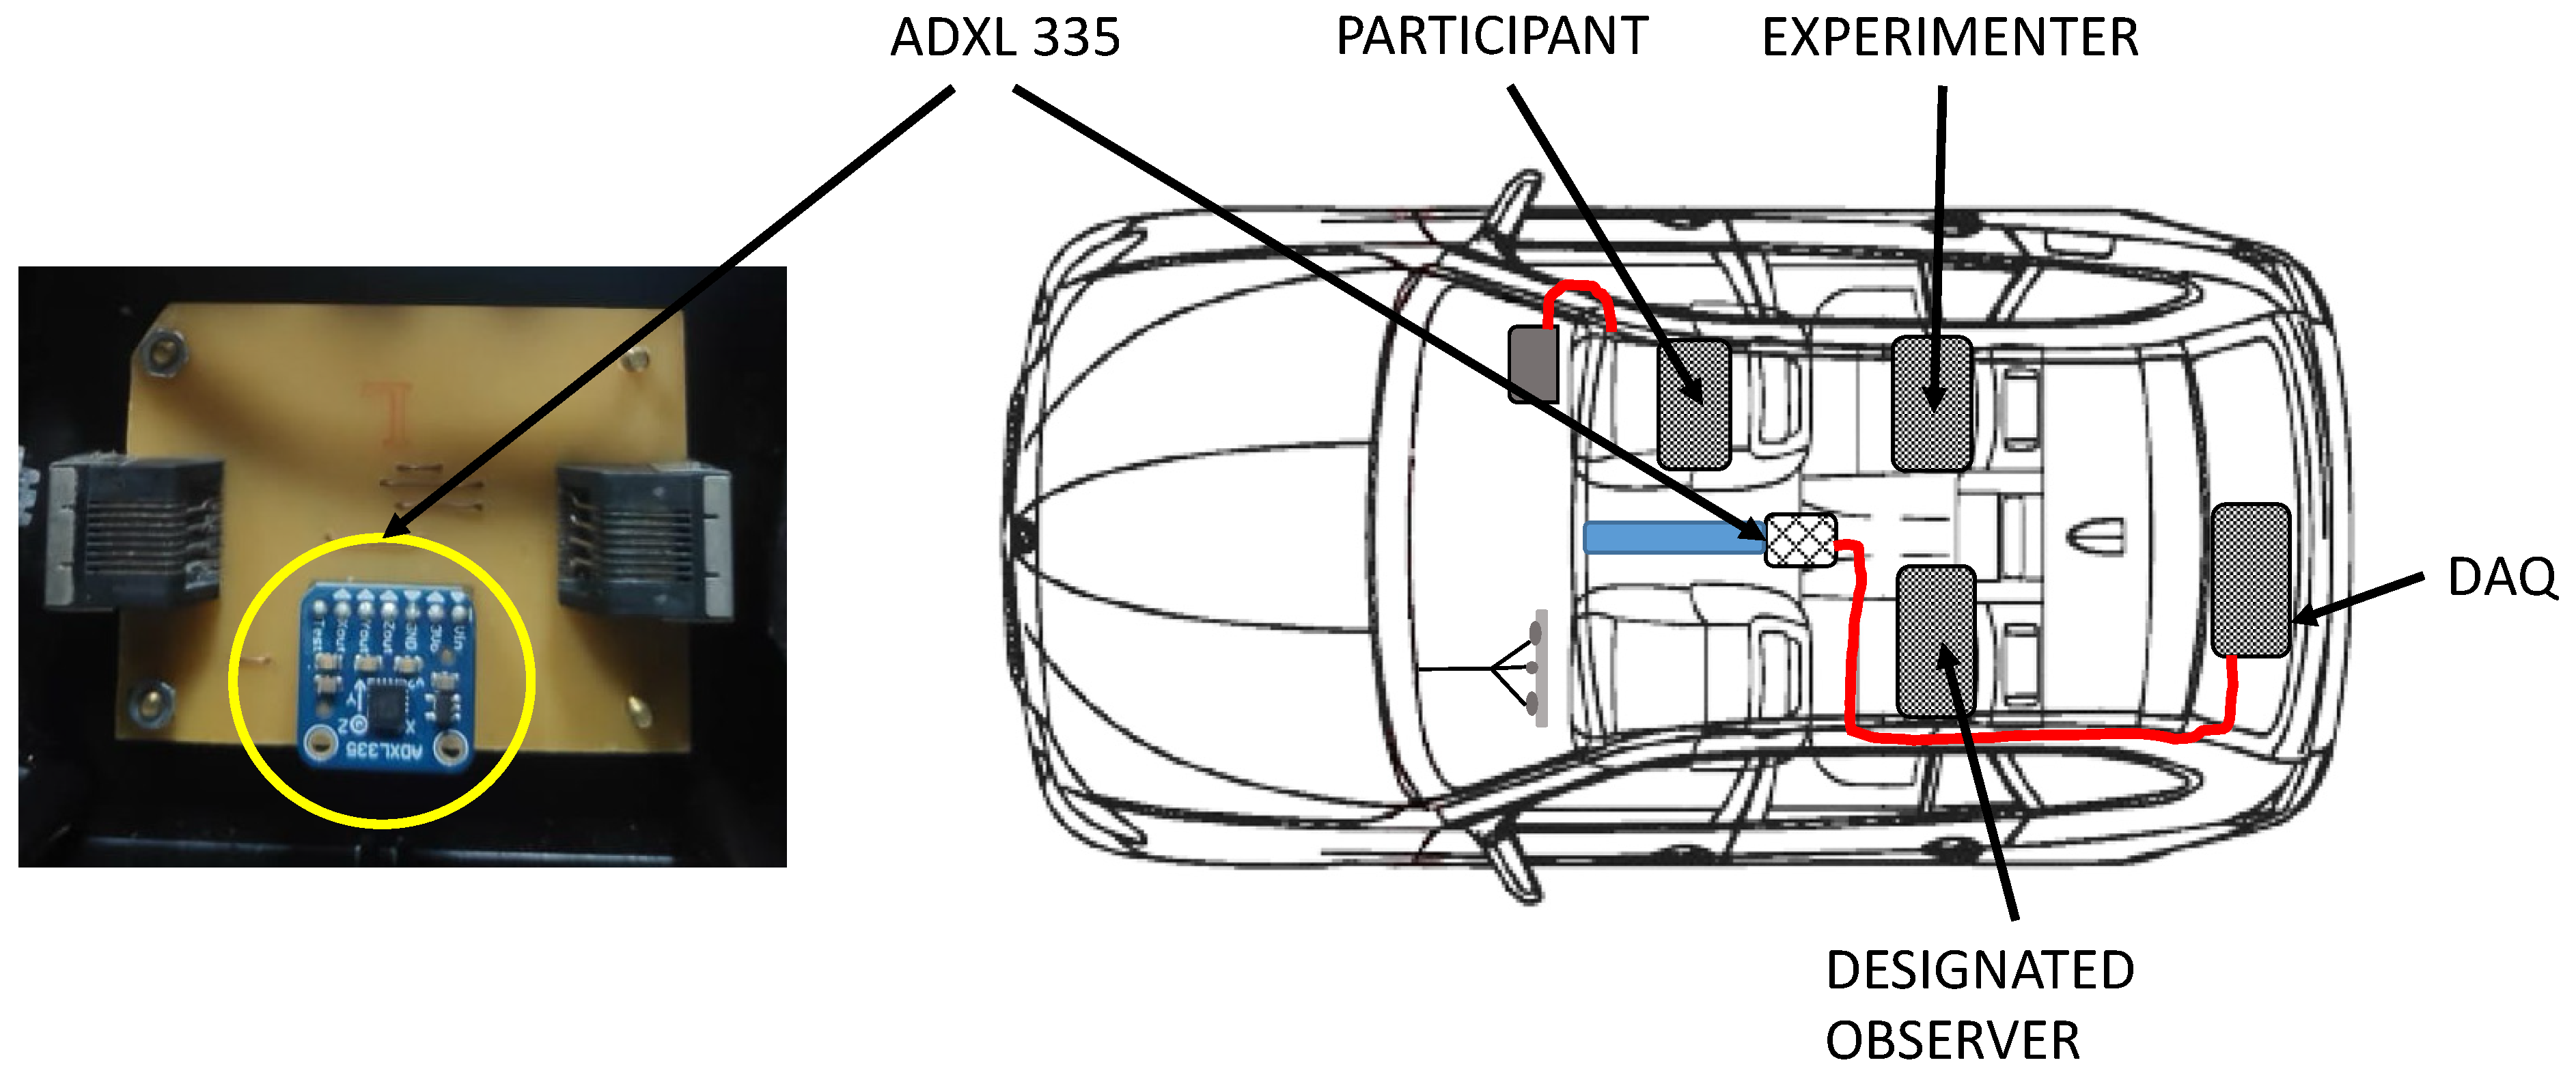
2.2. Instrumented Vehicle

A 2010 Perodua Myvi (B-Segment car made by Perodua in Rawang, Selangor, Malaysia) was installed with a data acquisition system (DAQ) as an instrumented vehicle to perform the driving activities and collect the participants’ raw data. The DAQ system included an accelerometer to collect acceleration data. The accelerometer was placed inside the vehicle between the passenger and driver seats (see Figure 1).

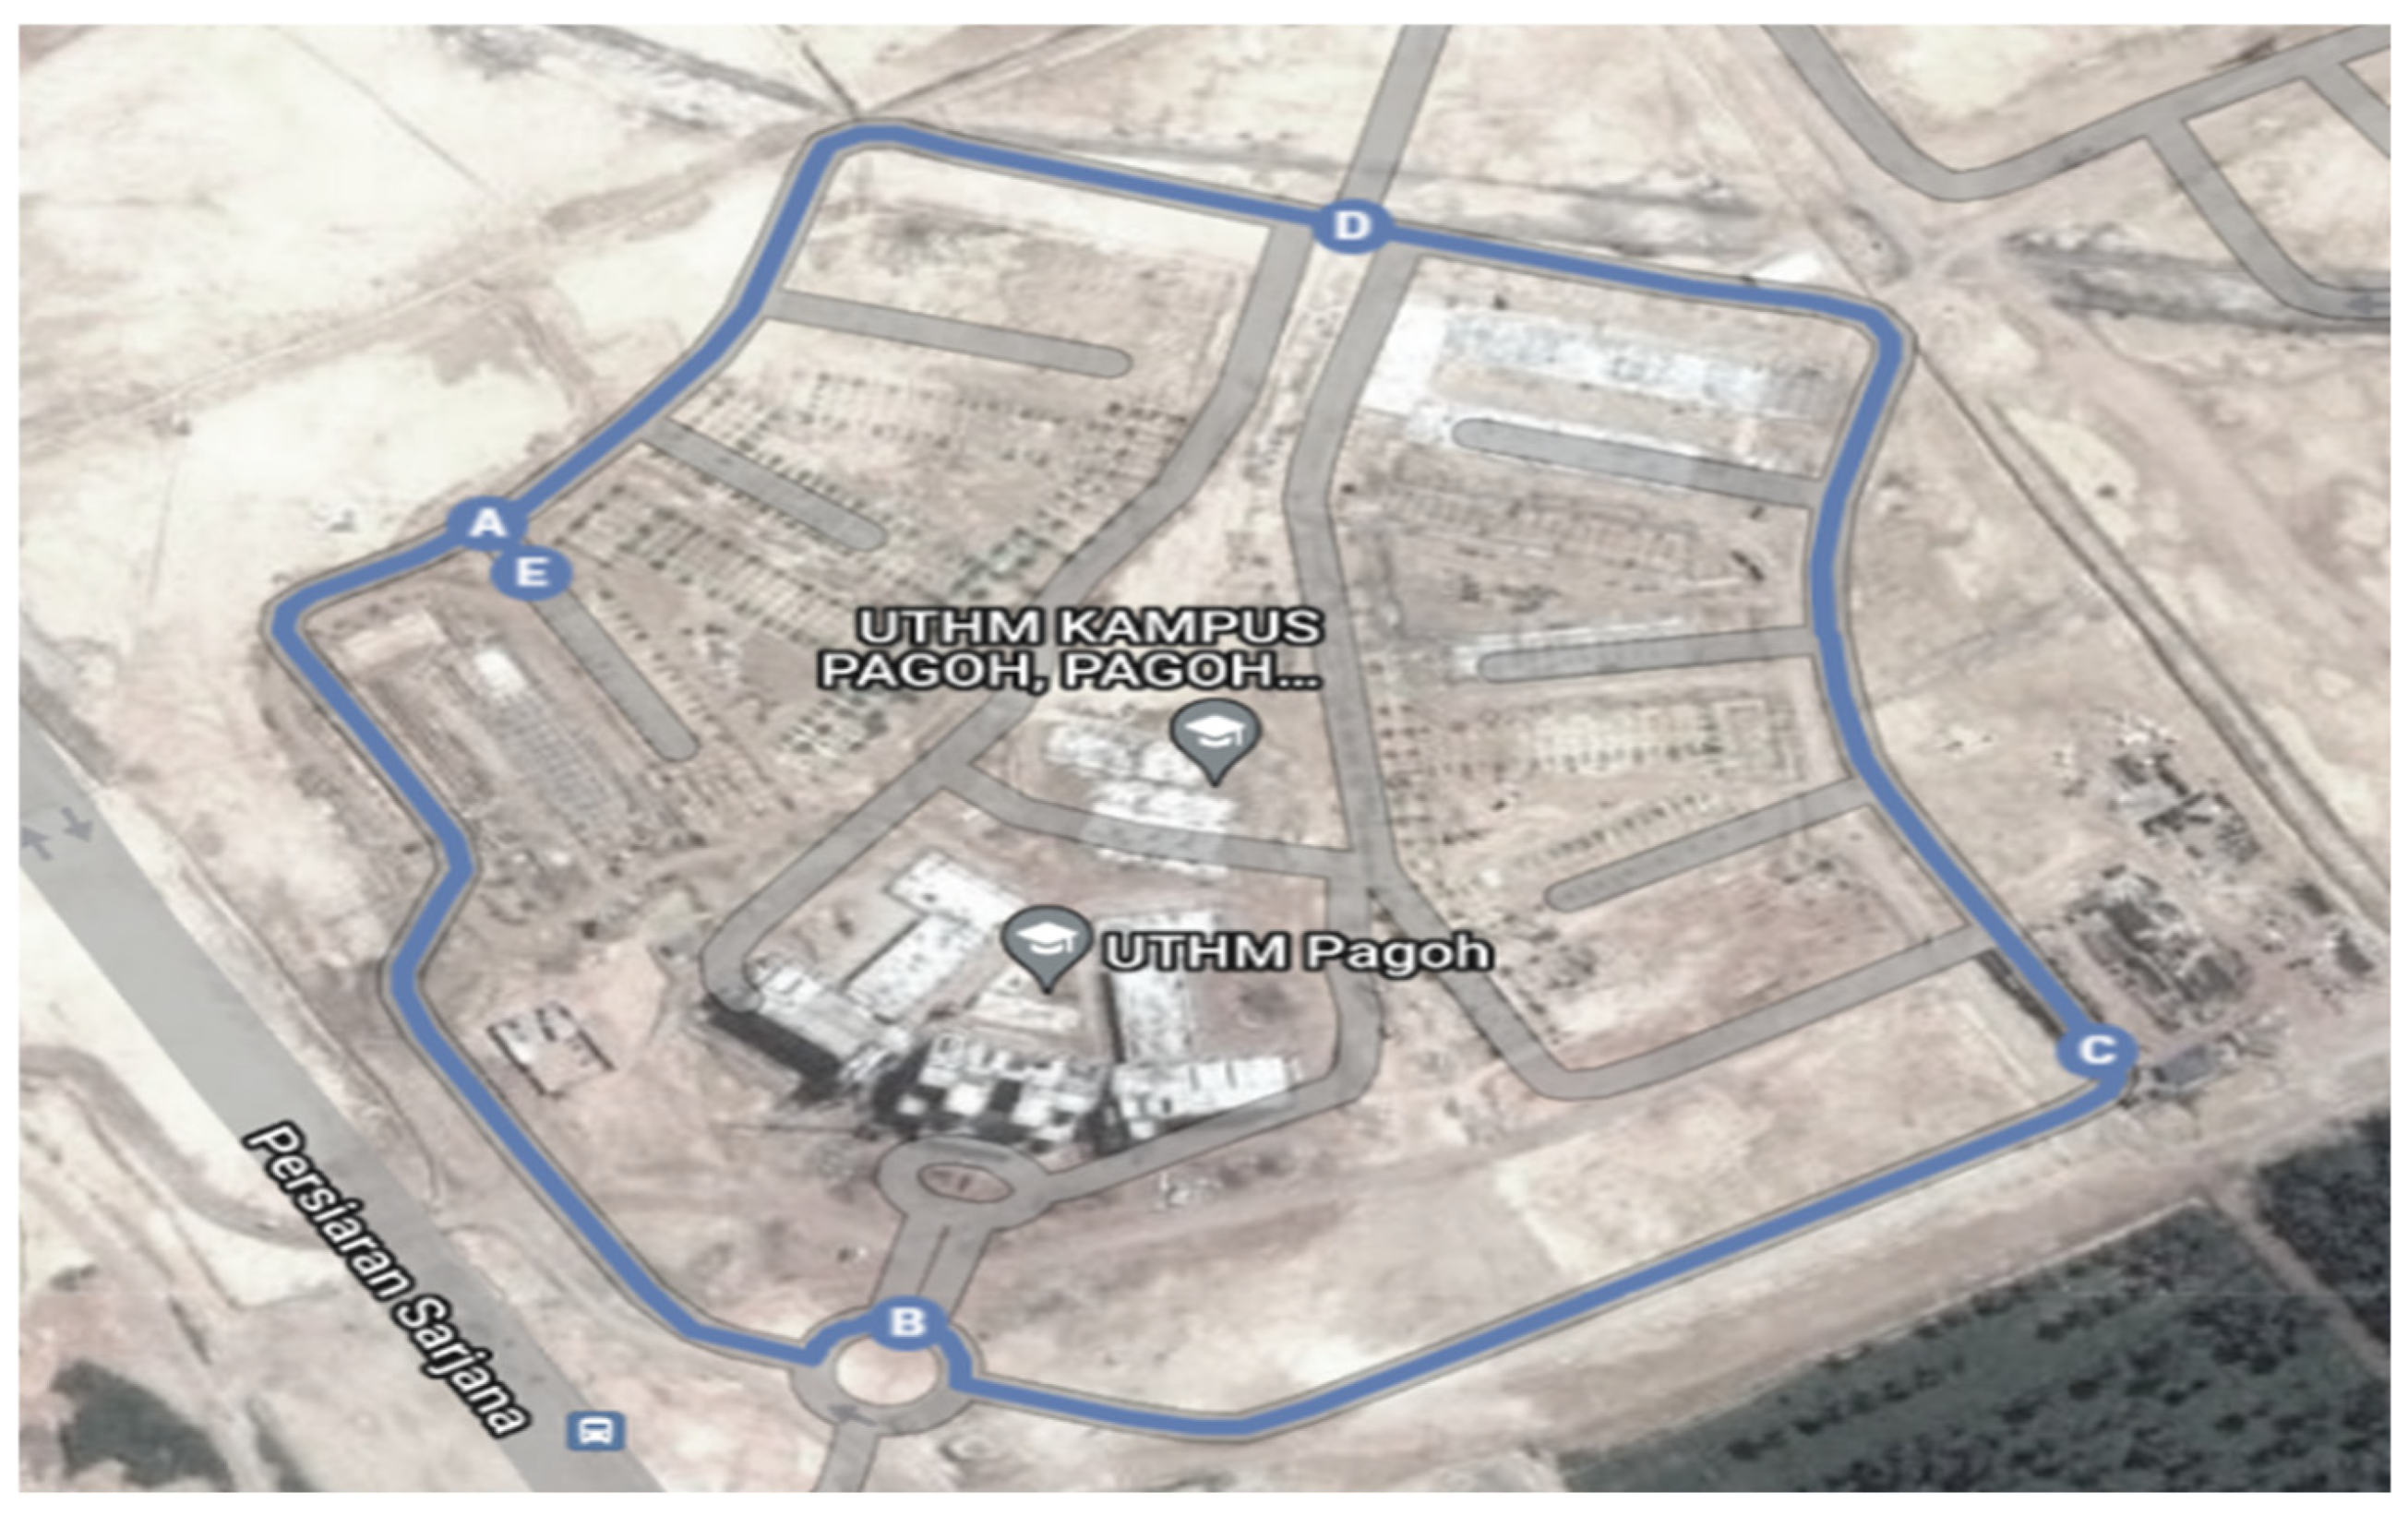
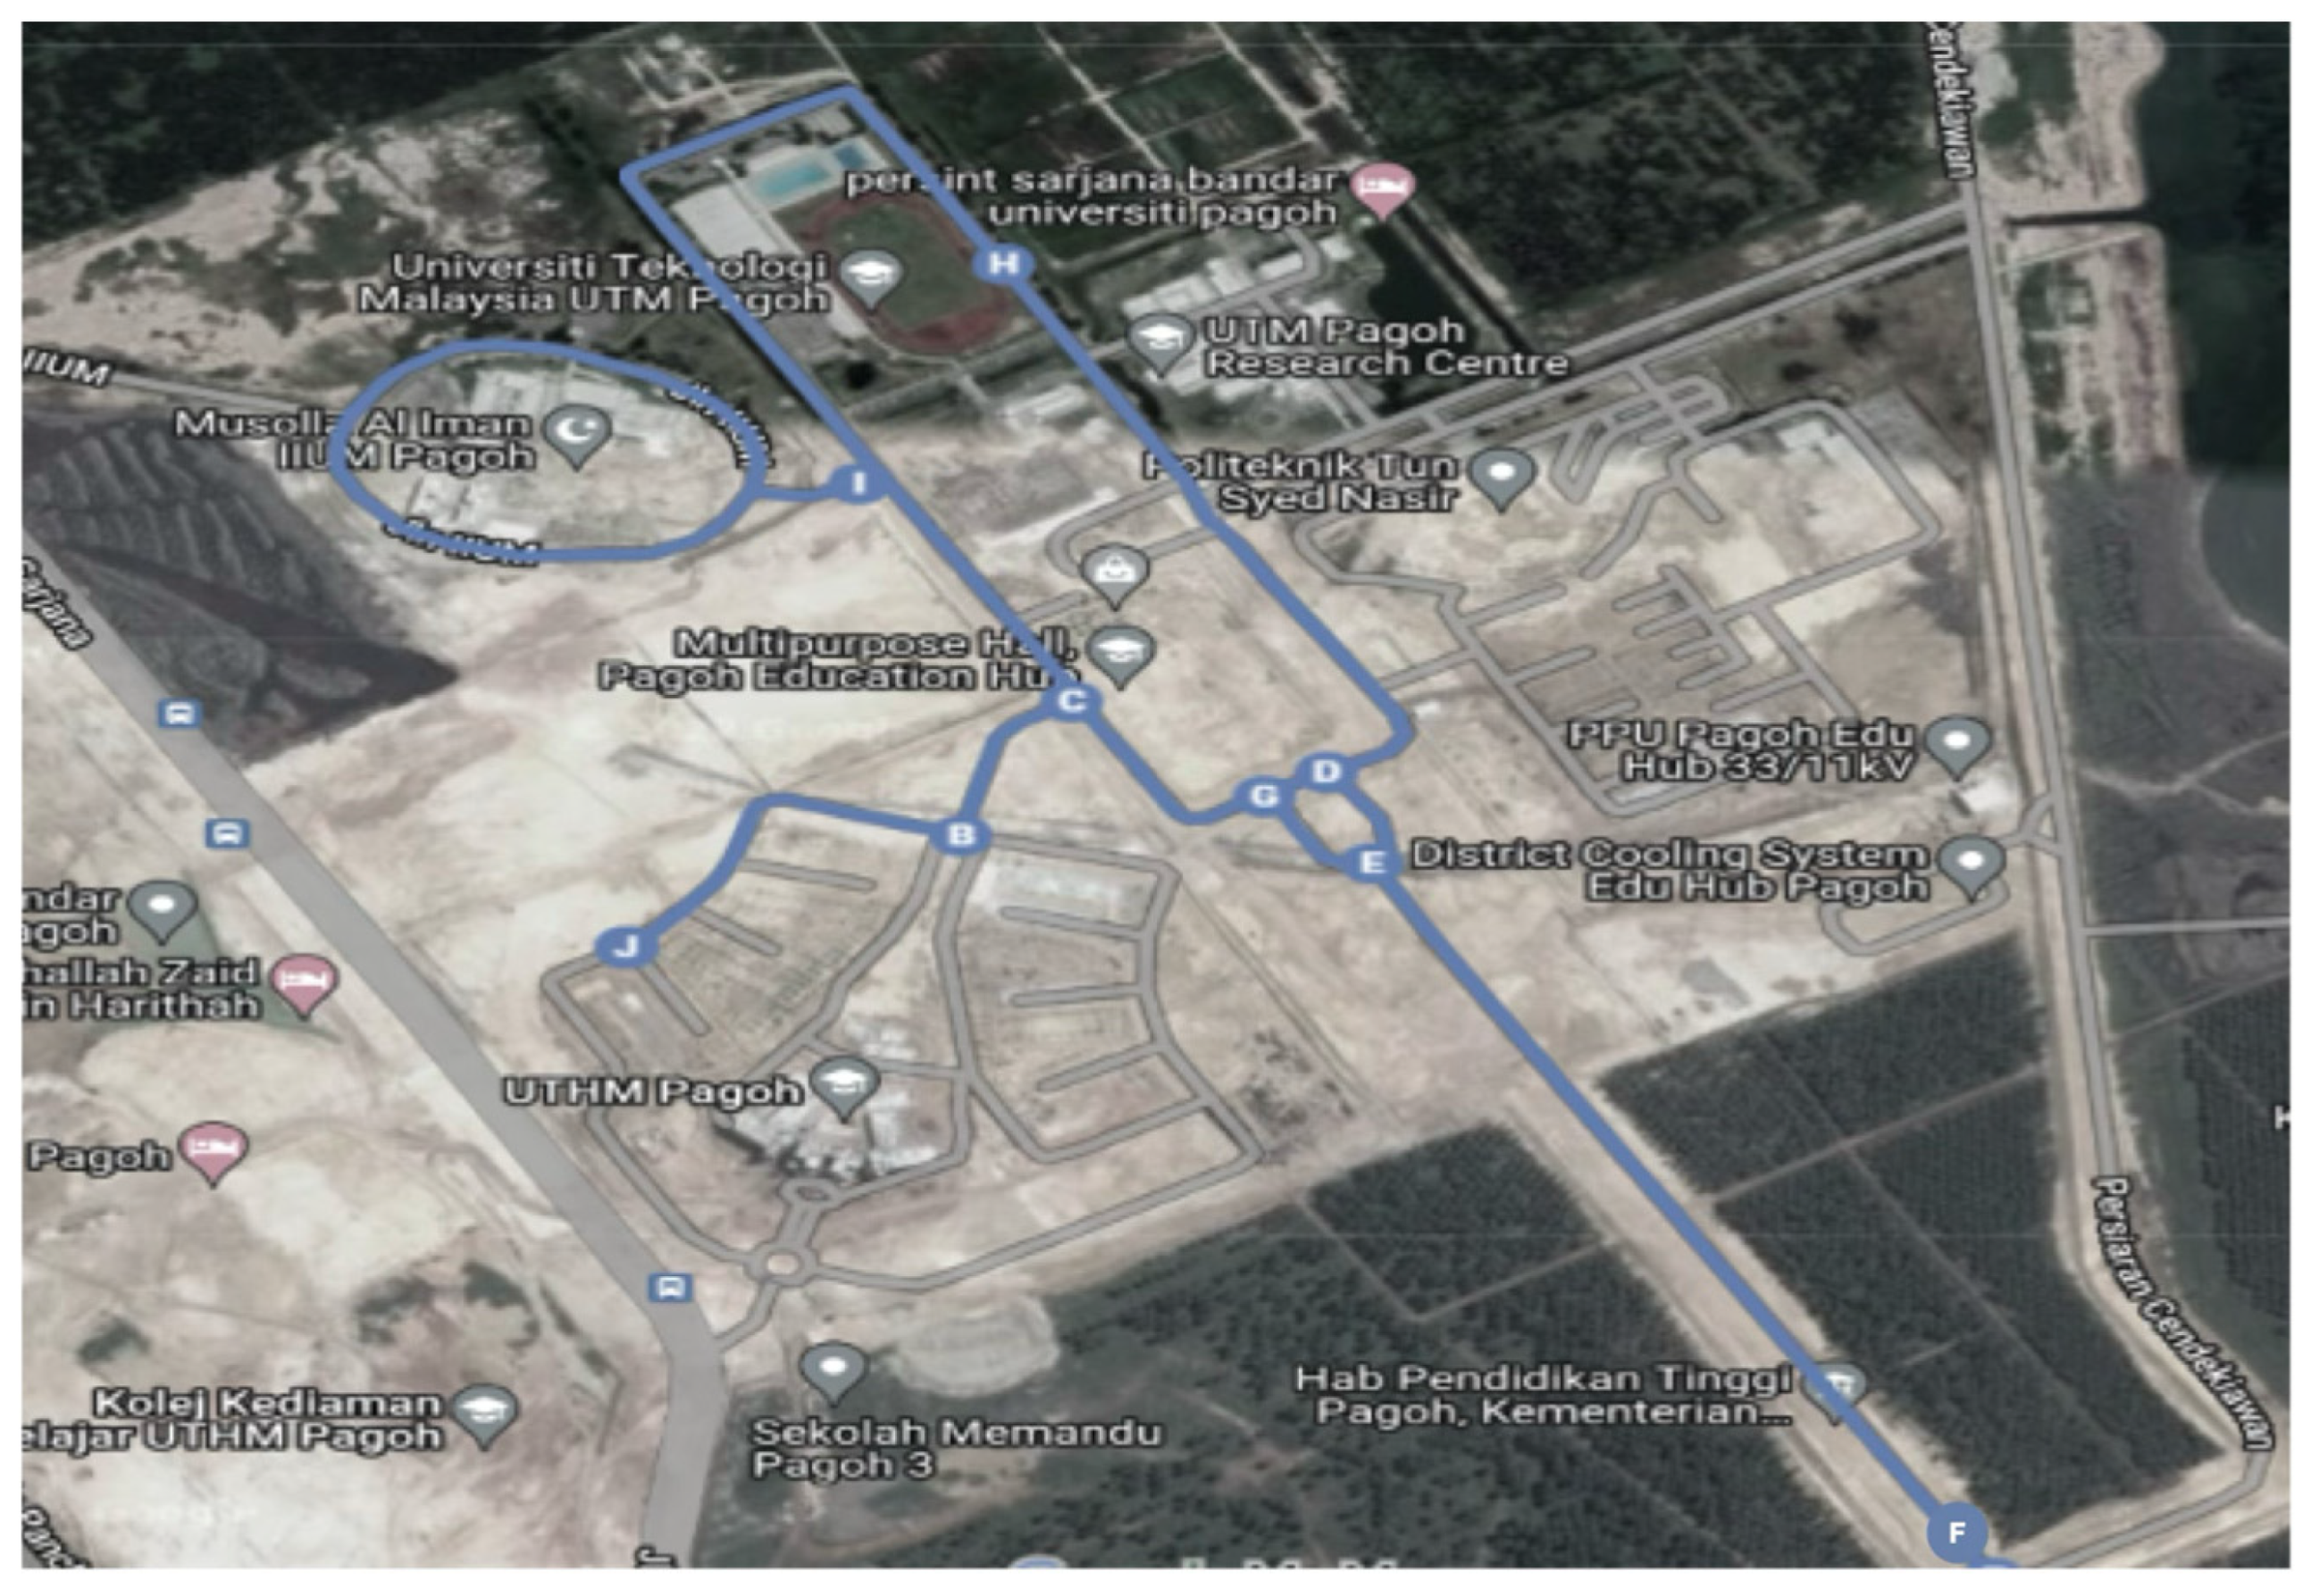
2.3. Designated Route
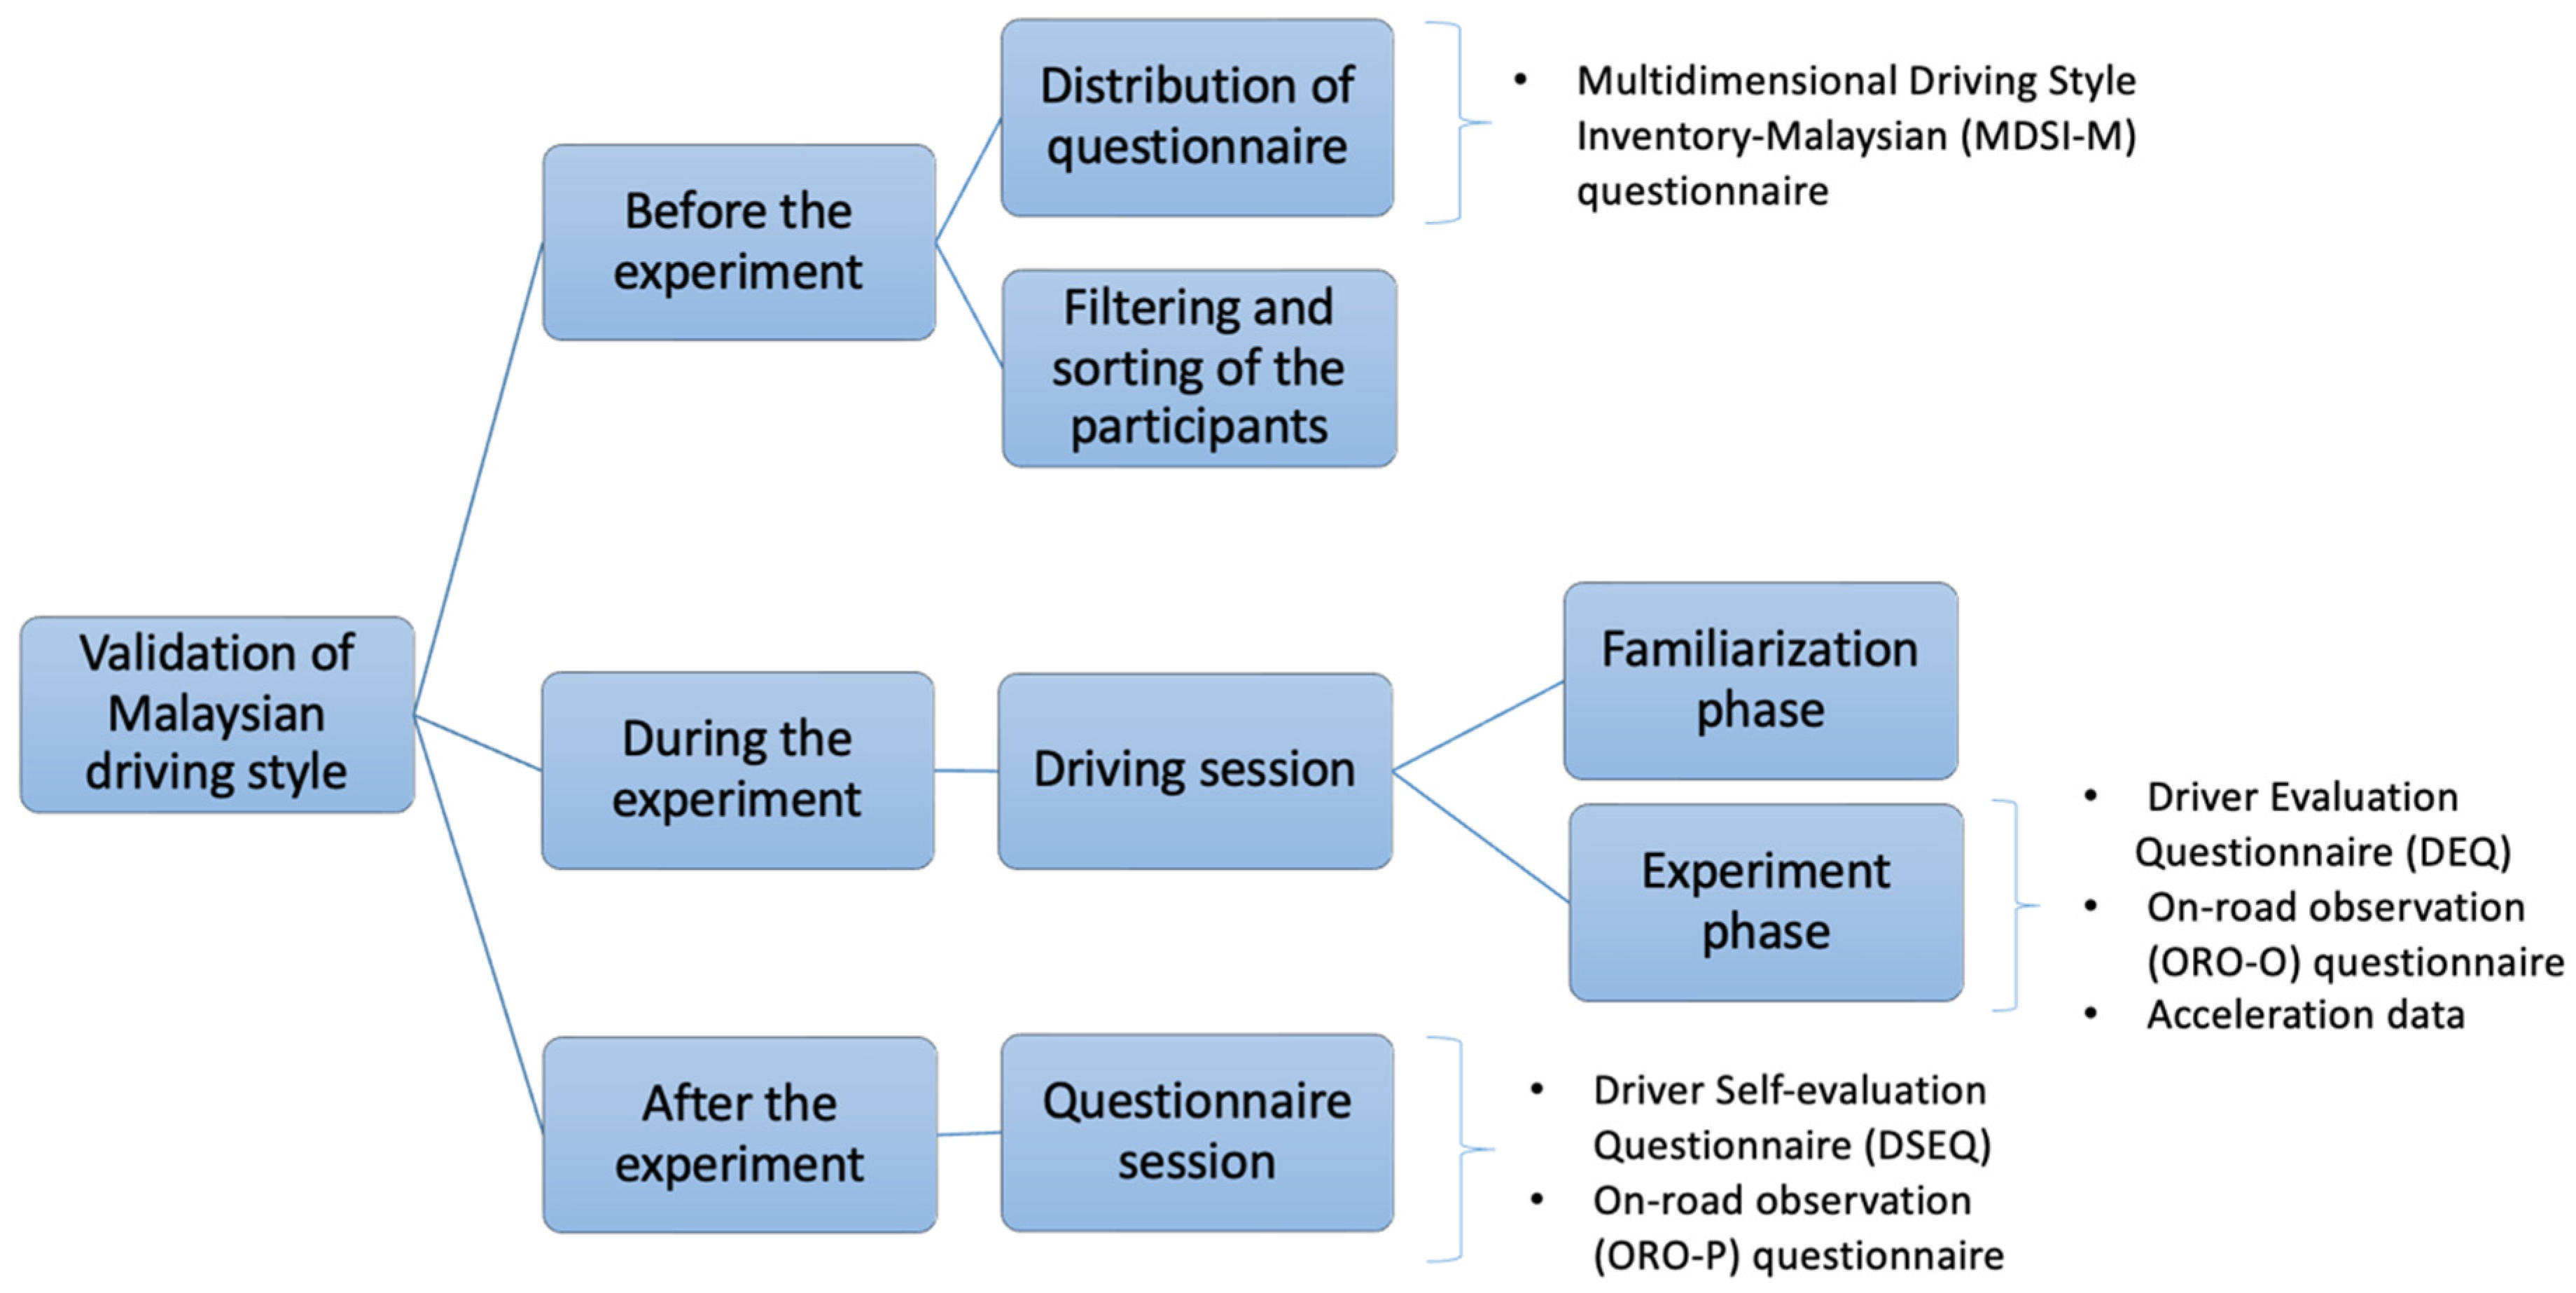
The participants were required to perform the driving sessions under two (2) sessions, including the familiarization and the experiment session. The experiment started with the familiarization session (about 5 min), which aimed to explain the purpose of the experiment and the objectives to the participants (see Figure 2). In addition, the familiarization session was used to familiarize the participants with the roundabout, cornering, straight line, and the vehicle used for this study. During this session, the participant could ask questions and clarify doubts. Then, the participant proceeded to the experiment session, where the participant went through the course for an estimated 25 min (see Figure 3).
The route consisted of roundabouts, cornering, and straight lines to imitate typical suburban roads in Malaysia. During the experiment session, the participant was instructed to complete the designated route two (2) times. The objective of this was to ensure that the data collected were dependable and accurate. The total distance covered was approximately 15 km, including 3 km for the familiarization session and 12 km for the experiment session.

2.4. Questionnaire

Four (4) questionnaires were used in this study (see Figure 4), namely the Multidimensional Driving Style Inventory-Malaysian (MDSI-M), On-Road Observation form (ORO), Driver Self-Evaluation Questionnaire (DSEQ), and Driver Evaluation Questionnaire (DEQ) [28]. In this study, participants answered the MDSI before undertaking the driving session. The designated observer evaluated the participants during the driving session using the DEQ and ORO (labeled as ORO-O, from here onwards). After the driving session, the participants completed a self-assessment of their driving by answering the DSEQ and ORO (labeled as ORO-P, from here onwards).
The MDSI-M summarizes the fact that the Malaysian driving style contains only 27 items with five (5) factors that should be rated on a Likert scale [20]. Based on the responses given from the seven (7)-point scale, these data indicate how frequently the driver engages in a list of driving habits using the given response scale (never, almost, sometimes, often, very often, and always). The result showed that the internal consistency questionnaire is reliable, indicating adequate to acceptable assessments for the following five (5) factors: careful driving (8 items, Cronbach’s alpha 0.73), risky driving (5 items, Cronbach’s alpha 0.69), angry driving (6 items, Cronbach’s 0.72), dissociative driving (5 items, Cronbach’s alpha 0.73), and anxious driving (3 items, Cronbach’s alpha 0.60) [20].
An ORO evaluates the driving behavior to indicate the error/violation of participants while operating in varied road situations and environments. The ORO evaluates five (5) dimensions of violations or errors: speed, lane use and passing, road signs, intersections and their usage, clearance and checking, and brakes and gears. The questionnaire was initially constructed based on previous research, with some items modified or removed to fit the objective based on the situation of Malaysian drivers [28]. For example, the dimensions of a traffic light were changed to road signs because the experiment was conducted in the university area. The item “Driving at the red light” was changed to “Driving when there is a stop sign”. The designated observer (see Figure 1) was required to rate the five (5) dimensions and 24 items of the ORO form during the driving session in terms of a five (5)-point Likert scale (“1” never, “5” very frequently) when the participant was driving the instrumented vehicle. The designated observer reported his observations on the form while moving between the different road segments at least two (2) times or more in each road segment.
The Driver Evaluation Questionnaire (DEQ) is a questionnaire form used by the designated experimenter to evaluate the participant’s performance. The Driver Self Evaluation Questionnaire (DSEQ) is a questionnaire that assesses the participant. This form comprises 18 items regarding driving style, behavior, and abilities. The questionnaire was initially constructed based on previous research [28] with some modifications to fit with the objective and designated route based on the situation of Malaysian drivers. For example, item number two was changed from the initial meaning of “perceiving hazards in traffic” to “perceiving hazards in the intersection” in terms of the five (5)-point Likert scale (where “1” indicates low and “5” indicates high-skill performance). The designated observer evaluated the DEQ during the driving session, while the participants evaluated themselves after the driving session using the DSEQ.

3. Results and Discussion

3.1. Pearson Correlation for Self-Assessment Questionnaire

Pearson’s correlation analysis was used to compare the relationship between the MDSI-M self-assessment and the participant’s driving activities ascertained from the observer’s judgment (ORO-O). The results for the MDSI-M score with error and violation scores from ORO-O were correlated (see Table 1). Firstly, the careful driving style showed a significantly low positive correlation with road sign usage (r = 0.37, p < 0.05). This suggests that careful drivers use road signs more frequently while driving. Conversely, the dissociative (r = −0.03, p < 0.05) and anxious (r = −0.03, p < 0.05) driving styles displayed low negative correlations with road sign usage, indicating that drivers with these styles tend to have lower scores for utilizing road signs [24]. Secondly, the dissociative driving style exhibited significant low-to-medium positive correlations with speed (r = 0.47, p < 0.05), clearance (r = 0.34, p < 0.05), and checking (r = 0.34, p < 0.05). This suggests that drivers with dissociative tendencies are more likely to engage in behaviors such as checking intersections and maintaining clearance during driving activities. Similarly, the anxious driving style displayed significant low-to-medium positive correlations with speed (r = 0.38, p < 0.05), clearance (r = 0.49, p < 0.05), and checking (r = 0.38, p < 0.05). This indicates that anxious drivers exhibit higher speeds and consistently check intersections and clearances [24].
Furthermore, the anxious driving style demonstrated significant low-to-medium positive correlations with lane use (r = 0.48, p < 0.05), passing (r = 0.37, p < 0.05), brakes (r = 0.48, p < 0.05), and gears (r = 0.37, p < 0.05). This implies that drivers with anxious tendencies have a higher risk of making mistakes in lane changes, passing maneuvers, braking, and gear selection compared to other driving styles [X]. Conversely, the careful driving style displayed significantly low negative correlations with lane use (r = −0.39, p < 0.05) and passing (r = −0.34, p < 0.05), indicating that careful drivers tend to use fewer lanes and pass less frequently. Additionally, the angry and dissociative driving styles exhibited significantly low negative correlations with road sign usage (r = −0.34, p < 0.05 and r = −0.32, p < 0.05), respectively. This suggests that angry and dissociative drivers tend to utilize road signs less frequently during their driving activities. These findings contribute to understanding the relationship between driving styles and specific driving behaviors. These findings also support previous research by [24,28] emphasizing the influence of personality traits on driving behavior. However, it is important to acknowledge this study’s limitations, including the reliance on self-assessments and the context-specific nature of the research conducted in Malaysia.
Meanwhile, there were also correlations between the MDSI-M with DEQ and DSEQ (see Table 2). The results showed a significant medium negative correlation with the “dissociative driver” (r = −0.39, p < 0.05). Next, a significant medium positive correlation was found between the DSEQ and careful driving (r = 0.47, p < 0.05). This result indicates that self-assessment was consistent before and after the experiment in showing the participant’s driving style, in general, for driving tasks.

3.1.1. Evaluation Between DEQ (Observer) and DSEQ (Participant)

ANOVA could be used to understand who is better at driving style evaluation, comparing different groups across two dependent variables: the DEQ and DSEQ. One-way ANOVA was used in this analysis because each independent variable (gender, driving experience, annual mileage) was being tested separately to see if it affected the dependent variables (DEQ and DSEQ). The mean item scores from DEQ and DSEQ were compared based on demographic data. Group means (see Table 3) show that gender driving experience and annual millage were covariates. The participant’s self-evaluation was higher compared to the observer, whereby only gender was significantly related to the difference between the DEQ and DSEQ (F(1, 39) = 1.63, p < 0.05). These results indicate that male participants evaluate their driving and driving skill levels much better than the observers.
The next section of the questionnaire concerns each DEQ and DSEQ item. Each item was compared individually (see Table 4) using the Wilcoxon signed ranked test. It was apparent that only three items were positively significant compared to eighteen items in the driving performance of all drivers.
In summary, these results indicate that most of the driving evaluations conducted by participants overestimated their driving performance on signals, relinquishing legitimate rights when necessary, and traffic lights. Moreover, a difference score was calculated to determine how many participants overestimated their driving performance in this research. The mean difference of 18 matching questions was labeled as “difference scores” after subtracting the observer’s rating (DEQ) from the participant’s rating (DSEQ) for each item. Drivers who scored a difference greater than zero rated their driving performance better than the expert’s opinion. The response rate was N = 29 for the total number of drivers who evaluated their driving performance as better than the expert’s. In contrast, (N = 12) drivers evaluated their driving performance as lower or the same compared to the expert’s evaluation.

3.1.2. Correlation of MDSI-M with the Acceleration Data

Pearson’s correlation was used to investigate the relationships between driving style derived from the MDSI-M and acceleration data in the longitudinal direction (see Table 5). There was a significantly low negative correlation between the MDSI’s careful driver score (r = −0.28) and the acceleration of cautious driving. Meanwhile, there was a significantly low positive correlation (r = 0.18) when comparing the MDSI to the acceleration of a “risky driver”. Together, these results provide important insights into the “careful driver”, who scored higher in the self-assessment for careful driving and had lower acceleration. At the same time, there was a high acceleration for the ”angry driver”. Next, the MDSI’s “risky driver” score showed a significantly low positive correlation (r = 0.07) with the acceleration risk. These results indicate that the “risky driver” has higher self-assessment scores and acceleration.
Interestingly, there was no significant correlation between the MDSI’s “angry driver” and MDSI’s “anxious driver” scores. Lastly, a significantly low negative correlation existed between the MDSI’s “anxious driver” score (r = −0.33) and the “dissociative driver” score for acceleration. Together, these results indicate that the “anxious driver” has a higher score but lower acceleration than the “dissociative driver”.

3.2. Discussion

The current study addresses the validation of Malaysian driving styles from the self-assessment questionnaire and acceleration data to assess the performance of driving style classification in on-road studies. Within the established Malaysian language and culture, it was discovered that the MDSI-M is reliable and valid in determining the types of Malaysian drivers [20]. However, this raises the question of whether a questionnaire is the best way to evaluate a person’s driving style or if it is possible to precisely define it due to the possibility of bias while responding to that question. The driving style was evaluated using self-assessment and a vehicle data recorder, which included many items about particular driving characteristics to date.
Firstly, before constructing validity, the question that needed to be answered was whether the self-assessment questionnaire was reliable or otherwise in reflecting Malaysian driving style. Therefore, Cronbach’s alpha was performed to measure the internal consistency (a measure of reliability) of each factor in the MDSI-M scale, and the result was good and acceptable (from r = 0.52 to r = 0.77). Each scale of the self-assessments was also analyzed to determine whether they were reliable, and the results also indicated a high level of internal consistency (from r = 0.70 to r = 0.89). The results showed that self-assessments were reliable for the study. The result is consistent with the recent findings in the literature [10,28].
Secondly, the self-assessment questionnaire was checked for any possible bias because the respondents might answer it based on their experience of driving activities. Therefore, in this study, a designated observer and participant evaluated their driving performance during and after the driving session. The results showed no significance between the observer’s (ORO-O) and participant’s evaluation (ORO-P). In addition, when driving skills and behaviors were evaluated using a questionnaire relating to general driving competence that was not particular to one driving session, the result showed no significance between the driver’s (DEQ) and observer’s ratings (DSEQ) for most items. However, when moving to the criterion validity for MDSI-M, the results showed a modest correlation between them (see Table 1). A low-to-medium correlation illustrated in this study proved that there was a correlation between the participant’s answers before and after the experiment was completed. However, a slight correlation between the observer’s evaluation and the participant’s self-rating in the results was also reasonable and was to be expected.
The first reason for this was that the sampling size used in this study was minimal (n = 41). Using the GPower sample size calculator, if a medium effect size was selected (f = 0.25) with an alpha error probability of 0.05 and power of 95%, it reveals that a sample of around 210 participants was needed [37].
A previous study showed that male drivers were more likely to have a higher correlation for risk behavior than female drivers because of the considerable gap in the sample size [38]. Secondly, the findings showed that the observer reports were based on small conversation tasks in a brief period. A possible explanation for the results may be that the on-road evaluation focused only on 30 min without including the familiarization phase. The differences can be partly explained by the proximity of the study [28] when it was performed over a more extended period. The results showed a small-to-medium correlation between the observer and the participant evaluations. Most recent studies also showed at least a correlation between the self-assessment of the observer and participant when increasing the experiment period [24,38,39]. Hence, some behaviors may change if the driving activity period is extended.
Next, the result showed an expected outcome when most drivers appraised their driving competence as overly positive. The response rate was N = 29, which is the total number of drivers who evaluated their driving performance as better than the expert’s evaluation. At the same time, the value N = 12 was either lower or the same as the observer’s evaluation number. These results match those of previous work [28], reiterating the earlier finding that drivers tend to overestimate their driving skills. Next, an analysis was performed to determine what demographic factors caused the participant to overestimate their driving skill. The results showed that one unexpected finding was found from the ANOVA analysis (see Table 3). The difference between genders was significantly related to the difference between DEQ and DSEQ. Even though there was a new contribution shown in these studies, contrary expectations supported the previous research [28], which found a significant difference between age and annual mileage. The lack of age difference between the participants may be a possible explanation for these results. For example, ref. [40] did not have a requirement to set an age limit for each participant, while this study focused only on novice drivers, most of whom were students (aged 17–29 years old). There are several possible explanations for this: if the variety of age ranges increased, the possibility of seeing a high correlation for each type of driver would also increase [41]; next, the objective focused on novice drivers because they are the future users of automated vehicles. So, it was relevant to use the age limitation to increase the possibility of validating the hypothesis of these studies, indicating a need to broaden the sample to include a more diverse and wide age range. Next, the Wilcoxon test was used to compare each item in the driving evaluation and driving self-evaluation questionnaire (see Table 4). It is interesting to note that only three items were significant, while the rest were not. Table 4 also shows that most items evaluated were the same for the observer and participant. This means there was no difference in the evaluation for the participant and the designated observer. In conclusion, there was no bias when the study was performed for driving style in the self-assessment questionnaire because the error tendency for the self-assessment was lower.
The findings from the current study are consistent with findings from the literature, indicating substantial relationships between self-reported driving style ratings and driving behavior in a driving simulator [10,24]. This finding supports the notion that the MDSI results are predictive of driving behavior in a simulator. The MDSI scale could distinguish each type of driver using Barlett’s method [12]. The results in Table 5 show that there is a significant relationship between them. The results provided a significantly low negative correlation for the MDSI’s “careful driver” score (r = −0.28) with cautious acceleration.
Meanwhile, there was a significantly low positive correlation (r = 0.18) comparing the acceleration from “risky driver” and so on (see Table 5). This result was in line with the previous literature by observing the correlation between acceleration data and scores from the self-assessment [10,31]. Together, these results provide important insights for careful drivers, with a higher score for cautious driving with lower acceleration, while there was high acceleration for “angry drivers”. These findings further support the idea that a driver who accelerates quickly must apply the brakes more forcefully, illustrated by the higher acceleration for the “risky driver” [42]. Meanwhile, the “careful driver” slowly used the lower gears and brakes, resulting in a low acceleration [24].

4. Conclusions

In conclusion, the findings indicate that ongoing research is appropriate to investigate driving style when the self-assessment method is performed based on objective, sensitive, and strongly correlated indicators. In addition, the results were generally consistent with prior studies on driving simulators; even the current research was performed using on-road situations, demonstrating that the MDSI is predictive of driving style. Next, the study suggested that MDSI can be utilized as a diagnostic instrument to detect the usual driving behavior of individuals by collecting acceleration data.
The results from this study indicate that for the first hypothesis, there are no concrete correlations between the observation and self-rating evaluation. The results for the second hypothesis show that the driving styles of “careful”, “risky”, and “dissociative” correlate with the respective acceleration observed, while the driving styles of “angry” and “anxious” do not have any correlation with the same comparison.
Meanwhile, a possible limitation of this study might be the ability to control all the experiment variables, such as road situation and environment, when the driving activities are performed on the road compared to a simulation. This limitation is due to the fact that in a simulation study, the setup is under control, reproducible, and standardized. Meanwhile, the situation on-road is not the same every time the study is conducted, unlike driving circumstances utilizing simulators. Hence, each participant may experience different conditions during the experiment using on-road conditions.

Author Contributions

Conceived and designed the experiments, M.Z.A.K. and J.K.; Performed the experiments, M.Z.A.K. and J.K.; Analyzed and interpreted the data, M.Z.A.K., J.K. and N.M.; Wrote the original paper, M.Z.A.K. and J.K.; Wrote the revised manuscript, M.Z.A.K., J.K., N.M., N.M.Y., M.Z.H., M.Z.B., Z.M.J. and M.R. All authors have read and agreed to the published version of the manuscript.

Funding

This research is fully supported by a national grant from Ministry of Higher Education (MOHE), Malaysia with funding number of FRGS/1/2020/TK02/UTEM/02/1.

Institutional Review Board Statement

The study was conducted in accordance with the Declaration of Helsinki, and approved by the Institutional Review Board (or Ethics Committee) of Universiti Teknikal Malaysia Melaka on 1 April 2019 (Reference letter: UTeM.23.01/500-25/4 Jilid 5(30)).

Informed Consent Statement

Informed consent was obtained from all subjects involved in the study.

Data Availability Statement

All data are available from the authors.

Acknowledgments

The authors thank the Ministry of Higher Education (MOHE) and Universiti Teknikal Malaysia Melaka (UTeM) for the approved funds and support to make this vital research viable and effective. This research is fully supported by a national grant, FRGS/1/2020/TK02/UTEM/02/1. The ethics committee has approved this study (UTeM.23.01/500-25/4 Jilid 5(30)).

Conflicts of Interest

The authors declare no conflicts of interest.

References

  1. Ishibashi, M.; Okuwa, M.; Doi, S.; Akamatsu, M. Indices for Characterizing Driving Style and Their Relevance to Car Following Behavior. In Proceedings of the SICE Annual Conference, Takamatsu, Japan, 17–20 September 2007; pp. 1132–1137. [Google Scholar] [CrossRef]
  2. Yigitcanlar, T.; Kamruzzaman, M. Smart cities and mobility: Does the smartness of Australian cities lead to sustainable commuting patterns? J. Urban Technol. 2019, 26, 21–46. [Google Scholar] [CrossRef]
  3. Qiao, Z.; Sun, X.; Loeb, H.; Mangharam, R. Drive Right: Shaping Public’s Trust, Understanding, and Preference Towards Autonomous Vehicles Using a Virtual Reality Driving Simulator. In Proceedings of the 2023 IEEE Intelligent Vehicles Symposium (IV), Anchorage, AK, USA, 4–7 June 2023; pp. 1–8. [Google Scholar]
  4. Delmas, M.; Camps, V.; Lemercier, C. Personalizing automated driving speed to enhance user experience and performance in intermediate-level automated driving. Accid. Anal. Prev. 2024, 199, 107512. [Google Scholar] [CrossRef] [PubMed]
  5. Yang, H.; Zhou, Y.; Wu, J.; Liu, H.; Yang, L.; Lv, C. Human-Guided Continual Learning for Personalized Decision-Making of Autonomous Driving. IEEE Trans. Intell. Transp. Syst. Early Access 2025. [Google Scholar] [CrossRef]
  6. Sagberg, F.; Selpi; Piccinini, G.F.B.; Engström, J. A Review of Research on Driving Styles and Road Safety. Hum. Factors 2015, 57, 1248–1275. [Google Scholar] [CrossRef]
  7. Cordero, J.; Aguilar, J.; Aguilar, K.; Chávez, D.; Puerto, E. Recognition of the Driving Style in Vehicle Drivers. Sensors 2020, 20, 2597. [Google Scholar] [CrossRef] [PubMed] [PubMed Central]
  8. Yang, L.; Ma, R.; Zhang, H.M.; Guan, W.; Jiang, S. Driving behavior recognition using EEG data from a simulated car-following experiment. Accid. Anal. Prev. 2018, 116, 30–40. [Google Scholar] [CrossRef]
  9. Basu, C.; Yang, Q.; Hungerman, D.; Singhal, M.; Dragan, A.D. Do You Want Your Autonomous Car to Drive Like You? In Proceedings of the ACM/IEEE International Conference on Human-Robot Interaction, Vienna, Austria, 6–9 March 2017; pp. 417–425. [Google Scholar] [CrossRef]
  10. Taubman-Ben-Ari, O.; Mikulincer, M.; Gillath, O. The multidimensional driving style inventory—Scale construct and validation. Accid. Anal. Prev. 2004, 36, 323–332. [Google Scholar] [CrossRef]
  11. van Huysduynen, H.H.; Terken, J.; Martens, J.-B.; Eggen, B. Measuring Driving Styles. In Proceedings of the 7th International Conference on Automotive User Interfaces and Interactive Vehicular Applications, Nottingham, UK, 1–3 September 2015; pp. 257–264. [Google Scholar] [CrossRef]
  12. Karjanto, J.; Yusof, N.M.; Terken, J.; Hassan, M.Z.; Delbressine, F.; van Huysduynen, H.H.; Rauterberg, M. The identification of Malaysian driving styles using the multidimensional driving style inventory. MATEC Web Conf. 2016, 90, 01004. [Google Scholar] [CrossRef]
  13. Martinussen, L.M.; Hakamies-Blomqvist, L.; Møller, M.; Özkan, T.; Lajunen, T. Age, gender, mileage and the DBQ: The validity of the Driver Behavior Questionnaire in different driver groups. Accid. Anal. Prev. 2013, 52, 228–236. [Google Scholar] [CrossRef]
  14. Glendon, A.I.; Dorn, L.; Matihews, G.; Gulian, E.; Davies, D.R.; Debney, L.M. Reliability of the driving behaviour inventory. Ergonomics 1993, 36, 719–726. [Google Scholar] [CrossRef]
  15. French, D.J.; West, R.J.; Elander, J.; Wilding, J.M. Decision-making style, driving style, and self-reported involvement in road traffic accidents. Ergonomics 1993, 36, 627–644. [Google Scholar] [CrossRef] [PubMed]
  16. West, R.; Hall, J. The role of personality and attitudes in traffic accident risk. Appl. Psychol. 1997, 46, 253–264. [Google Scholar] [CrossRef]
  17. Holman, A.C.; Havârneanu, C.E. The Romanian version of the multidimensional driving style inventory: Psychometric properties and cultural specificities. Transp. Res. Part F Traffic Psychol. Behav. 2015, 35, 45–59. [Google Scholar] [CrossRef]
  18. Long, S.; Ruosong, C. Reliability and validity of the Multidimensional Driving Style Inventory in Chinese drivers. Traffic Inj. Prev. 2019, 20, 152–157. [Google Scholar] [CrossRef]
  19. Padilla, J.L.; Castro, C.; Doncel, P.; Taubman, O. Adaptation of the multidimensional driving styles inventory for Spanish drivers: Convergent and predictive validity evidence for detecting safe and unsafeAC driving styles. Accid. Anal. Prev. 2020, 136, 105413. [Google Scholar] [CrossRef]
  20. Kamaludin, M.Z.A.; Bin Karjanto, J.; Muhammad, N.; Yusof, N.M.; Hassan, M.Z.; Zulkifli, A.F.; Ab Rashid, A.A. Exploration of Automated Vehicle’s Driving Style by Adapting Multidimensional Driving Styles Inventory for Malaysian Drivers. Adv. Transp. Stud. 2022, 58, 229–244. [Google Scholar] [CrossRef]
  21. Sümer, N.; Özkan, T.; Lajunen, T. Asymmetric relationship between driving and safety skills. Accid. Anal. Prev. 2006, 38, 703–711. [Google Scholar] [CrossRef]
  22. Shanker RJonas, A.; Devitt, S.; Huberty, K.; Flannery, S.; Greene, W.; Swinburne, B.; Locraft, G.; Wood, A.; Weiss, K.; Moore, J. Autonomous cars: Self-driving the new auto industry paradigm. Morgan Stanley Blue Pap. 2013, 1–109. [Google Scholar]
  23. Beiker, S.A. Legal aspects of autonomous driving. Santa Clara L. Rev. 2012, 52, 1145. [Google Scholar] [CrossRef]
  24. van Huysduynen, H.H.; Terken, J.; Eggen, B. The relation between self-reported driving style and driving behaviour. A simulator study. Transp. Res. Part F Traffic Psychol. Behav. 2018, 56, 245–255. [Google Scholar] [CrossRef]
  25. WÅhlberg, A.A.F. Driver Behaviour and Accident Research Methodology: Unresolved Problems; CRC Press: Boca Raton, FL, USA, 2017. [Google Scholar]
  26. West, R.; French, D.; Kemp, R.; Elander, J. Direct observation of driving, self reports of driver behaviour, and accident involvement. Ergonomics 1993, 36, 557–567. [Google Scholar] [CrossRef] [PubMed]
  27. Holland, C.; Geraghty, J.; Shah, K. Differential moderating effect of locus of control on effect of driving experience in young male and female drivers. Personal. Individ. Differ. 2010, 48, 821–826. [Google Scholar] [CrossRef]
  28. Amado, S.; Arikan, E.; Kaça, G.; Koyuncu, M.; Turkan, B.N. How accurately do drivers evaluate their own driving behavior? An on-road observational study. Accid. Anal. Prev. 2014, 63, 65–73. [Google Scholar] [CrossRef] [PubMed]
  29. Möller, H.-J. Effectiveness studies: Advantages and disadvantages. Dialogues Clin. Neurosci. 2011, 13, 199–207. [Google Scholar] [CrossRef]
  30. Vaitkus, V.; Lengvenis, P.; Zylius, G. Driving style classification using long-term accelerometer information. In 2014 19th International Conference on Methods and Models in Automation and Robotics (MMAR); IEEE: Piscataway, NJ, USA, 2014; pp. 641–644. [Google Scholar] [CrossRef]
  31. Murphey, Y.L.; Milton, R.; Kiliaris, L. Driver’s Style Classification Using Jerk Analysis. In Proceedings of the 2009 IEEE Workshop on Computational Intelligence in Vehicles and Vehicular Systems, CIVVS 2009—Proceedings, Nashville, TN, USA, 30 March–2 April 2009; pp. 23–28. [Google Scholar] [CrossRef]
  32. Khorram, B.; Wåhlberg, A.E.A.; Kashani, A.T. Longitudinal jerk and acceleration as measures of safety in bus rapid transit drivers in Tehran. Theor. Issues Ergon. Sci. 2020, 21, 577–594. [Google Scholar] [CrossRef]
  33. Itkonen, T.H.; Pekkanen, J.; Lappi, O.; Kosonen, I.; Luttinen, T.; Summala, H. Trade-off between jerk and time headway as an indicator of driving style. PLOS ONE 2017, 12, e0185856. [Google Scholar] [CrossRef]
  34. Feng, F.; Bao, S.; Sayer, J.R.; Flannagan, C.; Manser, M.; Wunderlich, R. Can vehicle longitudinal jerk be used to identify aggressive drivers? An examination using naturalistic driving data. Accid. Anal. Prev. 2017, 104, 125–136. [Google Scholar] [CrossRef]
  35. Pande, A.; Chand, S.; Saxena, N.; Dixit, V.; Loy, J.; Wolshon, B.; Kent, J.D. A preliminary investigation of the relationships between historical crash and naturalistic driving. Accid. Anal. Prev. 2017, 101, 107–116. [Google Scholar] [CrossRef]
  36. Yan, F.; Liu, M.; Ding, C.; Wang, Y.; Yan, L. Driving style recognition based on electroencephalography data from a simulated driving experiment. Front. Psychol. 2019, 10, 1254. [Google Scholar] [CrossRef]
  37. Faul, F.; Erdfelder, E.; Lang, A.-G.; Buchner, A. G*Power 3: A flexible statistical power analysis program for the social, behavioral, and biomedical sciences. Behav. Res. Methods 2007, 39, 175–191. [Google Scholar] [CrossRef]
  38. Zardosht, M.; Beauchemin, S.S.; Bauer, M.A. Identifying Driver Behavior in Preturning Maneuvers Using In-Vehicle CANbus Signals. J. Adv. Transp. 2018, 2018, 5020648. [Google Scholar] [CrossRef]
  39. Choi, S.; Kim, J.; Kwak, D.; Angkititrakul, P.; Hansen, J.H.L. Analysis and classification of driver behavior using in-vehicle can-bus information. Bienn. Workshop DSP Veh. Mob. Syst. 2015, 2007, 17–19. [Google Scholar]
  40. Harris, P.B.; Houston, J.M.; Vazquez, J.A.; Smither, J.A.; Harms, A.; Dahlke, J.A.; Sachau, D.A. The Prosocial and Aggressive Driving Inventory (PADI): A self-report measure of safe and unsafe driving behaviors. Accid. Anal. Prev. 2014, 72, 1–8. [Google Scholar] [CrossRef]
  41. Zimbardo, P.G.; Keough, K.A.; Boyd, J.N. Present time perspective as a predictor of risky driving. Personal. Individ. Differ. 1997, 23, 1007–1023. [Google Scholar] [CrossRef]
  42. Götze, M.; Bißbort, F.; Petermann-Stock, I.; Bengler, K. ‘A careful driver is one who looks in both directions when he passes a red light’–increased demands in urban traffic. In International Conference on Human Interface and the Management of Information; Springer: Berlin/Heidelberg, Germany, 2014; pp. 229–240. [Google Scholar]
Figure 1. Location of the accelerometer (ADXL 335, Analog Devices, Inc., Wilmington, MA, USA), DAQ, participant, experimenter, and designated observer inside the test vehicle.
Information 16 00140 g001
Figure 2. The familiarization route, started at A and ended at E (source: Google Maps).
Information 16 00140 g002
Figure 3. The experiment route, started at B and ended at J (source: Google Maps).
Information 16 00140 g003
Figure 4. The methodological approach to validate Malaysian driving styles using self-assessment.
Information 16 00140 g004
Table 1. Correlation between MDSI-M score with error and violation from ORO form.
MDSI-M
ScaleCarefulRiskyAngryAnxiousDissociative
ORO-OSpeed −0.150.230.060.47 *0.38 *
Lane use and passing−0.070.07−0.010.210.21
Road sign0.34 *−0.29−0.17−0.49 *−0.32 *
Intersection and usage−0.18−0.000.050.170.16
Clearance and checking−0.050.110.060.34 *0.48 *
Brakes and gears0.040.090.020.040.16
ORO-PSpeed−0.210.11−0.010.010.28
Lane use and passing−0.39 *−0.01−0.030.270.48 *
Road sign0.15−0.24−0.34 *−0.32 *−0.27
Intersection usage−0.280.02−0.050.020.39 *
Clearance and checking−0.080.090.14−0.010.10
Brakes and gears−0.220.08−0.010.150.37 *
p < 0.05 * indicates a significant effect.
Table 2. Correlation MDSI-M with DEQ and DSEQ.
CarefulRiskyAngryAnxiousDissociative
DEQ0.17−0.30−0.19−0.34 *−0.39 *
DSEQ0.47 *−0.100.14−0.25−0.50 *
p < 0.05 * indicates a significant effect.
Table 3. ANOVA analysis for DEQ and DSEQ.
Population Size (N)DEQDSEQ
MeanSDANOVAMeanSDANOVA
GenderMale303.890.56F(1,39) = 0.699 p = 0.4083.930.43F(1,39) = 1.627 p = 0.002 *
Female113.730.383.480.21
Driving experienceNovice driver103.830.50F(2,38) = 0.825 p = 0.4483.950.40F(2,38) = 2.135 p = 0.132
Moderate driver243.780.583.700.38
Experienced driver74.070.274.000.56
Annual mileageRarely drive53.960.53F(1,39) = 0.260 p = 0.6133.680.56F(1,39) = 0.510 p = 0.480
Daily driver363.830.533.830.41
p < 0.05 * indicates a significant effect.
Table 4. Wilcoxon analysis for DEQ and DSEQ.
ItemsDEQDSEQZ
MSDMSD
Steering4.410.594.100.66−2.42
Anger toward other drivers2.050.892.441.12−2.12
Supportive driving3.951.053.880.75−0.22
Anxiety2.491.122.391.22−0.41
Vigilance4.390.974.100.70−1.96
Safety3.930.994.320.61−2.13
Fluent driving4.630.704.240.70−2.57
Perceiving hazards in an intersection4.510.784.340.79−0.98
Careful towards other road users4.340.734.490.51−0.93
Driving behind a car without being impatient2.881.232.711.10−0.89
Predicting traffic situations ahead4.220.654.000.78−0.28
Fluent lane changes4.070.914.100.66−1.60
Adjusting speed4.070.934.120.68−0.05
Signal4.560.844.050.81−3.25 *
Relinquishing legitimate rights when necessary4.410.673.760.86−3.41 *
Avoiding risk4.221.014.290.72−0.04
Conforming to speed limits3.071.593.390.83−1.33
Obeying traffic lights2.981.393.850.73−3.41 *
p < 0.01 * indicates a significant effect.
Table 5. Correlation between MDSI and acceleration data (longitudinal direction).
Correlation (r)
MDSIAcceleration_CarefulAcceleration_RiskyAcceleration_AngryAcceleration_AnxiousAcceleration_Dissociative
Careful−0.28 *0.18 *0.100.28−0.05
Risky0.230.07 *0.330.090.02
Angry0.200.230.220.040.23
Anxious−0.370.190.090.00−0.11
Dissociative0.13−0.01−0.030.23−0.33 *
p < 0.05 * indicates a significant effect.
Disclaimer/Publisher’s Note: The statements, opinions and data contained in all publications are solely those of the individual author(s) and contributor(s) and not of MDPI and/or the editor(s). MDPI and/or the editor(s) disclaim responsibility for any injury to people or property resulting from any ideas, methods, instructions or products referred to in the content.

