Article

Integrating Instrument Networking and Programming into Electronics Curricula: Design, Implementation, and Impact

1
School of Electrical and Computer Engineering, Academy of Technical and Art Applied Studies Belgrade, 11000 Belgrade, Serbia
2
School of Electrical Engineering, University of Belgrade, 11000 Belgrade, Serbia
*
Author to whom correspondence should be addressed.
Information 2025, 16(12), 1024; https://doi.org/10.3390/info16121024
Submission received: 21 October 2025 / Revised: 16 November 2025 / Accepted: 20 November 2025 / Published: 24 November 2025

Abstract

The development of electronics education requires continuously keeping pace with changes in pedagogical methods, hardware, and software, as well as with emerging laboratory concepts such as remote, virtual, and augmented reality. This paper proposes an open, curriculum-integrated approach to embed ICT competencies, specifically computer networking and programming, into electronics education and assesses its impact. We developed a networked measurement and information-processing system that students not only use but also learn about every aspect of its operation across our electronics courses. The system uses LXI-capable measurement instruments connected using principles of standard computer networks, enabling built-in remote-access capabilities and high scalability. Software for communication, instrument control, and purpose-built functions for electronics applications is implemented in Python 3. The software also handles data acquisition and local or remote post-processing. In this way, the system is open, versatile, and readily adaptable to future instrument developments. Integrating this system into the curriculum demonstrably enhanced students’ ICT, digital, and entrepreneurial competencies, aligning with the European Commission competency frameworks. Evaluation, using purpose-built questionnaires, indicated strong student reception across multiple system aspects and confirmed the approach relevance and applicability from the perspective of industry stakeholders.

1. Introduction

Education, in general, especially in the fields that include hardware and software topics as their essential parts, as is the case in electronics, is in permanent development. This entails the use of new technologies and methods across different segments, with the goal of improving the content, work approaches, pedagogical methods, and impact on outcomes and competencies. Approaches to innovating electronics courses are often focused on introducing new pedagogical methods [1], innovating the hardware segment of the system [2], or completely rethinking the organization of the laboratory [3].
The concept we propose in this paper is focused on improving education in the area of electronics and related disciplines by using programmable instruments and ICT technologies, particularly computer networks and programming. We suggest a new educational approach where the measurement system and the information-processing system are integral parts of the course and teaching materials, providing additional educational benefits and improving teachers’ and students’ skills. The hardware segment of the solution includes programmable measuring instruments that can be connected based on the Ethernet, highlighting the computer network principles of our solution. On the software side, providing measurement systems with automation and management possibilities required knowledge of computer programming. These additions to the electronics courses were implemented in a fully open manner, meaning that all aspects of the solutions are included in the course materials. This resulted in the improvement in ICT competencies among teachers and students, as well as a broader impact on pedagogical objectives, specifically the enhancement of the digital and entrepreneurial competencies of our students, an outcome that we investigate the extent of in this research. The evaluation of the impact of our work also included a detailed student questionnaire on the materials, innovations, and competencies, as well as a questionnaire for entrepreneurs about the ICT technologies employed, to evaluate our question regarding their significance to industry practice. The system was developed for four courses, Analog Electronics and Special Electronic Circuits at the School of Electrical and Computer Engineering (VISER), the Academy of Technical and Art Applied Studies Belgrade (ATUSS), and Electrical Measurements and Power Electronics at the School of Electrical Engineering (ETF), University of Belgrade (UB). This paper presents all elements of the solution, but for a higher level of adherence to the principles of openness and reproducibility, complete examples are provided on sharing platforms, specifically GitHub and Zenodo [4,5].
The paper is divided into eight sections, as illustrated in the flowchart shown in Figure 1. Section 1 presents the introduction, and Section 2 provides an overview of related work. Methods and materials are presented in Section 3, Section 4 and Section 5 which include the presentation of the hardware segment, that is, networked programmable measurement instruments in Section 3; the software segment, that is, the way programming is used for control and measurement automation in such systems in Section 4; and examples of complete solutions for the characterization of electrical circuits in this new system in Section 5. Section 6 presents three selected solutions from electronics courses that use the system and the obtained results. Section 7 explains the principles and results of a detailed analysis of the impact of the new system. Finally, Section 8 presents final conclusions, limitations, and future work.

2. Related Work

Improving electronics education can be achieved in several ways. The literature highlights the following directions for improvement: different teaching methods, the introduction of additional adaptable hardware, and innovations in laboratory systems. Frequently, contributions include more than one method and more than one technology being applied. Below, we present selected references relevant to our work along with their key aspects for each of these categories.
With the aim to improve education in electronics, different educational methods have been applied. These methods are based on fundamental principles that focus on concepts [6,7] through methods that emphasize an interdisciplinary approach combining different topics related to a central topic [8], methods that focus on Project-Based Learning (PBL) [1,6,7], and methods using systems thinking principles (moving from whole to parts and highlighting relationships), such as [9], which presents a framework integrating these principles with maker culture and IoT in technical education, including methods of flipped teaching [10] and interventions that reinforce student learning [11].
Another pronounced direction for improvement in electronics education is the use of additional hardware components that are not the main topic of the considered electronics course, serving mainly as means to augment and improve the education. In this direction, there are two approaches. The first is the use of reconfigurable and programmable circuits, like FPGAs and microcontrollers, as described in [7]. This approach also covers the use of dedicated systems, like the controller hardware-in-the-loop laboratory proposed in [2]. Another approach is based on widely available and ubiquitous components—sensors. Examples of such references include [12], where technology-enhanced learning using sensors is developed; [13], which discusses methods to teach analog-to-digital sensors; and [14], which provides an example of using sensors in a remote laboratory with IoT architecture for teaching digital electronics.
During the last several years, development of novel concepts in organizing electronics laboratories intended for educational use has gained significance. Building upon simulations and emulations, virtual instruments and remote laboratory access proved to have substantial educational value. Among the latest developments are applications of augmented reality in the teaching of laboratory skills. Such modernized laboratories provide a novel approach to using instruments, providing easy access to systems and efficient processing of experimental data. This approach has been proven to attract students’ interest, resulting in improved educational outcomes. Examples of successful solutions include the following: virtualization and simulation [13]; remote web-based user-interactive e-learning platform for electronics [15,16]; remote laboratory with an option to use students’ smartphones and IoT devices and open-source software [14]; a VR-based educational strategy to enhance learning experience for electrical engineering education [3,17]; the use of augmented reality in teaching and learning [11,18]; virtual and augmented reality solutions for electronics lab [19].
Previous solutions often involve the use of open-source software, particularly Python 3 programming language and its modules, to enhance the concept of the electronics laboratory, automate measurements, and improve students’ learning experience during practical work. Our previous work also includes the development for electronics education in this sense, especially in terms of concepts, simulation and emulation [20], remote measurements, automation of laboratories and measurement documentation [5,21,22,23], web environments for access and measurements [24], and virtual laboratories [25]. Following positive experience in research and teaching applications, developed techniques were utilized in industrial applications [24,26,27,28]. Similar efforts and development of the measurement systems with open tools had been done in other laboratories [29,30,31,32,33,34,35], resulting in cost-effective and highly useful laboratory equipment.
The concept we propose in this paper is focused on improving education in the area of electronics and related disciplines by using programmable instruments and ICT technologies, particularly computer networks and programming. This approach addresses the gap between previous examples from the literature and our earlier work, especially those concerning the organization of laboratories with remote, virtual, or augmented reality access and traditional, completely direct approach of teaching electronics. Previous solutions improve teaching and education but do not allow students to look behind the curtain and involve them as users of innovation. Our system is not only completely open to students, meaning all additions to the traditional laboratory are visible in every aspect, but it is also an integral part of the curriculum for electronics courses in the computer networks and programming areas. The openness of the system and direct work in the laboratory across different areas of electrical and computer engineering, from a pedagogical perspective, enable a higher level of active learning and opportunities for problem-solving and critical thinking, as well as transparency and progressive skill development, while simultaneously strengthening ICT competencies.

3. Measurement Instruments, Their SCPI Commands, and Networking

This section provides an overview of the measurement instruments used in the development of a programmable networked laboratory for electronics education. The section begins with a description of the setup and instruments used in our laboratories, followed by a presentation of the oscilloscope, signal generator, and power supply with representative Standard Commands for Programmable Instruments (SCPI) relevant to their configuration and measurement functions. The final part of the section describes the networking of measurement instruments within a local area network (LAN).

3.1. Our Laboratory Setup for Electronics Education

Laboratory and measurement instruments are essential tools for teaching electronics courses such as Fundamentals of Electronics, Analog Electronics, Embedded Hardware, Digital Electronics, Electrical Measurements, RF Electronics, Special Electronic Circuits, and Smart Devices and Communications, providing students with the ability to visualize processes in electric circuits. Key devices such as oscilloscopes, signal generators, and power supplies are necessary to conduct experiments in order to provide circuit testing and validation. This is applicable not only in education but also in research, development, maintenance, and other activities in the industry sector.
To enhance and expand the traditional laboratory setup for electronics education, a system of networked measurement instruments has been developed at our two institutions. This system integrates oscilloscopes, signal generators, and power supplies into a local area network (LAN), enabling remote access, automated measurement sequences, centralized data acquisition, and data storage. The developed system is set up in the Electronics and Measurements laboratories as well as at dedicated workstations for students’ theses and faculty research activities. The goal is not to replace the conventional use of measurement instruments but to augment it by incorporating principles of computer networking and programming. It is important to emphasize that this integration of computer networking and programming into electronics education has been implemented in such a way that all the details are transparent to students, rather than appearing as a “black box.” The computer networks and programming used are directly included as a component of the courses that is taught and studied, thereby enhancing the ICT competencies of both students and all involved teachers.
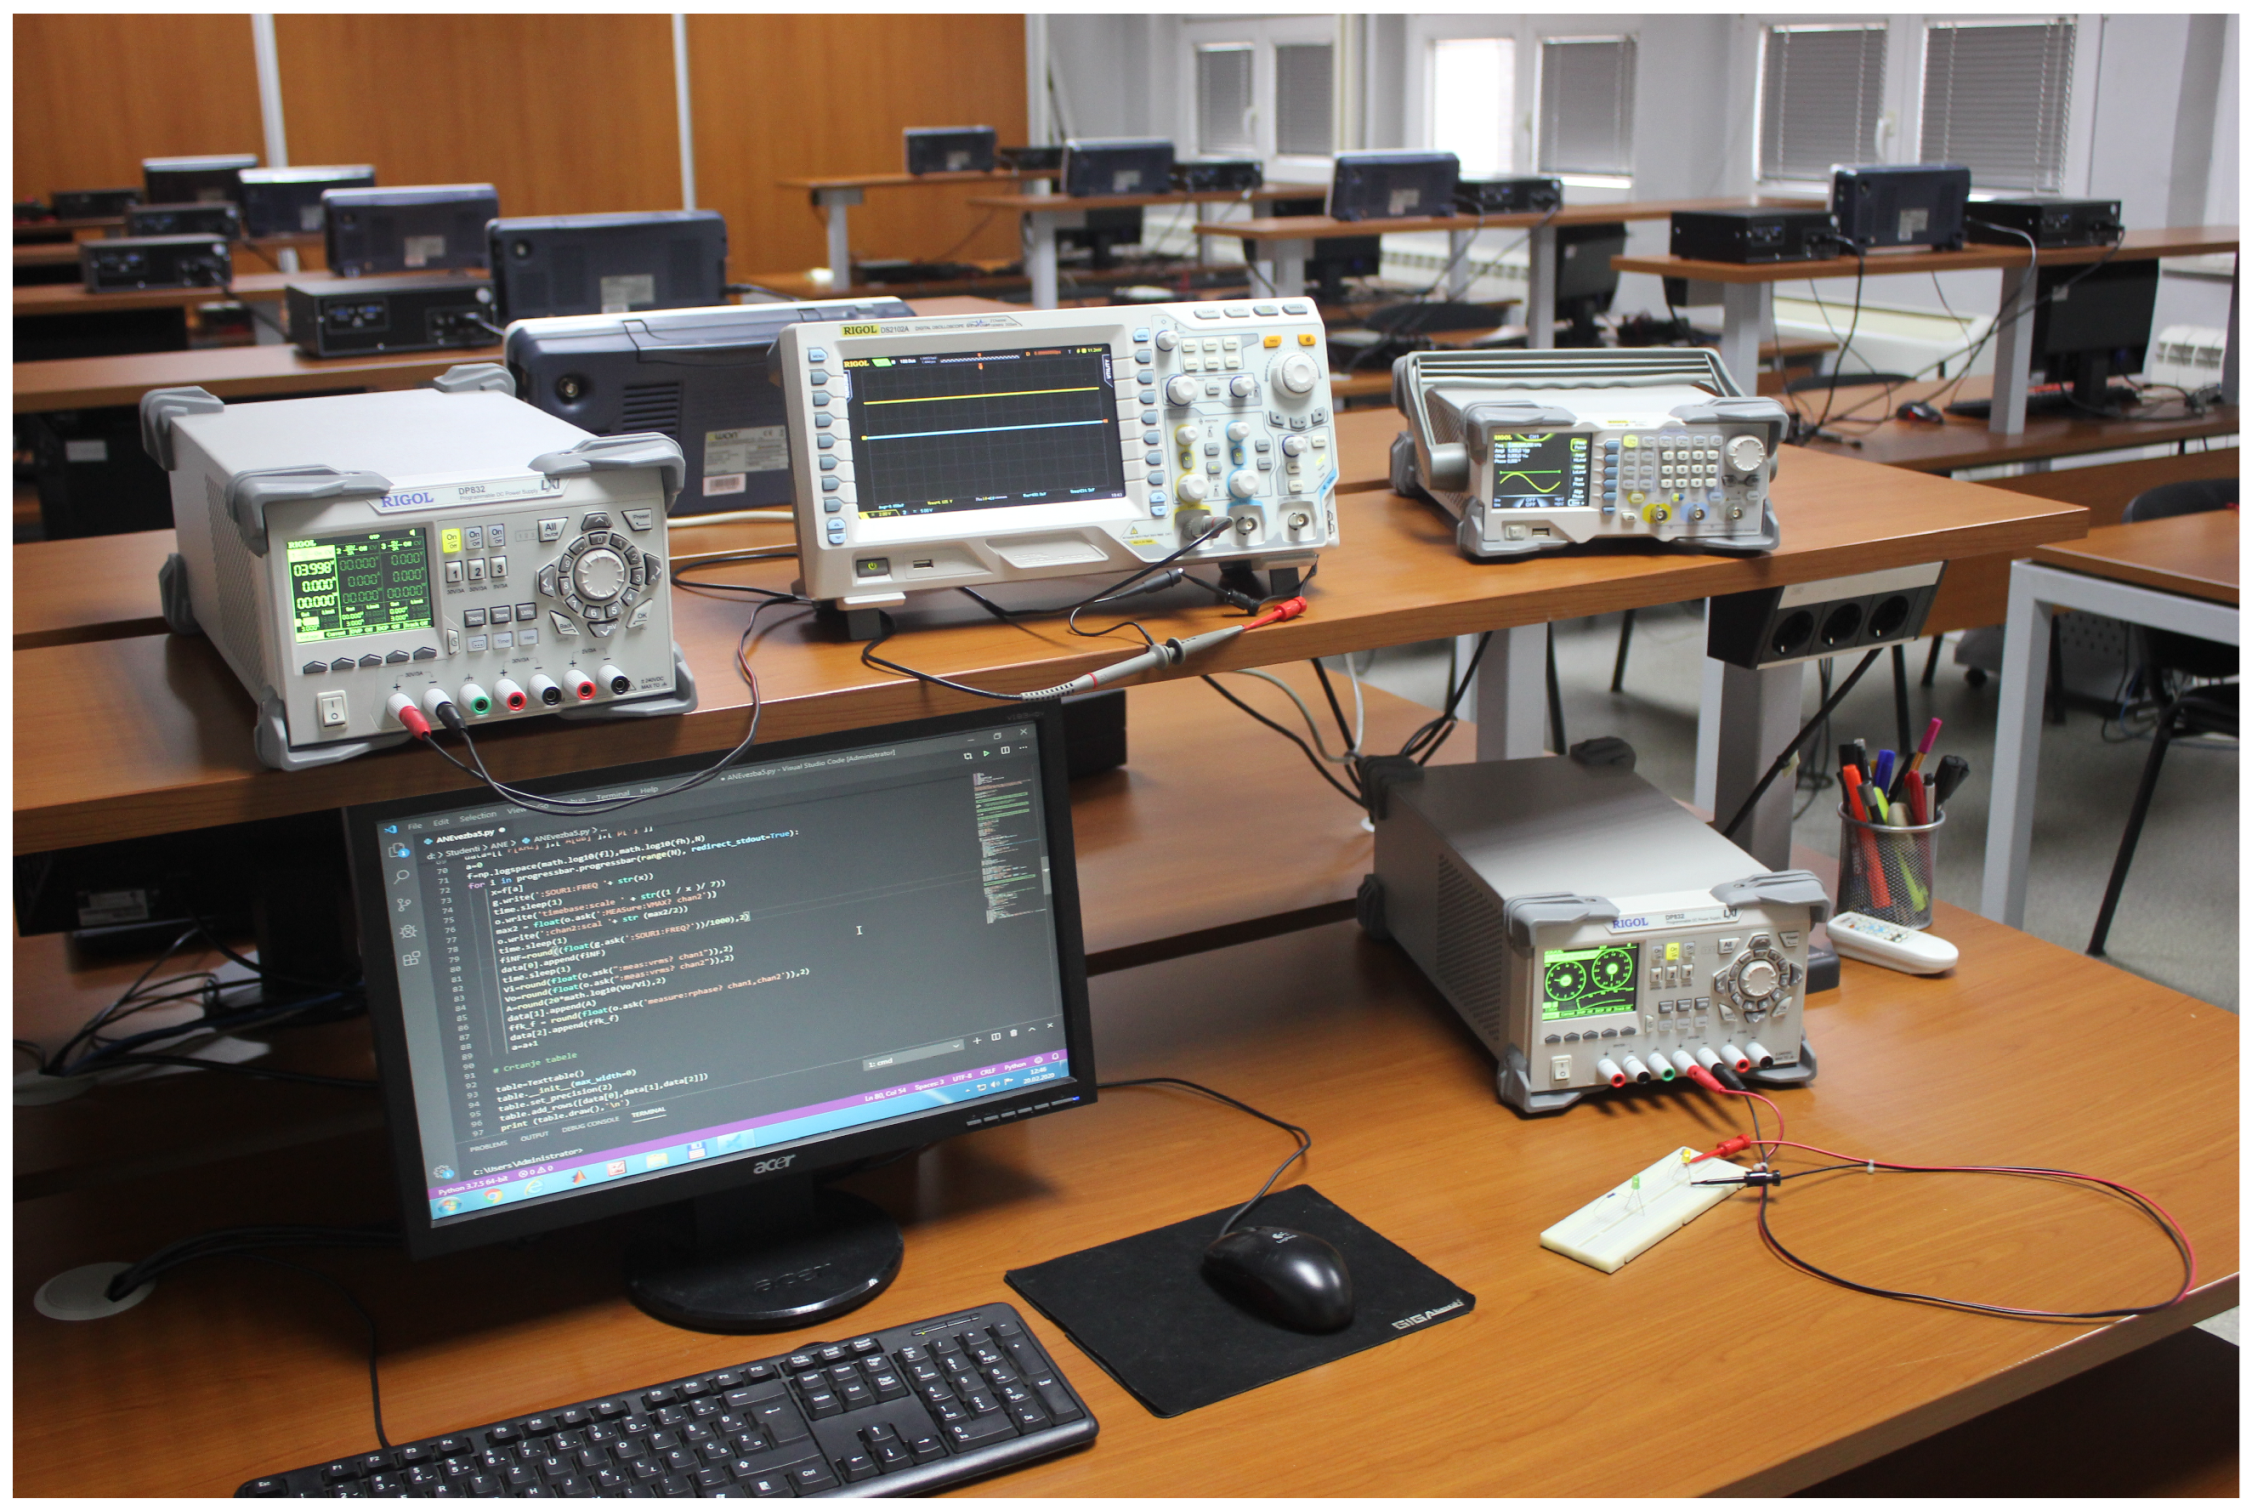
A networked workstation presented here includes a computer, a Rigol DS2102A oscilloscope, a Rigol DG1022Z signal generator, and a Rigol DP832 power supply (Rigol, Beijing, China). A photograph of the laboratory setup at one workstation in our laboratory is shown in Figure 2.
For remote access and automation of measurement devices, SCPI commands [36] were utilized. These commands were further integrated into Python code to provide an additional level of automation and data processing. The list of available SCPI commands depends on the specific measurement instrument and its capabilities, which share a common structure and logic, and experience is easily transferable from one device to another. The programming guides containing complete lists of SCPI commands for our instruments are provided in the Rigol DS2102A Oscilloscope Programming Guide [37], the Rigol DG1000Z Series Function/Arbitrary Waveform Generator Programming Guide [38], and the Rigol DP800 Series Programmable Linear DC Power Supplies Programming Guide [39].

3.2. Oscilloscope and Its SCPI Commands

An oscilloscope is used to visualize and quantify electrical signals, usually displaying voltage on the vertical axis versus time on the horizontal axis. Also, it could serve as a digital measurement and acquisition system, providing data to be numerically post-processed. In our networked laboratory setup, we used a Rigol DS2102A, a dual-channel digital storage oscilloscope with an analog bandwidth of 100 MHz , where each channel samples at a rate of 1 GSa / s , with a waveform capture rate of up to 52 , 000 wfms / s . The Rigol DS2102A oscilloscope supports communication via USB, Ethernet (LXI-compatible), and optional USB–GPIB.
Fundamental oscilloscope settings can be configured with SCPI commands, according to [37], such a :CHANnel1: SCALE, :TIMebase:SCALe, :CHANnel1:OFFSet, and :CHANnel1: COUPling. Measurements are equally straightforward, ranging from simple queries such as voltage or frequency (e.g., :MEASure:VPP?, :MEASure:FREQuency?) to more advanced ones like delay, phase, or statistical analysis (e.g., :MEASure:RDELay?, :MEASure:FPHase?, :MEASure:VAMP:SMAXimum?). In this manner, performing measurements and obtaining the measurement results are reduced to the exchange of alphanumerical strings between the computer and the oscilloscope.

3.3. Signal Generator and Its SCPI Commands

A signal generator provides controlled electrical waveforms that are used to provide appropriate inputs for the circuits under test. This allows the properties of the circuit under test to be measured, such as frequency response, timing accuracy, and linearity. When developing a networked laboratory setup we used a dual-channel 25 MHz function/arbitrary waveform generator, the Rigol DG1022Z [38] that supports a sampling rate of 200 MSa / s and Ethernet communication via its LAN LXI-compatible interface.
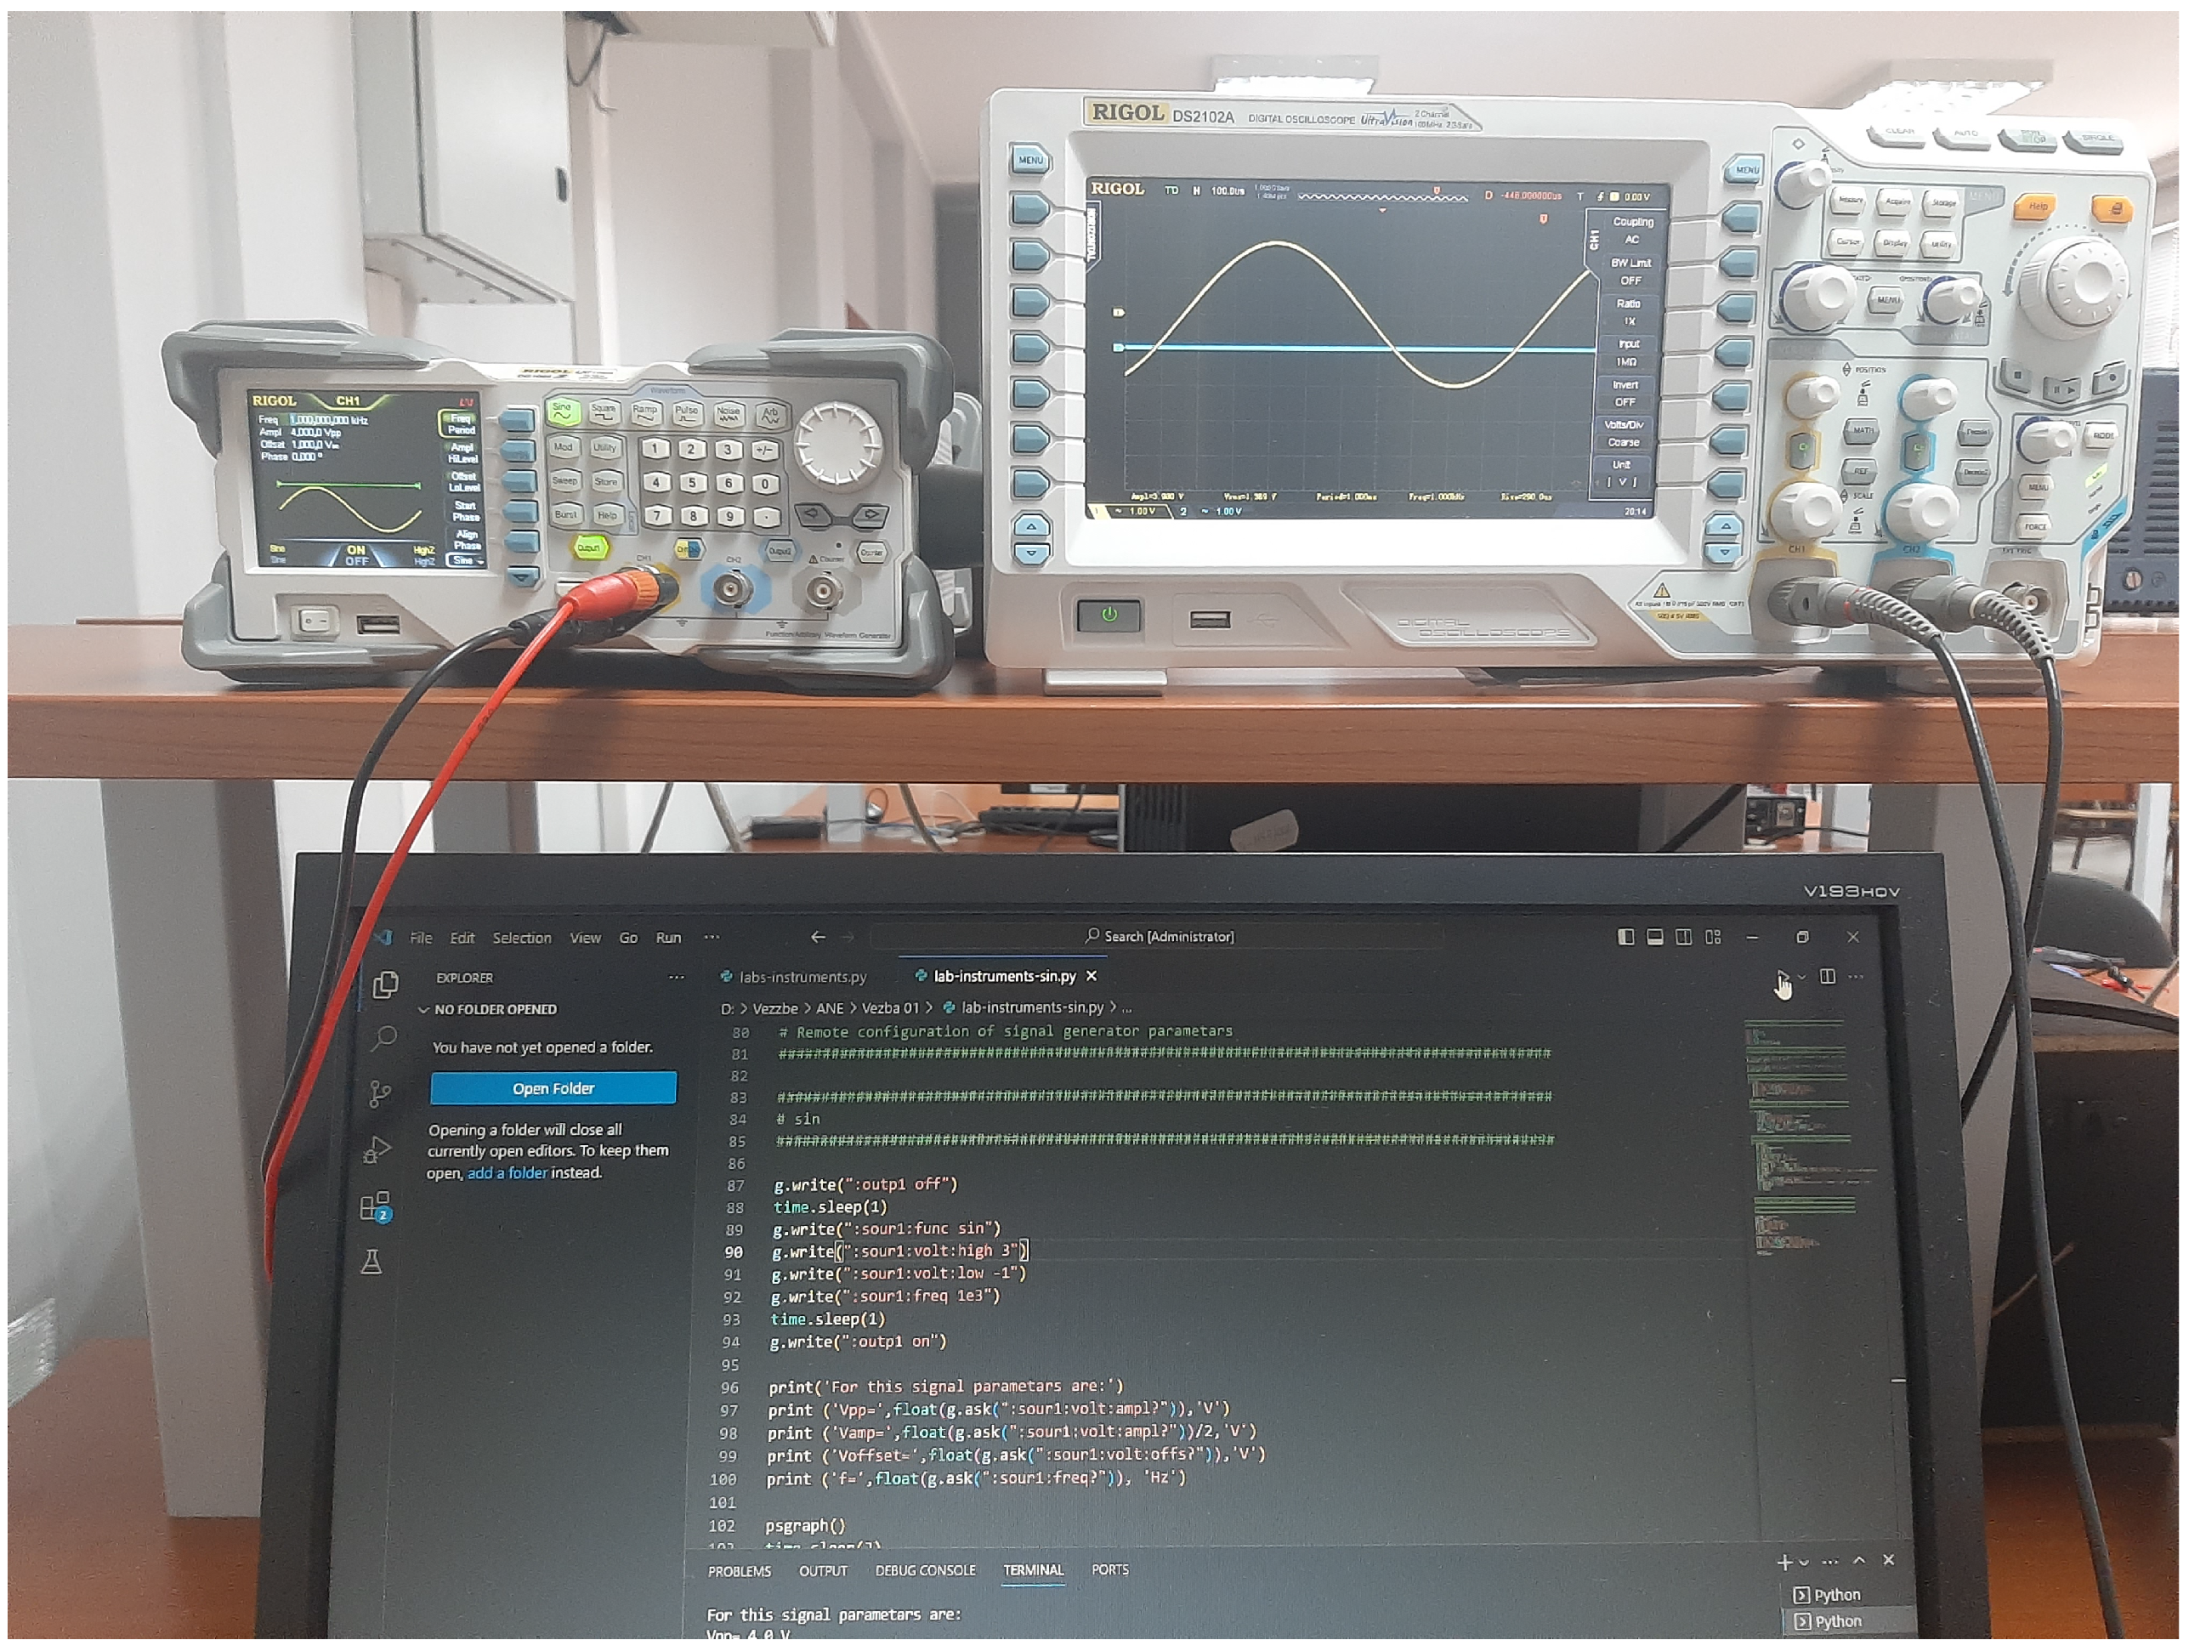
The selected generator can be configured using SCPI commands for waveform type (:FUNCtion SINusoid, SQUare, RAMP, etc.), amplitude (:VOLTage:HIGH, :VOLTage:LOW), offset (:OFFSet), and frequency (:FREQuency). Advanced configuration options include waveform-specific parameters such as duty cycle (:FUNCtion:SQUare:DCYCle) and symmetry (:FUNCtion:RAMP:SYMMetry). Additional settings related to polarity, impedance, and synchronization are also supported. Output channels can be enabled or disabled using the :OUTPut[n]:STATe command. Figure 3 illustrates the configuration of signal generator parameters using SCPI commands on a computer screen, their corresponding display on the oscilloscope, and the SCPI commands used to read their values.

3.4. Power Supply and Its SCPI Commands

A programmable DC power supply is a laboratory instrument that provides stable and adjustable voltage and current to electronic circuits under test. For our laboratory setup, the Rigol DP832 [39] was selected. This programmable linear DC power supply has three independent output channels, allowing students to power and test multiple sub-circuits simultaneously. It supports fine-grained control of voltage (up to 30 V on CH1/CH2 and 5.5 V on CH3) and current (up to 3.3 A ), as well as built-in overvoltage (OVP) and overcurrent (OCP) protection.
Some of the main SCPI commands for power supply include channel selection (:INSTrument:SELEct), assignment of voltage and current values (:SOURce[n]:VOLTage <value> and :SOURce[n]:CURRent <value>), and measurement of output parameters (:MEASure [:VOLTage]? and :MEASure:CURRent?). Built-in protections can be queried and configured using :OUTPut:OVP[:VALue] and :OUTPut:OCP[:STATe], with specified limits defined per channel.

3.5. Local Network of Measurement Instruments

One workstation in our laboratory setup contains three core measurement instruments: an oscilloscope (Rigol DS2102A), a signal generator (Rigol DG1022Z), and a power supply (Rigol DP832). Each of these devices is programmable and supports LXI Core for Ethernet connectivity [40]. This method of communication was chosen instead of GPIB [41], RS-232 [42], or USB [43], because it enables high scalability of the solution and direct use of remote access to the system. Regarding the communication protocol for the devices at a high level, Standard Commands for Programmable Instruments (SCPI) [36] was used.
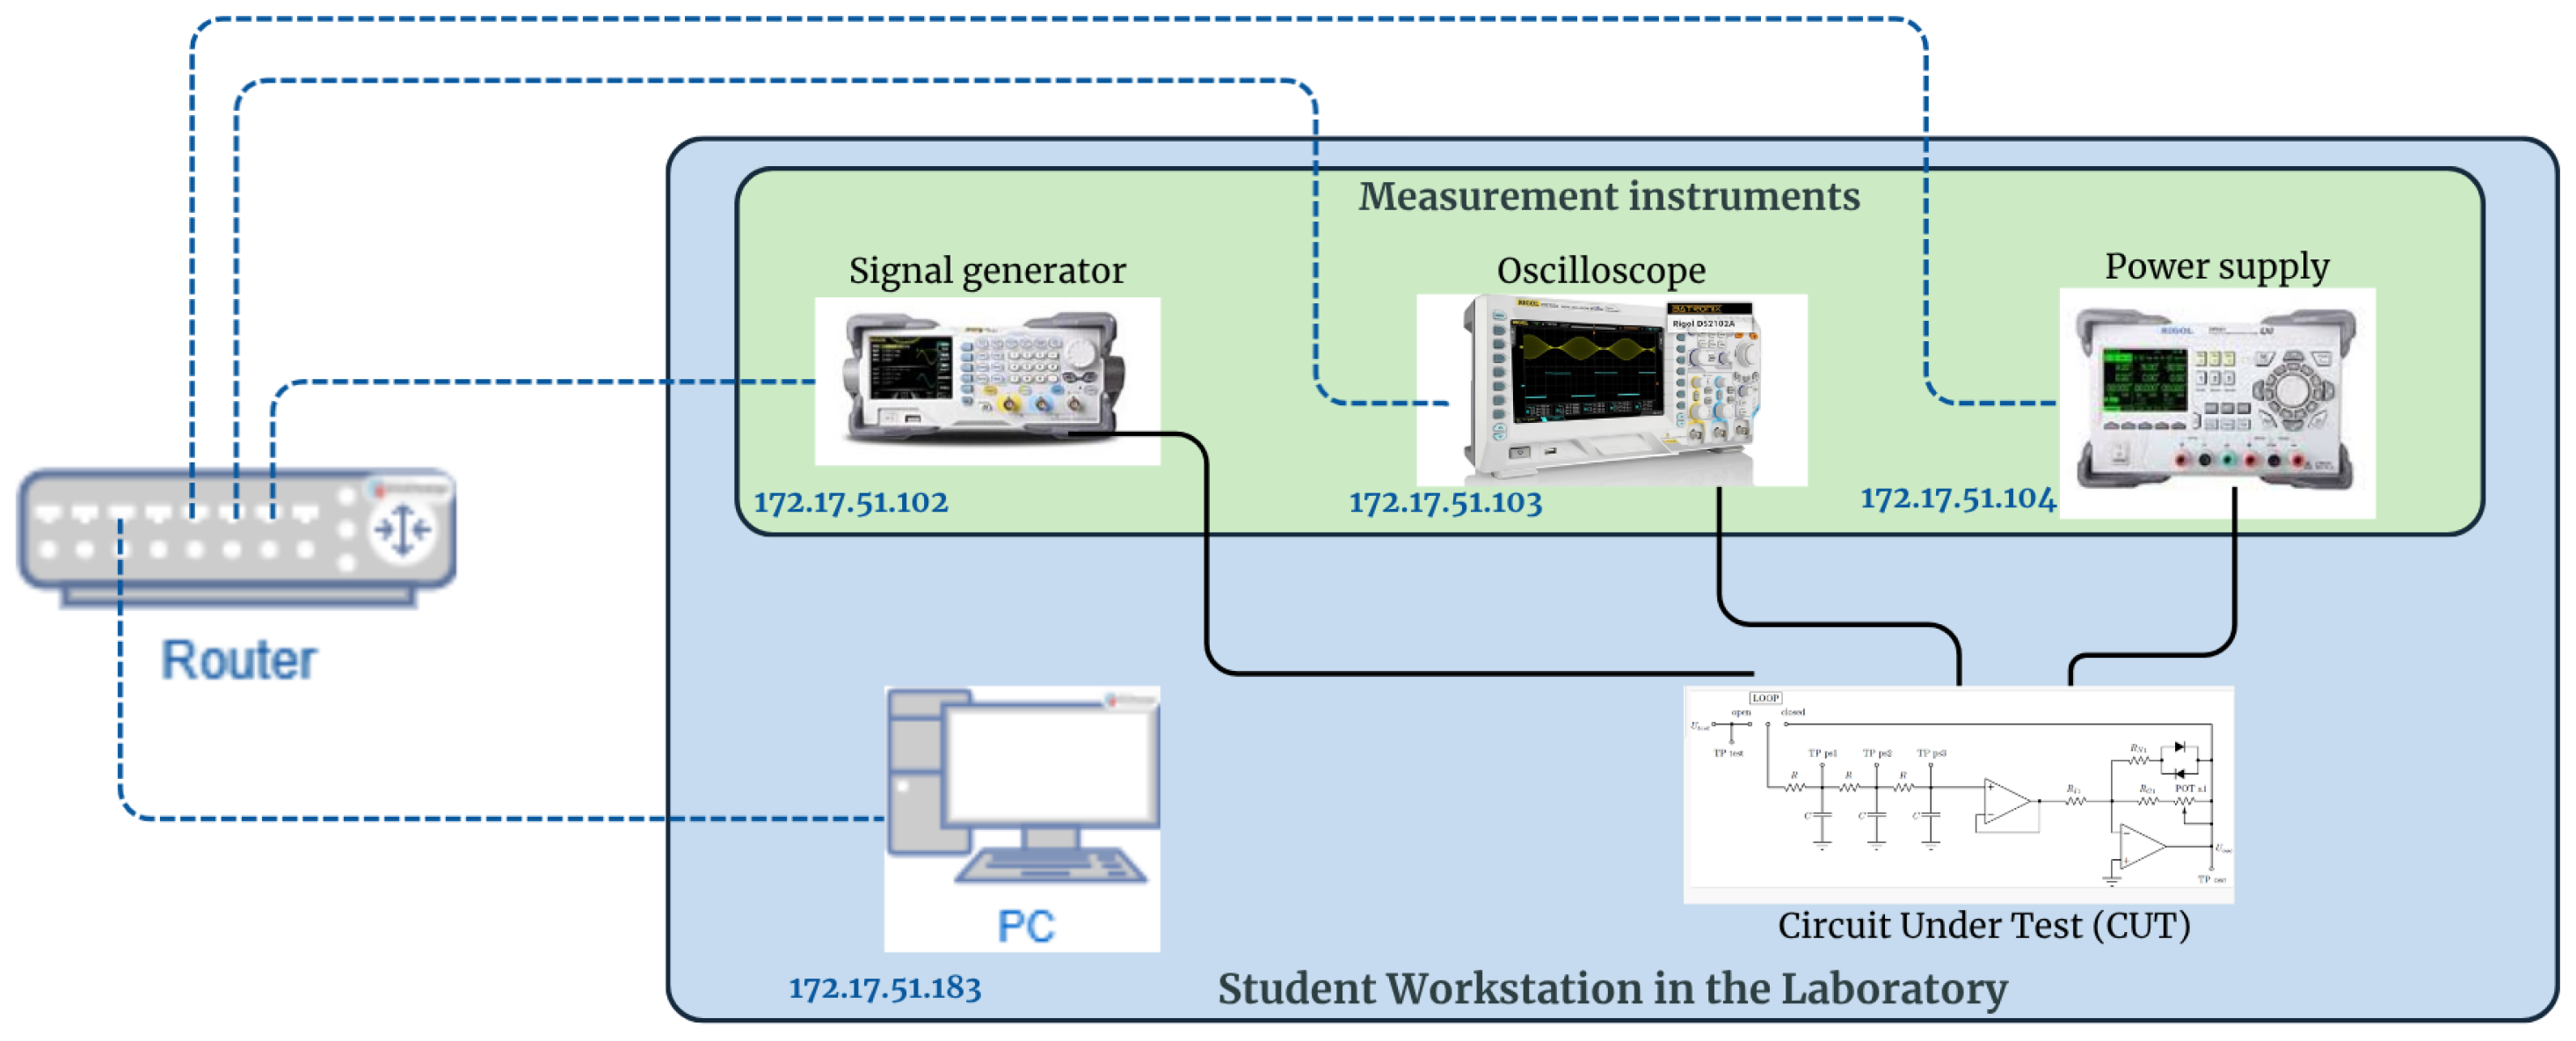
The instruments were connected to a LAN either directly with a computer or via a configured router. A single computer can control all the instruments in the laboratory, or, for teaching purposes, each station in the laboratory can have one complete setup. Integrating laboratory instruments into a LAN network transforms traditional setup into a unified, flexible, and scalable environment. Figure 4 presents a schematic diagram of the laboratory LAN.
The instruments we used have a network configuration option in the front-panel Utility → I/O Setting → Network Configuration. Here, it is possible to choose a dynamic configuration using DHCP (Dynamic Host Configuration Protocol) or by manually setting the values for IP address, subnet mask of the local network, first exit-gateway, and DNS (Domain Name System) server, ensuring that instruments and workstation computers reside on the same local subnet. The network configuration of the measurement instruments is shown in Figure 5, with additional verification using SCPI commands.

4. Automation of Networked Instruments Measurements Using Python

After creating the laboratory setup with networked instruments that support SCPI programmability, we added the next system layer, namely, programming in the Python language [44,45,46]. This section first provides an overall overview of the workflow for introducing Python into the measurement procedures, followed by subsections presenting the details of each individual step, from environment preparation and instrument communication to automated measurement execution and data handling.

4.1. The Workflow

A graphical representation of the workflow for automating measurements using Python is presented in Figure 6. The application of Python scripts for automating measurements in electronics included the following components:
1.
Importing relevant libraries;
2.
Establishing and testing communication with networked instruments;
3.
Remote configuration of laboratory instruments parameters;
4.
Reading measured values and/or waveforms from networked instruments;
5.
Automated circuit characterization (such as input–output relations and frequency responses);
6.
Saving measurement parameters, results, and plots;
7.
Conducting additional analyses either on the local network or in the Cloud.
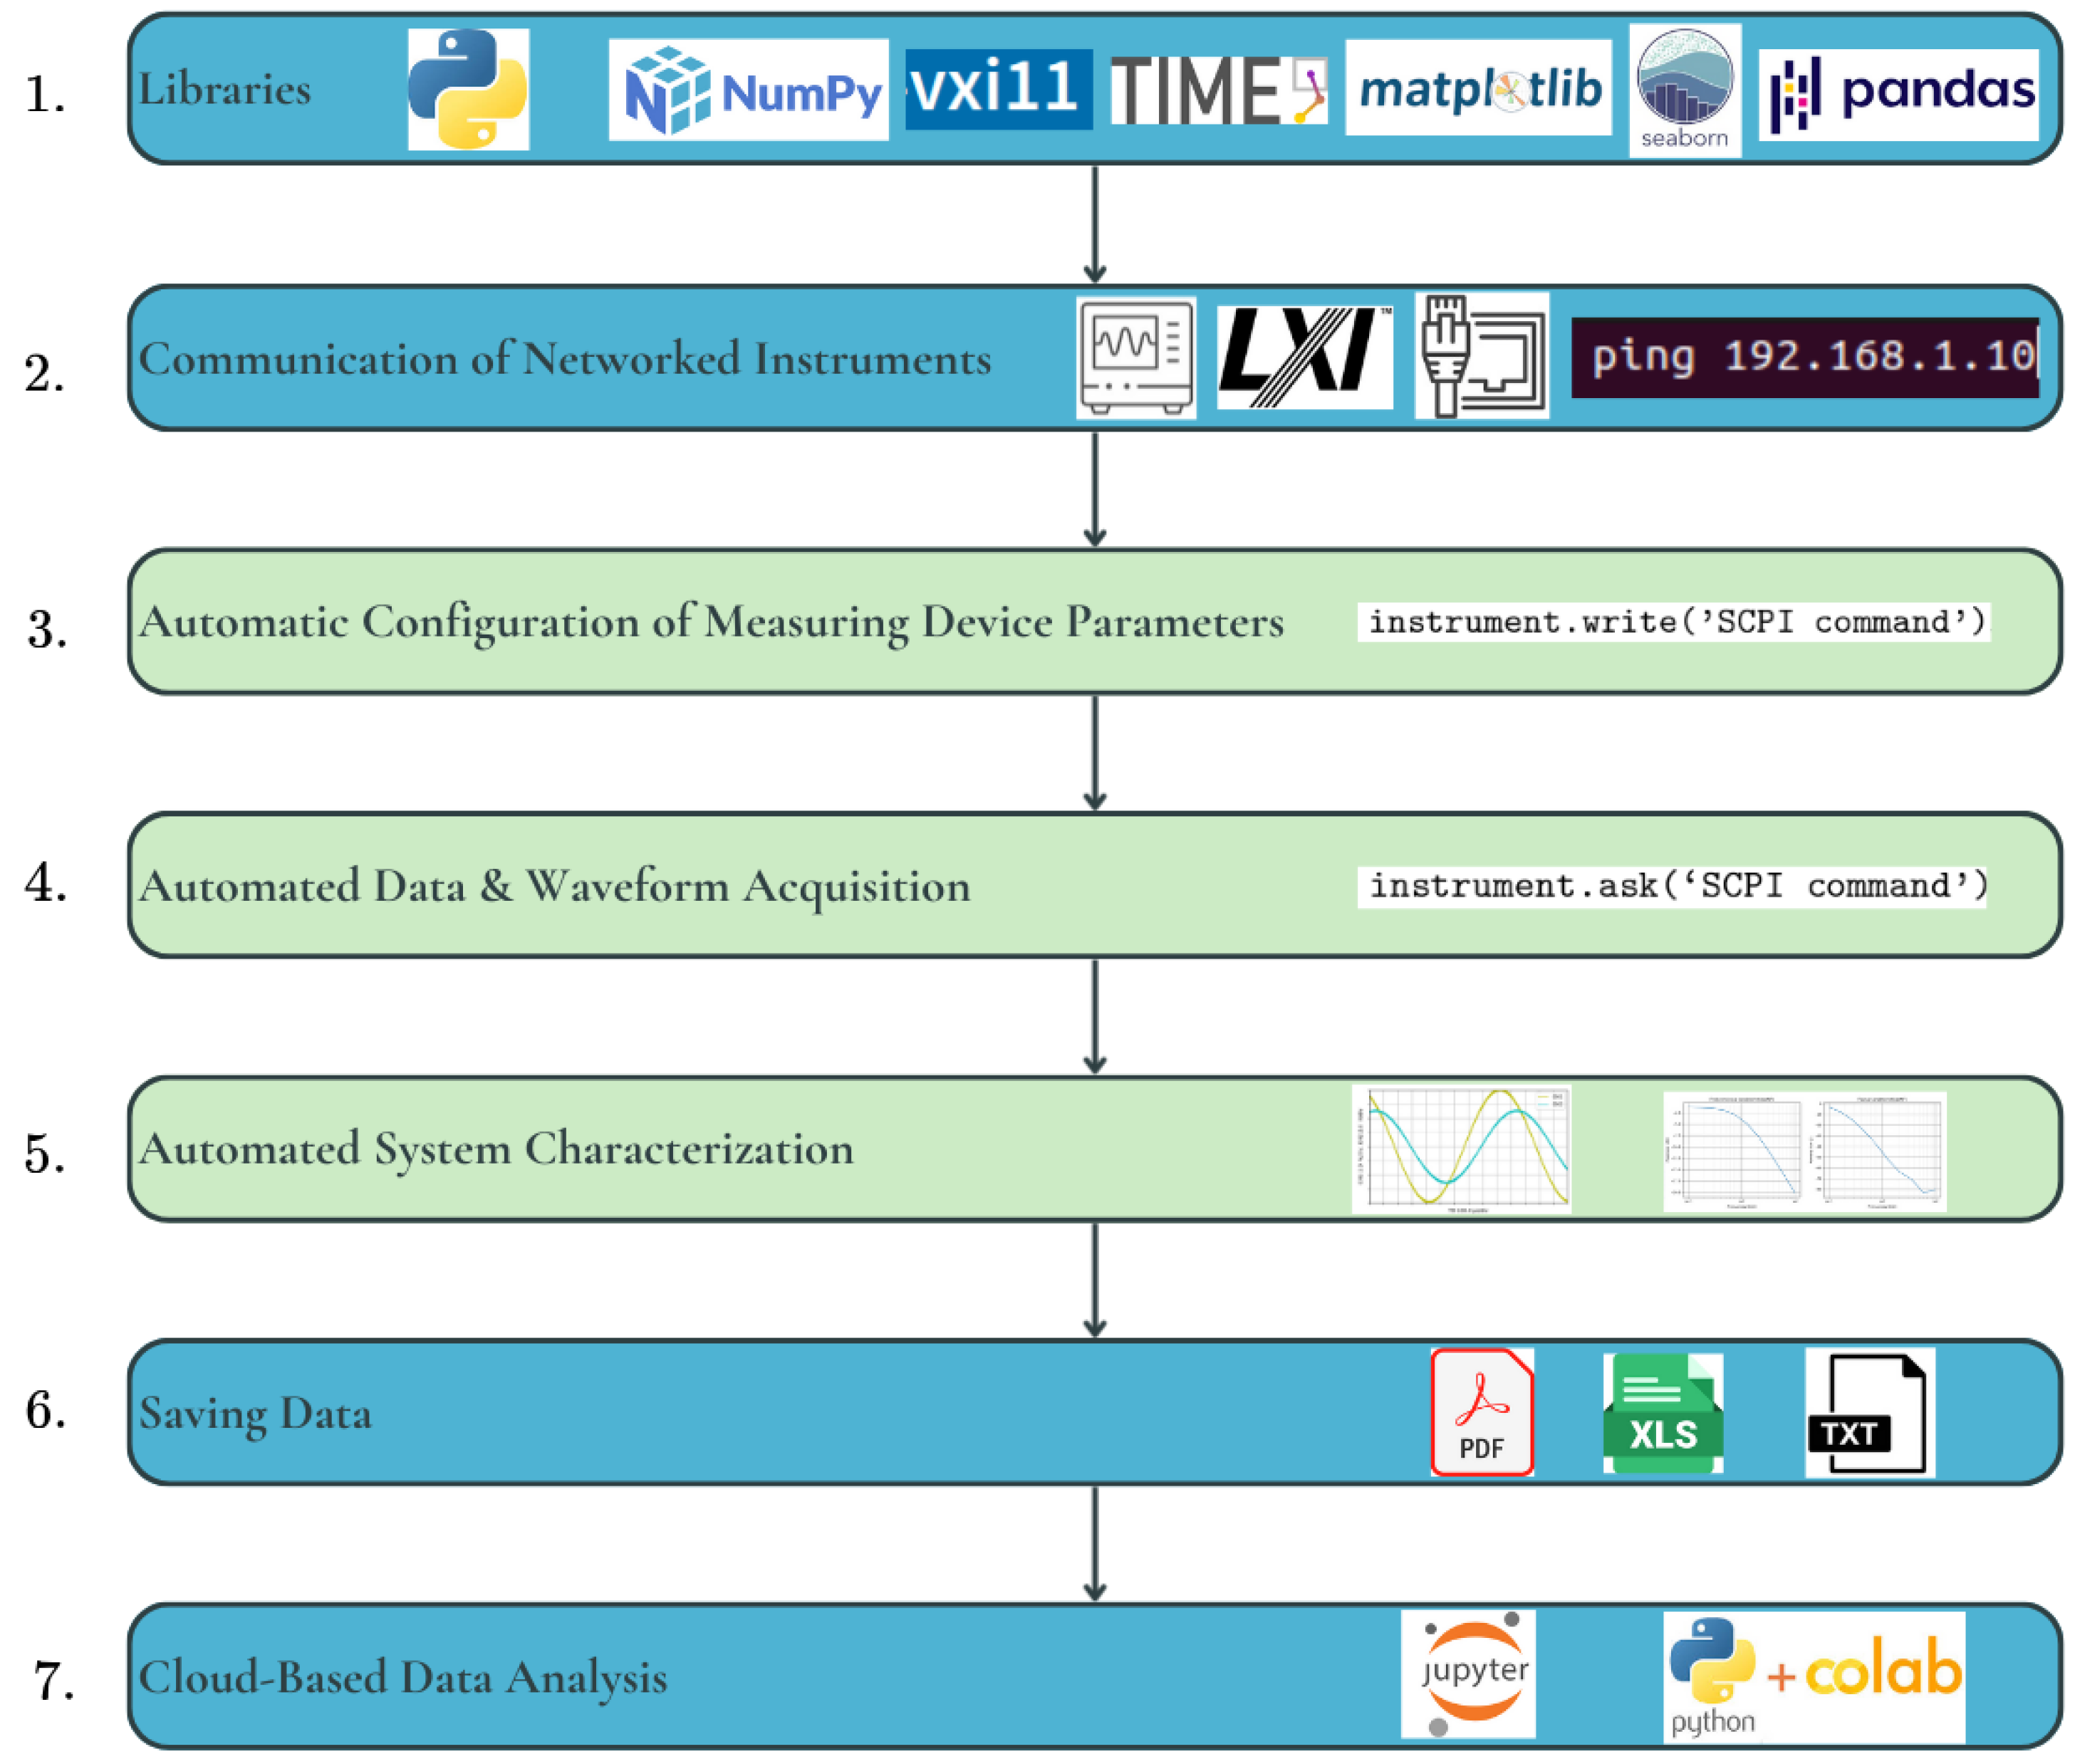
Figure 6. Workflow of automated measurements using Python and networked laboratory instruments.
Information 16 01024 g006

4.2. Environment Preparation in Python

To prepare a software environment for controlling and automating instruments, several specialized Python libraries were imported, including NumPy for numerical data processing, VXI-11 for communication with instruments, time for access to the system time, si_prefix to cover proper formatting of units of measure, and matplotlib and seaborn for graphical data presentation.
NumPy represents one of the general fundamental Python libraries whose main purpose is to perform fast vectorized computing with an object type array, [47]. The VXI-11 module enables communication with SCPI programmable instruments via the Ethernet-based protocol, [48]. In the case of another type of instrument interface, such as USB or GPIB, a change to an appropriate library is required [49,50], but the communication process as observed in the program would essentially remain the same. To control the time of operation execution, to introduce time stamp, or to add a delay to allow the transients to settle, and to provide additional time for the devices to complete measurements safely, the Python module time is imported. To provide readable and pleasing numerical and visual presentation of obtained results, the si_prefix library for standardized numerical formatting using SI units as well as matplotlib and seaborn for graphic display were used [51].

4.3. Testing Communication of Networked Instruments Using Python

In addition to the traditional device connectivity check at the corresponding IP address using the ping command from the computer command line, the instrument availability check and printing of device feedback can also be performed in Python code. The following example demonstrates an implementation using SCPI command ∗IDN? on a created instrument object named instrument,
instrument = vxi11.Instrument(instrument-address)
print (instrument.ask(’∗IDN?’))
and the returned string should be the instrument identification parameters.

4.4. Remote Configuration of Instruments Using Python and SCPI

Once the communication with the instruments is established, remote setting of their parameters is possible by sending appropriate SCPI commands from Python using the following method:
\texttt{instrument.write(’SCPI command’)}.
As an example, the following line of code configures the signal generator to produce a ramp waveform with 50% symmetry:
signal_generator.write(’:FUNCtion:RAMP:SYMMetry 50’)

4.5. Remote Acquisition of Measured Values and Waveforms Using Python and SCPI

Similar to the configuration of instrument parameters, measured values and waveforms can be acquired from the instruments using the following method:
instrument.ask(’SCPI command’)
As an example, the following line of code queries the oscilloscope to return a value of the maximum voltage measured on channel 1:
oscilloscope.ask(’:MEASure:VMAX? CHANnel1’)

4.6. Automated Generation and Acquisition of a Large Number of Measurement Results Using Python and SCPI

The advantage of remote access to instruments accompanied with Python programs that apply SCPI commands and the above-mentioned modules for data post-processing is that it enables us to automate measurements at a high level and to perform a large number of measurements in a very short time. For example, automation of signal generator parameter settings allows us to generate a sequence of signals whose amplitude varies over a selected range with a defined step size and to perform measurements for each of the assigned frequency values, as well as to collect the measured data. The program loop in each pass assigns parameters to the signal generator, initiates measurement, and collects the measurement data. In this manner, complex measurements could be performed in a time efficient manner.

4.7. Saving Measurement Results

Measurement results can be saved as both visualizations and as numerical data for further post-processing and analysis. Generated plots, such as waveforms or frequency response plots [27], can be exported as PDF documents using
plt.savefig (’waveform.pdf’, bbox_inches =’tight’).
Numerical data from the oscilloscope, being either waveform samples or the measurement data, the same calculated arrays obtained as a result of post-processing, for example frequencies and corresponding gain values, can be saved in .txt or .csv formats, for example:
np.savetxt (’afk.txt’, data , delimiter =’\t’, \
header =’Frequency_Hz \t Gain_dB’)

4.8. Processing of Measurement Results Using Python and Cloud-Based Tools

In addition to working directly in the Python environment on a local computer, additional data storage and processing can be done in the Cloud. For our electronics courses, the cloud environment for Jupyter Notebook, Google Colaboratory was chosen. In this way, students can perform additional data analysis online in a web environment, with the possibility of writing text notes and direct visual display in the environment.
For working with a large amount of data, the pandas library and its tabular structured data (DataFrame), which are often used in the field of Data Science, were used to load measurement settings and results and perform various types of analyses [52]. If measurement results are saved in a .csv file, with each column representing a measurement result, loading the file (df = pandas.read_csv(’measurement-results’)), accessing individual columns (df[’V1pp_m’] and df[’V2pp_m’]), and performing further analysis with (df[’V1pp_m’].mean(), df[’V1pp_m’].std()) and visualization (plt.plot (df[’V1pp_m’], df[’V2pp_m’]), seaborn.kdeplot(data=df[’V1pp_m’])) are straightforward.

5. Automated Signal Analyses for System Characterization

Once the measurement data are collected, various types of automated analyses can be performed to extract information about the circuit behavior. Examples of general and domain-specific analyses are provided in the next subsection. Selected examples of key analyses implemented using Python functions, which we prepared and included in our teaching as part of the theory in the courses, are presented in the following subsections. These include determination of input–output relations through waveforms and transfer curves, characterization of the circuit frequency response in terms of amplitude and phase, and evaluation of power-related quantities such as RMS values, power, total harmonic distortion, and the displacement power factor. When completing the independent tasks within the laboratory exercises, students can use, modify, and combine the provided functions for system characterization.

5.1. Introduction to System Characterization Based on Measured Data

General plots, such as time-domain waveforms, transfer curve, Bode plots [53], and step and impulse responses, help us to find key attributes such as bandwidth, stability, linearity, and dynamic response. Domain-specific analyses of circuits include impedance and Smith chart representations for RF systems, voltage–current relations for semiconductor devices, noise spectral density for precision circuits, and THD analysis for nonlinear systems.

5.2. Automated Measurement of Input and Output Characteristics

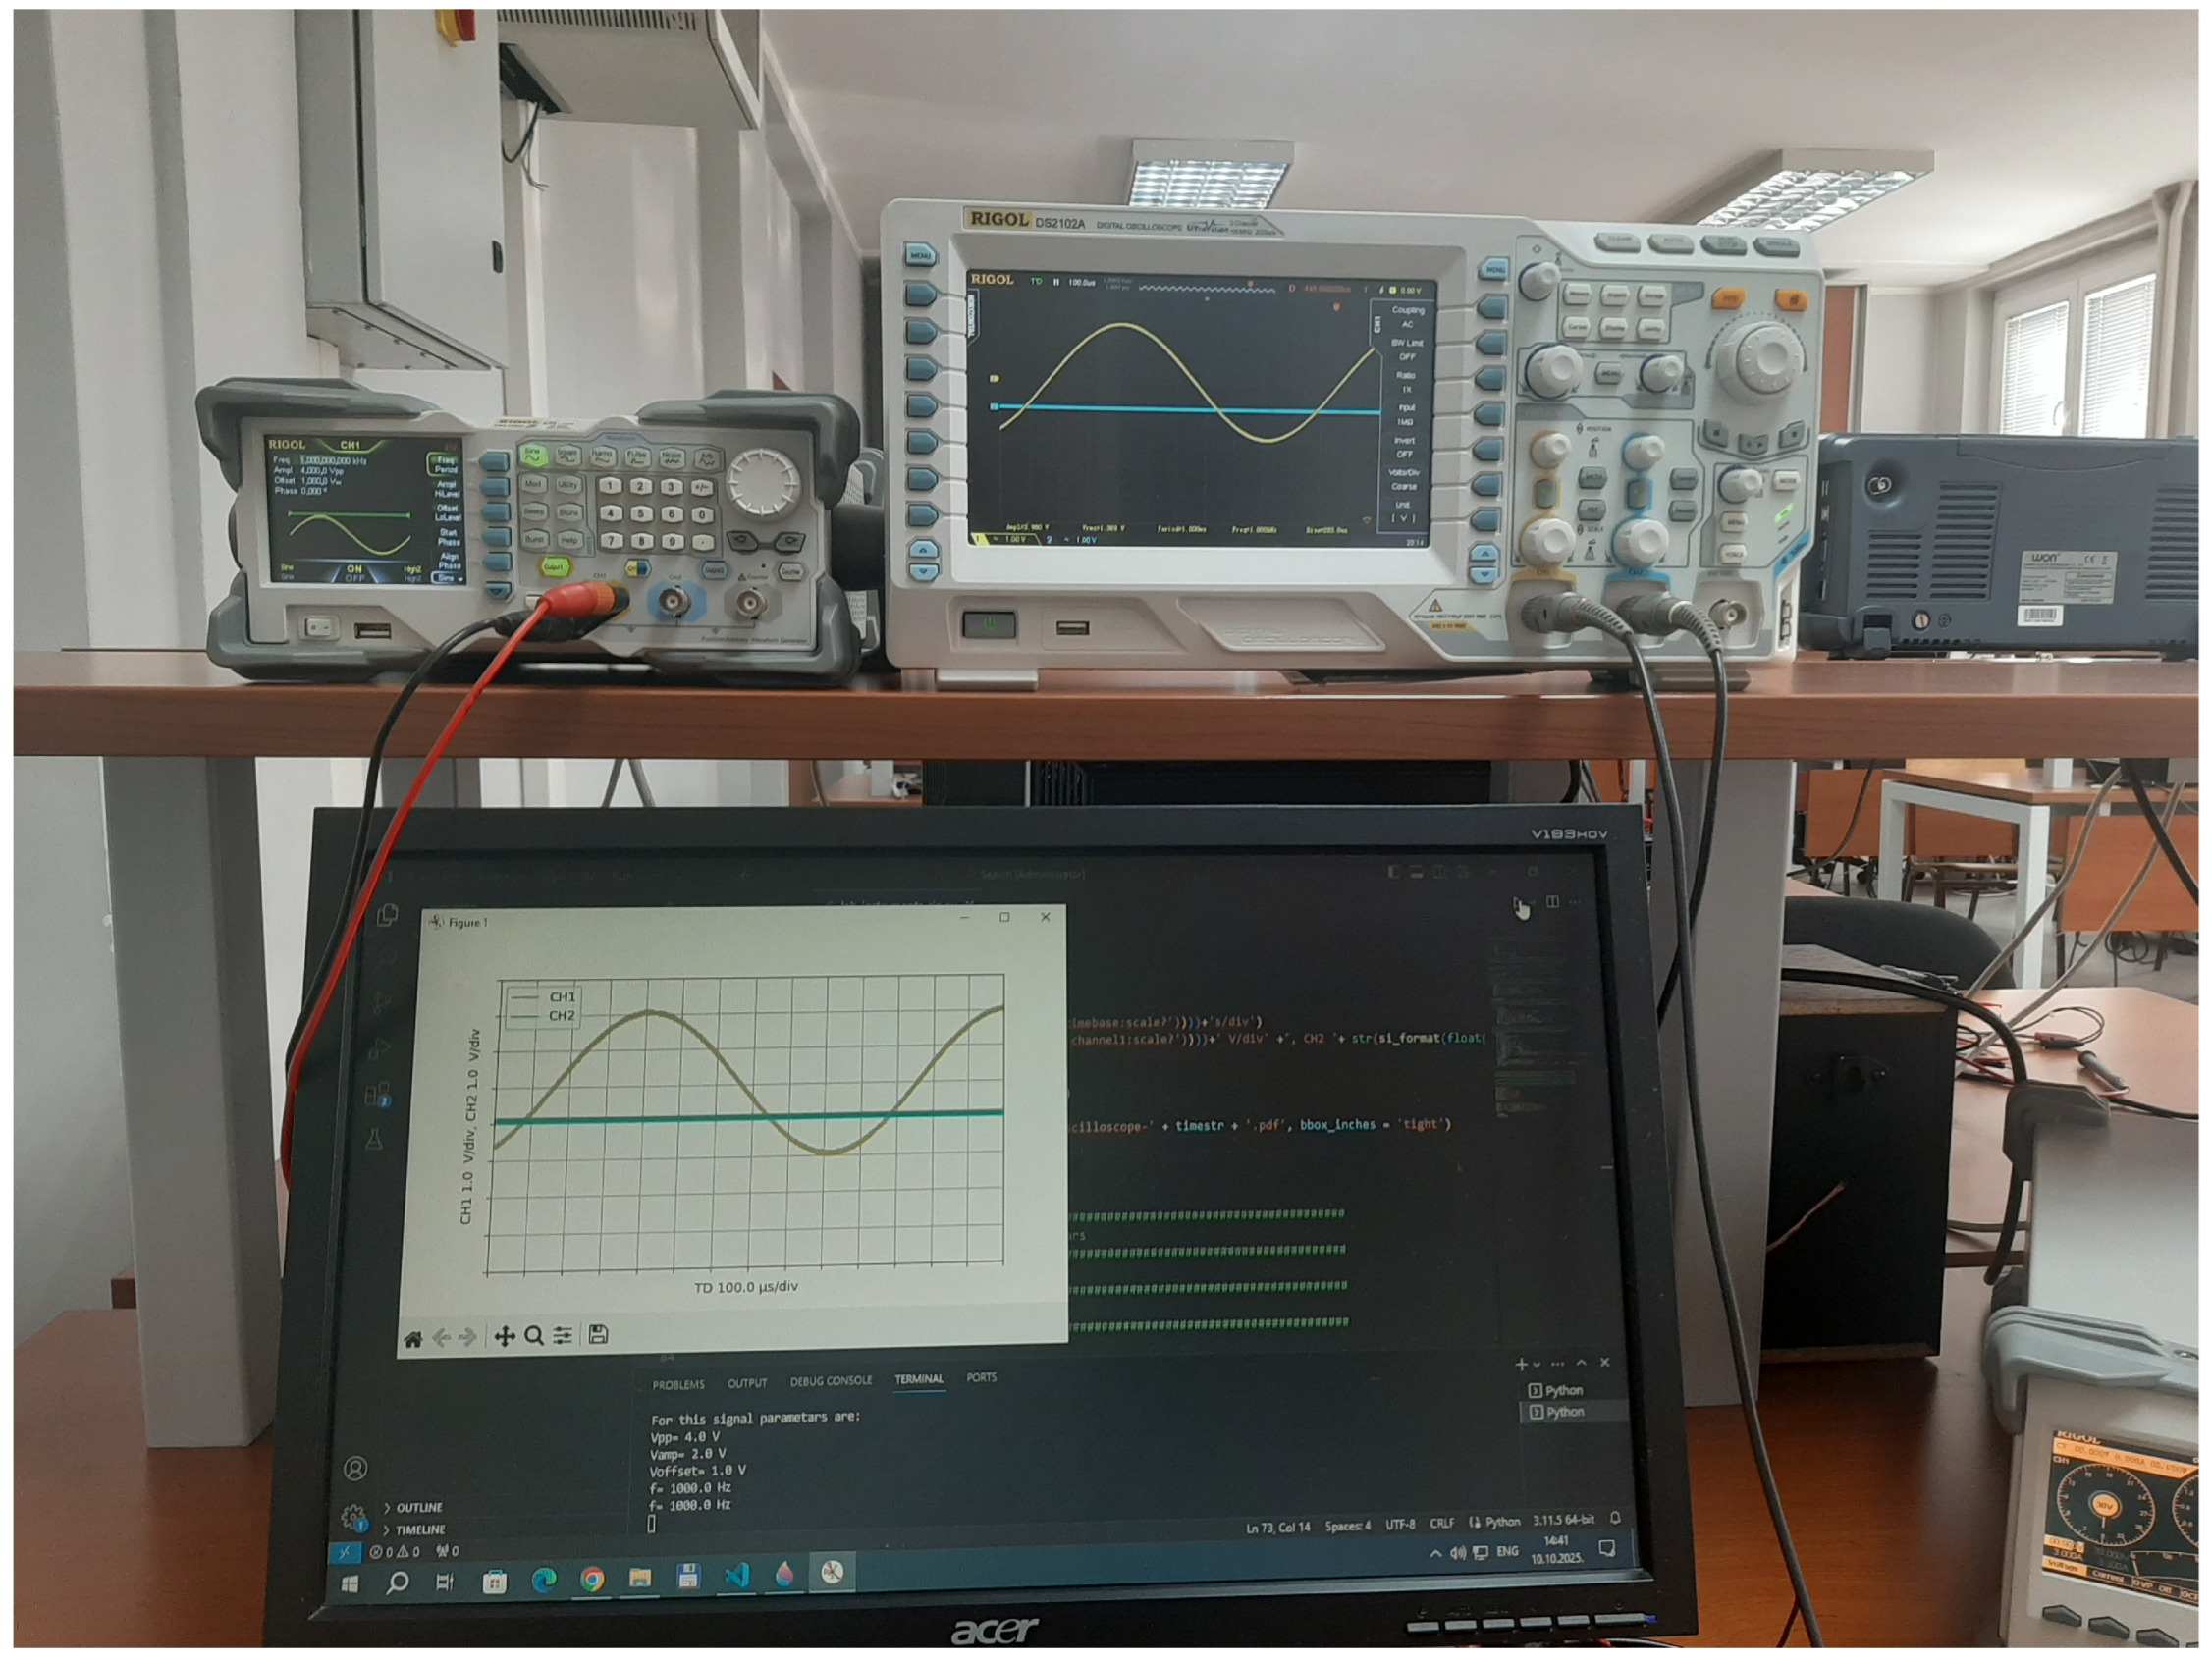
First, the circuit under test is supplied by appropriate voltage, if required, and stimulated by adequate signal from the signal generator. Next, the values of voltage samples recorded by the oscilloscope are transferred to the computer via LAN in order to visualize, store, and process further. Our Python function mo(channel, oscilloscope) downloads voltage samples from the oscilloscope in ASCII format (limited to the number of sample points supported by the oscilloscope model used) and converts them into numerical arrays (V and Vdisplay) that account for oscilloscope scaling and offsets. These arrays were then used to plot time-domain input and output waveforms using plt.plot(t, mo(1)[1], mo(2)[1]). An example of the parallel display of the input and output signals obtained in Python using the function mo(channel, oscilloscope) and on the oscilloscope is shown in Figure 7.
def 
mo(channel, oscilloscope):
oscilloscope.write (f’waveform:source channel {channel}’)
oscilloscope.write (’waveform:format ascii’)
 
raw_data = oscilloscope.ask (’waveform:data?’).split (’,’)
V = [ float (value) for value in raw_data [:1400]]
 
offset = float (oscilloscope.ask(f’: channel {channel}: offset?’))
scale = float (oscilloscope.ask(f’channel {channel}: scale?’))
 
Vdisplay = [(v + offset ) / scale for v in V]
 
return V, Vdisplay
Figure 7. Parallel display of input and output signals in Python and on the oscilloscope.
Information 16 01024 g007

5.3. Automated Measurement of Transfer Curves

The transfer curve describes the relationship between the input and the output of the circuit. Once we obtained the input and output voltage data using the function mo(channel, oscilloscope), we directly generated the transfer curve by plotting the output voltage values against the corresponding input voltage values, for example: plt.plot(mo(1, oscilloscope)[1], mo(2, oscilloscope)[1]).

5.4. Automated Measurement of Frequency Response

5.4.1. Introduction to Automated Frequency Response Characterization

Determining the frequency response of a system involves analyzing its behavior in the frequency domain, where the output is characterized by the amplitude and the phase shift in response to sinusoidal input signals over a range of frequencies.
The amplitude frequency response represents the ratio of the output to input signal amplitudes, describing the system gain as a function of frequency. The phase response provides information about the phase difference between the output and input sine waves. The frequency responses were determined over the specified range using logarithmically spaced values of frequencies.

5.4.2. Amplitude Frequency Response Measurement Using Python and SCPI

To determine the amplitude frequency response, a function named afk(f) was created. Within this function, the ratio of the output to input signal amplitudes is determined in dB at a given frequency. To improve performance, the function includes an automatic setting to always display, at the most, one full period of the signal on the oscilloscope screen and a short delay between measurements for system stabilization to allow the transient to settle down.
def 
afk(f):
signal_generator.write (’source1:frequency ’ + str(f))
oscilloscope.write (’timebase:scale ’ + str (1 / f / 10))
time.sleep (0.5)
 
VamplCH1 = float (oscilloscope.ask(’measure:Vrms? channel1’))
VamplCH2 = float (oscilloscope.ask(’measure:Vrms? channel2’))
 
afk_f = 20 ∗ np.log10 (VamplCH2 / VamplCH1 )
return afk_f
By applying the function afk(f) over the desired frequency range and plotting the results on a semilog-x diagram, we obtain the amplitude frequency response of the circuit.

5.4.3. Phase Frequency Response Using Python and SCPI

A function that determines the value of the phase difference between the signals on two channels of the oscilloscope, expressed in degrees at the chosen frequency, is denoted by ffk(f). In this function, before the actual reading of the phase difference, preparatory steps were done: the desired frequency is set on the signal generator, both channels of the oscilloscope are set to AC coupling, the display of a maximum of one full period on the oscilloscope screen has been adjusted, and a time delay is added to ensure that all settings are properly applied and all the transients are faded out before the measurement is taken.
def 
ffk(f):
signal_generator.write (’source1:frequency ’ + str(f))
oscilloscope.write (’channel1:coupling ac’)
oscilloscope.write (’channel2:coupling ac’)
oscilloscope.write (’timebase:scale ’ + str (1 / f / 10))
time.sleep (0.5)
ffk_f = float (oscilloscope.ask(’measure:rphase? channel1,channel2’))
return ffk_f
To determine the phase frequency response, the next step is to determine the phase differences on the selected frequency range and to plot a graph.
An advanced approach in the case of noisy environment is reported in [22,27], based on Fourier series expansion, and in an updated version of [27] using linear least squares to determine Fourier expansion coefficients using the complete set of data recording over the time frame, resulting in lower influence of noise since all the recorded samples were taken into account. However, this approach could be used only as a black box for the students that take elementary courses in electric measurements; same for the algorithm implemented in the oscilloscope. Analyzing details of the algorithm fall outside the course and basic techniques intended to be taught to the students, and thus, the presented method in this case has been chosen. Other courses [22] use the approach of [27], which is already modified in a way that is intended to be reported.

5.5. Automated Measurement of Power-Related Quantities: RMS Values, Power, Total Harmonic Distortion and the Displacement Power Factor

As already stated, after the waveform samples are taken, to compute root-mean-square values, resulting in a simple computation of apparent power, power, total harmonic distortion, and the displacement power factor require a very short code:
  • def rms(x):
            return sqrt(mean(x ∗∗ 2))
     
    def power(x, y):
            return mean(x ∗ y)
     
    def thd(x):
            X = abs(fft(x))
            X1rms2 = 2 ∗ X[1] ∗∗ 2
            Xrms2 = sum(X ∗∗ 2)
            return 100 ∗ sqrt(Xrms2 / X1rms2 - 1)
     
    def dpf(x, y):
            X = fft(x)
            Y = fft(y)
            return cos(angle(X[1]) - angle(Y[1]))
In this manner, a digital oscilloscope as a general purpose instrument is utilized to measure very specific quantities, which expands its applicability in everyday engineering practice.

6. Examples of Laboratory Exercises and Obtained Results

We teach several courses in the field of electronics within our higher education institutions. These courses typically include weekly lectures and laboratory classes, which allow students to gain theoretical knowledge and deepen it through practical work. When modernizing the courses with ICT content, in addition to the traditional approach, networked programmable instruments were included. The principle of full transparency and accessibility of all information about the changes was applied, along with dedicated exercises specially designed for gaining fundamental experience with the individual instruments.
The new system has been applied to a wide range of circuits studied in our courses. In the following subsections, illustrations are provided, showing the application of networked programmable instruments and their control using Python, SCPI commands, and dedicated functions developed for circuit characterization. For the presentation of circuits, workflow, and results, frequency-selective circuits, oscillators, and rectifiers were chosen as examples.

6.1. Example 1: Frequency-Selective Circuits—RC Circuit

Within our electronics courses and the associated laboratory exercises, passive and active frequency-selective circuits of various orders are studied. The frequency response, H ( j ω ) , can be represented in either polar or rectangular form:
H ( j ω ) = | H ( j ω ) | e j φ ( ω ) = { H ( j ω ) } + j { H ( j ω ) } .
In the frequency domain, the amplitude frequency response and the phase frequency response are given by
| H ( j ω ) | = { H ( j ω ) } 2 + { H ( j ω ) } 2
and
φ ( ω ) = arg ( H ( j ω ) ) = atan 2 { H ( j ω ) , { H ( j ω ) .
As an example, for one of the fundamental frequency-selective circuits, a first-order low-pass passive RC circuit, the responses are
H ( j ω ) = 1 1 + j ω R C , | H ( j ω ) | = 1 1 + ( ω R C ) 2 , φ ( ω ) = arctan ( ω R C ) ,
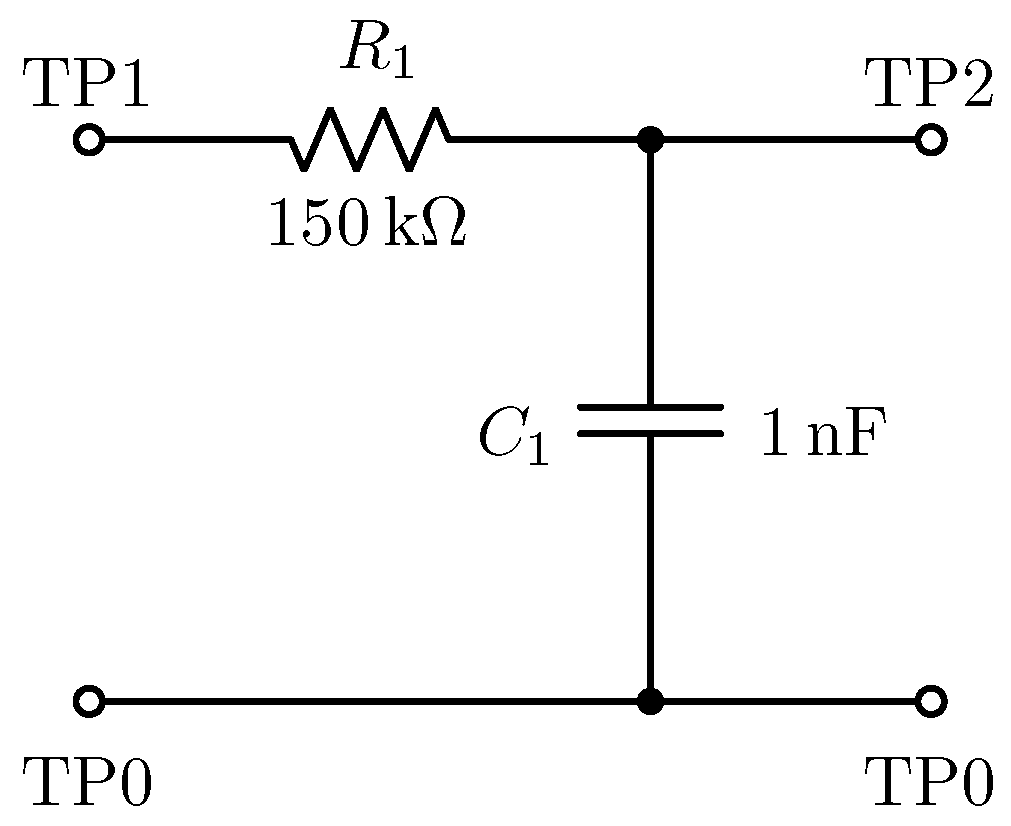
representing the frequency response, amplitude, and phase, respectively. An example of a circuit diagram and connections with instruments used in the laboratory exercise are shown in Figure 8, where the signal generator is connected to TP1 and TP0, while the oscilloscope is connected to TP1 for channel 1, and TP2 and TP0 for channel 2, TP0 being the ground connection in both cases.
A way to test a circuit behavior over a range of frequencies and to plot its response is to manually collect tabulated output data for each frequency value being set manually. Additionally, we automated data acquisition, plotting, and result-saving using developed Python functions and networked programmable instruments. The time-domain signals at the input and output of the circuit were obtained using the function mo(channel, oscilloscope), with results from both channels shown in Figure 9a. To determine the frequency response, the code varied the input frequency and automatically adjusted the signal generator. Using the previously implemented functions afk(f) and ffk(f), the amplitude and phase responses were obtained, shown in Figure 9b,c.
Amplitude response of the transfer function strictly follows the theoretical prediction, while the phase response is in good agreement in the low frequency area, where the output signal is high enough to dominate the noise, being somewhat less accurate in the high frequency area where the signal had been attenuated and approaches the noise level.

6.2. Example 2: Oscillators—RC Phase-Shift Oscillator

The second example of laboratory exercises focuses on harmonic oscillators, specifically the RC phase-shift oscillator. An electronic oscillator is a circuit that converts DC power into a periodic output signal without requiring an external time-varying input. The output can be sinusoidal (harmonic) or non-sinusoidal (e.g., square or triangular). Harmonic oscillators are commonly modeled as linear feedback systems.
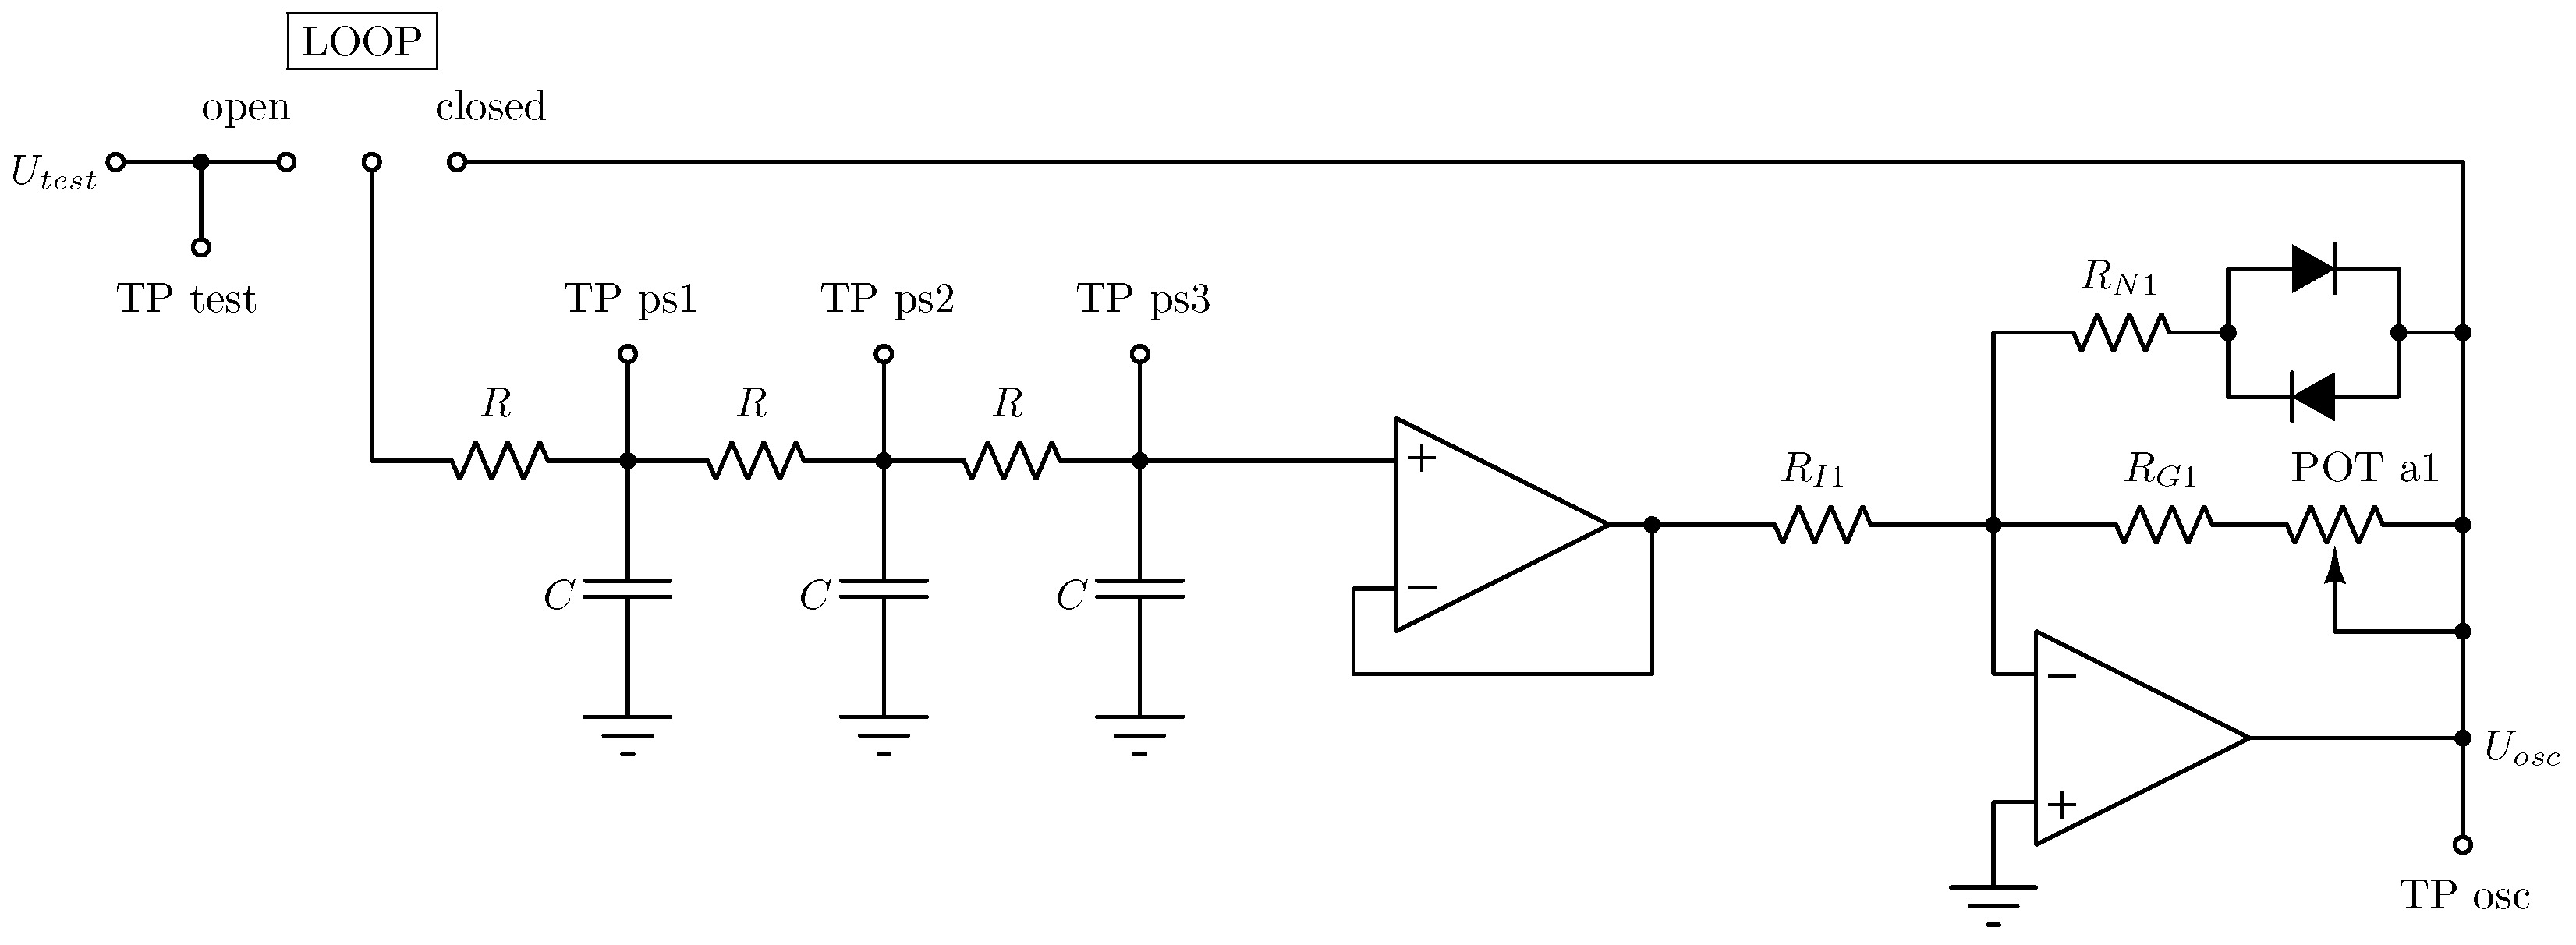
The circuit is presented in Figure 10 and it consists of an amplifier and the feedback network. The amplifier is assumed to have frequency independent gain in the frequency range of interest. Nonlinear elements are included to control the amplitude of oscillations. On the other hand, the feedback network is frequency-sensitive, corresponding to the three sections of RC circuits, discussed in Example 1, connected in series, one loading another. In this manner, analysis of the oscillator operation is built upon the topics analyzed previously, integrating the knowledge. Analysis of the oscillator circuit is based on the Barkhausen criterion for oscillator self-stimulation.
Let x ( t ) denote the external input signal and y ( t ) the output of the amplifier. For a system with amplifier gain A and feedback factor β , the output satisfies
y ( t ) ( 1 β A ) = A x ( t ) .
In the absence of an external input ( x ( t ) = 0 ), self-sustained oscillations occur when the Barkhausen criterion is satisfied:
β A = 1 | β A | = 1 , arg ( β A ) = 2 k π , k Z .
In an RC phase-shift oscillator, the feedback network consists of three identical RC low-pass sections connected in series, loading each other, followed by an inverting amplifier. For three cascaded RC sections, the amplifier gain must satisfy
A · β ( ω 0 ) = 1 ,
and the oscillation frequency for equal- R C sections is
ω 0 1 R C 6 .
Measured results using developed function for input–output waveforms are shown in Figure 11. The circuit includes three RC sections and an inverting amplifier with amplitude stabilization by a diode network. Oscilloscope measurements are taken at TP-osc and at each intermediate stage (TP-ps1, TP-ps2, TP-ps3) to observe the phase progression. The total phase shift across the RC network and amplifier confirms the Barkhausen criterion.

6.3. Example 3: Rectifiers—Twelve-Pulse Rectifiers

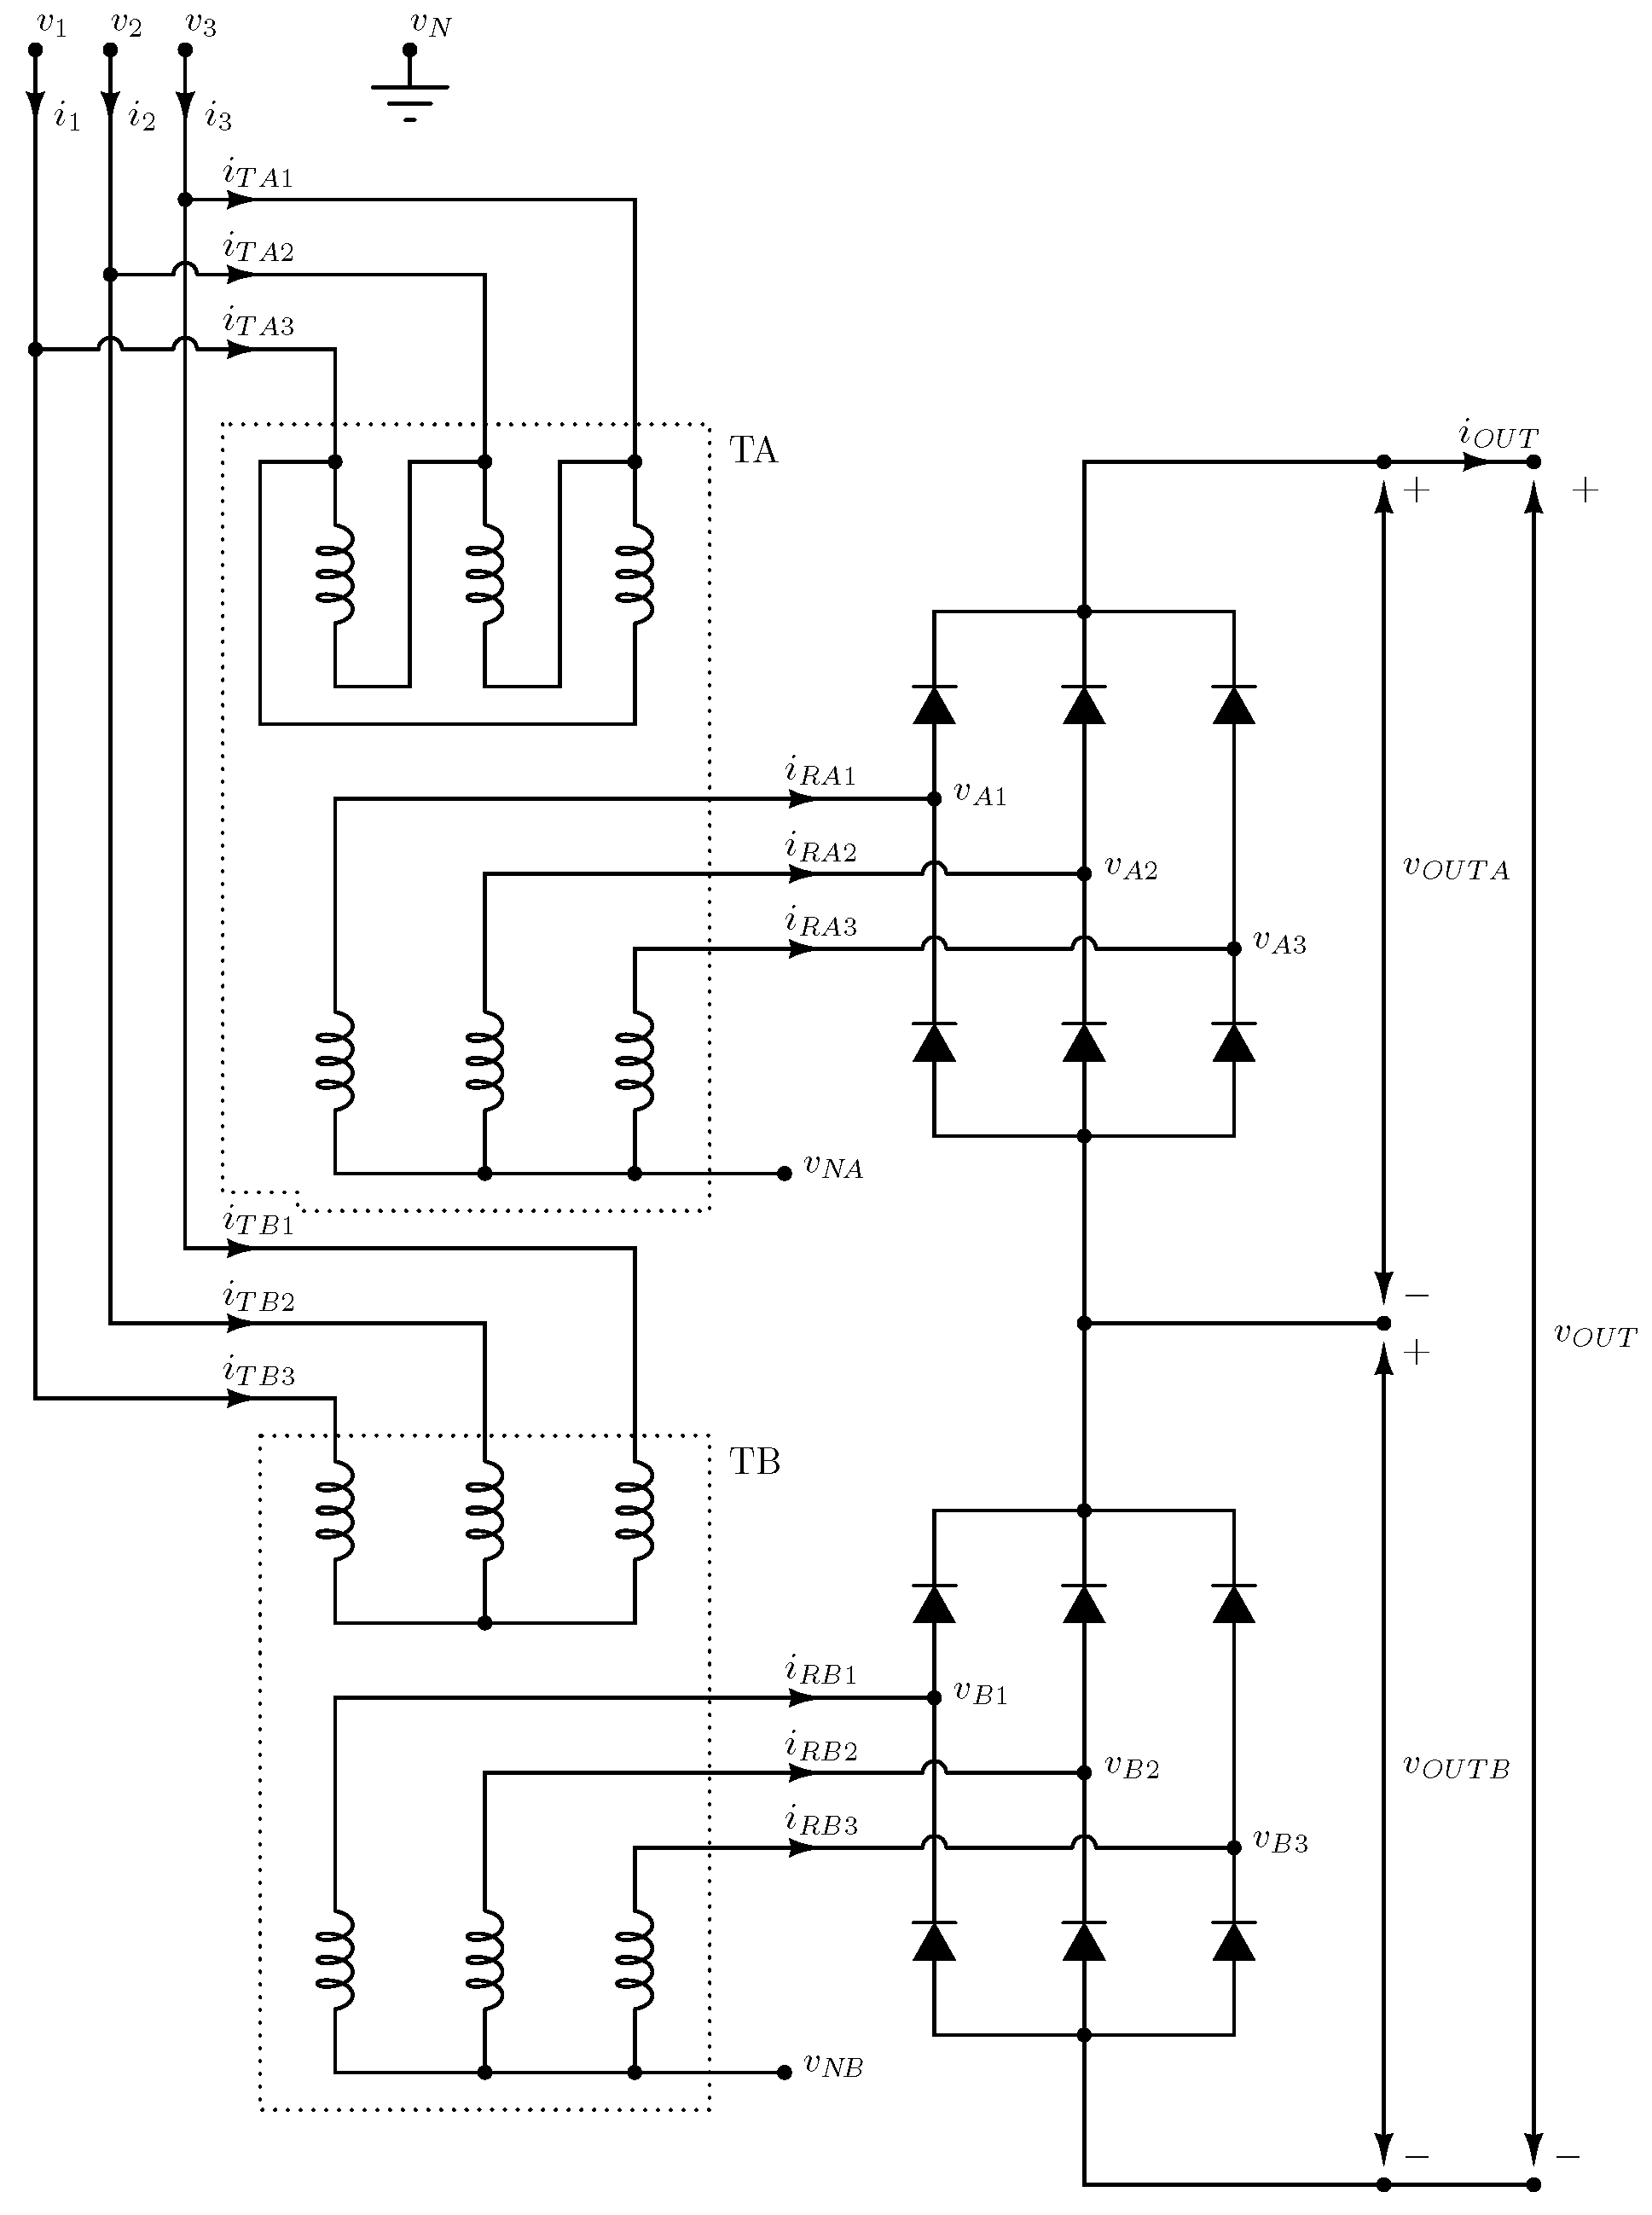
As our third and final example, a laboratory exercise intended for Master of Science degree students who took Power Electronics 2 course is presented [25]. The exercise covers twelve-pulse rectifier depicted in Figure 12. Operation of the circuit is based on the Fourier series theory, where two six-pulse circuits are integrated using a phase-shifting transformer into a twelve-pulse rectifier system. The theoretical analysis neglects magnetizing currents of the transformer as well as saturation effects of the transformer core that affect the magnetizing current waveforms. Furthermore, the harmonic content of the input voltages affects the system operation, slightly deviating the waveforms from the theoretical predictions. Finally, the transformer leakage inductance introduces finite diode commutation intervals, which contribute to the effort to reduce the distortion of input currents. These effects justify the experimental approach to study the phenomena. Furthermore, the lab exercises are based on certification measurements, a professional task being performed by the exercise authors previously [54], where all the measurements should be integrated into a report, which is a meticulous task requiring lot of precision and void of any creativity. Such tasks are perfect examples to justify the automatization approach, which presents one aspect of the benefits of the solution described in this paper.
The circuit of Figure 12 is complex, and the students are required to take numerous waveforms using the oscilloscope, to document how two six-pulse rectifiers cooperate to form a twelve-pulse rectifier in order to reduce the harmonic content of the input current. Exhaustive measurements are required, resulting in the waveform diagrams as depicted in Figure 13a. These waveforms are digitally processed to compute spectra of the input currents and voltages, like the one shown in Figure 13b, which is performed without a spectrum analyzer. Special care is taken to avoid spectral leakage, reducing the data samples to cover one period of the line voltage, 20 ms , while the oscilloscope frame covers 25 ms . In addition, commercially available spectrum analyzers frequently do not cover the low frequency spectral range required by this application, not being an option for this application. The diagrams of Figure 13b illustrate effects not considered in the theoretical analysis, primarily the finite slope of the input current during the diode-switching intervals caused by the leakage inductance and minor effects of the voltage system unbalance, observable by the presence of the harmonics of orders other than 1, 11, and 13 in the current spectrum. Finally, decrease in the input current THD with increases in the output current is an effect caused by the leakage inductance, not being theoretically covered in the lectures but illustrated in the lab.
Obtained waveforms are used to compute the rectifier parameters: input power, output power, apparent power, power factor, displacement power factor, and total harmonic distortions (THDs) of the input currents and voltages. Dependence of the input current THD on the output current is shown in Figure 13c, illustrating effects caused by magnetizing currents of the transformers, the effect not taken into account in the analysis of rectifier operation, justifying the need for real-world experiments.
Specific to this laboratory exercise is the automatic generation of the lab report [23], which is 92 page in length, being a result of an exercise that takes only two hours. The automatically generated report resembles official reports created in certification measurements. The educational benefit is to make students aware of automated measurement processes and modern capabilities to save human labor from repetitive tasks that could be automated. All the software applied in the lab is released under open-source license so that the students can reuse it in their projects or later on in their workplace.

7. Impact on Education and Competencies

The integration of programmable laboratory instruments, their networking, and programming-based automation has had a significant impact on the educational process for electronics courses and has enhanced the competencies of both teachers and students. This section begins with a comprehensive overview of these impacts, followed by detailed discussions within the subsequent subsections on the key areas of influence. The section concludes with the results of the student survey and the entrepreneur survey that provide an additional level of objectivity to our comprehensive analysis.

7.1. Overview of Impact on Education and Competencies

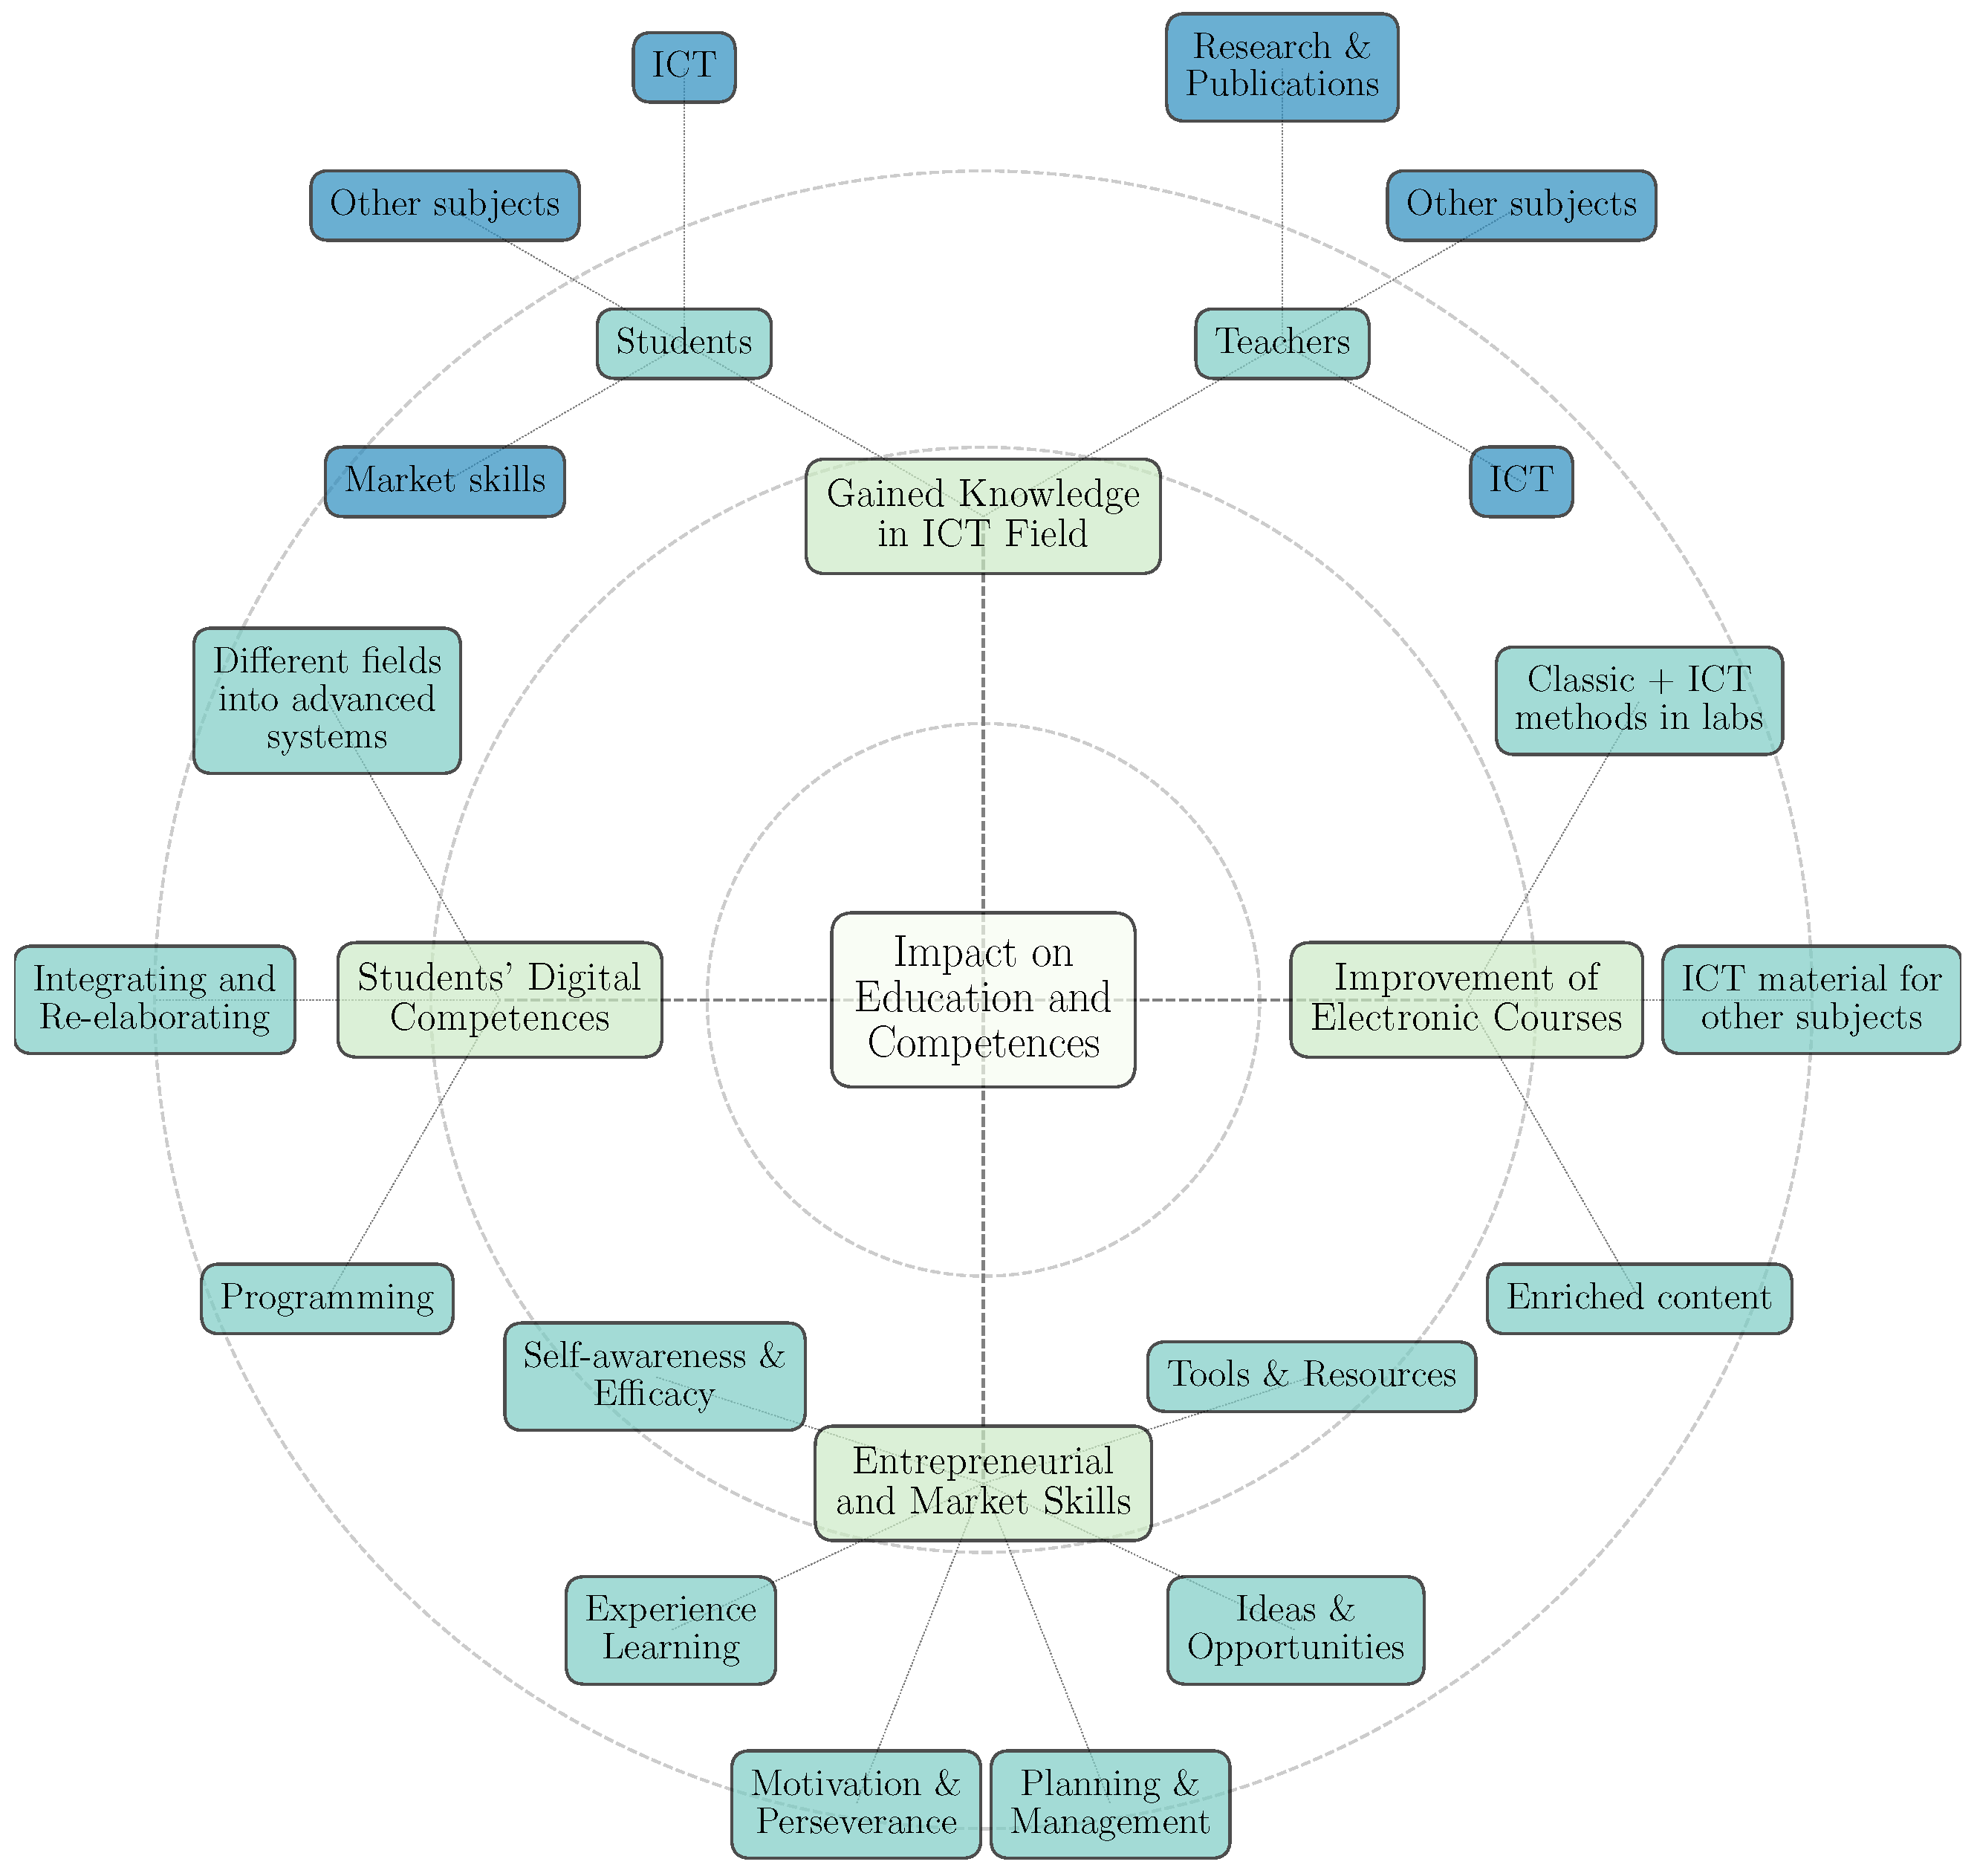
Figure 14 presents a hierarchical circular diagram that provides an overview of the impact on education and competencies. The central node, impact on education and competencies, represents the main theme, while the first layer of surrounding nodes highlights key areas of impact. These areas include improvement in electronics courses through the innovation and modernization of curricula enabled by the integration of programming and networking; gained knowledge in the ICT field for both students and teachers, particularly in computer networks and programming; enhancement of students’ digital competencies; and strengthening of students’ entrepreneurial and market skills, improving the practical applicability of their knowledge and their competitiveness in the labor market. Each category is further subdivided into specific elements or target groups, such as enriched course content, ICT materials for other subjects, and the integration of traditional and ICT-based laboratory methods within the improvement in electronics courses. Varying shades of blue distinguish the hierarchical layers, connecting lines highlight relationships with the central node, and concentric circles reinforce the radial structure.

7.2. Improvement in Electronics Courses

Our higher education institutions include departments of electronics where the authors work, offering a wide range of electronics courses at the undergraduate, master’s, and doctoral levels. Practical work in these courses follows the theory and involves direct work with specific circuits and analysis of their characteristics. The developed programmable laboratory setup has been most widely used in the courses Electrical Measurements, Analog Electronics, Special Electronic Circuits, and Power Electronics, all of which are taught by the authors. The introduction of new laboratory setups, which include networked instruments and their programming management, improves the courses content.
Laboratory exercises and course materials in electronics have traditionally included circuit analysis, design, measurement with instruments, characterization, validation, and testing. This traditional hands-on approach, involving direct work with components and measuring instruments, remains highly important and has been preserved without modification as part of the laboratory exercises within the mentioned courses. On the other hand, as part of the exercises, the courses have been enriched through the introduction of ICT materials developed by the authors. The new material has been added not only for the purpose of utilization but also as an integral part of the course, which is directly taught and represents an additional benefit of the course.
Specifically, materials have been developed that allow students to acquire basic programming knowledge, particularly in developing functions and managing program flow. In this way, students gain the skills necessary to automate the repetition of a larger number of measurements, for example, in cases where a single parameter is changed, such as adjusting the frequency on a signal generator and determining the frequency response over a range of values. To enable successful connection of measurement instruments via a LAN, the materials also include the fundamentals of IP addressing, key parameters of end devices in computer networks, and testing methods for this type of communication. Additionally, the course materials include dedicated exercises for learning automatic control of measurement instrument parameters from a connected computer using Python and SCPI commands. Finally, in the portion of the laboratory exercises focusing on a specific group of circuits, this ICT knowledge has been incorporated to automate the characterization of these circuits.
As shown in Figure 14, the areas of impact for the improvement in electronics courses, in addition to enriched content and the combination of classic and ICT-based methods in laboratory exercises, also include a segment of ICT materials for other courses. This is because the ICT materials developed for electronics courses can also be beneficial for related subjects and their practical work. Examples of these courses include Telecommunication, Communication Systems, Industrial Measurements, Smart Devices, and Internet of Things.

7.3. Improvement in Teachers and Students Competencies in ICT Field

When developing laboratory exercises for electronics courses, as well as in writing teaching guides for exercises involving automated networking of laboratory setups with measuring instruments independently or when testing specific circuits, the teachers and the teaching assistants gained knowledge and experience in the area of local area networks and programming in the Python programming language. Additionally, during the preparation and execution of laboratory exercises in courses where ICT-based exercises were introduced, all participating teachers acquired competencies in these areas. This knowledge of computer networks and programming is directly applicable to many other electronics courses, as well as more broadly within electrical engineering courses in which the teachers are involved. Furthermore, for all instructors participating in the preparation and/or implementation of additional ICT materials within electronics courses, the acquired knowledge is also beneficial for their research and development projects. In this way, the ICT competencies gained are extended both to teaching materials for other courses and to research work.
During practical work with a networked automated laboratory setup, students gain ICT knowledge, particularly in computer networks and programming. They can further apply this knowledge in other courses, whether directly related to electronics or focused on programming or computer networks. The knowledge gained in this way can also be applied to other courses and to the automation of their laboratory measurements, providing experience dissemination. This applies to courses in the field of electronics as well as other courses in the fields of electrical engineering and computer science. Additionally, the ICT knowledge acquired provides students with a direct benefit in the labor market, as it builds foundational skills in computer networks and programming that are highly valuable and widely applicable.

7.4. Students’ Digital Competencies

In our electronics course curricula, we provide students with foundational digital skills. Lectures and consultations emphasize effective online information retrieval: students search for data using authoritative academic and industry sources, learning to critically evaluate digital information. Course materials and communication (forums, messaging) are provided via our e-learning platform, immersing students in routine management of digital content, providing students with continuous access to digital resources, and encouraging independent learning, which  facilitates collaboration, exchange of technical knowledge, and development of digital communication skills. This approach aligns with established frameworks like DigComp 2.1 and DigComp 2.2 [55,56], which highlight browsing, searching, and evaluating digital information as core competencies.
In addition to these general digital competencies, the curricula support the development of more advanced digital skills that are integral to engineering education.
  • Laboratory exercises integrate multiple domains—electronics, programming, and computer networks—requiring students to search, organize, and combine diverse digital content. This process reinforces higher-order competencies in structuring and linking digital information.
  • Students engage with different forms of digital content, including equipment specifications, Python-based code development, and command line interfaces for networked devices. These activities correspond to Competence area 3: Digital content creation and 3.2: Integrating and re-elaborating digital content defined in DigComp 2.1 [55].
  • Programming-related tasks further enhance Competence area 3.4: Programming, providing authentic opportunities for digital problem-solving and applied learning [55,56].
  • Exposure to diverse textual, code-based, and network-oriented digital tools encourages students to integrate and manage complex digital environments, preparing them for professional engineering contexts that demand advanced digital fluency.
Enhancements to our electronics courses have significantly raised students’ digital competencies, which now serve as a strong foundation for developing more advanced digital and AI skills. The acquired foundation of digital competencies, regarding the ability to access, manage, understand, integrate, communicate, and create information with attention to security and efficiency, provides the basis for understanding and critically evaluating AI systems. AI-related priorities, as defined by the Coimbra Group [57], reinforce this foundation. In practice, this means emphasizing on principles such as fairness, reliability, privacy, transparency, and explainability throughout our courses. We also observed that students cultivate various transversal competencies, including critical thinking, innovation, creativity, communication, collaboration, responsibility, digital literacy, and autonomous learning, consistent with those identified in the literature [58]. These combined efforts ensure that our courses not only build core digital skills but also prepare students to use and evaluate AI responsibly and effectively.

7.5. Students’ Entrepreneurial Competencies

The structure and delivery of our teaching, which includes lectures and laboratory exercises in electronics courses, encourage the development of students’ entrepreneurial competencies. One way to formally organize these entrepreneurial competencies is to follow the European Entrepreneurship Competence Framework (EntreComp) [59,60]. These competencies are as follows:
  • Self-awareness and self-efficacy (EntreComp—Competences per area—Resources—2.1. Self-awareness & self-efficacy): Through lectures and practical work, students are encouraged to acquire knowledge, believe in themselves, and pursue further development and learning.
  • Motivation and perseverance (EntreComp—Competences per area—Resources—2.2. Motivation & perseverance): Students are encouraged to develop these skills through lectures and laboratory exercises, especially when obstacles arise during the implementation of practical problems in the lab.
  • Organization and management (EntreComp—Competences per area—Into Action—3.2. Planning & management), as well as teamwork development (EntreComp—Competences per area—Into Action—3.4. Working with others): Through lab exercises, students work in pairs and coordinate multiple parts of a lab setup involving measuring devices, computers, electrical components, and circuits.
  • Learning through practical work (EntreComp—Competences per area—Into Action—3.5. Learning through experience): In lab exercises of our electronics courses, students work with standard measuring equipment that is widely used and transferable to the job market, while performing measurements and testing practical implementations of electrical circuits directly in the laboratory environment, thereby actively developing practical competence through hands-on experience.
The improvement in the curriculum for the electronics courses involved strengthening the laboratory exercises through the introduction of new standard measuring equipment, which also includes advanced options for network connectivity, management, and measurement control using programming in Python, while maintaining part of the exercises in the traditional format. Since laboratory exercises have had the greatest impact on the entrepreneurial competences listed previously, this led to their enhancement. Additionally, this improvement also contributed to new entrepreneurial competences for students, specifically,
  • Strengthening entrepreneurial competences in the area of ideas and opportunities (EntreComp—Competences per area—Ideas & Opportunities) through exposure to and work on a complex system that connects several different subfields within the broader areas of electrical engineering and computer science, specifically, electronics, programming, and information and communication networks, emphasizing practical implementation, broad applicability in other areas, and direct relevance to the labor market;
  • Strengthening the area of resources in entrepreneurial competences (EntreComp—Competences per area—Resources—2.3. Mobilizing resources) by recognizing the availability of different options for standard network equipment and its applicability as well as understanding the ways and conditions for setting up code in the Python programming language.
Working on a system for automatic measurement management and control contributed to the development of practically applicable competences, helped students to recognize integration opportunities, and fostered the creation of better and more efficient solutions for existing measurements of real-world problems.

7.6. Students Survey

A student survey was conducted to evaluate the courses, materials, instructional innovations, and the acquisition of digital and entrepreneurial competencies, in alignment with the European DigComp and EntreComp frameworks [55,56,59,60]. The survey consisted of 10 questions, with students rating each aspect on a scale from 1 to 5, where 5 represented the highest rating. The survey was anonymous and voluntary, with no personal or identifiable data collected, ensuring both student privacy and objectivity in the evaluation. Survey items were adapted from established competence descriptions and mapped to the learning objectives of the courses. The draft instrument was reviewed by external experts to confirm content and face validity, and minor revisions were made based on their feedback. Data were collected over the past three academic years in the courses Analog Electronics and Special Electronic Circuits, yielding 156 completed responses.
For clarity, the survey questions were grouped according to the aspect they addressed. The first group of questions referred to the course itself and the traditional mode of instruction as follows:
Q1 Evaluate the provided course materials.
Q2 Evaluate the laboratory and measuring equipment used in this course.
The second group of questions referred to students’ impressions of networked programmable instruments through the following:
Q3 Evaluate the improvement in knowledge of working with measuring equipment.
Q4 Evaluate the improvement in practical knowledge.
Q5 Evaluate the improvement in multidisciplinary knowledge (combining electronics with computer networks and programming).
Q6 Working with programmable measuring equipment compared to traditional measuring equipment is Q6.1 more useful, Q6.2 more complex, and Q6.3 more interesting.
Q7 Evaluate the improvement in knowledge of networking measuring equipment.
Q8 Evaluate the improvement in knowledge of applying programming for measurement equipment control.
The third group of questions addressed the enhancement of digital competencies (Q9) and entrepreneurial competencies (Q10).
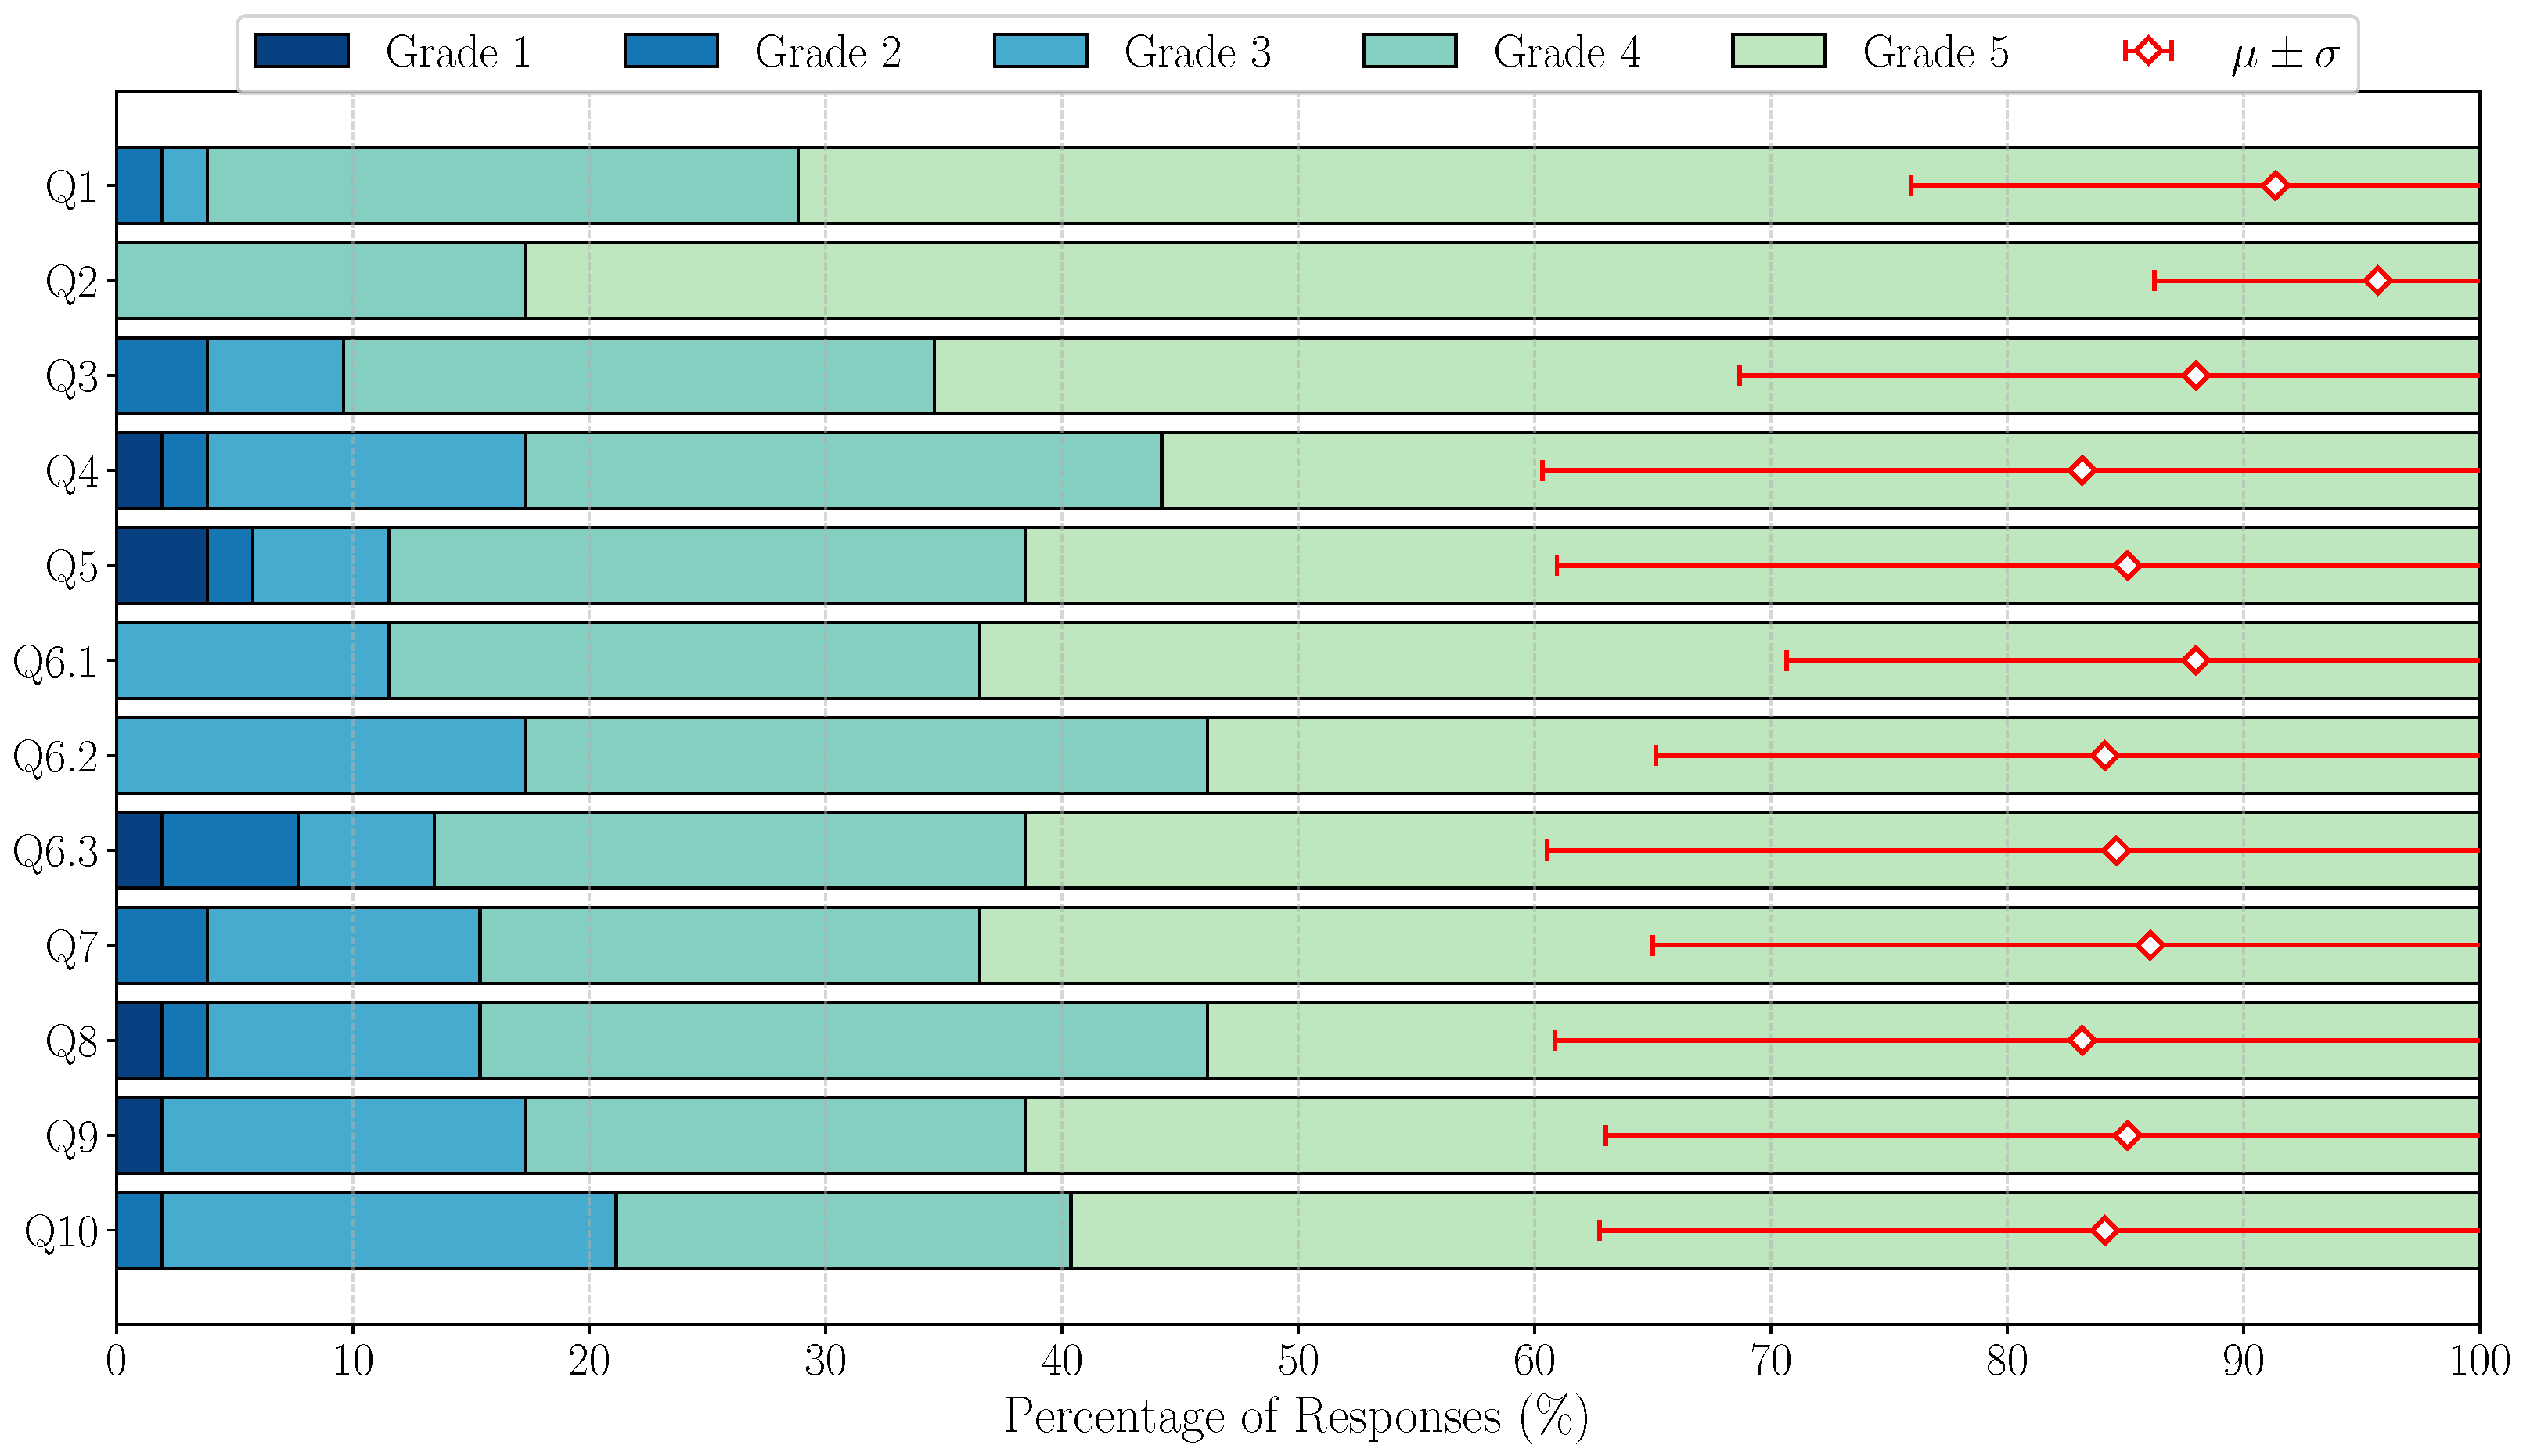
Detailed results of the student survey across our electronics courses are summarized in Table 1, while Figure 15 visually illustrates the distribution of student responses across survey questions using a horizontally stacked bar chart. Each bar represents the percentage of responses for grades 1 through 5. To characterize central tendency and variability, the weighted mean ( μ ) and standard deviation ( σ ) were calculated on the original 1–5 scale and presented in Table 1. For visualization purposes, in Figure 15, these values were linearly mapped to a 0–100% range, where 0% corresponds to grade 1 and 100% to grade 5. The mean values are shown as diamond markers, with red error bars indicating μ ± σ , providing an intuitive representation of both the overall trend and the response variability across questions.
The results indicate that students responded very positively to the new teaching topics and instructional style. High mean ratings (mostly above 4.3) and a large proportion of grades 4–5 (around 87%) reflect strong acceptance and engagement. These findings suggest that the introduced approach effectively enhanced the learning experience and reduced repetitive tasks. Continued monitoring of future surveys will help evaluate the long-term impact as automated measurements and networked programmable instruments become a standard component of the teaching process and students’ laboratory exercises performed in the lab.

7.7. Entrepreneurs Survey

During the introduction of networking of measuring equipment and programming their operation using the Python programming language into courses in the field of electronics, consultations were held with entrepreneurs who are likely future employers of our students. To disseminate the work, extend the analysis, and assess the effectiveness of the analysis, a survey was conducted. Eight companies and organizations of different sizes and types participated: Mihajlo Pupin Institute—national R&D institute; Institute of Physics, University of Belgrade; Institute IRITEL—telecommunications and electronics company; Informatika—IT and systems-integration company; JP Emisiona tehnika i veze—public broadcasting/transmission company; ELSYS Eastern Europe—electronic and embedded systems; Bitgear Wireless Design Services—IoT and product development; and Teleoptik–Žiroskopi—navigation and gyroscope manufacturer.
The survey comprised six questions: the first five were yes/no questions, while the sixth was open-ended. Specifically, the questions comprise the following:
Q1
Do you use programmable measuring equipment?
Q2
Do you perform networking of measuring equipment?
Q3
Do you engage in programming measuring equipment using the Python programming language?
Q4
Do you perform storing, visualization, and processing of measurement results using Python?
Q5
Do you use any other system for networking and remote control of measuring equipment?
Q6
If you use any other system for connecting measuring equipment, remote access, control, data acquisition, or processing, please describe the connection method and the software support used.
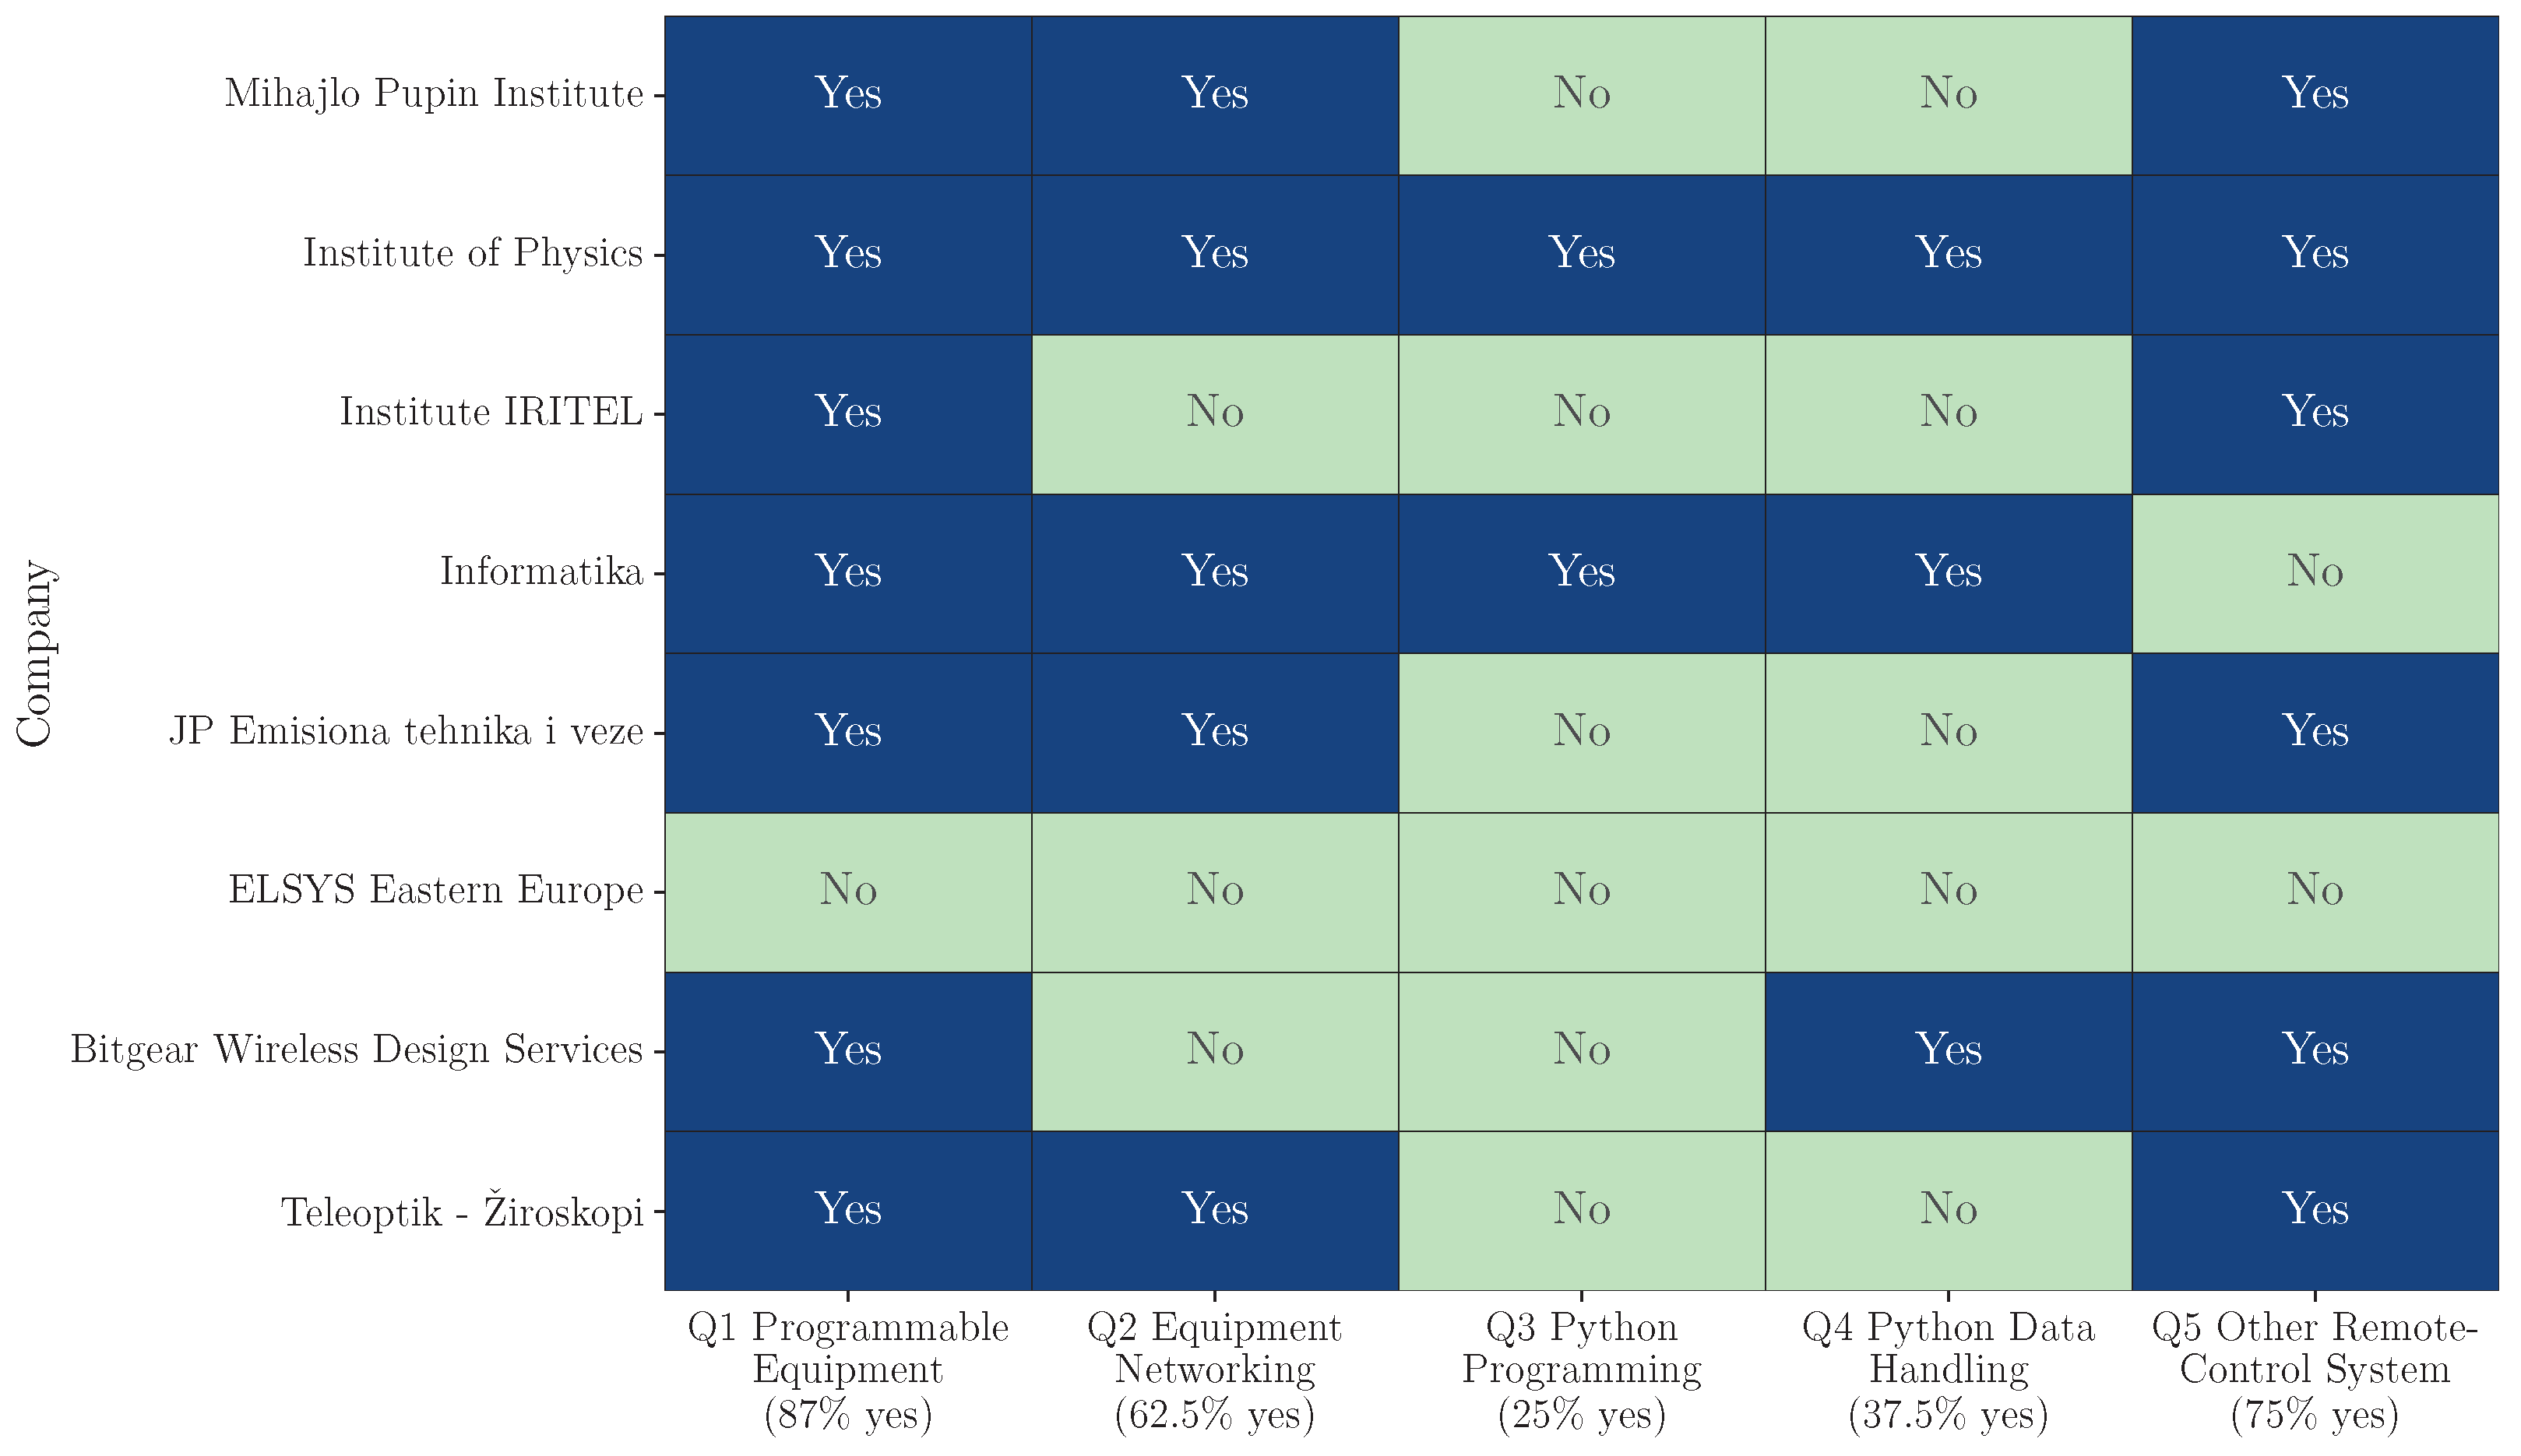
Figure 16 provides a detailed overview of each company’s responses to the yes/no questions (Q1–Q5), illustrating technology adoption in the form of a binary heatmap. Each cell indicates whether a company reported using a given technology, and the percentage of companies adopting each capability is summarized in the column labels. For example, programmable equipment and other remote control systems show the highest adoption rates (87% and 75%, respectively), whereas Python programming and data handling have lower uptake (25% and 37.5%). Among the companies using additional systems (Q6), the Mihajlo Pupin Institute employs NI LabVIEW; the Institute IRITEL uses Ethernet access with an in-house web server; JP Emisiona Tehnika i Veze applies Ceragon NetMaster and Cisco ROSA Network; Bitgear Wireless Design Services adopts an ANSI C-based approach; and Teleoptik–Žiroskopi relies on C/C#/C++ and the SimPati suite.
The overall conclusions of the entrepreneurs survey are that automated measurement systems are in use and that skills regarding these systems are well justified to be taught within the education system; employers place a high value on operational effectiveness, and automating repetitive measurement tasks is highly welcomed; and the diversity of platforms reported in Q6 further underscores the need to teach transferable skills, such as networking, instrument control, and data-acquisition programming, that remain applicable across different vendor-specific environments.

8. Discussion

Educational programs and course organization continually adapt to technological advances in order to improve course materials, develop student competencies, increase attractiveness, improve pedagogical frameworks, and strengthen links with other subjects and industry. This paper provides a solution to these needs within the context of electronics courses in higher education by proposing and evaluating an integrated system that incorporates ICT technologies, specifically, computer networking and programming, directly into electronics curricula. This system is successfully implemented in our courses.
The solution presented in this paper involves the connection of measurement instruments according to Ethernet principles, and instrument management and control is enabled using the widely used Python programming language. This innovation requires modifications of laboratory-oriented courses, requiring the introduction of computer networking and programming into the curriculum. This presents a challenge for teachers and students but highly influences their ICT competencies, and also results in improvements in the pedagogical framework especially in the sense of active learning and complex interconnection of the areas of engineering. This contrasts with other related solutions, such as remote, virtual, or AR laboratories, where the emphasis is placed on other benefits of the solution, while the pedagogical concept of active learning is more passive and less directly oriented toward students solving problems in all aspects of the system. Our approach is presented in detail in this paper, with emphasis on the use of general purpose tools such that gained knowledge is more widely available and might be utilized in other areas. A set of laboratory exercises is presented in the paper as examples, and additional solutions with full codes are openly available on our pages [4,5], making them fully replicable.
The developed system enables automated measurements using networked programmable instruments irrespective of the electronics sub-domain or the particular circuit under test, by providing dedicated code functions to probe general and specific characteristics. This approach broadens the applicability of the solution and allows reuse in related fields such as telecommunications and smart devices. An advantage of the developed system is that it supports high scalability: it can operate with a single workstation and measurement setup or be extended to automate an entire laboratory or a sector.
In contrast to previous publications, our solution provides details about social and professional impact analyzed through targeted questionnaires, conducted with students of our electronics courses and with entrepreneurs. The results from over 150 students indicate that they enjoy the new approach, with an overall rating of 4.46/5, finding it valuable in all aspects of the solution. Furthermore, more than 80% of the surveyed companies in relevant fields report applying measurement automation in their work, which underscores the importance of such curricular improvements to prepare for the labor market. In addition, the paper documents the impact of such developments on student competencies, through course materials and the acquisition of new ICT knowledge, as well as a detailed analysis of improvements in digital and entrepreneurial competencies, in alignment with the European Commission’s DigComp and EntreComp frameworks.
While the current implementation depends on specific types of equipment and software versions, these factors do present challenges but do not limit its core concept; rather, they provide opportunities for further enhancement aimed at increasing the universality and interoperability of the proposed solution across different institutional environments, as long as teacher willingness and training is present along with IT support. Our future work will include further multi-institutional trials, longitudinal tracking of graduate outcomes, development of standardized assessment instruments aligned with DigComp/EntreComp, and investigation of technical limitations, such as security and collisions in the Ethernet network of laboratory instruments.

Author Contributions

Conceptualization, A.Z.; methodology, A.Z.; software, A.Z. and P.P.; validation, A.Z. and P.P.; formal analysis, A.Z. and P.P.; investigation, A.Z. and P.P.; resources, A.Z. and P.P.; data curation, A.Z. and P.P.; writing—original draft preparation, A.Z.; writing—review and editing, A.Z. and P.P.; visualization, A.Z. and P.P.; supervision, A.Z. and P.P.; funding acquisition, A.Z. All authors have read and agreed to the published version of the manuscript.

Funding

This work was partially funded by the project “Introduction of Programming in Python in the Courses Analog Electronics and Special Electronic Circuits,” under the leadership of Amela Zekovic, funded by the Ministry of Education, Science and Technological Development, Republic of Serbia, and approved by contract number 451-02-02004/2019-06. The APC was funded by the School of Electrical and Computer Engineering (VISER), Academy of Technical and Art Applied Studies Belgrade (ATUSS).

Institutional Review Board Statement

Ethical review and approval were waived under the Law on Personal Data Protection of the Republic of Serbia (“Official Gazette of RS”, Nos. 97/08 and 107/2012), as the study involved anonymous, voluntary student questionnaires with no personal or identifiable data collected.

Informed Consent Statement

Participation was voluntary and anonymous. Under the same law, explicit consent is required only for personal data; completing the questionnaire provided implied consent for use of anonymous responses in the research.

Data Availability Statement

The original contributions presented in this study are included in the article. Further inquiries can be directed to the corresponding author.

Conflicts of Interest

The authors declare no conflicts of interest.

References

  1. Mantri, A.; Dutt, S.; Gupta, J.P.; Chitkara, M. Design and Evaluation of a PBL-Based Course in Analog Electronics. IEEE Trans. Educ. 2008, 51, 432–438. [Google Scholar] [CrossRef]
  2. Soomro, J.B.; Chachar, F.A.; Munir, H.M.; Ahmed Ansari, J.; Zalhaf, A.S.; Alqarni, M.; Alamri, B. Efficient Hardware-in-the-Loop and Digital Control Techniques for Power Electronics Teaching. Sustainability 2022, 14, 3504. [Google Scholar] [CrossRef]
  3. Albarracin-Acero, D.A.; Romero-Toledo, F.A.; Saavedra-Bautista, C.E.; Ariza-Echeverri, E.A. Virtual Reality in the Classroom: Transforming the Teaching of Electrical Circuits in the Digital Age. Future Internet 2024, 16, 279. [Google Scholar] [CrossRef]
  4. Zekovic, A. Networked Instruments and Python. GitHub Repository. 2025. Available online: https://github.com/AmelaZekovic/networked-instruments-and-python (accessed on 20 October 2025).
  5. Pejović, P. Laboratorijske Vežbe iz Električnih Merenja. Available online: https://zenodo.org/records/1311557 (accessed on 5 October 2025).
  6. Macías-Guarasa, J.; Montero, J.M.; San-Segundo, R.; Araujo, Á.; Nieto-Taladriz, O. A Project-Based Learning Approach to Design Electronic Systems Curricula. IEEE Trans. Educ. 2006, 49, 389–397. [Google Scholar] [CrossRef]
  7. Barak, M. Science Teacher Education in the Twenty-First Century: A Pedagogical Framework for Technology-Integrated Social Constructivism. Res. Sci. Educ. 2017, 47, 283–303. [Google Scholar] [CrossRef]
  8. Catz, B.; Kolodny, A.; Gero, A. Promoting engineering students’ learning: An interdisciplinary teaching approach of electronic circuits. Nternational J. Eng. Educ. 2023, 39, 208–218. [Google Scholar]
  9. Júnior, E.L.P.; Camargo, C.E.L.; Alves, J.A.d.O.; Maia, D.F.; Bimestre, T.A.; Moreira, M.Á.L.; Gomes, C.F.S.; dos Santos, M.; Diniz, B.P. Systems Thinking as a Support Tool in Teaching Electronics: An Approach through a Systematic Literature Review and Proposal of a Framework for Integrating Maker Culture and IoT in Technical Education. Procedia Comput. Sci. 2025, 266, 778–788. [Google Scholar] [CrossRef]
  10. Karayaka, H.B.; Adams, R.D. A Hybrid Flipped Classroom Approach to Teaching a Power Electronics Course to Electrical Engineering Students. In Proceedings of the American Society for Engineering Education Annual Conference & Exposition, Seattle, WA, USA, 14–17 June 2015. [Google Scholar] [CrossRef]
  11. Sandoval Peréz, S.; Gonzalez Lopez, J.M.; Villa Barba, M.A.; Jimenez Betancourt, R.O.; Molinar Solís, J.E.; Rosas Ornelas, J.L.; Riberth García, G.I.; Rodriguez Haro, F. On the use of augmented reality to reinforce the learning of power electronics for beginners. Electronics 2022, 11, 302. [Google Scholar] [CrossRef]
  12. Gomez, M.J.; Ruipérez-Valiente, J.A.; García Clemente, F.J. Exploring Technology- and Sensor-Driven Trends in Education: A Natural-Language-Processing-Enhanced Bibliometrics Study. Sensors 2023, 23, 9303. [Google Scholar] [CrossRef]
  13. Holub, J.; Svatos, J.; Vedral, J. Teaching of electronic circuits for measuring technology at the Faculty of Electrical Engineering, Department of Measurement, CTU in Prague. Meas. Sensors 2025, 38, 101312. [Google Scholar] [CrossRef]
  14. Valencia de Almeida, F.; Hayashi, V.T.; Arakaki, R.; Midorikawa, E.; de Mello Canovas, S.; Cugnasca, P.S.; Corrêa, P.L.P. Teaching Digital Electronics during the COVID-19 Pandemic via a Remote Lab. Sensors 2022, 22, 6944. [Google Scholar] [CrossRef]
  15. Wang, S.-C.; Liu, Y.-H. Software-Reconfigurable e-Learning Platform for Power Electronics Courses. IEEE Trans. Ind. Electron. 2008, 55, 2416–2424. [Google Scholar] [CrossRef]
  16. Sakkas, K.; Papadopoulos, G.; Georgiou, P.; Ioannou, A. Multiplayer Virtual Labs for Electronic Circuit Design. Electronics 2025, 14, 3163. [Google Scholar] [CrossRef]
  17. Asham, Y.; Bakr, M.H.; Emadi, A. Applications of Augmented and Virtual Reality in Electrical Engineering Education: A Review. IEEE Access 2023, 11, 134717–134738. [Google Scholar] [CrossRef]
  18. Ibáñez, M.B.; Delgado-Kloos, C. Augmented reality for STEM learning: A systematic review. Comput. Educ. 2018, 123, 109–123. [Google Scholar] [CrossRef]
  19. Pereira Júnior, E.L.; Moreira, M.Â.L.; Portella, A.G.; de Azevedo Junior, C.M.; de Araújo Costa, I.P.; Fávero, L.P.; Gomes, C.F.S.; dos Santos, M. Systematic Literature Review on Virtual Electronics Laboratories in Education: Identifying the Need for an Aeronautical Radar Simulator. Electronics 2023, 12, 2573. [Google Scholar] [CrossRef]
  20. Nesic, M.; Tomcik, B.; Zekovic, A.; Pejovic, P.; Marinkovic, B. Electrical characterization of polyaniline (PANI) based organic memristors and its emulation with programmable microcontroller device. In Proceedings of the MemoCIS 6th Workshop Memristors—Devices, Models, Circuits, Systems and Applications, Krakow, Poland, 21–22 September 2017. [Google Scholar]
  21. Pejović, P. Application of Python Programming Language in Measurements. Facta Univ. Ser. Electron. Energetics 2019, 10, 1–23. [Google Scholar] [CrossRef]
  22. Pejović, P. Electrical Measurements Revisited—Experiences from Modernizing the Course. In Proceedings of the IEEE EUROCON 2017, Ohrid, North Macedonia, 6–8 July 2017; pp. 838–844. [Google Scholar]
  23. Power Electronics 2, Laboratory Materials and Reports. Available online: http://tnt.etf.bg.ac.rs/~ms1ee2/ (accessed on 6 October 2025).
  24. Pejović, P.; Zeković, A. Software Supported DC Voltage Calibrator. In Proceedings of the XI International Symposium on Industrial Electronics (INDEL 2016), Banja Luka, Bosnia and Herzegovina, 3–5 November 2016; Available online: https://zenodo.org/records/1478177 (accessed on 1 October 2025).
  25. Pejović, P.; Simić, M. Virtual Instruments for Power Electronics Based on Free Software Tools. In Proceedings of the 17th International Symposium on Power Electronics (Ee 2013), Novi Sad, Serbia, 30 October–1 November 2013; Available online: https://zenodo.org/records/1478187 (accessed on 5 October 2025).
  26. Lazarević, V.; Bjelica, M.; Pejović, P. Maximum Power Point Tracking Control System of Photovoltaic Module Using Free Software and Standard Laboratory Equipment. In Proceedings of the 18th International Symposium on Power Electronics, Ee 2015, Novi Sad, Serbia, 28–30 October 2015. [Google Scholar]
  27. Pejović, P. An Automated System for Frequency Response Measurement Based on Free Software Tools. In Proceedings of the XII International Symposium Industrial Electronics, INDEL 2018, Banja Luka, Bosnia and Herzegovina, 1–3 November 2018. [Google Scholar] [CrossRef]
  28. Zekovic, A.; Serb, A.; Berdan, R.; Pejovic, P.; Prodromakis, T. ReMem: A system for accessing memristors remotely over the Internet. In Proceedings of the Research Workshop of the Israel Science Foundation, 2017 Stephen and Sharon Seiden Frontiers in Engineering and Science Workshop: Beyond CMOS: From Devices to Systems, Technion, Haifa, Israel, 5–6 June 2017. [Google Scholar]
  29. Real, G.; Raviola, L.; Jauré, M.F.; Vitali, A.O. Data acquisition system for didactic laboratories based on open-source hardware and free software. In Proceedings of the 2015 XVI IEEE Workshop on Information Processing and Control (RPIC), Cordoba, Argentina, 6–9 October 2015; pp. 1–6. [Google Scholar]
  30. Johnson, J.L.; Wörden, H.T.; van Wijk, K. PLACE: An Open-Source Python Package for Laboratory Automation, Control, and Experimentation. J. Lab. Autom. 2015, 20, 10–16. [Google Scholar] [CrossRef]
  31. Koenka, I.J.; Sáiz, J.; Hauser, P.C. Instrumentino: An Open-Source Modular Python Framework for Controlling Arduino-Based Experimental Instruments. Comput. Phys. Commun. 2014, 185, 2724–2729. [Google Scholar] [CrossRef]
  32. Martín, F.J.F.; Llopis, M.V.; Rodríguez, J.C.C.; González, J.R.B.; Blanco, J.M. Low-cost open-source multifunction data acquisition system for accurate measurements. Measurement 2014, 55, 265–271. [Google Scholar] [CrossRef]
  33. Lewis, A.J.; Campbell, M.; Stavroulakis, P. Performance evaluation of a cheap, open source, digital environmental monitor based on the Raspberry Pi. Measurement 2016, 87, 228–235. [Google Scholar] [CrossRef]
  34. Denih, A.; Putra, G.R.; Kurniawan, Z.; Bahtiar, E.T. Developing a Model for Curve-Fitting a Tree Stem’s Cross-Sectional Shape and Sapwood-Heartwood Transition in a Polar Diagram System Using Nonlinear Regression. Forests 2023, 14, 1102. [Google Scholar] [CrossRef]
  35. Heuvel-Horwitz, J.; Gross, E.C.; Sears, T.J. Python control of a high-resolution near-infrared spectrometer for undergraduate use. J. Mol. Spectrosc. 2025, 407, 111983. [Google Scholar] [CrossRef]
  36. SCPI Consortium, Standard Commands for Programmable Instruments (SCPI). Available online: https://www.ivifoundation.org/downloads/SCPI/scpi-99.pdf (accessed on 12 November 2025).
  37. Rigol Technologies, Inc. Rigol DS2102A Oscilloscope Programming Guide. Available online: https://beyondmeasure.rigoltech.com/acton/attachment/1579/f-0508/1/-/-/-/-/MSO2000A%26DS2000A_ProgrammingGuide.pdf (accessed on 21 October 2025).
  38. Rigol Technologies, Inc. Rigol DG1000Z Series Function/Arbitrary Waveform Generator Programming Guide. Available online: https://beyondmeasure.rigoltech.com/acton/attachment/1579/f-0493/1/-/-/-/-/DG1000Z%20Programming%20Guide.pdf (accessed on 12 October 2025).
  39. Rigol Technologies, Inc. Rigol DP800 Series Programmable Linear DC Power Supplies Programming Guide. Available online: https://beyondmeasure.rigoltech.com/acton/attachment/1579/f-03a1/1/-/-/-/-/DP800%20Programming%20Guide.pdf (accessed on 12 October 2025).
  40. LXI Consortium, LXI Standard. Available online: https://www.lxistandard.org/Documents/about/LXI%201_3%202008-10-30.pdf (accessed on 12 November 2025).
  41. IEEE Standard Codes, Formats, Protocols, and Common Commands for Use with IEEE Standard 488.1-1987, IEEE Standard Digital Interface for Programmable Instrumentation. Available online: https://standards.ieee.org/ieee/488.2/718/ (accessed on 12 November 2025).
  42. EIA RS-232-C; Interface Between Data Terminal Equipment and Data Circuit-Terminating Equipment Employing Serial Binary Data Interchange. Electronic Industries Association: Washington, DC, USA, 1969.
  43. USB4 Specification Version 2.0. Available online: https://www.usb.org/document-library/usb4r-specification-v20 (accessed on 12 November 2025).
  44. Python. Available online: https://www.python.org/ (accessed on 5 October 2025).
  45. Python Standard Library. Available online: https://docs.python.org/3/library/index.html (accessed on 5 October 2025).
  46. Hughes, J.M. Real World Instrumentation with Python: Automated Data Acquisition and Control Systems; O’Reilly Media, Inc.: Sebastopol, CA, USA, 2010. [Google Scholar]
  47. NumPy. Available online: https://numpy.org/ (accessed on 5 October 2025).
  48. Python-vxi11 0.9. Available online: https://pypi.org/project/python-vxi11/ (accessed on 5 October 2025).
  49. Python-pyserial 3.5. Available online: https://pypi.org/project/pyserial/ (accessed on 5 October 2025).
  50. Python-usbtmc 0.8. Available online: https://pypi.org/project/python-usbtmc/ (accessed on 5 October 2025).
  51. Matplotlib. Available online: https://matplotlib.org/ (accessed on 5 October 2025).
  52. Pandas. Available online: https://pandas.pydata.org/ (accessed on 5 October 2025).
  53. Pejović, P.; Zeković, A. Bode Plots Revisited: A Software System for Automated Generation od Piecewise Linear Frequency Response Plots. Electronics 2017, 21, 76–86. [Google Scholar] [CrossRef]
  54. Pejović, P. Three-Phase Diode Bridge Rectifier with Low Harmonics: Current Injection Methods; Springer: Boston, MA, USA, 2007. [Google Scholar]
  55. Carretero Gomez, S.; Vuorikari, R.; Punie, Y. DigComp 2.1: The Digital Competence Framework for Citizens with Eight Proficiency Levels and Examples of Use; Publications Office of the European Union: Luxembourg, 2017; Available online: https://publications.jrc.ec.europa.eu/repository/handle/JRC106281 (accessed on 6 October 2025).
  56. Vuorikari, R.; Kluzer, S.; Punie, Y. DigComp 2.2: The Digital Competence Framework for Citizens—With New Examples of Knowledge, Skills and Attitudes; Publications Office of the European Union: Luxembourg, 2022; Available online: https://publications.jrc.ec.europa.eu/repository/handle/JRC128415 (accessed on 6 October 2025).
  57. Coimbra Group. AI and Digital Competence Through Higher Education: Position Paper; Coimbra Group Employability Working Group: Brussels, Belgium, 2025; Available online: https://www.coimbra-group.eu/wp-content/uploads/AI-and-Digital-Competence-through-Higher-Education-EMP-WG-Position-Paper-.pdf (accessed on 11 November 2025).
  58. Deroncele-Acosta, A.; Sayán-Rivera, R.M.E.; Mendoza-López, A.D.; Norabuena-Figueroa, E.D. Generative Artificial Intelligence and Transversal Competencies in Higher Education: A Systematic Review. Appl. Syst. Innov. 2025, 8, 83. [Google Scholar] [CrossRef]
  59. Bacigalupo, M.; Kampylis, P.; Punie, Y.; Van den Brande, G. EntreComp: The Entrepreneurship Competence Framework; Publications Office of the European Union: Luxembourg, 2016; Report No. EUR 27939 EN; Available online: https://publications.jrc.ec.europa.eu/repository/handle/JRC101581 (accessed on 6 October 2025).
  60. McCallum, E.; Weicht, R.; McMullan, L.; Price, A. EntreComp: A Practical Guide; Publications Office of the European Union: Luxembourg, 2020; Report No. JRC120487; Available online: https://publications.jrc.ec.europa.eu/repository/handle/JRC120487 (accessed on 6 October 2025).
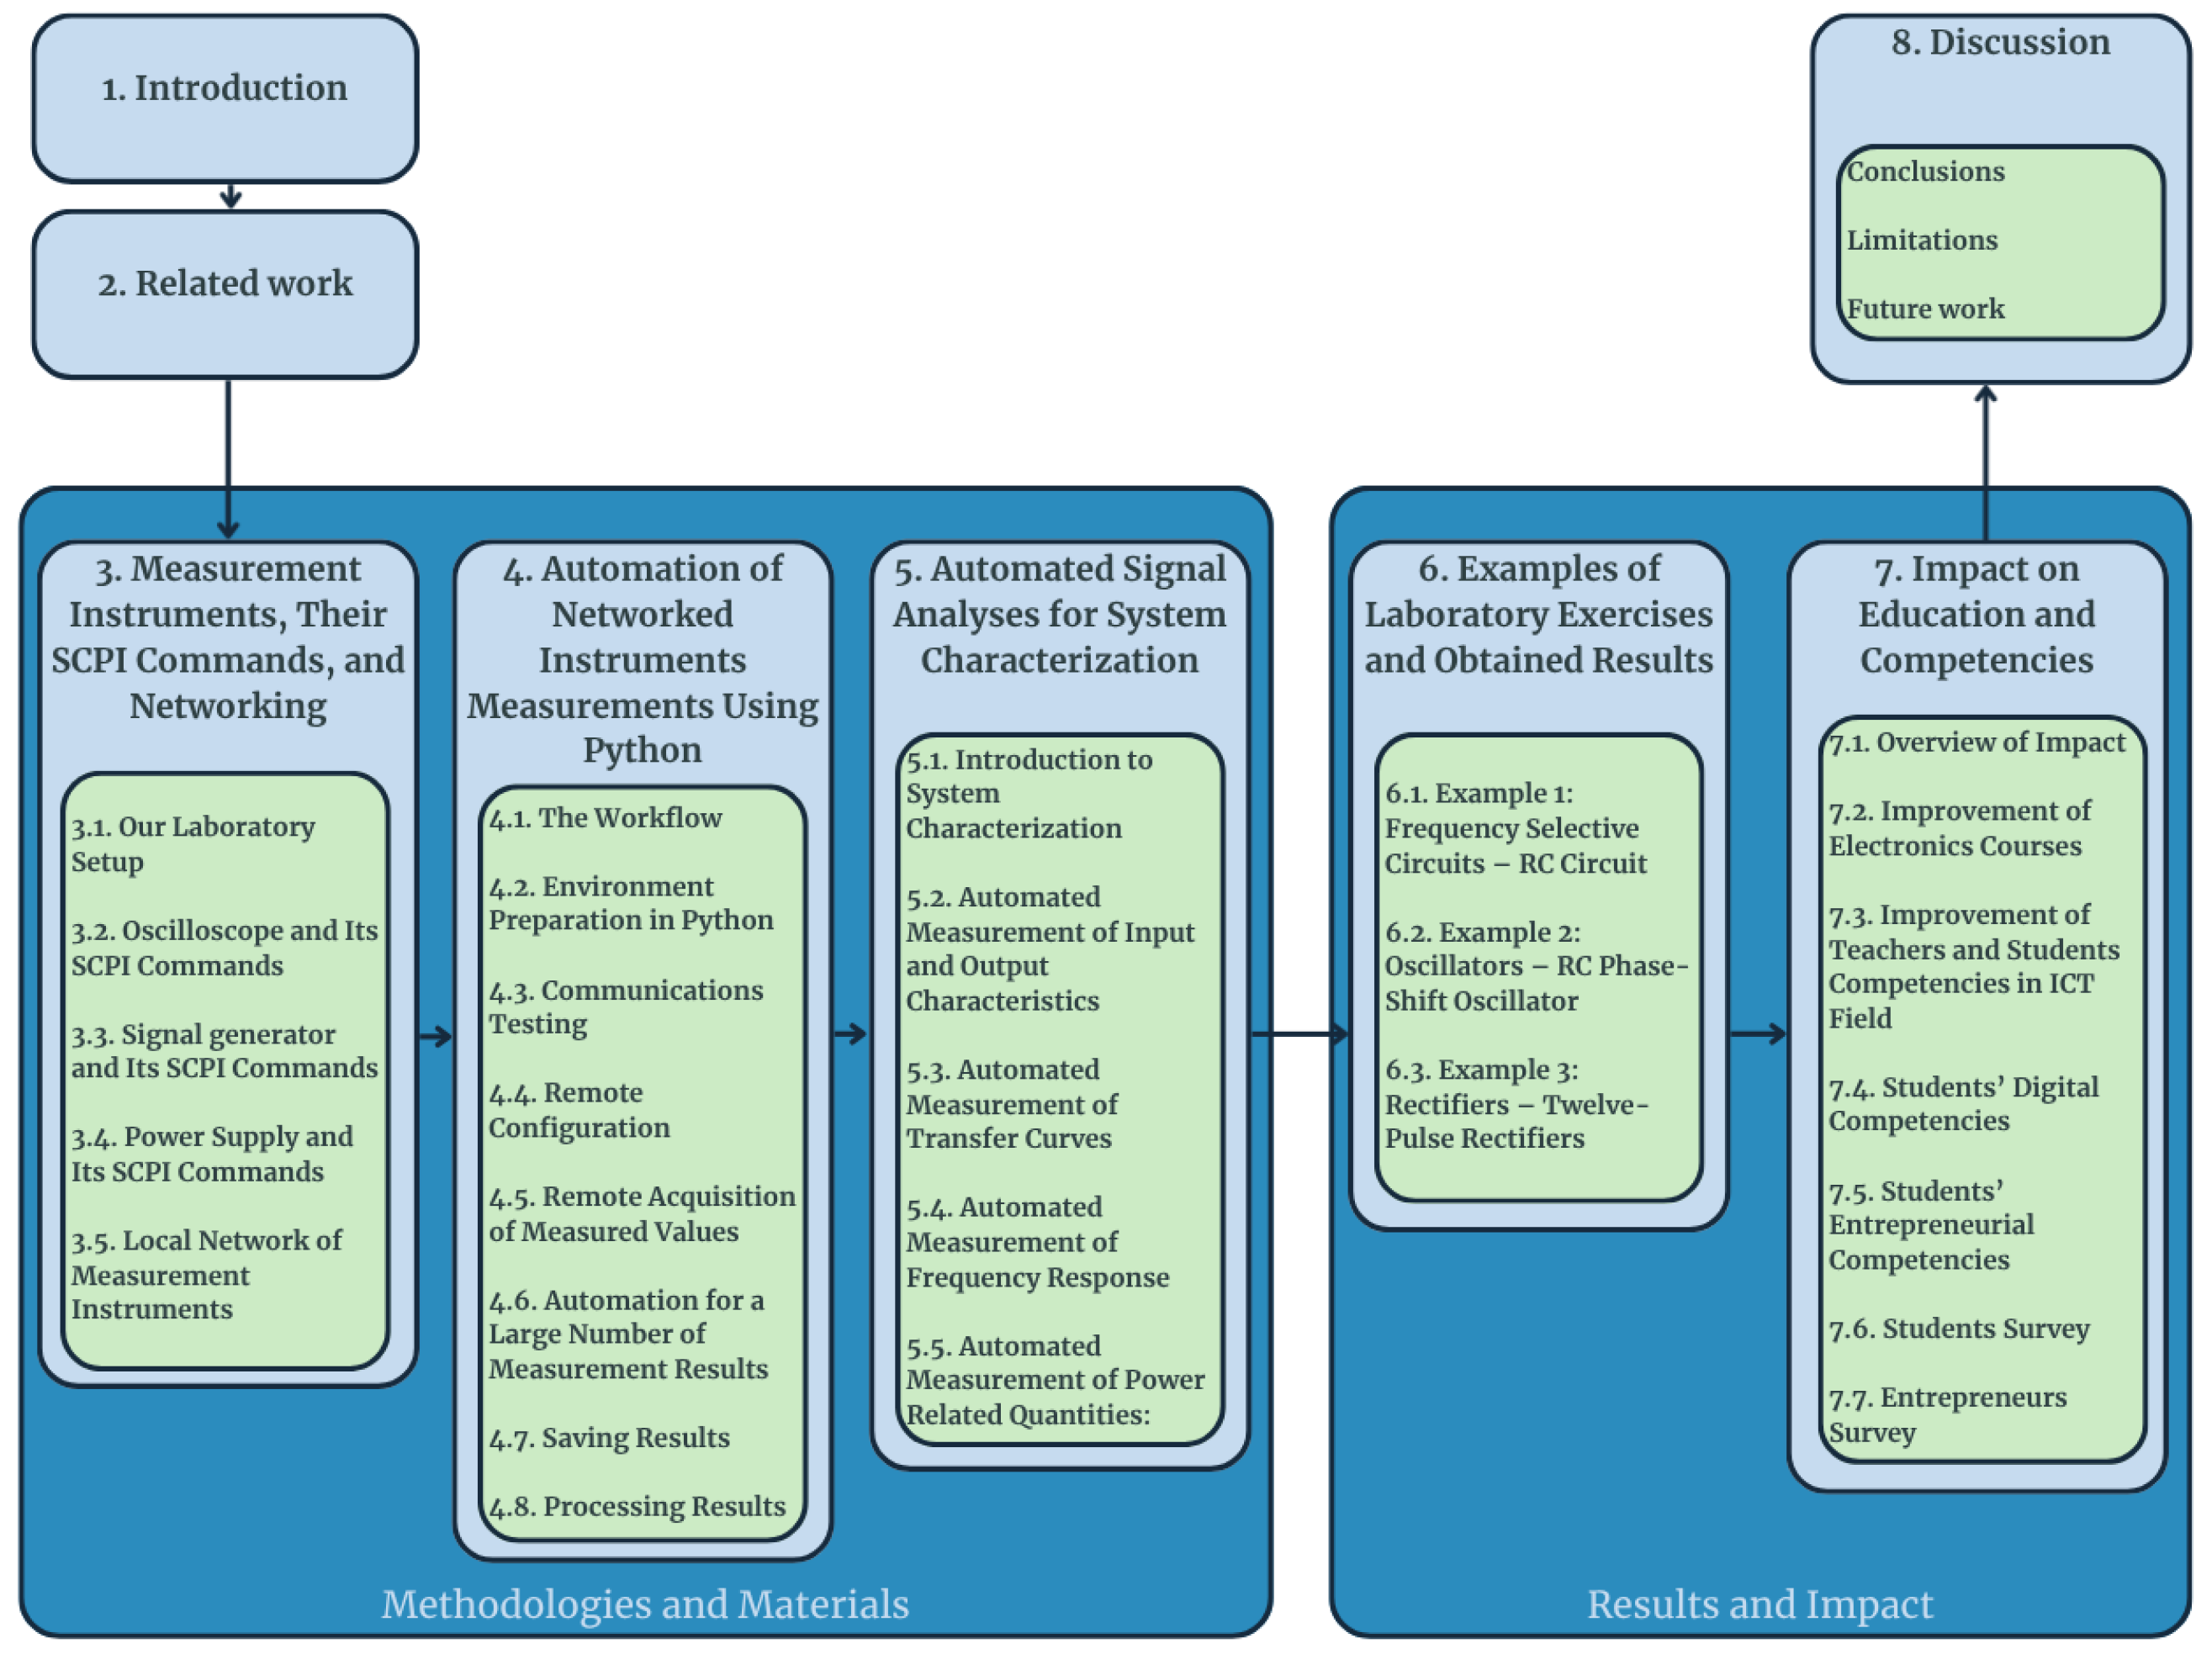
Figure 1. Flowchart of the paper structure.
Information 16 01024 g001
Figure 2. Our laboratory setup with networked measurement instruments for electronics education.
Information 16 01024 g002
Figure 3. Signal generator settings using SCPI commands with oscilloscope display and signal generator value readout using SCPI commands.
Information 16 01024 g003
Figure 4. Schematic diagram of the laboratory LAN.
Information 16 01024 g004
Figure 5. Network configuration of the measurement instruments.
Information 16 01024 g005
Figure 8. Schematic of the first-order passive RC circuit.
Information 16 01024 g008
Figure 9. Measured responses of the RC circuit: (a) input/output, (b) amplitude, (c) phase.
Information 16 01024 g009
Figure 10. Schematic of the three-stage RC phase-shift oscillator.
Information 16 01024 g010
Figure 11. Oscilloscope measurements of progressive phase shifts: (a) TP-ps1, (b) TP-ps2, (c) TP-ps3.
Information 16 01024 g011
Figure 12. Schematic of twelve-pulse rectifier.
Information 16 01024 g012
Figure 13. Twelve-pulse rectifier results: (a) input current waveform, (b) spectrum, (c) input current THD vs. output current.
Information 16 01024 g013
Figure 14. Overview of the impact on education and competencies.
Information 16 01024 g014
Figure 15. Student ratings per question.
Information 16 01024 g015
Figure 16. Results of entrepreneurs survey.
Information 16 01024 g016
Table 1. Combined results of students survey – ratings, average, σ , and percentage of high ratings.
Question12345Average Rating σ % Rated 4–5
Q1033391114.650.6296.15
Q2000271294.830.38100.00
Q3069391024.520.7790.38
Q4332142874.330.9282.69
Q563942964.400.9788.46
Q6.1001839994.520.7088.46
Q6.2002745844.370.7682.69
Q6.339939964.380.9786.54
Q7061833994.440.8484.62
Q8331848844.330.9084.62
Q9302433964.400.8982.69
Q10033030934.370.8678.85
Overall 4.460.8087.18
Disclaimer/Publisher’s Note: The statements, opinions and data contained in all publications are solely those of the individual author(s) and contributor(s) and not of MDPI and/or the editor(s). MDPI and/or the editor(s) disclaim responsibility for any injury to people or property resulting from any ideas, methods, instructions or products referred to in the content.