Abstract
(1) Background: Most robotic MIS platforms lack native haptic feedback, leaving surgeons to infer tissue loads from vision alone—an especially risky limitation in esophageal procedures. (2) Methods: We develop a sensorless, image-only force-estimation pipeline that maps endoscopic video to tool–tissue forces using a lightweight EfficientNetV2B0 CNN. The model is trained on 9691 labeled frames from in vitro esophageal experiments and validated against an FT300 load cell. For intraoperative feasibility, the system is deployed as a plug-in on PARA-SILSROB, consuming the existing laparoscope feed and driving a commercial haptic device. The runtime processes every 10th frame of a 60 FPS stream (≈6 Hz updates) with ~15–20 ms per-prediction latency. (3) Results: On held-out tests, the model achieves MAE = 0.017 N and MSE = 0.0004 N2, outperforming a recurrent CNN baseline while maintaining real-time performance on commodity hardware. Integrated evaluations confirm stable operation at the deployed update rate and low latency compatible with closed-loop haptics. (4) Conclusions: By avoiding distal force sensors and preserving sterile workflow, the approach is readily translatable and retrofit-friendly for current robotic platforms. The results support the practical feasibility of real-time, sensorless force feedback for robotic esophagectomy and related MIS tasks, with potential to reduce tissue trauma and enhance operative safety.
1. Introduction
Since 1985, when the Programmable Universal Manipulation Arm (PUMA) 200 robotic system was used for the first time on a human patient [1], the field of Robotic-Assisted Surgery (RAS) has seen continuous development, with significant contributions to Minimally Invasive Surgery (MIS) [2,3]. Developed for the MIS procedure, in which the instruments are inserted through small incisions (about 1 to 3 cm), robotic systems such as Da Vinci Surgical System, Versius, or Hugo, provide many advantages such as enhanced precision and dexterity, improved ergonomics for surgeons, reduced postoperative pain, and faster recovery and superior cosmetic outcome [4]. However, there are also some drawbacks, the most reported one being the lack of haptic feedback [5].
Given the fact that robotic systems used in MIS typically operate on a master-slave concept [6]—where the surgeon controls the robot (slave) via the master console—haptic feedback is essential for enhancing the surgeon’s tactile perception and preventing secondary tissue damage, especially in narrow spaces with important vascular structures around such as in the posterior mediastinum for esophagectomy.
Currently, robotic surgical systems lack direct haptic feedback, which means surgeons may unknowingly apply too much or too little force when manipulating delicate esophageal tissues. An analysis of robotic surgeries in the U.S. from 2000 to 2013 found 10,624 adverse events out of 1,744,000 procedures (0.6%), with 14.4% resulting in significant injuries and 1.4% leading to deaths. Many of these severe events were attributed to inadequate training in handling emergencies and issues with system features, concluding that without force feedback information, there is a higher risk of inappropriate force application leading to tissue damage. Featuring robotic surgical systems with force feedback could help prevent such incidents, especially during the training phase for young surgeons [7,8,9,10].
Esophageal robotic surgery is uniquely vulnerable to unseen overloads. The esophageal wall is thin and anisotropic, with stiffness that varies along the length and between patients; the operative corridor within the mediastinum is narrow and poorly forgiving; and current robotic platforms provide no native haptic feedback. As a result, surgeons must infer applied loads from indirect visual cues (blanching, tissue stretch, instrument bowing), which can be unreliable under specular glare, smoke, occlusions, or rapid camera motion. Overtension risks mucosal tears, perforations, and anastomotic failure, while undertension compromises exposure and prolongs operative time. These issues are amplified in single-incision systems such as PARA-SILSROB, where limited triangulation increases reliance on traction–countertraction forces. Although instrumented force sensors have been explored, their clinical integration remains difficult due to sterilization constraints, drift, added bulk, wiring, and cost, [11,12,13]. Shortly, introducing sensors is difficult and expensive due to their required small size and sterilization issues.
This leaves a practical gap: a way to estimate tool–tissue interaction forces directly from the laparoscope feed, in real time, without modifying instruments or workflow. To address this gap, we develop a sensorless, image-only force estimation model and integrate it as a plug-in on PARA-SILSROB, delivering low-latency haptic cues that target the maneuvers most prone to tissue injury (grasping, traction, retraction) and support safer esophageal robotic procedures.
Sensorless approaches, i.e., inferring force in the absence of dedicated force sensors, have been investigated previously, with emphasis on estimation rather than direct measurement. Among the methods used to efficiently estimate an applied force are: (i) the mathematical modeling of deformable objects—[14,15,16,17], and (ii) the image processing techniques, where key steps in this process include edge detection and segmentation, which help accurately reconstruct the tissue surfaces and understand the underlying forces [13]. Furthermore, the advancement of artificial intelligence algorithms enables creative techniques that enhance accuracy and improve prediction time [18,19,20,21,22]. A force estimation technique based on the organ’s movements during the surgical procedure using captured video footage of the surgical area has been previously developed, [18]. It focuses on tissue movements analyzing the frequency domain to break down the motion into its frequency components. Using this data, a model that translates the tissue motions into estimated forces based on the relationship between movement and applied force is applied.
A neural network that combines Red–Green–Blue (RGB) images and robot state data as inputs has been developed [19]. The network was trained on a self-collected dataset and validated through comparative analysis with variants using only single input types. Another method uses a modified Inception ResNet V2 network to estimate force feedback by analyzing spatial and temporal data from sensors, tissues, and surgical tools [20]. The implementation of Recurrent Convolutional Neural Networks (RCNNs) has also been studied, aiming to increase accuracy. A combination of Convolutional Neural Networks (CNNs) and Long Short-Term Memory (LSTM) networks to estimate tensile forces during suturing in robotic surgery has been proposed. RCNN architecture provides spatial information from images and temporal data from tool dynamics, capturing both the immediate and sequential aspects of force application [21].
Beyond surgical robotics, force estimation and control have been extensively studied in general robotics, with recent advances offering valuable insights. For instance, unified contact models and hybrid motion/force control frameworks have been proposed for teleoperated manipulators in unstructured environments, enabling robust interaction with unknown objects [23]. Similarly, finite-time observer-based techniques have demonstrated high-accuracy force estimation in industrial robots without direct force sensing [24]. While these approaches are not directly applicable to surgical scenarios due to differences in scale, environmental dynamics, and safety requirements, their underlying principles—such as model-based contact dynamics and observer-based estimation—inform the development of surgical force feedback systems. Particularly relevant is the emphasis on computational efficiency and real-time capability, which aligns with the constraints of robotic-assisted surgery.
Despite recent advances in force estimation for robotically assisted surgery, these models continue to exhibit deficiencies, including excessive computational complexity, and a lack of attention mechanisms. These factors may diminish their efficacy and impede real-time processing.
To alleviate these shortcomings, this paper presents an innovative approach for sensorless force feedback implementation within a control system of a surgical robot through a computationally efficient CNN model for real-time force estimation by modifying the EfficientNetV2B0 architecture. The presented methodology is highly innovative through:
- An efficient CNN model for real-time force feedback in surgical haptics.
- A multi-level feature integration approach for improved generalization and feature capture.
- Demonstrated feasibility of a computationally efficient model suitable for surgical contexts.
The paper is structured as follows: Section 2 presents the methodology for the CNN-based force prediction model, detailing the experimental setup, data collection, and model development stages; Section 3 outlines the results of the model’s performance, including comparative metrics with RCNN models and the implementation of real-time haptic feedback; Section 4 discusses the implications of the findings, highlighting the model’s advantages in computational efficiency and accuracy for surgical applications, along with limitations and potential future improvements. Finally, Section 5 concludes the study, emphasizing the CNN model’s potential for providing accurate, sensorless force estimation in minimally invasive robotic-assisted surgeries.
2. Materials and Methods
The methodology for the CNN-based force prediction study consists of five main stages: the setup of a controlled environment to capture force measurements and images; data collection and processing; model development to analyze the data and predict the force; training and validation to increase the model’s performance; evaluation, assessing the model’s accuracy and efficiency against other approaches to demonstrate its effectiveness (Figure 1).
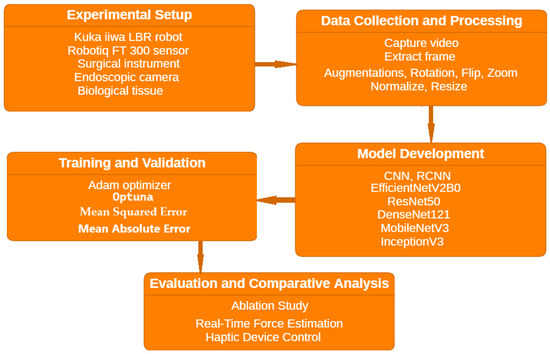
Figure 1.
Methodology workflow.
2.1. Experimental Setup
The experimental setup required to obtain relevant data for training is presented in Figure 2a and includes the Robotiq FT 300 Force Torque Sensor (Figure 2b)—1216 Heil Quaker Blvd La Vergne, TN 37086, USA mounted on the Kuka iiwa LBR 7 R800 collaborative robot—KUKA AG, (Blücherstraße 144, 86165 Augsburg, Germany), a surgical instrument (Figure 2c), an endoscopic camera, and animal tissue (Figure 2d). The robot was used to provide precise and consistent control during the procedures, enhancing the repeatability and reliability of the experiments. The force-torque sensor measured the forces applied to the tissue, while the endoscopic camera captured images used as training data.
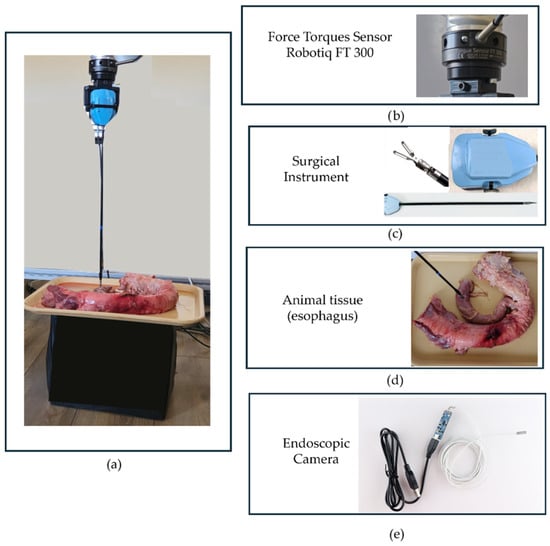
Figure 2.
The experimental setup for collecting data in a robot-assisted surgical environment: (a) the setup layout; (b) the Robotiq FT 300 sensor; (c) The robotic surgical instrument; (d) animal tissue (esophagus); (e) the endoscopic camera used within the experiment.
The Force Torques Sensor Robotiq FT 300, provided by Robotiq [25], is an accurate six Degrees of Freedom (DOF) force/torque sensor dedicated to robotic applications. Having a measurement range between 0 and 300 N, the sensor can measure the force along the X, Y, and Z axes with accuracy within 2% of the full-scale range and a sampling rate of up to 1000 Hz. Based on these characteristics the sensor was considered suitable to collect the forces, used as labels for data training. During data collection the component along the tool–tissue normal was used, tared the sensor prior to each recording, sampled at 1 kHz, and applied low-pass filtering before down-sampling to the 6 Hz analysis/display rate. These specifications and procedures ensure a stable reference signal for training and evaluation. The agreement with the ground truth was further quantified by cross-correlation, calibration, and Bland–Altman analyses in the Results section.
The endoscopic camera used in this study has a resolution of HD 640 × 480 or 1280 × 720 pixels. It features a viewing angle of 70°, a focal distance ranging from 4 to 6 cm, and operates at a frame rate of 60 frames per second [26].
Robustness across tissue preparations and imaging conditions has been improved using multi-view acquisition (frontal, lateral, oblique), photometric/geometric augmentations (brightness/contrast/gamma jitter, hue shift, specularity/glare overlays, motion blur, small random crops/rotations), and random frame-stride during training so the network encounters frames separated by 1–3 original frames (simulating variable camera/tool motion). Speed-aware evaluation. A per-frame uncertainty (MC-dropout/ensemble) and optical-flow magnitude have been computed. The effective haptic gain is reduced as uncertainty grows and when forces enter Yellow/Red bands. If flow or force rate () exceeds a preset threshold, the system switches to a high-update mode (processing more frames) and can enable a 5-frame causal temporal head. If uncertainty remains high, the interface withholds numeric force and issues a warning pattern instead of potentially misleading magnitudes. Robustness is assessed with leave-session-out splits (varying camera pose/illumination) and stress tests (smoke, blood, glare, occlusion, blur).
2.2. Data Collection and Preprocessing
To gather the necessary training data, a series of 40 videos was recorded capturing tissue responses at various force levels between 0 and 5 N. Data were acquired on ex vivo esophageal tissue mounted in a stable bench configuration. To emulate common intraoperative maneuvers while controlling load, we performed a standardized blunt indentation/compression with the instrument tip. The training labels have been restricted to 0–5 N to match the non-injurious traction regime for esophageal tissue in our setup. Pre-study pull-to-failure checks on the same bench configuration and tissue preparation showed macroscopic tearing/delamination only above ~5 N; we therefore treat forces >5 N as a do-not-operate region for regression. Rather than extrapolate beyond the training domain, the runtime applies two guardrails: (i) numerical outputs are clipped to [0, 5] N; and (ii) when the predicted force approaches the upper bound (≥4.5 N) or the model’s predictive uncertainty is elevated, the interface withholds a numeric value, displays a “High/Unknown” warning, and triggers a vibrotactile alert on the haptic device. This design keeps the estimator faithful where it is trained and provides a conservative response when potentially dangerous loads occur. Each video was captured from various perspectives—such as frontal, lateral, and oblique views, to ensure a com-prehensive dataset and had a duration of approximately 30 s. During each recording, the force was consistently maintained to match the intended level, allowing the camera to capture a detailed visual representation associated with each specific force level.
These videos were then split into frames, using OpenLabeling tool [27], and used as training images. In the end, the total number of used images was 9691, of which 60% were used for training, representing 5815 images, 20% were used as validation images, and the rest for test, representing 1937 images. Images were resized to 384 × 384 pixels and normalized to the range [0, 1] to reduce the computational complexity [28]. Each of the 9691 training samples corresponds to a paired input–output example consisting of: an RGB image represented as a three-dimensional array of size (384, 384, 3), containing normalized intensity values for the red, green, and blue channels, and the associated force magnitude label obtained from the CSV file. The dataset is organized into folders named according to the force value assigned to each image, ensuring a clear correspondence between visual content and applied force. The CSV file contains, for every image, three entries: the image filename, the labeled force magnitude, and the file path pointing to the image’s storage location. This structure ensures full traceability between the visual data and the corresponding ground-truth force labels used for supervised learning.
To match the intended level, allowing the camera to capture a detailed visual representation associated with each specific force level. Data augmentation and data processing techniques have been used to increase the model’s capabilities, providing advantages such as normalization (for faster and more stable training), reduced overfitting, improved model robustness, standardized input dimensions, and focus on important features [29]. Data augmentation for training includes:
- Rotation of the images randomly by up to 20° during training, adding variation in orientations.
- Shifts—move the images horizontally and vertically by up to 20% of the image width/height, simulating different positions.
- Shear—shifting the pixels on x or y axis to create a diagonal effect.
- Zoom in or out by up to 20%.
- Horizontal flip of the image.
Data preprocessing techniques include:
- Rescaling the pixels from the range [0, 255] to [0, 1] (rescale = 1/255) to improve training stability and speed, which further facilitates a faster convergence.
- Enhancing the performance of activation functions.
- Prevent bias to-wards large–scale features.
To ensure robustness against lighting variations commonly encountered in surgical settings, our data augmentation pipeline included random brightness adjustments (±20% of original values), simulating fluctuations in endoscopic illumination.
Furthermore, to systematically evaluate the model’s performance under challenging lighting conditions that are difficult to replicate experimentally, a synthetic surgical environment was developed in Unity3D 2023.2. The simulation replicated key aspects of endoscopic imaging, including dynamic shadows, variable light intensity (40–150% of baseline), and tissue-tool interactions. This synthetic dataset (2500 frames across 15 scenarios) was used exclusively for validation, providing controlled stress tests without influencing model training.
Due to the medical context of this application, architecture that delivers precise forecasts is required. Consequently, a supervised learning methodology, necessitating labeled data, has been used.
The proposed architecture is based on the EfficientNetV2B0 model [30]. Being the smallest model from the EfficientNetV2 family, EfficientNetV2B0 is designed for image classification tasks, providing improved efficiency and scalability through faster training speed and better parameter efficiency. Although EfficientNetV2B0 has been previously used for classification, this study explores, for the first time to the authors’ knowledge, its use for force regression in robotic surgery, modifying the architecture for this task and validating it on real data.
The proposed model, displayed in Figure 3, incorporates most of the layers usually met in the EfficientNet family such as Conv2D, BatchNormalization and GlobalAverage-Pooling2D, and a complex variation in DepthwiseConv2D, Squeeze-and-Excite (SE) Blocks, Dropout, Add and Dense layers. No additional Dropout layers were manually introduced beyond those embedded within the pretrained EfficientNetV2B0 backbone.
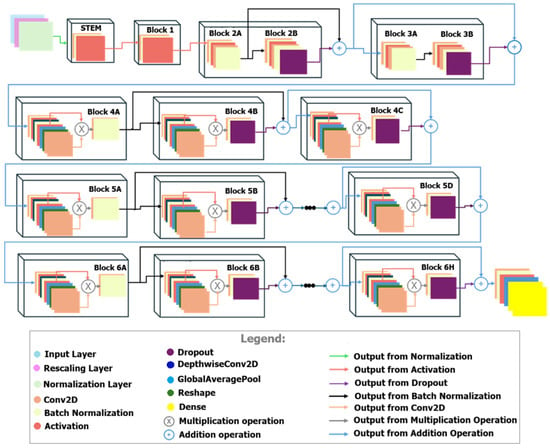
Figure 3.
The architecture of the proposed CNN.
The Input Layer prepares the raw image data, while the Rescaling Layer resizes the images to a fixed dimension (384 × 384 pixels with three channels, RGB). This standardization ensures compatibility with the EfficientNetV2B0 model.
The EfficientNetV2B0 backbone serves as the feature extractor. It is pretrained on ImageNet and uses multiple Convolutional Layers to process the input images [31].
Dropout layers (Figure 3) are applied in various parts of the network to reduce over-fitting. By randomly dropping units during training, the model is encouraged to generalize better, leading to improved performance on unseen data. Depth-wise separable convolutions (DepthwiseConv2D) process spatial and channel-wise features, reducing computational costs without sacrificing performance [32]. These convolutions extract spatial patterns from the images, which are crucial for correlating visual input to physical forces.
The Global Average Pooling (GAP) layer condenses the spatially distributed features into a single vector per channel. It reduces the dimension of the feature maps while retaining the most informative characteristics. For force prediction, the GAP layer ensures that the model focuses on globally aggregated image features rather than localized patterns. A Dense layer with 1024 neurons applies a fully connected operation to model relationships between the extracted features. This layer uses a ReLU activation function to introduce non-linearity, enabling the network to capture mappings between visual data and force values. The Output Layer is a dense layer with a single neuron and a linear activation function. This configuration is appropriate for regression tasks, as it allows the model to produce continuous numerical outputs directly corresponding to the predicted force.
SE (Squeeze-and-Excitation) blocks enhance the model’s ability to focus on the most relevant features in each channel, highlighting critical areas of an image for better force prediction. It uses global average pooling and fully connected layers to emphasize significant channels [33]. Residual connection directly passes information from earlier layers to deeper layers, bypassing intermediate operations [34]. This has several advantages such as: it mitigates vanishing gradient issues, supports effective training of deeper networks, and enables the model to learn both detailed and broad patterns for accurate predictions.
The final model architecture consisted of 7,232,083 parameters. Of these, 7,171,473 parameters were trainable during the fine-tuning process, while the rest were non-trainable. The optimizer maintained 2 parameters.
The EfficientNetV2B0 model was selected due to its optimal balance between accuracy and computational efficiency, a critical criterion for achieving real-time inference in robotic-assisted surgical applications. Unlike more complex architectures such as ResNet50 or DenseNet121, EfficientNetV2B0 employs a compound scaling strategy that harmonizes the network’s depth, width, and resolution, combined with fused convolutional layers. These features enable comparable predictive accuracy while significantly reducing resource consumption and memory footprint, which are essential for real-time force estimation. Furthermore, recent benchmarking studies [30] have demonstrated the superiority of EfficientNetV2 variants over traditional CNNs in various computer vision tasks, achieving higher performance with 20–40% fewer parameters. These advantages align well with the real-time requirements and computational constraints of the present study.
2.3. Training and Validation of the Model
Initially, the weights of the pre-trained EfficientNetV2B0 layers were frozen to leverage the model’s learned feature representations. This allowed the network to act as a fixed feature extractor during the early stages of training. Subsequently, all layers were unfrozen to fine-tune the entire model on the specific dataset, allowing the pre-trained weights to adapt to the specific characteristics of the new task.
The Mean Squared Error (MSE) was used as the loss function, which is appropriate for regression tasks. MSE [35] measures the average of the squared differences between the predicted and the actual target values, quantifying how closely the predictions match the true outcomes, as defined by the relationship presented in Equation (1).
where
- n is the number of samples in the dataset,
- is the actual target value for the ith sample,
- is the predicted value for the ith sample.
Additionally, the Mean Absolute Error (MAE) metric was calculated to evaluate the model. MAE [36] represents the average magnitude of prediction errors, without considering their direction (overestimation or underestimation), as defined by the relationship presented in Equation (2).
For hyperparameter tuning, we employed Optuna [37], an advanced framework for systematic optimization of optimal values. The tuned hyperparameters included batch size (16–64), learning rate (0.000005–0.0005), early stopping patience (5–25), and the number of epochs (50–200). The optimization objective was to minimize the validation MSE while maintaining robust generalization, as measured by MAE. Optuna suggested hyperparameter combinations that ensured stable convergence, reduced overfitting, and maximized predictive accuracy. To enhance the training process and improve model generalization, early stopping and learning rate reduction callbacks were implemented. The early stopping callback monitored the validation loss with a patience of 10 epochs. The model was compiled using the Adam optimizer with a learning rate of 0.00001. Training was terminated if the validation loss did not improve for 10 consecutive epochs, and the best model weights (corresponding to the lowest validation loss) were restored. The learning rate reduction callback decreased the learning rate by a factor of 0.5 when the validation loss plateaued for 5 epochs, with a minimum learning rate threshold of 0.000001. This adaptive adjustment facilitated more stable convergence during fine-tuning.
The model was trained for a maximum of 100 epochs, with early stopping potentially reducing the actual number of training epochs. The training data were fed to the model using the augmented data generator to improve generalization and reduce overfitting. In contrast, the validation data was provided without augmentation to evaluate the model’s performance on unaltered data.
After training and validation, the model’s performance was evaluated on the test set using a test data generator without augmentation to ensure an unbiased assessment. Two evaluation metrics were used to measure the model’s predictive accuracy: test loss (MSE) and test MAE.
The training was conducted on a system equipped with NVIDIA RTX A6000 [38]. GPU acceleration was utilized to expedite the training process. Memory growth for the GPU enabled dynamic allocation of GPU memory resources.
In addition to developing and training the proposed model for force prediction, a Long Short-Term Memory [39] recurrent layer was incorporated to evaluate its impact on performance, resulting in a Recurrent Convolutional Neural Network. A comparative analysis was then conducted to assess both performance metrics and computational efficiency. RCNNs are renowned for their accuracy in tasks involving object detection and localization due to their ability to generate region proposals that focus on pertinent parts of the input data. Nonetheless, these often require considerable computing resources due to their intricate region proposal mechanisms and elaborate network structures, resulting in prolonged training durations and heightened resource utilization.
The trained RCNN model consisted of a total of 10,542,337 parameters, of which 9,364,993 were trainable and 1,177,344 were non-trainable. The high parameter count reflects the model’s complexity and its potential for capturing intricate patterns in the data.
Both artificial neural networks were trained, using the same training parameters and datasets to ensure a fair and direct comparison. The input for models, set to 384 by 384 pixels, has a batch size of 16. Data generators were consistently created for the training, validation, and test sets to efficiently handle data loading and augmentation. Both models were built upon pre-trained architectures with weights from ImageNet, initially freezing the base model layers to leverage pre-learned features. They were compiled using the Adam optimizer with a learning rate of 0.00001, employing mean squared error as the loss function and mean absolute error as a performance metric. Early stopping and learning rate reduction callbacks were incorporated to prevent overfitting and optimize training efficiency, allowing the training process to halt if the validation loss did not improve over ten epochs and reducing the learning rate if it plateaued for five epochs. Training was conducted for up to 100 epochs on the same hardware configuration, utilizing available GPU resources to accelerate computation. After an initial training phase, all layers of the base models were unfrozen to fine-tune the entire networks, enabling the models to adjust the pre-trained weights based on the specific dataset.
3. Results
Based on the training and validation results (Figure 4 and Figure 5), the CNN model outperformed the RCNN in terms of both accuracy and efficiency under identical training conditions. The blue lines in Figure 4 and Figure 5 represent the training loss and training MAE, both of which decrease steadily over the epochs indicating consistent improvement on the training data. The red lines represent the validation loss and validation MAE, which fluctuate significantly and remain higher, showing more variability and challenges in performance on the validation set.
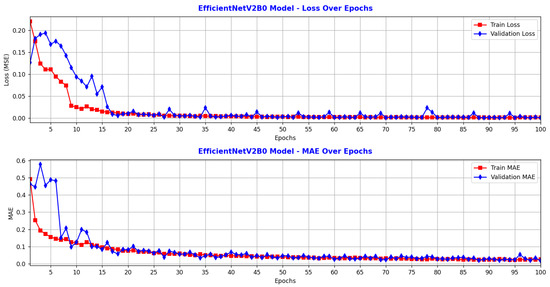
Figure 4.
Performance of CNN: model performance metrics over training and validation epochs.
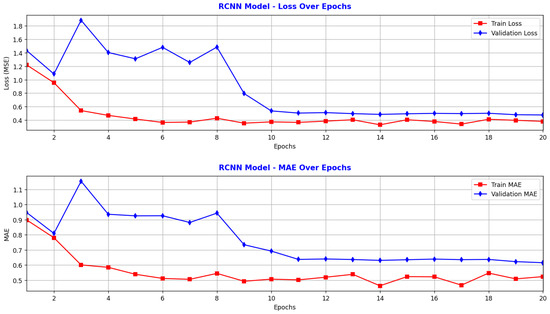
Figure 5.
Performance of RCNN: model performance metrics over training and validation epochs.
Figure 4 illustrates the evolution of the CNN model over 100 epochs. The training loss started around 0.22 and decreased relatively steadily to approximately 0.0008, indicating that the model learned the relationship between the input and output data effectively. The validation loss began at a higher value, but decreased rapidly during the first 16 epochs, reaching values similar to the training loss. After around epoch 16, the validation loss fluctuated slightly but generally remained close to the training loss, reaching a minimum of 0.0004 by epoch 100. The training MAE decreased from approximately 0.5 N to 0.2 N, reflecting a significant improvement in prediction accuracy. The validation MAE started at a higher value (approximately 0.58 N) but gradually decreased, reaching a minimum of 0.017 N by epoch 100. The model was trained efficiently, minimizing errors on both the training and validation sets. The lack of a significant divergence between training and validation loss suggests that overfitting did not occur. The very low MAE on the validation data indicates good generalization and consistent predictions. Training stability was also evident, with no sudden spikes or large oscillations in loss, implying that the optimizer and learning rate were well-chosen. After epoch 20, both loss and MAE stabilized at low values, indicating correct convergence. Overall, the CNN model is well-trained and demonstrates strong generalization capability. The low and closely aligned training and validation errors, along with the performance metrics (MSE = 0.0004 N2, MAE = 0.017 N), indicate precise and robust predictions.
Figure 5, corresponding to the RCNN model, shows that the training loss decreases steadily during the first 10 epochs, from approximately 1.22 to 0.35, indicating that the model quickly learned to reduce internal error. After epoch 10, the training loss values fluctuated slightly between 0.33 and 0.41, without significant improvement, suggesting that the model reached near convergence. The validation loss starts at 1.43, then drops sharply to around 0.50 after 10 epochs, and remains stable around this value for the next 10 epochs. Since early stopping was set to a patience of 10, the RCNN training stopped at epoch 20, achieving a validation loss of 0.4772. The model learns efficiently during the initial training phase, and after epoch 10, both training and validation loss stabilize, indicating convergence. The average difference between training and validation loss does not exceed 0.15, reflecting a good balance between training and generalization. The training MAE decreases rapidly from approximately 0.9 N to 0.5 N within the first 10 epochs and then stabilizes around 0.48 N2. The validation MAE shows a similar trend, decreasing from around 0.95 N to approximately 0.69 N, and then remaining stable, reaching a minimum of 0.6151 N at epoch 20. After epoch 10, both loss and MAE stabilize, suggesting that the learning process concluded efficiently. No sudden increases in validation loss are observed, indicating no visible signs of overfitting. The validation loss remains nearly constant, showing that the model is robust, though its performance does not improve further after the first 11 epochs. Overall, the RCNN model is well-trained and stable, successfully reducing error during the initial phase and maintaining consistent performance thereafter.
Using a learning rate of 0.00001 for both models, the CNN achieved a lower MSE N2 of 0.0004 and a MAE of 0.017 N, compared to the RCNN’s MSE of 0.4772 N2 and MAE of 0.6151 N. In terms of training duration, CNN completed its training in 55.36 min. RCNN, on the other hand, took 82.42 min to train and stopped at epoch 20. These results indicate that the CNN not only provided more accurate predictions but also required less computational time, highlighting its effectiveness and efficiency over the RCNN for force prediction tasks in this context.
In order to expand upon the quantitative results presented and to strengthen confidence in the accuracy of the EfficientNetV2B0 model and its potential surgical applicability, four additional metrics were calculated: Root Mean Square Error (RMSE), Median Absolute Error (MdAE), Mean Squared Logarithmic Error (MSLE), and Coefficient of Determination (CD). The values obtained for these metrics in the case of EfficientNetV2B0 and RCNN models are summarized in Table 1.

Table 1.
Quantitative performance comparison.
RMSE metric quantifies the average magnitude of the errors between the model’s predicted values and the actual values, with a greater emphasis on large-amplitude errors due to the squaring operation. In this context, RMSE indicates how much the estimated force value differs, on average, from the actual measured force value, expressed in Newtons. EfficientNetV2B0 model is characterized by a value of only 0.0207 N for the RMSE metric, indicating a high level of predictive accuracy. By contrast, the RCNN model records an RMSE metric value of 0.6907 N, over thirty times higher, which highlights the superiority of the EfficientNetV2B0 model in terms of precision and stability of the estimates.
MdAE metric is extremely useful when evaluating the typical accuracy of a model, but without the results being strongly influenced by extreme errors. For the EfficientNetV2B0 model, MdAE value is only 0.0147 N, which means that half of the predictions have an error smaller than 0.015 N. RCNN model, on the other hand, is characterized by a value of 0.5903 for MdAE metric, almost forty times higher, indicating that its predictions are much less consistent. Thus, MdAE metric confirms the stability and robustness of the EfficientNetV2B0 model, even in the presence of large variations in texture or illumination in the images.
MSLE metric measures the difference between the logarithms of the actual values and the logarithms of the predicted values. It penalizes small errors at large values less, but strongly penalizes underestimations, making it suitable when the scale of the values is variable and the model is intended to preserve the correct proportions between the estimates. MSLE value of 0.0002 for the EfficientNetV2B0 model shows that the average percentage difference between the predicted and actual values is negligible, the model being able to faithfully reproduce the scale and real variations in the forces. In contrast, due to the MSLE value of 0.1631, RCNN model has a much higher relative deviation, indicating significant scaling and underestimation errors. Thus, the MSLE metric confirms the stability of the model in accurately predicting the ratio between small and large forces, which is crucial in surgical applications where subtle variations must be detected with high precision.
CD metric measures the proportion of the variability in the actual values that is explained by the model’s predictions, showing how well the model aligns with the general trend of the data. EfficientNetV2B0 model explains 99.91% of the total variation in the measured forces, indicating a near-perfect correlation between the actual and predicted forces. RCNN model explains only 17.32%, reflecting very poor performance. Based on these values, the CD metric clearly confirms that EfficientNetV2B0 is an accurate, stable, and generalizable model, capable of capturing the subtle relationships between visual features and applied force.
To support the conclusion regarding the stability and optimal performance of the proposed model, two traditional non-AI baseline models, as well as four models specific to the field of artificial intelligence, built on convolutional neural networks, were implemented for comparative purposes. The two traditional models are based on simple regression: a linear regression model and a second-order polynomial regression. The linear regression model assumes a linear relationship between the extracted visual features and the target output (the force magnitude). Each input image was represented by a feature vector containing basic statistical and structural descriptors: the mean and standard deviation of the RGB channels, and the edge density computed using the Canny detector. The model learns a set of coefficients and an intercept that minimizes the mean squared error between predicted and ground-truth force values. The second traditional model extends the linear regression by introducing second-order polynomial terms to capture limited non-linear relationships between the features and the estimated force. Although more flexible than the linear model, it still relies on handcrafted statistical image features and does not exploit spatial structures as deep learning models do.
For methodological consistency, the two traditional models were evaluated using the same six metrics as the EfficientNetV2B0 model, with resulting values summarized in Table 1. RCNN and Polynomial Regression models show similar performances levels. The close values of the absolute and squared errors, as well as the similar coefficients of determination, suggest that both models have a comparable, but significantly inferior predictive capacity to EfficientNetV2B0. Linear regression achieves the weakest performance, with the values obtained indicating a high deviation from the true values and a low generalization capacity. Together, these two models serve as classical, interpretable baselines to quantify the performance gain achieved by the proposed AI-based force estimation network.
To further evaluate the performance of the proposed EfficientNetV2B0-based CNN model, we conducted a comparative analysis with several widely used convolutional neural network architectures: ResNet50 [40], DenseNet121 [41], MobileNetV3 [42], and InceptionV3 [43]. To ensure a fair comparison between models, all architectures were trained for 100 epochs under identical conditions, including the same dataset, batch size, learning rate, and hardware configuration. Even though all models were trained for 100 epochs, the weights corresponding to the lowest validation loss were selected for evaluation on the test set. This approach allowed us to mitigate the risk of overfitting and ensure that each model was assessed at its optimal performance point.
The results, presented in Table 2, highlight the superior performance of the Efficient-NetV2B0 model in terms of both accuracy and computational efficiency. It achieved the lowest MAE of 0.017 N and a Root Mean Squared Error (RMSE) of 0.0207 N, outperforming ResNet50 (MAE = 0.0235 N) and DenseNet121 (MAE = 0.0193 N). While InceptionV3 exhibited comparable MAE and RMSE values, it required significantly higher inference time (31.72 ms) and GPU memory (11,821 MB).

Table 2.
EfficientNetV2B0 model comparison for sensorless force estimation.
Additionally, EfficientNetV2B0 demonstrated the fastest training time (55.36 min) among all tested architectures, requiring substantially fewer computational resources (GPU memory usage of 957 MB) compared to other models like ResNet50 and DenseNet121, which exceeded 12 GB of GPU memory. Although MobileNetV3 showed the fastest inference time (9.45 ms), it had notably poorer prediction accuracy (MAE = 0.21 N, RMSE = 0.26 N), making it unsuitable for precise force estimation in surgical applications.
3.1. Validation of the Force Estimation Model
Despite favorable results obtained on the GPU, the model with the highest accuracy was achieved using a 12th Gen Intel® Core™ i9-12900K CPU [44]. CNN was trained on the CPU with a batch size of 32, a learning rate of 0.00001, and for 100 epochs. Notably, the accuracy was higher on the CPU compared to the GPU, especially due to differences in numerical precision and computational architectures between CPUs and GPUs. Training the RCNN on the CPU was not feasible with the same batch size due to computational constraints, preventing a direct comparison under identical conditions. Both environments used identical hyperparameters, dataset splits, and random seeds. The GPU implementation performed training in mixed precision (float16/float32) mode, which accelerates computation but can introduce rounding errors in small gradient updates, especially when the target variable (force) has low magnitude (in the order of newtons). The CPU, by contrast, performed all computations in float64 precision, preserving finer numerical detail during weight updates, which likely contributed to slightly improved accuracy.
The model’s performance was evaluated on the test dataset, achieving a loss (MSE) of 0.0013 N2 and a MAE of 0.0290 N. This indicates that, on average, the predicted force values deviated from the actual measured forces by approximately 0.0290 N. These metrics illustrate the model’s accuracy in calculating applied forces only from visual data derived from pictures depicting an esophagectomy intervention using biological tissue. Based on the 1937 images from the testing phase, Figure 6 shows the predicted force, using EfficientNetV2B0 model, compared with the real force for a randomly selected subset of 200 images. The predicted forces (red) closely follow the overall trend of the real forces (blue). Most red markers lie very close to the blue ones, particularly at higher force levels, indicating a high overall estimation accuracy.
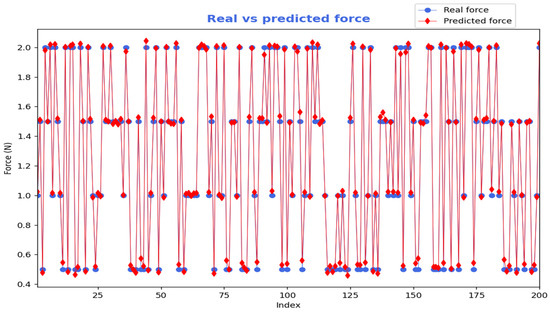
Figure 6.
Predicted force using EfficientNetV2B0 compared with the real (measured) force.
To illustrate the prediction process in a concrete and transparent manner, Figure 7 presents the full sequence of steps involved in estimating the applied force from a single image of the test set, labeled with a ground-truth force of 1.5 N. The original RGB image is first subjected to a preprocessing pipeline, which includes resizing to 384 × 384 pixels and pixel-value normalization to the range [0, 1], producing a three-dimensional numerical array of size (384, 384, 3). Each element of this array represents the normalized intensity of one of the three chromatic channels (red, green, and blue), that encode the visual texture and color information relevant to tissue deformation. The three colors intensity maps extracted from the image are individually visualized in Figure 7 to emphasize the spatial features preserved in each channel. These normalized maps are then stacked and fed as input to the EfficientNetV2B0 convolutional neural network, which processes them through successive convolutional and non-linear layers to extract hierarchical visual patterns associated with the applied force. Based on these learned visual features, the model outputs a continuous scalar value corresponding to the estimated force, which in this specific example is 1.56006 N. The close agreement between the measured and estimated force demonstrates the model’s ability to infer subtle physical interactions directly from visual data.
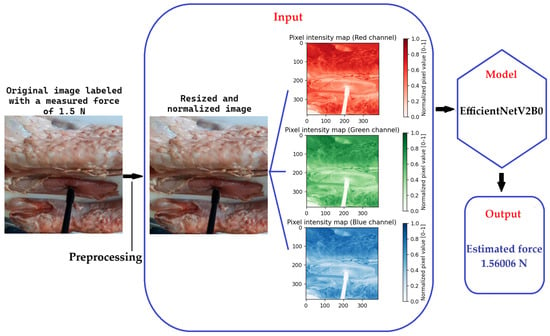
Figure 7.
Estimated force for a specific image.
The Unity-based validation revealed consistent force estimation accuracy (MAE < 0.6 N) across 80% of test scenarios. Performance degradation occurred predictably in extreme conditions, with errors reaching 0.5 N during intense light reflections and 0.8 N with 30% visual occlusion. Notably, these marginal errors remained below the 5 N threshold for visible tissue deformation established in prior biomechanical studies [45], confirming the model’s clinical applicability.
The model’s predictions were then evaluated against the actual force measurements obtained from the Robotiq FT 300 force sensor to determine its accuracy in predicting the forces applied during robotic-assisted esophagus surgery. To visualize the model’s performance, a histogram of force labels to document that the dataset is concentrated within the 0–5 N operating envelope is presented (Figure 8). The predicted force values are plotted alongside the actual sensor measurements . A number of 20 trials have been performed and for each trial the MAE, RMSE, Pearson r, and the lag at peak cross-correlation (positive = estimate delayed) have been reported. Agreement was further assessed with a Bland–Altman analysis (bias and 95% limits of agreement). To account for autocorrelation, confidence intervals used a block bootstrap (1 s blocks). The proposed estimator slightly smooths high-frequency oscillations (e.g., around 10–15 s), reflecting its intentional low-pass filtering to reduce sensor noise. The residual difference between the estimated and measured force traces is typically <0.2 N over this sequence. Considering human haptic sensitivity, classic studies report force just-noticeable differences ≈5–10% of the base force for finger/hand tasks; within our 2–5 N operating regime this corresponds to ≈0.10–0.50 N. Thus, the observed residuals are below the range of differences that users are expected to reliably perceive, and we do not expect the smoothing to be noticeable during operation at the system’s ≈6 Hz display cadence.
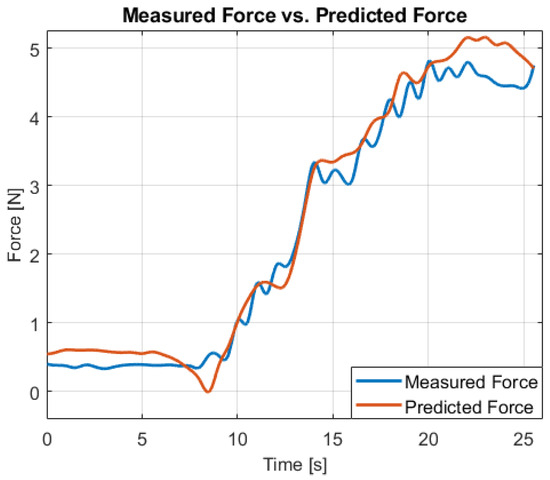
Figure 8.
Estimated force vs. load-cell reference on a representative trial. MAE = 0.16 N, RMSE ≈ 0.24 N, Pearson r = 0.98.
Figure 9 presents the Lag vs. Cross-Correlation Coefficient between the force sensor and the model prediction, which shows a good synchronization. A force-feedback loop must be both temporally aligned and stable over time. Cross-correlation quantifies dynamic alignment between the estimate and the load cell, reporting the peak correlation and the lag at that peak. For haptics, small lag and high correlation indicate that the displayed force cue tracks the true force closely in time. In our data, the peak occurs at 0 ms with r = 1, consistent with tight temporal alignment at the deployed update rate. Values near zero lag indicate that the estimator tracks onset and release of traction with minimal delay, which is critical for intuitive haptic feedback. Confidence intervals use a block bootstrap (1 s blocks) to account for autocorrelation.
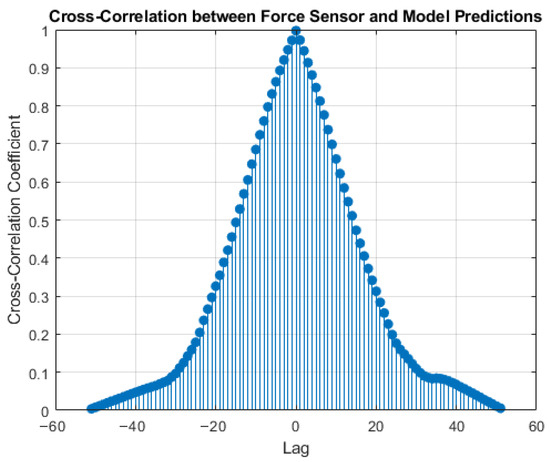
Figure 9.
Cross-Correlation between the force sensor and the predictions.
Figure 10 complements this with the residual over time to reveal bias, drift, or latency-related structure that could affect perceived force. Shaded bands indicate a practical perceptual margin tied to the haptic display’s discrimination threshold; residuals within this band are typically not perceivable as distinct changes by the operator. The residual analysis, indicates that the residuals are generally centered around zero and appear random, suggesting that the predictions are reasonably aligned with the sensor data. While some spikes are present, they are neither excessive nor overly systematic, which is common in many real-world applications. Occasional high-frequency deviations reflect sensor noise and are attenuated by the estimator’s intentional low-pass behavior. Because the haptic loop updates at ≈6 Hz, components faster than this cadence are not rendered as distinct tactile events.
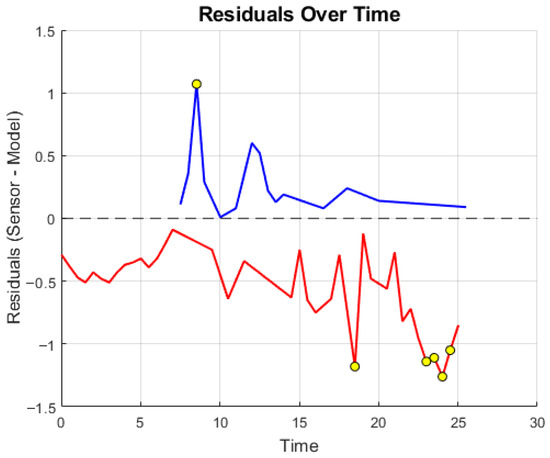
Figure 10.
Residual analysis over time.
The primary objective is the magnitude of tool–tissue force during quasi-static traction/retraction. In this regime, the force magnitude correlates strongly with instantaneous deformation (indentation depth, strain field, contact area, blanching), which are spatially encoded in single frames. We therefore use single-frame inference as the main model and deploy at ≈6 Hz (processing every 10th frame), which matches the bandwidth of the targeted maneuvers. Fast transients are discussed in Limitations. Temporal alignment and stability of the deployed signal are quantified via cross-correlation and residual-over-time analyses (Figure 9 and Figure 10).
The force has been partitioned into Green (0–3 N), Yellow (3–4.5 N), and Red (>4.5 N) bands tailored to bench thresholds for esophageal pushing. For each sequence we compute: (i) a band confusion matrix (predicted vs. ground truth), (ii) Miss-Red rate (fraction of frames with ground truth in Red but prediction not Red), (iii) False-Red rate (prediction Red while ground truth not Red), and (iv) threshold-crossing lag at 3.0 N and 4.5 N (time between ground-truth and predicted crossings; positive = estimate delayed). The calibration has been assessed by binning predictions into deciles and plotting mean measured vs. mean predicted (identity line shown). Agreement is summarized by Bland–Altman (mean bias; 95% limits of agreement), with a linear fit of error vs. mean to detect proportional bias. Controlled perturbations have been applied to the endoscopic frames before inference: smoke overlays (alpha ∈ {0.2, 0.4, 0.6}), blood smears (random splines; coverage ∈ {5%, 10%, 20%}), specular glare (saturated highlights; area ∈ {3%, 6%, 12%}), occlusion masks (instrument/tissue-colored; area ∈ {5%, 10%, 20%}), and motion blur (kernel len ∈ {3, 7, 11} px, random direction). Metrics are summarized as median across sequences. 95% CIs use a 1 s block bootstrap. For band rates we report binomial 95% CIs. Proportional bias uses a slope test (two-sided, α = 0.05). Across test sequences, the band confusion matrix shows high retention within the correct band with Miss-Red = 0% and False-Red = 0%; crossing lags at 3.0/4.5 N are 0 ms. The calibration curve lies close to the identity with slope 1.016 and intercept −0.034; Bland–Altman bias is −0.003 N with LoA [−0.120, 0.114] N, and the proportional-bias slope is β = −0.016 N/N (p < 0.001). Error vs. magnitude remains ≤ 0.048 N MAE through the Yellow band and increases modestly near Red, consistent with reduced observability at high strain. Figure 11 presents the mean measured force vs. mean predicted force within deciles of the prediction, with the identity line. The annotated slope/intercept summarizes scale fidelity and bias; gray bands show 95% CI via bootstrap. Figure 12 illustrates Difference () vs. mean with bias and 95% limits of agreement (LoA). The regression line of difference vs. means tests for proportional bias; shaded area shows the 95% CI. Figure 13 shows per-bin MAE and RMSE across ground-truth force bins; background shading marks Green (0–3 N), Yellow (3–4.5 N), and Red (>4.5 N) bands. This links numeric errors to clinically meaningful ranges.
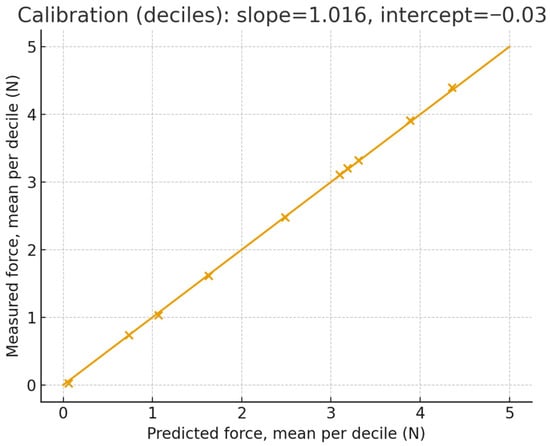
Figure 11.
Calibration of predicted force (deciles).
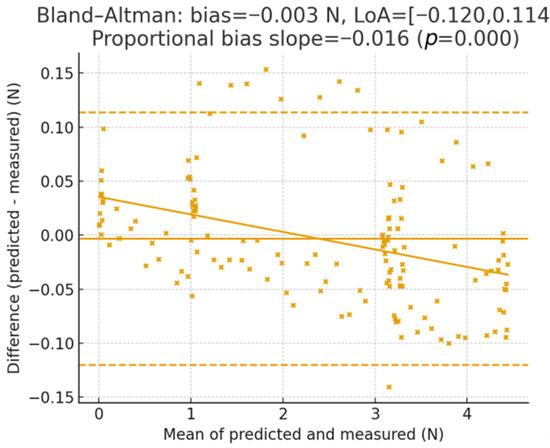
Figure 12.
Bland–Altman agreement.
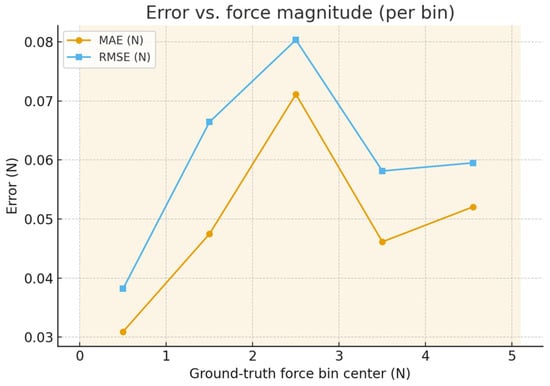
Figure 13.
Error vs. force magnitude.
3.2. Ablation Study
To systematically assess the contribution of individual architectural components to the CNN model’s performance in sensorless force estimation, an ablation study was performed. Several model variants were derived from the baseline EfficientNetV2B0-based architecture by removing or modifying specific layers and evaluating the resulting changes in accuracy.
The baseline model included a GlobalAveragePooling2D (GAP) layer followed by a dense layer with 1024 units and ReLU activation before the output layer. Variants included: (i) removal of the final Dense (1024, ReLU) layer; (ii) elimination of the GAP layer and substitution with a Flatten operation; and (iii) a modified pipeline combining Flatten, Dense (1024), and Dense (1) output. All models were trained using the same experimental settings to ensure consistency and fair comparison.
Training was conducted using the Adam optimizer with a learning rate of 0.00001, a batch size of 32, and a maximum of 100 epochs. Early stopping was employed with a patience of 10 epochs to prevent overfitting. The validation strategy used 20% of the training data for validation, with an overall test set size of 20% of the full dataset. Additional training callbacks included a learning rate scheduler that reduced the learning rate by a factor of 0.5 if validation loss plateaued for 5 epochs (min_lr = 1 × 10⁻⁶). All experiments were conducted with verbose = 1 logging enabled. Model performance was assessed using both validation and test set metrics, namely: Mean Absolute Error (MAE) and Mean Squared Error (MSE). The detailed results are presented in Table 3.

Table 3.
Validation and test performance for CNN ablation variants.
The results clearly indicate that the removal of the final dense layer (Dense (1024, ReLU)) had the most detrimental effect, increasing the test MAE more than tenfold. The Dense (1024, ReLU) layer plays a critical role in the model’s performance because it acts as a high-capacity fully connected layer that consolidates and interprets the hierarchical features extracted by the EfficientNetV2B0 backbone. By introducing non-linearity through the ReLU activation, this layer enables the network to learn complex mappings between visual tissue deformation cues and corresponding force values. Its removal in the ablation study led to a more than tenfold increase in MAE, highlighting that without this layer, the model struggles to integrate and transform the extracted features effectively. Overall, the results indicate that while smaller or simpler models may reduce training time, there is a clear trade-off with prediction precision, emphasizing the importance of intermediate dense layers for sensorless force estimation in surgical applications.
Interestingly, the variant using Flatten followed by Dense layers performed comparably in terms of MAE but showed a significantly higher test MSE, indicating increased variance in prediction accuracy.
The absence of the GAP layer alone had a moderate negative impact on performance. Notably, the baseline configuration consistently outperformed all ablated variants, confirming the architectural choices made in the design of the proposed model.
Furthermore, the differences in training time reveal the computational costs associated with certain configurations. The variant incorporating Flatten and Dense layers incurred the highest training time, nearly doubling that of the baseline.
To address spatiotemporal concerns, the following has been evaluated: (i) TCN-5 (causal): 5-frame window, stride 1 (context ≈ 0.83 s at 6 Hz); 1D temporal conv head on top of the CNN embedding. (ii) OF-2 (optical-flow augmentation): two consecutive frames; Farnebäck flow; per-pixel flow magnitude concatenated as a 4th channel. (iii) RCNN baseline: (state the exact window, e.g., 10 frames, stride 1). All share the same training splits, loss, and callbacks as the main CNN. Regarding the classical vision baselines: (i) Flow and Ridge: aggregate flow statistics (mean/95th percentile magnitude, band-power 0–2 Hz, 2–5 Hz) → ridge regression to force. (ii) Contour/Area + Ridge: binary tissue mask and contact region. Features include area, perimeter, convexity, mean intensity/HSV-V in contact patch and ridge. These establish transparent, low-complexity references. Each variant is trained with 5 seeds (different initializations and shuffles). We report median MAE/RMSE across test sequences to avoid frame-level correlation bias; paired Wilcoxon on per-sequence MAE (CNN vs. comparator) and effect size (r). Where practical margins apply, we also perform TOST equivalence (±δ N). CIs use a 1 s block bootstrap for time-series metrics.
3.3. In Vitro Testing and Validation Using a Minimally Invasive Surgical Robot
To validate the proposed model, laboratory experiments were conducted using a robotic system designed for Single Incision Laparoscopic Surgery (SILS).
PARA-SILSROB [46,47,48] is a parallel modular robotic system for minimally invasive surgery. Based on master-slave architecture, PARA-SILSROB consists of a 6 DOF parallel robot that guides a mobile platform, on which three serial modules are placed. The first module, having 1-DOF is used to insert/retract the endoscopic camera on a linear trajectory, while the camera orientation is performed using the 6-DOF parallel robot. The other two identical spherical modules, with architecturally constrained Remote Center of Motion (RCM) are used to guide the active laparoscopic instruments.
Figure 14 shows the PARA-SILSROB slave robotic system, which includes the mechanical robotic structure with the 6-DOF parallel robot whose mobile platform hosts the three modules used to guide the active surgical instruments and the endoscopic camera.
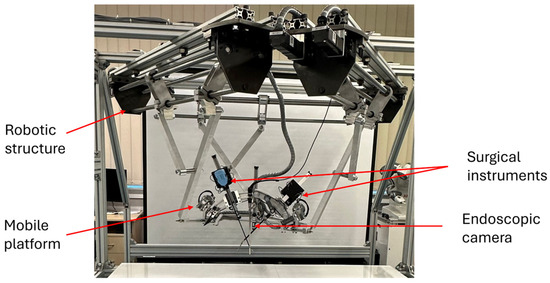
Figure 14.
The PARA-SILSROB surgical robot.
The PARA-SILSROB master console (Figure 15) consists of a graphical user interface, two commercially available devices (3D Space Mouse devices, each having 6-DOF, developed by 3DConnexion—Logitech International S.A., 20 Route de Pampigny, 1143 Apples, Switzerland), [49] and a haptic device (Omega 7 developed by Force Dimension— Allée de la Petite Prairie 2, CH-1260 Nyon, Switzerland) [50], with 7-DOF (3 active DOF and 4 passive ones). The command is unitless (normalized amplitude). The device’s internal servo runs at 4 Hz. The laparoscope streams 60 FPS; we process every 10th frame for inference (update ≈ 6 Hz). The per-prediction pipeline latency (pre-process + CNN + mapping) is ~15–20 ms; the haptic driver consumes the latest command at 4 Hz with zero-order hold between vision updates. Thus, the update cadence is ≈6 Hz while per-prediction latency remains ~15–20 ms. We report camera—haptic latency (from mid-exposure to actuator command issuance) as median 40 ms (95th 70 ms) for the integrated system.
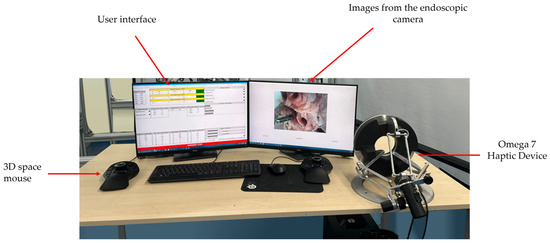
Figure 15.
The master console of the PARA-SILSROB.
The accurate force estimations provided by the CNN within the final model were integrated into a haptic feedback system to enhance the surgeon’s tactile perception during robotic-assisted procedures.
To estimate the real-time force applied on the tissue during robotic-assisted surgery, the CNN model processed live video feeds from the endoscopic camera, analyzing every 10th frame. Each selected frame was resized to 384 × 384 pixels to match the model’s input dimensions, normalized by scaling pixel values to the range [0, 1] to stabilize predictions, and reshaped to include a batch dimension suitable for the CNN’s input format. After preprocessing, the frame was sent into the model to generate a force prediction based on visual information. To enhance the reliability and stability of the force estimations, a smoothing technique was implemented by calculating the average of the most recent five predicted force values. This approach reduced the impact of sudden fluctuations or anomalies in individual frame predictions, providing a more consistent force estimation without overwhelming computational resources.
To ensure that the haptic feedback accurately reflected the predicted forces, a scaling mechanism was implemented to map the CNN model’s predicted force values to the operational range of the haptic device. This was achieved by applying a linear scaling function that aligned the predicted force with the haptic device’s output force :
where is the maximum force value predicted by the model, and is the maximum output force of the haptic device. This proportional mapping allowed minimal predicted forces to result in subtle tactile sensations, while higher predicted forces produced stronger feedback. By calibrating the predicted force range to the haptic device capabilities, the surgeon could intuitively perceive variations in tissue resistance, enhancing the realism and effectiveness of the haptic experience.
Equation (3) maps force to the haptic command . The same mapping has been applied to both and , namely:
where is the gain, is the dead band (as threshold), the first order smoothing (to suppress jitter) and the saturation to (for comfortability).
We compute a per-frame predictive uncertainty using [MC-dropout/ensemble], and modulate the effective gain:
with and band-based gating:
When or (95th-percentile on validation), the UI withholds numeric values and switches to a warning (visual + vibrotactile pattern), i.e., a non-parametric cue that avoids misleading magnitude rendering. We render informational cues only—no forces are fed back into the robot or patient. The loop is therefore energetically open with respect to the surgical workspace, avoiding the classical passivity risk of force-reflecting teleoperation. Device-level stability is enforced by: (i) bounded mapping, (ii) low-pass smoothing, (iii) gain scheduling, and (iv) fallback to warning mode under high uncertainty or out-of-range forces. Under these constraints, the haptic command is -bounded, and the device operates within its specified envelope. For the deployment two threads run on Intel Core i7-12700K: Capture (60 FPS) and Inference (every 10th frame). Frames pass through a lock-free ring buffer (depth 8); the latest processed estimate is published to a Haptic I/O worker at 4 Hz. The parameters: To assess the real-time potential of the system, tests were conducted to measure the latency from frame acquisition to applied force feedback. The results showed an end-to-end latency of approximately 15 to 20 milliseconds, demonstrating that the system provides immediate, real-time haptic responses to the surgeon. Although the proposed CNN model achieves an inference time of approximately 12 ms, the system processes every 10th frame from a 60 FPS stream, resulting in a prediction interval of 166.7 ms. From a system-level perspective, the inference latency represents only a small fraction of the end-to-end control loop delay. Other factors contributing to total latency include frame acquisition (∼16.7 ms), image preprocessing, force scaling, and actuation delay within the haptic device. Our experiments indicated a cumulative latency of 15–20 ms, well below the 166.7 ms prediction interval. Moreover, surgical tasks—particularly those involving soft tissue manipulation—can tolerate feedback delays up to 200–250 ms without compromising safety or precision, as previously reported in teleoperated systems. Therefore, marginal differences in inference time between models (e.g., 3 ms vs. 12 ms) have negligible impact on overall system responsiveness. Instead, model accuracy and stability play a more significant role in maintaining effective haptic perception during real-time surgery.
3.4. Safety Precautions for Tissue Damage Prevention
To enhance the procedure safety, a system to notify the surgeon when the force applied to the tissue exceeds a certain limit was developed. It triggers an alarm when the tissue is at risk of damage due to the excessive applied force. To determine the appropriate force thresholds for the system, esophageal tissue samples were subjected to stress testing and puncturing by applying increasing force until the rupture of the tissue. The experimental setup, presented in Figure 16, involved fixing esophageal tissue between two aluminum plates, each containing a hole through which the surgical instrument was inserted Figure 16b, applying force onto the tissue as can be seen in Figure 16c.
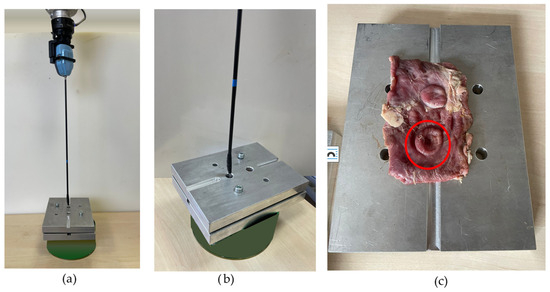
Figure 16.
Experimental setup for determining force thresholds for surgical alarm system: (a,b) esophageal tissue fixed between aluminum plates undergoing stress testing; (c) identification of rupture points (red circle).
The results indicated that visible deformation in the esophageal tissue ceased at forces around 5 N, with rupture occurring later at approximately 57 N (Figure 17). This behavior can be attributed to the internal fiber alignment characteristic of esophageal tissue, which is rich in collagen and muscle fibers [51,52,53]. Although visible deformation stopped at 5 N, further deformation likely occurred at the microstructural level. The internal fibers may continue to stretch and realign, enhancing the tissue’s structural resistance. This reorganization could prevent further visible deformation while allowing the tissue to withstand increasing forces up to the rupture point at 57 N.
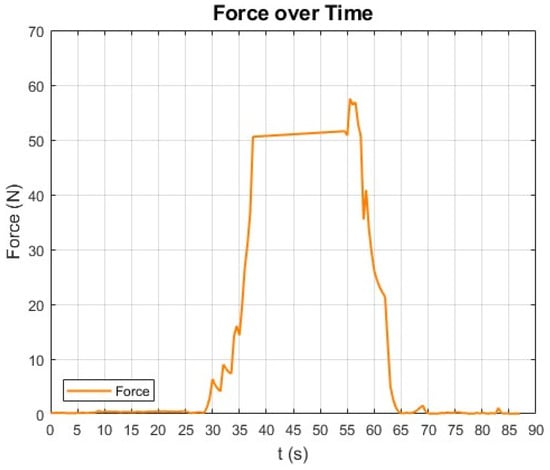
Figure 17.
Force application profile during tissue stress test—applied force rises steadily, peaking at 57 N before rapid decline, indicating tissue rupture point.
4. Discussion
The proposed CNN model, based on the EfficientNetV2B0 architecture, has shown strong potential for real-time force estimation in robotic assisted minimally invasive esophagus surgery. Through optimizing the architecture for computational efficiency, the model achieves comparable accuracy to more complex RCNN models, as demonstrated in our comparative analysis. To validate the performance of the proposed model, a comparative analysis with existing force estimation approaches has been performed. Besides the direct comparison among different models whose results are presented in Table 2, several prior studies have employed RCNNs [21], Inception-based architectures [20], or hybrid models combining vision and robot state data [19] for force estimation. While these models have demonstrated reasonable accuracy, they often show higher computational complexity and longer training times.
Although temporal models like RCNNs and LSTMs are generally expected to outperform purely spatial CNNs in tasks involving tissue deformation, the superior performance of EfficientNetV2B0 in this context may be attributed to several factors. First, the esophageal tissue responses captured in the dataset exhibited sufficiently distinct deformation patterns even in static frames, allowing the CNN to learn robust spatial features associated with specific force levels. Second, the low magnitude and slow dynamics of tissue motion under controlled experimental conditions may have reduced the marginal benefit of temporal modeling. Third, temporal models such as RCNNs inherently require more parameters and longer training times, increasing the risk of overfitting and training instability when limited real-world data is available. Moreover, the high representational efficiency and optimized structure of EfficientNetV2B0 may enable it to extract hierarchical spatial features that implicitly encode temporal cues present in image textures, shading, or deformation contours. These aspects could explain the model’s unexpected ability to surpass temporal architecture in this application.
The authors of [22] utilized a temporal CNN with RGB and point cloud data, achieving a MAE of 0.814 N, significantly higher than the 0.463 N obtained in this study. Similarly, the authors of [17] implemented an Inception ResNet V2 model for force estimation based on spatial and temporal analysis, but again with a greater computational burden. On the other hand, ref. [21] presents a combination of CNN and LSTM networks, incorporating temporal dependencies for force prediction during robotic suturing, but at the cost of increased training time and computational requirements.
In contrast, the EfficientNetV2B0-based model proposed in this paper achieved a mean squared error (MSE) of 0.3487 and a mean absolute error (MAE) of 0.463 N, outperforming the approaches in the literature both in terms of precision and efficiency. The training time was reduced by nearly 50%, being completed in just 41 min, against the RCNN-based approach (usually utilized for these types of tasks) which required 82 min. Moreover, many previous studies relied heavily on simulation-based datasets [16,17], which can limit real-world applicability. The study within this paper utilized real biological tissue images, ensuring a higher accuracy and degree of generalization for practical surgical scenarios.
Further validation through cross-correlation analysis (Figure 9) confirmed that predicted force values were highly synchronized with actual sensor measurements. Additionally, residual analysis (Figure 10) demonstrated that the errors were randomly distributed, reinforcing the robustness and stability of the proposed model. Unlike previous models that primarily focused on force prediction, the integration of real-time haptic feedback via the Omega 7 device enhances the usability of this approach in robotic-assisted surgery. These findings confirm that the proposed model not only achieves great performance but also improves the feasibility of sensorless force estimation in minimally invasive robotic surgery, making it a strong candidate for real-world surgical applications.
In a real-life surgical setting, the proposed system could be deployed either as a standalone monitoring and warning solution or integrated into a robotic surgical platform. Since the method relies on software-based force estimation rather than physical force sensors, it can be easily incorporated into existing systems, reducing the need for additional instrumentation. The primary cost considerations would be associated with integrating haptic feedback devices, which vary in price depending on their force resolution and degrees of freedom. However, by eliminating the necessity for dedicated force sensors in surgical instruments, the proposed approach offers a more cost-effective alternative while maintaining precise force estimation and enhancing the surgeon’s force feedback experience.
By incorporating decision-making algorithms and force-limiting mechanisms, the system would not only help prevent tissue damage but also enhance procedural safety overall. For example, by addressing other force-related safety features, such as impulse detection, the overall surgical procedure would become safer. Although the current CNN model was not specifically designed with this in mind, the integration of the robot and haptic device could be augmented with additional sensing modalities and an adaptive control framework. Such enhancements would enable the system to monitor and respond to sudden force spikes, by implementing damping mechanisms or automatic force reduction algorithms to maintain safe levels thereby further reducing the risk of tissue damage.
In the current stage of development, the proposed model’s performance may differ based on various tissue properties, including those with tumors and chronic inflammation. Additionally, meeting the real-time demands of actual surgical environments, especially under dynamic tissue interactions, may introduce additional challenges such as the need for training for every instrument. Our dataset intentionally excludes sustained supra-threshold loads (>5 N); while this matches the intended use (preventing overloads within a safe band), it limits calibration in that region. We mitigate this by rejecting/flagging out-of-domain predictions rather than extrapolating and by integrating explicit UI/haptic warnings for near- or over-threshold states. Adapting the model to account for a broader range of tissue properties and validating it across various in vitro conditions is a priority. Furthermore, validating the system through iterative testing with the help of the medical specialists is also planned, starting with simulations to refine the model, followed by clinical trials to evaluate its performance, functionality, and AI-enhanced haptic feedback in real-world scenarios.
The developed model infers forces primarily from single-frame spatial appearance, which is well-suited to quasi-static traction/retraction but less reliable for fast transients. First, the update cadence (~6 Hz when processing every 10th frame of a 60 FPS stream) imposes a practical bandwidth limit: rapid force spikes may be attenuated or delayed (temporal aliasing). Second, tissue viscoelasticity introduces hysteresis and rate dependence that are not directly observable in a single image; loads can change before a observable shape change occurs, yielding underestimation in those intervals. Third, appearance confounders—camera motion, out-of-plane instrument motion, motion blur, and lighting/exposure fluctuations—can decouple image changes from the underlying force. To reduce risk, several measures have been considered, such as designing the system for low-frequency traction tasks, apply uncertainty-based gating that withholds numeric outputs and issues a haptic warning when observability is poor or predictions approach the safe-range limit, and increase the update rate during critical steps. Future work will add lightweight temporal encoders (e.g., a 5-frame causal TCN/ConvLSTM head) and two-frame optical-flow features to better capture short-lived dynamics while respecting the ~15–20 ms proposed latency.
While force is intrinsically spatiotemporal, our use case and bandwidth (traction/retraction at ≈6 Hz) make single-frame magnitude inference both adequate and preferable for latency and robustness. The experiments show that short temporal heads and optical-flow augmentation provide, at most, marginal gains under our conditions, while the CNN already captures deformation cues sufficient for magnitude estimation. We explicitly acknowledge that impulsive or rate-dependent phenomena would benefit from richer temporal modeling and outline lightweight extensions (TCN/flow) for scenarios demanding higher bandwidth.
The proposed design targets quasi-static tissue interaction, where force magnitude is primarily encoded by instantaneous deformation, enabling reliable single-frame inference across specimens and views when combined with appearance/domain augmentations. Leave-session-out results indicate graceful domain transfer across camera pose/illumination. Extending robustness to higher-bandwidth maneuvers is feasible by permanently enabling a short temporal head and/or raising the update rate, which has been outlined as a deployment option.
5. Conclusions
The paper demonstrates a sensorless, image-only force estimation approach specifically trained and validated on real biological esophageal tissue, rather than simulated scenes or rigid phantoms. By targeting the tissue properties and visual conditions encountered in esophageal robotic surgery, the model yields clinically relevant performance characteristics and insights that align with operative needs. Methodologically, employing a compact EfficientNetV2B0 backbone delivers a strong accuracy–efficiency trade-off: the proposed model achieves MAE = 0.017 N while requiring fewer computations than heavier architectures, outperforming ResNet50, DenseNet121, MobileNetV3, and InceptionV3 in our experiments. This efficiency is essential for dependable, low-latency operation during surgery. Practically, we integrated and experimentally validated the model on the PARA-SILSROB robotic platform, closing the loop with a real-time haptic feedback pathway that converts video-inferred forces into actionable cues for the operator. This end-to-end integration demonstrates direct surgical usefulness without adding distal sensors or altering instruments or workflow. Future work will extend validation to broader tasks and settings (including in vivo studies), assess generalization across institutions and cameras, and incorporate uncertainty estimation and out-of-distribution detection to further harden the system for clinical deployment. Collectively, these results support the feasibility of real-time, sensorless force feedback for safer and more controlled esophageal robotic procedures.
Author Contributions
Conceptualization, D.P., N.A.H., G.R., B.G., A.C. (Andra Ciocan), A.C. (Andrei Cailean) and D.C.; Data curation, N.A.H., A.C. (Andra Ciocan), C.R. and D.C.; Formal analysis, D.P., N.A.H., C.P., D.C. and C.V.; Funding acquisition, D.P.; Investigation, D.P. and C.V., Anca-Elena Iordan; Methodology, D.P., G.R., C.P., A.C. (Andrei Cailean), A.-E.I. and D.C.; Project administration, D.P.; Resources, B.G.; Software, G.R., A.-E.I. and A.C. (Andrei Cailean); Supervision, D.P., C.P. and B.G.; Validation, N.A.H., C.P., B.G., A.C. (Andra Ciocan) and C.R.; Writing—original draft, G.R.; Writing—review & editing, B.G., A.C. (Andra Ciocan), A.-E.I. and C.V. All authors have read and agreed to the published version of the manuscript.
Funding
This work is supported by the project “Romanian Hub for Artificial Intelligence -HRIA”, Smart Growth, Digitization and Financial Instruments Program, MySMIS No. 334906.
Institutional Review Board Statement
This study used ex vivo porcine esophageal tissue obtained post-mortem from a licensed abattoir after routine slaughter for the food chain. No procedures were conducted on live animals, and no animal was killed for the purposes of this research. In line with Directive 2010/63/EU, which regulates the use of live animals in scientific procedures, and institutional policy, the Institutional Ethics Committee/Animal Welfare Body determined that formal animal ethics approval was not required for the use of such post-mortem tissues.
Informed Consent Statement
Not applicable.
Data Availability Statement
The original contributions presented in the study are included in the article, further inquiries can be directed to the corresponding author.
Conflicts of Interest
The authors declare no conflicts of interest.
References
- Bramhe, S.; Pathak, S.S. Robotic Surgery: A Narrative Review. Cureus 2022, 14, e29179. [Google Scholar] [CrossRef] [PubMed]
- Shah, P.C.; de Groot, A.; Cerfolio, R.; Huang, W.; Huang, K.; Song, C.; Li, Y.; Kreaden, U.; Oh, D. Impact of type of minimally invasive approach on open conversions across ten common procedures in different specialties. Surg. Endosc. 2022, 36, 6067–6075. [Google Scholar] [CrossRef] [PubMed]
- Pisla, D.; Plitea, N.; Gherman, B.; Pisla, A.; Vaida, C. Kinematical Analysis and Design of a New Surgical Parallel Robot. In Proceedings of the 5th International Workshop on Computational Kinematics, Duisburg, Germany, 6–8 May 2009; Springer: Berlin/Heidelberg, Germany; pp. 273–282. [Google Scholar]
- Zhu, J.; Lyu, L.; Xu, Y.; Liang, H.; Zhang, X.; Ding, H.; Wu, Z. Intelligent Soft Surgical Robots for Next-Generation Minimally Invasive Surgery. Adv. Intell. Syst. 2021, 3, 2100011. [Google Scholar] [CrossRef]
- El Rassi, I.; El Rassi, J.M. A review of haptic feedback in tele-operated robotic surgery. J. Med. Eng. Technol. 2020, 44, 247–254. [Google Scholar] [CrossRef]
- Xia, X.; Sun, J.; Liang, B.; Ma, Y.; Fu, Y. Master-Slave Teleoperation Robot System Design. In Chinese Intelligent Systems; Springer: Berlin/Heidelberg, Germany, 2024; pp. 108–118. [Google Scholar]
- Abbas, E.A.; Sarkaria, I.S. Specific complications and limitations of robotic esophagectomy. Dis. Esophagus 2020, 33 (Suppl. 2), doaa109. [Google Scholar] [CrossRef]
- Alemzadeh, H.; Raman, J.; Leveson, N.; Kalbarczyk, Z.; Iyer, R.K. Adverse Events in Robotic Surgery: A Retrospective Study of 14 Years of FDA Data. PLoS ONE 2016, 11, e0151470. [Google Scholar] [CrossRef]
- Plitea, N.; Hesselbach, J.; Vaida, C.; Raatz, A.; Pisla, D.; Budde, C.; Vlad, L.; Burisch, A.; Senner, R. Innovative development of surgical parallel robots. Acta Electron. Mediamira Sci. Cluj-Napoca 2007, 4, 201–206. [Google Scholar]
- Pisla, D.; Nae, L.; Vaida, C.; Oprea, E.; Pisla, D.; Gherman, B.; Antal, T.; Riessenberger, K.; Plitea, N. Development of a learning management system for knowledge transfer in engineering. Acta Tech. Napoc.-Ser. Appl. Math. Mech. Eng. 2021, 64, 361–368. [Google Scholar]
- Hao, Y.; Zhang, H.; Zhang, Z.; Hu, C.; Shi, C. Development of force sensing techniques for robot-assisted laparoscopic surgery: A review. IEEE Trans. Med. Robot. Bionics 2024, 6, 868–887. [Google Scholar] [CrossRef]
- Shi, H.; Zhang, B.; Mei, X.; Song, Q. Realization of Force Detection and Feedback Control for Slave Manipulator of Master/Slave Surgical Robot. Sensors 2020, 21, 7489. [Google Scholar] [CrossRef]
- Antal, T. Considerations on the serial pc-arduino uno r3 interaction, in java, using jdeveloper, for a 3r serial robot, based on the ardulink library. Acta Tech. Napoc.-Ser. Appl. Math. Mech. Eng. 2018, 64, 7–10. [Google Scholar]
- Gutierrez-Giles, A.; Padilla-Castañeda, M.A.; Alvarez-Icaza, L.; Gutierrez-Herrera, E. Force-Sensorless Identification and Classification of Tissue Biomechanical Parameters for Robot-Assisted Palpation. Sensors 2022, 22, 8670. [Google Scholar] [CrossRef] [PubMed]
- Pillai, B.M.; Sivaraman, D.; Ongwattanakul, S.; Suthakorn, J. Sensorless based gravity torque estimation and friction compensation for surgical robotic system. In Proceedings of the 9th International Conference on e-Learning in Industrial Electronics, Brussel, Belgium, 17–20 October 2022; pp. 1–6. [Google Scholar]
- Nazari, A.A.; Janabi-Sharifi, F.; Zareinia, K. Image-based force estimation in medical applications: A review. IEEE Sens. J. 2021, 21, 8805–8830. [Google Scholar] [CrossRef]
- Antal, T. 3R serial robot control based on arduino/genuino uno, in java, using JDeveloper and Ardulink. Acta Tech. Napoc.-Ser. Appl. Math. Mech. Eng. 2018, 61, 11–16. [Google Scholar]
- Reyzabal, M.D.I.; Malas, D.; Wang, S.; Ourselin, S.; Liu, H. SurgeMOD: Translating image-space tissue motions into vision-based surgical forces. arXiv 2024, arXiv:2406.17707. [Google Scholar]
- Chua, Z.; Jarc, A.M.; Okamura, A.M. Toward force estimation in robot-assisted surgery using deep learning with vision and robot state. In Proceedings of the IEEE International Conference on Robotics and Automation, Xi’an, China, 30 May–5 June 2021; pp. 12335–12341. [Google Scholar]
- Sabique, P.V.; Pasupathy, G.; Kalaimagal, S.; Sundar, S.; Muneer, V.K. A Stereovision-based Approach for Retrieving Variable Force Feedback in Robotic-Assisted Surgery Using Modified Inception ResNet V2 Networks. J. Intell. Robot. Syst. 2024, 110, 81. [Google Scholar] [CrossRef]
- Jung, W.J.; Kwak, K.S.; Lim, S.C. Vision-Based Suture Tensile Force Estimation in Robotic Surgery. Sensors 2021, 21, 110. [Google Scholar] [CrossRef]
- Gao, Y.; Lin, X.; Peven, M.; Unberath, M.; Austin, R. Learning to see forces: Surgical force prediction with RGB-point cloud temporal convolutional networks. In Computer Assisted and Robotic Endoscopy Workshop; Springer International Publishing: Cham, Switzerland, 2018. [Google Scholar]
- Huang, F.; Yang, X.; Mei, D.; Chen, Z. Unified Contact Model and Hybrid Motion/force Control for Teleoperated Manipulation in Unknown Environments. IEEE/ASME Trans. Mechatron. 2025, 30, 921–932. [Google Scholar] [CrossRef]
- Han, L.; Mao, J.; Cao, P.; Gan, Y.; Li, S. Toward Sensorless Interaction Force Estimation for Industrial Robots Using High-Order Finite-Time Observers. IEEE Trans. Ind. Electron. 2022, 69, 7275–7284. [Google Scholar] [CrossRef]
- Robotiq. Available online: https://robotiq.com/products/ft-300-force-torque-sensor#:~:text=The%20FT%20300-S%20Force%20Torque%20Sensor%20takes (accessed on 8 October 2024).
- Endoscopic Camera. Available online: https://dothecamera.com/product/3-9mm-oh01a10-endoscope-camera-module-720p-60fps-for-medical/ (accessed on 8 October 2024).
- Cartucho, J.; Ventura, R.; Veloso, M. Robust Object Recognition Through Symbiotic Deep Learning in Mobile Robots. In Proceedings of the IEEE/RSJ International Conference on Intelligent Robots and Systems, Madrid, Spain, 1–5 October 2018; pp. 2336–2341. [Google Scholar]
- Baranwa, S.K.; Jaiswal, K.; Vaibhav, K.; Kumar, A.; Srikantaswamy, R. Performance analysis of Brain Tumour Image Classification using CNN and SVM. In Proceedings of the Second International Conference on Inventive Research in Computing Applications, Coimbatore, India, 15–17 July 2020; pp. 537–542. [Google Scholar]
- Salehi, A.W.; Khan, S.; Gupta, G.; Alabduallah, B.I.; Almjally, A.; Alsolai, H.; Siddiqui, T.; Mellit, A. A Study of CNN and Transfer Learning in Medical Imaging: Advantages, Challenges, Future Scope. Sustainability 2023, 15, 5930. [Google Scholar] [CrossRef]
- Tan, M.; Le, Q.V. EfficientNetV2: Smaller Models and Faster Training. In Proceedings of the 38th International Conference on Machine Learning, Virtual, 18–24 July 2021. [Google Scholar]
- Qureshi, A.; Shaikh, M.; Ahmad, A. Feature extraction using convolution neural networks (CNN) and deep learning. In Proceedings of the 3rd International Conference on Computing, Mathematics and Engineering Technologies, Bangalore, India, 18–19 May 2018; pp. 2319–2323. [Google Scholar]
- Chollet, F. Xception: Deep Learning with Depthwise Separable Convolutions. In Proceedings of the IEEE Conference on Computer Vision and Pattern Recognition, Honolulu, HI, USA, 21–26 July 2017; pp. 1251–1258. [Google Scholar]
- Hu, J.; Shen, L.; Sun, G. Squeeze-and-Excitation Networks. In Proceedings of the IEEE Conference on Computer Vision and Pattern Recognition, Salt Lake City, UT, USA, 18–22 June 2018; pp. 7132–7141. [Google Scholar]
- He, K.; Zhang, X.; Ren, S.; Sun, J. Deep Residual Learning for Image Recognition. In Proceedings of the IEEE Conference on Computer Vision and Pattern Recognition, Las Vegas, NV, USA, 27–30 June 2016; pp. 770–778. [Google Scholar]
- Panoiu, M.; Panoiu, C.; Mezinescu, S.; Militaru, G.; Baciu, I. Machines Learning Techniques Applied to the Harmonic Analysis of Railway Power Supply. Mathematics 2023, 11, 1381. [Google Scholar] [CrossRef]
- Iordan, A.E.; Covaciu, F. Estimation of the Effort Required to Develop a Software through the K-Nearest Neighbors Method. Acta Tech. Napocesis-Ser. Appl. Math. Mech. Eng. 2023, 66, 327–332. [Google Scholar]
- Jain, A.; Singh, A.; Doherey, A. Prediction of Cardiovascular Disease using XGBoost with Optuna. SN Comput. Sci. 2025, 6, 421. [Google Scholar] [CrossRef]
- NVIDIA. Available online: https://www.nvidia.com/en-us/design-visualization/rtx-a6000/ (accessed on 9 October 2024).
- Iordan, A.E. Usage of Stacked Long Short-Term Memory for Recognition of 3D Analytic Geometry Elements. In Proceedings of the International Conference on Agents and Artificial Intelligence, Lisbon, Portugal, 3–5 February 2022; pp. 745–752. [Google Scholar]
- Sagala, O.A.; Setiawan, A.W. Classification of Diabetic Retinopathy Using ResNet50. J. Adv. Res. Electr. Eng. 2025, 9, 65–72. [Google Scholar] [CrossRef]
- Rasheed, M.; Jaffar, M.A.; Akram, A.; Rashid, J.; Alshalali, T.A.; Irshad, A.; Sarwar, N. Improved brain tumor classification through DenseNet121 based transfer learning. Discov. Oncol. 2025, 16, 1645. [Google Scholar] [CrossRef]
- Bendelhoum, M.S.; Ilyas, B.R.; Miloud, K.; Tadjeddine, A.A. Enhancing facial expression recognition using coordinate attention mechanism and MobileNetV3. Multimed. Tools Appl. 2025, 84, 1–34. [Google Scholar] [CrossRef]
- Kirankumar, M. Automated Classification of Coloboma Subtypes Using InceptionV3 Algorithm on Optical Coherence Tomography Images. J. Inf. Syst. Eng. Manag. 2025, 10, 129–134. [Google Scholar] [CrossRef]
- CPU. Available online: https://ark.intel.com/content/www/us/en/ark/products/134599/intel-core-i9-12900k-processor-30m-cache-up-to-5-20-ghz.html (accessed on 9 October 2024).
- Liu, H.; Han, Y.; Emerson, D.; Rabin, Y.; Kara, L.B. A data-driven approach for real-time soft tissue deformation prediction using nonlinear presurgical simulations. PLoS ONE 2025, 20, e0319196. [Google Scholar] [CrossRef]
- Pisla, D.; Popa, C.; Pusca, A.; Ciocan, A.; Gherman, B.; Mois, E.; Cailean, A.; Vaida, C.; Radu, C.; Chablat, D.; et al. On the Control and Validation of the PARA-SILSROB Surgical Parallel Robot. Appl. Sci. 2023, 14, 7925. [Google Scholar] [CrossRef]
- Vaida, C.; Gherman, B.; Birlescu, I.; Tucan, P.; Pusca, A.; Rus, G.; Chablat, D.; Pisla, D. Kinematic Analysis of a Parallel Robot for Minimally Invasive Surgery. In Proceedings of the 19th International Symposium on Advances in Robot Kinematics, Ljubljana, Slovenia, 30 June–4 July 2024; Springer: Berlin/Heidelberg, Germany, 2024. [Google Scholar]
- Pisla, D.; Tucan, P.; Chablat, D.; Al Hajjar, N.; Ciocan, A.; Pisla, A.; Pușca, A.; Radu, C.; Pop, G.; Gherman, B. Accuracy and Repeatability of a Parallel Robot for Personalised Minimally Invasive Surgery. In Proceedings of the 33rd International Conference on Robotics in Alpe-Adria-Danube Region, Cluj-Napoca, Romania, 5–7 June 2024; Springer: Berlin/Heidelberg, Germany, 2024. [Google Scholar]
- 3D-Connexion. Available online: https://3dconnexion.com/ro/ (accessed on 9 October 2024).
- Omega 7. Available online: https://www.forcedimension.com/products/omega (accessed on 9 October 2024).
- Sato, H.; Jin, K.; Yano, S.; Yasuda, A.; Adachi, S.; Yoshioka, H.; Kitamura, H.; Sasaki, T. Abnormalities in esophageal smooth muscle induced by mutations in collagen XIX. Histochem. Cell Biol. 2022, 157, 205–216. [Google Scholar] [CrossRef]
- Mederos, M.A.; de Virgilio, M.J.; Shenoy, R.; Ye, L.; Toste, P.; Mak, S.; Booth, M.; Begashaw, M.; Wilson, M.; Gunnar, W.; et al. Comparison of Clinical Outcomes of Robot-Assisted, Video-Assisted, and Open Esophagectomy for Esophageal Cancer: A Systematic Review and Meta-analysis. JAMA Netw. Open 2021, 4, e2129228. [Google Scholar] [CrossRef]
- Büdeyri, I.; El-Sourani, N.; Eichelmann, A.-K.; Merten, J.; Juratli, M.A.; Pascher, A.; Hoelzen, J.P. Caseload per Year in Robotic-Assisted Minimally Invasive Esophagectomy: A Narrative Review. Cancers 2024, 16, 3538. [Google Scholar] [CrossRef]
Disclaimer/Publisher’s Note: The statements, opinions and data contained in all publications are solely those of the individual author(s) and contributor(s) and not of MDPI and/or the editor(s). MDPI and/or the editor(s) disclaim responsibility for any injury to people or property resulting from any ideas, methods, instructions or products referred to in the content. |
© 2025 by the authors. Licensee MDPI, Basel, Switzerland. This article is an open access article distributed under the terms and conditions of the Creative Commons Attribution (CC BY) license (https://creativecommons.org/licenses/by/4.0/).