Article

Digital Innovation Through Behavioural Analytics: Evidence from Acquisition Channels and Engagement in Global Cruise Firms

by
Dimitrios P. Reklitis
1,*,
Nikolaos T. Giannakopoulos
1,
Marina C. Terzi
1,
Damianos P. Sakas
1,
Stylianos K. Tountas
2,
Nikos Kanellos
1 and
Panagiotis Reklitis
1
1
BICTEVAC Laboratory—Business Information and Communication Technologies in Value Chains, Department of Agribusiness and Supply Chain Management, School of Applied Economics and Social Sciences, Agricultural University of Athens, 118 55 Athens, Greece
2
Faculty of Electrical Engineering, School of Electrical and Computer Engineering, Technical University of Athens, Zografou Campus 9, IroonPolytechniou Str., 157 72 Athens, Greece
*
Author to whom correspondence should be addressed.
Information 2025, 16(11), 1012; https://doi.org/10.3390/info16111012
Submission received: 11 October 2025 / Revised: 2 November 2025 / Accepted: 13 November 2025 / Published: 20 November 2025
(This article belongs to the Special Issue Emerging Research in Knowledge Management and Innovation)

Abstract

Digital transformation has reshaped how cruise firms acquire, engage and retain customers. However, existing research rarely integrates these behavioural dimensions within a unified analytical framework. This study applies a hybrid regression–Fuzzy Cognitive Mapping (FCM) approach to examine how acquisition channels, engagement indicators and online reputation metrics jointly shape website performance and digital innovation among leading global cruise operators. Using multi-source web-analytics data, regression models identify the direct predictive effects of organic, paid, referral and email channels, while FCM captures their non-linear feedback dynamics. Results reveal that visibility does not equate to engagement: organic and referral traffic drive exposure but not depth, whereas authority and reputation mediate engagement–performance relationships. Scenario simulations reveal asymmetric responses within the digital ecosystem. Consequently, balanced, knowledge-driven channel diversification emerges as a key strategic advantage. The findings extend the Knowledge-Based View (KBV) by conceptualising behavioural analytics as organisational knowledge resources that enable adaptive learning and digital innovation. The proposed framework contributes to both tourism analytics and information systems research, offering a scalable model for understanding how data-intensive service firms convert behavioural information into strategic knowledge and sustainable competitive advantage.

1. Introduction

The cruise industry has entered a digital era in which online acquisition channels and engagement metrics are pivotal to competitive positioning [1]. While passenger volumes and revenues continue to expand, the sector’s digital transformation now constitutes a strategic rather than merely operational frontier. A recent bibliometric review confirms that cruise-tourism research has expanded alongside industry growth, documenting increases in both passenger numbers and academic output [2]. Passenger numbers surged from 9.9 million in 2001 to 28.5 million in 2018, generating 1.177 million jobs and about USD 150 billion in revenue and forecasts suggest that the sector will serve 37.6 million passengers by 2025. Beyond numerical growth, the integration of IoT, satellite communications and big data platforms signals a qualitative shift toward a “smart cruise ecosystem” [3]. These technological shifts intersect with changing demand: younger, digitally native travellers expect constant connectivity, personalisation and credible sustainability practices, pushing firms toward data-driven, multichannel marketing and service delivery [4]. In this setting, digital innovation is not limited to technological adoption but reflects firms’ ability to convert behavioural data into strategic knowledge—reconfiguring marketing routines, service delivery and customer experience.
Tourism and hospitality research consistently shows that digital marketing strengthens customer acquisition, visibility and loyalty. Empirical evidence shows that integrating big-data analytics and social-media metrics can significantly improve marketing performance and automate decision-making [5,6,7]. Moreover, real-time analytics further allow firms to identify consumer trends and optimise campaigns [8]. Research on web analytics highlights the importance of behavioural indicators such as page views, session duration and bounce rates [8,9] and notes that organic search and referral traffic often signal higher consumer intent than paid channels, while social and email channels facilitate more personalised engagement [10]. However, existing research rarely integrates acquisition channels, engagement indicators and digital-reputation metrics within a single empirical framework, even though strategic decision-making increasingly depends on these interconnected digital touchpoints [11].
Within cruise tourism, digital strategies are even less studied. A systematic review of sustainable cruise tourism finds that research overwhelmingly centres on corporate social responsibility, territory management and training for sustainable behaviour, calling for broader analyses of cruise operations and post-pandemic recovery [12]. A bibliographic survey reveals only 17 articles connecting big data or business intelligence to cruise tourism, with most focusing on accidents, social-media sentiment or demand prediction [13]. Although some studies examine social-media strategies [14] or sentiment analysis in cruise reviews [15], there remains little empirical work that jointly models acquisition channels, engagement indicators and authority-based reputation metrics. This gap is striking given that digital traffic to cruise websites grew by more than 25% between 2022 and 2023 [16], even though earlier tourism-informatics projects such as the Destination Web Monitor had already advocated integrating traffic and reputation measures for managerial decision-making [17].
The literature also presents conflicting evidence about which channels drive engagement and how digital reputation mediates this relationship. On one hand, some studies emphasise that paid campaigns accelerate reach and visibility in saturated markets where organic growth alone is insufficient [5], while others caution that paid traffic often yields “low-loyalty” visits with limited engagement [18]. Reviews further observe that tourism-analytics research remains fragmented, dominated by small-scale case studies, with limited exploration of how organisations transform raw data into strategic knowledge, and linear models unable to capture the non-linear interdependencies that characterise digital ecosystems [6,11,19]. This methodological gap highlights the need for frameworks that capture feedback loops and systemic complexity, an area where FCM is particularly effective [19,20].
Addressing these conceptual and methodological shortcomings, the present study investigates how digital acquisition channels, engagement indicators and reputation metrics shape website performance among leading global cruise operators. It applies a four-stage framework combining descriptive statistics, correlation analysis, regression modelling and FCM. Regression isolates direct predictive relationships. In contrast, FCM captures non-linear feedbacks and interdependencies, offering a system-level view of digital-ecosystem dynamics. By treating web-analytics data as strategic knowledge resources [21], the study contributes empirical evidence on the predictive effects of organic and paid traffic, referral and social pathways and authority-based reputation factors on engagement, visits and bounce behaviour. Scenario-based FCM simulations further explore how shocks to acquisition mixes propagate through engagement and reputation, clarifying debates on channel quality versus volume and informing resilient digital strategies.
Accordingly, the study formulates three research questions that connect the empirical design to identified theoretical and methodological gaps:
RQ1. How do different digital acquisition channels influence user engagement and website performance in the global cruise industry?
RQ2. What is the role of online reputation and authority metrics in shaping and mediating engagement–performance relationships?
RQ3. How can behavioural analytics reveal feedback dynamics and interdependencies among acquisition, engagement and reputation within cruise firms’ digital ecosystems?
These questions frame the study’s contribution to the literature on digital innovation and knowledge-based value creation.
The remainder of the paper is organised as follows. Section 2 reviews digital marketing research in tourism and hospitality, focusing on acquisition channels, engagement and reputation signals and identifies gaps specific to the cruise domain. Section 3 outlines the methodological framework and dataset. Section 4 presents the statistical and FCM findings, while Section 5 discusses their implications for theory and managerial practice. Finally, Section 6 concludes with a summary of contributions, limitations and avenues for future research.

2. Literature Review

2.1. Digital Transformation and the Cruise Industry

Digital transformation has become a defining force in tourism and hospitality, reshaping how services are produced, delivered and consumed. Within this transformation, the cruise industry stands out as one of the earliest adopters of integrated digital infrastructures that link operational efficiency with experiential personalization [22,23]. Rather than viewing technology as an ancillary tool, cruise operators increasingly treat digital systems as strategic assets for real-time coordination and customer intelligence. IoT sensors, satellite communications, robotics and cloud platforms are being embedded across shipboard and shoreside systems to monitor operations, manage passenger flows and tailor services. These components collectively construct a “Smart Cruise Ecosystem” in which interoperable systems capture and process data dynamically to enable seamless value co-creation for passengers, crew and operators [3,24]. Such data flows extend beyond operational telemetry to inform marketing optimisation, reputation management and engagement design.
The COVID-19 pandemic accelerated this transformation. Initially adopted for health and safety, digitalisation has evolved into a long-term strategic priority [25,26]. Investments in contactless technologies, health-monitoring systems and real-time information infrastructures reinforced the centrality of digital platforms for safety, trust and service continuity. Consequently, analytics-driven learning loops have become core organisational routines that support resilience and continuous improvement.
Consumer behaviour has evolved in parallel. The digitally native generations Y and Z dominate emerging demand and expect personalised, immersive and sustainable experiences with uninterrupted connectivity [1,27]. These expectations compel cruise companies to re-engineer marketing and communication strategies through omnichannel engagement that integrates social, web and mobile touchpoints [4,6]. As travellers increasingly rely on search engines, social networks and referral platforms to discover and book cruises, digital interfaces have displaced traditional intermediaries and redefined acquisition processes around measurable user interactions—visits, time on site, pages per session and bounce behaviour—that serve as proxies for engagement quality [28].
At the academic level, bibliometric reviews reveal a maturing yet uneven research landscape. Most cruise-related studies still prioritise sustainability, environmental management and destination governance, while digitalisation, analytics and marketing innovation remain underrepresented [13,29,30]. This imbalance mirrors broader tourism-analytics literature, which is shifting from descriptive dashboards to predictive and prescriptive approaches powered by big data, social-media mining and AI-based recommendation systems [31,32]. However, few empirical studies connect platform-level acquisition channels with measurable engagement outcomes, leaving a gap between digital-transformation narratives and demonstrable performance.
In summary, digital transformation in cruise tourism should be viewed not simply as technology adoption but as the development of an organisational capability to convert data into strategic knowledge—consistent with the KBV [6,33]. Through this perspective, cruise firms increasingly interpret web-traffic flows, engagement metrics and authority signals as knowledge resources for decision support and performance optimisation. The following section builds on this premise by examining how acquisition, engagement and reputation interact within digital marketing ecosystems to create competitive advantages.

2.2. Digital Marketing Ecosystems: Acquisition, Engagement and Reputation Dynamics

Digital marketing has evolved into an ecosystemic, data-driven process, reconfiguring how tourism and hospitality firms attract and retain customers. Multi-channel architectures—spanning organic and paid search, referrals, social media and email—transform customer acquisition into a continuous feedback system that integrates behavioural data across touchpoints [5,34]. These channels differ in cost efficiency, visibility and conversion potential. Empirical evidence indicates that organic and referral traffic typically reflect stronger purchase intent and engagement quality, whereas paid campaigns provide immediate reach but often weaker post-visit loyalty [6,35]. In tourism markets, search-engine optimisation and algorithmic curation on social platforms remain central to brand visibility, while influencer and user-generated content drive emotional connection [36,37]. Thus, acquisition should be conceived not as a single transaction but as an iterative, knowledge-producing process underpinning digital competitiveness.
Strategic orchestration of these channels increasingly depends on analytics and automation [38]. Cross-channel coordination enhances cumulative performance: visibility in search amplifies social engagement, which in turn strengthens referral and email response [39,40]. This synergy marks a transition from linear marketing funnels to cyclical engagement loops sustained by algorithmic personalisation and real-time learning [38]. In such environments, marketing becomes an adaptive system where data flow continuously between acquisition inputs and engagement outputs.
Research on digital engagement metrics clarifies how users interact across channels. Indicators such as session duration, dwell time, page depth, click-through and bounce rate capture the intensity and quality of attention [8]. The bounce rate, for instance, signals disengagement or unmet expectations. In tourism contexts, such metrics represent not only consumer activity but also organisational learning opportunities—each interaction generates data that can be reinterpreted to refine targeting, design and communication [41]. Engagement data thus serve a dual role—diagnosing user experience and feeding back into strategic decision-making.
Beyond direct interaction, digital reputation functions as a mediating resource linking engagement to competitiveness. Authority indicators—backlink profiles, domain authority and trust scores—govern visibility in organic search and influence consumer confidence and conversion [10,42]. Early tourism-informatics initiatives such as the Destination Web Monitor [17] have already demonstrated the value of merging traffic and reputational analytics, yet unified empirical frameworks remain rare. Evidence shows that firms with stronger online authority benefit from algorithmic reinforcement and reputational spillovers, which mediate the link between engagement quality and performance outcomes [42,43]. In this sense, reputation operates as a knowledge filter, transforming behavioural engagement into strategic visibility.
Still, scholarship diverges on the value of channel diversification. Some argue that diversification enhances resilience against platform volatility [44], whereas others warn that excessive dispersion can dilute brand identity and erode engagement depth [6]. This conceptual tension underscores a methodological one: most tourism-analytics studies employ linear models that capture isolated correlations but overlook recursive interactions among channel mix, engagement and authority. To address this limitation, systems-based approaches such as FCM are needed to model causal feedback and non-linear dependencies within digital ecosystems [21].
In summary, acquisition channels, engagement behaviours and reputation signals form an interdependent system through which cruise firms convert digital visibility into sustained authority and performance. Yet, prior research typically evaluates these components in isolation [5,6,8]. The KBV offers a unifying interpretive lens, conceptualising data and analytics as organisational knowledge resources rather than mere performance indicators. The next subsection adopts this perspective to theorise how behavioural analytics enable digital innovation by linking acquisition, engagement and reputation within continuous learning cycles.

2.3. Knowledge-Based View and Digital Innovation Through Behavioural Analytics

The KBV conceptualises organisations as repositories and processors of knowledge whose competitive advantage depends on their ability to create, integrate and exploit knowledge resources more effectively than rivals [34]. In digital environments, data function as the raw material of knowledge creation and analytics represent the mechanisms that transform these data into actionable insight. The capacity to interpret behavioural information and embed it in decision routines therefore constitutes a core dynamic capability that supports learning, innovation and sustained competitiveness [6,44].
Within tourism, this theoretical shift reframes analytics from operational tools into strategic enablers of knowledge-based competitiveness. Value arises not merely from data accumulation but from the firm’s ability to interpret and recombine user-generated information into marketing and service innovation [21]. In the cruise industry, behavioural analytics—derived from user interactions across websites, social media and communication channels—become instruments of organisational learning. Through real-time observation of browsing, engagement and conversion patterns, firms continuously refine content, personalisation and campaign design, embedding data-driven responsiveness in everyday routines [8]. This process corresponds to what Buhalis and Sinarta [22] term “nowness service”, where continuous feedback enables co-creation of experiences and agile service adaptation.
Reputation metrics such as authority scores and backlink profiles can be interpreted as externalised forms of organisational knowledge. They signal the credibility and relational capital accumulated within digital ecosystems and provide codified feedback from external stakeholders [42]. Integrating this externally validated information into managerial decision-making distinguishes data-rich firms from truly knowledge-driven ones. Thus, digital innovation therefore emerges not from technological novelty alone but from the systematic recombination of internal insights and external signals to enhance adaptability and strategic agility [5,45].
Recent studies of digital transformation in tourism reinforce this perspective. Analytics-driven innovation requires alignment among technological, human and organisational capabilities [31,32]. Firms that embed analytics within strategic routines—through dashboards, automated feedback loops and decision-support systems—achieve higher adaptability and customer-centred innovation outcomes. This dynamic capability approach is particularly relevant to the cruise sector, where performance increasingly depends on learning from behavioural data rather than on technology adoption per se.
Accordingly, this study conceptualises behavioural analytics as an organisational knowledge system underpinning digital innovation in cruise tourism. Acquisition channels, engagement indicators and reputation metrics are treated as interconnected domains of knowledge whose interdependencies generate iterative learning cycles. This conceptualisation directly informs the study’s empirical strategy: regression analysis isolates the direct, measurable relationships among these variables, while FCM captures their feedback dynamics and non-linear interdependencies. Through this dual approach, digital innovation is modelled as a continuous process of knowledge creation, validation and application within the cruise industry’s data-intensive ecosystem. The following section translates these theoretical principles into a four-stage methodological framework designed to operationalise KBV in empirical terms.

3. Materials and Methods

3.1. Methodological Framework

The methodological framework of this study is designed to link web analytics indicators with engagement metrics, reputation signals and diversification measures in order to explore how digital knowledge flows can be leveraged for innovation management in the cruise sector. The framework unfolds in four sequential stages, combining quantitative statistical methods with advanced causal modelling.
  • Stage 1: Data Collection
Data were retrieved from specialised web analytics platforms and industry monitoring tools, which provide standardised digital performance indicators across websites. The sample consists of 35 firm-month observations from the top 5 global cruise firms, ensuring representation of the industry’s largest players. The dataset includes the following:
  • Traffic acquisition channels: Direct, referral, organic search, paid search, organic social, paid social, email and display ads.
  • Engagement metrics: Pages per visit, time on site and bounce rate.
  • Performance indicators: Website users and website visits.
  • Reputation measures: Authority score and backlinks.
  • Cost variables: Organic traffic cost and paid traffic cost.
  • Diversification index: Shannon entropy, computed from acquisition shares to measure balance across channels.
This multi-dimensional dataset allows for an integrated assessment of traffic dynamics, user behaviour and reputation capital in a digital service environment.
  • Stage 2: Descriptive Statistics and Correlation Analysis
The second stage involves summarising the dataset using descriptive statistics (mean, standard deviation, minimum and maximum values) to highlight scale and variability. For example, direct traffic emerges as the dominant acquisition source, while channels such as paid social and display ads remain marginal. Engagement indicators display substantial heterogeneity across observations, reflecting differences in customer interaction depth.
To identify preliminary associations, Pearson correlation coefficients were calculated among all variables. This step provides an overview of significant linear relationships, such as the strong positive correlation between authority score and organic traffic (r = 0.91, p < 0.001) and between email share and time on site (r = 0.59, p < 0.001). The correlation matrix serves as a diagnostic tool to flag potential multicollinearity, guiding variable selection for regression analysis.
  • Stage 3: Regression Analysis
Building on descriptive and correlational insights, Ordinary Least Squares (OLS) regression models were employed to quantify the impact of acquisition channels, paid investments and reputation measures on engagement outcomes and traffic volumes. Models were specified with different dependent variables, including pages per visit, time on site, bounce rate, website visits and organic traffic.
The regressions reveal distinct patterns:
  • Organic and referral traffic shares are negatively associated with engagement indicators, while positively related to bounce rate.
  • Paid traffic cost significantly drives website visits but does not improve pages per visit.
  • Authority score and backlinks strongly predict organic traffic, confirming their role as digital reputation drivers.
  • Email share consistently enhances engagement, particularly time on site and pages per visit.
  • The entropy index shows no stable predictive value, indicating that diversification did not materially affect outcomes.
These regression outcomes provide a statistical foundation for causal inference, which is further refined in the final stage.
  • Stage 4: FCM Modelling
To capture the complex interdependencies among digital variables beyond linear regression, the fourth stage employs FCM. This method models relationships as a system of interconnected concepts (nodes) linked by weighted causal edges. The weights derive from the regression coefficients and correlation strengths, adjusted through expert calibration to reflect realistic causal logic.
The FCM enables simulation of what-if scenarios. For example, increasing investment in email marketing can be modelled to assess its ripple effects not only on time on site, but also indirectly on bounce rate and organic traffic via knowledge spillovers. Similarly, reputational improvements in Authority Score can be tested for their long-term influence on diversified traffic flows.
By integrating descriptive, correlational and regression-based insights into a cognitive map, the FCM stage provides a holistic knowledge-based model of how acquisition strategies, engagement behaviours and reputation signals interact in the cruise industry’s digital environment.

3.2. Sample Selection and Retrieval

The empirical analysis draws on data from the top five global cruise firms (namely Carnival Corporation & plc, Royal Caribbean Cruise Lines, Norwegian Cruise Line Holdings, MSC Cruises and Disney Cruise Line), which were selected due to their dominant market share, international customer base and strong reliance on digital platforms for marketing and customer acquisition. These firms were identified through publicly available rankings of the global cruise industry, ensuring representation of the sector’s largest and most influential players. The selection provides a robust basis for investigating how digital acquisition channels and engagement indicators operate in a competitive and innovation-driven service environment.
Data retrieval was conducted using a web analytics online platform Semrush (version 1, Semrush Holdings, Inc., Boston, MA, USA), enabling the collection of standardised indicators across firms. Variables included traffic acquisition sources (direct, referral, organic search, paid search, organic social, paid social, email and display ads), engagement outcomes (pages per visit, time on site and bounce rate) and digital reputation metrics (authority score and backlinks). To capture channel diversification, an entropy index was computed based on the proportional distribution of acquisition sources. The dataset covers a timeline expanding from 1 June 2024 to 31 December 2024. The dataset represents a balanced panel covering the same five cruise firms across seven consecutive months (June–December 2024). Preliminary descriptive and correlation analyses were conducted as robustness checks to ensure stability across periods before proceeding to the final modelling stages (see Supplementary Materials).

3.3. Research Hypotheses

The emergence of web analytics as a knowledge asset has provided organisations with new ways to understand consumer behaviour and innovate in their strategic decision-making. Prior research shows that digital touchpoints generate informational flows that can be transformed into knowledge for improving marketing efficiency, customer engagement and organisational performance [11]. Within service-intensive industries such as cruise tourism, where customer acquisition and retention are highly dependent on digital presence, analysing acquisition channels, engagement metrics and reputation indicators has become central to innovation and value creation [6,11]. Building on this, the following hypotheses (H1–H5) were developed to explore the relationships between acquisition mix, spending efficiency, authority, social/email interactions and diversification strategies, thereby linking web analytics with knowledge and innovation management.
Recent studies emphasise that organic search traffic tends to reflect high-intent customers, which is often linked to deeper engagement [10,11]. Similarly, referral pathways can enhance trust transfer and knowledge sharing across networks [6]. In tourism and hospitality, research has shown that SEO optimisation and referral partnerships improve digital visibility and stimulate engagement [6]. Knowledge management perspectives frame these channels as enablers of informational spillovers that foster customer learning and long-term loyalty [11].
H1. 
Higher shares of organic search and referral traffic are positively associated with user engagement (pages per visit, time on site) and negatively associated with bounce rate.
While paid traffic investments reliably increase exposure, recent findings indicate that the relationship with engagement is often weak due to ad fatigue and low authenticity perceptions [10,11]. Digital marketing efficiency studies argue that managers need to assess not just traffic but also conversion quality and return on ad spend (ROAS) [5,37]. In service industries, paid campaigns have been criticised for attracting “low-loyalty” traffic that boosts visit counts without improving retention [11]. Thus, knowledge-based allocation of resources requires a more nuanced understanding of cost–benefit dynamics in paid acquisition.
H2. 
Paid traffic cost is not necessarily proportional to user engagement outcomes, even if it drives higher website visits.
Recent evidence shows that domain authority and backlink ecosystems act as proxies for organisational credibility and knowledge validation [22,33]. Search engine studies confirm that backlinks from authoritative domains significantly improve organic ranking and visibility [18,34]. In hospitality and tourism, inbound link-building has been associated with knowledge spillovers, online trust and stronger brand equity [6]. From a knowledge management standpoint, these external validation signals function as innovation-enabling assets, reducing bounce rates by attracting more relevant visitors.
H3. 
Higher authority score and a greater number of backlinks are positively associated with organic traffic and lower bounce rate.
Email marketing continues to be identified as a high-performing channel for personalization and loyalty [5,9,15]. Studies show that interactive communication via email and social media fosters long-term engagement and co-creation of knowledge [1,21]. In tourism, organic social activity has been shown to increase session duration and stimulate repeat visits, particularly when aligned with storytelling strategies [6]. These channels represent democratised spaces for customer–firm knowledge exchange, enabling innovative engagement practices.
H4. 
Greater reliance on email and organic social channels is positively associated with user engagement (pages per visit, time on site).
Channel diversification reflects principles of risk management and resilience, mirroring portfolio diversification in finance [11]. In digital strategy, diversification has been associated with more sustainable traffic flows and reduced dependency on volatile platforms [5]. For tourism and hospitality, multi-channel integration enhances knowledge sharing across ecosystems, stabilising demand and engagement [7,11]. The entropy-based measure captures this balance, hypothesising that diversified acquisition reduces bounce rates and produces more consistent performance.
H5. 
Greater diversification across acquisition channels (entropy index) is associated with more stable website visits and lower bounce rates.

3.4. Conceptual Framework

Guided by the KBV, this study conceptualises digital marketing ecosystems as knowledge systems that transform behavioural data into strategic insight and innovation capability. Figure 1 summarises the proposed framework.
Acquisition channels represent the inflow of external information captured through organic, paid, referral and email pathways. These channels constitute the organisation’s knowledge inputs, shaping initial visibility and information exposure. Engagement indicators (e.g., session duration, pages per session, bounce rate) capture how visitors process and internalise this information—reflecting the knowledge transformation phase in which user behaviour provides feedback on content relevance and experiential value. Reputation and authority metrics (domain authority, backlinks, trust flow) act as knowledge validation mechanisms, signalling external recognition and mediating the relationship between engagement and long-term performance. Strong authority reinforces visibility, creating recursive effects that feed back into acquisition channels. Website performance and digital innovation emerge as outcomes of this cyclical learning process. Within the KBV perspective, value is generated when the organisation interprets behavioural analytics to reconfigure marketing routines and digital capabilities. This conceptual framework thus positions behavioural analytics as a cyclical knowledge-creation mechanism, operationalising the KBV through the empirical coupling of regression and FCM analyses presented in the following section.
The framework distinguishes two analytical layers. Regression analysis examines the direct, linear relationships among acquisition, engagement, reputation and performance. FCM extends this by modelling non-linear feedback loops that reflect the recursive learning processes predicted by KBV. Together, these approaches operationalise digital innovation as a continuous cycle of knowledge acquisition, transformation and validation within the cruise sector’s data-intensive ecosystem.

4. Results

4.1. Statistical Analysis

The analysis integrates descriptive statistics, correlation patterns and regression models to examine the relationships between acquisition channels, engagement indicators, reputation metrics and diversification measures across the dataset of the five leading cruise firms. The results are presented in three stages. First, descriptive statistics and entropy distribution provide an overview of traffic sources, user behaviour and diversification levels. Second, bivariate correlations highlight the strength and direction of associations among acquisition variables, engagement outcomes and authority signals. Third, regression models supported by visualisations (Figure 2, Figure 3, Figure 4, Figure 5, Figure 6 and Figure 7) offer detailed insights into how specific traffic sources, paid investments, authority measures and channel diversification relate to website visits, engagement depth and bounce behaviour.
We created the entropy index from the traffic acquisition shares (direct, referral, organic search, paid search, organic social, paid social, email, display ads). For each observation, the following is true:
E n t r o p y = i = 1 k p i l n ( p i )
where
  • pi = share of channel i (e.g., direct traffic/total acquisition)
  • k = number of acquisition channels with non-zero shares
Figure 2 and Table 1 provide an overview of the dataset. Acquisition channels are highly imbalanced: Direct traffic dominates (M = 14.8 M, SD = 25.8 M), while paid social (M = 18 K) and display ads (M = 23 K) contribute minimally. Engagement metrics average at 3.25 pages per visit and 6.61 min time on site, with a wide range in both indicators. Website visits vary substantially (M = 22.4 M, SD = 39 M), reflecting large fluctuations across firms or periods. The entropy index (M = 0.93, SD = 0.20) indicates moderate diversification, with values ranging between 0.51 and 1.25.
Table 2 shows that most traffic acquisition variables are strongly intercorrelated, particularly direct, referral and organic search with website visits and organic traffic (r > 0.90, p < 0.001). Email share is positively correlated with time on site (r = 0.59, p < 0.001), while pages per visit correlates negatively with bounce rate (r = −0.42, p < 0.05). Authority score and backlinks show strong positive correlations with organic traffic (r = 0.91 and 0.99, respectively, both p < 0.001). Entropy is weakly correlated with most variables and shows a small positive correlation with bounce rate (r = 0.27, ns).
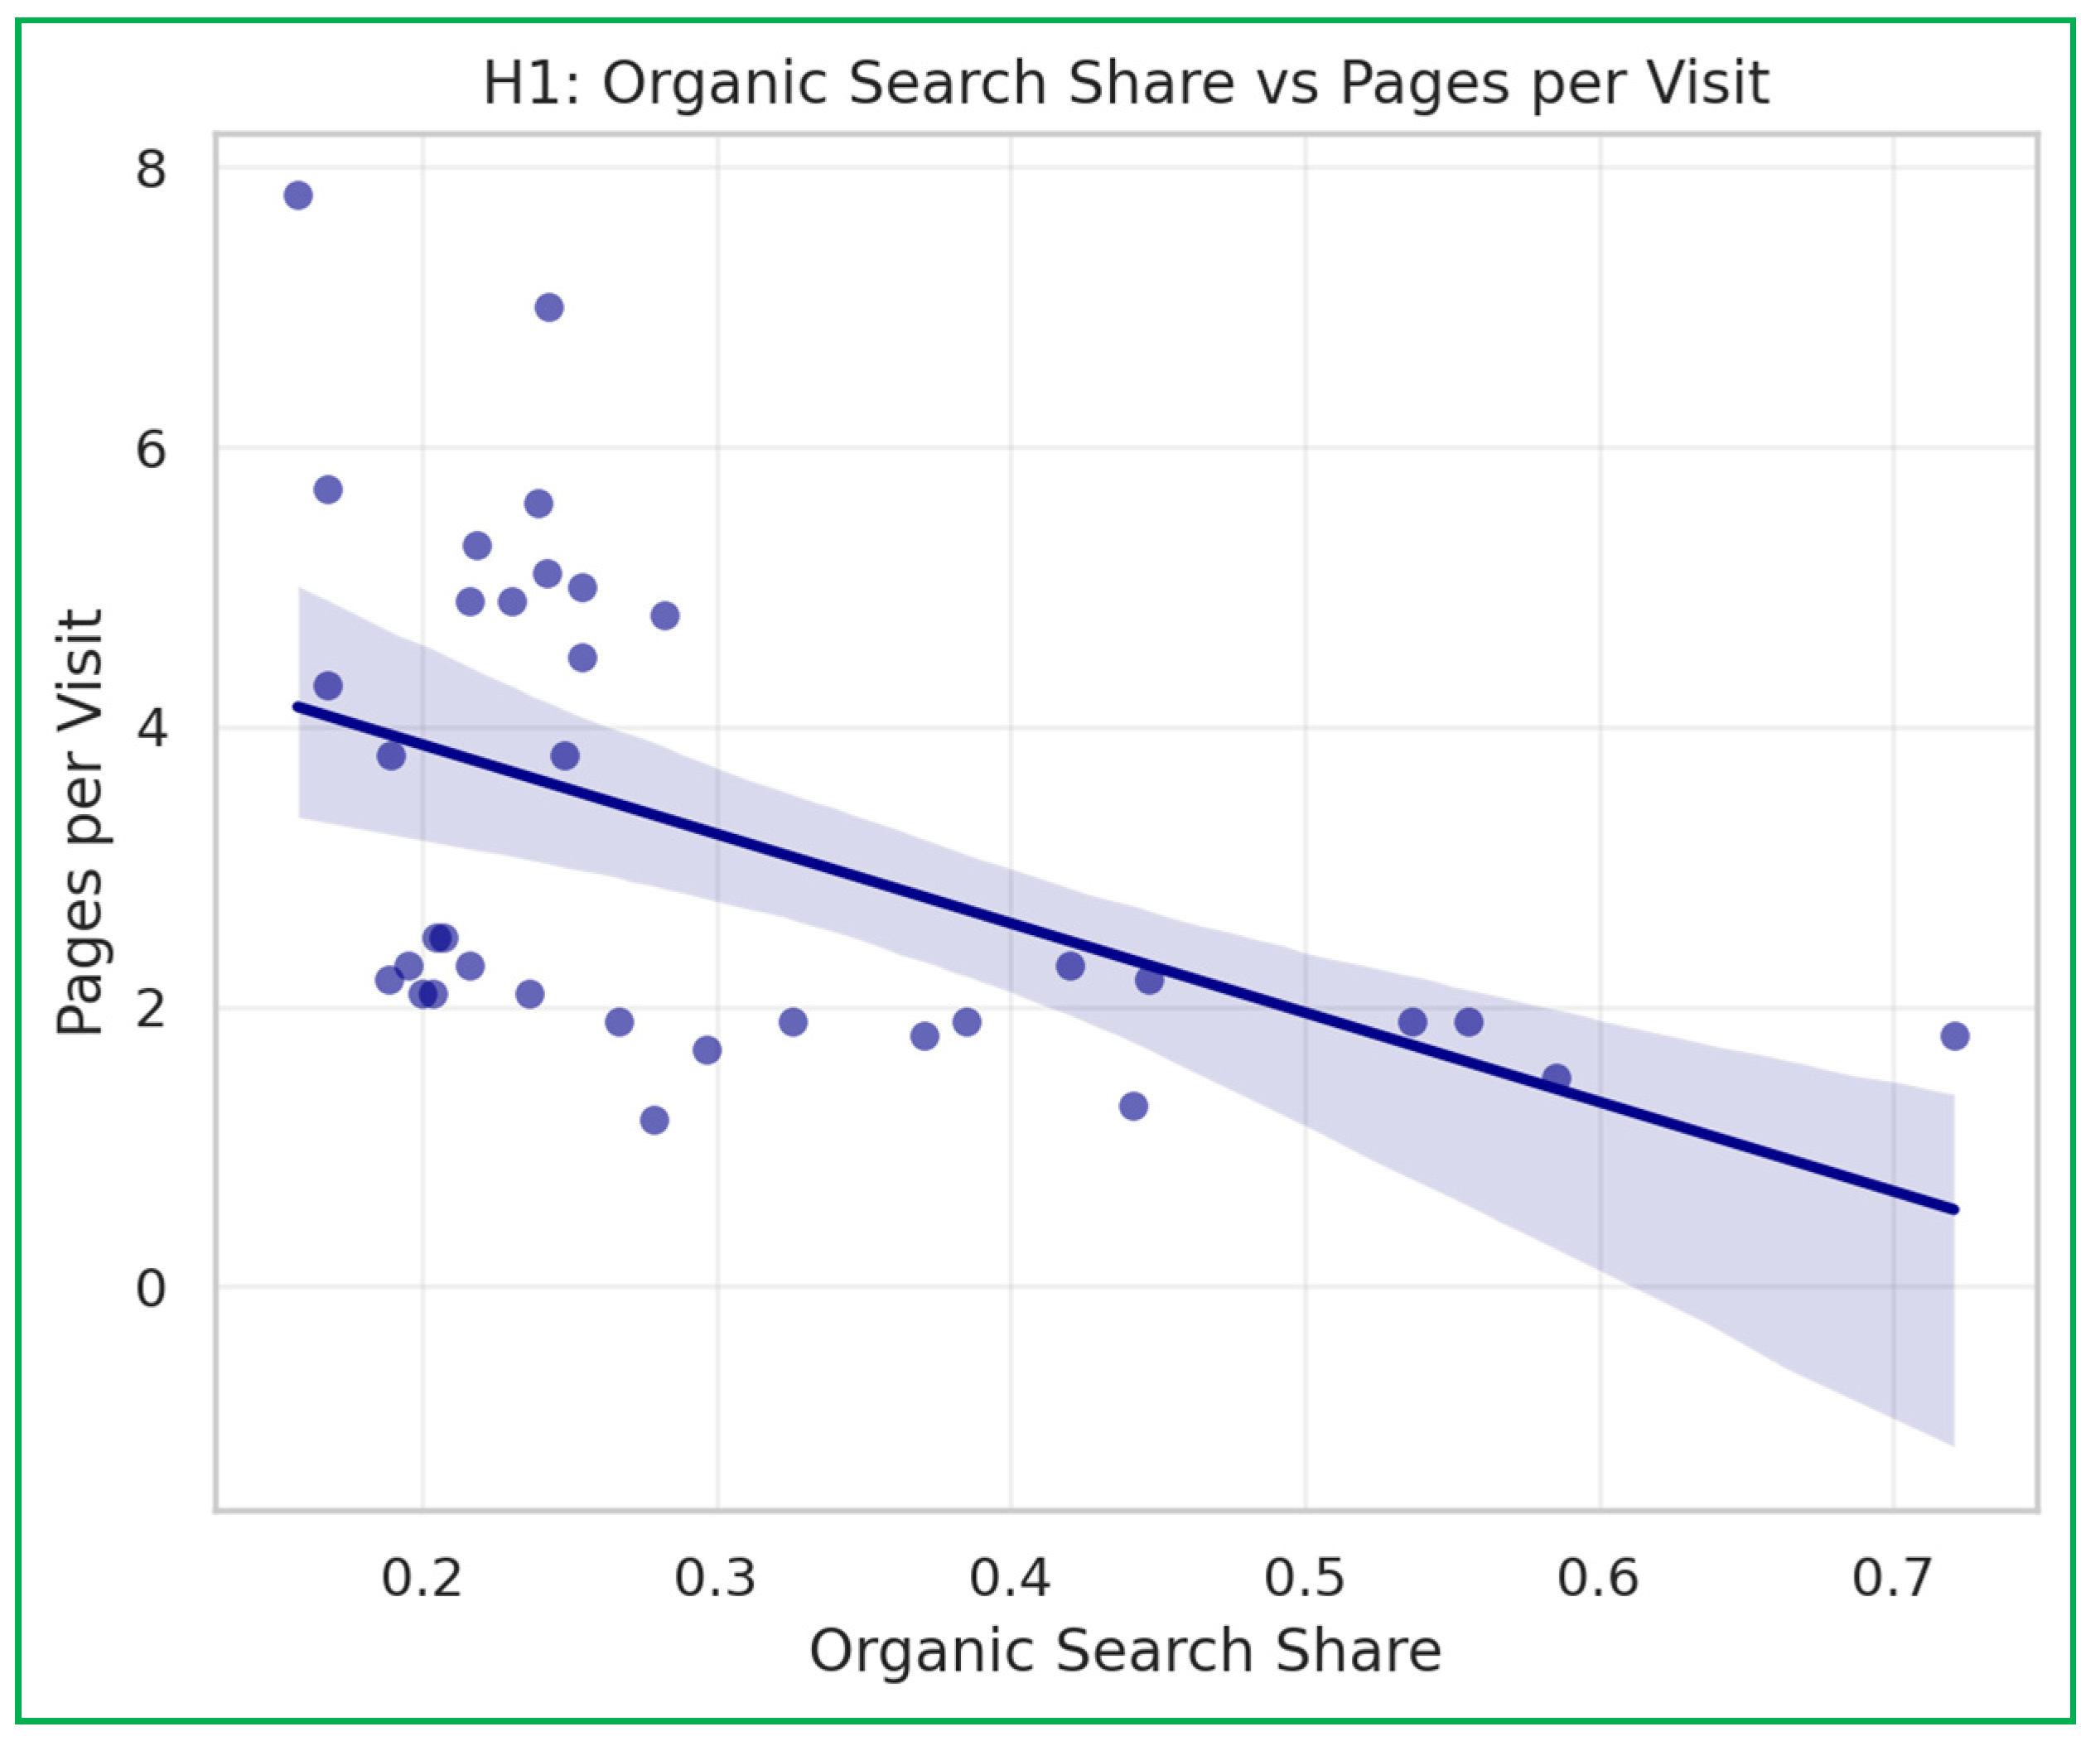
Table 3 and Figure 3 reveal that organic search share and referral share are negatively associated with both pages per visit and time on site. Conversely, both are positively associated with bounce rate. The models explain 29–42% of variance in engagement indicators, indicating moderate explanatory power.
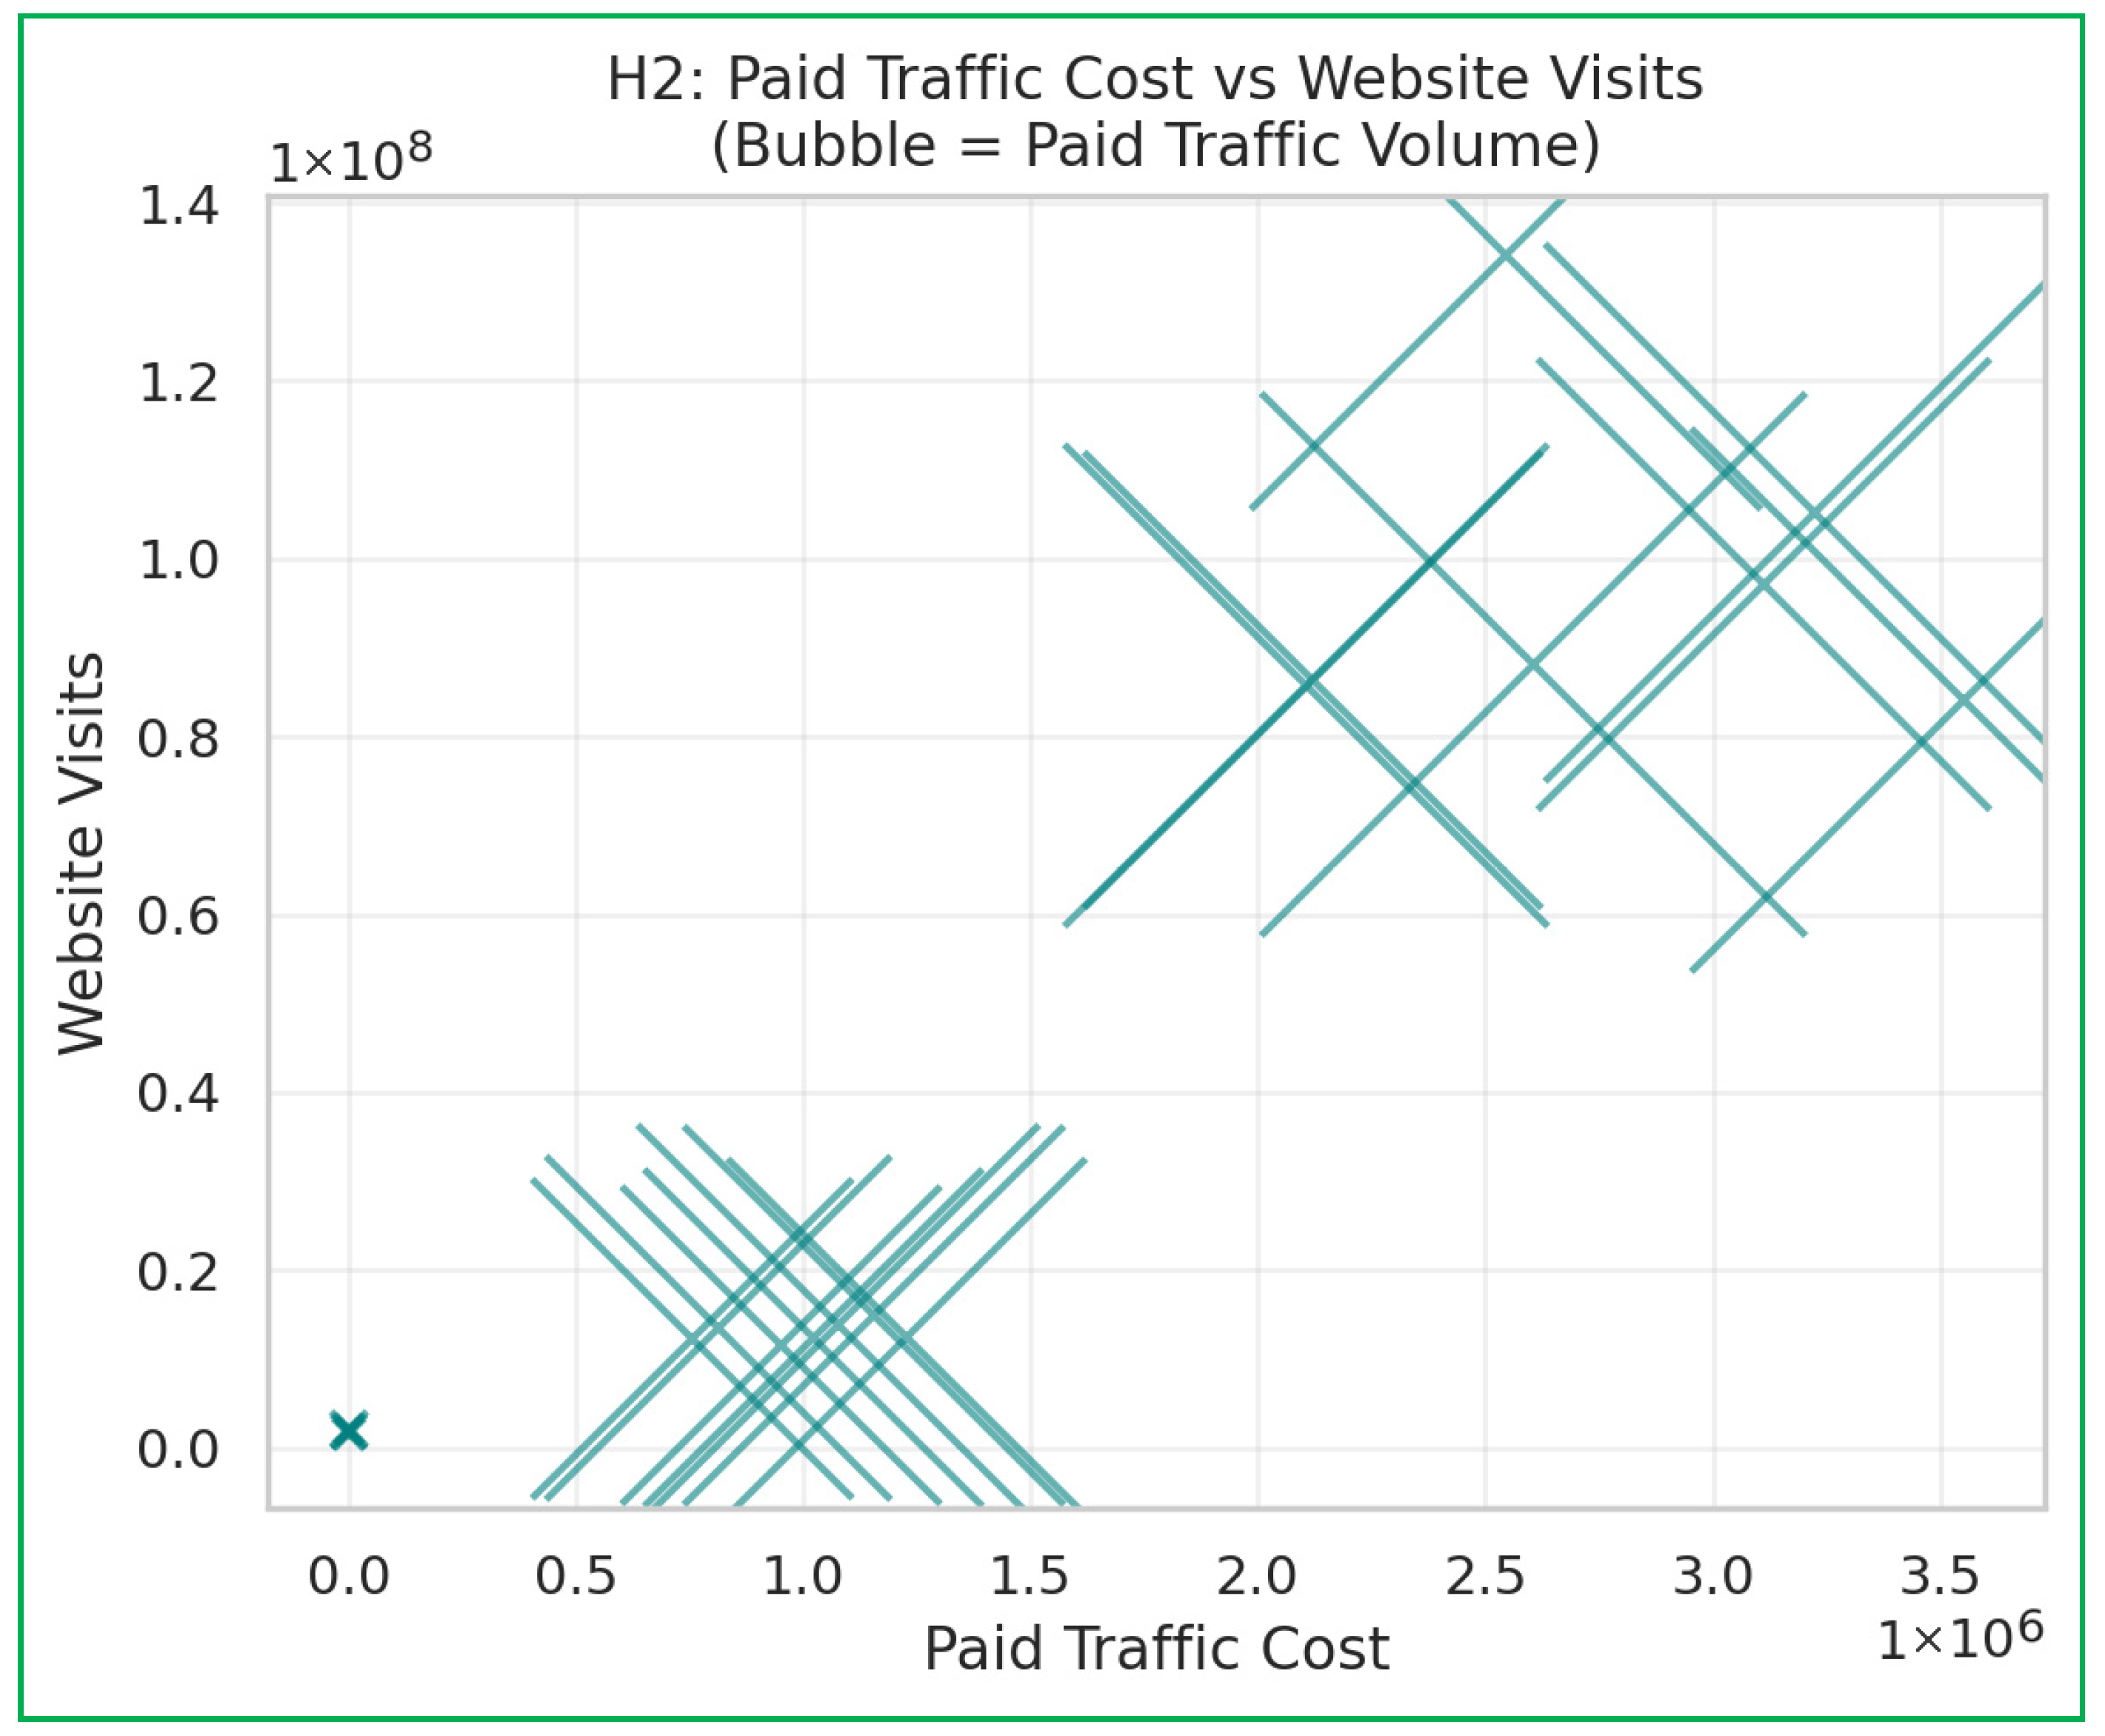
Table 4 and Figure 4 show strong positive relationships between paid traffic cost, paid traffic and website visits (R2 = 0.88). However, neither variable significantly predicts pages per visit, suggesting their effect is limited to driving traffic volume rather than engagement.
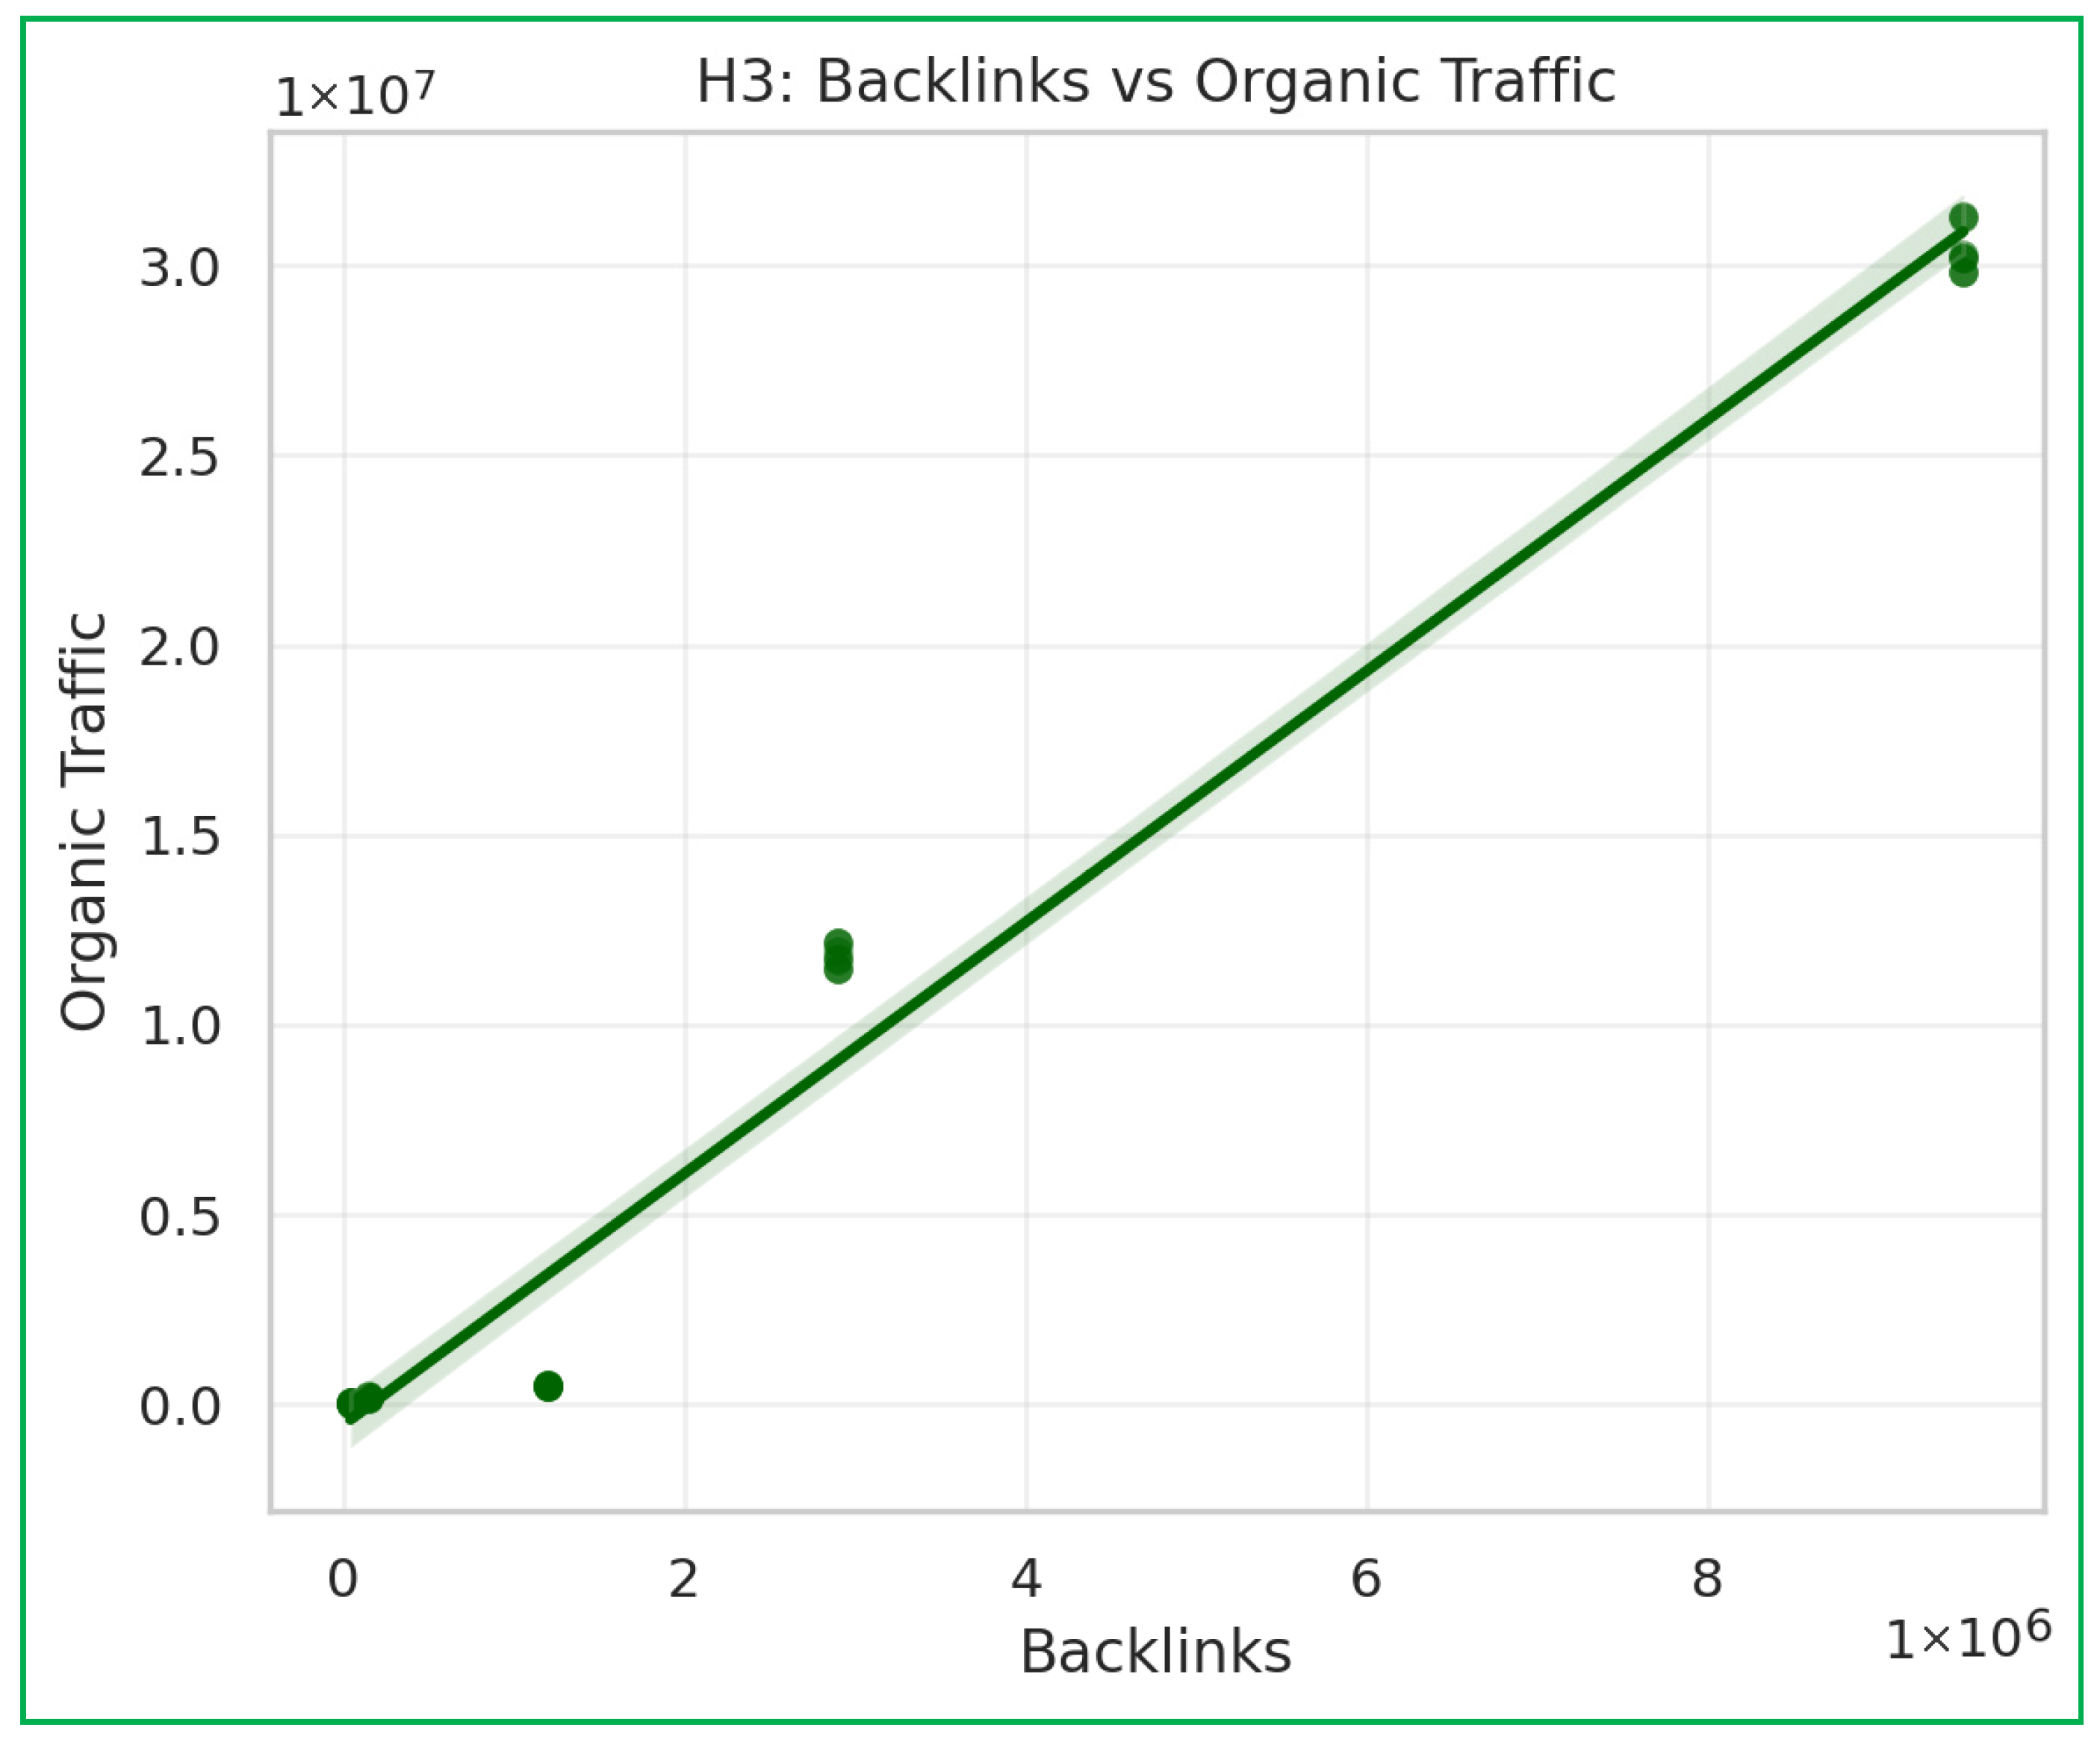
Table 5 and Figure 5 demonstrate robust positive effects of both authority score (β = 56,234, p < 0.001) and backlinks (β = 1.832, p < 0.001) on organic traffic, with a very high explained variance (R2 = 0.92). No significant effects are observed on bounce rate, indicating that authority signals drive visibility but not immediate exit behaviour.
Table 6 and Figure 6 highlight a strong positive relationship between email share and both time on site (β = 22.32, p < 0.01) and pages per visit (β = 12.91, p < 0.001). Organic social share shows only a marginal effect on pages per visit (p < 0.10). Engagement appears more strongly linked with email activity than social activity.
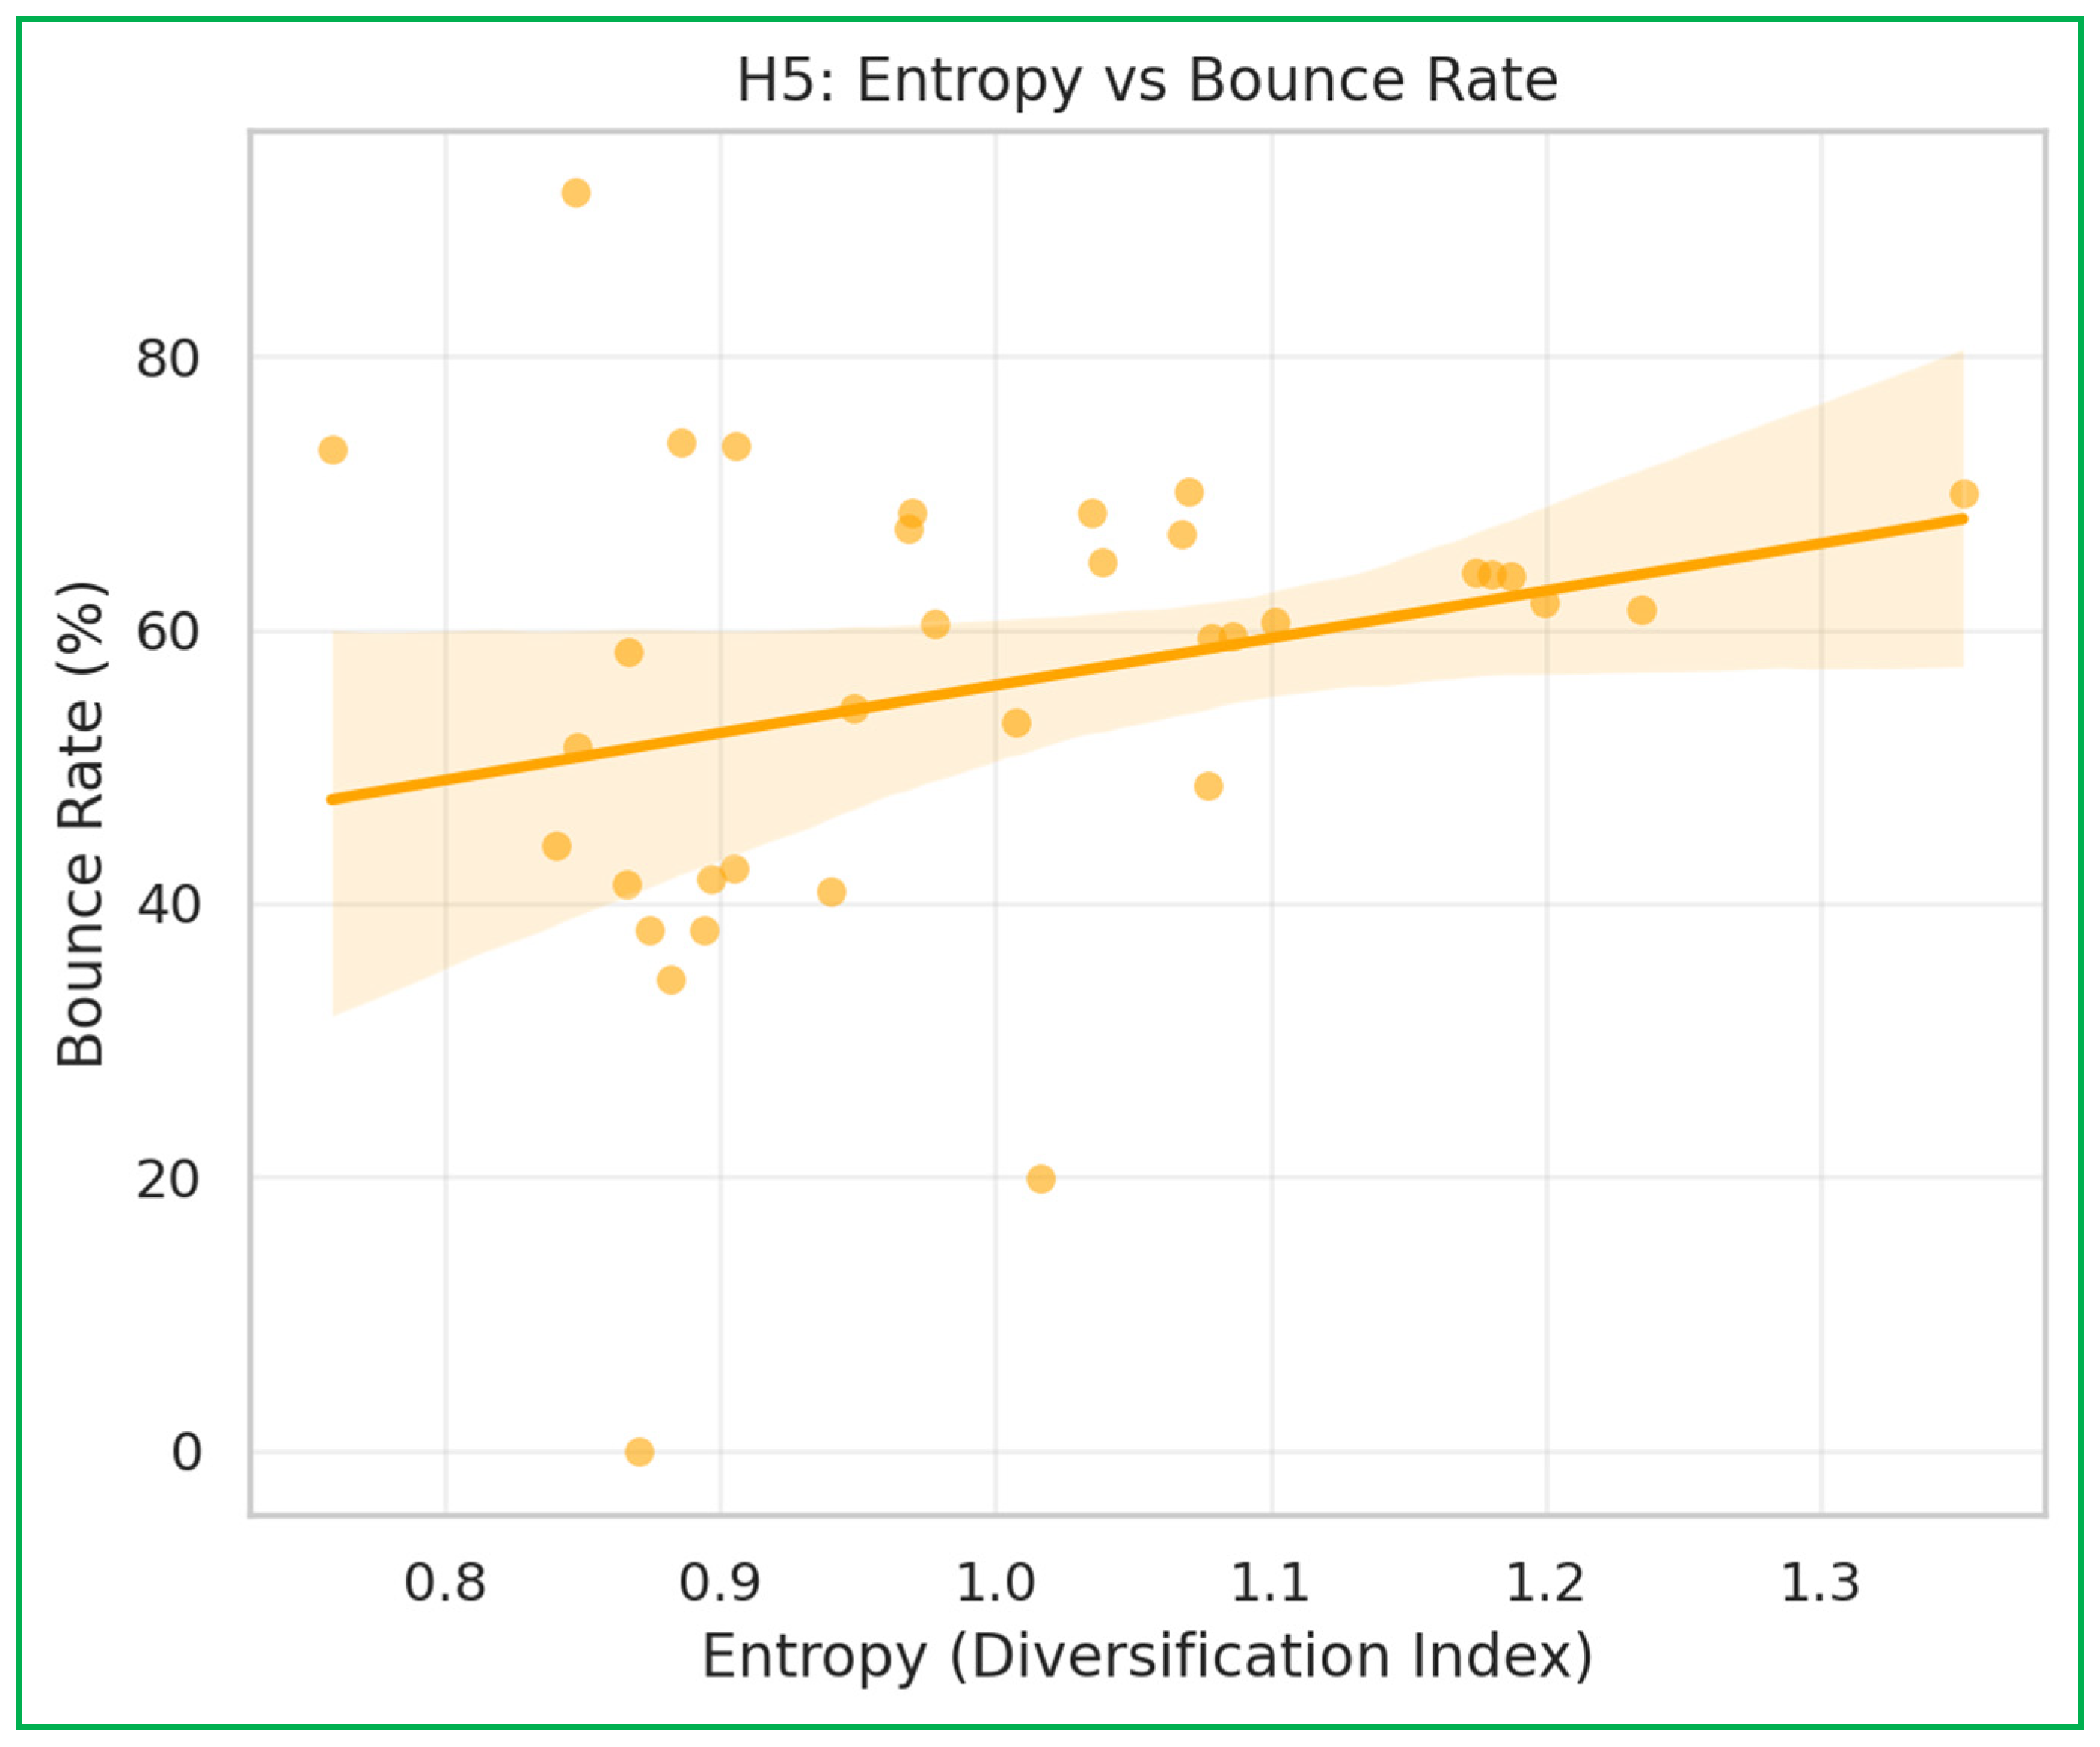
Table 7 and Figure 7 show no significant relationship between entropy and website visits (β = −11.67 M, ns). A weak positive trend is visible between entropy and bounce rate, but the results are not stable due to limited variation. This suggests diversification, as measured here, does not systematically affect traffic volume or bounce behaviour in the dataset.
All regression models were tested for multicollinearity using the Variance Inflation Factor (VIF). VIF values remained below the conventional threshold of 5, indicating that multicollinearity was not a concern among the predictors.

4.2. Fuzzy Cognitive Mapping Analysis

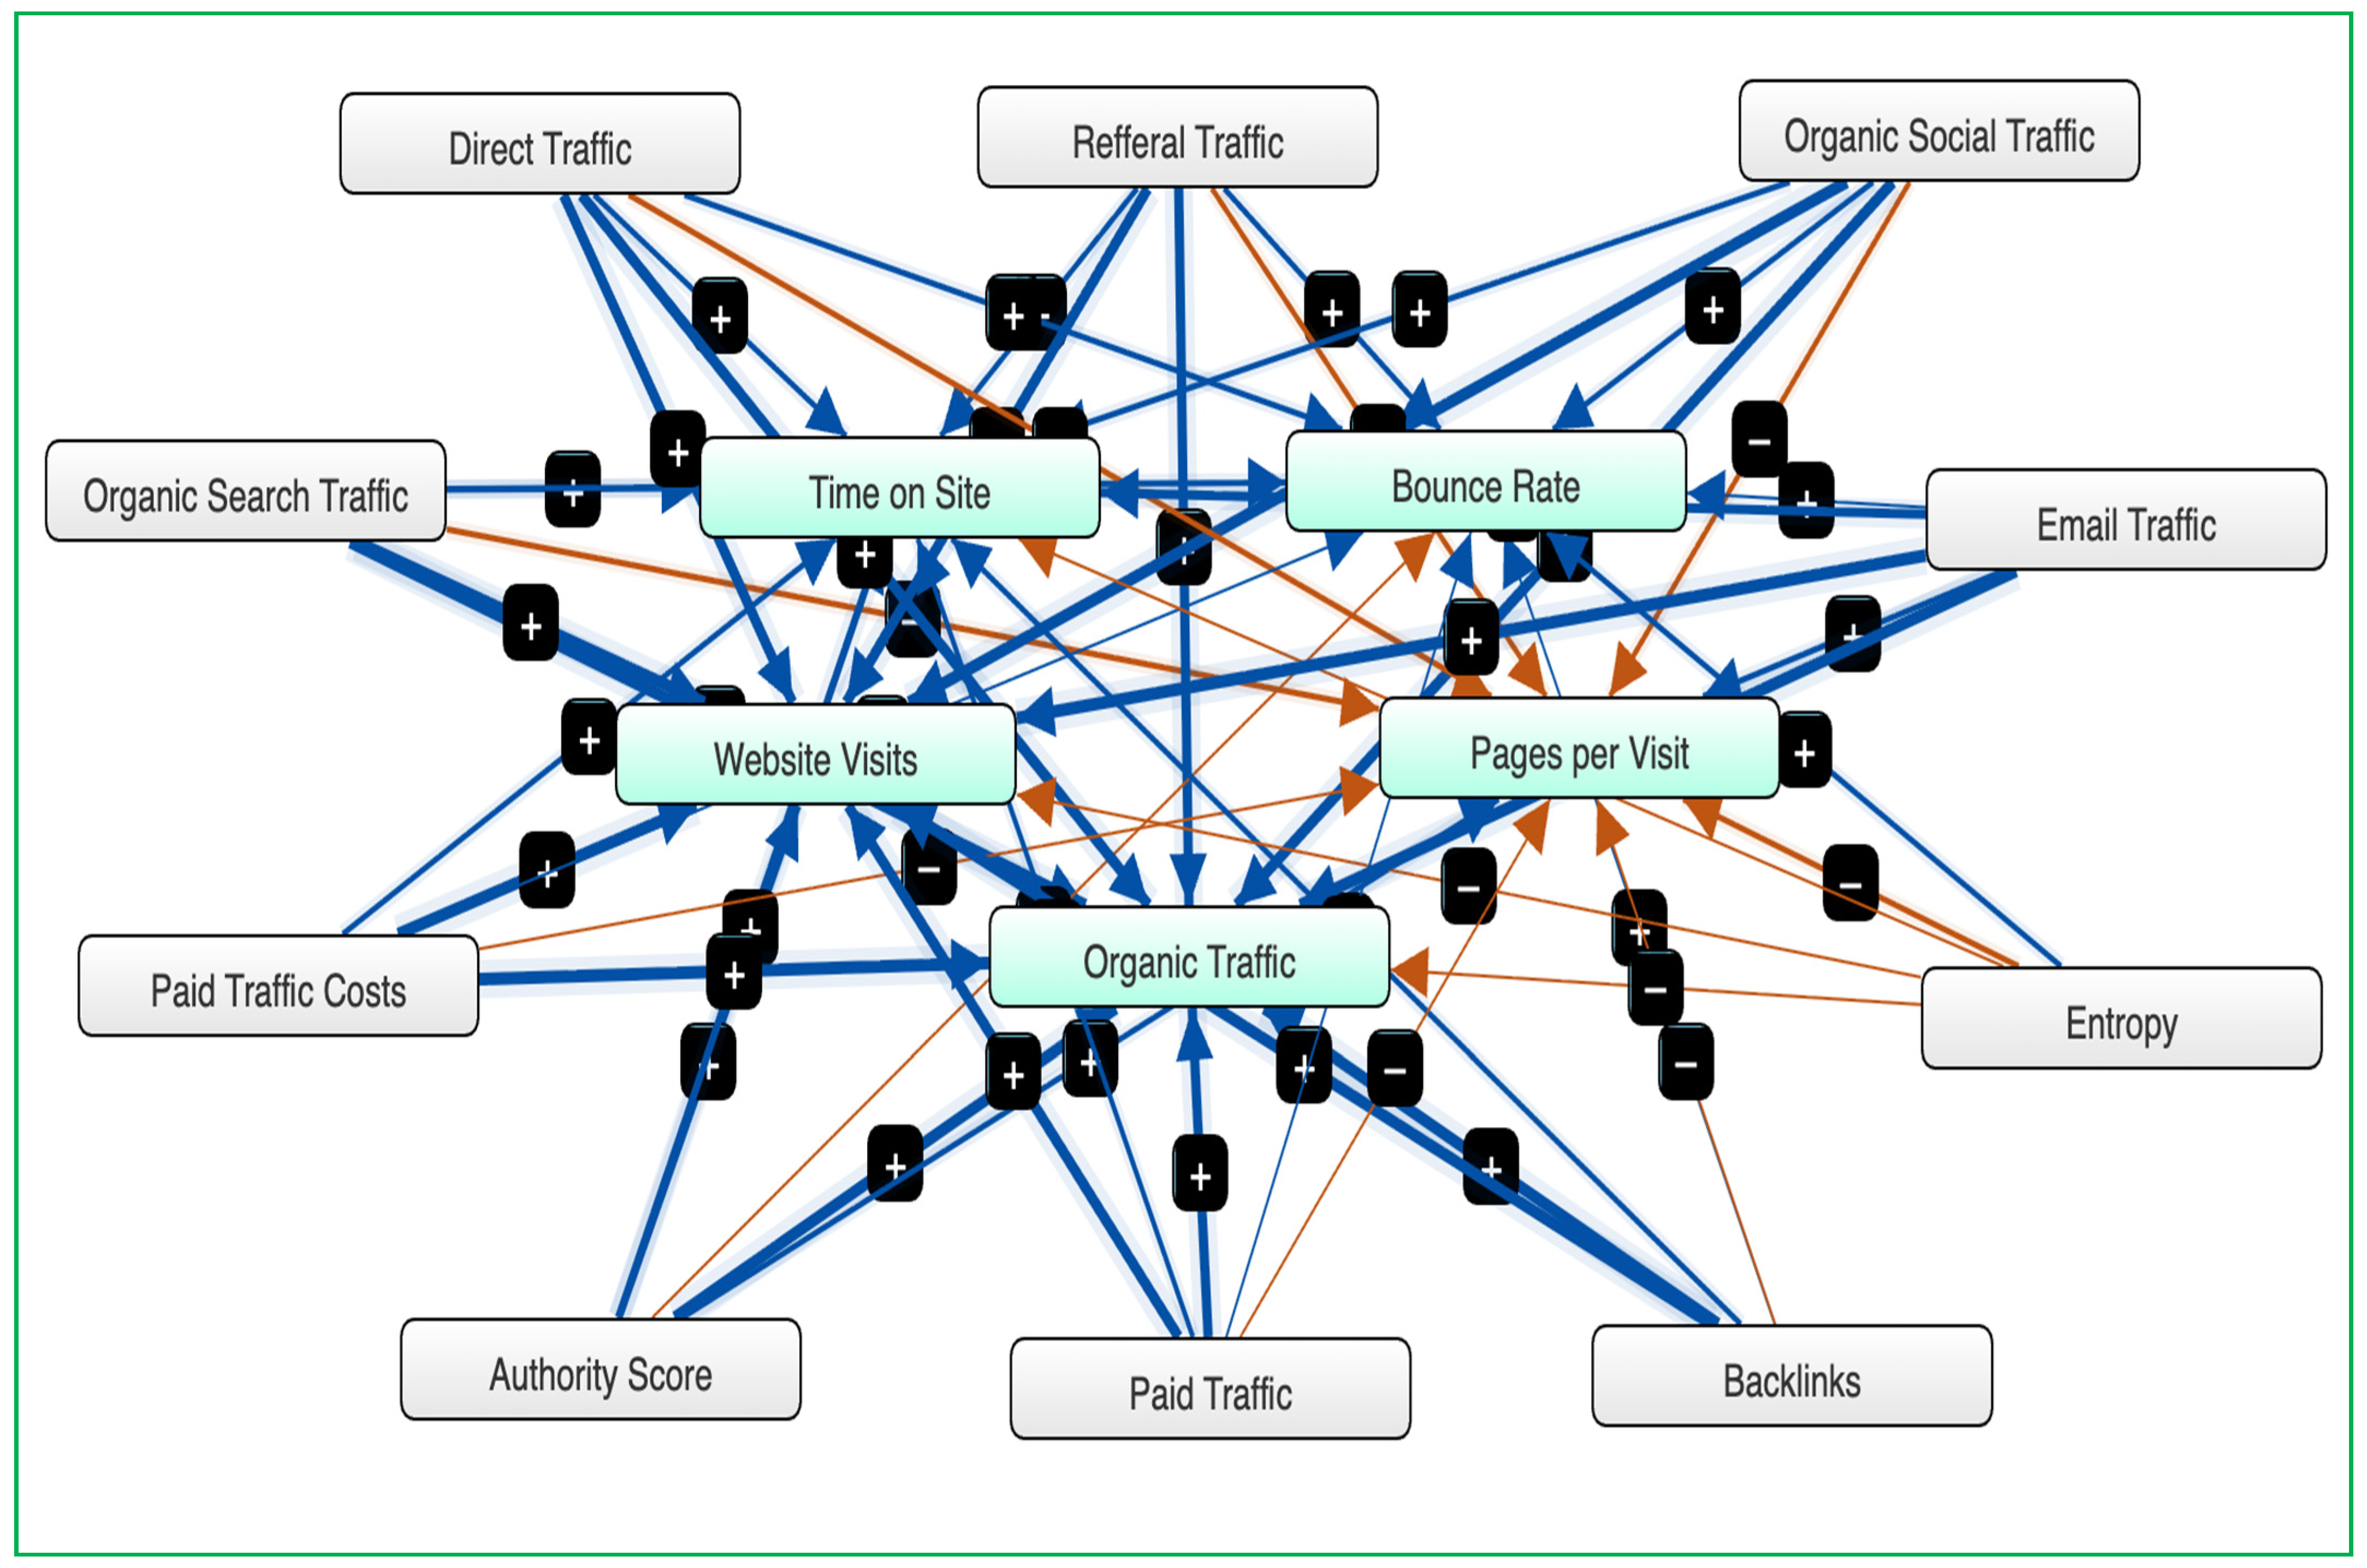
FCM has become an increasingly popular methodology for modelling complex decision-making environments, particularly in contexts where interdependencies between multiple variables must be understood holistically [46,47,48,49,50,51]. Its hybrid structure, combining elements of graph theory and fuzzy logic, allows for the representation of both causal relationships and the uncertainty inherent in managerial decision-making [52]. In digital analytics and online consumer behaviour research, FCM is particularly valuable because it captures non-linear interactions between traffic sources, engagement indicators and conversion-related performance [48]. By simulating variations in acquisition channels and engagement metrics, FCM provides a dynamic perspective on how shifts in digital strategies propagate across the ecosystem of website performance. This makes it a useful tool not only for descriptive insights but also for scenario testing and strategic forecasting, especially in industries characterised by volatile demand and high digital dependency, such as the cruise sector [46,49]. For FCM calibration, regression and correlation coefficients were solely used, based on the structure of the Mental Modeler (version 14.0, Kiff Consulting LLC). Figure 8 below shows the development of the FCM model in the present study.
The scenario analysis conducted through the FCM model provides a dynamic simulation of how changes in acquisition and engagement variables influence the overall performance of cruise industry websites. Unlike static statistical approaches, scenario testing allows researchers to explore the sensitivity of the system under both growth and contraction conditions, revealing hidden interdependencies and non-linear effects. By applying incremental positive and negative variations to key input variables, the analysis captures how digital ecosystems respond asymmetrically to strategic shifts. This approach is particularly relevant in competitive and volatile markets, where firms must anticipate not only the benefits of channel expansion but also the risks associated with overreliance on certain acquisition sources.
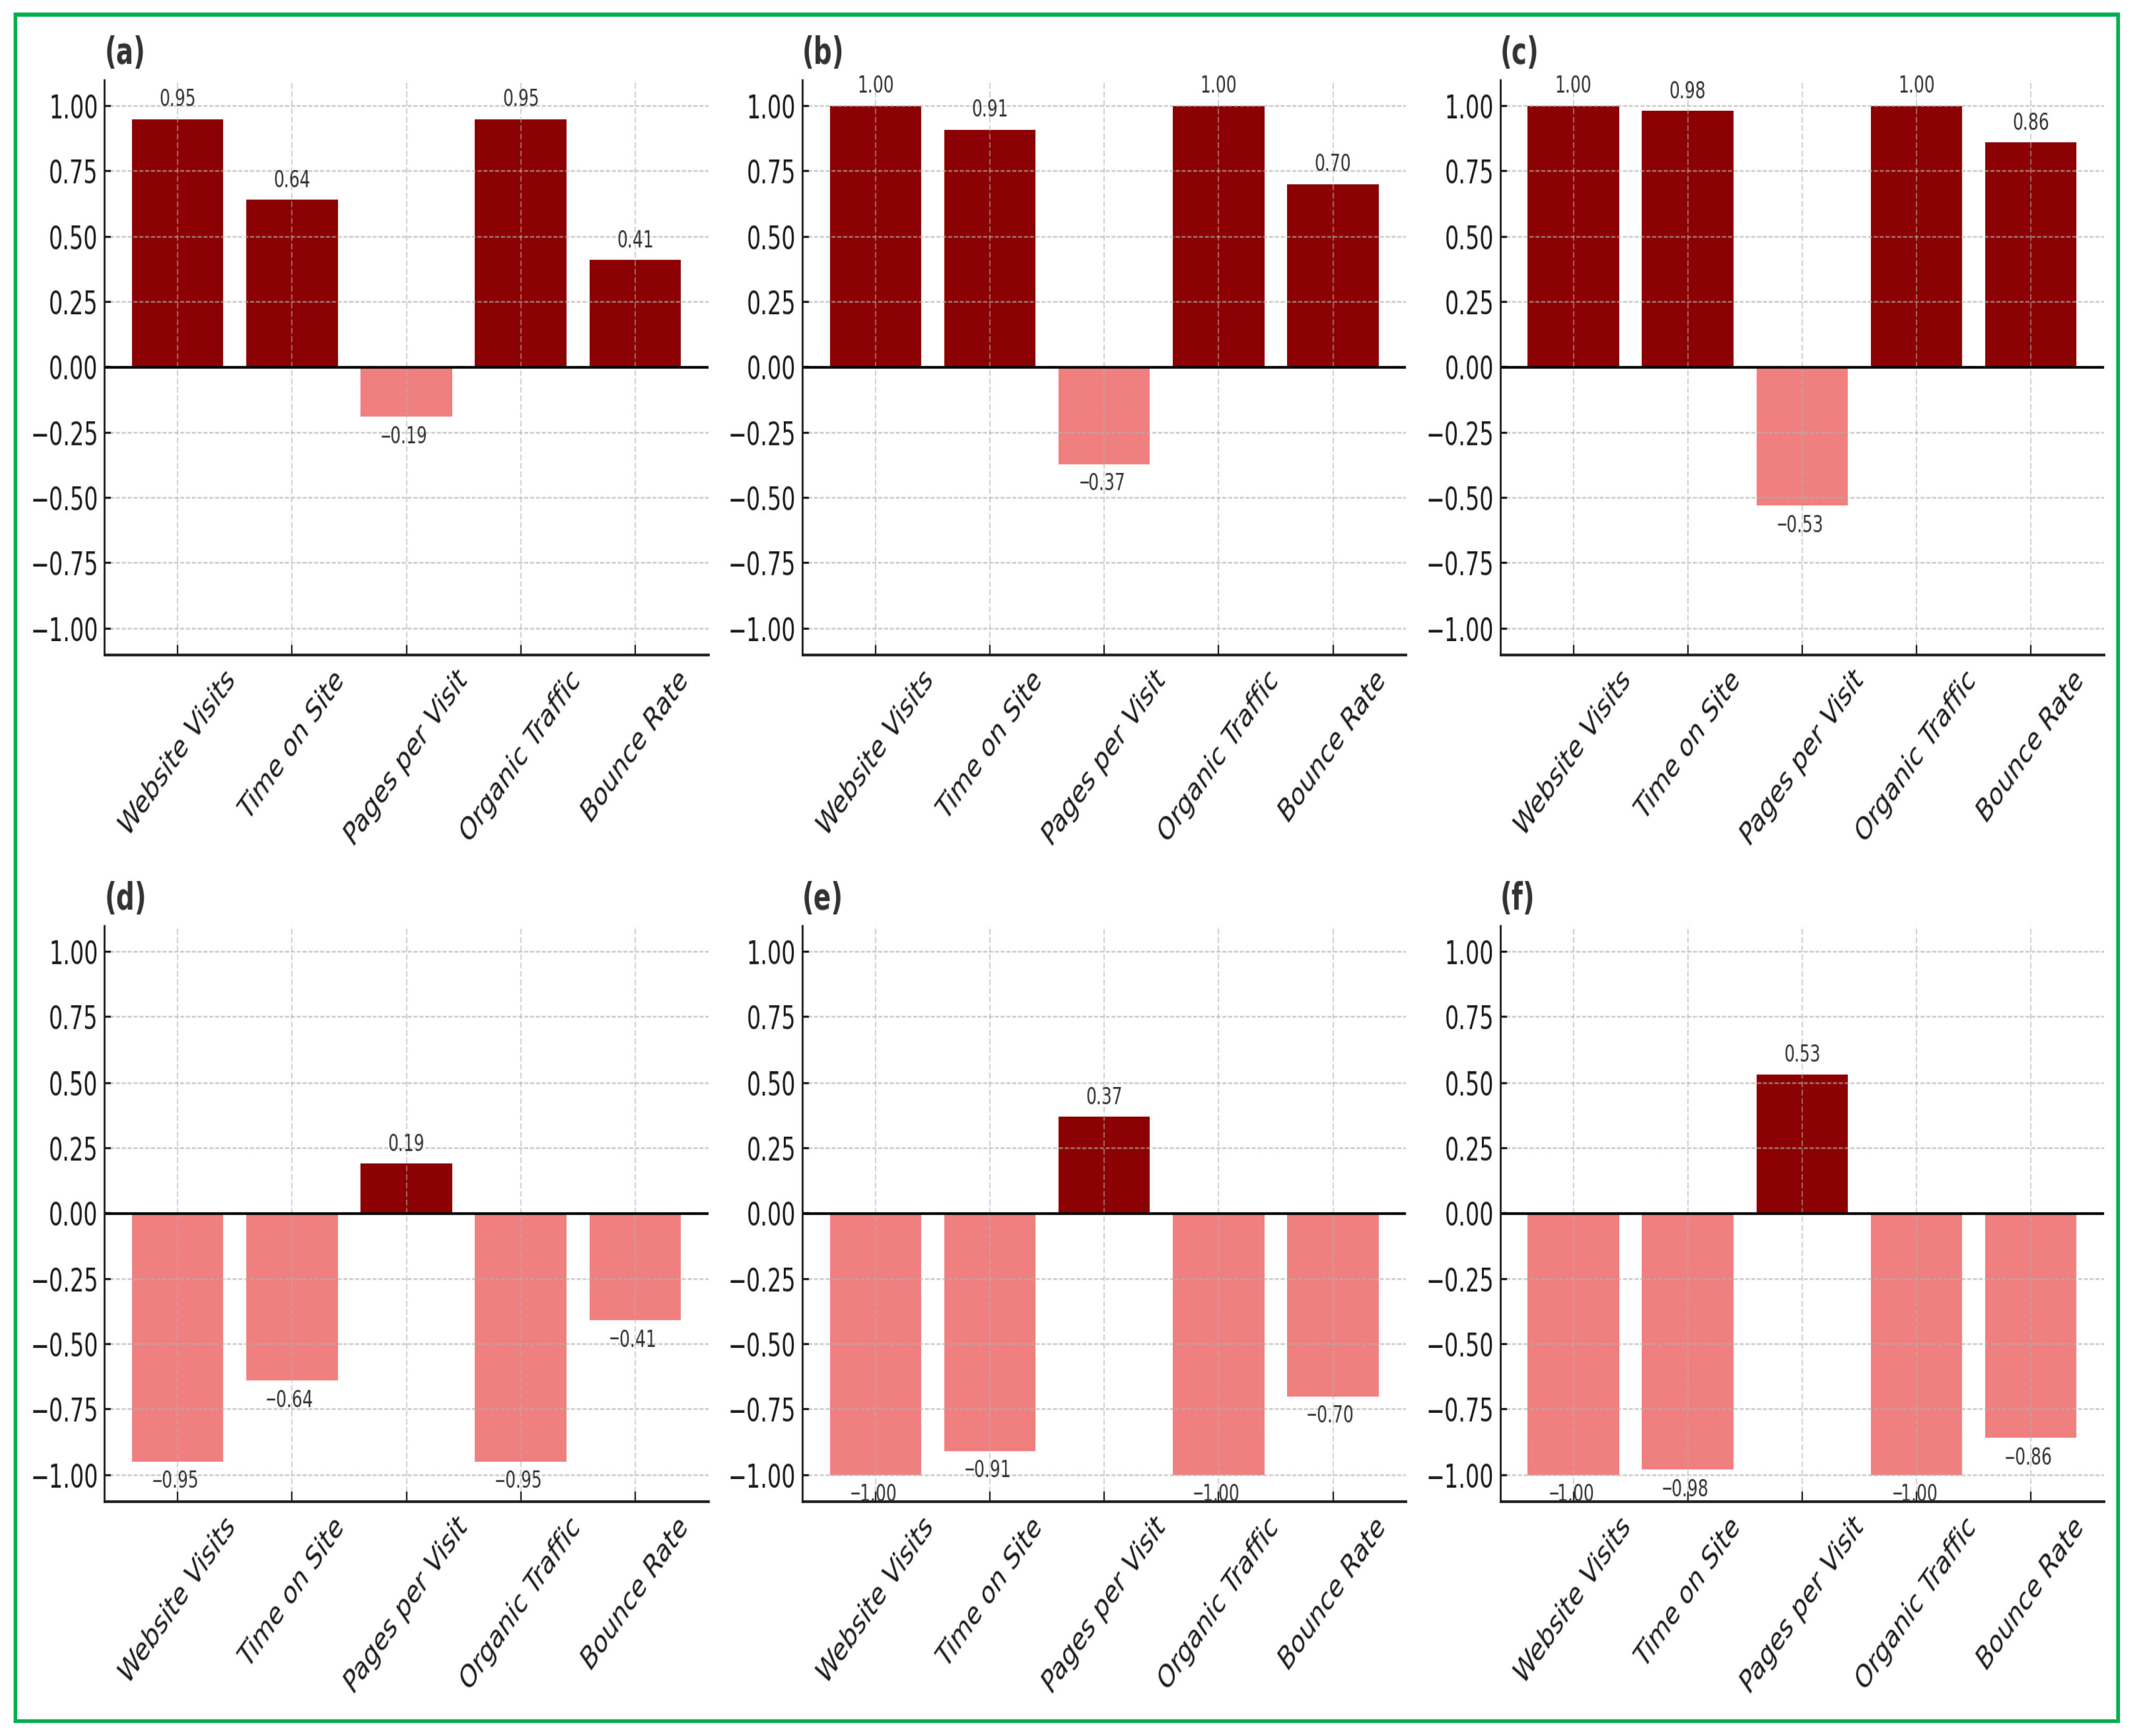
Figure 9a–c illustrate the impact of positive variation scenarios (+25%, +50%, +75%) across key input variables. Results consistently demonstrate that website visits and organic traffic exhibit strong alignment with engagement outcomes such as time on site and bounce rate reduction. However, the measure of pages per visit displays a counterintuitive negative response, suggesting diminishing marginal returns of visit depth when acquisition volumes rise sharply. This effect highlights the potential of information overload or less-targeted acquisition strategies, where higher traffic does not necessarily translate into deeper browsing [53].
Figure 9d–f, representing negative variation scenarios (−25%, −50%, −75%), show the vulnerabilities of channel diversification strategies under contraction. Here, overreliance on paid or referral channels appears to reduce engagement consistency, with negative associations emerging between acquisition sources and key outcome indicators such as organic traffic and time on site. In particular, the −75% scenario (Figure 9f) shows the steepest decline in engagement alignment, underlining the systemic fragility of digital ecosystems when one or more channels face disruption. These findings reinforce the view that digital strategies must balance growth-oriented channel expansion with sustainability considerations, ensuring resilience against sudden shocks [51,54].
Overall, the FCM scenarios validate the methodological utility of fuzzy cognitive modelling in capturing feedback loops within digital performance systems. They further highlight that both growth and contraction scenarios generate asymmetric effects, providing actionable insights for managers aiming to optimise traffic allocation and engagement outcomes.

5. Discussion

This study’s findings demonstrate a complex link among acquisition channels, user engagement and authority signals. Contrary to original expectations, the results reveal an inverse link between organic search and referral traffic and engagement. Both organic search share and referral share demonstrated a negative correlation with time on site and pages per visit, while concurrently displaying a positive association with bounce rate. This indicates that while these platforms enhance visibility, the traffic they generate may exhibit predominantly transactional or information-seeking behaviour, failing to foster deeper interaction. Paid traffic, although evidently effective in increasing visit volumes, has little ability to improve engagement results. The significant correlation among paid traffic costs, paid visits and total website visits underscores the crucial importance of investment in visibility. These data indicate that such traffic does not promote prolonged interaction, supporting the view that paid techniques are more effective for acquisition than for retention or meaningful engagement. From the point of view of digital innovation, this shows how traditional paid strategies are limited and the need for more flexible, data-driven and knowledge-based ways to engage users, where companies use behavioural analytics to create new user journeys instead of just increasing their reach. Authority signals demonstrate a strong and consistent correlation with organic visibility. Both authority score and backlinks are significant predictors of organic traffic, suggesting that enhanced reputational and linking profiles yield greater reach. These parameters show minimal influence on bounce rate, underscoring a disparity between visibility and engagement. This difference shows a crucial fact for creating value based on knowledge: authority alone is not enough to make something valuable; it needs to be paired with content and design innovations that turn visibility into real, experience-driven value.
Consequently, authority may more accurately reflect discoverability than the quality of post-click experiences. Email stands up as a particularly strong catalyst for engagement when evaluating other content-sharing methods. Email sharing exhibits a robust correlation with time spent on the site and pages viewed per visit, establishing it as a notably high-value acquisition channel. Conversely, organic social sharing exhibits a diminished correlation, indicating that socially driven visits may be briefer and more superficial. This underscores the need of personalised and direct communication tactics, such as email, for fostering deeper involvement. The diversification of acquisition channels, quantified by the entropy index, was anticipated to enhance traffic stability and diminish bounce rates. Nevertheless, the results demonstrate merely feeble and inconsistent impacts. Entropy demonstrated no consistent correlation with website visits and, surprisingly, displayed a marginal positive link with bounce rate. This indicates that in the current dataset, diversification is not a dependable predictor of traffic stability or engagement. The limited range of entropy values in the sample may restrict the capacity to identify more pronounced impacts. Email and other direct, data-driven channels of contact are very effective. This is because they use digital innovation to personalise and build relationships, turning behavioural insights into customised interactions that create value.
The results suggest that engagement is not solely influenced by traffic volume or acquisition diversity, but rather by distinct characteristics of traffic sources. Paid traffic increases visibility but does not deepen engagement, whereas authority enhances discoverability without diminishing first exits. Email serves as a more effective medium for promoting engagement, highlighting the significance of relational over just transactional interactions. These findings enhance the comprehension of how various acquisition techniques correlate with visibility and user experience. These findings add to the conversation about digital innovation by showing how behavioural analytics can help create smarter, knowledge-based strategies for creating value in digital ecosystems—moving beyond simple visibility metrics and towards models of user engagement and retention that are based on facts.
Overall, these findings further enhance the theoretical discourse by connecting behavioural analytics to the Knowledge-Based View (KBV). Behavioural data serve as essential information assets that empower organisations to create digitally by transforming user interaction patterns into strategic insights. The negative associations seen between organic or referral traffic and engagement underscore the significance of audience quality above sheer quantity. The results indicate that increased exposure may draw information-seeking users who contribute less to ongoing engagement, highlighting the necessity for knowledge-driven tactics that prioritise significant, relationship-focused interactions. In this context, behavioural analytics not only delineate user activity but also provide a basis for digital innovation and knowledge-based value generation.

6. Conclusions

This study investigated how digital acquisition channels, engagement indicators and reputation metrics jointly influence website performance and innovation capability in the global cruise industry. It addressed a persistent gap in tourism research, where digital marketing performance is typically analysed through isolated indicators, that is to say visibility, conversion or engagement, rather than an integrated framework capturing their interdependencies [5,6]. By combining regression analysis with FCM, the study advances an analytical approach that bridges linear prediction with systemic feedback representation.
The findings reveal that acquisition, engagement and reputation constitute an interdependent digital ecosystem rather than separate performance dimensions. Organic and referral channels enhance visibility yet fail to sustain engagement depth, confirming that exposure does not automatically translate into loyalty. Paid campaigns boost reach but contribute little to engagement quality. Conversely, email emerges as a relational channel that deepens user interaction, supporting the idea that personalised communication fosters sustained attention. Authority and backlink metrics are confirmed as decisive predictors of organic visibility, underscoring that reputation mediates the relationship between acquisition quality and website success [10,42].
FCM simulations expand these statistical findings, revealing asymmetric responses within the digital ecosystem. Expansion scenarios increase visits and authority but can reduce browsing depth, whereas contraction scenarios expose vulnerabilities in firms over-dependent on paid or referral traffic. This asymmetry demonstrates that digital ecosystems are non-linear: growth and decline do not mirror each other and strategic resilience depends on balanced, knowledge-driven diversification.
Collectively, the findings address the three research questions directly:
  • (RQ1) Different digital acquisition channels exert distinct, often contrasting, effects on engagement and overall performance.
  • (RQ2) Reputation and authority metrics act as mediating resources that convert engagement quality into visibility and trust.
  • (RQ3) Behavioural analytics uncover the feedback mechanisms through which acquisition, engagement and reputation co-evolve within a dynamic learning system.
When it comes to RQ1, the data show that engagement is affected by the quality of the interaction more than the amount of traffic. Paid channels increase awareness but do not deepen engagement. Email-based acquisition, on the other hand, is much better at building relationships with users and keeping them involved over time. This shows how personalised communication based on behaviour is an example of a digital innovation that turns data into relationship value. When it comes to RQ2, authority signs like backlinks and authority score have a big effect on organic visibility but not on bounce rate or session depth. This difference shows that reputational authority makes something easier to find but does not automatically make people want to interact with it. This shows how important it is to use knowledge-based, integrated methods that turn exposure into user value. In response to RQ3, the results show that behavioural analytics give us a complete picture of how acquisition, engagement and authority change together. Diversification by itself does not have much of an impact, but the behavioural perspective provides a solid base for evidence-based digital innovation, leading cruise businesses to smarter, more flexible and value-driven digital strategies.
These findings reframe digital competitiveness as a product of organisational learning rather than marketing spend. Cruise firms capable of continuously interpreting and reapplying behavioural insights can transform analytics into adaptive decision-making and innovation capacity. The study advances the KBV by empirically showing how behavioural data become organisational knowledge that drives strategic renewal [11,33]. By demonstrating how behavioural data evolve into organisational knowledge through analytics-driven feedback, the study validates the KBV assumption that competitive advantage stems from learning capabilities rather than technological endowments.
In essence, this research redefines digital marketing performance as a learning-based process embedded in complex feedback systems. Cruise firms that cultivate such knowledge loops achieve greater innovation agility and resilience in volatile digital environments. The integrative framework proposed here not only closes an empirical gap in cruise-tourism analytics but also contributes to broader discussions on how data-driven organisations convert behavioural information into strategic knowledge and sustainable advantage.

6.1. Theoretical Implications

The study contributes to the KBV by empirically demonstrating how behavioural analytics function as organisational knowledge resources rather than merely performance indicators. Where prior research emphasised technology adoption or data volume, the present findings show that competitive advantage arises from firms’ capacity to interpret, integrate and reapply behavioural data through continuous feedback loops. This interpretation extends KBV beyond its traditional focus on human or structural capital to encompass digital, algorithmic and behavioural knowledge assets that evolve dynamically within online ecosystems [6,44].
The results also refine digital-ecosystem theory by showing how acquisition, engagement and reputation operate as interdependent knowledge-exchange mechanisms. Within this system, authority metrics represent externally validated knowledge, while engagement indicators embody experiential knowledge generated through user interaction. Their recursive interplay transforms data into learning cycles, offering a micro-level mechanism through which digital innovation emerges—thus operationalising KBV in a networked, data-intensive context.
From a methodological standpoint, the study advances the epistemology of tourism analytics by combining regression with FCM. Whereas regression quantifies direct effects, FCM models feedback and non-linearity, capturing how digital-marketing variables mutually reinforce or offset one another. This hybrid framework bridges positivist and systemic paradigms, providing a theoretical template for examining knowledge flows in other service ecosystems where causality is recursive rather than unidirectional.
Finally, the findings challenge conventional assumptions about digital visibility and effectiveness. They suggest that more traffic does not inherently imply greater engagement or knowledge creation; rather, strategic value emerges from the firm’s interpretive and recombinative capabilities. This insight aligns KBV with contemporary understandings of organisational learning in data-driven environments, where value depends on the transformation—not the possession—of information.
Together, these contributions reposition behavioural analytics as a foundational element of knowledge-based competitiveness and extend theoretical models of digital transformation toward adaptive, feedback-driven learning systems.

6.2. Managerial Implications

The results provide several strategic insights for managers of cruise and tourism organisations seeking to leverage digital ecosystems for performance and innovation.
First, channel management should prioritise quality of engagement over sheer traffic volume. The analysis demonstrates that organic and referral visits increase visibility but may not sustain user attention or depth of interaction. Managers should design acquisition strategies that prioritise relevant, high-engagement visitors rather than maximising reach. Paid campaigns can complement this mix but must be carefully monitored to prevent high-cost, low-loyalty traffic. Email and content-driven channels emerge as key vehicles for relational engagement, suggesting that CRM (Customer Relationship Management) systems and personalised communication remain essential even in data-saturated environments.
Second, online authority and reputation should be treated as strategic assets rather than by-products of marketing. Authority metrics—domain reputation, backlinks and trust flow—directly mediate the relationship between engagement quality and visibility. Investing in credible content partnerships, influencer collaborations and third-party endorsements strengthens both algorithmic ranking and user trust. This reinforces the need for integrated digital governance, where marketing, analytics and communication units jointly manage brand authority as a measurable knowledge resource.
Third, managers should approach digital ecosystems as dynamic learning systems. The FCM simulations highlight how small changes in one variable (e.g., reduced paid traffic) can propagate throughout the system, altering engagement and reputation outcomes. Continuous monitoring, simulation and scenario testing should thus form part of routine strategic planning. Tools that visualise causal feedback—similar to FCM—can support what-if analyses, allowing firms to anticipate unintended consequences of marketing adjustments. This transforms analytics from diagnostic dashboards into decision-support infrastructures.
Overall, the managerial implication of this study is clear: success in data-intensive tourism markets depends not only on acquiring data but on cultivating organisational routines that interpret, learn from and strategically act upon behavioural analytics. This managerial learning perspective provides the bridge between digital transformation and sustainable innovation.

6.3. Limitations and Future Research

While this study offers an integrative framework for analysing digital ecosystems in cruise tourism, several limitations qualify the interpretation of its findings and suggest fertile directions for future research.
First, the analysis is restricted to publicly available web-analytics data from leading global cruise firms. Although this approach ensures comparability and transparency, it cannot fully capture offline interactions, loyalty-programme dynamics or proprietary CRM data. Future studies could combine internal and external datasets—integrating social-media sentiment, mobile-app use or customer-relationship records—to construct more holistic behavioural models.
Second, the cross-sectional design limits causal inference. While regression and FCM reveal structural relationships and feedback dynamics, they cannot track how these evolve over time. Longitudinal or panel-based FCM studies could explore the temporal stability of digital-engagement loops, distinguishing transient campaign effects from sustained learning processes.
Third, the focus on cruise firms constrains the generalisability of results across tourism subsectors. Cruises operate under unique brand architectures and regulatory environments that may amplify or dampen digital interactions. Comparative research across airlines, hotels and destination marketing organisations would test the transferability of the proposed framework and clarify sector-specific digital-learning mechanisms.
Fourth, the model’s quantitative emphasis necessarily simplifies the socio-cognitive dimensions of managerial interpretation. KBV suggests that organisational learning depends not only on data structures but also on human sense-making. Future qualitative or mixed-method research—through interviews, ethnography or cognitive mapping workshops—could examine how managers actually perceive and use behavioural analytics in strategic decision-making.
Finally, methodological innovation remains an open frontier. The hybrid regression–FCM approach could be expanded with machine-learning classifiers to capture uncertainty and adaptive learning more precisely. Developing explainable AI tools that visualise causal pathways would further enhance managerial interpretability and theoretical transparency.
The sample size of 35 firm-month observations could potentially limit the statistical generalizability of the findings, although it provides valuable insights into the leading actors of the global cruise sector. Moreover, as the dataset relies on publicly available web-analytics sources, offline interactions and proprietary CRM data could not be captured, potentially overlooking behavioural nuances in customer relationships. Future studies should therefore expand the scope through larger, longitudinal and cross-industry datasets to reinforce the empirical robustness and external validity of the proposed framework.
In summary, acknowledging these limitations underscores the study’s contribution as a conceptual foundation rather than a definitive model. By outlining a research agenda that integrates richer data, longitudinal design, cross-sector comparison and human-centred inquiry, future scholarship can extend understanding of how behavioural analytics drive knowledge-based innovation in tourism and other data-intensive service ecosystems.

Supplementary Materials

The following supporting information can be downloaded at https://files.fm/u/48v5kdwph3 (accessed on 10 September 2025).

Author Contributions

Conceptualization, D.P.R., N.T.G., M.C.T., D.P.S., S.K.T., N.K. and P.R.; methodology, D.P.R., N.T.G., M.C.T., D.P.S., S.K.T., N.K. and P.R.; software, D.P.R., N.T.G., M.C.T., D.P.S., S.K.T., N.K. and P.R.; validation, D.P.R., N.T.G., M.C.T., D.P.S., S.K.T., N.K. and P.R.; formal analysis, D.P.R., N.T.G., M.C.T., D.P.S., S.K.T., N.K. and P.R.; investigation, D.P.R., N.T.G., M.C.T., D.P.S., S.K.T., N.K. and P.R.; resources, D.P.R., N.T.G., M.C.T., D.P.S., S.K.T., N.K. and P.R.; data curation, D.P.R., N.T.G., M.C.T., D.P.S., S.K.T., N.K. and P.R.; writing—original draft preparation, D.P.R., N.T.G., M.C.T., D.P.S., S.K.T., N.K. and P.R.; writing—review and editing D.P.R., N.T.G., M.C.T., D.P.S., S.K.T., N.K. and P.R.; visualisation, D.P.R., N.T.G., M.C.T., D.P.S., S.K.T., N.K. and P.R.; supervision, D.P.R., N.T.G., M.C.T., D.P.S., S.K.T., N.K. and P.R.; project administration, D.P.R., N.T.G., M.C.T., D.P.S., S.K.T., N.K. and P.R.; funding acquisition, D.P.R., N.T.G., M.C.T., D.P.S., S.K.T., N.K. and P.R. All authors have read and agreed to the published version of the manuscript.

Funding

This research received no external funding.

Institutional Review Board Statement

Not applicable.

Informed Consent Statement

Not applicable.

Data Availability Statement

The data presented in this study are available on request from the corresponding author.

Conflicts of Interest

The authors declare no conflicts of interest.

References

  1. Sakas, D.P.; Terzi, M.C.; Kamperos, I.D.G.; Kriemadis, A. Cruise Industry Crisis Risk Management and Recovery Strategies Utilizing Crowdsourcing Data. In Computational and Strategic Business Modelling; Sakas, D.P., Nasiopoulos, D.K., Taratuhina, Y., Eds.; IC-BIM 2021; Springer Proceedings in Business and Economics; Springer: Cham, Switzerland, 2021. [Google Scholar] [CrossRef]
  2. Meng, S.; Li, H.; Wu, X. International Cruise Research Advances and Hotspots: Based on Literature Big Data. Front. Mar. Sci. 2023, 10, 1135274. [Google Scholar] [CrossRef]
  3. Buhalis, D.; Papathanassis, A.; Vafeidou, M. Smart cruising: Smart technology applications and their diffusion in cruise tourism. J. Hosp. Tour. Technol. 2022, 13, 626–649. [Google Scholar] [CrossRef]
  4. Hoarau-Heemstra, H.; Wigger, K.; Olsen, J.; James, L. Cruise tourism destinations: Practices, consequences and the road to sustainability. J. Destin. Mark. Manag. 2023, 30, 100820. [Google Scholar] [CrossRef]
  5. Dwivedi, Y.K.; Ismagilova, E.; Hughes, L.; Carlson, J.; Filieri, R.; Jacobson, J.; Jain, V.; Karjaluoto, H.; Kefi, H.; Krishen, A.S.; et al. Setting the Future of Digital and Social Media Marketing Research: Perspectives and Research Propositions. Int. J. Inf. Manag. 2021, 57, 102324. [Google Scholar] [CrossRef]
  6. Mariani, M.; Baggio, R. Big data and analytics in hospitality and tourism: A systematic literature review. Int. J. Contemp. Hosp. Manag. 2022, 34, 231–278. [Google Scholar] [CrossRef]
  7. Sakas, D.P.; Reklitis, D.P.; Trivellas, P. Social Media Analytics for Customer Satisfaction Based on User Engagement and Interactions in the Tourism Industry. In Computational and Strategic Business Modelling; Sakas, D.P., Nasiopoulos, D.K., Taratuhina, Y., Eds.; Springer Proceedings in Business and Economics; Springer: Cham, Switzerland, 2024; pp. 127–139. [Google Scholar] [CrossRef]
  8. Jansen, B.J.; Jung, S.-G.; Salminen, J. Measuring user interactions with websites: A comparison of two industry standard analytics approaches using data of 86 websites. PLoS ONE 2022, 17, e0268212. [Google Scholar] [CrossRef]
  9. Reklitis, D.P.; Terzi, M.C.; Sakas, D.P.; Konstantopoulou, C.K. Customer Behaviour in Response to Disaster Announcements: A Big Data Analysis of Digital Marketing in Hospitality. Tour. Hosp. 2025, 6, 112. [Google Scholar] [CrossRef]
  10. Morais, E.P.; Esteves, E.T.; Cunha, C.R. SEO in Rural Tourism: A Case Study of Terras de Trás-os-Montes—Portugal. Information 2025, 16, 465. [Google Scholar] [CrossRef]
  11. Mikalef, P.; Pappas, I.O.; Krogstie, J.; Pavlou, P.A. Big data and business analytics: A research agenda for realizing business value. Inf. Manag. 2019, 57, 103237. [Google Scholar] [CrossRef]
  12. Kulkov, I.; Hellström, M.; Tsvetkova, A.; Malmberg, J. Sustainable Cruise Tourism: Systematic Literature Review and Future Research Areas. Sustainability 2023, 15, 8335. [Google Scholar] [CrossRef]
  13. Espinet, J.M.; Mulet-Forteza, C.; Ferrer-Rosell, B. Big Data and Business Intelligence in Cruise Destinations. In Tourism and ICTs: Advances in Data Science, Artificial Intelligence and Sustainability; Guevara Plaza, A.J., Cerezo Medina, A., Navarro Jurado, E., Eds.; TURITEC 2023; Springer Proceedings in Business and Economics; Springer: Cham, Switzerland, 2023. [Google Scholar] [CrossRef]
  14. Tiago, F.; Couto, J.; Faria, S.; Borges-Tiago, T. Cruise tourism: Social media content and network structures. Tour. Rev. 2018, 73, 433–447. [Google Scholar] [CrossRef]
  15. Sun, X.; Cao, X.; Lau, Y.-y. Exploring cruise tourists’ sentiment expression pattern from online reviews: An insight into market positioning. Tour. Manag. Perspect. 2023, 49, 101195. [Google Scholar] [CrossRef]
  16. McGillivray, R. Cruise Line Web Traffic Surges Over 25% Since 2022. Available online: https://www.cruisehive.com/cruise-line-web-traffic-surges-over-25-since-2022/108778 (accessed on 2 October 2025).
  17. Alzua-Sorzabal, A.; Gerrikagoitia, J.; Rebon Ortiz, F. Tourism Destination Web Monitor: Beyond Web Analytics. 2014. Available online: https://ertr.tamu.edu/files/2014/02/enter2014_RN_136.pdf#:~:text=destinations%2C%20providing%20huge%20volumes%20of,DMO (accessed on 2 October 2025).
  18. Asante, I.O.; Jiang, Y.; Luo, X.; Ankrah Twumasi, M. The Organic Marketing Nexus: The Effect of Unpaid Marketing Practices on Consumer Engagement. Sustainability 2023, 15, 148. [Google Scholar] [CrossRef]
  19. Knox, C.; Gray, S.; Zareei, M.; Wentworth, C.; Aminpour, P.; Wallace, R.V.; Hodbod, J.; Brugnone, N. Modeling complex problems by harnessing the collective intelligence of local experts: New approaches in fuzzy cognitive mapping. Collect. Intell. 2023, 2, 99–112. [Google Scholar] [CrossRef]
  20. Borrero-Domínguez, C.; Escobar-Rodríguez, T. Decision support systems in crowdfunding: A fuzzy cognitive maps (FCM) approach. Decis. Support Syst. 2023, 173, 114000. [Google Scholar] [CrossRef]
  21. Ogutu, H.; Adol, G.F.C.; Bujdosó, Z.; Andrea, B.; Fekete-Farkas, M.; Dávid, L.D. Theoretical Nexus of Knowledge Management and Tourism Business Enterprise Competitiveness: An Integrated Overview. Sustainability 2023, 15, 1948. [Google Scholar] [CrossRef]
  22. Buhalis, D.; Sinarta, Y. Real-time co-creation and nowness service: Lessons from tourism and hospitality. J. Travel Tour. Mark. 2019, 36, 563–582. [Google Scholar] [CrossRef]
  23. Monzon Baeza, V.; Ortiz, F.; Herrero Garcia, S.; Lagunas, E. Enhanced Communications on Satellite-Based IoT Systems to Support Maritime Transportation Services. Sensors 2022, 22, 6450. [Google Scholar] [CrossRef] [PubMed]
  24. Papathanassis, A. Cruise tourism management: State of the art. Tour. Rev. 2017, 72, 104–119. [Google Scholar] [CrossRef]
  25. Lin, L.-Y.; Tsai, C.-C.; Lee, J.-Y. A Study on the Trends of the Global Cruise Tourism Industry, Sustainable Development, and the Impacts of the COVID-19 Pandemic. Sustainability 2022, 14, 6890. [Google Scholar] [CrossRef]
  26. Giousmpasoglou, C.; Marinakou, E.; Zopiatis, A. Hospitality managers in turbulent times: The COVID-19 crisis. Int. J. Contemp. Hosp. Manag. 2021, 33, 1297–1318. [Google Scholar] [CrossRef]
  27. Tavares, J.M.; Cobanoglu, C.; Ivanov, S. Generation Z and Non-Generation Z as Potential Sea Cruisers. Tour. Mar. Environ. 2021, 16, 113–124. [Google Scholar] [CrossRef]
  28. Zeqiri, A.; Ben Youssef, A.; Maherzi Zahar, T. The Role of Digital Tourism Platforms in Advancing Sustainable Development Goals in the Industry 4.0 Era. Sustainability 2025, 17, 3482. [Google Scholar] [CrossRef]
  29. Islam, T.; Pradhan, B.; Nor, R.N.H.; Saleh, R.A.; Kumar, J. Unveiling the Landscape of Cruise Tourism Research: A Bibliometric Analysis and Visualisation. Pertanika J. Soc. Sci. Humanit. 2024, 32, 887–908. [Google Scholar] [CrossRef]
  30. Papathanassis, A. Cruise tourism research: A horizon 2050 paper. Tour. Rev. 2025, 80, 165–180. [Google Scholar] [CrossRef]
  31. Cai, Y.; Li, G.; Wen, L.; Liu, C. Intellectual Landscape and Emerging Trends of Big Data Research in Tourism and Hospitality: A Scientometric Analysis. Int. J. Hosp. Manag. 2024, 117, 103633. [Google Scholar] [CrossRef]
  32. Gutierriz, I.; Ferreira, J.J.; Fernandes, P.O. Digital transformation and the new combinations in tourism: A systematic literature review. Tour. Hosp. Res. 2023, 25, 194–213. [Google Scholar] [CrossRef]
  33. Nonaka, I.; Hirotaka, T. The Wise Company: How Companies Create Continuous Innovation; Oxford University Press: New York, NY, USA, 2019. [Google Scholar]
  34. Sakas, D.P.; Reklitis, D.P.; Terzi, M.C.; Vassilakis, C. Multichannel Digital Marketing Optimizations through Big Data Analytics in the Tourism and Hospitality Industry. J. Theor. Appl. Electron. Commer. Res. 2022, 17, 1383–1408. [Google Scholar] [CrossRef]
  35. Tang, L.; Wang, X.; Kim, E. Predicting Conversion Rates in Online Hotel Bookings with Customer Reviews. J. Theor. Appl. Electron. Commer. Res. 2022, 17, 1264–1278. [Google Scholar] [CrossRef]
  36. Blanco-Moreno, S.; González-Fernández, A.M.; Muñoz-Gallego, P.A.; Casaló, L.V. Understanding engagement with Instagram posts about tourism destinations. J. Destin. Mark. Manag. 2024, 34, 100948. [Google Scholar] [CrossRef]
  37. Christou, E.; Giannopoulos, A.; Simeli, I. The Evolution of Digital Tourism Marketing: From Hashtags to AI-Immersive Journeys in the Metaverse Era. Sustainability 2025, 17, 6016. [Google Scholar] [CrossRef]
  38. Abayomi, A.A.; Ogeawuchi, J.C.; Onifade, A.Y.; Agboola, O.A.; Dosumu, R.E.; George, O.O. Systematic review of marketing attribution techniques for omnichannel customer acquisition models. Int. J. Adv. Multidiscip. Res. Stud. 2023, 3, 1621–1633. [Google Scholar] [CrossRef]
  39. Al-Haraizah, A.; Abdelfattah, F.A.; Rehman, S.U.; Ismaeel, B.; Mufleh, M.; Omeish, F.Y. The impact of search engine optimization and website engagement towards customer buying behaviour. Glob. Knowl. Mem. Commun. 2025; ahead-of-print. [Google Scholar] [CrossRef]
  40. Albqaeen, J.; Al Ajlouni, B.; Amayreh, M. The Influence of Social Media Engagement and Customer Satisfaction on Booking Intention in Five-Star Hotels in Jordan: The Mediating Role of Information Trust. Int. J. Acad. Res. Bus. Soc. Sci. 2025, 15, 1078–1086. [Google Scholar] [CrossRef]
  41. Chatterjee, S.; Rana, N.P.; Khorana, S.; Mikalef, P.; Sharma, A. Assessing Organizational Users’ Intentions and Behavior to AI Integrated CRM Systems: A Meta-UTAUT Approach. Inf. Syst. Front. 2023, 25, 1299–1313. [Google Scholar] [CrossRef]
  42. Roy, G. Travelers’ online review on hotel performance—Analyzing facts with the Theory of Lodging and sentiment analysis. Int. J. Hosp. Manag. 2023, 111, 103459. [Google Scholar] [CrossRef]
  43. Tajvidi, R.; Karami, A. The effect of social media on firm performance. Comput. Hum. Behav. 2017, 115, 105174. [Google Scholar] [CrossRef]
  44. Mikalef, P.; Parmiggiani, E. A Framework for Digital Transformation for Research and Practice: Putting Things into Perspective. In Digital Transformation in Norwegian Enterprises; Mikalef, P., Parmiggiani, E., Eds.; Springer: Cham, Switzerland, 2022. [Google Scholar] [CrossRef]
  45. Wu, D.C.; Zhong, S.; Wu, J.; Song, H. Tourism and Hospitality Forecasting With Big Data: A Systematic Review of the Literature. J. Hosp. Tour. Res. 2024, 49, 615–634. [Google Scholar] [CrossRef]
  46. Cuong, T.N.; Kim, H.S.; Long, L.N.B.; You, S.S. Seaport profit analysis and efficient management strategies under stochastic disruptions. Marit. Econ. Logist. 2024, 26, 212–240. [Google Scholar] [CrossRef]
  47. Glykas, M. Fuzzy Cognitive Maps: Advances in Theory, Methodologies, Tools and Applications; Springer: Berlin, Germany, 2010; Volume 247. [Google Scholar] [CrossRef]
  48. Krimpas, G.A.; Krimpas, N.A.; Groumpos, P.P. An Overview of Making Decisions on Medical Problems Using Fuzzy Cognitive Maps. In 2023 14th International Conference on Information, Intelligence, Systems & Applications (IISA); IEEE: Piscataway, NJ, USA, 2023; pp. 1–6. [Google Scholar]
  49. Li, X.; Law, R.; Xie, G.; Wang, S. Review of tourism forecasting research with internet data. Tour. Manag. 2021, 83, 104245. [Google Scholar] [CrossRef]
  50. Papageorgiou, K.; Carvalho, G.; Papageorgiou, E.I.; Bochtis, D.; Stamoulis, G. Decision-Making Process for Photovoltaic Solar Energy Sector Development using Fuzzy Cognitive Map Technique. Energies 2020, 13, 1427. [Google Scholar] [CrossRef]
  51. Qiu, D.; Lv, B.; Chan, C.M.L. How Digital Platforms Enhance Urban Resilience. Sustainability 2022, 14, 1285. [Google Scholar] [CrossRef]
  52. Sarmiento, I.; Cockcroft, A.; Dion, A.; Belaid, L.; Silver, H.; Pizarro, K.; Pimentel, J.; Tratt, E.; Skerritt, L.; Ghadirian, M.Z.; et al. Fuzzy cognitive mapping in participatory research and decision making: A practice review. Arch. Public Health 2024, 82, 76. [Google Scholar] [CrossRef] [PubMed]
  53. Sun, Y.; Yu, H.; Wang, H. A systems perspective on the approach to industrial chain and supply chain ecology. Syst. Res. Behav. Sci. 2024, 42, 1181–1194. [Google Scholar] [CrossRef]
  54. Zhou, W.; Lin, M.; Xiao, M.; Fang, L. Higher precision is not always better: Search algorithm and consumer engagement. Manag. Sci. 2025, 71, 6204–6226. [Google Scholar] [CrossRef]
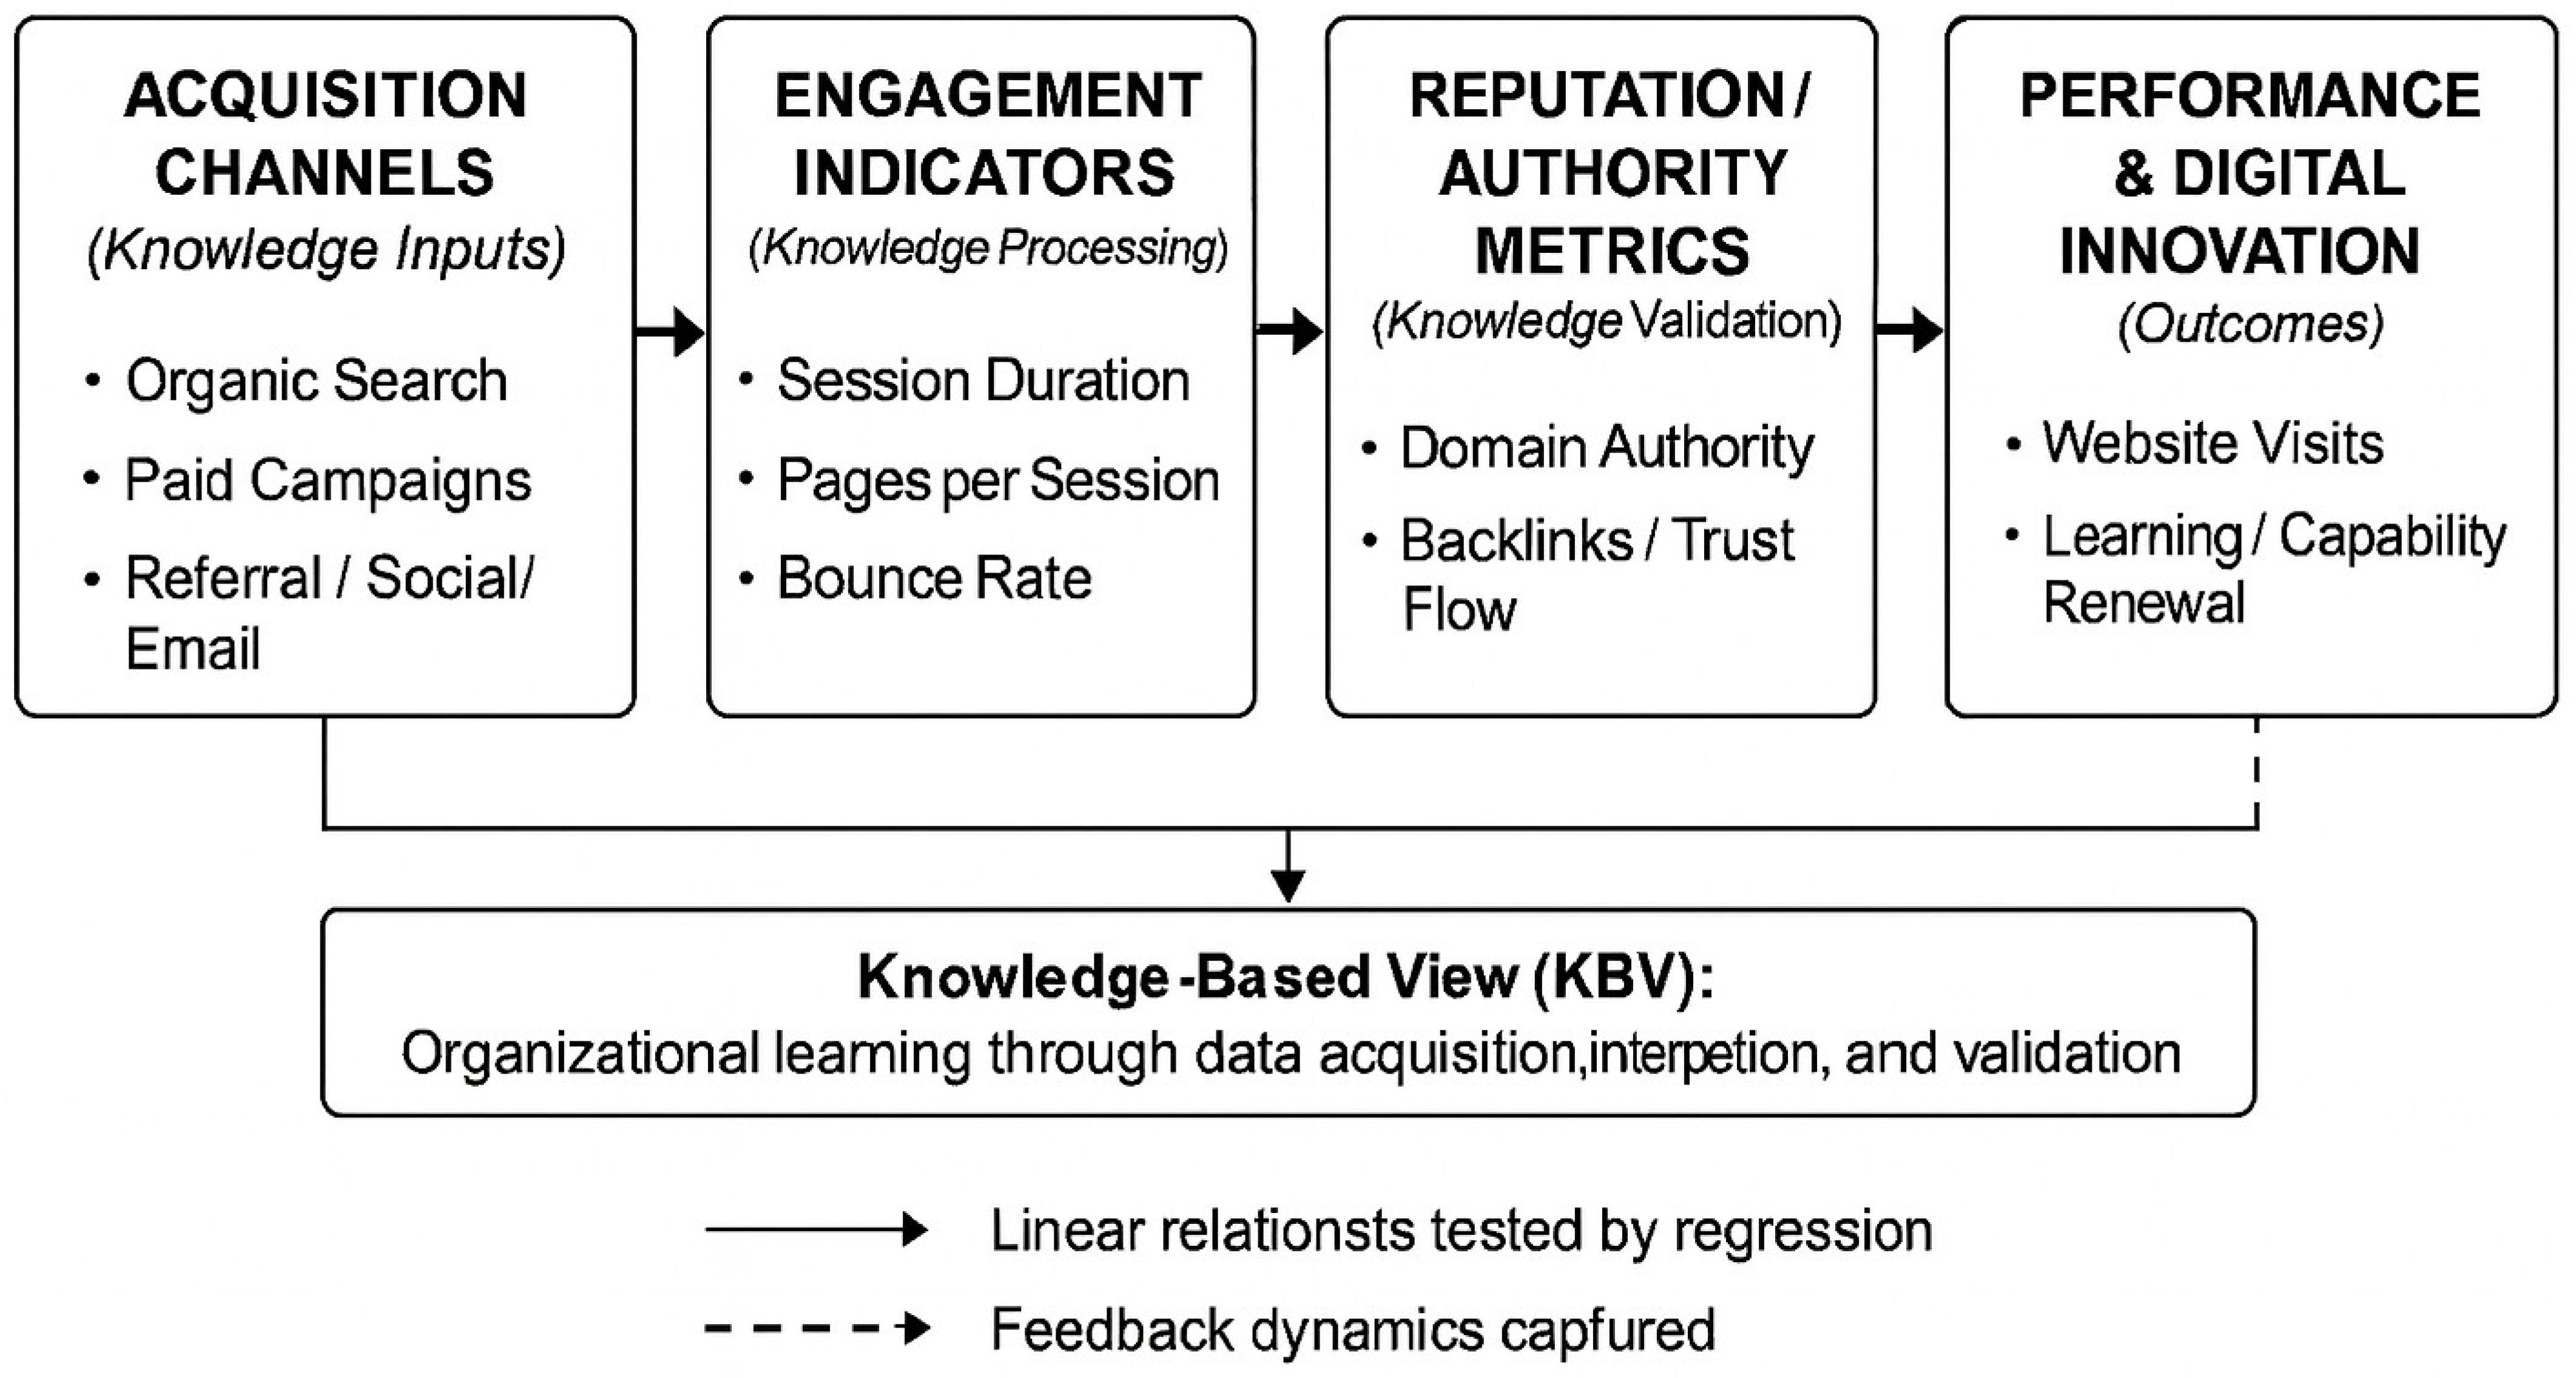
Figure 1. Conceptual framework based on the Knowledge-Based View.
Information 16 01012 g001
Figure 2. Entropy distribution.
Information 16 01012 g002
Figure 3. Organic search share vs. pages per visit (scatterplot).
Information 16 01012 g003
Figure 4. Paid traffic cost vs. website visits (bubble plot).
Information 16 01012 g004
Figure 5. Backlinks vs. organic traffic (scatterplot).
Information 16 01012 g005
Figure 6. Email share vs. time on site (scatterplot).
Information 16 01012 g006
Figure 7. Entropy vs. bounce rate (scatterplot).
Information 16 01012 g007
Figure 8. FCM model development.
Information 16 01012 g008
Figure 9. FCM scenarios. Figures (ac) display positive variation (+25%, +50%, +75%) scenarios where website visits and organic traffic are strongly aligned with engagement measures, though pages per visit show negative associations. Figures (df) highlight inverse scenarios (−25%, −50%, −75%), where diversification and overreliance on specific acquisition channels reduce engagement consistency, leading to negative correlations with core performance indicators.
Information 16 01012 g009
Table 1. Descriptive statistics.
VariableCountMeanStd DevMinMax
Direct3514,778,580.7125,792,024.67103593,983,360
Referral351,827,704.433,531,398.3333310,089,640
Organic Search354,646,843.697,843,881.53887826,837,640
Paid Search35175,416.83222,877.210613,329
Organic Social35846,270.631,826,695.3506,702,804
Paid Social3518,114.1733,764.720111,601
Email35112,107.06117,667.540364,039
Display Ads3522,930.3142,295.780137,930
Pages per Visit353.251.761.27.8
Time on Site (min)356.613.260.1813.04
Website Users3510,033,146.8917,416,392.5712,15859,812,060
Website Visits3522,427,967.8339,002,173.8416,554134,127,600
Organic Traffic358,592,370.4611,970,144.9340,52231,317,730
Organic Traffic Cost3510,829,993.0614,577,056.1360,09541,449,780
Paid Traffic35318,874.57440,074.1301,242,407
Paid Traffic Cost35750,659.401,116,185.7603,552,071
Authority Score3561.4018.214286
Backlinks352,757,760.003,575,580.2840,3009,500,000
Entropy350.930.200.511.25
Table 2. Correlation matrix.
VariableOrganic SearchReferralWebsite VisitsOrganic
Social
Time on SitePages per VisitOrganic TrafficBounce RateAuthority ScoreDirectPaid
Traffic
Paid Traffic CostBacklinksEntropyEmail
Organic Search1.000.92 ***1.00 ***0.85 ***0.34 *−0.200.95 ***0.320.77 ***0.94 ***0.91 ***0.91 ***0.95 ***−0.050.94 ***
Referral0.92 ***1.000.98 ***0.87 ***0.28−0.260.92 ***0.37 *0.69 ***0.92 ***0.90 ***0.90 ***0.92 ***0.030.88 ***
Website Visits1.00 ***0.98 ***1.000.90 ***0.32−0.210.94 ***0.330.76 ***1.00 ***0.92 ***0.93 ***0.97 ***−0.040.88 ***
Organic
Social
0.85 ***0.87 ***0.90 ***1.000.21−0.260.85 ***0.34 *0.64 ***0.90 ***0.84 ***0.87 ***0.85 ***0.080.93 ***
Time on Site0.34 *0.280.320.211.000.56 ***0.41 *−0.51 **0.52 **0.330.37 *0.38 *0.43 **−0.120.59 ***
Pages per Visit−0.20−0.26−0.21−0.260.56 ***1.00−0.08−0.42 *0.18−0.21−0.08−0.10−0.06−0.180.18
Organic Traffic0.95 ***0.92 ***0.94 ***0.85 ***0.41 *−0.081.000.140.91 ***0.94 ***0.97 ***0.97 ***0.99 ***−0.120.94 ***
Bounce Rate0.320.37 *0.330.34 *−0.51 **−0.42 *0.141.00−0.120.330.150.160.140.270.09
Authority Score0.77 ***0.69 ***0.76 ***0.64 ***0.52 **0.180.91 ***−0.121.000.75 ***0.86 ***0.87 ***0.85 ***−0.160.92 ***
Direct0.94 ***0.92 ***1.00 ***0.90 ***0.33−0.210.94 ***0.330.75 ***1.000.92 ***0.92 ***0.97 ***−0.050.88 ***
Paid
Traffic
0.91 ***0.90 ***0.92 ***0.84 ***0.37 *−0.080.97 ***0.150.86 ***0.92 ***1.000.99 ***0.96 ***−0.100.93 ***
Paid Traffic Cost0.91 ***0.90 ***0.93 ***0.87 ***0.38 *−0.100.97 ***0.160.87 ***0.92 ***0.99 ***1.000.96 ***−0.110.93 ***
Backlinks0.95 ***0.92 ***0.97 ***0.85 ***0.43 **−0.060.99 ***0.140.85 ***0.97 ***0.96 ***0.96 ***1.00−0.070.94 ***
Entropy−0.050.03−0.040.08−0.12−0.18−0.120.27−0.16−0.05−0.10−0.11−0.071.00−0.18
Email0.94 ***0.88 ***0.88 ***0.93 ***0.59 ***0.180.94 ***0.090.92 ***0.88 ***0.93 ***0.93 ***0.94 ***−0.181.00
*: p < 0.05; **: p < 0.01; ***: p < 0.001.
Table 3. Acquisition channels and engagement.
Dependent VariableIndependent VariableCoefficientStd. ErrortSig.R2Adj. R2N
Pages per VisitOrganic Search share−5.1731.64−3.16**0.330.2935
Referral share−7.0612.84−2.49*
Time on SiteOrganic Search share−8.8422.12−4.17***0.420.3835
Referral share−6.9673.10−2.25*
Bounce RateOrganic Search share12.5313.863.25**0.360.3235
Referral share9.3874.122.28*
*: p < 0.05; **: p < 0.01; ***: p < 0.001.
Table 4. Paid traffic cost and efficiency.
Dependent VariableIndependent VariableCoefficientStd. ErrortSig.R2Adj. R2N
Website VisitsPaid Traffic Cost18.9434.214.50***0.880.8735
Paid Traffic45.7629.744.70***
Pages per VisitPaid Traffic Cost−0.0020.01−0.25ns0.030.0035
Paid Traffic0.0040.010.41ns
ns: not significant, >0.05 level of significance; ***: p < 0.001.
Table 5. Authority score, backlinks and trust.
Dependent VariableIndependent VariableCoefficientStd. ErrortSig.R2Adj. R2N
Organic TrafficAuthority Score56,234.011,123.05.06***0.920.9135
Backlinks1.8320.228.34***
Bounce RateAuthority Score−0.1120.09−1.22ns0.040.0035
Backlinks0.0030.010.45ns
ns: not significant, >0.05 level of significance; ***: p < 0.001.
Table 6. Email and social channels.
Dependent VariableIndependent VariableCoefficientStd. ErrortSig.R2Adj. R2N
Time on SiteEmail share22.3186.783.29**0.280.2435
Organic Social share1.4522.140.68ns
Pages per VisitEmail share12.9122.874.50***0.550.5235
Organic Social share2.1351.211.76p < 0.10
ns: not significant, >0.05 level of significance; **: p < 0.01; ***: p < 0.001.
Table 7. Channel diversification (entropy index).
Dependent VariableIndependent VariableCoefficientStd. ErrortSig.R2Adj. R2N
Website VisitsEntropy−11,674,08049,704,710−0.23ns0.002−0.02935
Bounce RateEntropy—no valid variation detected
ns: not significant, >0.05 level of significance.
Disclaimer/Publisher’s Note: The statements, opinions and data contained in all publications are solely those of the individual author(s) and contributor(s) and not of MDPI and/or the editor(s). MDPI and/or the editor(s) disclaim responsibility for any injury to people or property resulting from any ideas, methods, instructions or products referred to in the content.