Article

A Priority-Based Multiobjective Optimization Framework for Fair Profit Allocation in Cooperative Systems of Cross-Border E-Commerce Logistics Supply Chains

1
School of Maritime Economics and Management, Dalian Maritime University, Dalian 116026, China
2
Collaborative Innovation Center for Transport Studies, Dalian Maritime University, Dalian 116026, China
*
Author to whom correspondence should be addressed.
Information 2025, 16(11), 1002; https://doi.org/10.3390/info16111002
Submission received: 11 October 2025 / Revised: 10 November 2025 / Accepted: 12 November 2025 / Published: 18 November 2025
(This article belongs to the Section Information Theory and Methodology)

Abstract

Cross-border e-commerce logistics supply chain alliances face the practical challenge of allocating profits in a way that is both fair and operationally controllable when member contributions and cooperation priorities jointly matter. This study proposes an integrated framework that first evaluates member contributions via a group decision-making (GDM) procedure to derive contribution weights, and then aggregates them to coalition-level importance scores to rank feasible cooperation structures. Building on these inputs, we formulate a Priority-Based Multiobjective Linear Programming (P-MOLP) model that performs tiered (priority) optimization under individual rationality and budget-balance constraints, thereby ensuring implementable allocations. Using alliance data, P-MOLP provides clearer structural differentiation than an ordinary goal-programming model: high-contribution, strategically central members receive larger shares, and low-contribution members receive less (“more-work-more-reward”). Unlike weighted-Shapley, which can violate individual rationality under extreme weights, P-MOLP is individually rational and budget-balanced, aligns better with observed practice, remains applicable when some coalition values are infeasible or missing, and attains ε-core near-stability. Priority weights serve as managerial levers to tune outcomes.

Graphical Abstract

1. Introduction

Driven by the rapid growth of cross-border e-commerce and the accelerated evolution of internet-enabled logistics, this business model—integrating traditional foreign trade with the internet—has demonstrated strong growth resilience and transformative potential. According to the 2023 China E-Commerce Market Data Report released by the China e-Business Research Center, China’s cross-border e-commerce market rose 7.32% year-on-year to RMB 16.85 trillion, from RMB 15.7 trillion in 2022, and has become a new driver of the country’s foreign trade growth (China e-Business Research Center, 2024) [1].
This rapid expansion has placed higher demands on cross-border logistics. However, in many markets, the sector remains at an early stage, characterized by fragmented service capacity, low market concentration, elevated operating costs, and frictions in border procedures—constraints that have become key bottlenecks to scaling cross-border e-commerce (Wang et al., 2021) [2]. In response, firms increasingly establish supply chain collaborative alliances with domestic and overseas partners and build global logistics operating systems to extend network coverage and accelerate international growth (Hua and Wu, 2024) [3]. Such alliances are developing steadily in China, with several transnational, enterprise-led cases (e.g., Cainiao Network and Russian Post; JD and Yamato International Logistics). By integrating regional logistics resources worldwide to leverage complementary strengths and meet diverse cross-border e-commerce logistics needs, these alliances have achieved initial success.
The success of a logistics alliance hinges on partner selection, as it demands that partners align on strategic objectives, demonstrate complementary needs and capabilities, and maintain a cooperative orientation (Mamédio et al., 2019) [4]. However, cross-border logistics enterprises often exhibit significant disparities in strategic objectives, service capabilities, and resource endowments due to national and regional heterogeneity. This heterogeneity not only intensifies information asymmetry during partner selection—prompting many firms to rely merely on preliminary reputation assessments—but also shapes each member’s contribution to the alliance and its strategic standing (Chen et al., 2022) [5]. In response, priority-based collaboration models have become prevalent in alliance formation:
  • Resource-sharing (e.g., JD and Amazon Global Store; SF Express International), in which “strong-strong” collaboration aims to optimize resource utilization.
  • Resource-complementary (e.g., Amazon China; Deppon Logistics; Siqi International Freight Forwarding), in which tripartite cooperation delivers one-stop global e-commerce supply chain services.
  • Resource-integration (e.g., Alibaba Cainiao Logistics Ecosystem; Amazon FBA Ecosystem), which builds interconnected resource systems to support global logistics fulfillment.
With their high resource integration efficiency and strategic synergy, these models are often prioritized by enterprises seeking long-term cooperative stability (Martin et al., 2018) [6].
Even with these priority-based collaboration models, the sustainability of cross-border e-commerce logistics alliances remains constrained by two interrelated challenges—rooted precisely in the aforementioned heterogeneity and strategic disparities. First, regional and institutional heterogeneity (a core driver of partner selection difficulties) further manifests in divergent strategic objectives, persistent information asymmetry, and unclear cooperation priorities, ultimately leading to inefficient resource allocation between leading logistics partners and smaller service providers. Second, the absence of a scientific and transparent profit allocation mechanism further exacerbates this instability: many alliances depend on ad hoc negotiations instead of objective evaluations, failing to reflect members’ actual contributions or their strategic significance across different priority models (e.g., a member’s role in resource-sharing versus resource-integration) (Dai et al., 2022) [7]. These issues are further amplified by cross-border uncertainties—including cultural gaps, regulatory shifts, exchange rate volatility, and even data discontinuities or cooperation disruptions (Zha et al., 2022; Liu and Li, 2020) [8,9]—plunging many alliances into a recurring “formation–conflict–dissolution” cycle(Xie and Yin, 2019; Vaez-Alaei et al., 2022) [10,11].
However, existing research has not yet adequately addressed these practical challenges. Most profit-allocation models in the cooperative logistics literature treat alliances as homogeneous entities and overlook the hierarchical nature of cooperation. In practice, different alliance structures—ranging from loosely coordinated resource-sharing partnerships to deeply integrated logistics ecosystems—exhibit varying strategic priorities and levels of interdependence. Yet existing approaches rarely capture how these priority hierarchies influence profit distribution, resulting in incentive misalignment and constraining the practical implementability of cooperative schemes. Furthermore, current frameworks often lack sufficient consideration of cross-border operational realities—such as institutional heterogeneity, information asymmetry, and environmental uncertainty—which critically shape alliance behavior and stability in practice.
To bridge these gaps, this study develops a Priority-Based Multi-Objective Linear Programming (P-MOLP) framework that integrates Group Decision-Making (GDM) for quantifying member contributions with hierarchical priority structuring and lexicographic optimization for tiered profit allocation. This hybrid approach enables the model to simultaneously capture contribution heterogeneity and cooperation hierarchies, ensuring both fairness and managerial interpretability within a controllable optimization process. Beyond its methodological innovation, the study contributes to alliance theory by introducing a hierarchical priority perspective that links member-contribution heterogeneity with alliance governance and stability. The numerical results demonstrate that priority-driven optimization enhances both fairness and stability in cross-border logistics alliances, offering actionable guidance for alliance managers to design transparent, incentive-aligned profit-allocation schemes and for policymakers to promote resilient and sustainable cross-border logistics ecosystems.
The remainder of the paper is organized as follows. Section 2 reviews the related literature and identifies the research gap. Section 3 examines the vertical integration of cross-border e-commerce logistics supply chains (industry background). Section 4 develops the contribution-evaluation index system. Section 5 presents the group decision-making (GDM) procedure for assessing member contributions. Section 6 formulates the priority-based multiobjective linear programming (P-MOLP) allocation model and analyzes its properties. Section 7 reports numerical results and comparative analyses. Section 8 discusses managerial implications, outlines limitations and avenues for future research, and concludes.

2. Literature Review

Research on profit distribution among logistics alliance members has attracted substantial scholarly attention, particularly within the broader domain of supply chain cooperation. Mainstream approaches include contract coordination mechanisms, cooperative-game–based allocation rules such as the Shapley value (and its weighted or modified variants), and multi-objective optimization frameworks.
Early studies focused on classical cooperative-game solutions. Wang et al. (2018) [12] operationalized members’ core capabilities as resource-input levels via a scoring scheme and applied the Shapley value, the nucleolus, and the core method to achieve reasonable profit allocation in supply chain alliances. Yu et al. (2018) [13] proposed a multi-factor improved Shapley value to address profit distribution in e-commerce logistics alliances under warehouse-overstock conditions. From a supply chain perspective, Li and Zhao (2019) [14] analyzed the coordinated development of cross-border e-commerce and cross-border logistics, emphasizing the need for a sound profit-allocation mechanism and institutional safeguards to enhance trust and collaboration. Considering a closed-loop supply chain (CLSC), Zheng et al. (2019) [15] studied optimal/equilibrium decisions and profits under five non-cooperative and cooperative game models, and introduced a variable-weighted Shapley value to coordinate the CLSC. Yan et al. (2021) [16] developed a four-party, incomplete-cooperation Stackelberg model for cross-border e-commerce supply chain members and reallocated profits using the Shapley value and a total cooperative-profit-increment sharing mechanism across different cooperation modes. From a value co-creation angle, Wan et al. (2022) [17] used a Stackelberg framework to model both a traditional e-commerce supply chain and one enhanced with buyer online comment technology (BOCR). They derived optimal decisions and profits under decentralized and centralized structures and proposed investment conditions, cost-sharing, and profit-sharing contracts to achieve coordination. Dai et al. (2022) [7] found that communication structure matters and proposed a two-stage allocation—vertical-projection + (improved Shapley/A-T), then a fuzzy quality adjustment. Mou (2024) [18] examined a supply chain composed of a cross-border import e-commerce firm and a third-party integrated overseas-warehouse logistics provider, studying the profit-impact mechanism and the optimization of value-added logistics service levels. Zhu and Liu (2023) [19] analyzed how cost-sharing mechanisms shape key decisions regarding logistics service workload in live-streaming e-commerce logistics service supply chains (LSE-LSSCs), and designed coordination contracts for service-effort levels using game-theoretic methods. Finally, Meng et al. (2023) [20] argued that ignoring cooperation constraints and heterogeneous enterprise priorities undermines fairness and rationality in supply chain profit distribution, calling for a revised Shapley-type rule with alliance-condition constraints to preserve cooperative stability.
More recent research expands from single-method cooperative games to multi-criteria a fairness-oriented, and stability-aware mechanisms. Wang, Chen, and Yu (2024) [21] designed a multi-weight H-Shapley value model for express logistics sharing centers, capturing multidimensional contributions (resources, efficiency, risk). Dai et al. (2024) [22] proposed a Rule–Utilitarian Core (RUC) mechanism that finds near-core allocations for e-retailer alliances. Zhang et al. (2023) [23] applied Nash bargaining to multi-energy microgrid coalitions, designing a profit-sharing mechanism that reflects members’ marginal economic and environmental contributions. Liu, Huang, and Feng (2024) [24] integrated Shapley risk quantification with Nash bargaining. From the stability and mechanism-design perspective, Saygın, Tekin and Kuyzu (2025) [25] examined cost allocation in collaborative hub networks, comparing Shapley-value and core-based methods, and revealed the inherent tension between fairness and coalition stability when the core is empty. Ni, Feng, and Gou (2023) [26] analyzed fairness concerns in Nash bargaining under push–pull supply chains, showing that moderate fairness preferences enhance overall stability. Marousi et al. (2024) [27] proposed a Nash-bargaining-based optimization for industrial gas supply chains, prioritizing fairness before profit maximization. In parallel, research on multi-objective and priority-based optimization has emerged. Yang and Liu (2025) [28] introduced a fairness-oriented multi-objective mixed-integer model for sustainable supply chain planning under uncertainty, embedding fairness as an explicit optimization goal. Amin-Tahmasbi et al. (2023) [29] developed a multi-objective integrated optimization model for facility location and order allocation in two-level supply chains, jointly minimizing cost and improving responsiveness. Masruroh et al. (2024) [30] introduced priority-based multi-objective evolutionary algorithms for green-supply chain network design under disruption risk, explicitly assigning hierarchical importance to cost, emissions, and reliability objectives. Collectively, these studies demonstrate a clear transition from static fairness-based allocation models toward multi-objective, lexicographic, and decision-maker–aware optimization frameworks.
Nevertheless, research on cross-border e-commerce logistics supply chain alliances remains limited. No existing study explicitly incorporates internal cooperation structures (e.g., priority-based coalition forms) into profit allocation design, even though these structures materially influence alliance stability and incentive compatibility (Meng et al., 2023; Wang and Zhu, 2023; Ding and Jian, 2024; Asghari et al., 2022) [20,31,32,33]. Moreover, existing methods exhibit several shortcomings:
First, to quantify member contributions, the existing literature primarily employs a spectrum of evaluation techniques, ranging from subjective methods—such as AHP, its numerous extensions, and rating-based scoring approaches—to objective methods like TOPSIS, as well as integrated subjective–objective frameworks that seek to combine the advantages of both perspectives. (Dai et al., 2022; Wang et al., 2018; Yu et al., 2018) [7,12,13]. These methods are operable and can yield contribution levels determined by a single expert; however, the contribution index system is a multi-factor decision problem, and evaluations by a single expert often fail to capture this complexity, leading to a nontrivial risk of deviation from reality. Moreover, hybrid evaluation approaches typically require objective metrics, but for cross-border logistics supply chains, such information is expensive or hard to acquire, which restricts their practical use.
Second, within baseline allocation methods, non-cooperative game models chiefly address profit coordination under decentralized decision-making (Wan et al., 2022; Mou, 2024; Zhu and Liu, 2023,Marousi et al., 2024) [17,18,19,27] and are ill-suited to allocating the total profit of an alliance (grand coalition). Although scholars have used the Shapley value and core-based models to study alliance allocation (Wang et al., 2018; Zheng et al., 2019; Yan et al., 2021; Dai et al., 2024; Saygın et al., 2024) [12,15,16,22,25], these frameworks commonly assume equal member status and do not account for heterogeneous contribution and strategic importance—assumptions misaligned with practice. Even improved (weighted) Shapley approaches (Yu et al., 2018; Wang et al., 2024) [13,21] may produce individually irrational allocations when expert judgments are extreme. Further, Shapley-type models have limited scope when coalition values are missing for “ineffective” coalitions—common in cross-border settings where members may opt not to cooperate or cooperation may be interrupted by changes in the trade environment—thus leaving payoff characteristics unavailable (Hu, 2018) [34].
Third, although recent studies have developed multi-objective and fairness-oriented optimization frameworks (Marousi et al., 2024; Yang and Liu, 2025; Amin-Tahmasbi et al., 2023; Masruroh et al., 2024) [27,28,29,30], these approaches are not yet systematically integrated. They often address cost, efficiency, and fairness objectives in isolation and rarely incorporate expert-based decision inputs, hierarchical cooperation priorities, and coalition stability considerations within a unified allocation framework, which limits their explanatory depth and managerial applicability.
A comparison of these differences with relevant literature is presented in Table 1.
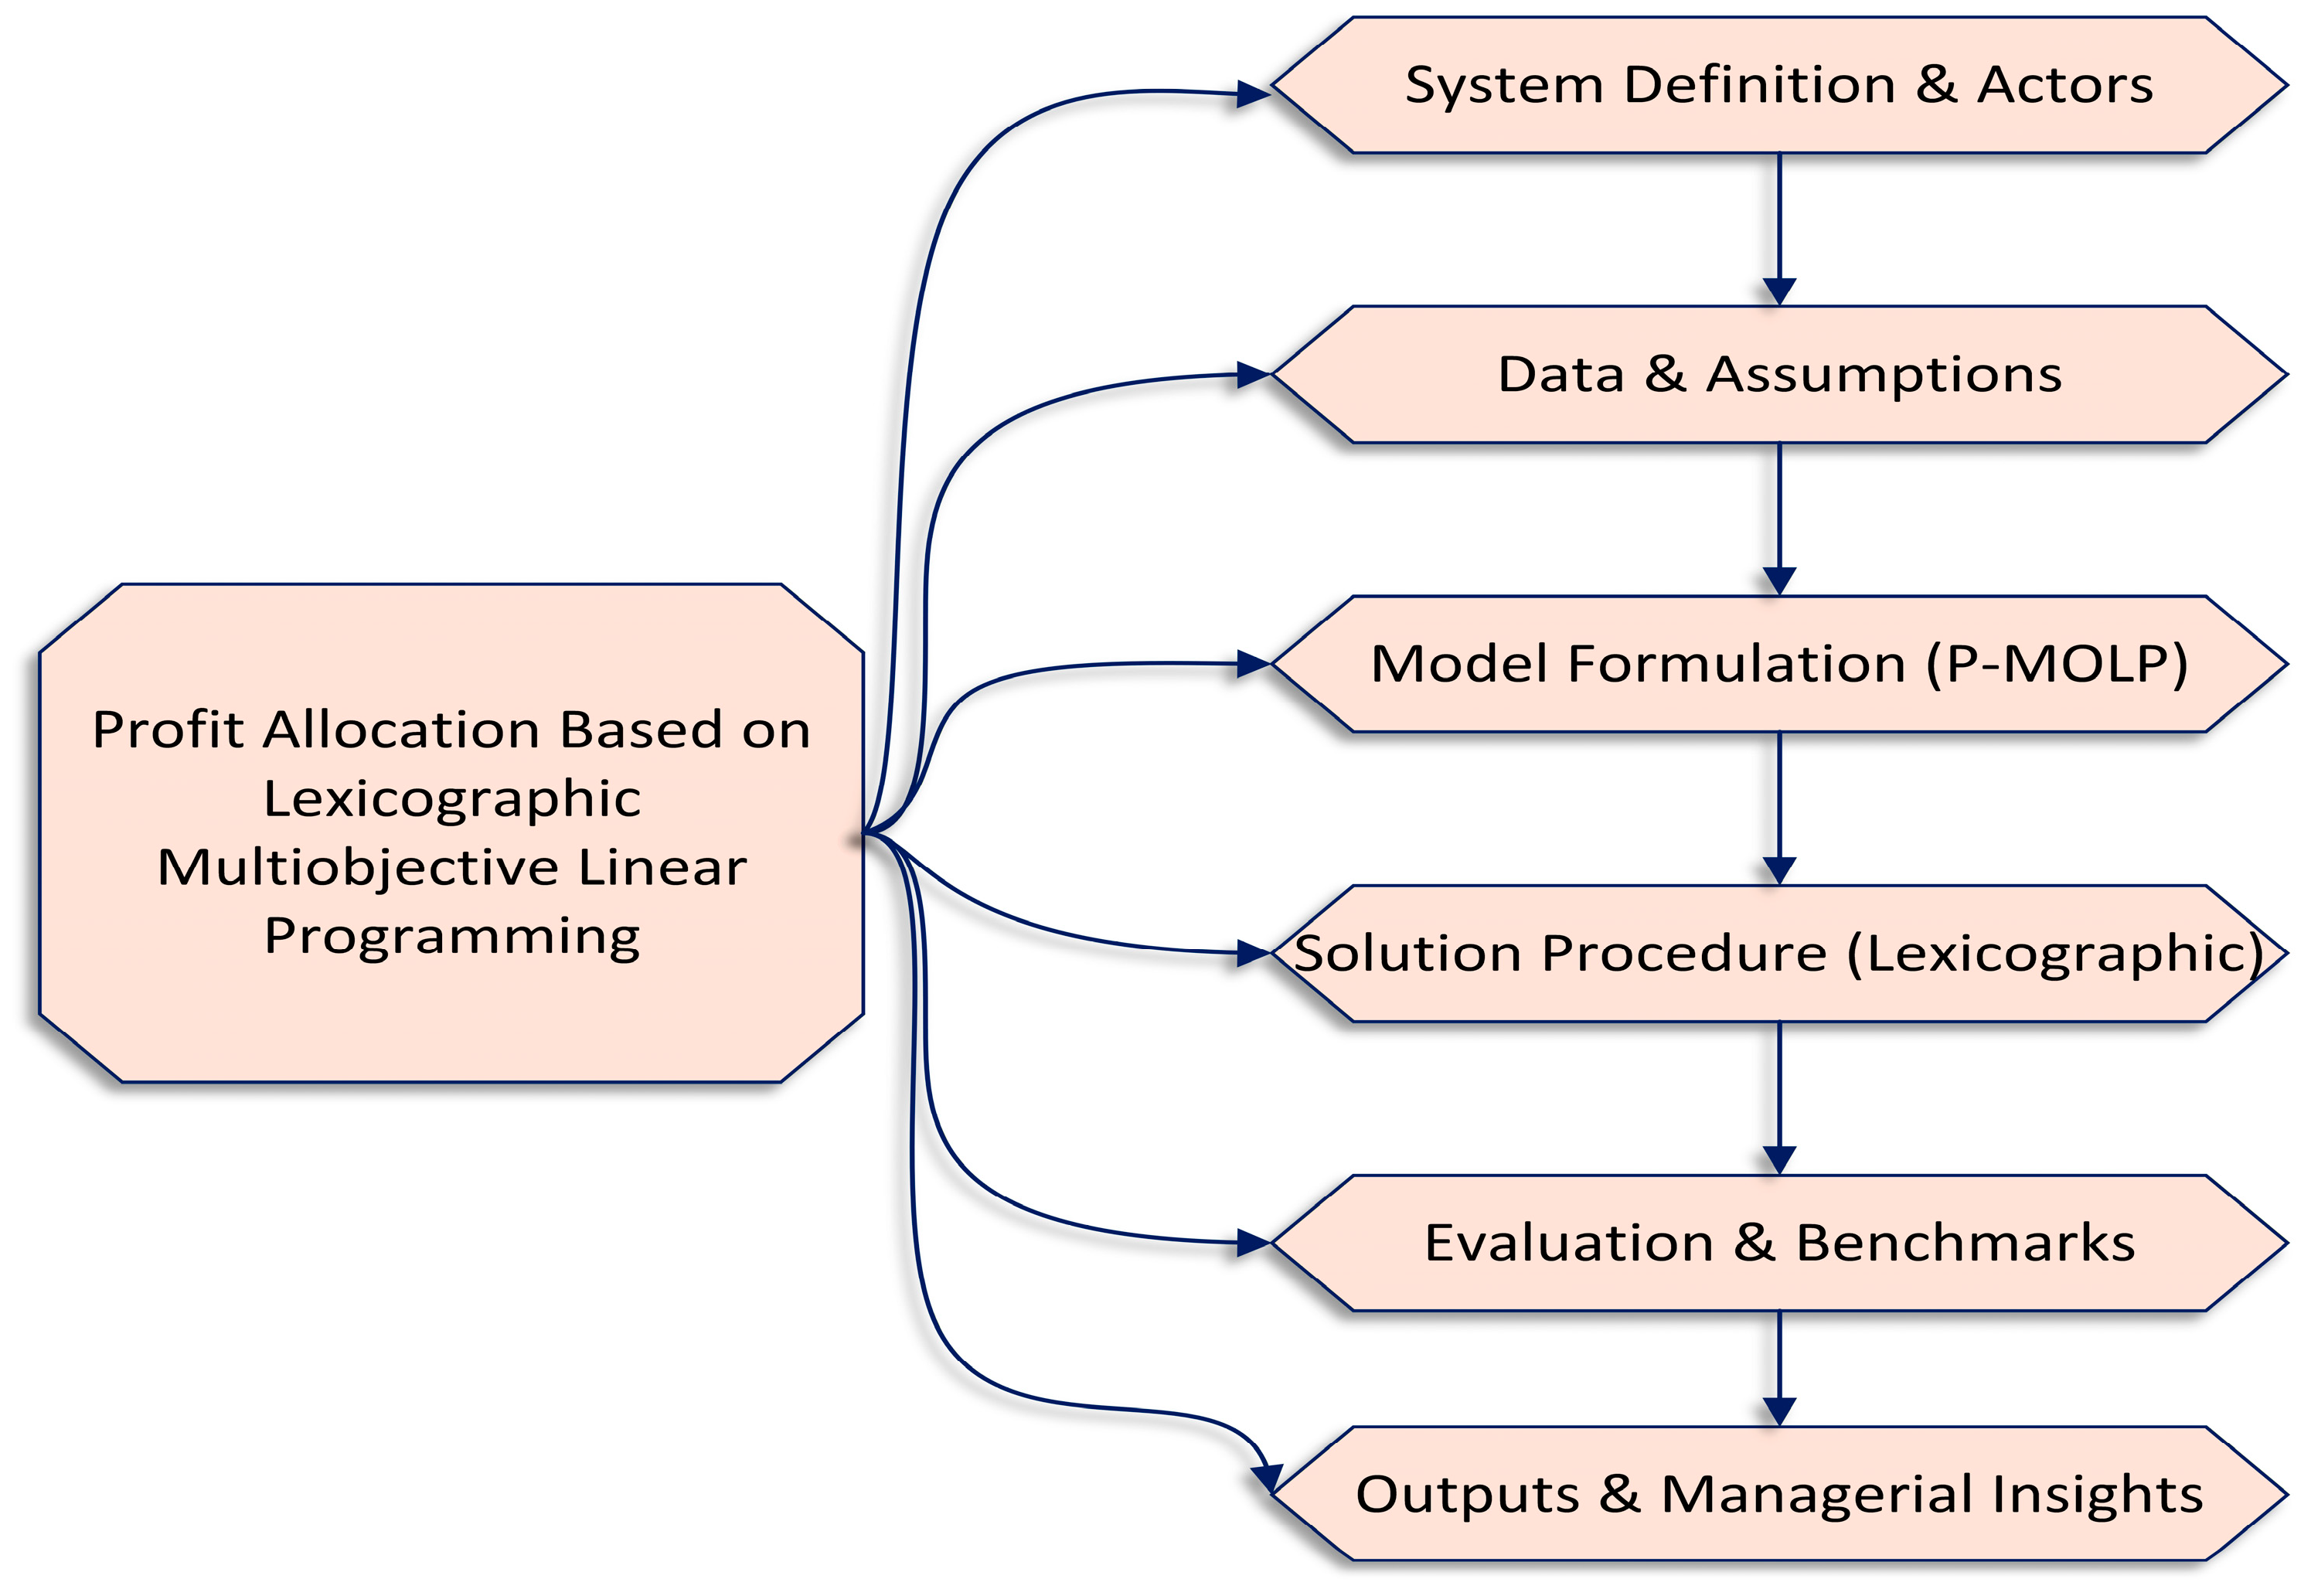
To close these gaps, we propose a linear-programming framework that explicitly integrates cooperation priorities with member contributions (Figure 1). First, we build a contribution-evaluation index and obtain member weights via group decision-making (GDM). We then rank the candidate cooperation structures by priority based on these weights. We then adopt a priority-based multiobjective linear program in which tiered optimization satisfies high-priority goals first and refines lower-priority ones. The resulting profit-allocation model—Priority-Based Multiobjective Linear Programming (P-MOLP)—enforces individual rationality and budget balance.
Our contributions are threefold:
(1)
We have developed a unified priority-based multiobjective linear programming (P-MOLP) allocation method that integrates GDM-based contribution evaluation with explicit cooperative priority control in an optimization scheme.
(2)
We state and prove the key properties of the proposed allocation method—feasibility and boundedness, existence of tiered optima, individual rationality and budget balance, priority-order preservation (monotonicity), and an ε-core approximation.
(3)
We conduct a comparative evaluation against an ordinary goal programming benchmark and cooperative-game baselines (Shapley, weighted-Shapley, least-core), showing that P-MOLP yields clearer differentiation across cooperation structures and is practically implementable—meeting IR and budget-balance requirements and allowing managers to tune outcomes via priority weights.
This synthesis closes the review and motivates the framework developed in the following sections.

3. Industry Background: Vertical Integration of Cross-Border E-Commerce Logistics Supply Chains

Cross-border e-commerce logistics is rapidly evolving toward vertical integration through alliance-based cooperation, where platforms, logistics enterprises, and technology providers form contractual or equity partnerships to share resources and complement capabilities. Such alliances break organizational boundaries and create end-to-end efficiency gains across international networks. In practice, a multi-party ecosystem has emerged—leading platforms (e.g., Amazon Global Store, JD Worldwide, Tmall Global, Temu, SHEIN) collaborate with 3PL/4PL providers (e.g., Cainiao Global, Deppon Logistics) to build integrated systems linking warehousing, cross-border transport, and last-mile delivery. SMEs benefit from these alliances through shared logistics networks and reduced entry costs, forming a symbiotic structure where platform capabilities diffuse outward to smaller firms.
Operationally, three dominant cooperation modes can be observed: (i) resource-sharing alliances among strong partners for efficiency gains; (ii) resource-complementary alliances combining distinct capabilities; and (iii) resource-integration alliances forming ecosystem-based structures. These types serve as the empirical basis for the priority hierarchy adopted in the subsequent model, linking real-world cooperation depth to quantitative allocation priorities. As “Internet + Logistics,” blockchain, and data technologies advance, these alliances are shifting from policy-driven to technology-driven systems, highlighting the need for a scientific and adaptive profit-allocation mechanism.

4. Contribution-Evaluation Index System for Alliance Members

Drawing on prior research on member contribution and profit allocation in e-commerce logistics supply chain alliances (Yu et al., 2018; Xie and Yin, 2019; Teng, 2021) [10,13,35], and adhering to the principles of completeness, hierarchical logic, scientific rigor, and practical operability, we fully consider the complexity and heterogeneity of cross-border logistics services (business processes, cultural context, policy environment, geography, and information asymmetry). Under realistic operating conditions, we therefore construct an evaluation index system for member contributions that fits the operational requirements of such alliances, as summarized below.
The index framework is structured around four first-level dimensions—risk management, operational input, technological innovation, and operations management—which represent the core capability domains of cross-border logistics alliances. Specifically, risk management captures members’ abilities to handle customs compliance, exchange-rate volatility, and cross-border regulatory risks; operational input reflects tangible resources invested in warehousing, transportation, and human capital; technological innovation measures the level of digital transformation, data-driven coordination, and information-sharing capabilities; and operations management evaluates managerial efficiency, service quality, and responsiveness.
These indicators were finalized through expert consultation combined with hierarchical analysis, ensuring comprehensive coverage of strategic, operational, and technological aspects. The relative importance of each indicator was further quantified using an improved analytic hierarchy process (IAHP) based on expert scoring. The final index framework is presented in Table 2.

5. Construction of the Member-Contribution Evaluation Model for Cross-Border E-Commerce Logistics Supply Chain Alliances

At present, mainstream methods such as AHP and its variants (Saaty and Vargas, 1987; Yang et al., 2023) [36,37] can produce single-expert assessments of member contribution levels in cross-border e-commerce logistics supply chain alliances. However, the contribution-evaluation index system built in this paper is a multi-factor decision problem, and a single expert often cannot fully cope with the complexity of the decision. To overcome this limitation, we introduce a group decision-making (GDM) scheme to revise the traditional AHP results. For expert aggregation, we adopt a hierarchical clustering method, which is accurate, fast to compute, and easy to implement. The basic procedure is as follows:
Assume that p experts evaluate n alliance members (the alternatives to be ranked). Let F = F 1 , F 2 , F p be the set of experts and M = { M 1 , , M n } the set of members. For expert   δ , the AHP computation yields a contribution-weight vector W ( δ ) = ( w 1 ( δ ) , , w n ( δ ) ) , where w j ( δ ) denotes the weight of member M j .
For any two experts a and   b , the agreement between their evaluations is measured by the Euclidean distance between their weight vectors:
t a b = W ( a ) W ( b ) 2 = j = 1 n w j ( a ) w j ( b ) 2 1 / 2
The measure t a b satisfies:
(i)
t a b = 0 , if the two experts’ ranking vectors are identical;
(ii)
t a b = t b a ;
(iii)
0 t a b 1 .
When t a b falls below a prescribed threshold, experts a and   b can be grouped into the same class. Applying hierarchical clustering partitions the p experts into   Q classes ( Q p ) . Experts within the same class are regarded as having similar weights, whereas experts in different classes have different weights. To reflect the majority view, a class that contains more experts should receive a larger weight; conversely, a class with fewer experts should receive a smaller weight.
Let β δ be the size of the class to which expert   δ belongs. The weight assigned to expert   δ  is
ϕ δ = β δ r = 1 p β r
Aggregating all expert evaluations yields the GDM-adjusted contribution vector for the alliance:
W G D M A H P = δ = 1 p ϕ δ W δ = ( w 1 , w 2 , , w n ) .

6. Construction of the Multiobjective Linear-Programming Model for Profit Allocation

6.1. P-MOLP Model Formulation

Assume that, in the cooperation process of a cross-border e-commerce logistics supply chain alliance, there are n members, with the player set N = { 1 , 2 , , n } . Let V be the characteristic function on coalitions; in particular, V ( ) = 0 . Denote the cooperative game by   L = N , V . For an allocation vector X = ( X 1 , X 2 , , X n ) , if it satisfies individual rationality X i V ( { i } ) and group efficiency j = 1 n X j = V ( N ) , then   X is called a rational allocation. Let E = { { 1 } , { 2 } , , { n } } be the partition of singletons, and let G N be the family of all coalitions on N . Define H ( N ) = G ( N ) \ ( E { N } ) , i.e., the set of all proper non-singleton coalitions. Then H ( N ) = 2 n n 2 . Since different coalition forms may play different strategic roles, members may choose different cooperation orders, which leads to priority differences among coalitions.
Using goal programming ideas, we introduce priority levels P 1 , P 2 , , P S and, within each level, a coalition-specific priority weight ω s e . We partition   H N into S disjoint priority classes H s ( s = 1 , , S ) such that H ( N ) = H 1 H 2 H S , H c H d = ( c d ) , H ( N ) = H 1 H 2 H S , and denote by H s   the number of coalitions in class H s . The e t h coalition of level s is written H s e . Let the total payoff obtained by the members of coalition H s e be V ( H s e ) . In goal programming, the deviation between the allocated sum and the target is captured by the positive and negative deviation variables σ H s e + and σ H s e . The basic balance for each coalition thus reads
j H s e X j σ H s e + + σ H s e = V ( H s e ) .
To ensure the stability of the grand-coalition cooperation, we prefer the members’ payoffs in the grand coalition to be no less than those attainable in any sub-coalition they belong to; hence, we penalize the negative deviations and make them as small as possible. Taking into account the overall priority level P s   and the within-level weight ω s e of each coalition, the objective becomes min Z = s = 1 S P s e = 1 | H s | ω s e σ H s e . Given the contribution levels determined earlier, let the members be ordered 1 , 2 , , k , , n in descending contribution. To respect fairness (“more work, more reward”), define each member’s increment relative to standing alone as Δ j   = X j   V ( { j } ) , and impose monotonicity Δ k Δ k + 1 . Combining the above, the priority-based multiobjective linear-programming model (P-MOLP) is:
min Z = s = 1 S P s e = 1 H s ω s e σ H s e s . t . j H s e X j σ H s e + + σ H s e = V H s e , H s e H s j n X j = V N X j V j X j V j = Δ j Δ k > Δ k 1 σ H s e + σ H s e = 0 σ H s e + 0 ,   σ H s e 0 ,   Δ j 0
Here X j V ( { j } ) enforces individual rationality, and j = 1 n X j = V ( N ) enforces group efficiency. The constraint σ H s e + σ H s e = 0 means that, in a single allocation round, a member’s payoff in the grand coalition cannot be both higher and lower than the payoff it would obtain in its sub-coalition H s e ; hence, only one of the deviation variables may be nonzero.
With the above linear programming model, profit allocation is carried out by using the priority factors P s   to encode the ordering across different coalition forms, while the within-level weights ω s e capture the relative importance of coalitions inside the same priority level. The objective is a weighted sum of deviations; the larger a weight, the more strongly the corresponding deviation is forced to zero, so higher-priority targets are satisfied first.
In particular:
(i)
If all 2 n n 2 coalitions are placed in one priority level ( s = 1 ), the within-level weights compare their importance and model (5) reduces to Equation (6).
(ii)
If there are no within-level weights but a clear priority ranking among coalition forms, model (5) reduces to Equation (7).
(iii)
If there is no priority structure at all, the problem degenerates to a standard coalition profit-allocation problem, and model (5) reduces to Equation (8).
min Z = e = 1 H N ω e σ e s . t . j H e X j σ e + + σ e = V H e , H e H N j = 1 n X j = V N X j V j X j V j = Δ j Δ k > Δ k 1 σ e + σ e = 0 σ e + 0 ,   σ e 0 ,   Δ j 0 1 e H N = 2 n n 2
min Z = s = 1 S P s e = 1 H s σ H s e s . t . j H s e X j σ H s e + + σ H s e = V H s e , H s e H s j n X j = V N X j V j X j V j = Δ j Δ k > Δ k 1 σ H s e + σ H s e = 0 σ H s e + 0 ,   σ H s e 0 ,   Δ j 0
min Z = e = 1 H N σ e s . t . j H e X j σ e + + σ e = V H e , H e H N j = 1 n X j = V N X j V j X j V j = Δ j Δ k > Δ k 1 σ e + σ e = 0 σ e + 0 ,   σ e 0 ,   Δ j 0 1 e H N = 2 n n 2
Here ω s e denotes the priority weight of the e t h coalition structure at level s ; σ H s e + and σ H s e are its positive and negative deviation variables, respectively.
The determination of the priority factors P 1 , P 2 , , P S and the within-level weights ω s e (applied to the positive/negative deviation terms as needed) is based on the GDM–AHP procedure in Section 5, which yields the member weight vector W G D M A H P = ( w 1 , w 2 , , w n ) , where   w j denotes the intrinsic contribution weight of member j ( j = 1 , 2 , , n ) The coalition family H N contains 2 n n 2 proper coalitions. Drawing on resource-dependence theory (Pfeffer and Salancik, 1978) [38] and the additivity axiom of cooperative games (Shapley, 1953) [39], members’ inputs into core resources can be treated as linearly additive. Hence, the importance of a coalition—i.e., its priority weight—is computed by linearly summing the contribution weights of the members contained in that coalition:
ω s   e = j H s e w j , j = 1 , 2 , , n , 1 e   H ( N ) = 2   n n 2
After determining ω s e , we analyze coalition structures using the hierarchical clustering procedure described in Section 5. As a widely used tool for data classification and structure identification, hierarchical clustering has been applied to layered design of supply chain alliances, object grouping, and managerial decision-making; its dendrogram offers an intuitive view of multi-level structures (Shokouhyar et al., 2024; Daie and Li, 2016; Wang et al., 2005; Zhang and Wang, 2011) [40,41,42,43]. In implementation, we cluster coalition forms according to the similarity of their importance, thereby achieving automatic grouping and ranking. This yields the hierarchical partition and the corresponding priority levels S and factors P 1 , P 2 , P s , providing the theoretical and data foundations for constructing the multi-level profit-allocation model.

6.2. Solution Procedure for the P-MOLP Model

“To ensure lexicographic priority and preserve fairness among coalition levels, the P-MOLP model is solved tier by tier using a sequential linear-programming procedure.”
(i)
Inputs:
  • Member set N = { 1 , 2 , , n } ; feasible coalition family H ( N ) 2 N \ .
  • Coalition value function V ( S ) for all S H N N , j .
  • Baselines x j _ = v ( { j } ) (for IR links x j x j _ = Δ j ).
  • Tier partition H ( N ) = s = 1 S H s e ( p r i o r i t y : 1 2 S ) .
  • Tier weights ω s e > 0 (normalized within each tier is recommended).
(ii)
Decision variables
  • Allocations x j 0 , gains Δ j 0 .
  • Deviations σ H s e + 0 , σ H s e 0 for all S H N
(iii)
Common constraints (kept in every tier)
(C1) Budget balance: j n X j = V N .
(C2) Coalition equations: j H s e X j σ H s e + + σ H s e = V H s e , H s e H s .
(C3) IR link: x j x j _ = Δ j .
(C4) Priority order (strict by a gap): Δ 4 Δ 3 g k , Δ 3 Δ 2 g k , Δ 2 Δ 1 g k , Δ 1 ε , a small positive constant g > 0 , ε > 0 is used exclusively to enforce the strict priority order among the Δ j variables.
(C5) Nonnegativity: x j , Δ j , σ H s e + , σ H s e 0 .
Tier-p objective: Z s = e = 1 H s e ω s e σ e ,   s = 1 , , S .
(iv)
Algorithm Steps
Step 0 (Set up)
Create an LP model with variables ( x j , Δ j , σ H s e + , σ H s e ) and constraints (C1)–(C5).
Set δ (locking tolerance) and ε (priority gap).
Step 1 (Tier 1)
Set objective: minimize Z 1 = e = 1 H 1 e ω 1 e σ e Solve the LP. Record Z 1 * .
Lock 1: add e = 1 H 1 e ω 1 e σ e = Z 1 * .
Step 2 (Tiers 2… S )
For each u = 2… S :
1. Objective: minimize Z u = e = 1 H u e ω u e σ e .
2. Keep all common constraints (C1)–(C5) plus the previously added locks.
3. Solve LP; record Z u * .
4. Add lock: e = 1 H u e ω u e σ e = Z u * .
Step 3 (Output)
(v)
Final Output:
  • Allocation vector X = ( x 1 , , x n ) ;
  • Increment vector Δ j and deviation terms σ + H s e , σ H s e ;
  • Optimal objective values for each tier Z 1 , , Z S .

6.3. Model Properties and Computational Scalability

6.3.1. Model Properties

From the proposed model, it follows that the P-MOLP scheme enforces a level-by-level priority: it not only represents the relative importance of coalition forms but also embeds member contribution weights into the coalition payoffs, thus honoring the fairness rule of “more contribution, more reward.” Compared with the traditional Shapley value, P-MOLP has advantages in allocation logic. The Shapley model assumes that every potential coalition can be formed; however, in cross-border logistics, this is often unrealistic. Geographic constraints, policy shocks, cultural differences, and capability gaps can prevent certain coalitions from being formed in practice or cause cooperation to be interrupted, making the payoff of some coalitions undefined. As noted by Meng et al. (2023) [20] and Hu (2018) [34], forcing such invalid sub-coalitions to have zero value can materially distort Shapley-based allocations and lead to results that deviate from practice.

6.3.2. Computational Scalability

Beyond its theoretical soundness, the computational scalability of P-MOLP also offers a distinct advantage. From a computational perspective, the proposed P-MOLP framework exhibits polynomial-time complexity. Each priority tier corresponds to one linear program of size O n + | H N | , where n is the number of alliance members and H ( N ) = 2 n n 2 represents the number of feasible coalitions. Solving the entire lexicographic sequence thus involves S LPs, each efficiently handled by commercial solvers such as Lingo or Gurobi. Even when n 6 corresponding to 62 feasible coalitions—the model can be solved in less than one second on a standard computer. The locking constraints between tiers ensure exact lexicographic priority without resorting to large artificial weighting coefficients, thereby guaranteeing numerical stability and interpretability.
In contrast, Shapley-based allocation methods require enumerating all 2 n 1 sub-coalitions for each member, resulting in exponential computational complexity O ( n 2 n 1 ) . When n = 6 , this already entails evaluating 192 coalition payoffs, each of which typically requires solving a separate optimization or simulation problem to compute V S . By transforming the allocation process into a sequence of polynomial-sized linear programs, P-MOLP achieves comparable fairness and interpretability to Shapley-based approaches while being several orders of magnitude more computationally efficient. Consequently, the model remains both theoretically rigorous and practically scalable, supporting real-time decision-making in cooperative alliance design.

6.3.3. Theoretical and Practical Implications

P-MOLP provides a strong theoretical foundation for fairness: beyond individual rationality and budget balance (efficiency), it accounts for alliance stability and priority order preservation, and—under general conditions—approximates the ε-core, thereby extending the applicability of classical core methods to empty-core cases. See Appendix A for the formal proofs of Propositions 1–6. Taken together, P-MOLP balances theoretical rigor, computational feasibility, and practical applicability, offering strong potential for real-world deployment.

7. Case Study

Drawing on the literature on the composition of cross-border e-commerce logistics supply chain alliances (Hua and Wu, 2024; Xie and Yin, 2019; Zhang et al., 2024) [2,9,44] and on representative practices at firms such as JD Global, Amazon China, Deppon Logistics, and FedEx, we select the logistics supply chain alliance of a leading cross-border e-commerce platform as the focal case. Based on interviews with the platform’s cross-border logistics manager, the core members of the alliance are categorized as: platform operator M 1 , domestic carrier M 2 , freight forwarder M 3 , and international carrier M 4 . After computing the alliance’s total payoff, we first quantify the contribution of each member via a group decision-making (GDM) evaluation, and then build a multi-priority goal programming model to study profit allocation and test fairness and implementability.

7.1. Determining Member Contribution Levels via GDM

7.1.1. IAHP-Derived Contribution Weights

Following Saaty and Vargas (1987) and Yang et al. (2023) [36,37], we apply an improved analytic hierarchy process (IAHP) to elicit member weights from individual experts. Based on the contribution-evaluation index system presented in Table 2, six domain experts were invited to participate. For each upper-level criterion, the experts assessed all lower-level indicators using the standard 1–9 scale. The inclusion of six experts provides a sufficient and balanced foundation for group decision-making. Previous AHP- and GDM-based studies generally employ expert panels of 5–10 participants, which is considered adequate to capture both diversity of judgment and consensus reliability. The six experts in this study collectively represent key subfields of cross-border logistics, supply chain management, and e-commerce platform operations.
As the analytic hierarchy process and its improved forms have been extensively adopted in logistics and performance evaluation, the detailed computational steps (e.g., construction of pairwise comparison matrices and consistency testing) are omitted here for brevity. The methodological focus of this paper is not the IAHP itself, but the enhancement of decision rationality through multi-expert judgment aggregation. Based on the experts’ judgments, the per-expert contribution-weight vectors were obtained. The resulting four-dimensional contribution-weight vectors (for members M 1 M 4 ) provided by the six experts are shown below. W I A H P 1 = (0.37660, 0.10099, 0.13410, 0.38829).
W I A H P 2 = (0.38555, 0.102104, 0.139351, 0.372995).
W I A H P 3 = (0.38074, 0.11648, 0.11650, 0.38626).
W I A H P 4 = (0.44436, 0.10311, 0.12810, 0.32521).
W I A H P 5 = (0.39730, 0.08130, 0.13390, 0.38750).
W I A H P 6 = (0.45730, 0.11402, 0.12625, 0.30243).

7.1.2. GDM Adjustment to IAHP Judgments

This section starts from the IAHP member-weight vectors given by individual experts and applies a GDM procedure to obtain consensus: we first compute inter-expert similarity and estimate expert weights, and then perform a weighted aggregation of the vectors to derive group-consistent member weights.
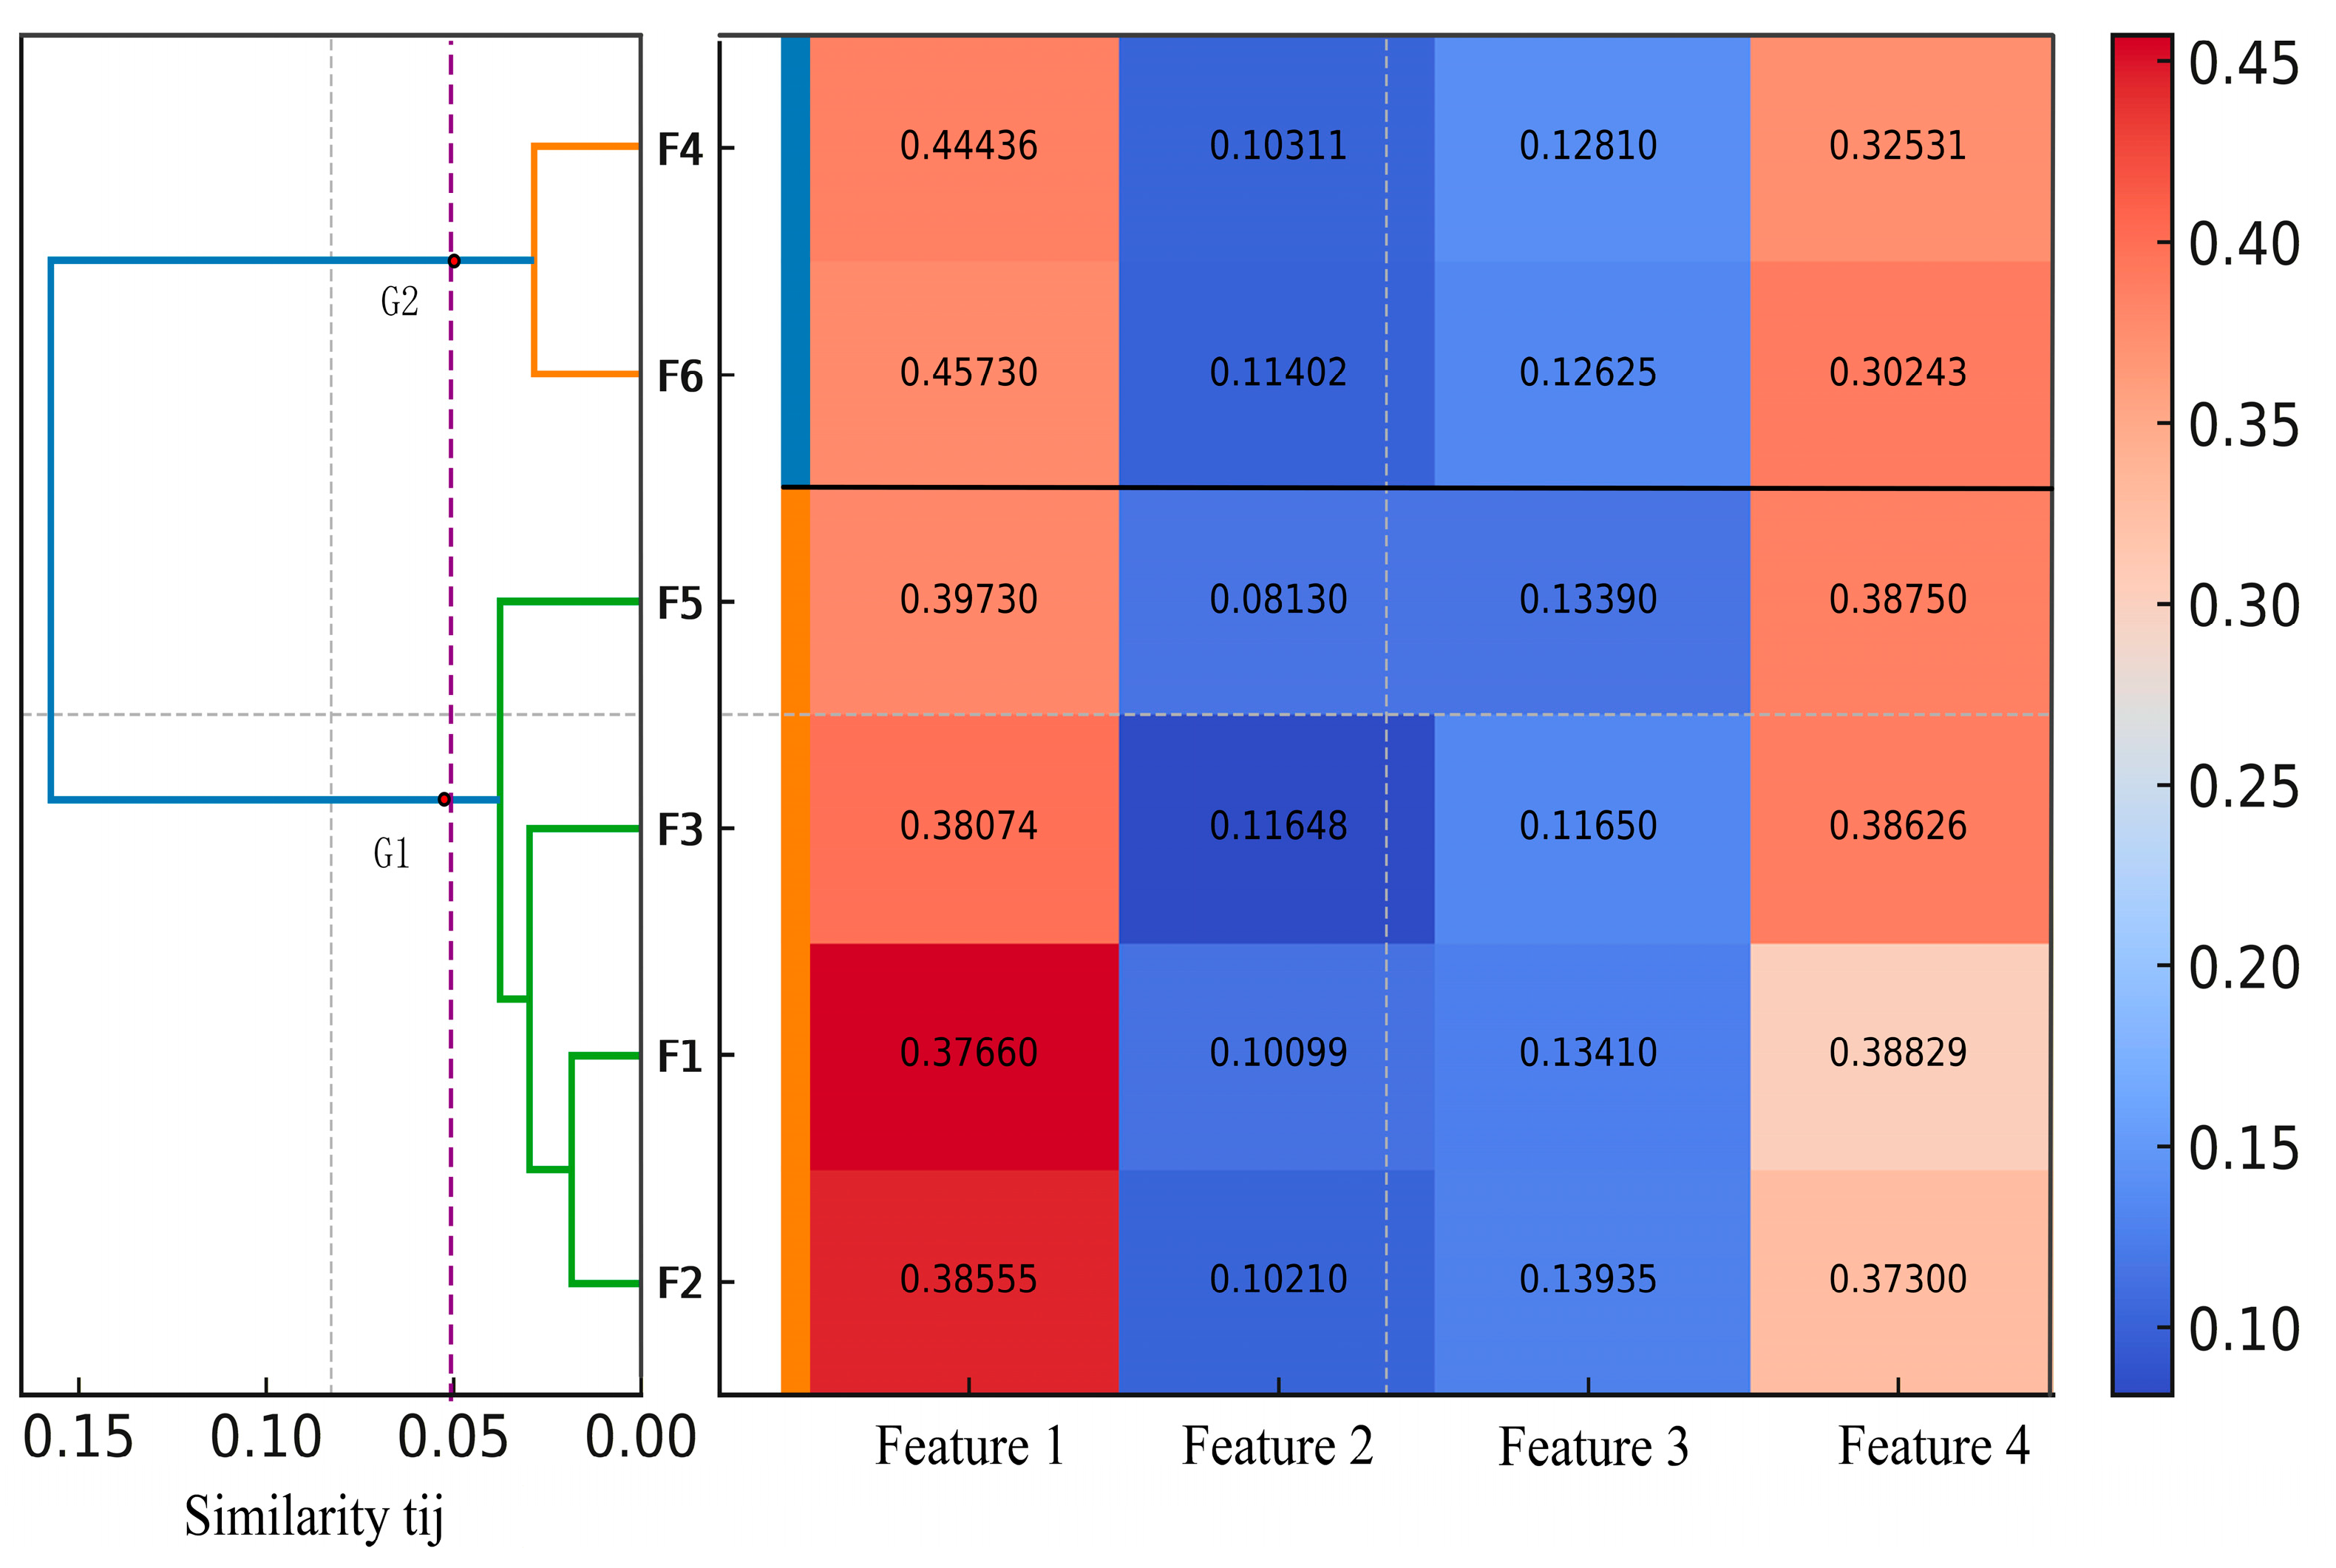
For exposition, index the six experts as F 1 , , F 6 and define the initial classes Q = F 1 , Q 2 = F 2 , Q 3 = F 3 , Q 4 = F 4 , Q 5 = F 5 , Q 6 = F 6 . Using (1), the pairwise similarity between expert a and expert   b is computed as   t a b . The obtained values are: t 12 = 0.01851, t 13 = 0.02389, t 14 = 0.09279, t 15 = 0.02858, t 16 = 0.11881, t 23 = 0.03046, t 24 = 0.07661, t 25 = 0.02847, t 26 = 0.10218, t 34 = 0.08993, t 35 = 0.04261, t 36 = 0.11397, t 45 = 0.08126, t 46 = 0.02843, t 56 = 0.10938. Let t min = t 12 . Merge Q 1 and Q 2 into a new class Q 7 = F 1 , F 2 the class set becomes Q 3 , Q 4 , Q 5 , Q 6 , Q 7 Recompute the pairwise similarities for the updated set, t 34 = 0.08993, t 35 = 0.04261, t 36 = 0.11397, t 37 =   min t 13 , t 23 = 0.02389, t 45 = 0.08126, t 46 = 0.02843, t 47 = min t 14 , t 24 = 0.07661, t 56 = 0.10938, t 57 = min t 15 , t 25 = 0.02847, since t min = t 37 , merge Q 3 and Q 7 to obtain the new class Q 8 = F 1 , F 2 , F 3 ; the class set becomes Q 4 , Q 5 , Q 6 , Q 8 . Repeat the agglomeration steps. The resulting new classes are
Q 9 = F 1 , F 2 , F 3 , F 5 ,   Q 10 = F 4 , F 6 ,   Q 11 = F 1 , F 2 , F 3 , F 4 , F 5 , F 6 .
The hierarchical clustering for the above process yields the dendrogram and the corresponding expert-feature heatmap shown in Figure 2.
This section investigates the sensitivity of expert clustering results to changes in the threshold t . When t varies across different intervals, both the grouping structure of experts and the aggregated group weights W G D M I A H P t evolve correspondingly. If the grouping pattern remains unchanged within a relatively wide range of t , the clustering can be regarded as stable and robust. As shown in Table 3, the clustering results evolve as follows:
(1)
When t < 0.0185, all six experts remain independent. This indicates a low degree of consensus and large individual differences among experts’ IAHP weight vectors.
(2)
For t (0.0185, 0.0284), experts F 1 and F 2 first merge, suggesting that they share the highest similarity and form the first local consensus group.
(3)
For t (0.0284, 0.0289), a new subgroup { F 4 , F 6 } emerges, showing that these two experts exhibit close proximity in their evaluation patterns—representing a second local convergence.
(4)
For t (0.0289, 0.0426), the structure stabilizes into { F 1 , F 2 , F 3 }, { F 4 , F 6 }, and { F 5 }. The first three experts gradually align in their weighting logic, while F5 remains marginally distinct.
(5)
When t > 0.0426, the final configuration { F 1 , F 2 , F 3 , F 5 } and { F 4 , F 6 } becomes dominant and remains unchanged, where the two main clusters merge.
Conceptually, experts F 1 , F 2 , F 3 and F 5 share similar weighting patterns, while F 4 and F 6 emphasize risk- and input-related factors, forming a distinct perspective. Hence, the two-group division achieves a sound balance between intra-group consistency and inter-group diversity, capturing the essential consensus structure among experts while retaining meaningful variation in judgment.
Through the above analysis, it is reasonable to conclude that, as shown in Figure 2, under a moderate similarity threshold (around t i j = 0.05 ), the experts are naturally divided into two stable groups—{ F 1 , F 2 , F 3 , F 5 } and { F 4 , F 6 }.By (2), the class sizes (weights) are β 1 = β 2 = β 3 = β 5 = 4 , β 4 = β 6 = 2 . Hence, the group weight coefficients are ϕ 1 = ϕ 2 = ϕ 3 = ϕ 5 = 4 4 + 4 + 4 + 4 + 2 + 2 = 0.2, ϕ 4 = ϕ 6 = 2 4 + 4 + 4 + 4 + 2 + 2 = 0.1.
According to (3), taking the weighted average of each expert’s IAHP vector with these proportions gives the GDM-IAHP comprehensive weights of the alliance members:
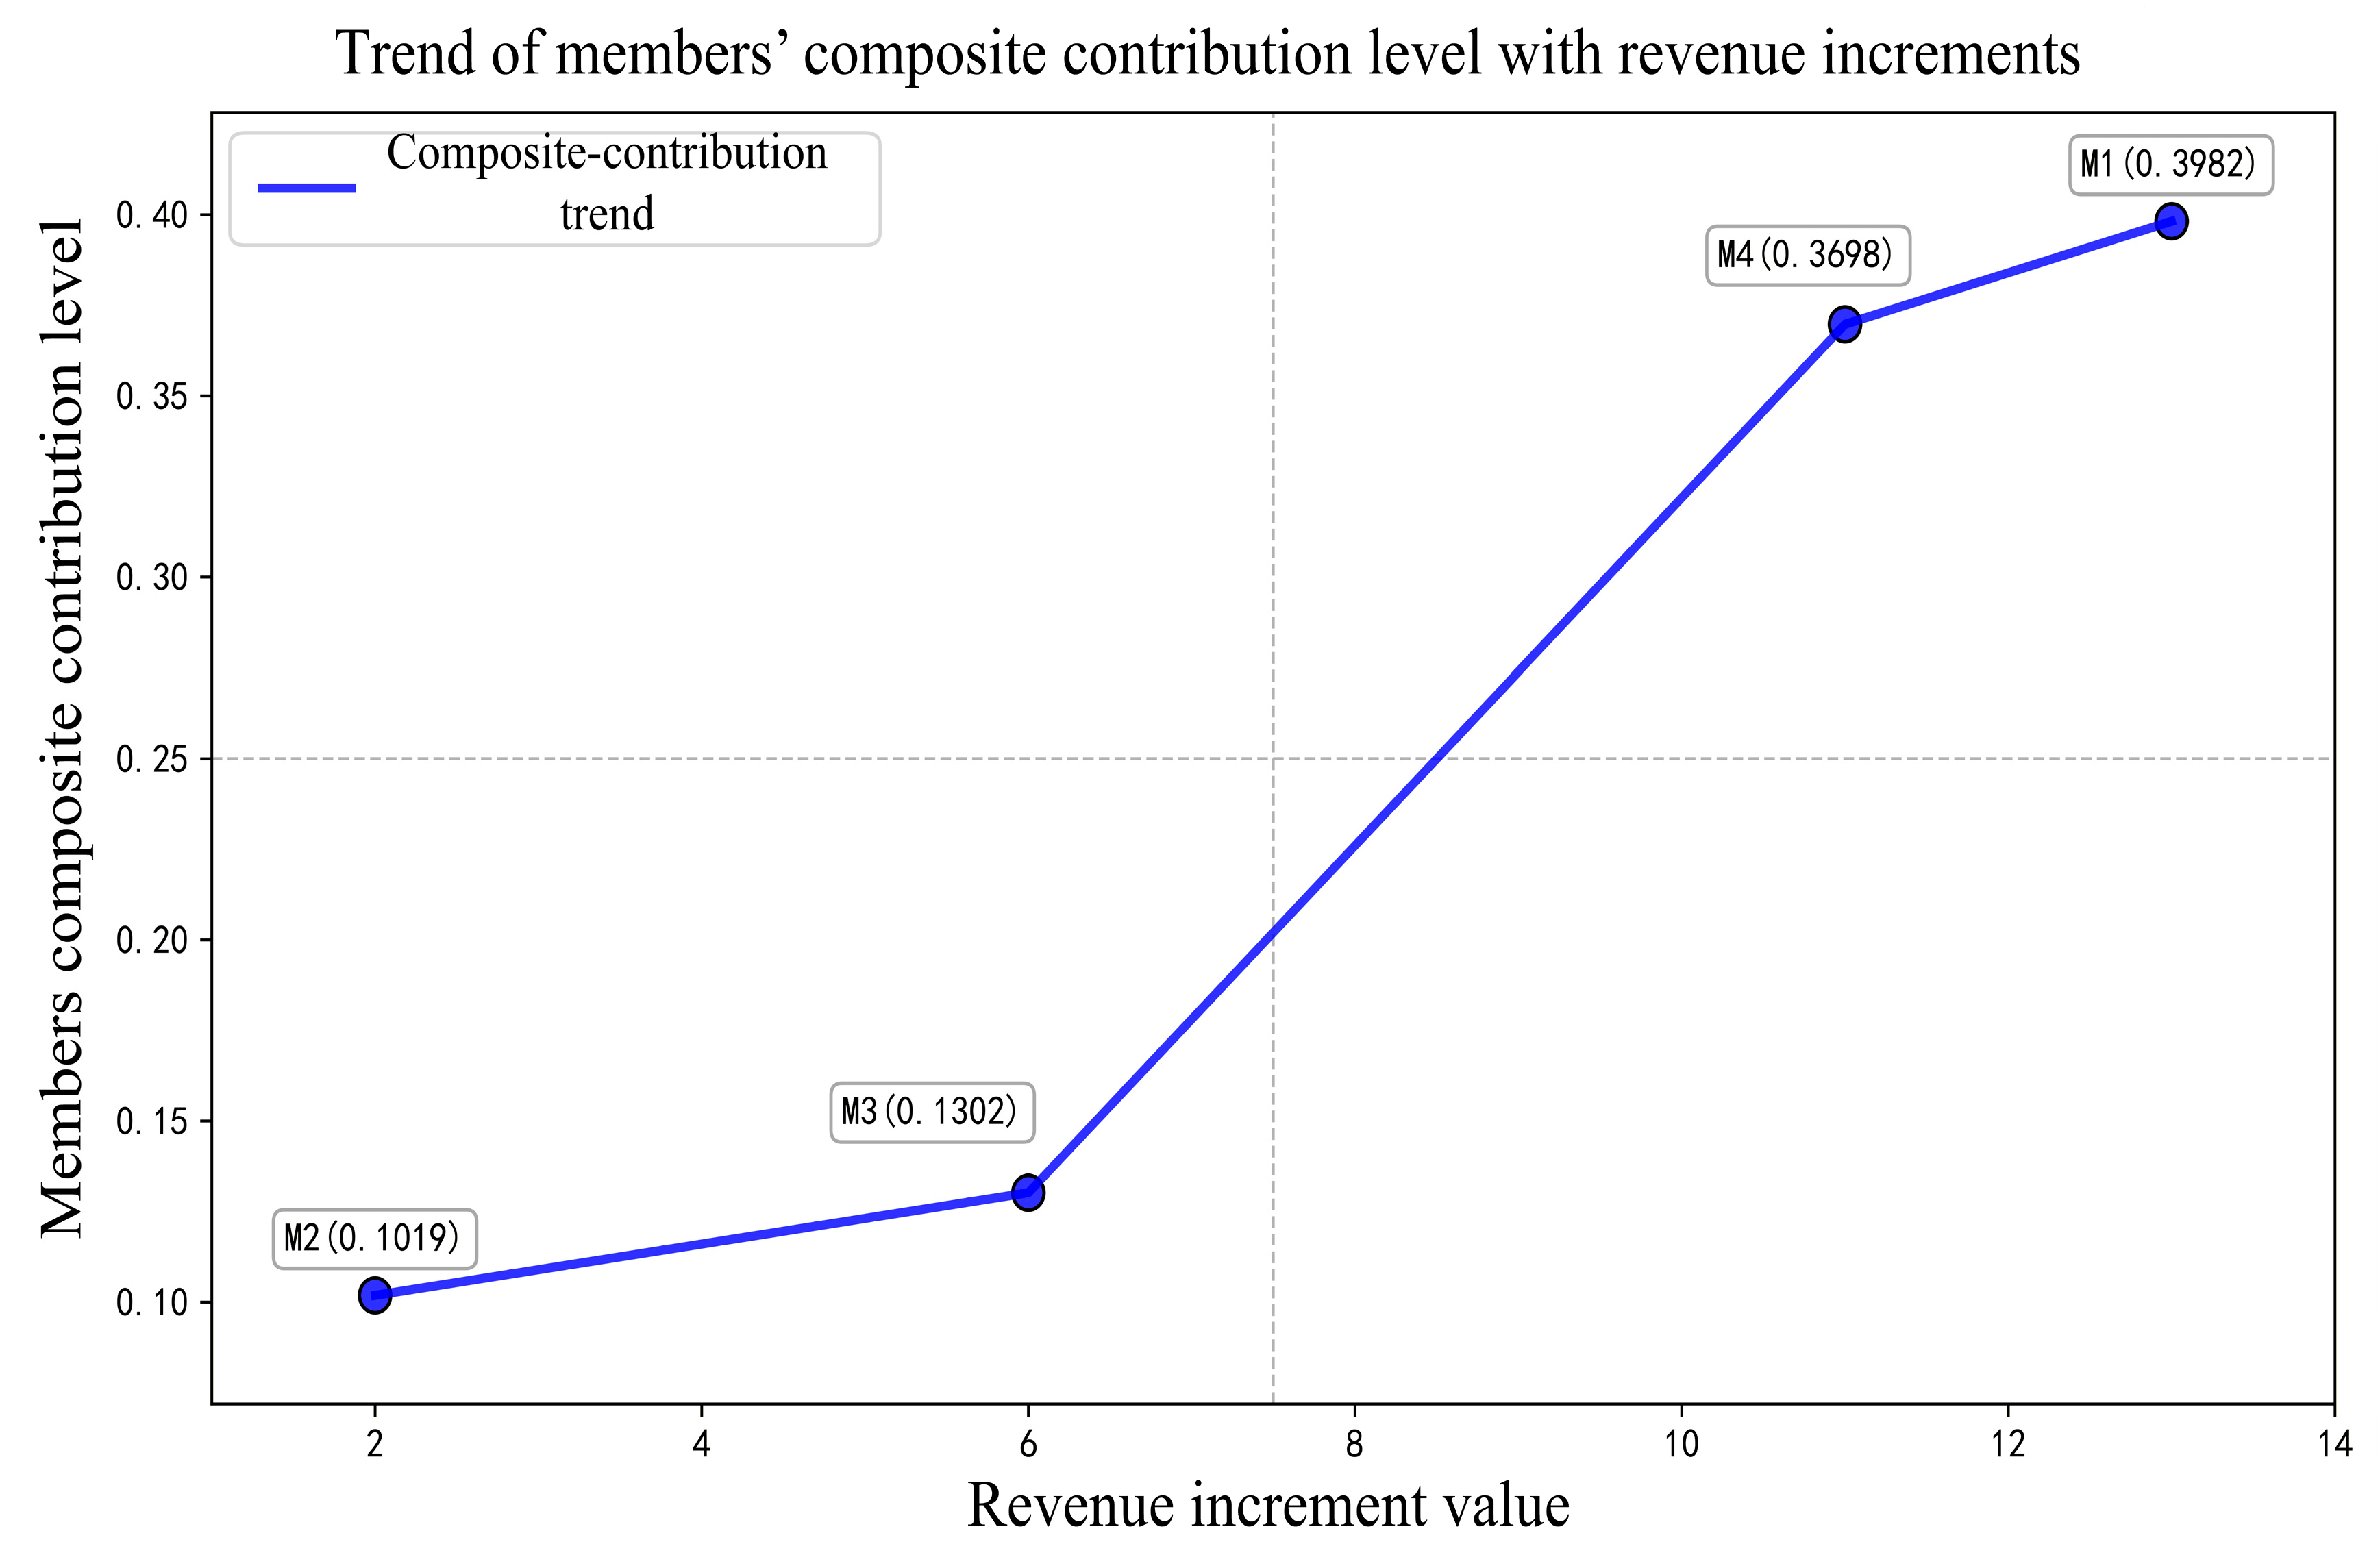
W G D M I A H P = i p W I A H P i × ϕ i = W A H P 1 × ϕ 1 + W I A H P 2 × ϕ 2 + W I A H P 3 × ϕ 3 + W I A H P 4 × ϕ 4 + W I A H P 5 × ϕ 5 + W I A H P 6 × ϕ 6 = ( 0.39820 ,   0.10188 ,   0.13020 ,   0.36977 )

7.2. Multiobjective Linear-Programming Model for Profit Allocation with Cooperation Priorities

Based on enterprise interviews, each alliance member M 1 , M 2 , M 3 , M 4 can either operate independently or form coalitions. The feasible coalition structures and their net payoffs are shown in Table 4. The payoff data are designed to reflect typical operational characteristics of cross-border e-commerce logistics alliances. Each singleton value V { i } represents the member’s standalone profit capacity determined by its role, cost structure, and control over resources. The platform ( M 1 ) achieves the highest payoff due to its dominance in transaction aggregation; the international carrier ( M 4 ) follows, reflecting its cross-border transport capability; while the domestic carrier ( M 2 ) and freight forwarder ( M 3 ) earn lower independent profits consistent with their supporting positions in the chain.
Coalition payoffs   V S incorporate scale and coordination synergies—such as information sharing, route optimization, and joint customs handling—ensuring that all non-singleton coalitions satisfy V ( S ) > i S V ( { i } ) . This construction captures cooperative value enhancement and maintains numerical realism, satisfying the fundamental superadditivity condition at the singleton level and providing a consistent empirical basis for subsequent allocation analysis.
Using the IAHP–based group decision results in Section 7.1.2, we linearly summed the comprehensive weights of members that appear in each coalition to obtain the coalition importance (priority coefficient, ω s e ) for every feasible coalition H N . The results are shown in Table 5.
Using hierarchical clustering, we analyze the importance of alliance cooperation structures; the results are shown in Figure 3. The x-axis shows the pairwise similarity t i j between coalition structures, and the y-axis reports the importance level of the coalition structures.
To quantitatively identify the most representative tier configuration, the clustering results were examined across a sequence of threshold intervals. Table 6 summarizes how different threshold values affect the number of tiers and the resulting coalition grouping patterns, while Table 7 further characterizes their structural properties.
First, let us examine how different threshold intervals influence the formation of tiers, coalition groupings, and their structural characteristics. Through this comparison, we observe that the clustering configuration evolves systematically with the similarity threshold: as the threshold increases, alliances gradually merge from fine-grained to coarse structures.
Within this process, the configuration around t = 0.05 emerges as particularly representative—showing both statistical stability and managerial interpretability. The hierarchical clustering reveals a stable five-tier structure within t 0.0296 , 0.0735 , where alliances in the same tier share homogeneous importance patterns, while those across tiers differ substantially.
Correspondingly, these tiers align well with the practical typology of cross-border logistics alliances:
  • P1 ( H 8 , H 9 ): Strategic core alliances (resource-integration type);
  • P2 ( H 3 ): High-value bilateral cooperation (resource-complementary)
  • P3 ( H 7 , H 10 ): Potential tri-party partnerships (emerging complementary);
  • P4 ( H 1 , H 6 , H 2 , H 5 ): Operational-level collaborations (resource-sharing);
  • P5 ( H 5 ): Peripheral cooperation (transactional sharing).
This hierarchy captures both quantitative differentiation and managerial logic, illustrating how varying cooperation depths—from resource sharing to full integration—naturally translate into ordered priority tiers. In summary, the five-tier structure within t 0.0296 , 0.0735 achieves an optimal balance between statistical stability and managerial explicability.
Using the minimization model in (5) together with the coalition-revenue data in Table 4, we build the following linear program for profit allocation:
min Z = P 1 0.8699 σ H 1 1 + 0.8982 σ H 1 2 + P 2 0.7680 σ H 2 1 + P 3 0.6303 σ H 3 1 + 0.6019 σ H 3 2 + P 4 0.5001 σ H 4 1 + 0.5 σ H 4 2 + 0.5284 σ H 4 3 + 0.4717 σ H 4 4 + P 5 0.2321 σ H 5 1 s . t . X 1 36 X 2 14 X 3 13 X 4 29 X 1 + X 2 σ H 4 1 + + σ H 4 1 = 64 X 1 + X 3 σ H 4 3 + + σ H 4 3 = 57 X 1 + X 4 σ H 2 1 + + σ H 2 1 = 76 X 2 + X 3 σ H 5 1 + + σ H 5 1 = 35 X 2 + X 4 σ H 4 4 + + σ H 4 4 = 56 X 3 + X 4 σ H 4 2 + + σ H 4 2 = 48 X 1 + X 2 + X 3 σ H 3 1 + + σ H 3 1 = 78 X 1 + X 2 + X 4 σ H 1 1 + + σ H 1 1 = 100 X 1 + X 3 + X 4 σ H 1 2 + + σ H 1 2 = 90 X 2 + X 3 + X 4 σ H 3 2 + + σ H 3 2 = 68 X 1 + X 2 + X 3 + X 4 = 124 X 2 14 = Δ 1 , X 3 13 = Δ 2 X 4 29 = Δ 3 , X 1 36 = Δ 4 Δ 4 > Δ 3 > Δ 2 > Δ 1 0 σ H s e + σ H s e = 0   σ H s e + 0 ,   σ H s e 0
We solve the model using a preemptive (lexicographic) goal-programming procedure implemented in LINGO 17. At the computed optimum, all negative-deviation variables are driven to zero (i.e., σ = 0 ), while the solver reports the corresponding positive deviations σ + ; the optimal objective value is Z .
σ H 1 1 = 0 ,   σ H 1 2 = 0 ,   σ H 2 1 = 0 ,   σ H 3 1 = 0 ,   σ H 3 2 = 0 ,   σ H 4 1 = 0 ,   σ H 4 2 = 0 ,   σ H 4 3 = 0 ,   σ H 4 4 = 0 ,   σ H 5 1 = 0 ,   Z = 0
σ H 1 1 + = 5 ,   σ H 1 2 + = 18 ,   σ H 2 1 + = 13 ,   σ H 3 1 + = 6 ,   σ H 3 2 + = 7 ,   σ H 4 1 + = 1 ,   σ H 4 2 + = 11 ,   σ H 4 3 + = 11 ,   σ H 4 4 + = 0 ,   σ H 5 1 + = 0
Accordingly, the optimal profit allocation for the four members of the cross-border e-commerce logistics supply chain alliance is:
(1)
platform M 1 : 49.0
(2)
domestic logistics firm M 2 : 16.0
(3)
freight forwarder M 3 : 19.0
(4)
international logistics firm M 4 : 40.0
To give readers a more intuitive comparison, the payoff vectors produced by different profit-allocation methods are listed in Table 8, and the corresponding computational procedures are provided in Appendix B.

7.3. Comparative Analysis of Results

From Table 8, the P-MOLP allocation (which incorporates alliance priorities and weight coefficients) assigns larger payoffs to members M 1 and M 4 , and smaller payoffs to M 2 and M 3 . This reflects that, when operating independently, M 1 and M 4 earn higher revenues and have higher composite contributions (comprehensive weights) within the alliance, whereas M 2 and M 3 contribute less overall. The allocations are therefore consistent with actual operations and satisfy the “more contribution, more reward” principle. As shown in Figure 4, the increase in members’ benefits after forming the grand alliance follows:
M 1 > M 4 > M 3 > M 2
which matches the ranking of their composite contributions, indicating that the allocation results are fairer.
Comparing P-MOLP with the ordinary goal programming model (which does not account for cooperation priority or weight coefficients) shows that P-MOLP yields clearer differentiation. Because M 1 and M 4 have higher comprehensive contributions and more central roles, the coalition structures they join are of higher priority and thus deliver higher benefits; the opposite holds for M 2 and M 3 .
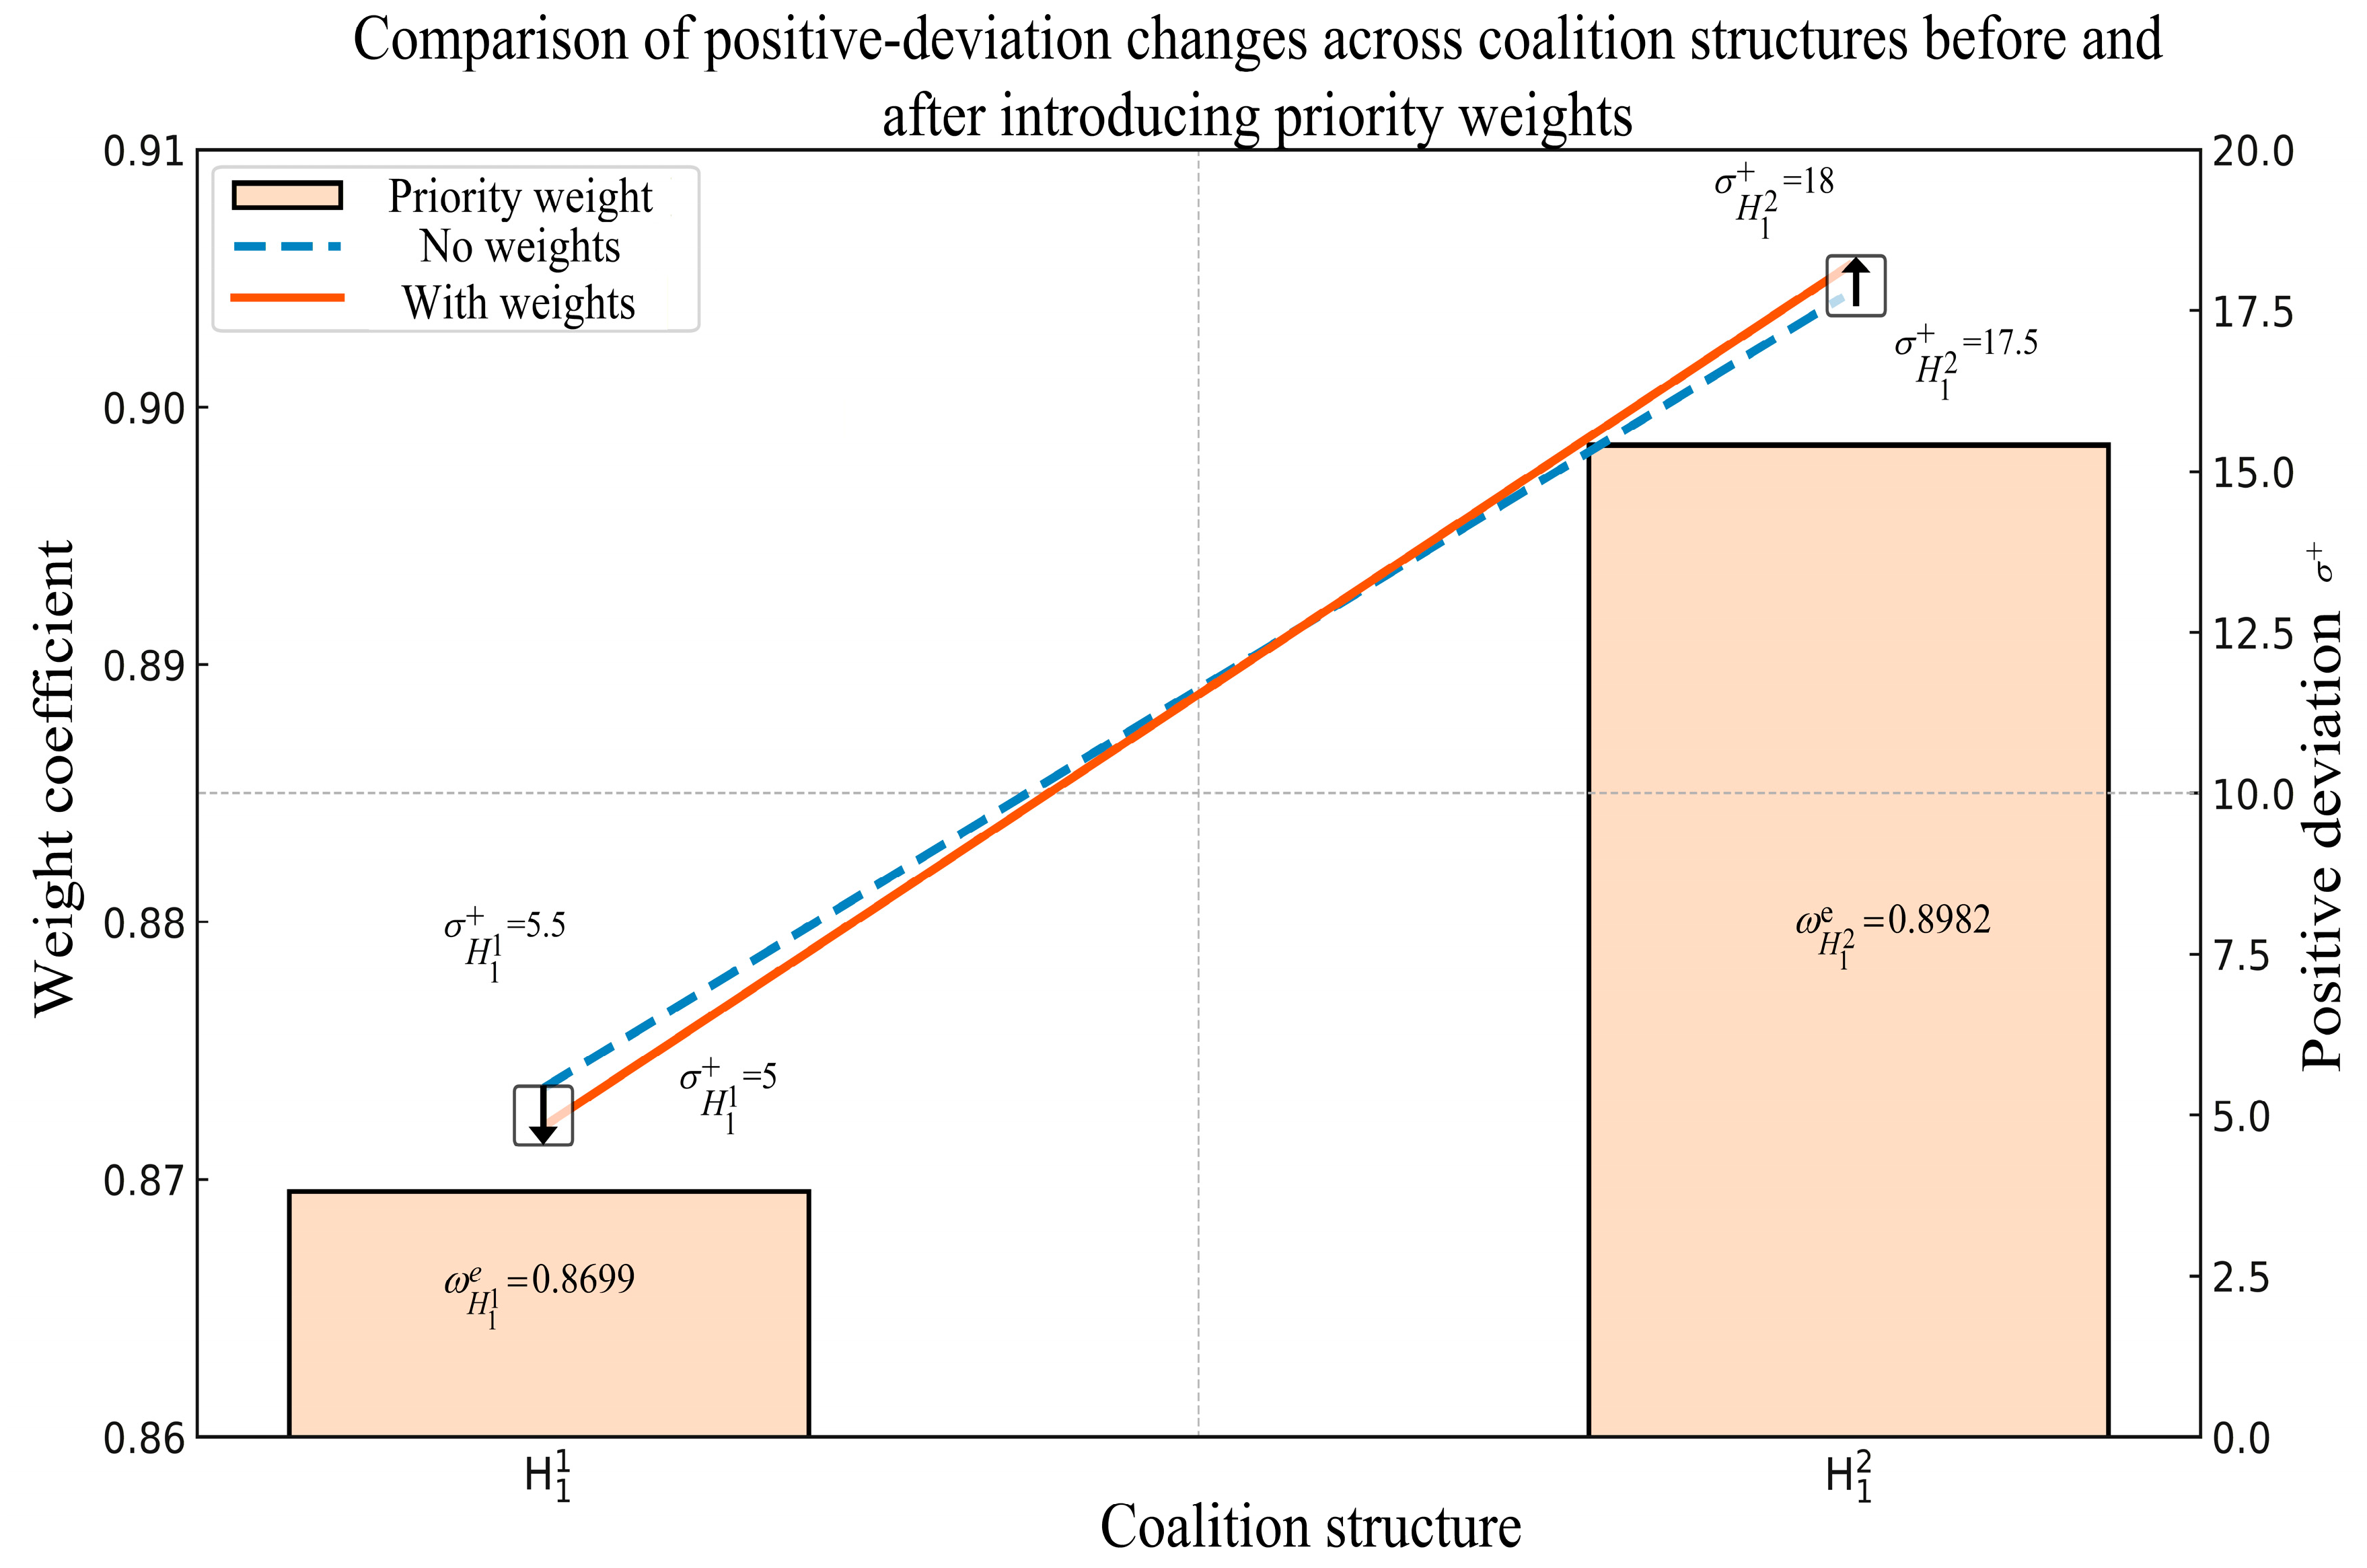
We also compare two P-MOLP variants—with and without weight coefficients. As illustrated in Figure 5, some bias appears in the allocation results, especially at the first-priority level. After introducing weight coefficients, the positive deviation variables change from
σ H 1 1 + = 5.5 ,   σ H 1 2 + = 17.5   to   σ H 1 1 + = 5 ,   σ H 1 2 + = 18
Since the importance weight of H 8 is 0.8699, and that of H 9 is 0.8982, H 9 is more important; accordingly, the positive deviation allocated to the more important structure increases while that for the less important structure decreases. This shift indicates that introducing weight coefficients enhances the separation of allocation outcomes across coalition structures, improving both the reasonableness and sensitivity of the scheme.
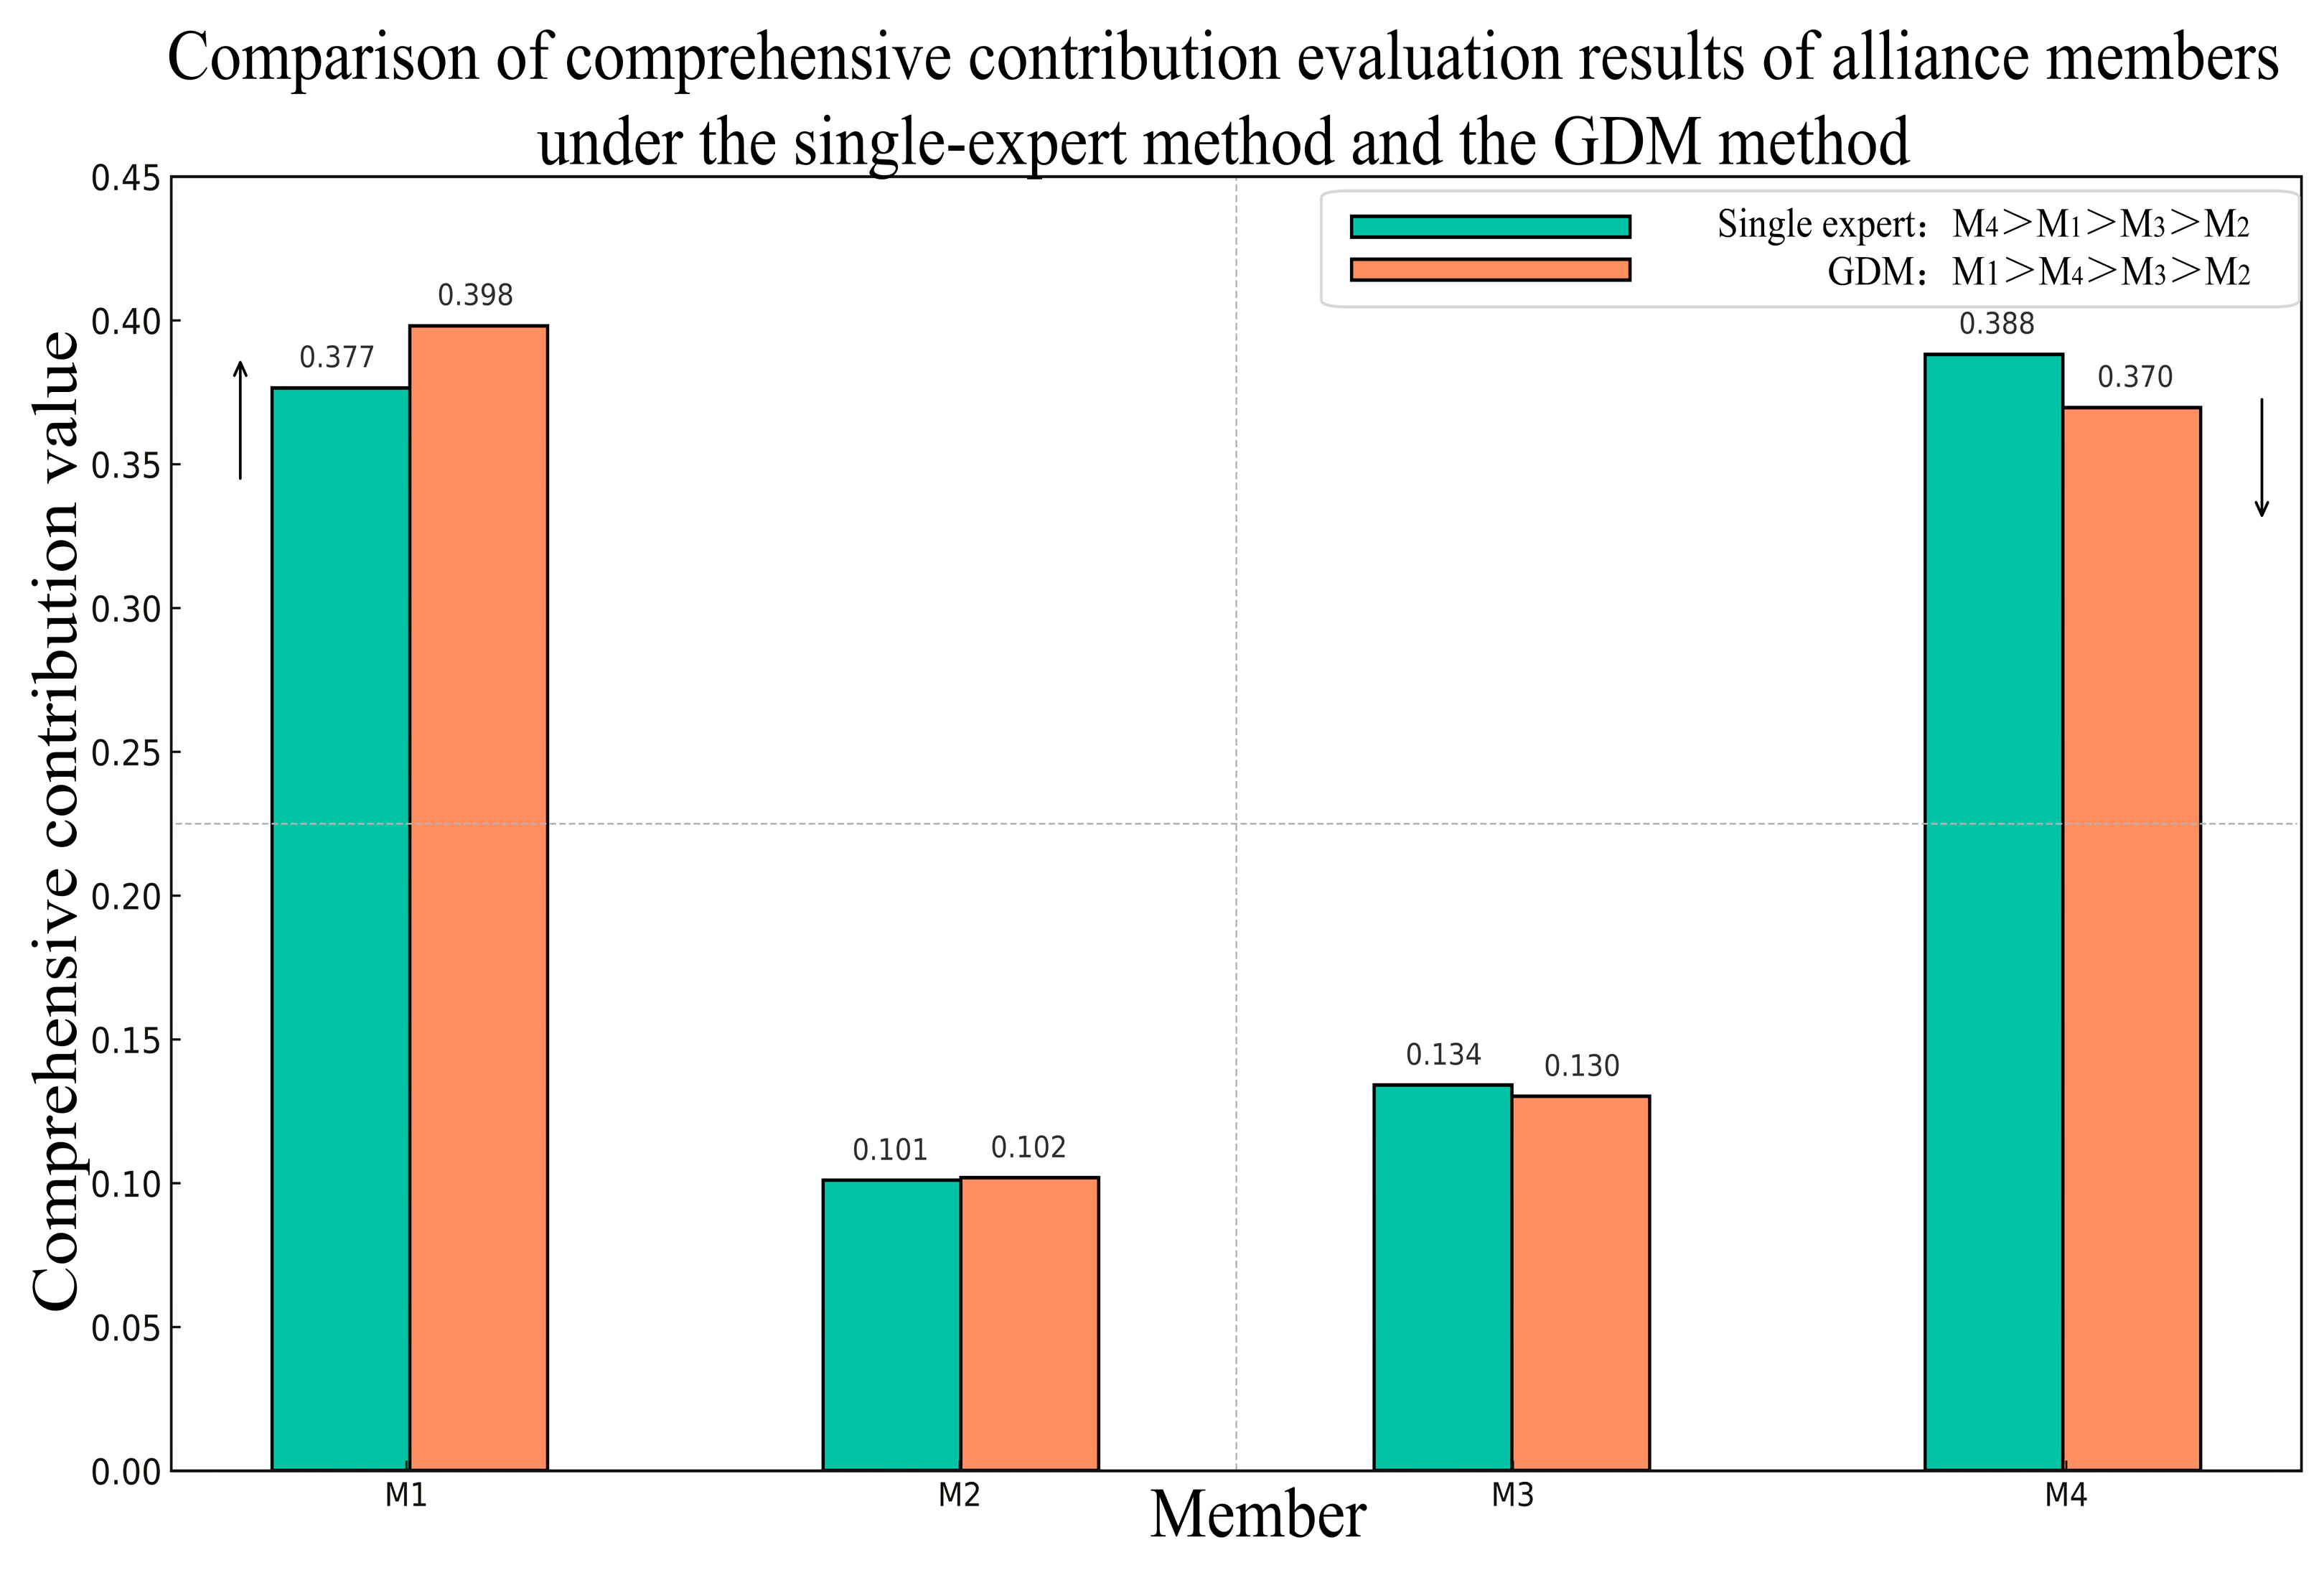
Combining the single-expert and group decision-making (GDM) schemes, we compare the composite contribution weights of members. As shown in Figure 6, under GDM, the weight of M 1 exceeds that of M 4 ; under the single-expert IAHP, however, the ranking is reversed. Even small differences in these weights can change the ordering of priority weights, which in turn produces sizable differences in the final profit-allocation outcomes. Hence, determining composite contribution weights via the GDM-based IAHP—by pooling the judgments of multiple experts—yields a more comprehensive decision and better reflects alliance reality.
Comparing the P-MOLP with the Shapley allocation shows that, because the Shapley scheme assumes equal status among members and ignores cooperation-priority structures, its results do not sufficiently differentiate coalition patterns. Given that member M 3 has a higher overall contribution than M 2 , the increase in M 3 ’s allocated payoff under P-MOLP is larger than that of M 2 ; the plain Shapley allocation cannot reflect such differences in comprehensive contribution.
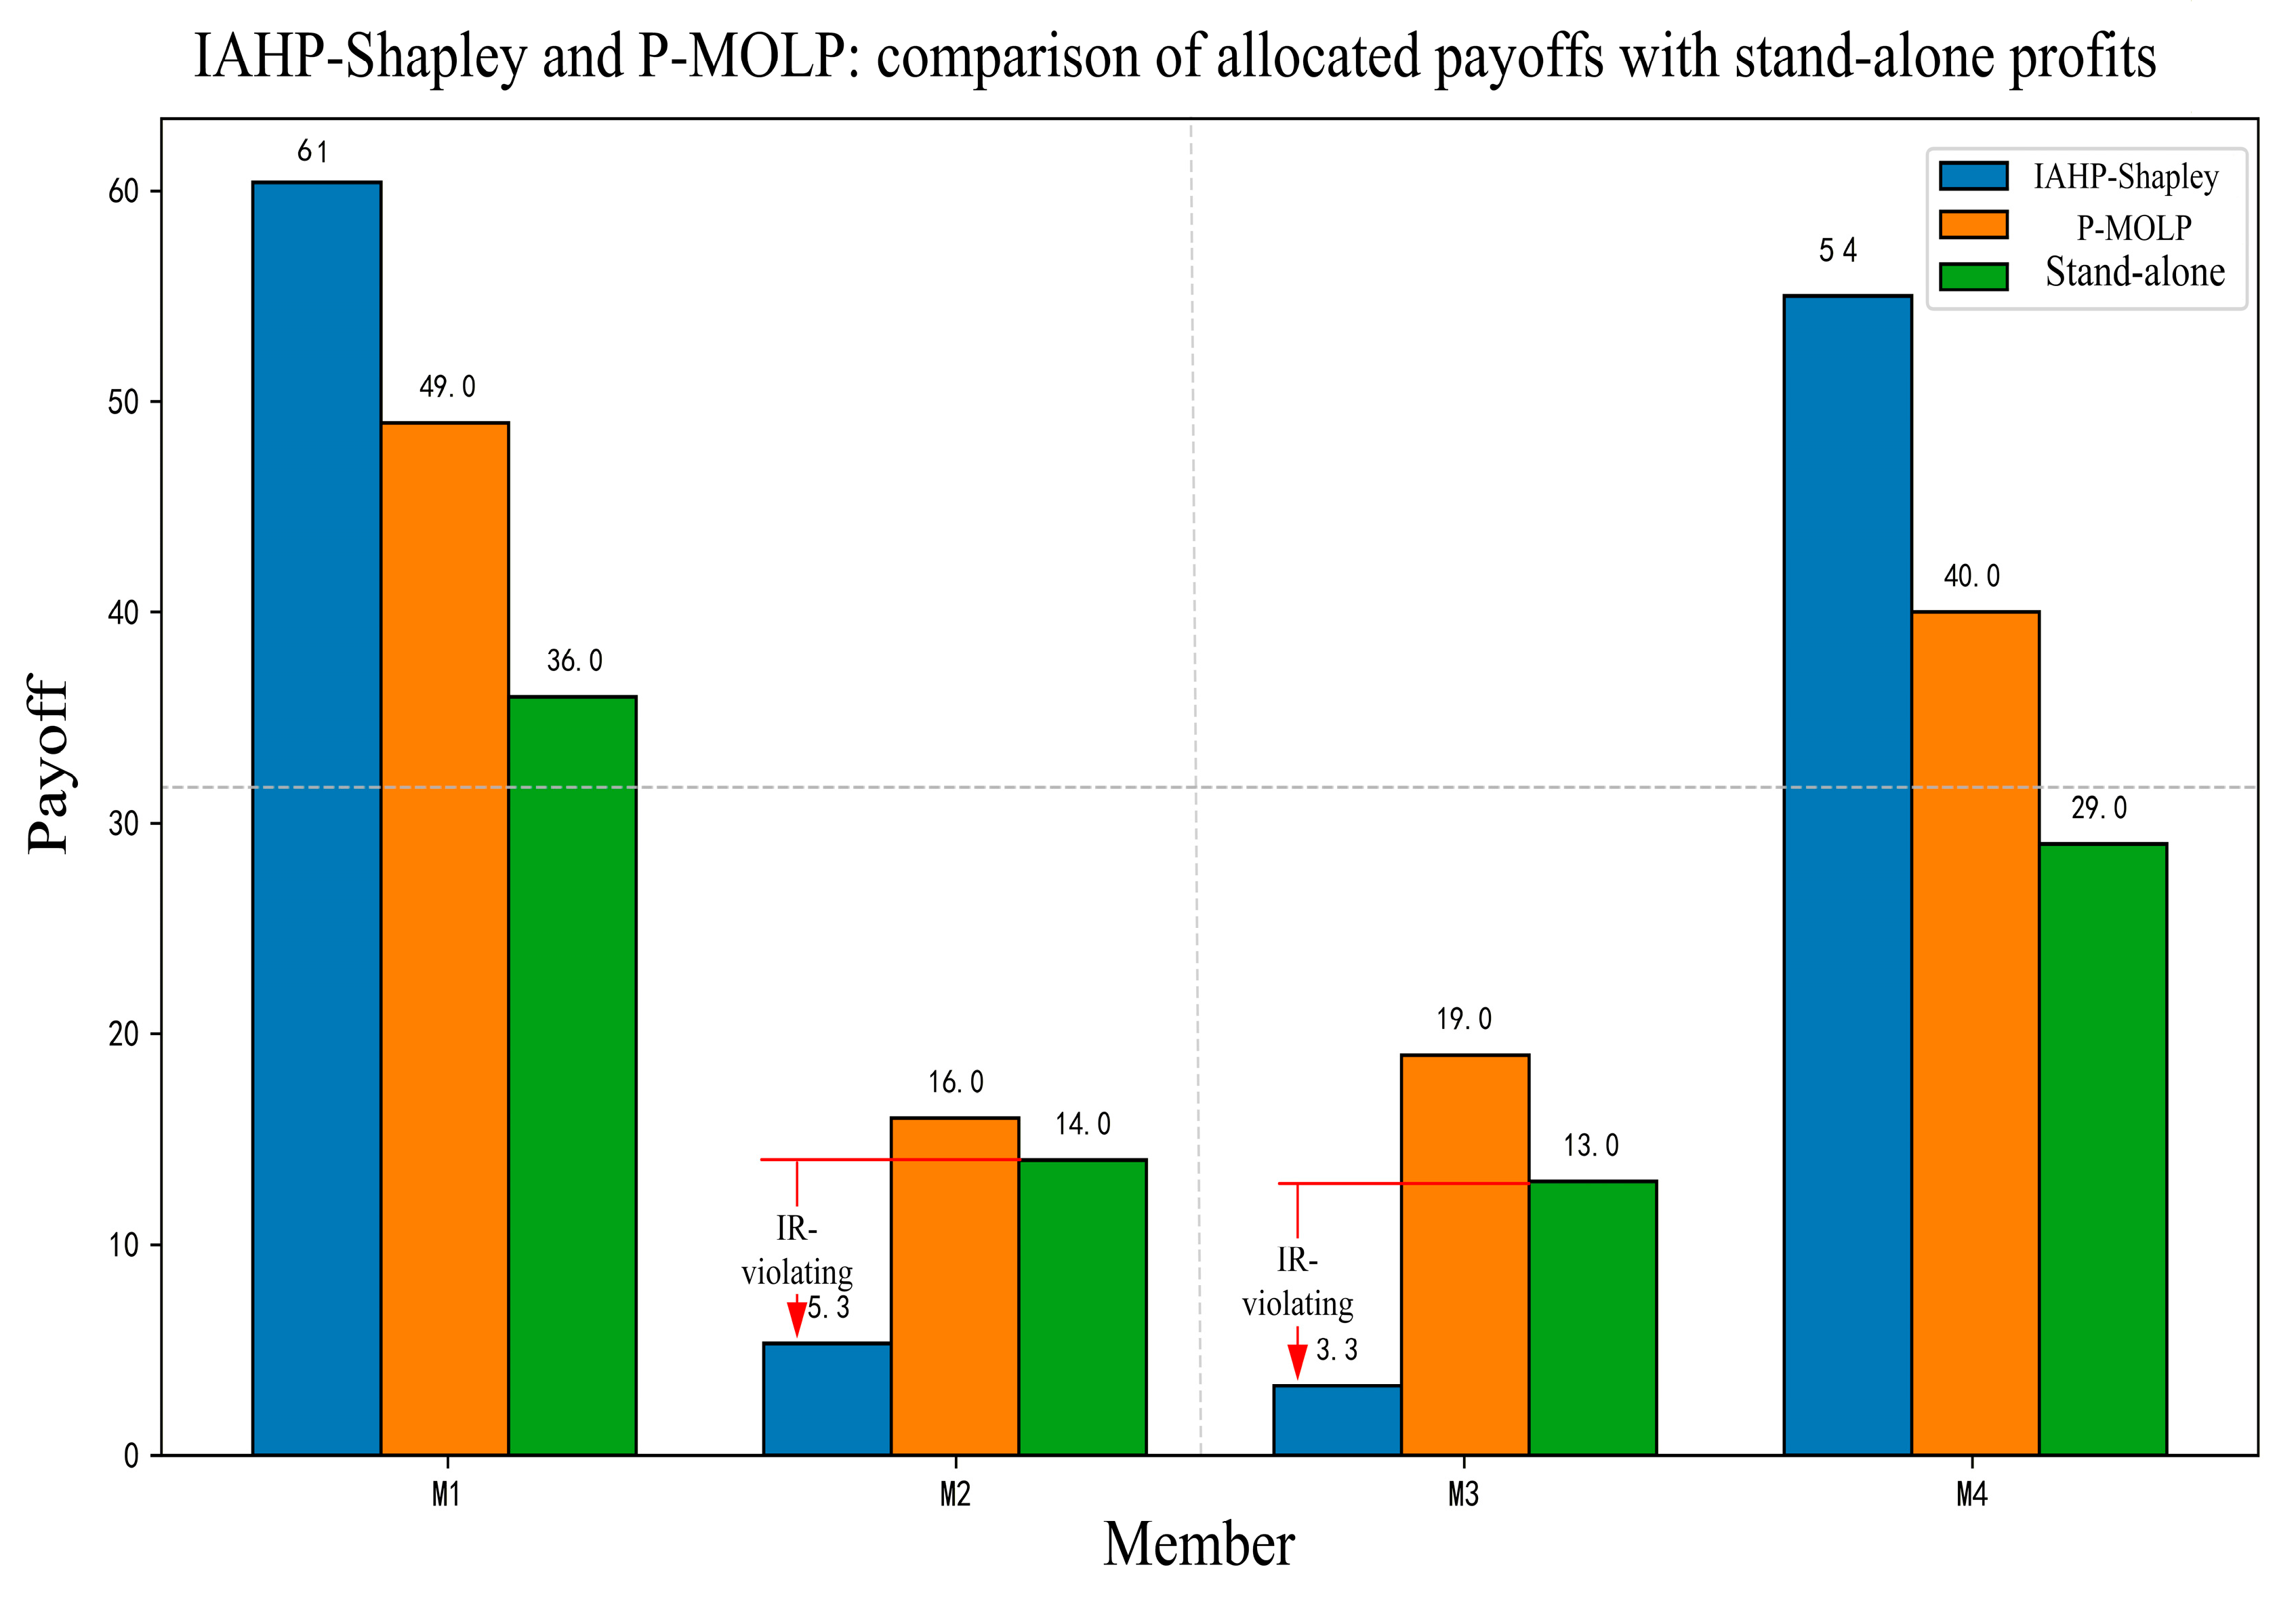
Moreover, many studies propose “modified-Shapley” variants (Yu et al., 2018; Zhang, 2018; Ma et al., 2020; Fang et al., 2020; Liu et al., 2021; Wang et al., 2023) [13,45,46,47,48,49]. Using IAHP-Shapley as an example, Figure 7 shows that the payoffs allocated to M 2 and M 3 within the alliance are lower than their stand-alone profits, violating individual rationality. The reason is the strong subjectivity in expert judgments, which can drive some weights to extremes and lead to overly large corrections. Only when the coalition’s total profit is sufficiently high will all members’ final payoffs satisfy individual rationality. Hence, such methods can be limited in practice, whereas the proposed P-MOLP, by enforcing individual-rationality constraints, avoids this problem effectively.
Meanwhile, Shapley-value–type methods average over all possible coalition structures. In practice, however, capability heterogeneity among members and differences in culture, region, and economic policies in cross-border logistics often make some coalitions infeasible or cause cooperation to be interrupted. In such cases, those methods fail to produce valid allocations. The proposed priority-based multiobjective linear programming model addresses this issue: when a coalition is infeasible, the corresponding constraints can be deactivated during optimization, so the rest of the model proceeds without being affected.
Finally, we compare with the core approach. The core yields allocations that satisfy both collective and individual rationality and therefore have some practical value, but its solutions are generally non-unique. More importantly, it does not consider cooperation-priority structures or differences in member contributions, so it inherits the same limitations as the Shapley family. By contrast, the proposed P-MOLP, built on individual- and group-rationality constraints, admits ε-core stability under general conditions (see Proposition 6) and remains effective even when the core is empty. It also accounts for member importance and contribution levels, conforms to the “more work, more reward” principle, and delivers solutions with broader applicability and better realism.

8. Discussion, Implications, and Conclusion

8.1. Managerial Implications

(1)
Integrate pivotal members’ cooperation capability into allocation design.
Profit allocation should explicitly reflect the cooperation capability and strategic importance of pivotal members. Ignoring this factor risks weakening incentives and triggering their withdrawal to smaller, more advantageous coalitions. Managers should identify pivotal members using measurable indicators—such as the scale of cross-border resource input, control over key logistics nodes, and responsiveness to alliance disruptions—and ensure these members receive proportionally higher allocations. This incentive alignment helps sustain commitment and enhances alliance stability.
(2)
Conduct group-based contribution assessment with transparent procedures.
To improve fairness and accountability, contribution evaluation should follow a collective, auditable process. Forming a cross-functional assessment panel (e.g., operations, trade finance, and logistics governance) and applying a standardized GDM rubric can reduce subjective bias. Recording scoring justifications and conducting periodic reviews—especially when alliance inputs or cooperation scope shift significantly—support continuous credibility and consistency.
(3)
Institutionalize method selection and robustness governance.
Managers should adopt a structured allocation framework: use P-MOLP as the main decision tool for long-term alliances, benchmark results against Shapley or least-core allocations, and apply simplified goal programming for short-term collaboration. Re-running robustness checks when contribution weights or coalition orders change ensures allocation stability and managerial adaptability across contractual contexts.

8.2. Limitations and Future Research

This study has several limitations that also point to meaningful directions for future research.
First, when solving the multi-priority optimization model, the sensitivity of allocations to intra-tier priority weights gradually weakens at lower priority levels. This is not a modeling flaw but an inherent feature of lexicographic optimization: once upper-tier objectives are fully satisfied, lower-tier weights can only adjust within a highly restricted feasible region. Such dominance of hierarchical priorities reflects a balanced managerial logic in strongly tiered systems—such as cross-border e-commerce logistics alliances—where strategic stability provides the foundation for sustainable cooperation, and fairness refinements operate as complementary mechanisms that fine-tune equilibrium outcomes. Nevertheless, this strict hierarchy inevitably limits the influence of intra-tier weights. Future research may therefore introduce tolerance-based or relaxed lexicographic formulations to enhance the responsiveness of lower-tier objectives while maintaining upper-tier priority consistency.
Second, although the current framework estimates member contributions and filters infeasible coalition structures through static constraints, it still adopts a static perspective on cooperation. In reality, alliance formation is dynamic and adaptive, influenced by shifting policies, evolving trust, partner reputation, and cross-border institutional frictions. To capture this complexity, a Dynamic P-MOLP framework can be developed to couple static profit allocation with coalition evolution. Specifically, such an extension would:
(1)
Assign each feasible coalition S t a time-dependent formation probability   p S t , evolving through Bayesian learning, Markov transitions, or replicator dynamics;
(2)
represents the cooperation network as a weighted graph G V , E t , where edge weights denote cooperative intensity, allowing network measures (e.g., edge density, clustering, modularity) to inform optimization constraints;
(3)
Re-solve the allocation problem iteratively as the network evolves, yielding a time-dependent allocation trajectory x t that converges to a dynamic equilibrium.
This dynamic coupling scheme is computationally tractable for small- and medium-scale coalition systems and significantly enhances the robustness and realism of P-MOLP. It provides a theoretical foundation for linking static fairness optimization with dynamic coalition evolution, enabling the integrated analysis of alliance stability, fairness, and cooperative intensity under uncertainty—offering a promising and practically relevant direction for future research on cross-border e-commerce logistics systems.
Third, the framework assumes that alliance members provide accurate and unbiased information regarding their contributions, including resource inputs, service capacities, and exposure to operational risks. In practice, however, some members may unintentionally or strategically misreport such information—for instance, by emphasizing their pivotal roles or underestimating costs—to improve their perceived importance in allocation outcomes. These reporting deviations may affect the fairness and credibility of P-MOLP results. To address this issue, future research should consider incorporating incentive-compatible mechanisms that align reported contributions with verifiable performance indicators (e.g., order-fulfillment efficiency or cost-reduction rates) and draw on mechanism design theory to promote truthful reporting as the equilibrium behavior among participants.
Fourth, the framework does not explicitly account for transaction costs incurred during implementation, such as those associated with organizing expert panels for GDM evaluation, negotiating cooperation priorities and incentive schemes, or monitoring compliance with allocation results. These administrative and coordination costs can be non-negligible—especially in cross-border contexts characterized by regulatory diversity, cultural distance, and geographical dispersion. Future studies could quantify such costs empirically (e.g., through surveys of cross-border logistics alliances) and incorporate them into the optimization process, either as penalty components within the objective function or as constraints on the feasible allocation budget.
Collectively, addressing these limitations would enhance the robustness of the framework and broaden its applicability to dynamic, information-asymmetric, and transaction-cost-sensitive alliance environments. By integrating mechanisms that discourage strategic manipulation, incorporating dynamic coalition evolution, and accounting for transaction costs, future extensions of the P-MOLP framework can more faithfully capture the behavioral and institutional complexities of cross-border e-commerce logistics alliances, thereby reinforcing its theoretical rigor and managerial relevance.
8.3. Conclusions

A scientific and reasonable profit-allocation mechanism is essential for the long-term stability of cross-border e-commerce logistics supply chain alliances and for achieving planned performance targets. From a cooperation-first perspective, this study first evaluates the importance of all feasible coalition structures and then embeds multi-level cooperation priorities into a linear-programming framework. The proposed Priority-Based Multiobjective Linear Programming (P-MOLP) model jointly accounts for member contributions and coalition priorities, and yields allocation schemes that are both fair and implementable while preserving the priority order. Comparative results against Shapley, weighted-Shapley, and least-core allocations show that the proposed model has a wider scope of applicability, produces more reasonable allocations, and offers clear practical value—thus providing decision support for designing profit-allocation mechanisms in cross-border e-commerce logistics alliances.

Author Contributions

M.Z.: Writing—original draft, Supervision, Software, Resources, Methodology, Funding acquisition, Data curation, Conceptualization. P.J.: Supervision, Software, Methodology, Investigation, Funding acquisition, Data curation, Conceptualization. Y.Z.: Writing—Software, Methodology, Investigation. All authors have read and agreed to the published version of the manuscript.

Funding

This work was supported by the 111 Project of China under Grant (Grant number B20082), National High-end Foreign Experts Recruitment Plan of China (Grant number G2023193005L), and China Scholarship Council (Grant number CXXM2309210057).

Institutional Review Board Statement

Not applicable.

Informed Consent Statement

Not applicable.

Data Availability Statement

The original materials provided in this study are included in the article, and further inquiries can be made to the respective authors.

Conflicts of Interest

The authors declare no conflicts of interest.

Appendix A. Theoretical Properties of the P-MOLP Model (With Proofs)

Proposition 1 
(Feasibility). The P-MOLP model always admits a feasible solution.
Proof. 
Assign each member j its stand-alone profit, i.e., set the allocation X j   = V { j } . For any coalition H s e we can write the coalition-value matching constraint with nonnegative deviation variables σ H s e + , σ H s e so that
j H s e X j σ H s e + + σ H s e = V H s e , H s e H s
If the coalition structure is superadditive (synergies, resource complementarity), then V H s e j H s e V ( { j } ) ; take σ H s e + 0 , σ H s e = 0 . If it is non-superadditive (conflicts or diminishing returns), then V H s e j H s e V ( { j } ) ; take σ H s e 0 , σ H s e + = 0 . Together with the remaining nonnegativity and priority constraints (e.g., setting auxiliary slack variables to zero), all constraints are satisfied. Hence, the feasible region is nonempty. □
Proposition 2 
(Existence of an optimum). If all parameters are real and the LP constraints define a closed and bounded feasible region, then P-MOLP has an optimal solution.
Proof. 
P-MOLP is a linear program in continuous nonnegative variables. By LP theory, a nonempty feasible region and an objective with a finite lower bound imply the existence of an optimum. □
By Prop. 1, the feasible region is nonempty; all objective terms are nonnegative, so Z 0 . Therefore, an optimal solution exists.
Proposition 3 
(Individual rationality). In any P-MOLP optimum, every member j receives at least its stand-alone profit:  X j V ( { j } ) .
Proof. 
The constraint X j V ( { j } ) is explicitly included in the model; hence, it holds at optimum. □
Proposition 4 
(Efficiency). P-MOLP allocation is Pareto-efficient in the sense that  j X j = V ( N ) .
Proof. 
The model sets j X j = V ( N ) directly via an equality constraint; the allocation exhausts the grand-coalition value with neither waste nor deficit. □
Proposition 5 
(Priority-order preservation). Suppose members are ordered by their comprehensive contribution weights  w 1 w 2 w n . If the ordered decision variables satisfy the model’s priority-control constraints, then the resulting allocation preserves that order (higher-priority members do not receive smaller incremental gains than lower-priority ones).
Proof. 
The priority-control constraints in P-MOLP enforce monotone improvements across the ordered members (higher-weight members cannot be “overtaken” by lower-weight ones in marginal adjustments). Thus, the allocation respects the given priority order. □
Proposition 6 
(ε-core proximity and stability). In cooperative game theory, the core consists of allocations  X = ( X 1 , , X n )  such that for every coalition  H s e N , 
j n X j V H s e ,   j N X j = V N   ( core )
Because the core can be empty (e.g., under complex or restricted coalition structures), we use an ε-core relaxation:
j n X j V H s e ε ,   j N X j = V N   ( ε - core )
Let coalitions be grouped and ordered by priority levels  S = 1 , , S max , and let the P-MOLP model introduce nonnegative deviation variables  σ H s e + 0  and  σ H s e 0  for each coalition  H s e  within level  S , with the coalition-wise balance constraint.
j H s e X j σ H s e + + σ H s e = V H s e
Define the worst negative deviation
ε = max 1 S S max , 1 e H S σ H s e
Then there exists an optimal P-MOLP allocation  X  that belongs to the ε-core, i.e.,  X  satisfies (ε-core).
Proof. 
In the P-MOLP model, for each priority S , the coalition H s e N within the ranking satisfies the following constraint: j H s e X j σ H s e + + σ H s e = V H s e , by rearrangement, we obtain: j H s e X j = V H s e + σ H s e + σ H s e , since σ H s e + 0 , it follows that: j H s e X j V H s e σ H s e , where the last inequality uses the definition ε = max 1 S S max , 1 e H S σ H s e that σ H s e ε for all H s e . Evaluating at an optimal P-MOLP solution X yields j n X j V H s e ε , for all H s e . The P-MOLP model also enforces the group-efficiency (budget-balance) baseline j N X j = V N , hence j N X j = V N . Combining this with group-efficiency shows that X satisfies (ε-core), Thus, the proposition is proved. □
In particular, when all negative deviations converge to zero (i.e., σ H s e = 0 ), the solution of P-MOLP will converge to the traditional core, i.e., X * core. Therefore, the P-MOLP model not only extends the applicability of traditional core solutions (enabling the provision of approximate stable solutions even when the core may be empty) but also supports multi-priority structure control and deviation adjustment, enhancing the interpretability and flexibility of cooperative game solutions.

Appendix B. Shapley and IAHP-Shapley Value Calculation Procedure

Shapley Value Calculation for the Four-Member Coalition
This section provides a step-by-step computation of the Shapley values for a four-member coalition based on the coalition payoffs presented in Table 2. The Shapley value for each member i is calculated using the following formula:
ϕ j ( V ) = T N \ j | T | ! ( n | T | 1 ) ! n ! V ( T j ) V ( T )
where N = 1 , 2 , 3 , 4 is the set of members, and T N \ j denotes any coalition not containing j . For the case of four members, the weights are distributed as follows: for T = 0 and T = 3 , the weight is 1/4; for T = 1 and T = 2 , the weight is 1/12.
ϕ j = 1 4 ! T N \ { j } | T | ! ( 4 | T | 1 ) ! [ V ( T { j } ) V ( T ) ]
  • Coalition Payoffs (based on Table 2)
  • Step-by-Step Calculation
    • Member M 1 : ϕ 1 = ¼(36) + 112(50 + 44 + 47 + 43 + 44 + 42) + ¼(56) = 45.5
    • Member M 2 : ϕ 2 = ¼(14) + 112(28 + 22 + 27 + 21 + 24 + 20) + ¼(34) ≈ 23.83
    • Member M 3 : ϕ 3 = ¼(13) + 112(21 + 21 + 19 + 14 + 14 + 12) + ¼(24) ≈ 17.67
    • Member M 4 : ϕ 4 = ¼(29) + 112(40 + 42 + 35 + 36 + 33 + 33) + ¼(46) = 37.0
  • Final Results
The computed Shapley values are summarized as follows:
ϕ = ( M 1 , M 2 , M 3 , M 4 ) = (45.5, 23.83, 17.67, 37.0)
These values satisfy the budget balance condition, as their sum equals the total coalition value: 45.5 + 23.83 + 17.67 + 37.0 = 124 = V N .
IAHP-Shapley Value Calculation for the Four-Member Coalition
This section presents the computation procedure of IAHP-Shapley values based on the adjusted Shapley shares. The process involves normalization, offset correction, addition with pre-specified weights, and final scaling by the total payoff value ( V N = 124).
  • Initial Data and Basic Proportion
The original Shapley values are given as follows:
M 1 = 45.5, M 2 = 23.83, M 3 = 17.67, M 4 = 37.
Total payoff: 45.5 + 23.83 + 17.67 + 37 = 124.
Each member’s proportion (rounded to one decimal place):
  • M 1 : 45.5/124 × 100% ≈ 36.7%
  • M 2 : 23.83/124 × 100% ≈ 19.2%
  • M 3 : 17.67/124 × 100% ≈ 14.3%
  • M 4 : 37/124 × 100% ≈ 29.8%
2.
Proportion Adjustment ( 1 n , Subtracting 25 Percentage Points)
  • 36.7% − 25% = 11.7%
  • 19.2% − 25% = −5.8%
  • 14.3% − 25% = −10.7%
  • 29.8% − 25% = 4.8%
3.
Combination with Prespecified Weights
The adjusted proportions are converted to decimals and combined with the given weight vector W I A H P 1 = (0.37660, 0.10099, 0.13410, 0.38829). as follows:
Converted decimal values:
  • 11.7% = 0.117
  • −5.8% = −0.058
  • −10.7% = −0.107
  • 4.8% = 0.048
After combination:
  • 0.117 + 0.37660 = 0.4936
  • −0.058 + 0.10099 = 0.04299
  • −0.107 + 0.13410 = 0.0271
  • 0.048 + 0.38829 = 0.43629
4.
Final Scaling by the Total Payoff
Each combined value is multiplied by the total payoff 124 (rounded to two decimal places):
  • 0.4936 × 124 ≈ 61.21
  • 0.04299 × 124 ≈ 5.33
  • 0.0271 × 124 ≈ 3.36
  • 0.43629 × 124 ≈ 54.10
Final IAHP-Shapley ( W I A H P 1 ) results (rounded to two decimals): (61.21, 5.33, 3.36, 54.10).
Similarly, the GDM-IAHP-Shapley results (rounded to two decimals): (63.88, 5.44, 2.88, 51.80).
Although the GDM-based version mitigates single-expert bias and better reflects collective evaluation, both variants violate the individual rationality (IR) condition: members M 2 and M 3 receive less than their stand-alone payoffs. This indicates that IAHP-Shapley-type methods, while theoretically fair in weight integration, may still allocate insufficient rewards to weaker members when subjective weighting dominates, thus failing to ensure IR in practice.

References

  1. China E-Business Research Center (ECRC). 2023 China Cross-Border E-Commerce Market Data Report; ECRC: Hangzhou, China, 2024; Available online: https://www.100ec.cn/detail--6638736.html (accessed on 15 February 2025).
  2. Wang, X.; Xie, J.; Fan, Z.P. B2C cross-border E-commerce logistics mode selection considering product returns. Int. J. Prod. Res. 2021, 59, 3841–3860. [Google Scholar] [CrossRef]
  3. Hua, L.; Wu, Y. Strategic analysis of vertical integration in cross-border e-commerce logistics service supply chains. Transp. Res. Part E Logist. Transp. Rev. 2024, 188, 103626. [Google Scholar] [CrossRef]
  4. Mamédio, D.; Rocha, C.; Szczepanik, D.; Kato, H. Strategic alliances and dynamic capabilities: A systematic review. J. Strategy Manag. 2019, 12, 83–102. [Google Scholar] [CrossRef]
  5. Chen, S.; He, Q.; Xiao, H. A study on cross-border e-commerce partner selection in B2B mode. Electron. Commer. Res. 2022, 22, 1–21. [Google Scholar] [CrossRef]
  6. Martin, N.; Verdonck, L.; Caris, A.; Depaire, B. Horizontal collaboration in logistics: Decision framework and typology. Oper. Manag. Res. 2018, 11, 32–50. [Google Scholar] [CrossRef]
  7. Dai, P.; Xu, J.; Li, W. Research on profit distribution of logistics alliance considering communication structure and task completion quality. Processes 2022, 10, 1139. [Google Scholar] [CrossRef]
  8. Zha, X.; Zhang, X.; Liu, Y.; Dan, B. Bonded-warehouse or direct-mail? Logistics mode choice in a cross-border e-commerce supply chain with platform information sharing. Electron. Commer. Res. Appl. 2022, 54, 101181. [Google Scholar] [CrossRef]
  9. Liu, Z.; Li, Z. A blockchain-based framework of cross-border e-commerce supply chain. Int. J. Inf. Manag. 2020, 52, 102059. [Google Scholar] [CrossRef]
  10. Xie, S.; Yin, B. Risk prediction and strategic breakout of cross-border e-commerce logistics supply chain alliance under China–US trade friction. China Bus. Mark. 2019, 33, 73–82. [Google Scholar]
  11. Vaez-Alaei, M.; Deniaud, I.; Marmier, F.; Gourc, D.; Cowan, R. A partner selection framework for strategic alliances based on project complexity and partner’s past experience. Enterp. Inf. Syst. 2022, 16, 1889038. [Google Scholar] [CrossRef]
  12. Wang, X.; Zhang, P.; Sun, H. Benefit allocation scheme of supply chain alliance based on resource input. Stat. Decis. 2018, 34, 55–59. [Google Scholar]
  13. Yu, J.; Zhang, N.; Lin, H. Profit allocation of e-commerce logistics enterprise alliances based on a modified Shapley value. Mod. Manag. 2018, 38, 44–48. [Google Scholar]
  14. Li, X.; Zhao, R. Optimization of cross-border e-commerce logistics chain from a supply chain perspective. Commer. Res. 2019, 76–79. [Google Scholar]
  15. Zheng, X.X.; Li, D.F.; Liu, Z.; Jia, F.; Sheu, J.-B. Coordinating a closed-loop supply chain with fairness concerns through variable-weighted Shapley values. Transp. Res. Part E Logist. Transp. Rev. 2019, 126, 227–253. [Google Scholar] [CrossRef]
  16. Yan, W.; Zhou, H.; Li, H. Decision and coordination of cross-border e-commerce supply chain: Based on four modes of cooperation. Sci. Program. 2021, 2021, 1–15. [Google Scholar] [CrossRef]
  17. Wan, X.; Yang, D.; Teng, Z. Blockchain digital technology empowers e-commerce supply chain sustainable value co-creation decision and coordination considering online consumer reviews. Appl. Soft Comput. 2022, 130, 109662. [Google Scholar] [CrossRef]
  18. Mou, J.; Wang, S. Optimization decisions for value-added logistics services in cross-border e-commerce supply chains. J. Manag. Sci. China 2025. online first. [Google Scholar]
  19. Zhu, L.; Liu, N. Game theoretic analysis of logistics service coordination in a live-streaming e-commerce system. Electron. Commer. Res. 2023, 23, 1049–1087. [Google Scholar] [CrossRef]
  20. Meng, F.; Li, Z.; Dong, Q.; Fu, L.; Zhang, Y. Profit allocation on a four-echelon supply chain in perspective of cooperative games on augmenting systems. Expert Syst. Appl. 2023, 219, 119639. [Google Scholar] [CrossRef]
  21. Wang, C.; Chen, J.; Yu, X. Research on benefit allocation based on multi-weight H-Shapley value: A case study of express logistics sharing. PLoS ONE 2024, 19, e0305656. [Google Scholar] [CrossRef]
  22. Dai, B.; Xiao, T.; Liu, Y.; Li, F. A profit allocation mechanism for multiple-channels order fulfillment system of an e-retailers alliance. SAGE Open 2024, 14, 21582440241300781. [Google Scholar] [CrossRef]
  23. Zhang, S.; Hu, W.; Cao, X.; Du, J.; Bai, C.; Liu, W.; Tang, M.; Zhan, W.; Chen, Z. Low-carbon economic dispatch strategy for interconnected multi-energy microgrids considering carbon emission accounting and profit allocation. Sustain. Cities Soc. 2023, 99, 104987. [Google Scholar] [CrossRef]
  24. Liu, W.; Huang, M.; Feng, W. Optimized profit allocation model for service alliance transactions considering risk. Electronics 2024, 13, 4648. [Google Scholar] [CrossRef]
  25. Saygın, E.; Tekin, S.; Kuyzu, G. Fair cost allocation for collaborative hub networks. Oper. Res. 2025, 25, 55. [Google Scholar] [CrossRef]
  26. Ni, S.; Feng, C.; Gou, H. Nash-bargaining fairness concerns under push and pull supply chains. Mathematics 2023, 11, 4719. [Google Scholar] [CrossRef]
  27. Marousi, A.; Thyagarajan, K.; Pinto, J.M.; Papageorgiou, L.G.; Charitopoulos, V.M. Game-theoretic optimisation of supply chain design with customer contracts: The case of industrial gases market. Comput. Chem. Eng. 2024, 184, 108625. [Google Scholar] [CrossRef]
  28. Yang, Z.; Liu, S. Fairness-oriented multi-objective optimization of supply chain planning under uncertainties. Socio-Econ. Plan. Sci. 2025, 99, 102198. [Google Scholar] [CrossRef]
  29. Amin-Tahmasbi, H.; Sadafi, S.; Ekren, B.Y.; Kumar, V. A multi-objective integrated optimisation model for facility location and order allocation problem in a two-level supply chain network. Ann. Oper. Res. 2023, 324, 993–1022. [Google Scholar] [CrossRef]
  30. Masruroh, N.A.; Rifai, A.P.; Mulyani, Y.P.; Ananta, V.S.; Luthfiansyah, M.F.; Winati, F.D. Priority-based multi-objective algorithms for green supply chain network design with disruption consideration. Prod. Eng. 2024, 18, 117–140. [Google Scholar] [CrossRef]
  31. Wang, J.; Zhu, W. Analyzing the development of competition and cooperation among ocean carriers considering the impact of carbon tax policy. Transp. Res. Part E Logist. Transp. Rev. 2023, 175, 103157. [Google Scholar] [CrossRef]
  32. Ding, X.; Jian, S. Revenue sharing and resource allocation for cooperative multimodal transport systems. Transp. Res. Part C Emerg. Technol. 2024, 164, 104666. [Google Scholar] [CrossRef]
  33. Asghari, T.; Taleizadeh, A.A.; Jolai, F.; Moshtagh, M.S. Cooperative game for coordination of a green closed-loop supply chain. J. Clean. Prod. 2022, 363, 132371. [Google Scholar] [CrossRef]
  34. Hu, S. How should benefits be distributed in social cooperation? Beyond the Shapley value: A “clan solution” of cooperative games. Manag. World 2018, 34, 83–93. [Google Scholar]
  35. Teng, S. Route planning method for cross-border e-commerce logistics of agricultural products based on recurrent neural network. Soft Comput. 2021, 25, 12107–12116. [Google Scholar] [CrossRef]
  36. Saaty, T.L.; Vargas, L.G. Uncertainty and rank order in the analytic hierarchy process. Eur. J. Oper. Res. 1987, 32, 107–117. [Google Scholar] [CrossRef]
  37. Yang, Y.; Lyu, L.; Yang, Q.; Liu, Y.; An, W. Trust-based consensus reaching process for product design decision-making with heterogeneous information. Adv. Eng. Inform. 2023, 56, 101934. [Google Scholar] [CrossRef]
  38. Pfeffer, J.; Salancik, G.R. The External Control of Organizations: A Resource Dependence Perspective; Harper & Row: New York, NY, USA, 1978. [Google Scholar]
  39. Shapley, L.S. A value for n-person games. In Contributions to the Theory of Games II; Kuhn, H.W., Tucker, A.W., Eds.; Annals of Mathematics Studies 28; Princeton University Press: Princeton, NJ, USA, 1953; pp. 307–317. [Google Scholar]
  40. Shokouhyar, S.; Maghsoudi, M.; Khanizadeh, S.; Jorfi, S. Analyzing supply chain technology trends through network analysis and clustering techniques: A patent-based study. Ann. Oper. Res. 2024, 341, 313–348. [Google Scholar] [CrossRef]
  41. Daie, P.; Li, S. Hierarchical clustering for structuring supply chain network in case of product variety. J. Manuf. Syst. 2016, 38, 77–86. [Google Scholar] [CrossRef]
  42. Wang, L.; Du, Y.; Peng, X.; Cao, K. Application of clustering method in preliminary selection of supply chain alliance partners. J. Intell. 2005, 26–28. [Google Scholar]
  43. Zhang, X.; Wang, D. Clustering analysis of supply chain members based on trust indicator attribute values. Stat. Decis. 2011, 62–64. [Google Scholar]
  44. Zhang, X.; Zha, X.; Dan, B.; Liu, Y.; Sui, R. Logistics mode selection and information sharing in a cross-border e-commerce supply chain with competition. Eur. J. Oper. Res. 2024, 314, 136–151. [Google Scholar] [CrossRef]
  45. Zhang, Y. A reasonable sharing mechanism for mineral resource development benefits: Analysis based on a modified Shapley value. Resour. Sci. 2018, 40, 645–653. [Google Scholar]
  46. Ma, X.; Yu, S.; Zhu, S.; Wang, G. Profit allocation of virtual power plants based on a multi-factor improved Shapley value. Proc. CSEE 2020, 35, 585–595. [Google Scholar]
  47. Fang, F.; Yu, S.; Liu, M. An improved Shapley value-based profit allocation method for CHP-VPP. Energy 2020, 213, 118805. [Google Scholar] [CrossRef]
  48. Liu, X.; Wang, X.; Guo, H.; An, X. Benefit allocation in shared water-saving management contract projects based on modified expected Shapley value. Water Resour. Manag. 2021, 35, 39–62. [Google Scholar] [CrossRef]
  49. Wang, Y.; Zhao, Z.; Baležentis, T. Benefit distribution in shared private charging pile projects based on modified Shapley value. Energy 2023, 263, 125720. [Google Scholar] [CrossRef]
Figure 1. Method Framework: P-MOLP. Source: Authors’ own work.
Information 16 01002 g001
Figure 2. Composite figure of expert clustering: dendrogram and expert–feature heatmap. Notes: The colors in the heatmap represent the contribution-weight values of each feature, with red indicating higher values and blue indicating lower values. The vertical dotted line in the dendrogram denotes the threshold t used to determine the expert groups. Source: Authors’ own work.
Information 16 01002 g002
Figure 3. Hierarchical clustering of alliance cooperation-structure importance. Notes: Different branch colors represent distinct cooperation-structure clusters. The vertical dotted lines indicate the similarity thresholds used for grouping. The color bar on the right represents the importance level of each cooperation structure, with green indicating higher importance and red indicating lower importance. Source: Authors’ own work.
Information 16 01002 g003
Figure 4. Trend of members’ contribution level with revenue increments. Source: Authors’ own work.
Information 16 01002 g004
Figure 5. Comparison of positive-deviation changes across coalition structures before and after introducing priority weights. Source: Authors’ own work. Notes: The dashed and solid lines indicate the positive-deviation trajectories without and with priority weights, respectively. The arrows mark the direction and magnitude of changes in the positive deviation σ + for each coalition structure.
Information 16 01002 g005
Figure 6. Comparison of comprehensive contribution evaluation results of alliance members under the single-expert and multi-expert GDM methods. Source: Authors’ own work. Notes: The upward and downward arrows indicate the direction of change in each member’s contribution value when moving from the single-expert method to the GDM method.
Information 16 01002 g006
Figure 7. IAHP-Shapley vs. P-MOLP—allocated payoffs in the alliance compared with stand-alone profits. Source: Authors’ own work. Notes: The red markers (lines and arrows) highlight cases where the allocated payoff is below the stand-alone profit, indicating violations of the individual rationality (IR) constraint.
Information 16 01002 g007
Table 1. Comparison between this paper and previous literature.
LiteratureCGTMCAPCGDMF&SA:CBA
Wang et al. (2024) [21]
Liu et al. (2024) [24]
Saygin et al. (2025) [25]
Yan et al. (2021) [16]
Mou et al. (2024) [18]
Dai et al. (2024) [22]
Zhang et al. (2023) [23]
Masruroh et al. (2024) [30]
Yang and Liu (2025) [28]
Meng et al. (2023) [20]
This paper
Notes: CGT = Cooperative Game Theory; MCA = Multi-Criteria Allocation; PC = Priority Control; GDM = Group decision-making; F&SA = Fairness and Stability Analysis; CBA = Cross-Border Applicability. “√” indicates the inclusion of each methodological element; this paper integrates all six dimensions. Source: Authors’ own work.
Table 2. Evaluation Index System for Profit Allocation in Cross-border E-commerce Logistics Supply Chain Alliances.
Target LevelCriterion LevelIndicator Level
C1
Overall contribution of the member enterprise to the alliance.
R1 Risk managementR11 Data and information security risk
R12 Exchange-rate fluctuation and foreign-exchange settlement risk
R13 Standards and process-specification mismatch risk
R14 Policy and regulatory compliance risk
R15 Cross-cultural communication and management risk
R2 Operational inputR21 Investment in cross-border information platforms
R22 Safeguard inputs for cross-border business operations
R23 Investment in logistics technologies and systems
R24 Investment in human and managerial resources
R25 Inputs for building collaboration mechanisms.
R3 Technological innovationR31 Digital foundation and platform capability
R32 Information collaboration and interface connectivity
R33 Logistics process and equipment technology level
R34 Depth of intelligent applications
R35 Green technology adoption
R4 Operations managementR41 Process standardization
R42 Execution consistency
R43 Process maturity
R44 Management system completeness
Source: Authors’ own work.
Table 3. Clustering outcomes and aggregated group weights under different threshold intervals.
Threshold ( t ) IntervalGrouping Structure ( W G D M A H P )   ( M 1 M 4 )
( t < 0.0185){1}, {2}, {3}, {4}, {5}, {6}(0.40698, 0.10300, 0.12970, 0.36045)
(0.0185–0.0284){1,2}, {3}, {4}, {5}, {6}(0.40050, 0.10264, 0.13146, 0.36550)
(0.0284–0.0289){1,2}, {3}, {4,6}, {5}(0.41057, 0.10382, 0.13060, 0.35516)
(0.0289–0.0426){1,2,3}, {4,6}, {5}(0.40209, 0.10531, 0.12946, 0.36325)
( t > 0.0426){1,2,3,5}, {4,6}(0.39820, 0.10189, 0.13021, 0.36977)
Source: Authors’ own work.
Table 4. Coalition Cooperation Payoffs.
CoalitionNet Payoff
M 1 36
M 2 14
M 3 13
M 4 29
M 1 M 2 64
M 1 M 3 57
M 1 M 4 76
M 2 M 3 35
M 2 M 4 56
M 3 M 4 48
M 1 M 2 M 3 78
M 1 M 2 M 4 100
M 1 M 3 M 4 90
M 2 M 3 M 4 68
M 1 M 2 M 3 M 4 124
Source: Authors’ own work.
Table 5. Importance of coalition structures.
Coalition H N Importance ( ω s e )
H 1 ( M 1 M 2 )0.5001
H 2 ( M 1 M 3 )0.5284
H 3 ( M 1 M 4 )0.7680
H 4 ( M 2 M 3 )0.2321
H 5 ( M 2 M 4 )0.4717
H 6 ( M 3 M 4 )0.5000
H 7 ( M 1 M 2 M 3 )0.6303
H 8 ( M 1 M 2 M 4 )0.8699
H 9 ( M 1 M 3 M 4 )0.8982
H 10 ( M 2 M 3 M 4 )0.6019
Source: Authors’ own work.
Table 6. Coalition Hierarchical Grouping by Threshold Intervals.
Threshold IntervalNumber of TiersGrouping Structure H N
(0 < t < 0.0296)6–8 tiersMost coalitions are independent
(0.0296–0.0735)5 tiers (stable zone){8,9}, {3}, {7,10}, {1,2,5,6}, {4}
(0.0735–0.1019)4 tiers{8,9,3}, {7,10}, {1,2,5,6}, {4}
(0.1019–0.1377)3 tiers{8,9,3}, {1,2,5,6,7,10}, {4}
(0.1377–0.2396)2 tiers{8,9,3,1,2,5,6,7,10}, {4}
Source: Authors’ own work.
Table 7. Structural Characteristics of Coalition Tiers by Threshold Intervals.
Threshold IntervalNumber of TiersStructural Characteristic
(0 < t < 0.0296)6–8Over-fragmented, weak inter-tier distinction
(0.0296–0.0735)5 (Stable range)Most stable and interpretable configuration
(0.0735–0.1019)4Middle-tier merging, decreased differentiation
(0.1019–0.1377)3Coarser hierarchy, blurred priority boundaries
(0.1377–0.2396)2Excessive merging, loss of tiered structure
Source: Authors’ own work.
Table 8. Member payoffs under different profit-allocation methods.
Allocation MethodOptimal Allocation
Shapley(45.5, 23.83, 17.67, 37.0)
IAHP-Shapley(61.21, 5.33, 3.36, 54.10)
Least-core(54.5, 21.5, 13.5, 34.5)
Ordinary goal programming model (MOLP)(46.97, 18.97, 21.03, 37.03)
P-MOLP(49.0, 16.0, 19.0, 40.0)
P-MOLP without priority weights(49.5, 16.5, 18.5, 39.5)
Notes: “Shapley” = classical Shapley allocation; “Least-Core” = refers to the allocation that minimizes the maximum excess among all coalitions; when the core is non-empty, the least-core coincides with the core; “P-MOLP” = priority-based multiobjective linear program. Payoffs are ( M 1 , M 2 , M 3 , M 4 ). Sources: IAHP–Shapley combines IAHP weighting (Saaty and Vargas, 1987 [36]; Yang et al., 2023 [37]) with Shapley-type variants (Yu et al., 2018 [13]; Zhang, 2018 [45]; Ma et al., 2020 [46]; Fang et al., 2020 [47]; Liu et al., 2021 [48]; Wang et al., 2023 [49]).
Disclaimer/Publisher’s Note: The statements, opinions and data contained in all publications are solely those of the individual author(s) and contributor(s) and not of MDPI and/or the editor(s). MDPI and/or the editor(s) disclaim responsibility for any injury to people or property resulting from any ideas, methods, instructions or products referred to in the content.