Systematic Review

Artificial Intelligence and Crime in Latin America: A Multilingual Bibliometric Review (2010–2025)

1
Facultad de Ingeniería y Arquitectura, Universidad Autónoma del Perú, Lima 150142, Peru
2
Facultad de Ingeniería, Universidad Tecnológica del Perú, Lima 150101, Peru
3
Escuela de Posgrado, Universidad Continental, Lima 15113, Peru
*
Author to whom correspondence should be addressed.
Information 2025, 16(11), 1001; https://doi.org/10.3390/info16111001
Submission received: 25 October 2025 / Revised: 14 November 2025 / Accepted: 15 November 2025 / Published: 18 November 2025

Abstract

Artificial intelligence is increasingly used to support public safety by predicting events, uncovering patterns, and informing decisions. In Latin America, where crime burdens are high and data systems are heterogeneous, a region-focused synthesis is needed to assess progress, identify gaps, and clarify operational implications. Accordingly, this PRISMA-guided, multilingual (English, Spanish, and Portuguese) bibliometric review synthesizes 146 peer-reviewed journal articles (2010–October 2025) to examine trends, methods, and application domains. Since 2018, publication output accelerated, peaking in 2024–2025. Regionally, Brazil leads within a multi-hub co-authorship network linking Latin American nodes to the United States and Spain; additional hubs include Colombia, Chile, Mexico, Ecuador, and Peru. Methodologically, three motifs dominate: temporal-dependence modeling; ensemble learners with cost-sensitive decision rules; and multimodal integration of remote sensing and computer vision with administrative data. At the application level, four families prevail: utility and fiscal-fraud analytics; environmental offenses with temporal modeling; cyber and platform-based analytics; and sensing, geospatial, and forensic workflows. However, evaluation practices are heterogeneous, with frequent risks of spatial or temporal leakage; moreover, reporting on fairness, accountability, and transparency is limited. In order to support responsible scaling, research directions include interoperable data governance, leakage-controlled and cost-sensitive evaluation, domain adaptation that accounts for spatial dependence, open and auditable benchmarks, and broader regional participation. To our knowledge, this review is one of the first multilingual, region-centered syntheses of artificial intelligence and crime in Latin America, and it establishes a reproducible baseline and an actionable evidence map that enable comparable, leakage-controlled evaluation and inform research, funding, and public safety policy in the region.

1. Introduction

Artificial intelligence (AI) has matured into a general-purpose analytical layer across scientific and policy domains. By combining statistical learning, optimization, and representation learning, AI systems extract structure from high-dimensional signals that include geospatial traces, administrative records, social media streams, transaction logs, audiovisual data, and remote sensing imagery [1,2,3,4,5]. These capabilities enable prediction, pattern discovery, and decision support at multiple scales, while also raising normative demands regarding fairness, accountability, transparency, and privacy. As data availability and computational infrastructures expand, AI becomes increasingly relevant for addressing complex public problems that require timely inference under uncertainty and resource constraints [6,7,8,9].
Crime and related social harms remain central public challenges in Latin America [10,11,12,13,14]. With less than 10% of the world population, Latin America and the Caribbean account for close to one third of global homicides, and regional homicide rates around the early 2010s stood at approximately 23–25 deaths per 100,000 inhabitants, nearly four times the global average of just over 6 per 100,000 [15,16]. Over the 2000–2019 period, age-standardized homicide mortality in the Americas increased by about 20%, reaching around 19 deaths per 100,000 population [17]. Several countries, including Mexico, Colombia, and Venezuela, have been repeatedly classified among the most violent globally [18,19], and substantial heterogeneity is observed across municipalities and departments [20]. Young men are disproportionately affected, both as victims and perpetrators [17,19].
The region experiences the confluence of rapid urbanization, spatial inequality, heterogeneous institutional capacity, and diverse forms of criminal activity, including common crime, organized crime, corruption, embezzlement, financial fraud, cyber-enabled offenses, and violence concentrated in persistent hotspots [21,22,23,24,25,26,27]. Data on these phenomena are often fragmented across agencies and formats, with uneven quality and limited interoperability [28,29,30,31]. In this context, AI emerges as a tool to support early warning, resource allocation, and situational awareness through crime mapping, spatio-temporal hotspot forecasting, risk estimation, anomaly detection, and network analysis [32,33,34,35]. When grounded in robust data governance and ethical safeguards, these approaches can complement prevention and investigation strategies [36,37,38,39]. However, deploying AI systems in contexts marked by institutional fragility, data limitations, and deep social inequalities raises critical questions about effectiveness, fairness, and accountability. Given the elevated levels of violence and the potential consequences of algorithmic decision-making for vulnerable populations, rigorous and transparent evidence on how AI is being applied to crime-related problems in Latin America is essential to inform policy, safeguard human rights, and ensure that technological interventions contribute to equitable and sustainable crime reduction.
Internationally, a growing empirical literature within artificial intelligence—particularly machine learning and data mining—addresses crime detection and prediction [40,41,42,43,44]. Computer vision pipelines extract signals from Closed-Circuit Television and aerial or satellite imagery; natural language processing systems mine social and news media for indicators of threat and sentiment; graph-based models represent criminal networks and illicit supply chains; and supervised models estimate risk at the level of place, time, and target using geospatial, demographic, and routine activity features [41,45,46,47,48]. Several studies have examined similar tasks within Latin American settings, for example, hotspot analysis in major metropolitan areas, social media monitoring for disorder, network structures in organized crime, and fraud detection in utilities and financial services [24,27,28,49,50,51,52,53]. Parallel to these applications, there are reviews that survey AI for crime analytics at the global scale. However, to date, there appears to be no review that focuses exclusively on Latin America.
Against this backdrop, prior reviews diverge from the regional and multilingual scope of the present review in two respects. First, they are predominantly global and technology-led: they foreground cybercrime, social media analytics, Internet of Things (IoT) pipelines, computer vision, and biometric surveillance, but rarely disaggregate findings for Latin America or systematically consider scholarship in Spanish and Portuguese [24,45,54,55,56,57,58,59]. They also devote limited attention to domains salient in the region, such as utility non-technical losses, integrity in public procurement, and environmental offenses. In contrast, the present review adopts an explicitly region-centered scope and maps these application families within Latin American contexts.
Second, existing syntheses exhibit methodological and coverage limitations. Systematic reviews and scientometric mappings frequently report heterogeneous and non-comparable metrics, apply limited controls for spatial or temporal leakage, and seldom include multi-city validation or transparent reporting on calibration, cost-sensitive evaluation, or bias auditing [24,57,60]. When not global in scope, coverage tends to favor North America, Europe, and Asia, with limited systematic attention to Latin American contexts [54,61]. Several surveys focus narrowly on spatial forecasting at neighborhood scale or on criminal justice tasks such as recidivism prediction, while others prioritize spatio-temporal taxonomies without engaging operational constraints; conceptual frameworks such as the GeoCrime Analytic Framework remain weakly connected to systematic empirical coverage; and broader overviews often stop at earlier cutoff years, leaving recent developments underexamined [54,60,61,62,63,64,65]. Case-based contributions in Latin America are frequently confined to single-city designs with narrow contextual variables and limited data governance or ethics reporting, which constrains external validity and operational uptake [66]. Adjacent bibliometric lines on financial crime and white-collar offenses reinforce reliance on global corpora and single-index coverage without a regional lens [67,68].
In sum, the literature remains largely global and technology-led, underrepresents domains salient to the region, and relies on heterogeneous evaluation practices with limited transparency and uneven geographic coverage. As a result, a systematic, multilingual, and method-aware map of artificial intelligence applications to crime and public safety in Latin America is still lacking.
Accordingly, this review characterizes the regional research landscape (2010 to October 2025) and derives directions for robust, auditable, context-sensitive deployment. Specifically, it (i) documents temporal evolution; (ii) identifies leading countries, institutions, and publication sources; (iii) analyzes highly cited studies and application families; (iv) maps international collaboration; and (v) reconstructs thematic structure through co-occurrence networks and a centrality-density map, foregrounding evaluation and external validity for operational uptake. It contributes a multilingual regional corpus from Scopus and Web of Science, along with a transparent bibliometric pipeline that removes query-inflated and generic descriptors, and combines descriptive indicators with community-detected network analyses. Additionally, it includes an integrated discussion of limitations, external validity, and policy implications, linking methods to regional data infrastructures and governance safeguards.
The paper proceeds as follows. Section 2 details the methodological protocol. Section 3 reports trends, geography, collaboration, institutions, publication sources, most cited studies, and thematic structure. Section 4 synthesizes findings, addresses external validity and operational considerations, and outlines policy implications. Section 5 concludes with implications and future research avenues.

2. Methodology

With the purpose of addressing the objectives of this review, a structured and replicable approach was designed in accordance with the PRISMA 2020 guidelines [69]. The methodological workflow comprised four main stages: database selection and search strategy design (Section 2.1), eligibility screening and inclusion/exclusion filtering (Section 2.2 and Section 2.3), keyword curation and normalization (Section 2.4), and bibliometric computation and visualization (Section 2.5). This systematic procedure ensured transparency, reproducibility, and thematic precision throughout the analysis.

2.1. Databases and Search Strategy

A structured search was conducted in Scopus (field: TITLE-ABS-KEY) and Web of Science (field: TS). The time frame for retrieval and analysis was from 2010 to October 2025. The same Boolean query was applied in both databases.
In order to comprehensively capture the intersection between artificial intelligence technologies, crime and public safety domains, and the Latin American regional context, the search equation was structured around three conceptual groups of terms:
  • Group 1: AI Technologies
    (“artificial intelligence” OR “intelligent system*” OR “AI system*” OR “machine learning” OR “supervised learning” OR “unsupervised learning” OR “reinforcement learning” OR “deep learning” OR “artificial neural network*” OR “ANN” OR “convolutional neural network*” OR “recurrent neural network*” OR “graph neural network*” OR “data mining” OR “pattern recognition” OR “computational intelligence”)
  • Group 2: Crime and Public Safety Domain
    (crime OR crimes OR criminal* OR offense* OR “criminal activity” OR “law enforcement” OR “crime prediction” OR “crime forecasting” OR “crime detection” OR “crime prevention” OR “predictive policing” OR “crime mapping” OR “crime hotspot*” OR “hotspot policing”)
  • Group 3: Geographical Scope: Latin America
    (“Latin America” OR “South America” OR “Central America” OR “Peru” OR Peruvi* OR “Chile” OR Chilean* OR “Mexico” OR Mexican* OR “Argentina” OR Argentin* OR “Ecuador” OR Ecuadorian* OR “Colombia” OR Colombian* OR “Bolivia” OR Bolivian* OR “Uruguay” OR Uruguayan* OR “Paraguay” OR Paraguayan* OR “Venezuela” OR Venezuel* OR “Brazil” OR Brasil* OR Brazilian* OR “Costa Rica” OR “El Salvador” OR “Guatemala” OR “Honduras” OR “Nicaragua” OR “Panama” OR “Cuba” OR “Dominican Republic” OR “Haiti”)
The searches were executed on 5 October 2025 in Scopus (TITLE-ABS-KEY) and Web of Science (TS) with no database-side filters (years, document types, languages); records were exported as Scopus CSV (full record & references) and Web of Science Plain Text (full record & references), and all post-export restrictions were applied in R/RStudio with bibliometrix/Biblioshiny (see Section 2.5). The exact copy-paste Boolean strings are provided in Appendix A. The final query combined the three groups as follows: Group 1 AND Group 2 AND Group 3. The search retrieved 344 records from Scopus and 80 from Web of Science (total = 424). After removing 66 duplicates, 358 unique records were entered into screening, as shown in Figure 1.

2.2. Eligibility Criteria

Criteria were defined a priori and applied uniformly:
  • Publication period. Only studies published between 2010 and October 2025 were considered. Fourteen records published before 2010 were excluded (1987:1; 1992:1; 1999:1; 2003:2; 2004:2; 2007:1; 2008:2; 2009:4).
  • Document type. Included: research articles, early access articles, and data articles. Excluded: conference papers (164), conference reviews (17), proceeding paper (1), reviews (3), and book chapters (9). The rationale for excluding conference papers and reviews was to ensure the analysis focused on peer-reviewed original research outputs representing stable contributions to the field.
  • Language. The corpus comprised English (115), Spanish (22), Portuguese (9), French (2), Chinese (1), and Italian (1). Only English, Spanish, and Portuguese records were retained; four items were excluded (Chinese: 1, French: 2, Italian: 1).

2.3. Screening and Selection Process

Of the 358 records, 14 were excluded by year, resulting in 344 records. Applying document-type criteria excluded 194, resulting in 150 articles (148 articles, 1 early access, 1 data article). All 150 were retrieved for full-text assessment. After language exclusions (4), the final sample comprised 146 articles (97.3%) included in the bibliometric analysis, as presented in Figure 1. The entire list of these documents is available in Supplementary File S1: Bibliographic dataset, provided as a CSV file.
Before applying year or document-type filters, the 358 deduplicated records entering screening had the following language distribution: English (309), Spanish (33), Portuguese (12), French (2), Italian (1), and Chinese (1). The a priori language rule—retain English, Spanish, and Portuguese—was applied during metadata curation, resulting in the removal of 4 records (French = 2, Italian = 1, Chinese = 1); accordingly, no language-based exclusions occurred at the title/abstract screening stage.

2.4. Keyword Curation and Exclusion

Before conducting keyword analyses, a targeted curation step was applied to remove: (i) terms already present in the search equation (which can inflate centrality and bias co-occurrence structures); (ii) generic academic or methodological terms that do not convey specific topical content; (iii) demographic descriptors that are not thematic foci; (iv) geographic scope labels already controlled by the query; and (v) highly generic contextual terms. Obvious duplicates, hyphenation variants, and typographical variants were also removed. The excluded terms are listed below, grouped by rationale.
  • AI/ML terms already captured by the search equation.
    artificial intelligence, artificial intelligence (ai), ai, intelligent system, intelligent systems, ai system, ai systems, machine learning, machine-learning, machine learning methods, supervised learning, unsupervised learning, reinforcement learning, deep learning, data mining, neural network, neural networks, artificial neural network, artificial neural networks, ann, cnn, rnn, gnn, pattern recognition, computational intelligence, algorithm, algorithms.
  • Crime and policing terms already captured by the search equation.
    crime, crimes, criminal, criminals, criminal activity, offense, offenses, law enforcement, crime prediction, crime forecasting, crime detection, crime prevention, predictive policing, crime mapping, crime hotspot, crime hotspots, hotspot policing, hotspot, hotspots, crime victims.
  • Generic academic/methodological terms (non-topical).
    article, articles, paper, study, studies, issue, review, reviews, approach, approaches, method, methods, methodology, model, models, analysis, performance, application, applications, dataset, datasets, classification (of information), design, procedures, data analysis, data collection, decision making, management, techniques, tools, statistics, statistical analysis, selection, resolution, trends, training, task, series, patterns, impact, research.
  • Demographic/population descriptors (non-thematic).
    human, humans, male, female, adolescent, adolescents, adult, adults, child, children, aged.
  • Geographic scope labels already controlled by the query.
    brazil, colombia, chile, mexico, peru, latin america, region.
  • Highly generic contextual terms (non-informative for thematic mapping).
    data, system, systems, support, technology, media, information, knowledge, environment, industry, internet, space, security.
  • Duplicates, hyphenation, and typographical variants (normalized/removed).
    Repeated or orthographic variants were consolidated or removed to avoid redundancy, e.g., machine-learning (duplicate of machine learning), repeated entries such as aged, region, application, applications, and system.
This curation step ensures that the subsequent keyword analyses focus on content-bearing terms, preventing artificial inflation by query terms and reducing noise from generic descriptors. The complete list above reflects exactly the items removed from the keyword pool prior to analysis.

2.5. Software Environment and Tools

All data handling and computations were performed in R (version 4.5.1) within RStudio (version 2025.09.1). Bibliometric processing used the bibliometrix package and its web interface Biblioshiny. Native import and merging utilities were used to consolidate exports from Scopus and Web of Science. The latter was followed by the removal of duplicates and filtering by year, document type, and language, as detailed above. Subsequent descriptive indicators and keyword-based analyses were computed within the same environment to ensure a reproducible workflow, and network community detection was performed using the Walktrap algorithm with Automatic layout.
All indicators were derived from the final corpus of 146 journal articles, following the curation and filtering steps detailed in this section.

3. Results

3.1. Scientific Production and Temporal Evolution

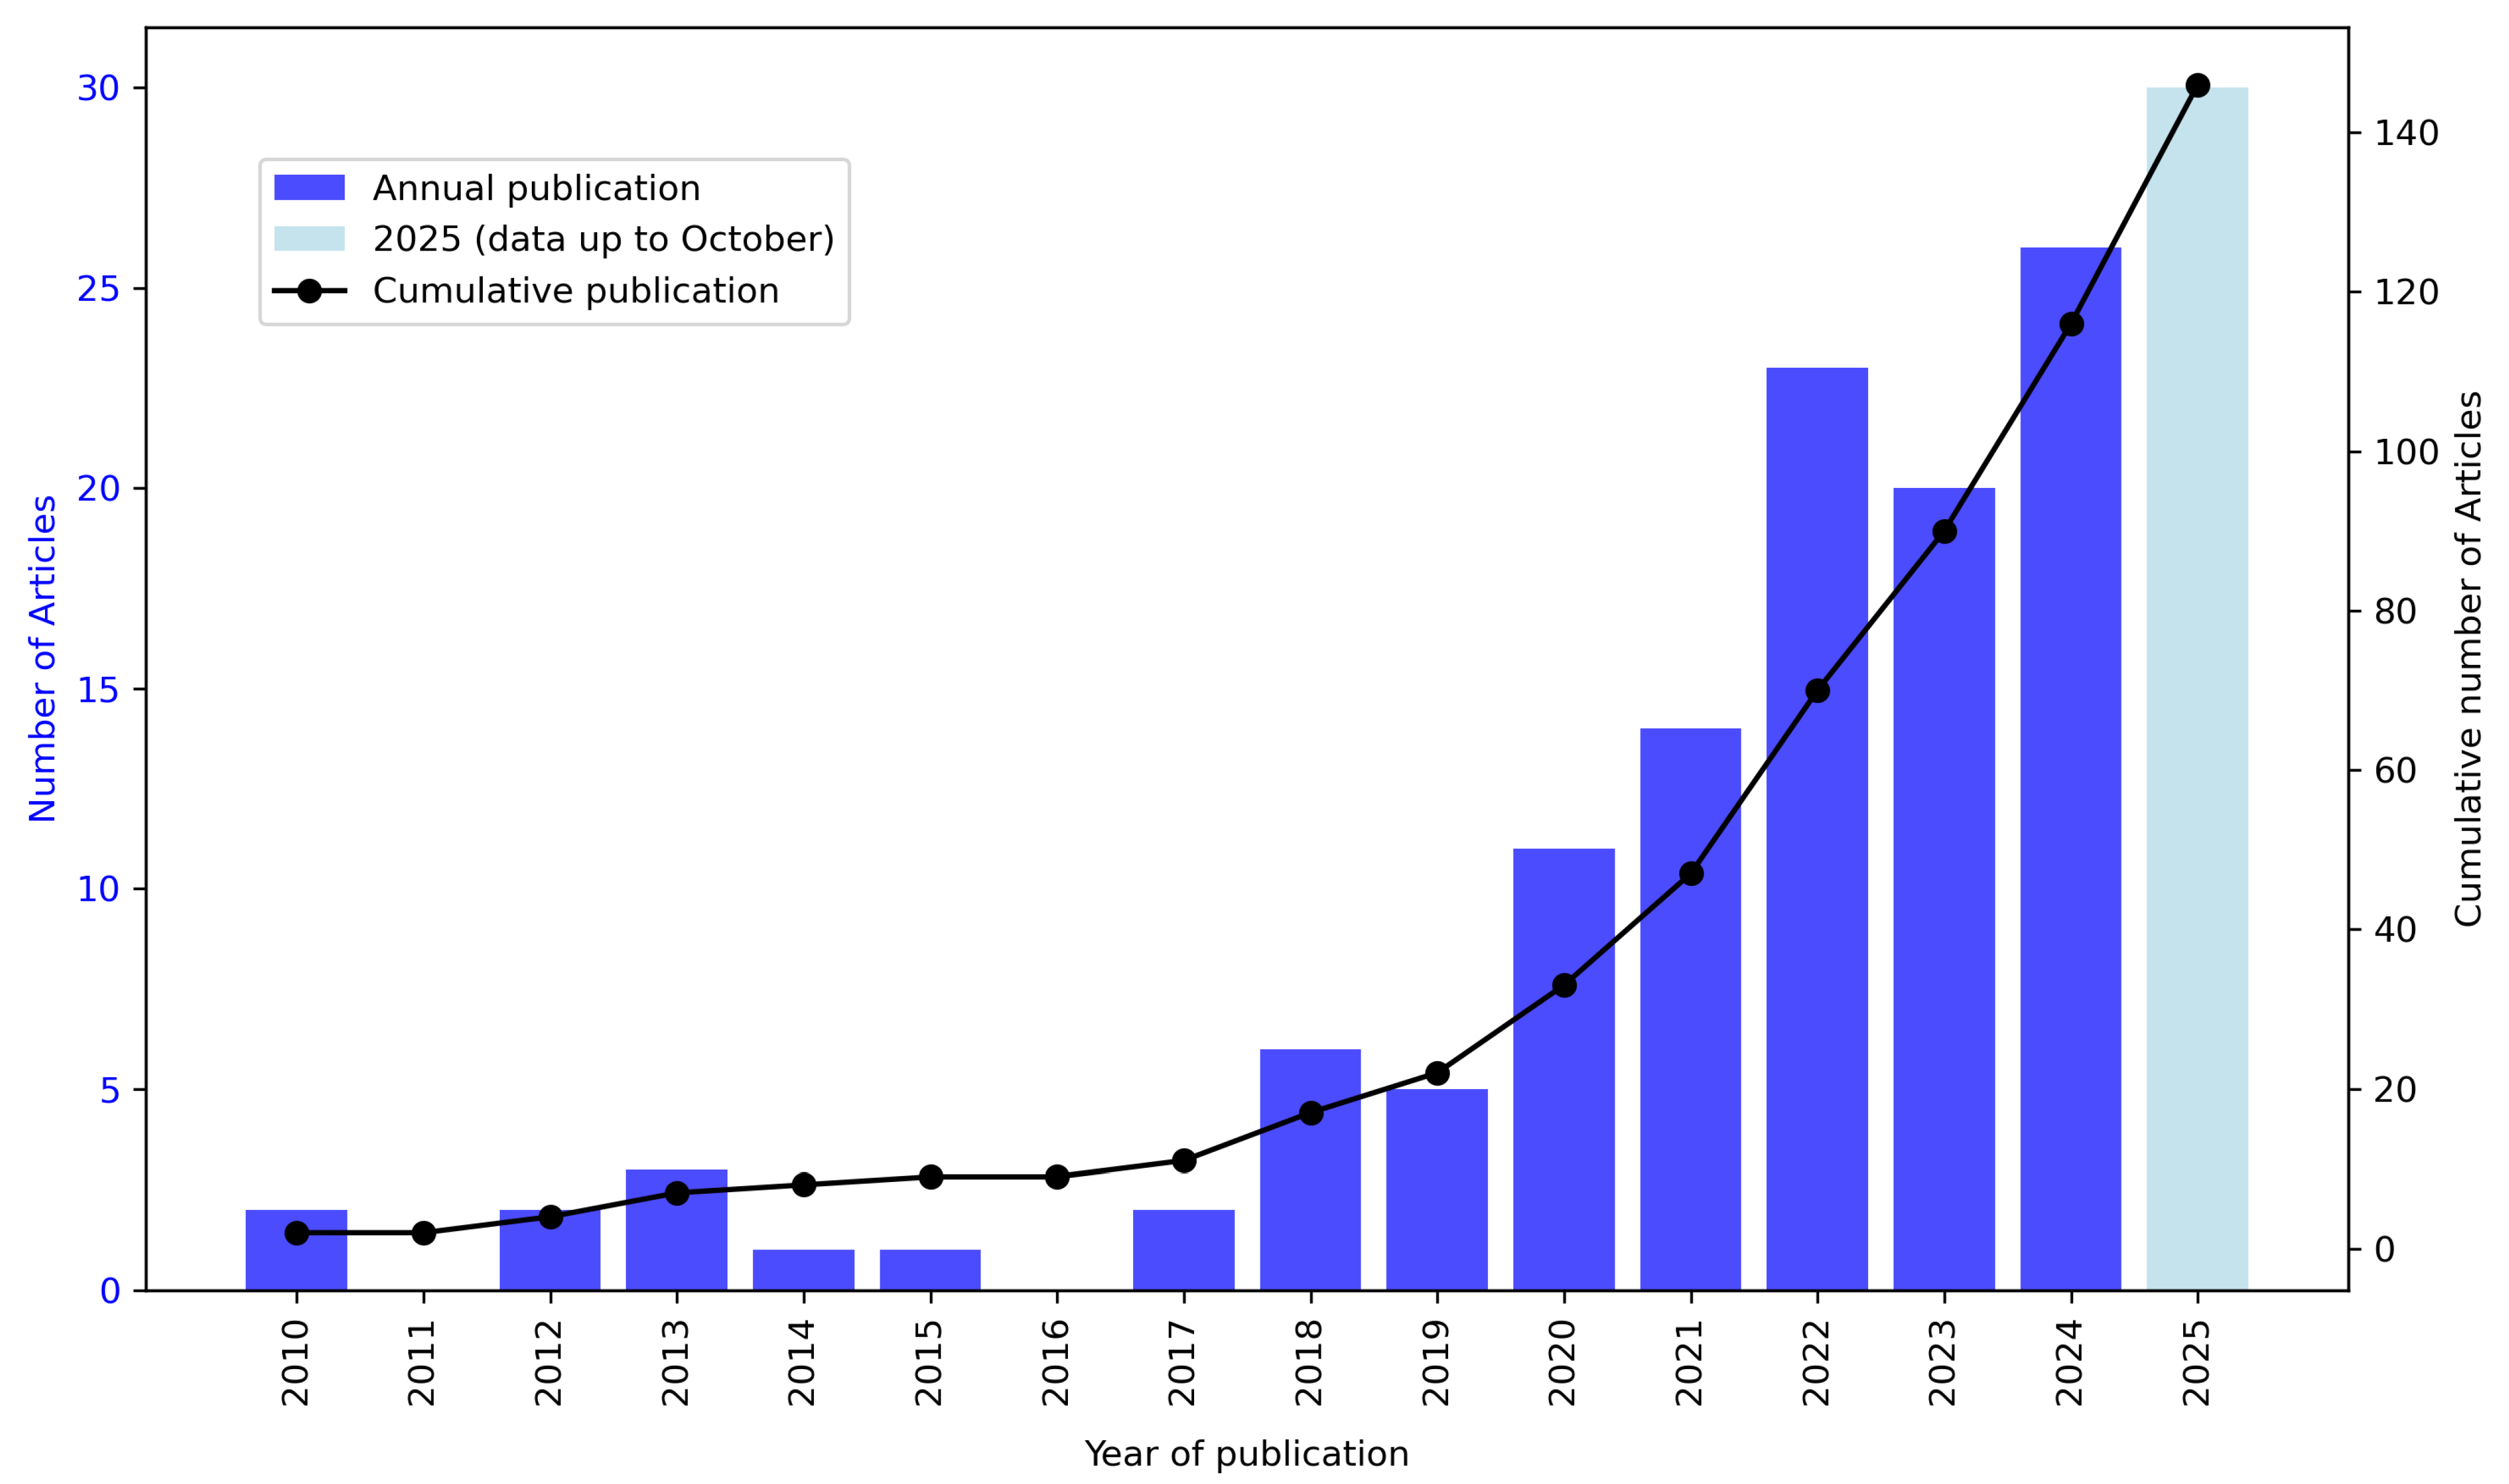
Figure 2 illustrates the annual and cumulative scientific production on artificial intelligence and crime in Latin America between 2010 and 5 October 2025. The trend of annual publication shows a gradual increase during the first half of the analyzed period, followed by a pronounced acceleration from 2018 onward.
Between 2010 and 2017, the yearly output remained relatively modest, fluctuating between 0 and 3 articles per year (2010: 2; 2011: 0; 2012: 2; 2013: 3; 2014: 1; 2015: 1; 2016: 0; 2017: 2). From 2018 to 2021, a progressive growth phase is observed, with the number of articles rising from 6 in 2018 to 14 in 2021. This upward trajectory continued through 2022 and 2023, which registered 23 and 20 publications, respectively, consolidating the visibility of the topic within the regional scientific landscape. The years 2024 and 2025 (up to October) reached the highest outputs, with 26 and 30 articles, respectively.
The cumulative curve confirms a sustained and almost exponential increase, reaching a total of 146 documents by October 2025. This trajectory indicates an expanding research interest over the past decade, particularly during the post-2020 period, when artificial intelligence methods became increasingly applied to criminal activity prediction, law enforcement analytics, and public safety domains in Latin American contexts.
The observed temporal pattern provides the foundation for the subsequent analysis of the geographical distribution of this production, which explores the regional and international contributions driving this growth.

3.2. Geographical Distribution of Research Output

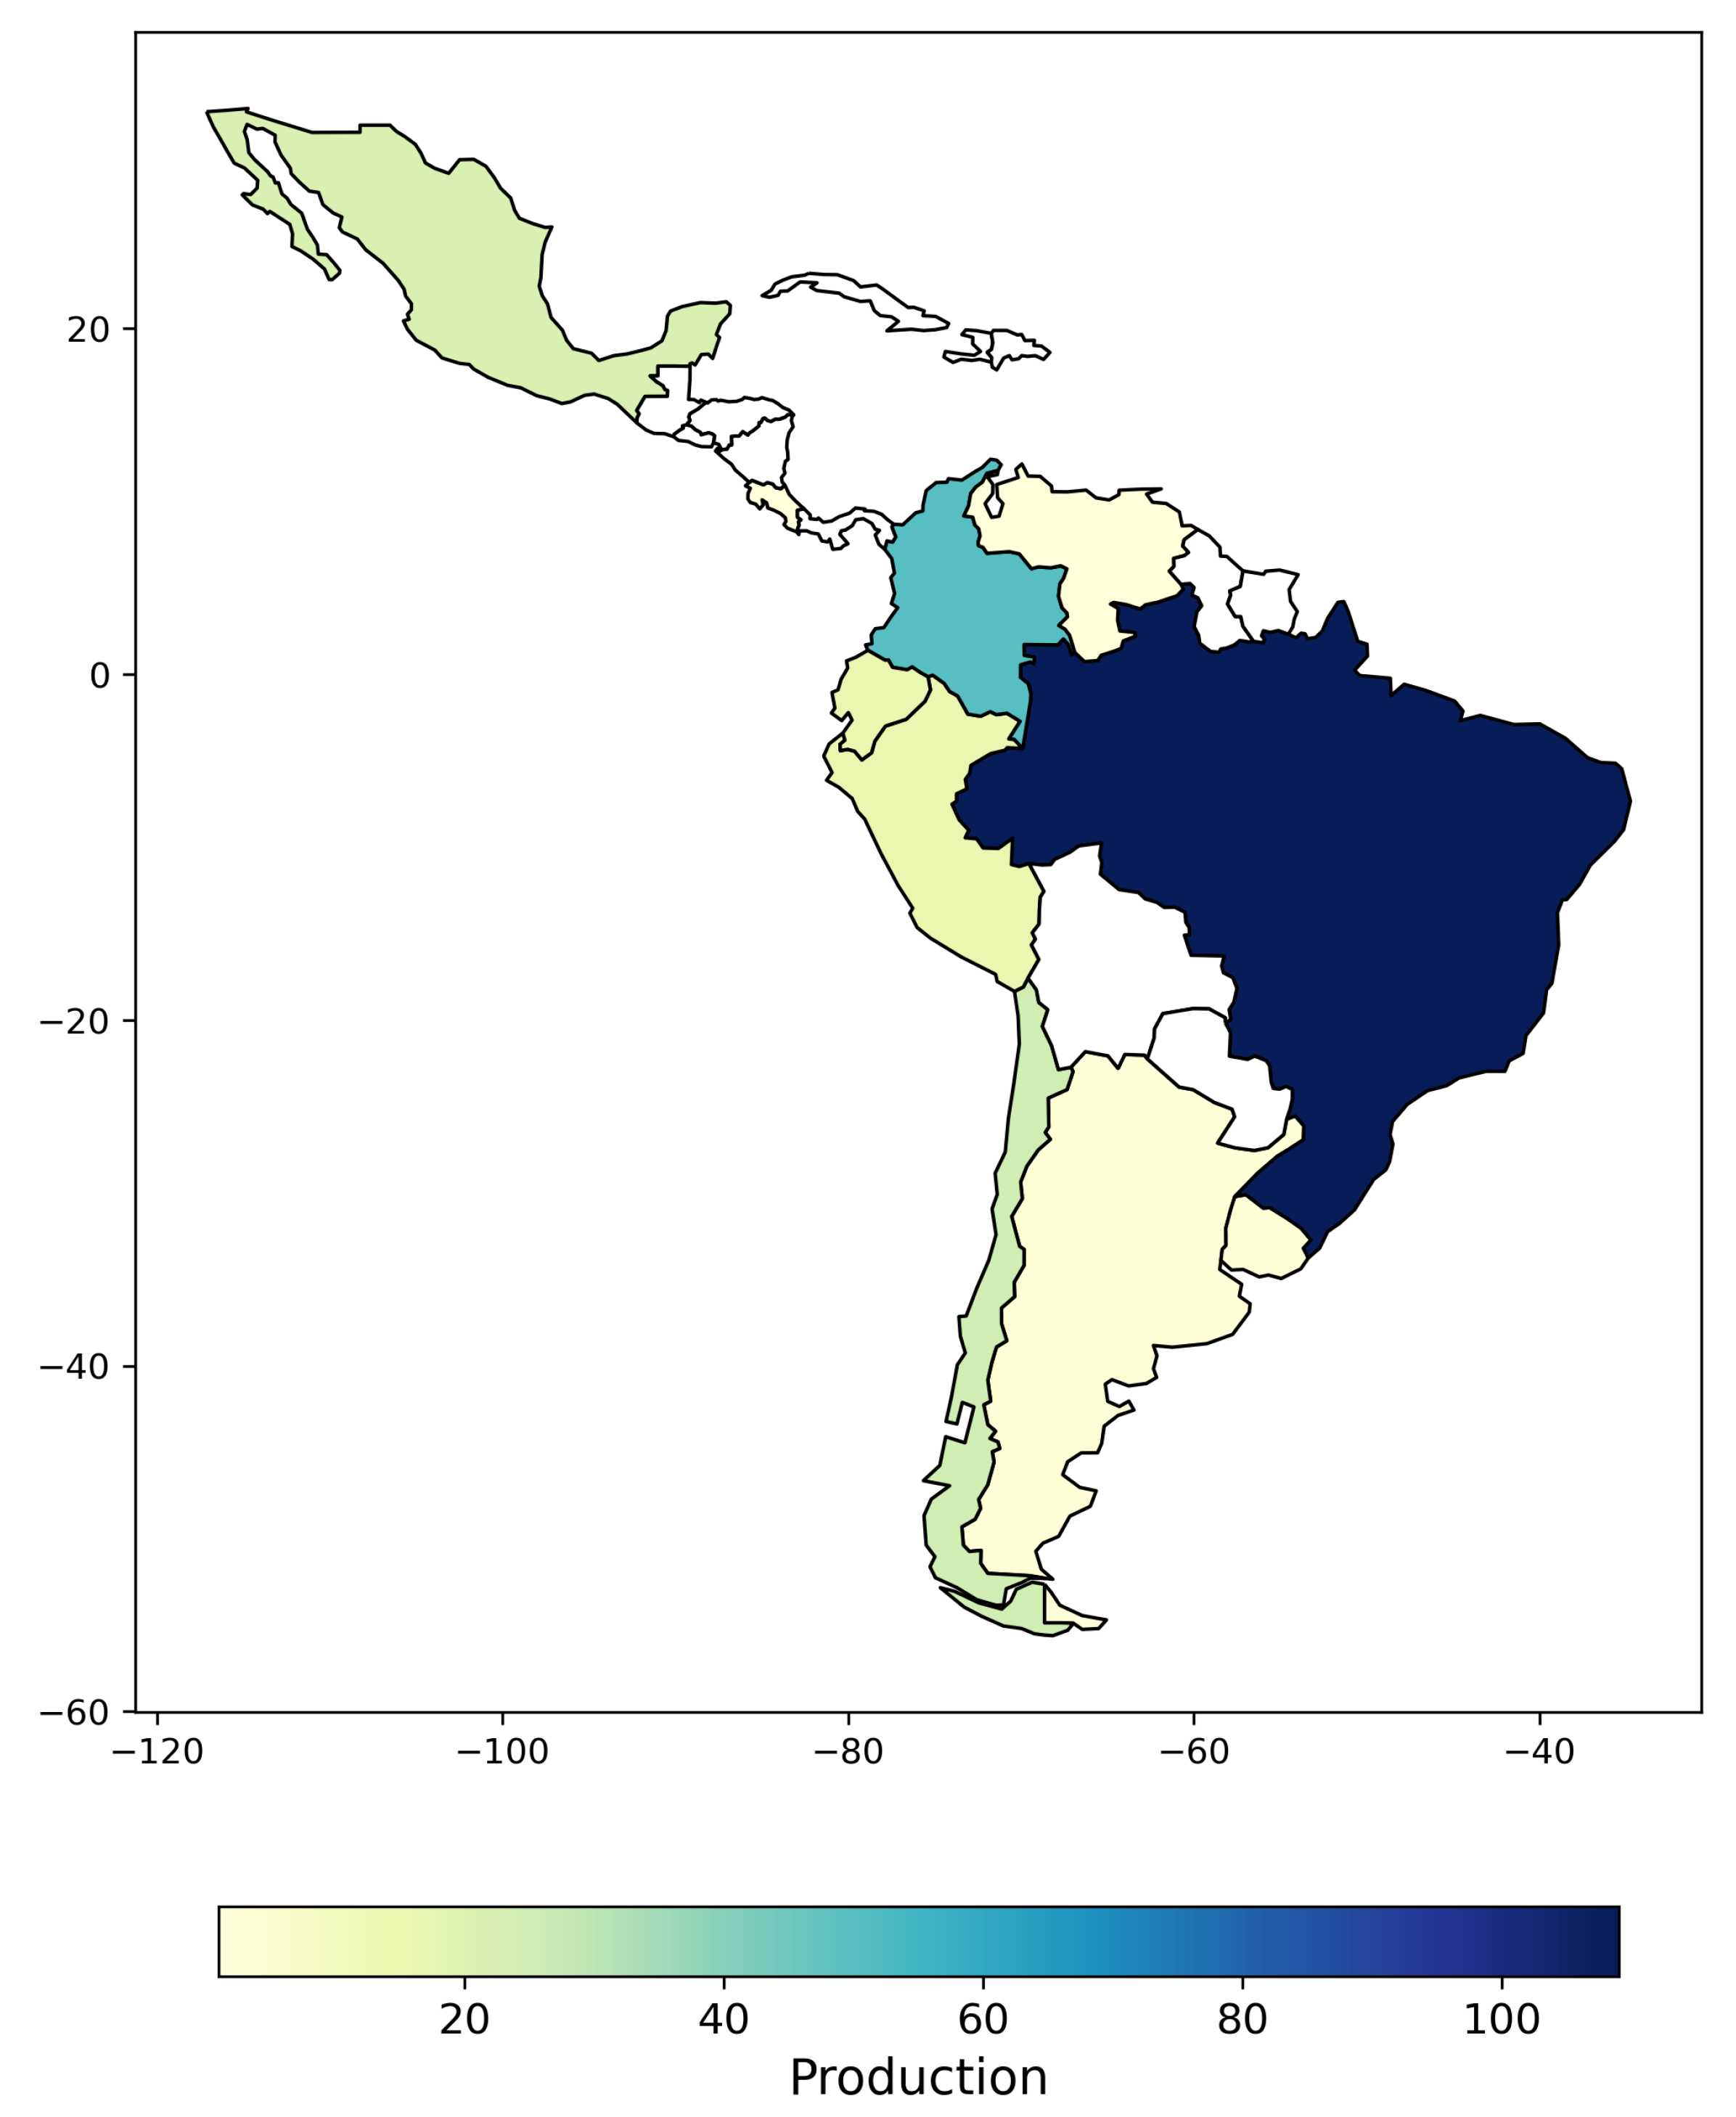
The geographical distribution of scientific production, based on the affiliations of authors and co-authors, is presented in Figure 3. Following Biblioshiny/Bibliometrix conventions, the unit of analysis is each author-affiliation-country block; the resulting country-level count is denoted by n b . Consequently, a single article can contribute multiple observations, and an author with multiple affiliations contributes as many entries as declared. This approach does not count unique articles or unique authors, and it does not weight by author order. Moreover, because several studies involve international collaboration, the total number of affiliation blocks exceeds the total number of articles in the corpus.
Brazil accounts for the largest share of affiliations, with n b = 109 , confirming its central position in regional research activity related to artificial intelligence and crime. Colombia follows with n b = 50 , while Chile ( n b = 25 ), Mexico ( n b = 22 ), Ecuador ( n b = 16 ), and Peru ( n b = 16 ) also demonstrate consistent participation within the Latin American context. Additional contributions are observed from Argentina ( n b = 2 ), Uruguay ( n b = 2 ), Costa Rica ( n b = 1 ), and Venezuela ( n b = 1 ), indicating a broader, though uneven, regional distribution.
Beyond Latin America, a notable number of affiliations are linked to institutions from the United States ( n b = 41 ) and Spain ( n b = 18 ), suggesting strong transcontinental collaboration links. Other participating countries include China ( n b = 9 ), the United Kingdom ( n b = 7 ), Italy ( n b = 6 ), Canada ( n b = 4 ), Portugal ( n b = 4 ), Germany ( n b = 3 ), Russia ( n b = 3 ), Austria ( n b = 2 ), Indonesia ( n b = 2 ), South Korea ( n b = 2 ), India ( n b = 1 ), Ireland ( n b = 1 ), Israel ( n b = 1 ), Norway ( n b = 1 ), Romania ( n b = 1 ), and Thailand ( n b = 1 ). Taken together, these values highlight a diverse institutional landscape that contributes to the topic, even though participation is highly concentrated in a few countries.
The full-counting scheme described above better reflects multi-institutional and cross-border collaboration, recognizes cases where a researcher reports multiple affiliations, and assigns credit to each institutional participation. However, it may overvalue countries with many domestic co-authors on the same article, does not distinguish between first/lead and co-authors, and shared institutions are tallied multiple times across authors within the same paper. Results should therefore be interpreted as the volume of affiliated participations rather than as counts of unique papers or unique researchers. To benchmark these effects, Table 1 reports, for Latin American countries, the unique-article counts ( n u ), a simple inflation ratio capturing domestic multi-affiliation ( n b / n u ), and the fractional contribution F c defined as follows:
F c = a n c , a K a ,
where n c , a is the number of affiliation blocks of country c in article a, and K a is the total number of affiliation blocks (author–affiliation–country units) in the same article. In this way, each article contributes a total weight of 1 that is distributed proportionally across countries according to their number of reported affiliations.
The full count ( n b ) records the total number of author–affiliation–country blocks and therefore captures multi-institutional participation within the same paper, whereas the unique-article count ( n u ) indicates how many distinct papers include at least one affiliation from the country. Consequently, the ratio n b / n u approximates the average domestic multi-affiliation intensity per paper; values greater than 1 imply, on average, more than one national affiliation per article. Furthermore, the fractional contribution F c allocates each weight of the article proportionally across all author–affiliation–country blocks, thereby mitigating the overemphasis that full counting can place on prolific hubs, as shown in Table 1.
In this corpus, Brazil remains the leading contributor under both full and fractional counting (109 blocks, 54 unique papers, n b / n u = 2.02 , and F c = 47.62 ), which signals both scale and moderate domestic co-affiliation, indicating that its central position is not solely an artifact of multi-affiliation. Colombia ( F c = 20.12 ), Mexico ( F c = 8.58 ), and Chile ( F c = 8.13 ) follow, with n b / n u ranging from 2.20 to 2.50, indicating relatively dense internal collaboration. By contrast, Argentina, Costa Rica, Uruguay, and Venezuela exhibit n b / n u = 1 , consistent with a single national affiliation per paper. Taken together, the table enables readers to compare gross institutional participation ( n b ) with non-redundant output ( n u ) and fractionalized credit ( F c ), thereby providing a more balanced view of the country-level scholarly footprint.
Finally, Table 1 and the spatial pattern illustrated in Figure 3 show a clear concentration of research activity in Brazil and, to a lesser extent, in the Andean region and Mexico. This regional structure provides a suitable framework for analyzing the subsequent international collaboration networks that have supported the expansion of research on this topic.

3.3. International Collaboration Network

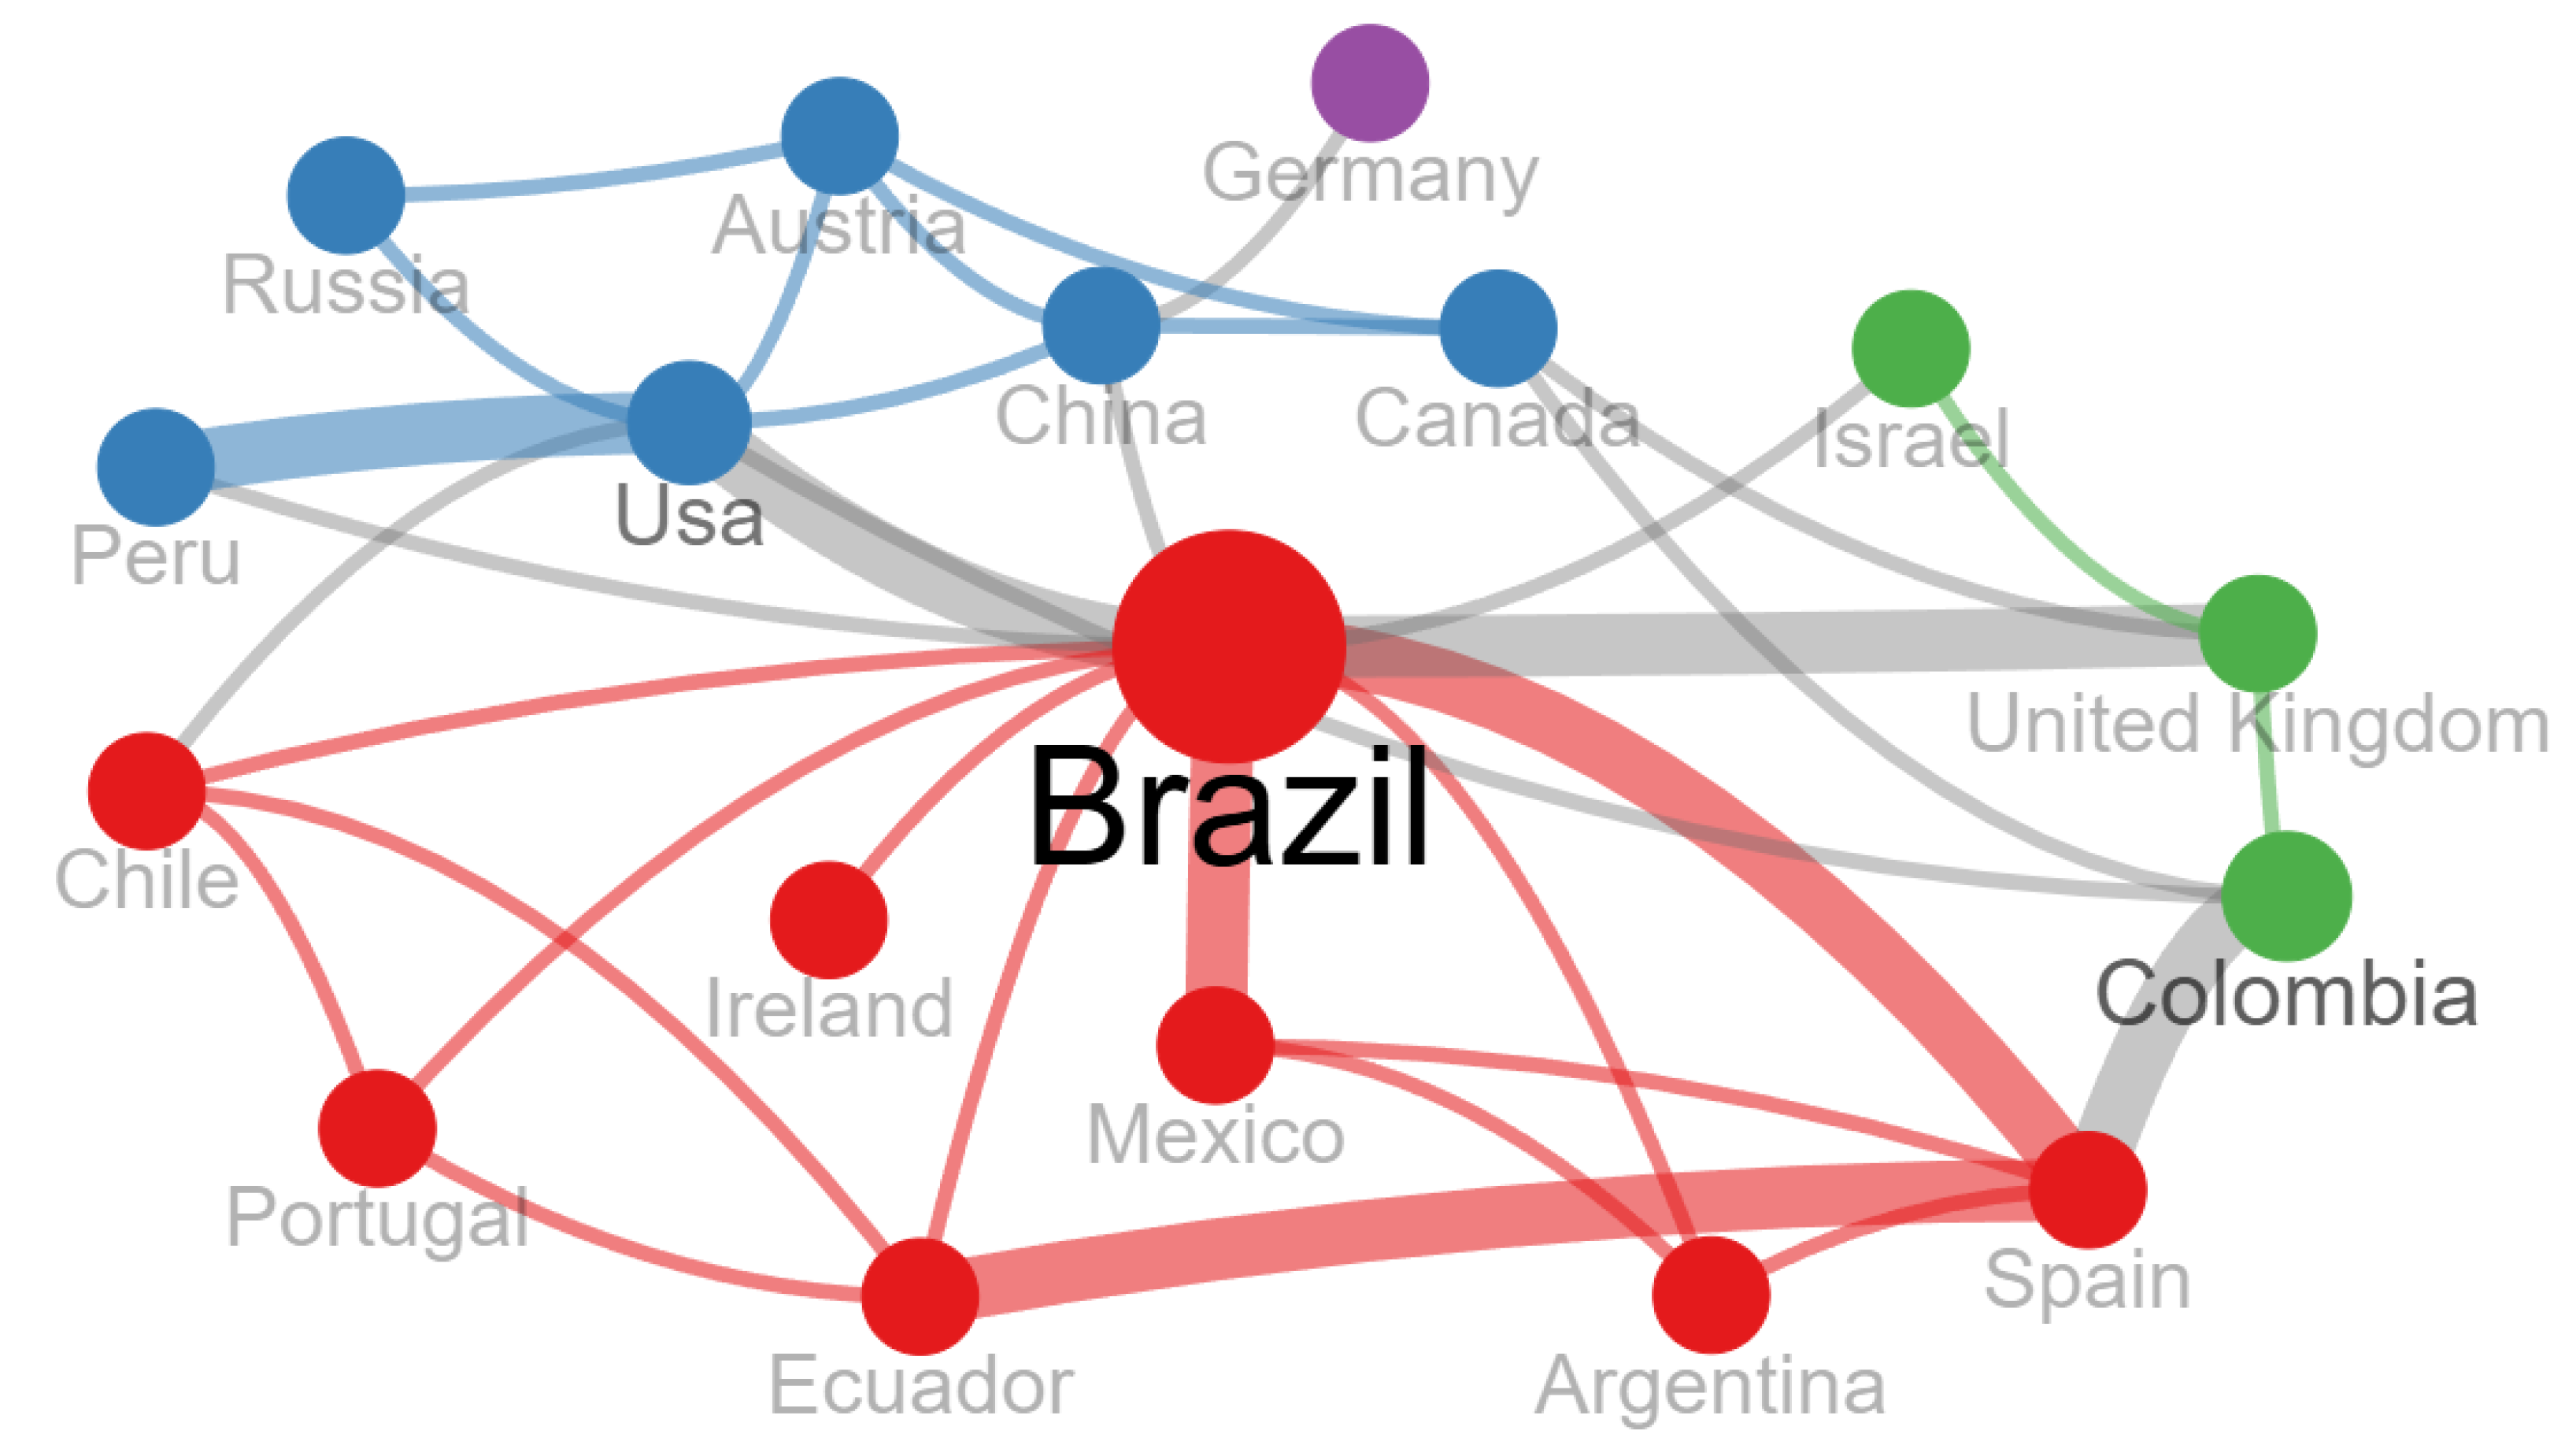
Figure 4 illustrates the international co-authorship network derived from the affiliations of the 146 analyzed publications. Each node represents a country, while the size of the node corresponds to the number of documents associated with that country. The thickness of the connecting lines reflects the intensity of collaborative relationships, expressed through shared publications between co-authors from different national affiliations.
The visualization reveals Brazil as the central hub of collaboration in the region, maintaining strong connections with both Latin American and extra-regional partners. The most prominent collaborative links are observed between Brazil and Spain, Mexico, Ecuador, Argentina, and Portugal, as indicated by the thick red edges. Colombia also plays a relevant role, forming an active partnership cluster with the United Kingdom and Spain, represented in green.
The United States forms another important collaboration bridge, connecting with Brazil, China, and Russia, and indirectly linking the Latin American network with Asian and North American institutions. Secondary but visible collaborations include those among China, Austria, Canada, and Germany, which form part of a smaller blue subnetwork associated with technology-oriented research institutions.
Overall, the network features a multi-hub configuration, with Brazil serving as the principal regional connector and Colombia emerging as a key node, fostering transatlantic collaboration. These patterns are consistent with the geographical distribution previously presented, in which both countries concentrated the largest number of author affiliations in the region.
The structure of international collaboration identified here provides the basis for a more detailed examination of the institutions driving this research landscape, as described in the following subsection.

3.4. Most Prolific Institutions

The institutional analysis of the research output reveals a strong concentration of activity in a relatively small group of universities and research centers in Latin America, as reported in Table 2.
At the country level, we defined n b as the total number of author–affiliation–country blocks and n u as the number of unique articles with at least one affiliation in the country. At the institutional level, we use the analogous notation n b f and n u f , where the subscript f indicates affiliation blocks computed for each institution rather than for countries. In this table, n u f denotes the number of unique articles with at least one affiliation to the institution, n b f corresponds to the total number of author–affiliation–institution blocks under full counting, and the ratio n b f / n u f approximates the average number of authors affiliated with that institution per article in which it appears. Consistent with the geographical patterns described in the previous subsection, Brazilian institutions dominate the regional landscape, complemented by substantial contributions from Colombia, Chile, Ecuador, Mexico, Peru, and Uruguay.
At the top of the ranking, the Universidade Federal de Pernambuco (Brazil) stands out with nine unique articles and fifteen author-affiliation-institution blocks, confirming its central role in the regional network. It is followed by the Universidade de São Paulo and the Universidade Estadual de Campinas (both in Brazil), each contributing five unique articles and nine and eight blocks, respectively. A second tier of institutions with three unique articles includes the Universidade Federal do Rio Grande do Norte and the Universidade do Estado do Rio de Janeiro (Brazil), as well as the Universidad Externado de Colombia, Universidad Tecnológica de Bolívar, Universidad Militar Nueva Granada, Universidad de Cartagena (Colombia), Universidad Adolfo Ibáñez (Chile), and Universidad Central del Ecuador (Ecuador). These institutions form the core of a growing academic base that sustains research on artificial intelligence and crime across multiple national contexts.
Institutions with two unique articles, such as the Pontificia Universidad Católica de Chile (Chile), the Pontifícia Universidade Católica do Rio de Janeiro (Brazil), the Universidad Michoacana de San Nicolás de Hidalgo and Universidad Autónoma de Ciudad Juárez (Mexico), the Universidad de los Andes (Colombia), the Universidad de Lima and Universidad Nacional Mayor de San Marcos (Peru), the Universidad Regional Autónoma de los Andes (Ecuador), and the Universidade do Vale do Rio dos Sinos (Brazil), reinforce this core group by providing additional nodes in the regional collaboration structure. The tail of the distribution is composed of institutions with a single unique article but often a relatively high number of affiliated authors, including the Universidade Federal Rural de Pernambuco, Universidade Federal do Pará, Universidade Federal do Rio Grande do Sul, and Instituto Jones dos Santos Neves in Brazil; the Universidad Autónoma de Baja California and Universidad de Guanajuato in Mexico; the Universidad Estatal de Milagro in Ecuador; the Corporación Universitaria Remington, Universidad de Bogotá Jorge Tadeo Lozano, and Universidad Simón Bolívar in Colombia; and the Universidad de la República in Uruguay.
The ratio n b f / n u f adds an additional layer of interpretation by highlighting the intensity of within–institution collaboration. For example, the Pontificia Universidad Católica de Chile exhibits a high ratio (11 blocks across 2 unique articles), while the Universidade Federal Rural de Pernambuco, Universidade Federal do Pará, and Universidad Autónoma de Ciudad Juárez combine only one unique article each with seven or more affiliation blocks. These high ratios indicate that teams with multiple co-authors from the same institution work jointly on the few articles in which the institution appears, suggesting locally dense collaboration patterns even when the total number of publications is modest.
Outside Latin America, several institutions also play a significant role in the international collaboration structure discussed earlier. The Universitat Politècnica de València (Spain) emerges as a particularly prominent partner, followed by the Research Center for Geoinformatics (United States) and the School of Applied Mathematics (United States). Other relevant contributors include the University of Bologna (Italy), the University of Maryland (United States), Shenzhen University (China), Università degli Studi di Torino (Italy), and San Diego State University (United States). Collectively, these institutions strengthen transregional links and enhance the global visibility of research on artificial intelligence and crime connected to Latin America.

3.5. Most Relevant Sources

Table 3 presents the scientific journals with the highest number of publications. The distribution of sources reveals a diverse publishing landscape that integrates outlets from computer science, social sciences, and regionally oriented journals.
The journals Expert Systems with Applications (Q1) and Revista Criminalidad (Q4) each account for 5 articles, representing the highest individual contributions within the corpus. They are followed by Artificial Intelligence and Law (Q1) and RISTI–Revista Ibérica de Sistemas e Tecnologias de Informação (formerly covered in Scopus), both with 4 articles. PLOS ONE (Q1) appears next with 3 publications, reflecting the inclusion of interdisciplinary research on data-driven crime analysis and social impacts.
A broader group of journals published 2 articles each, spanning a wide range of disciplines. These include high-impact venues such as Cities, Decision Support Systems, Forensic Science International, Humanities & Social Sciences Communications, IEEE Access, IEEE Transactions on Smart Grid, and IEEE Transactions on Visualization and Computer Graphics—all classified in Q1. Additional outlets cover regional and specialized areas, including Intelligent Data Analysis (Q2), Journal of Computational Social Science (Q2), and several Latin American journals such as Revista Brasileira de Ciências Policiais, Revista Científica General José María Córdova, and Revista Brasileira de Direito Processual Penal. This diversity underscores the multidisciplinary nature of the research that connects artificial intelligence, data systems, and criminology.
The distribution of sources highlights the coexistence of global, interdisciplinary journals with regional outlets that emphasize contextual applications of technology to public safety and legal frameworks. These publication channels form the basis for identifying the most influential individual contributions, which are examined in the following subsection.

3.6. Most Relevant Articles

Table 4 summarizes the ten most cited documents identified in the bibliometric analysis, illustrating the breadth of artificial intelligence applications to crime-related challenges across Latin America. Citation counts range from 35 to 131, with annual citation averages between 5.15 and 16.38. Thematically, these studies address issues including crime prediction, homicide modeling, energy theft detection, tax and procurement fraud, and public safety perception, covering cases from Guatemala, Brazil, Chile, Colombia, and Uruguay. Collectively, they reveal a growing regional emphasis on data-driven governance, predictive analytics, and the integration of machine learning techniques into public security and transparency systems.
The most cited study [70], with 131 citations and 16.38 citations per year, proposes a deep learning architecture for predicting emergency events—specifically murders, robberies, burglaries, and acts of violence—using Long Short-Term Memory (LSTM) recurrent neural networks. Conducted in Guatemala City, one of the most crime-prone urban centers in Latin America, the research employed official National Police data from 2012–2015 (see Appendix B). Four predictive models were developed: two for binary classification (event occurrence) and two for regression (event count), distinguishing between spatially dependent and independent approaches. The preprocessing phase combined spatial clustering—K-Means, Partitioning Around Medoids (PAM), and Density-Based Spatial Clustering of Applications with Noise (DBSCAN)—with temporal segmentation to capture geographic and temporal patterns more effectively.
Empirical results showed that the LSTM models outperformed traditional time-series methods such as Moving Average (MA), Weighted Moving Average (WMA), and Autoregressive Integrated Moving Average (ARIMA), as well as classical machine learning algorithms like Support Vector Machine (SVM), decision tree, and Multilayer Perceptron (MLP). The independent regression model (RI-LSTM) achieved the lowest prediction errors (MAE = 0.40, RMSE = 0.65), while binary variants (BI-LSTM and BD-LSTM) reached 71.6% accuracy. Despite these results, the single-city dataset and lack of contextual variables—socioeconomic, environmental, or mobility-related—limit generalization. Future extensions could include multi-city validation, real-time data, and advanced architectures such as attention-based or graph neural networks.
Building upon the predictive approach, the second most cited article [71] investigates homicide prediction in over 5000 Brazilian municipalities using a Random Forest (RF) regressor trained on nationwide urban indicators. The authors argue that ensemble learning methods are better suited to handle heteroscedasticity, multicollinearity, and heavy-tailed distributions that compromise traditional Ordinary Least Squares (OLS) regression. Using census-derived variables such as unemployment, illiteracy, sanitation, and population composition, the RF achieved 97% accuracy and an adjusted R 2 of 0.80, far surpassing OLS benchmarks. Feature importance analysis identified unemployment and illiteracy as dominant predictors, followed by male population proportion, while GDP and past homicide rates contributed minimally. The study emphasizes interpretive caution, as feature importance reveals relevance but not direction of effect. In RF models, these importance scores are non-causal, and their magnitude is sensitive to correlation structures and shared variance among predictors, so they should be interpreted as descriptive indicators of contribution to predictive accuracy rather than as estimates of causal impact. The authors propose combining nonlinear and Bayesian frameworks to improve both predictive precision and explanatory insight into urban violence.
Shifting focus from violence to financial crime, the third most cited article [72] addresses non-technical losses—particularly electricity theft—in the power distribution sector of Brazil. The authors introduce a Binary Black Hole Algorithm (BBHA), derived from the continuous Black Hole optimization method, for feature selection in detecting irregular energy consumption. Tested on datasets from Brazilian utilities, the BBHA combined with the Optimum-Path Forest (OPF) classifier increased detection accuracy to 83.8% for industrial and 64.8% for commercial consumers while halving the number of input variables. Although efficient and parameter-free, its validation was limited to two datasets without detailed irregularity typologies. Future work should include heterogeneous sources such as socioeconomic and geographic data to expand applicability across smart grid systems in Latin America.
Expanding the spatial dimension, the fourth most cited study [27] applies a Bayesian Negative Binomial spatial model to analyze how socioeconomic, environmental, and mobility variables affect violent and property crimes in Bogotá (Colombia) and three U.S. cities—Boston, Los Angeles, and Chicago. In Bogotá, mobility and population density were stronger predictors than socioeconomic disadvantage, suggesting distinctive local dynamics. The findings underscore that crime determinants are city-specific and context-dependent. Limitations include static data and incomplete representation of social cohesion or policing. Future research should incorporate dynamic mobility data and context-sensitive social variables to enhance cross-city comparability.
In a similar urban context, the fifth most cited study [73] examines how safety perceptions in Santiago (Chile) vary by gender and mobility behavior, integrating computer vision and discrete choice modeling. Deep neural networks—SegNet for semantic segmentation and Faster Region-Based Convolutional Neural Network (Faster R-CNN) for object detection—-were used to extract environmental features from Google Street View images. Combined with survey data from 1342 residents, these features fed an ordinal logit model linking built environment characteristics to perceived safety. Women reported systematically lower safety perceptions, while pedestrians and cyclists were more sensitive to social and natural cues. Although limited by static imagery and a lack of behavioral data, this approach offers a scalable framework for perception-based urban safety analysis.
Extending AI applications to fiscal control, the sixth most cited article [74]—developed within the Internal Revenue Service of Chile (SII)—uses data mining and neural modeling to detect taxpayers using false invoices, a recurrent form of value-added tax (VAT) fraud. Combining Self-Organizing Maps (SOM), Neural Gas, Decision Trees (CHAID), MLP, and Bayesian Networks, the model achieved accuracies above 90% across firm sizes. Key predictors included tax credit ratios and audit outcomes. Despite incomplete and static annual data, the study demonstrated the utility of neural networks for large-scale tax fraud detection, encouraging future integration of temporal and behavioral variables.
Returning to energy-related crimes, the seventh most cited article [75] develops a cost-sensitive inspection framework for electricity theft in the distribution network of Uruguay. Rather than optimizing classification accuracy, the model maximizes expected economic gain using a Bayesian decision approach that integrates fraud probability, potential recovery, and inspection cost. Validated on data from 50,000 customers in Montevideo—of which 6% were fraudulent—the model showed that prioritizing by expected monetary value yields higher recovery efficiency than threshold-based strategies. Random Forest models proved the most stable, though the approach remains constrained by limited real-time and unmetered data.
In the eighth position, the study [76] presents a Decision Support System (DSS) for detecting corruption and fraud in public procurement across Brazilian states. Integrating graph theory, clustering (DBSCAN), and regression analysis, the DSS consolidates over two million contracts and corporate records into a unified data lake. Deployed within the Prosecutor’s Offices of São Paulo and Paraíba, it supported major anti-corruption operations—Xeque-Mate and Calvário—uncovering irregular contracts exceeding R$4 billion (∼USD 1.2 billion). While effective in large-scale investigations, its dependence on structured data and official records limits adaptability. Future enhancements include unstructured data integration and Natural Language Processing (NLP)-based anomaly detection.
The ninth most cited article [77], from the Federal University of Pernambuco and the Brazilian Federal Police, applies machine learning to detect illegal Cannabis sativa L. plantations using Near-Infrared Hyperspectral Imaging (HSI-NIR) combined with sparse Principal Component Analysis (sPCA) and Soft Independent Modeling of Class Analogy (SIMCA). Using confiscated plant samples, four discriminant wavelengths (1875, 1894, 1931, and 1994 nm) were identified, achieving 89.45% sensitivity and 97.60% specificity. Though laboratory-based, the approach demonstrates the feasibility of low-cost, drone-assisted surveillance for narcotics detection in Brazil. Broader validation across biomes and real airborne data remains a necessary step.
Finally, the tenth most cited article [78] introduces a semi-supervised deep learning framework based on DeepLabv3+ with a ResNet-101 backbone to generate high-resolution urban tree canopy (UTC) maps for 472 Brazilian cities. Using WorldView, GeoEye, SkySat, and Pleiades imagery, the model reached 95.76% accuracy and revealed stark inequalities in canopy coverage, ranging from 5% to 35%. Although centered on urban ecology, these findings offer valuable insights for analyzing environmental justice and its potential links to urban safety and crime exposure. Limitations include reduced segmentation accuracy in dense areas and the absence of temporal monitoring. Future research should incorporate LiDAR data and temporal analyses to improve urban sustainability assessment.
Collectively, these ten highly cited studies reveal the diversity of artificial intelligence applications to crime-related challenges in Latin America—from violence and corruption to tax and energy fraud—using methods ranging from deep learning and Bayesian inference to graph theory and cost-sensitive modeling. Their varied approaches underscore a regional trend toward data-driven governance, setting the stage for a deeper exploration of the thematic patterns and conceptual linkages discussed in the following subsection. Additionally, the datasets most frequently used across the reviewed studies are documented in a dedicated table in Appendix B, which facilitates transparency, reproducibility, and data reuse.

3.7. Wordclouds and Keyword Co-Occurrence

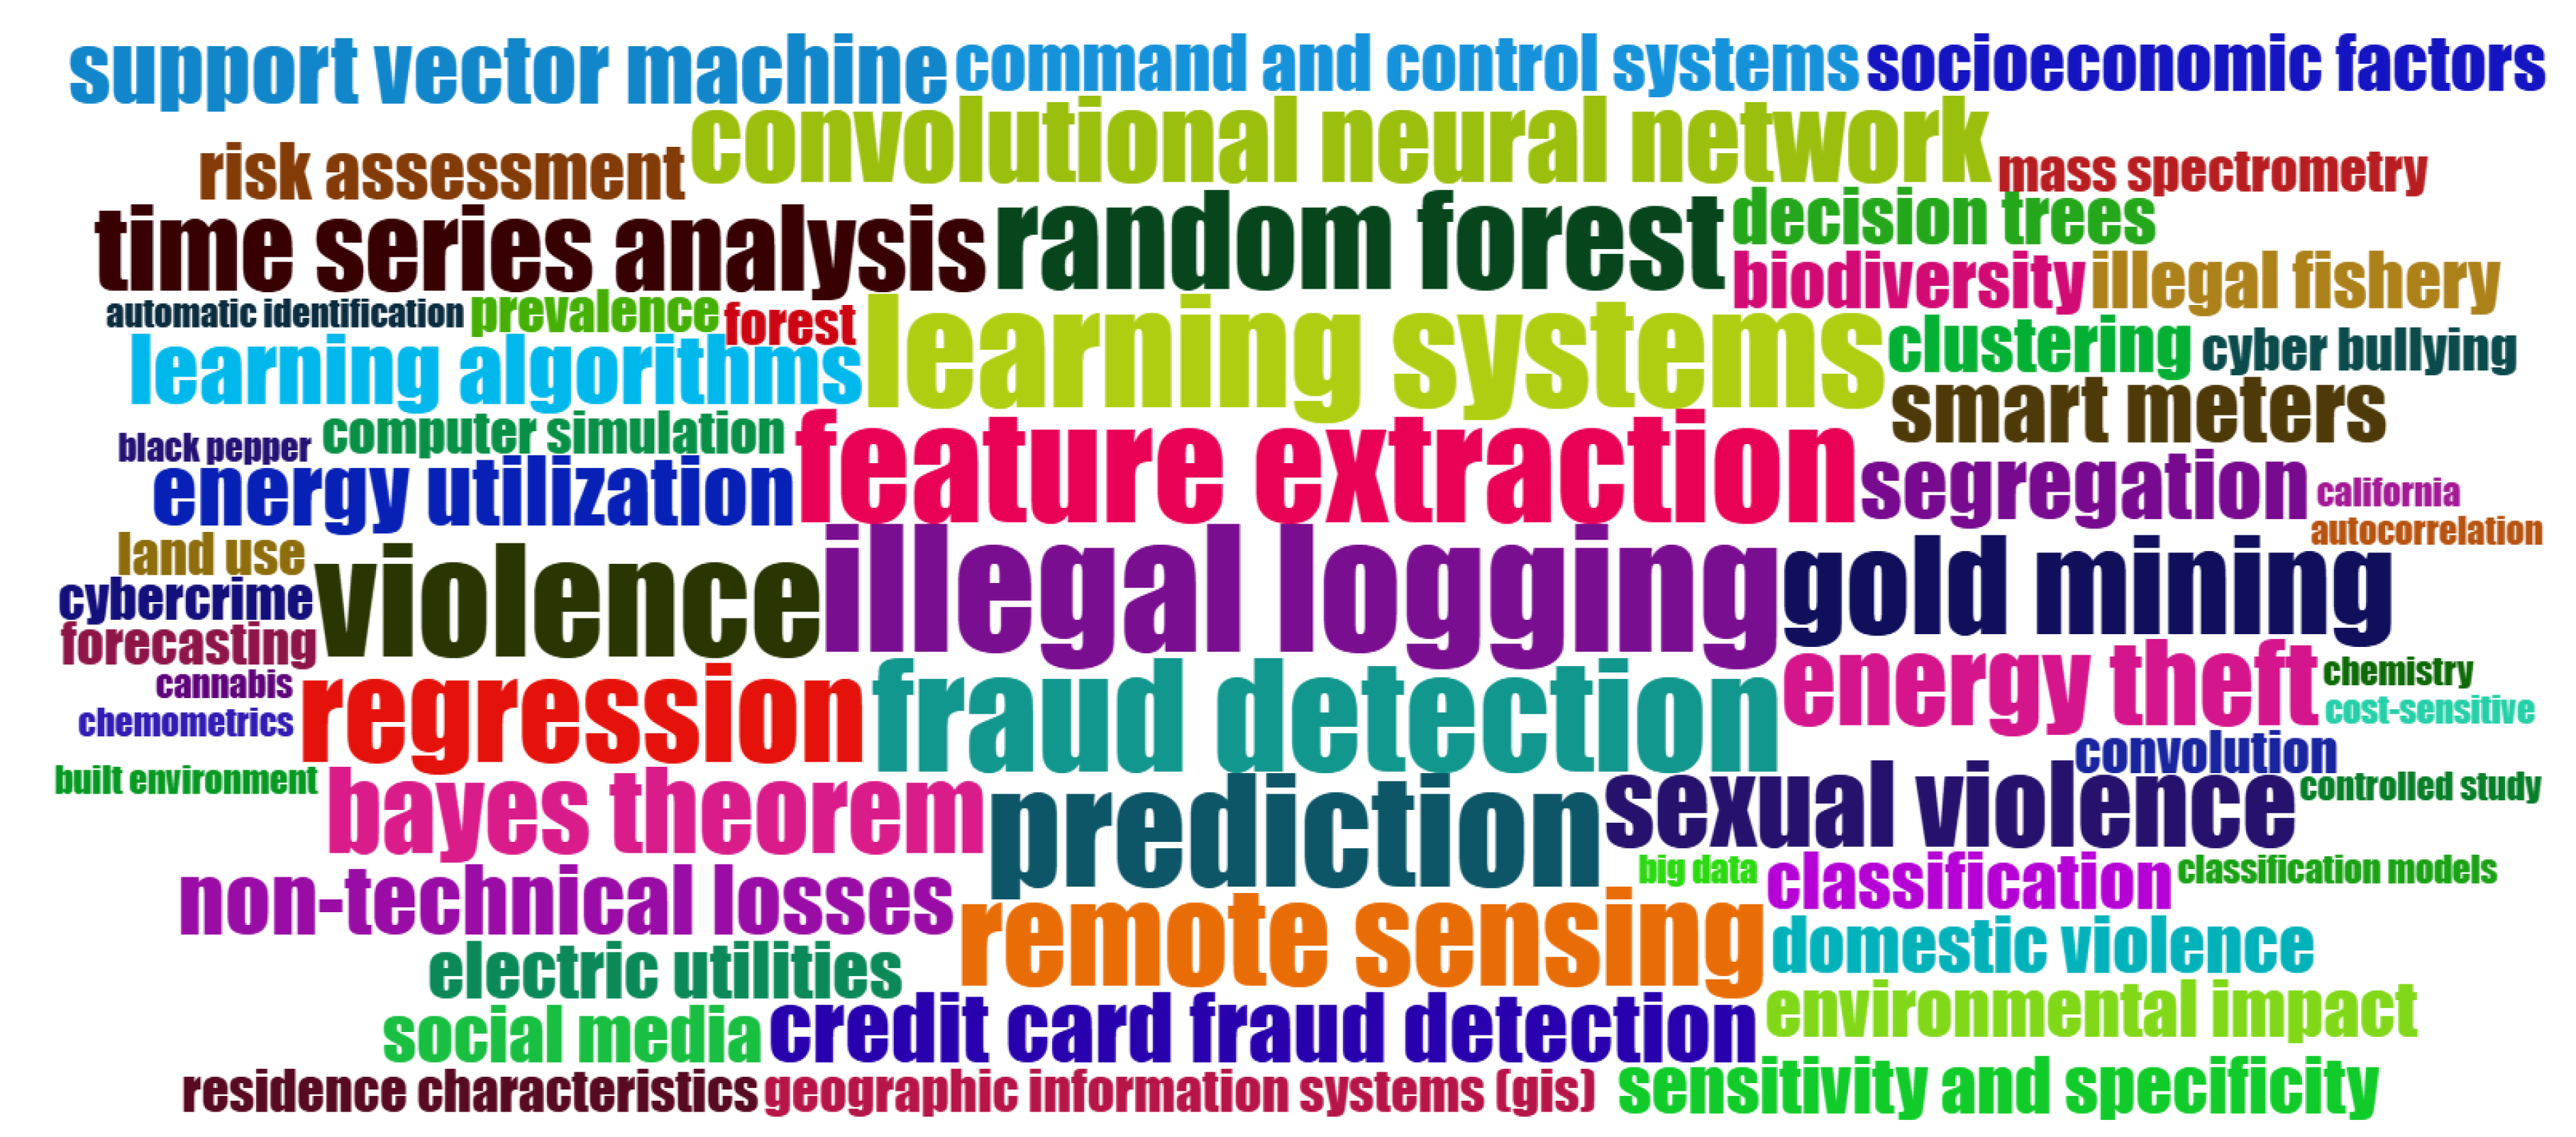
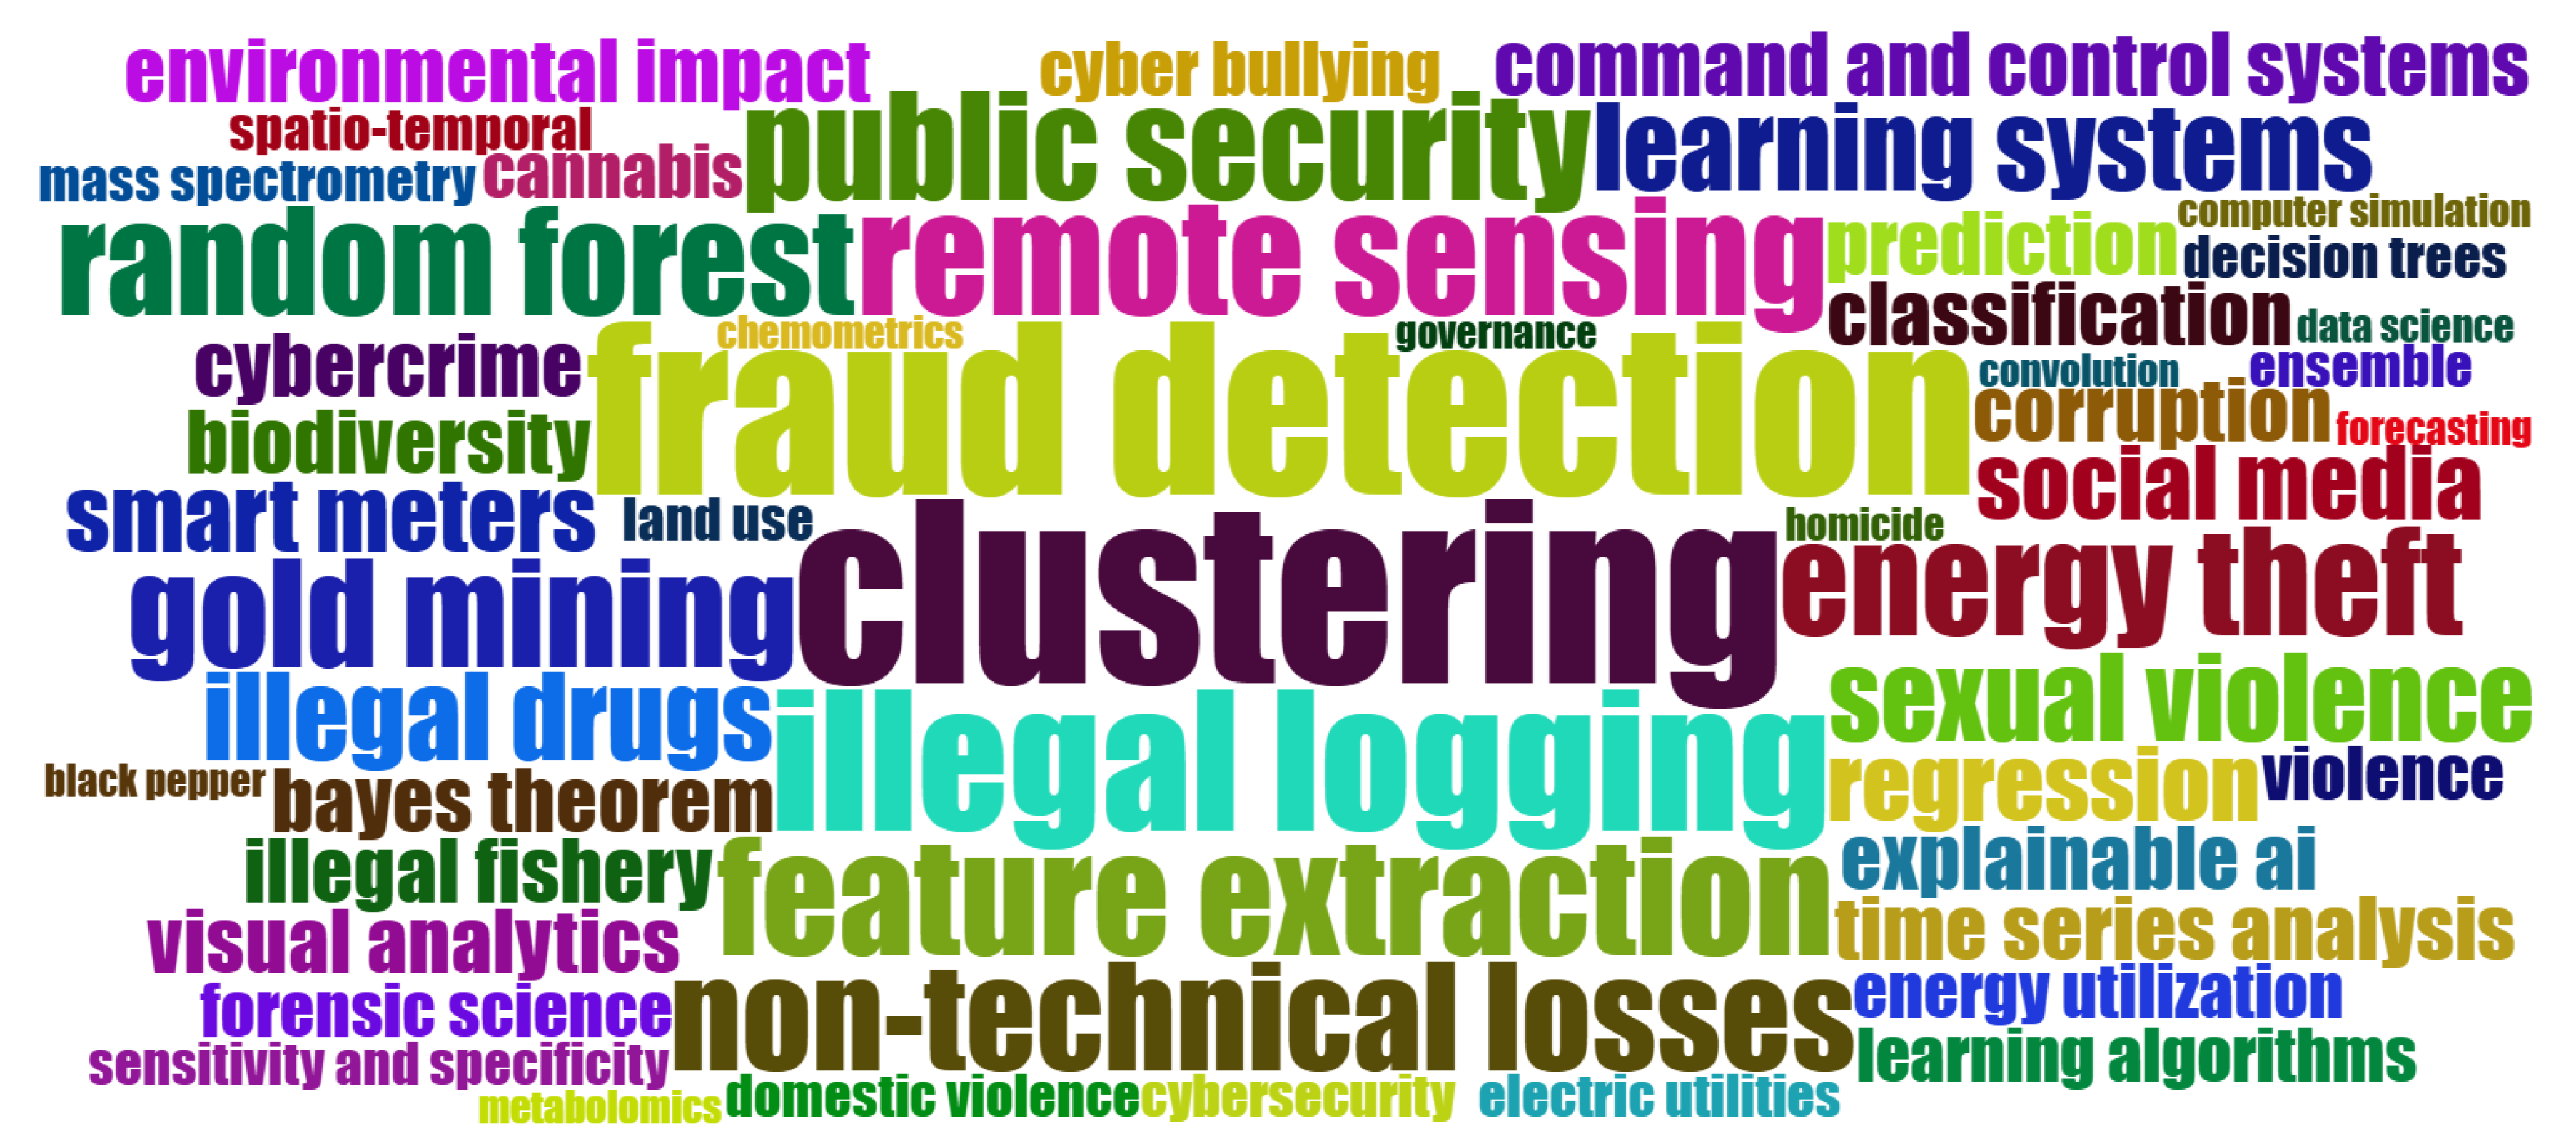
Figure 5 and Figure 6 compare two complementary views of the thematic space. Both clouds are built from the same 146 documents, yet they emphasize different layers of the literature. Convergences are clear: in both figures, methodological terms such as “clustering”, “random forest”, “feature extraction”, “classification”, “regression”, and “time series analysis” are prominent, as are application labels tied to the main domains identified earlier in the most cited studies, including “fraud detection”, “energy theft” and “non-technical losses”, “illegal logging”, “gold mining”, “cybercrime”, “sexual violence” and “domestic violence”. Both clouds also highlight heterogeneous data sources that recur throughout the corpus, notably “remote sensing”, “smart meters”, “social media”, “electric utilities”, “land use”, and “biodiversity”, which align with the environmental and urban security cases previously discussed.
Differences reflect how each vocabulary is generated. The Keyword Plus cloud, Figure 5, concentrates additional indexing and study design descriptors, including “support vector machine”, “classification models”, “bayes theorem”, “risk assessment”, “autocorrelation”, “sensitivity and specificity”, “prevalence”, “computer simulation”, “controlled study”, and “big data”. It also surfaces contextual variables and measurement frameworks such as “geographic information systems (GIS)”, “residence characteristics”, “socioeconomic factors”, and “built environment”, and it specifies subdomains like “credit card fraud detection”. The appearance of toponyms such as “California” suggests cross-city or comparative designs, consistent with the multi-city analyses reported earlier.
By contrast, the author keywords cloud, Figure 6, places greater weight on practitioner language and recent technical trends. Alongside the shared core of tree-based and statistical methods, it foregrounds “ensemble”, “visual analytics”, and “explainable AI”, and it includes operational tokens such as “public security”, “spatio-temporal”, “governance”, and “command and control systems”. Deep learning appears in both views through “convolutional neural network” or “convolution”, but the author list balances this with workflow specific terms tied to sensing and forensics, for example, “mass spectrometry”, “chemometrics”, and “metabolomics”. Domain-specific markers like “cannabis” and “black pepper” are consistent with spectral or chemical discrimination tasks, which also underpin several environmental and narcotics applications highlighted in the results.
Taken together, Figure 5 and Figure 6 depict a shared core built around ensemble learning, supervised and unsupervised classification, and multimodal evidence. At the same time, Keyword Plus enriches the landscape with indexing, evaluation, and contextual variables, and author keywords emphasize emergent techniques and operational frames.
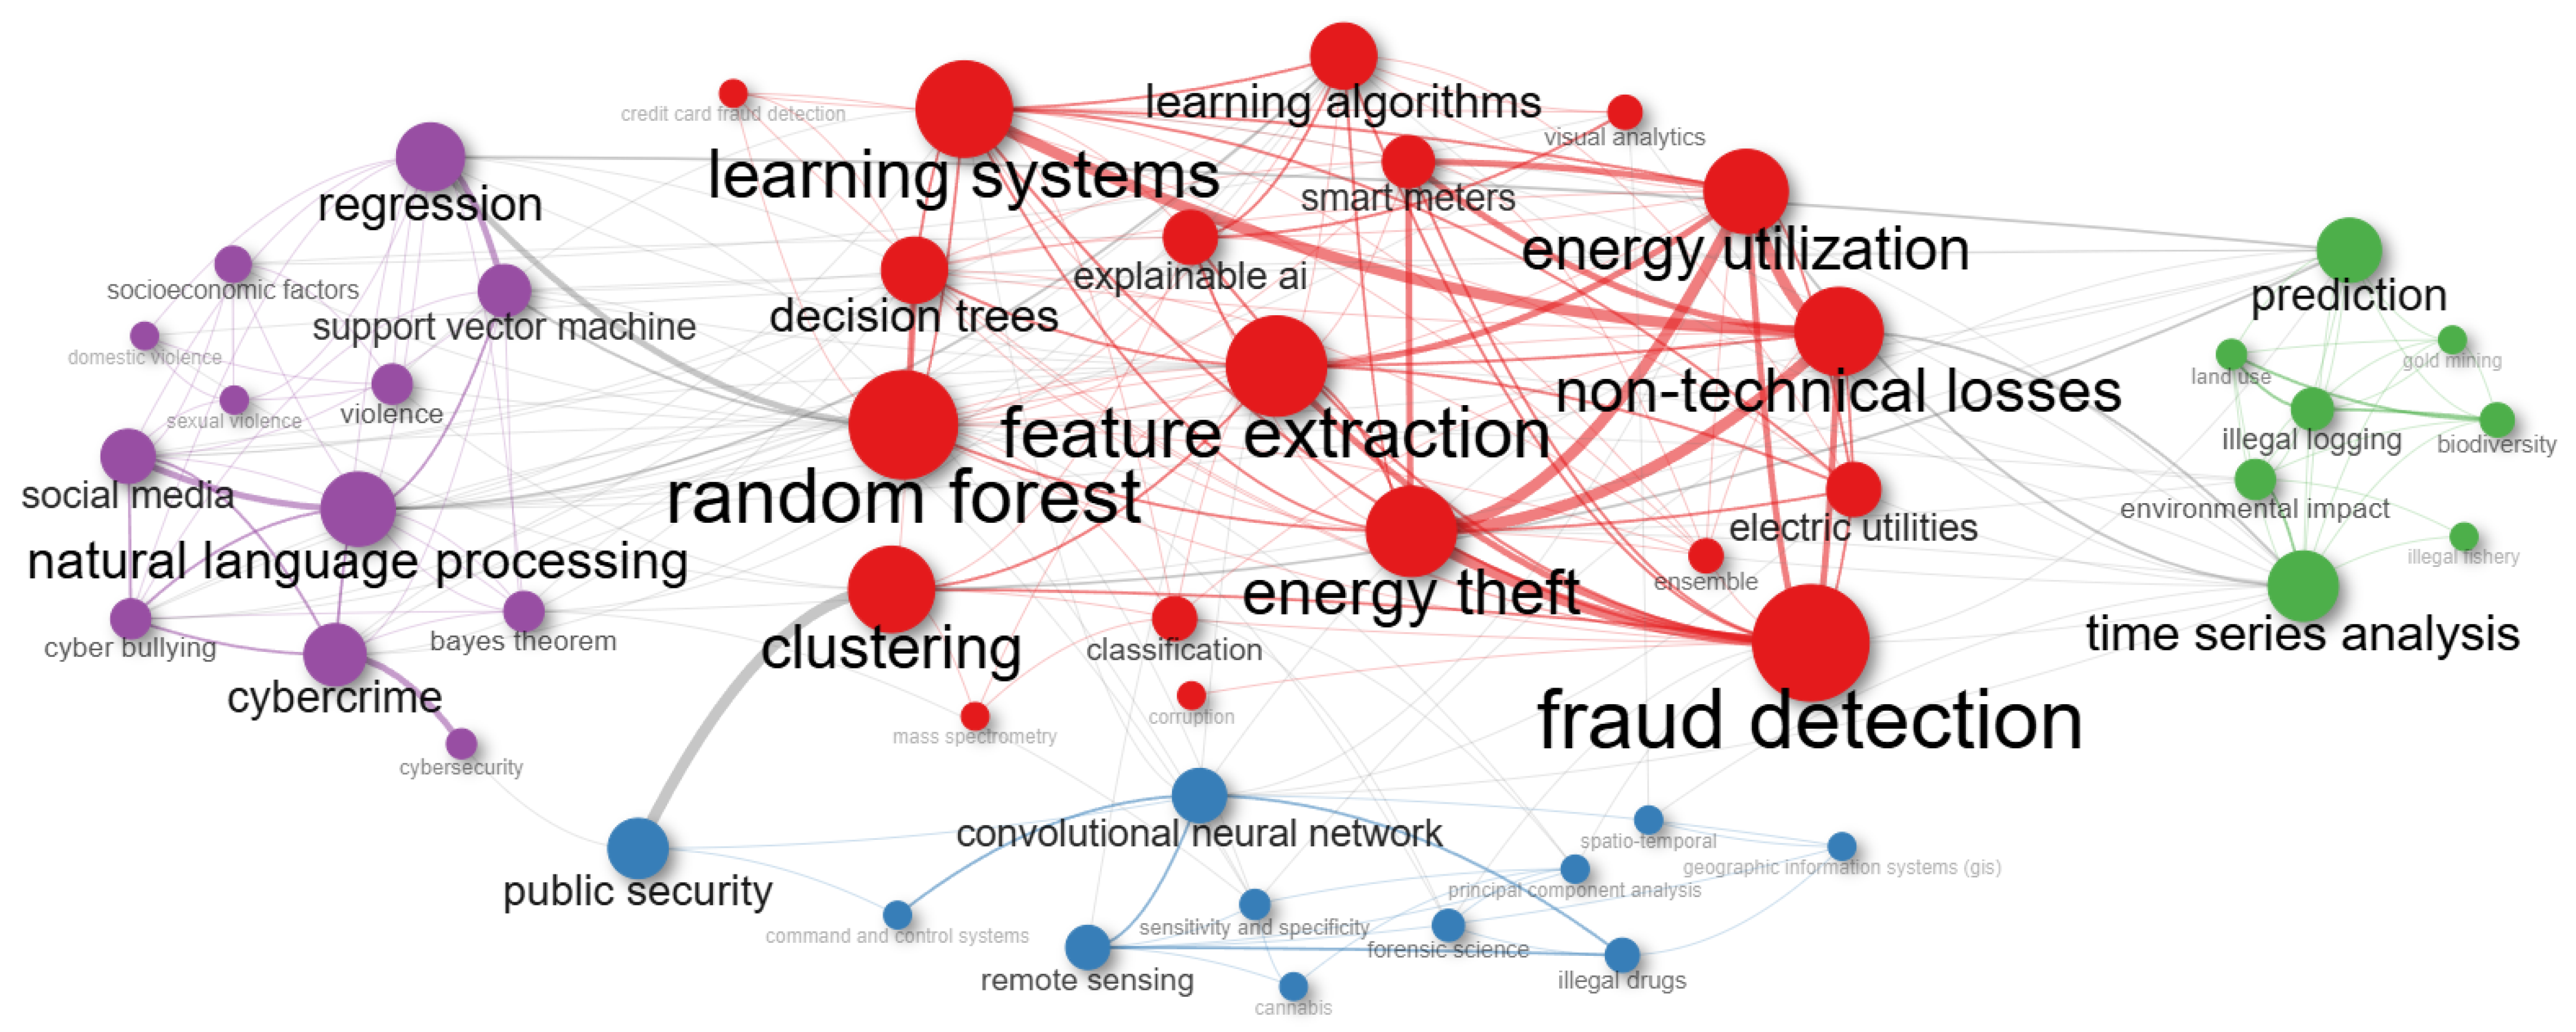
Figure 7 maps the co-occurrence structure of the author keywords. Node size encodes keyword frequency, and edge thickness reflects the strength of co-occurrence. Four communities are visible, each organizing a distinct segment of the literature while maintaining cross-links that mirror the multimodal focus described in the previous subsections.
  • Red community: fraud and utility analytics.
    This cluster is centered on “fraud detection”, “random forest”, “feature extraction”, and “energy theft”, with dense ties to “non-technical losses”, “electric utilities”, “energy utilization”, “smart meters”, “learning systems”, “decision trees”, “learning algorithms”, and “explainable AI”. The strongest edges connect “fraud detection” with “energy theft” and “non-technical losses”, and link “random forest” with “feature extraction” and “clustering”. A smaller satellite around “credit card fraud detection” appears attached to this community. The structure is consistent with results reported for electricity theft and fiscal or procurement analytics in the most cited studies, shown in Section 3.6.
  • Green community: environmental offenses and temporal modeling.
    Here, “time series analysis” and “prediction” anchor connections to “illegal logging”, “environmental impact”, “land use”, “biodiversity”, and “illegal fishery”. The links indicate a temporal and ecological framing of environmental crimes and align with the remote sensing applications discussed earlier. Edges from this group to the red community suggest shared modeling routines with utility and fraud topics.
  • Purple community: cyber and social platforms with classical learners.
    The terms “natural language processing”, “cybercrime”, and “social media” form a hub connected to “cyberbullying”, while methodological neighbors include “support vector machine”, “regression”, and “Bayes theorem”. Connections extend toward “violence”, “sexual violence”, “domestic violence”, and “socioeconomic factors”, indicating the joint use of text and platform data with conventional classifiers in studies of online harms and urban safety.
  • Blue community: sensing, geospatial analysis, and evaluation.
    This group contains “convolutional neural network”, “remote sensing”, “geographic information systems (GIS)”, “spatio-temporal”, “principal component analysis”, “forensic science”, “illegal drugs”, “cannabis”, and “sensitivity and specificity”. Notable cross-links tie “convolutional neural network” to “remote sensing”, and connect this community with the red cluster through “public security” and “clustering”, reflecting the transfer of vision pipelines and geospatial workflows to operational contexts.
  • Bridging terms and cross-domain ties.
    Across communities, bridging nodes include “clustering” (linking public security with fraud and metering analytics), “time series analysis” (connecting environmental offenses with predictive routines), and “feature extraction” (tying classical and deep learning streams). The overall topology reproduces the joint emphasis on ensemble learners, temporal models, and multimodal data sources as documented in the word clouds, shown in Figure 5 and Figure 6, and in the set of highly cited applications (Section 3.6).

Thematic Evolution and Trend Detection

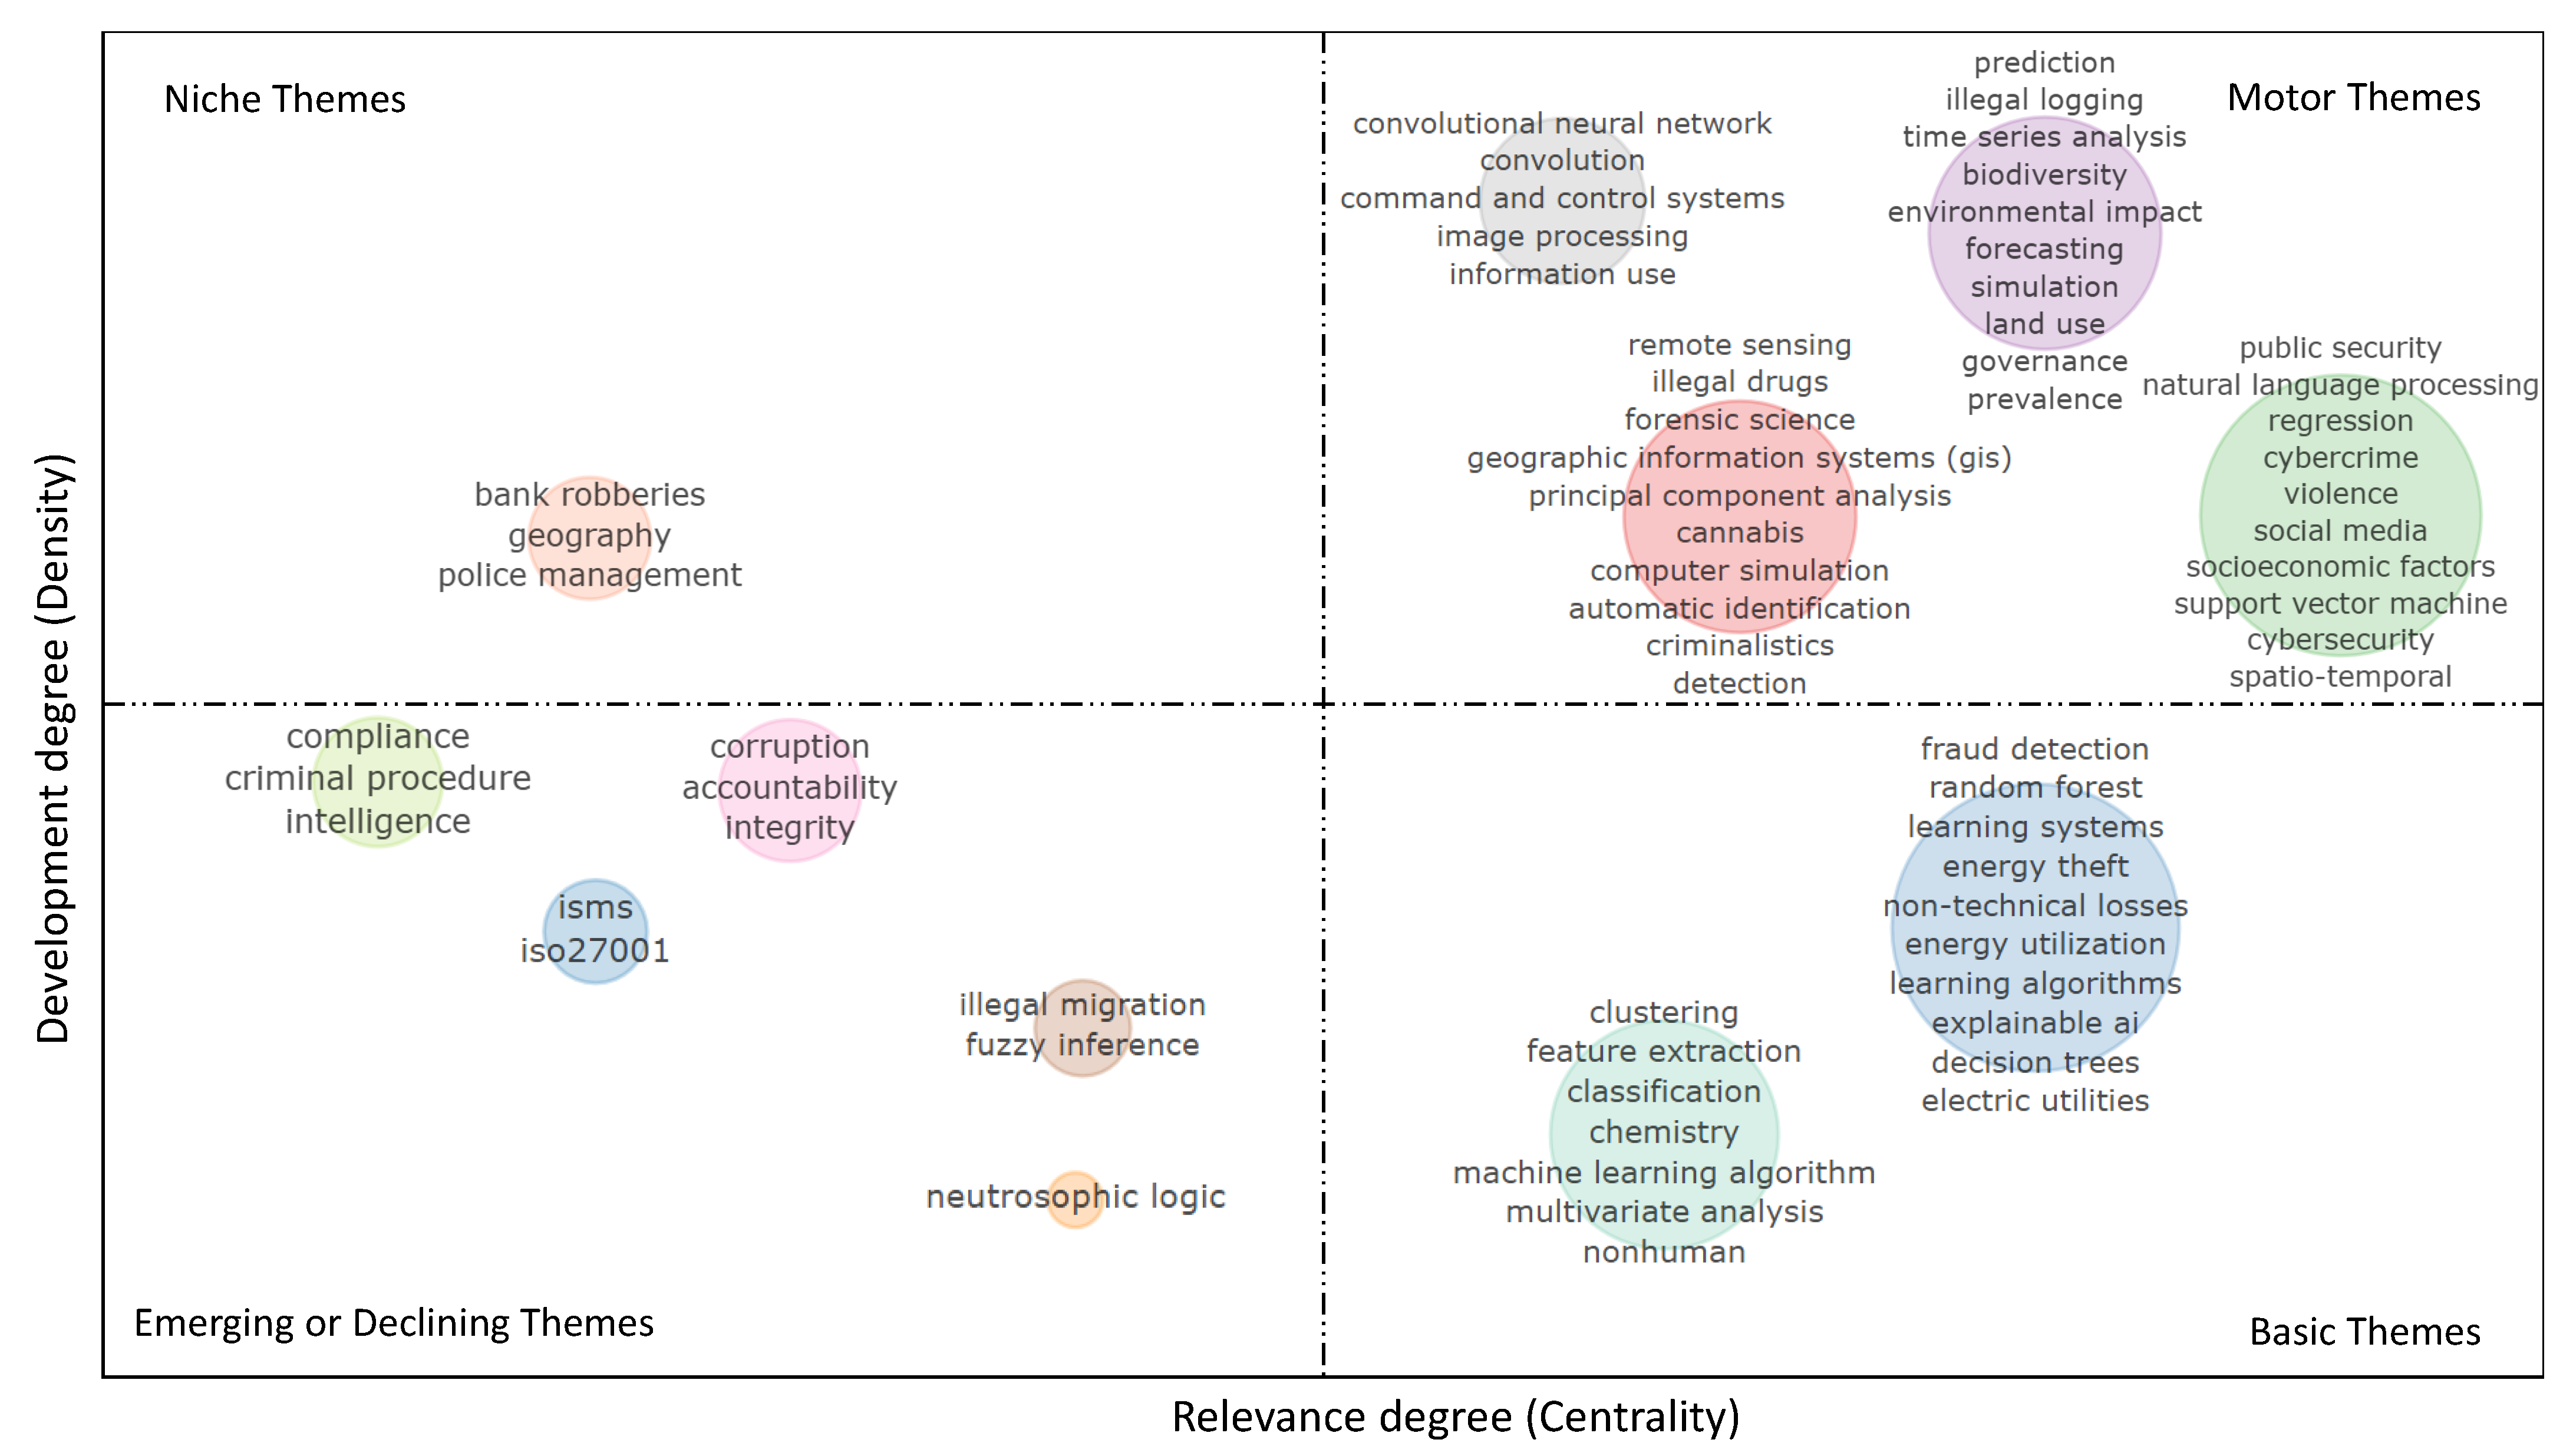
Figure 8 depicts the thematic map based on co-word clustering, where the horizontal axis encodes centrality (relevance degree) and the vertical axis encodes density (development degree). The four quadrants follow the standard interpretation: motor themes (upper right, high centrality and density), basic themes (lower right, high centrality, low density), niche themes (upper left, low centrality, high density), and emerging or declining themes (lower left, low centrality and density). In parallel with the word clouds and the co-occurrence network, the map summarizes how topics concentrate and evolve across the corpus.
  • Motor themes (upper right).
    Four clusters configure the motor area: First, the Environmental–temporal analytics: “prediction”, “illegal logging”, “time series analysis”, “biodiversity”, “environmental impact”, “forecasting”, “simulation”, “land use”, “governance”, “prevalence”. This cluster couples temporal modeling with environmental and land-use variables, echoing the prominence of environmental offenses in Figure 5 and Figure 6.
    The second cluster, Public security and platform data, encompasses terms such as: “public security”, “natural language processing”, “regression”, “cybercrime”, “violence”, “social media”, “socioeconomic factors”, “support vector machine”, “cybersecurity”, “spatio-temporal”. The latter set links text and platform data with classical learners and urban-safety variables, consistent with the purple community in Figure 7.
    The third cluster, Command–vision stack, contains: “convolutional neural network”, “convolution”, “command and control systems”, “image processing”, “information use”. These tokens represent visual computing and operational pipelines that interact with public-security tasks.
    Finally, the Fourth cluster, Remote sensing–forensics, contains terms such as: “remote sensing”, “illegal drugs”, “forensic science”, “geographic information systems (GIS)”, “principal component analysis”, “cannabis”, “computer simulation”, “automatic identification”, “criminalistics”, “detection”. This cluster assembles geospatial and forensic-imaging workflows and aligns with the blue community connected to convolutional models in Figure 7.
  • Basic themes (lower right). Two central, less self-dense clusters appear: First, the cluster Utility–fraud analytics, that encompasses: “fraud detection”, “random forest”, “learning systems”, “energy theft”, “non-technical losses”, “energy utilization”, “learning algorithms”, “explainable AI”, “decision trees”, “electric utilities”. This vocabulary corresponds to the red community in Figure 7 and to the electricity-theft and fiscal-procurement applications discussed in Section 3.6.
    The second cluster in this quadrant, Reusable workflows, contains terms such as: “clustering”, “feature extraction”, “classification”, “chemistry”, “machine learning algorithm”, “multivariate analysis”, “nonhuman”. These tokens describe widely used routines that feed multiple domains.
  • Niche themes (upper left).
    A compact operational cluster includes “bank robberies”, “geography”, and “police management”. Its high density and low centrality indicate focused studies with limited diffusion to other themes.
  • Emerging or declining themes (lower left).
    Several small clusters populate this quadrant: First, Legal–organizational, such as: “compliance”, “criminal procedure”, “intelligence”. The second cluster, Security standards, encompasses: “isms”, “iso27001”. The third cluster, Integrity and oversight, contains terms such as “corruption”, “accountability”, and “integrity”. The Fourth cluster, Migration–reasoning, contains “illegal migration”, fuzzy inference. Finally, the last cluster encompasses“neutrosophic logic”.
    Their positions reflect low internal cohesion and weaker connectivity with the central blocks during the observed period.
The environmental–temporal cluster consolidates the rise of “time series analysis”, ”forecasting”, and land-use variables already visible in the word clouds. The public-security cluster integrates “natural language processing”, “social media”, and “socioeconomic factors” with “regression” and “support vector machine”, in line with the platform-oriented community in Figure 7. The utility–fraud block remains central in the basic quadrant, using “random forest”, “decision trees”, and “explainable AI” for “energy theft” and “non-technical losses”. Vision and geospatial pipelines occupy the motor area through the command–vision and remote sensing–forensics clusters. Bridging tokens such as “clustering”, “feature extraction”, and “spatio-temporal” link these areas, matching the cross-community edges observed in the co-occurrence network previously shown.

4. Discussion

This section synthesizes the temporal, geographical, institutional, methodological, and thematic evidence to interpret the observed patterns and their implications for evaluation and deployment. It opens with scope, growth, and evaluation, then connects collaboration and institutional structures with methods and themes, before turning to external validity and policy considerations.

4.1. Scope, Growth, and Evaluation

The temporal profile in Figure 2 shows a sustained rise in output with a marked acceleration after 2018. This inflection coincides with the diffusion of mature learning pipelines into operational domains documented in Section 3.6, including sequence models for event prediction, ensemble learners for homicide modeling, and cost-sensitive decision systems for fraud inspection. The combination of methodological consolidation and application pull appears to have broadened participation and diversified targets, with the highest yearly outputs concentrated in 2024 and 2025. In parallel, the distribution of targets reveals a substantial focus on fraud detection in utilities and public procurement, complemented by homicide and violence prediction, as well as environmental and narcotics detection. Keywords Plus emphasize evaluation and study–design terms, including sensitivity and specificity, risk assessment, prevalence, and autocorrelation, which align with operational deployments and with the need to quantify trade-offs under uncertainty [61]. The presence of perception-based urban safety studies underscores cases where predictive performance must be balanced with interpretability and context, since built-environment signals and mobility patterns are city-specific and may not transfer without explicit adaptation [64]. These dynamics are consistent with global mappings that describe a predominantly technology-led literature with limited regional disaggregation [54,55] and with systematic reviews that document heterogeneous metrics and frequent risks of spatial or temporal leakage that hinder comparability [60,61]. In parallel, security reviews oriented to IoT and related platforms emphasize cyber and infrastructure protection over physical urban violence, reinforcing the need for region-specific evidence [24,58,59].

4.2. Geographies, Institutions, and Collaboration

Author affiliations in Figure 3 reveal an intense concentration in Brazil, with a second tier formed by Colombia, Chile, Mexico, Ecuador, and Peru. The country-level indicators, under both full and fractional counting, in Table 1 are consistent with this pattern: Brazil retains the largest contribution, and the same group of countries concentrates most of the remaining regional output. The collaboration network in Figure 4 mirrors these distributions: Brazil operates as the principal connector within Latin America and toward extra-regional partners, while Colombia emerges as an additional hub with transatlantic links. These structures suggest that capacity building and shared data infrastructures in a limited set of countries channel a substantial portion of regional research.
Under both full and fractional counting, the participation of the United States and Spain as frequent partners indicates sustained external bridges that facilitate methodological transfer and joint infrastructure, while potentially reinforcing the centrality of already active nodes. At the institutional level, recurrent contributors in Brazil, Mexico, Colombia, Chile, Ecuador, and Peru align with these country patterns, as summarised in Table 2, where full and fractional indicators highlight a similar concentration in a relatively small set of organisations. Such concentration can accelerate methodological depth and tool reuse, but it may also shape topic selection through data availability, regulatory settings, and sectoral priorities. Underrepresented countries are therefore more likely to be associated with gaps in the evidence base, particularly for city-specific determinants of crime, where local data and institutional partnerships are critical. This concentration pattern is consistent with global overviews that report geographically uneven participation and a strong emphasis on computer science venues [54,55].

4.3. Methods and Thematic Structure

The most cited studies combine deep learning, ensemble methods, Bayesian modeling, and graph-based analytics. Results point to three recurrent methodological motifs. First, predictive pipelines that exploit temporal dependence, such as recurrent architectures for emergency events, align with the prominence of time series analysis in thematic structures. Second, robust tree ensembles and cost-sensitive decision rules address class imbalance and heterogeneous error costs, which are typical in fraud inspection and utility losses. Third, multimodal integration connects remote sensing, computer vision, and structured administrative data, enabling applications that range from environmental offenses to procurement oversight. These motifs explain the shared core observed in the word clouds and the co-occurrence map, where supervised and unsupervised routines, feature extraction, and spatio-temporal modeling operate as reusable building blocks [61,64], in line with broader technical surveys that highlight GIS, computer vision, and deep learning as convergent pillars [45,58].
Consistent with these patterns, the co-occurrence network and the thematic map, as shown in Figure 7 and Figure 8, converge on four well–defined communities that match the dominant application families in the most cited set: utility and fiscal fraud; environmental offenses with temporal modeling; cyber and platform-based analytics; and sensing, geospatial, and forensic workflows. Bridging tokens such as clustering, feature extraction, and spatio-temporal link these communities and indicate potential for transfer learning and shared evaluation practices. This structure suggests that advances in representation learning, cross-domain regularization, and sequence modeling can propagate across domains with similar statistical constraints, for example, when inspection costs and class imbalance are salient or when spatial autocorrelation is non-negligible. The need to standardize evaluation choices and to prevent spatial or temporal leakage in these transferable pipelines is consistent with recommendations from methodological reviews [60,61].
Beyond the four dominant families, niche themes such as “bank robberies”, “geography”, and “police management” remain dense but peripheral, suggesting focused operational literatures with limited cross–domain diffusion. Emerging or declining clusters around “compliance”, “criminal procedure”, “integrity”, “ISO 27001/ISMS” [79], “illegal migration”, and “logic–based reasoning” (e.g., “fuzzy” and “neutrosophic”) exhibit low centrality and cohesion, indicating either early consolidation stages or topic retraction. Adjacent bibliometric lines on economic and white-collar crime are predominantly global and single-index, which helps explain their peripheral coupling to the regional thematic core [67,68]. Tracking these quadrants across time slices, as displayed in Figure 8, would clarify maturation paths and inform targeted capacity building.

4.4. External Validity and Operational Uptake

Several highly cited studies highlight that determinants of crime are contingent on local dynamics. The multi-city analysis with Bayesian spatial models shows that mobility and density can outweigh standard socioeconomic indicators in specific contexts, while ensemble learners trained on nationwide indicators deliver strong predictive fits that require careful interpretation of variable importance. Taken together with the modular thematic structure observed in this review, two implications follow: models should incorporate mechanisms for domain adaptation and spatial dependence, and cross-city comparisons should report design choices, target definitions, and data vintages to facilitate cautious synthesis. These imperatives align with prior reviews that call for explicit controls against spatio-temporal leakage, realistic validation settings, and transparent reporting of evaluation protocols [60,61].
On the operational side, applications in energy theft, procurement integrity, and environmental monitoring rely on administrative, sensor, and remote-sensing data streams. The diversity and access conditions of the underlying data sources used across the corpus are summarized in Appendix B, which supports replication, secondary analyses, and the design of interoperable data infrastructures for public safety analytics. Where structured records and inspection workflows exist, cost-sensitive and decision-support approaches are prominent; where imagery and spectral data are available, segmentation and classification pipelines dominate. Scaling evidence to new jurisdictions will therefore depend on data integration agreements, metadata standards, and routine reporting that preserve comparability across agencies, alongside monitoring for calibration, drift, and equity impacts [61]. The prevalence of platform-centric and infrastructure-centric security pipelines in global surveys further underscores the importance of governance and interoperability when transferring systems to Latin American contexts [24,58,59]. Finally, the persistence of single-city designs with narrow contextual variables in regional case studies reinforces the need for multi-city validation and careful external validity assessments [64,66].

4.5. Policy Implications

The regional evidence base supports several policy–relevant insights. Cost-sensitive inspection can improve resource allocation under budget constraints in utilities and procurement oversight. Spatial and temporal modeling can inform targeted prevention where mobility and density concentrate risk. Vision and spectral analytics can augment monitoring in environmental and narcotics enforcement. These implications depend on local data quality and governance safeguards; policy design should pair analytical deployment with documentation of data provenance, evaluation transparency, and mechanisms for periodic recalibration, anticipating model updating and audit requirements. In line with prior technical and security reviews, governance frameworks should explicitly address interoperability, privacy, and accountability requirements for operational analytics [24,59,60,61].
For decision makers, the evidence map provided by this review can be used in at least three concrete ways. First, it helps ministries, municipal governments, utilities, and prosecution offices identify which AI-crime application families (for example, cost-sensitive fraud inspection or spatio-temporal hotspot forecasting) are already supported by multi-site empirical evidence and more mature evaluation practices, and which domains remain exploratory. Second, it offers a set of evaluation and governance expectations—such as controls for spatial and temporal leakage, calibration and cost-sensitive metrics, and basic fairness and accountability checks—that can be translated into procurement requirements, regulatory guidelines, and audit checklists when commissioning or overseeing AI systems for public safety. Third, by highlighting geographic, thematic, and fairness-reporting gaps, the map can inform the design of national and regional research agendas, funding calls, and data-sharing agreements that strategically expand the current evidence base rather than duplicating existing efforts.

4.6. Limitations

This review prioritizes transparency and reproducibility, yet several constraints bound coverage, measurement, and interpretation.
  • Sampling frame and retrieval: The corpus relies on Scopus and Web of Science, queried in TITLE-ABS-KEY (Scopus) and TS (WoS), with a Latin America filter based on country and regional terms. Studies conducted in the region that do not surface geography in the title, abstract, or keywords may have been missed, while items with Latin American tokens but a peripheral regional focus may have been included. The window extends to October 2025; indexing lags and partial-year coverage can undercount the most recent period. Language criteria excluded French, Italian, and Chinese records, reducing heterogeneity. Restricting the corpus to English, Spanish, and Portuguese may underrepresent strands that publish in French, Italian, or Chinese—particularly in environmental crime and cybercrime—potentially skewing topic salience toward venues indexed in EN/ES/PT. Conference papers and reviews were excluded to focus on peer-reviewed journal articles, which may underrepresent the fast-moving technical advances common in computer science venues.
    A further limitation concerns the validation of the review protocol. The search strategy, screening rules, and analytical pipeline were designed and iteratively refined within the author team, following PRISMA guidance for study identification and selection. To enhance transparency, we provide a PRISMA-style flow diagram and an appendix detailing the exact Boolean search strings, database-specific filters, export formats, and search dates. Additionally, we offer public access to the curated bibliometric database via the data availability statement. However, we did not conduct a formal multi-round external consultation (for example, a Delphi-style process) with domain experts in criminology, policing, or legal studies to review and refine the protocol. Future updates of this review could incorporate structured expert feedback to further strengthen the design, coverage decisions, and interpretation of the evidence map.
  • Indicators, normalization, and citation windows: Citation-based indicators were taken as reported at retrieval time. Beyond citations per year, no field or year normalization was applied, and self-citations were not removed. Quartile labels vary by database, subject category, and year, introducing uncertainty when comparing sources; prominence rankings should therefore be read as indicative. Heterogeneous citation windows and early-view items introduce time-since-publication biases that favor earlier papers.
  • Text and network construction: Keyword curation removed query terms, generic descriptors, and high-level methodological labels to avoid artificial centrality inflation, which can attenuate the apparent prominence of core AI terms. Cross-language lemmatization and synonymy (e.g., “smart meters” vs. “advanced metering infrastructures”) were not exhaustively harmonized, leaving residual fragmentation. Co-authorship (country-level) and co-occurrence networks were computed in bibliometrix/Biblioshiny using full counting, which favors larger teams and prolific institutions. Community detection used the Walktrap algorithm with Automatic layout; partitions and centrality rankings are sensitive to algorithm choice, edge weighting, and low-weight pruning. The results represent a consistent specification rather than a unique ground truth.
  • Geography, attribution, and evidence synthesis Geographical analyses use author affiliations rather than study sites; affiliations can overrepresent host countries relative to where data were generated or interventions occurred. Multi-affiliated authors and large teams inflate counts under full counting, and no normalization by population, research expenditure, or higher-education capacity was applied, so cross-country contrasts are descriptive. Author and affiliation disambiguation were not manually curated, allowing homonyms and institutional variants to inflate or fragment counts. Summaries of highly cited studies rely on reported metrics and validation protocols, which were not re-estimated. Additionally, heterogeneous reporting (e.g., accuracy vs. error metrics) limits comparability. No formal quality appraisal or risk-of-bias assessment was conducted. The analysis identifies patterns in topics, venues, and collaborations but does not establish causal drivers; inferences about operational impact, fairness, accountability, and robustness remain limited because these dimensions are inconsistently reported and are not captured by bibliometric indicators.

4.7. Future Perspectives

  • Broadening and normalising the evidence base: Given the acceleration of output and the concentration of productive hubs, the field would benefit from a living review that periodically expands beyond Scopus and Web of Science. Future iterations should incorporate conference proceedings in computer science and information systems, regional journals with limited indexation, and grey literature from agencies and civil society. Multilingual retrieval and targeted country or city queries can reduce undercoverage. At the analytic level, extending the use of fractional counting of affiliations beyond the country-level indicators reported here, together with field- and year-normalised citation metrics and sensitivity analyses across community detection specifications, would further strengthen robustness. Dynamic, time-sliced network analyses can track the emergence, consolidation, and decline of themes and collaborations over time. Open benchmarks with transparent splits and clearly defined targets for utility or fiscal fraud, environmental offenses, cyber or platform harms, and sensing-driven forensics should include datasheets, model cards, reproducible code, documented preprocessing, compute budgets, and shared protocols for spatio-temporal cross-validation and geospatial leakage control.
  • Data governance and interoperable infrastructure: The dominance of applications that rely on administrative, sensor, and remote sensing streams points to the need for interoperable infrastructures. Regional stakeholders can converge on shared metadata standards and ontologies for public safety, utilities, and procurement, adopt open contracting data specifications for integrity analytics, and publish geospatial assets with discoverable catalogues. FAIR principles, lineage documentation, and routine data quality reports should be institutionalised. Because many use cases involve sensitive information, privacy-preserving machine learning, including federated learning, secure multi-party computation, and differential privacy, should enable cross-agency collaboration without exposing individual-level records.
  • Methods under operational constraints: Transferable routines should become explicitly adaptive, causal, and aware of uncertainty. Priorities include: domain adaptation and transfer learning for spatio-temporal settings with hierarchical pooling and graph-based learners that encode spatial dependence; the integration of causal inference and decision-focused learning using designs such as difference in differences, synthetic controls, and instrumental variable strategies combined with machine learning; and operational monitoring with full calibration, drift detection, and reporting of cost-sensitive and utility-based metrics alongside conventional accuracy measures to reflect resource and equity trade-offs.
  • Responsible, auditable deployment and regional capacity: Operational uptake in utilities and procurement should be matched with governance safeguards. Agencies and research partners should implement pre-deployment impact assessments, participatory design with affected communities, and recurring fairness and robustness audits. Multi-objective optimisation that balances effectiveness, equity, privacy, and cost is essential, supported by audit trails, versioning, and periodic model revalidation. The collaboration structure detected here can support regional consortia for training, shared compute, and mobility programmes. South–south partnerships can diversify evidence and reduce overreliance on a small set of hubs. On the policy front, staged pilots with explicit counterfactual evaluation, including randomised and quasi-experimental designs where feasible, can connect analytic gains to measurable social outcomes. Cross-border data agreements for environmental and financial crimes, with harmonised metadata, would support investigations that exceed national boundaries.

5. Conclusions

The present review provides a systematic, PRISMA-aligned synthesis of 146 journal articles on artificial intelligence and crime in Latin America published between 2010 and October 2025. The evidence shows a clear inflection after 2018 and a peak activity in 2024–2025, indicating rapid consolidation and operational uptake. Geographically, production is concentrated in Brazil, with a second tier in Colombia, Chile, Mexico, Ecuador, and Peru, and sustained extra-regional bridges to the United States and Spain. The international network is multi-hub, suggesting that a small set of countries and institutions act as conduits for methods, data, and infrastructure.
Across studies, three methodological motifs recur and underpin the thematic structure. First, temporal dependence is systematically exploited through sequence models and time series analysis. Second, ensemble learners and cost-sensitive decision rules address class imbalance and heterogeneous error costs typical of inspection and enforcement settings. Third, multimodal integration links remote sensing and computer vision with administrative and transactional data. These routines correspond to four dominant application families revealed by co-word networks and thematic maps: utility and fiscal fraud analytics, environmental offenses with temporal modeling, cyber and platform-based harms, and sensing–geospatial–forensic workflows. Bridging tokens, such as clustering, feature extraction, and spatio-temporal representations, explain transfer potential across domains with similar statistical constraints.
The corpus also documents operationally salient targets. Energy theft, procurement integrity, and environmental monitoring focus on areas where sensor and administrative streams are available, while studies on homicide and safety perception highlight the need to balance predictive performance with contextual interpretation. At the same time, fairness, accountability, and transparency are not yet central descriptors in the thematic landscape, and geographical participation remains uneven, limiting the external validity and generalizability of policy conclusions.
The following three implications are given. First, scaling evidence responsibly requires interoperable data governance, including shared metadata standards, discoverable geospatial assets, and privacy-preserving collaboration. Second, methodological development should prioritize domain adaptation and spatial dependence, decision-focused and causal designs, and routine calibration and drift monitoring, with reporting that reflects resource and equity trade-offs. Third, reproducibility and comparability would be strengthened by open benchmarks with transparent splits, leakage-controlled geospatial evaluation, model cards, and datasheets, supported by regional consortia that broaden participation and capabilities.
In sum, research on artificial intelligence and crime in Latin America has moved from isolated proofs of concept to a modular ecosystem organized around transferable learning routines and data-driven governance tasks. Consolidating this progress will depend on widening the geographical base, formalizing evaluation standards, and embedding auditable safeguards so that analytic gains translate into preventive, equitable, and accountable public safety outcomes.

Supplementary Materials

The following supporting information can be downloaded at: https://www.mdpi.com/article/10.3390/info16111001/s1, File S1: Bibliometric corpus used in this study. This file lists all records included in the review and the key metadata fields used in the quantitative and network analyses. As this is a bibliometric mapping, these documents are treated as corpus data; only the subset explicitly analysed in the Results and Discussion is cited in the main text and included in the reference list.

Author Contributions

Conceptualization, F.D. and N.C.; methodology, F.D.; software, F.D. and N.C.; validation, N.C. and R.L.; formal analysis, F.D., and N.C.; investigation, F.D., and N.C.; writing—original draft preparation, F.D., R.L., and N.C.; writing—review and editing, F.D.; supervision, F.D. All authors have read and agreed to the published version of the manuscript.

Funding

This research received no external funding.

Institutional Review Board Statement

Not applicable.

Informed Consent Statement

Not applicable.

Data Availability Statement

The data presented in this study are included in the Supplementary Material. Further inquiries can be directed to the corresponding author.

Conflicts of Interest

The authors declare no conflicts of interest.

Appendix A. Search Equations by Database

Appendix A.1. Scopus

TITLE-ABS-KEY ( (“artificial intelligence” OR “intelligent system*” OR “AI system*” OR “machine learning” OR “supervised learning” OR “unsupervised learning” OR “reinforcement learning” OR “deep learning” OR “artificial neural network*” OR “ANN” OR “convolutional neural network*” OR “recurrent neural network*” OR “graph neural network*” OR “data mining” OR “pattern recognition” OR “computational intelligence”) AND (crime OR crimes OR criminal* OR offense* OR “criminal activity” OR “law enforcement” OR “crime prediction” OR “crime forecasting” OR “crime detection” OR “crime prevention” OR “predictive policing” OR “crime mapping” OR “crime hotspot*” OR “hotspot policing”) AND (“Latin America” OR “South America” OR “Central America” OR “Peru” OR Peruvi* OR “Chile” OR Chilean* OR “Mexico” OR Mexican* OR “Argentina” OR Argentin* OR “Ecuador” OR Ecuadorian* OR “Colombia” OR Colombian* OR “Bolivia” OR Bolivian* OR “Uruguay” OR Uruguayan* OR “Paraguay” OR Paraguayan* OR “Venezuela” OR Venezuel* OR “Brazil” OR Brasil* OR Brazilian* OR “Costa Rica” OR “El Salvador” OR “Guatemala” OR “Honduras” OR “Nicaragua” OR “Panama” OR “Cuba” OR “Dominican Republic” OR “Haiti”) )

Appendix A.2. Web of Science

TS = ( (“artificial intelligence” OR “intelligent system*” OR “AI system*” OR “machine learning” OR “supervised learning” OR “unsupervised learning” OR “reinforcement learning” OR “deep learning” OR “artificial neural network*” OR “ANN” OR “convolutional neural network*” OR “recurrent neural network*” OR “graph neural network*” OR “data mining” OR ”pattern recognition” OR “computational intelligence”) AND (crime OR crimes OR criminal* OR offense* OR “criminal activity” OR “law enforcement” OR ”crime prediction” OR “crime forecasting” OR “crime detection” OR “crime prevention” OR “predictive policing” OR “crime mapping” OR “crime hotspot*” OR “hotspot policing”) AND (“Latin America” OR “South America” OR “Central America” OR “Peru” OR Peruvi* OR “Chile” OR Chilean* OR “Mexico” OR Mexican* OR “Argentina” OR Argentin* OR “Ecuador” OR Ecuadorian* OR “Colombia” OR Colombian* OR “Bolivia” OR Bolivian* OR “Uruguay” OR Uruguayan* OR “Paraguay” OR Paraguayan* OR “Venezuela” OR Venezuel* OR “Brazil” OR Brasil* OR Brazilian* OR “Costa Rica” OR “El Salvador” OR “Guatemala” OR “Honduras” OR “Nicaragua” OR “Panama” OR “Cuba” OR “Dominican Republic” OR “Haiti”) )

Appendix B. Data Sources

Table A1. Representative data sources used in the AI–crime studies reviewed.
DatabaseNatureURL (Accessed on 10 November 2025)
UCI Machine Learning Repository–Communities and CrimePublichttps://archive.ics.uci.edu/ml/datasets/communities+and+crime
Chicago Crime Data PortalPublichttps://data.cityofchicago.org/Public-Safety/Crimes-2001-to-Present/ijzp-q8t2
Twitter/X APIPrivate (public API)https://developer.twitter.com/
SIEDCO (Colombia)Public (restricted access)https://www.policia.gov.co/estadisticas-delictivas
CPFL Energia (Brazil)Private (company)https://www.cpfl.com.br/
Carabineros de Chile–StatisticsPublichttps://www.carabineros.cl/
Contraloría General de la República (Brazil)Publichttps://www.gov.br/cgu/pt-br
Fiscalía General de la Nación (Colombia)Public (partial)https://www.fiscalia.gov.co/colombia/
Policía Nacional de GuatemalaPublic (restricted access)https://www.pnc.gob.gt/
UTE UruguayPrivate (state-owned company)https://portal.ute.com.uy/
Kaggle Crime DatasetsPublichttps://www.kaggle.com/datasets
San Francisco Crime DataPublichttps://datasf.org/opendata/
Policía Nacional de Colombia–StatisticsPublichttps://www.policia.gov.co/estadisticas-delictivas
Datos Abiertos ColombiaPublichttps://www.datos.gov.co/
INEGI–MexicoPublichttps://www.inegi.org.mx/
NYC Open Data–CrimePublichttps://opendata.cityofnewyork.us/
Sistema de Informações Criminais (Brazil)Public (partial)https://www.gov.br/mj/pt-br
IBGE–Instituto Brasileiro de Geografia e EstatísticaPublichttps://www.ibge.gov.br/
Datos Abiertos ChilePublichttps://datos.gob.cl/
Datos Abiertos MéxicoPublichttps://datos.gob.mx/
World Bank Open DataPublichttps://data.worldbank.org/
UNODC–United Nations Office on Drugs and CrimePublichttps://www.unodc.org/unodc/en/data-and-analysis/index.html
GitHubPublichttps://github.com/
JusBrasilPublichttps://www.jusbrasil.com.br/

References

  1. Bommasani, R.; Arora, S.; Chayes, J.; Choi, Y.; Cuéllar, M.-F.; Li, F.-F.; Ho, D.E.; Jurafsky, D.; Koyejo, S.; Lakkaraju, H.; et al. Advancing science- and evidence-based AI policy. Science 2025, 389, 459–461. [Google Scholar] [CrossRef]
  2. Ha, N.; Xu, K.; Ren, G.; Mitchell, A.; Ou, J.Z. Machine Learning-Enabled Smart Sensor Systems. Adv. Intell. Syst. 2020, 2, 2000063. [Google Scholar] [CrossRef]
  3. Montasari, R. (Ed.) Artificial Intelligence and National Security; Springer: Cham, Switzerland, 2022. [Google Scholar] [CrossRef]
  4. Chen, M.; Claramunt, C.; Çöltekin, A.; Liu, X.; Peng, P.; Robinson, A.C.; Wang, D.; Strobl, J.; Wilson, J.P.; Batty, M.; et al. Artificial intelligence and visual analytics in geographical space and cyberspace: Research opportunities and challenges. Earth-Sci. Rev. 2023, 241, 104438. [Google Scholar] [CrossRef]
  5. Gialampoukidis, I.; Andreadis, S.; Vrochidis, S.; Kompatsiaris, I. Multimodal Data Fusion of Social Media and Satellite Images for Emergency Response and Decision-Making. In Proceedings of the IGARSS 2021–2021 IEEE International Geoscience and Remote Sensing Symposium, Brussels, Belgium, 11–16 July 2021; IEEE: Piscataway, NJ, USA, 2021; pp. 228–231. [Google Scholar] [CrossRef]
  6. Aldemir, C.; Uçma Uysal, T. Artificial Intelligence for Financial Accountability and Governance in the Public Sector: Strategic Opportunities and Challenges. Adm. Sci. 2025, 15, 58. [Google Scholar] [CrossRef]
  7. Allen, D.; Hubbard, S.; Lim, W.; Stanger, A.; Wagman, S.; Zalesne, K.; Omoakhalen, O. A roadmap for governing AI: Technology governance and power-sharing liberalism. AI Ethics 2025, 5, 3355–3377. [Google Scholar] [CrossRef]
  8. Dwivedi, Y.K.; Hughes, L.; Ismagilova, E.; Aarts, G.; Coombs, C.; Crick, T.; Duan, Y.; Dwivedi, R.; Janssen, M. Artificial Intelligence (AI): Multidisciplinary perspectives on emerging challenges, opportunities, and agenda for research, practice and policy. Int. J. Inf. Manag. 2021, 57, 101994. [Google Scholar] [CrossRef]
  9. Misra, S.K.; Das, S.; Gupta, S.; Sharma, S.K. Public Policy and Regulatory Challenges of Artificial Intelligence (AI). In Re-Imagining Diffusion and Adoption of Information Technology and Systems: A Continuing Conversation; IFIP Advances in Information and Communication Technology; Sharma, S.K., Dwivedi, Y.K., Metri, B., Rana, N.P., Eds.; Springer: Cham, Switzerland, 2020; Volume 617, pp. 100–111. [Google Scholar] [CrossRef]
  10. Pires, S.F.; Guerette, R.T.; Stubbert, C.H. The Crime Triangle of Kidnapping for Ransom Incidents in Colombia, South America: A ‘Litmus’ Test for Situational Crime Prevention. Br. J. Criminol. 2014, 54, 784–808. [Google Scholar] [CrossRef]
  11. Stubbert, C.H.; Pires, S.F.; Guerette, R.T. Crime science and crime epidemics in developing countries: A reflection on kidnapping for ransom in Colombia, South America. Crime Sci. 2015, 4, 23. [Google Scholar] [CrossRef]
  12. Jaitman, L. Frontiers in the economics of crime: Lessons for Latin America and the Caribbean. Lat. Am. Econ. Rev. 2019, 28, 19. [Google Scholar] [CrossRef]
  13. Müller, M.-M. Governing crime and violence in Latin America. Glob. Crime 2018, 19, 171–191. [Google Scholar] [CrossRef]
  14. Quirós, L. Environmental Crimes in South America: The Pervasive Nexus Between Organized Crime and Land Trafficking. In Transnational Unconventional Organized Crime: A National and Global Security Concern. Volume II: Regional and National Perspectives; Advanced Sciences and Technologies for Security Applications Series; Kaunert, C., Léonard, S., Masys, A.J., Eds.; Springer: Cham, Switzerland, 2025; pp. 107–122. [Google Scholar] [CrossRef]
  15. United Nations Office on Drugs and Crime. Global Study on Homicide 2013: Trends, Contexts, Data; United Nations Office on Drugs and Crime: Vienna, Austria, 2014; Available online: https://www.unodc.org/documents/data-and-analysis/statistics/GSH2013/2014_GLOBAL_HOMICIDE_BOOK_web.pdf (accessed on 8 November 2025).
  16. Alvarado, N.; Muggah, R. Crime and Violence: Obstacles to Development in Latin American and Caribbean Cities; Inter-American Development Bank: Washington, DC, USA, 2018; IDB-DP-644; Available online: https://publications.iadb.org/publications/english/document/Crime_and_Violence_Obstacles_to_Development_in_Latin_American_and_Caribbean_Cities_en.pdf (accessed on 8 November 2025).
  17. Pan American Health Organization. Homicide Mortality in Total Population and in Children Under 18 Years of Age in the Region of the Americas; ENLACE Data Portal, Pan American Health Organization: Washington, DC, USA, 2021; Estimates Based on WHO Global Health Estimates 2000–2019; Available online: https://www.paho.org/en/enlace/homicide-mortality (accessed on 8 November 2025).
  18. Gelvez, J.D. Predicting police and military violence: Evidence from Colombia and Mexico using machine learning models. Humanit. Soc. Sci. Commun. 2025, 12, 765. [Google Scholar] [CrossRef]
  19. Ordoñez-Eraso, H.-A.; Pardo-Calvache, C.-J.; Cobos-Lozada, C.-A. Detección de tendencias de homicidios en Colombia usando Machine Learning. Rev. Fac. Ing. 2020, 29, e11740. [Google Scholar] [CrossRef]
  20. Fontalvo Herrera, T.J.; Vega Hernández, M.A.; Mejía Zambrano, F. Método de clustering e inteligencia artificial para clasificar y proyectar delitos violentos en Colombia. Rev. CientíFica Gen. José MaríA CóRdova 2023, 21, 551–572. [Google Scholar] [CrossRef]
  21. Knoblauch, S.; Muthusamy, R.K.; Moritz, M.; Kang, Y.; Li, H.; Lautenbach, S.; Pereira, R.H.M.; Biljecki, F.; Gonzalez, M.C.; Barbosa, R.; et al. Crime-associated inequality in geographical access to education: Insights from the municipality of Rio de Janeiro. Cities 2025, 160, 105818. [Google Scholar] [CrossRef]
  22. Lira Cortes, A.L.; Fuentes Silva, C. Artificial Intelligence Models for Crime Prediction in Urban Spaces. Mach. Learn. Appl. Int. J. (MLAIJ) 2021, 8. Available online: https://ssrn.com/abstract=3822346 (accessed on 8 November 2025). [CrossRef]
  23. Dodds, T.; Chengyuan, L. The hidden threat of Argentina’s AI policing. AI Soc. 2025, 40, 5577–5578. [Google Scholar] [CrossRef]
  24. Simisterra-Batallas, C.; Pico-Valencia, P.; Sayago-Heredia, J.; Quiñónez-Ku, X. Internet of Things and Deep Learning for Citizen Security: A Systematic Literature Review on Violence and Crime. Future Internet 2025, 17, 159. [Google Scholar] [CrossRef]
  25. Elfversson, E.; Höglund, K.; Muvumba Sellström, A.; Pellerin, C. Contesting the growing city? Forms of urban growth and consequences for communal violence. Political Geogr. 2023, 100, 102810. [Google Scholar] [CrossRef]
  26. Loja, P.S.; Heras, W.M.; Mendoza, C.A. Amenities and crime: What is the association of amenities with crime in urban areas of Cuenca, Ecuador? Reg. Sci. Policy Pract. 2024, 16, 100062. [Google Scholar] [CrossRef]
  27. De Nadai, M.; Xu, Y.; Letouzé, E.; González, M.C.; Lepri, B. Socio-economic, built environment, and mobility conditions associated with crime: A study of multiple cities. Sci. Rep. 2020, 10, 13871. [Google Scholar] [CrossRef]
  28. Shiode, N.; Shiode, S.; Inoue, R. Measuring the colocation of crime hotspots. GeoJournal 2023, 88, 3307–3322. [Google Scholar] [CrossRef]
  29. Finnegan, J.C.; Masys, A.J. An Epidemiological Framework for Investigating Organized Crime and Terrorist Networks. In Science Informed Policing; Advanced Sciences and Technologies for Security Applications Series; Fox, B., Reid, J.A., Masys, A.J., Eds.; Springer: Cham, Switzerland, 2020; pp. 19–37. [Google Scholar] [CrossRef]
  30. Madikeri, S.; Motlicek, P.; Sanchez-Cortes, D.; Rangappa, P.; Hughes, J.; Tkaczuk, J.; Sanchez Lara, A.; Khalil, D.; Rohdin, J.; Zhu, D.; et al. Autocrime—Open multimodal platform for combating organized crime. Forensic Sci. Int. Digit. Investig. 2025, 54, 301937. [Google Scholar] [CrossRef]
  31. Hassan, S.-U.; Shabbir, M.; Iqbal, S.; Said, A.; Kamiran, F.; Nawaz, R.; Saif, U. Leveraging Deep Learning and SNA Approaches for Smart City Policing in the Developing World. Int. J. Inf. Manag. 2021, 56, 102045. [Google Scholar] [CrossRef]
  32. Bandpey, Z.; Piri, S.; Shokouhian, M. Integrating Machine Learning Techniques for Enhanced Safety and Crime Analysis in Maryland. Appl. Sci. 2025, 15, 4642. [Google Scholar] [CrossRef]
  33. Gandapur, M.Q. E2E-VSDL: End-to-end video surveillance-based deep learning model to detect and prevent criminal activities. Image Vis. Comput. 2022, 123, 104467. [Google Scholar] [CrossRef]
  34. Rosés, R.; Kadar, C.; Malleson, N. A data-driven agent-based simulation to predict crime patterns in an urban environment. Comput. Environ. Urban Syst. 2021, 89, 101660. [Google Scholar] [CrossRef]
  35. Castelli, M.; Sormani, R.; Trujillo, L.; Popovič, A. Predicting per capita violent crimes in urban areas: An artificial intelligence approach. J. Ambient. Intell. Humaniz. Comput. 2017, 8, 29–36. [Google Scholar] [CrossRef]
  36. Khalfa, R.; Hardyns, W. ‘Led by Intelligence’: A Scoping Review on the Experimental Evaluation of Intelligence-Led Policing. Eval. Rev. 2024, 48, 797–847. [Google Scholar] [CrossRef] [PubMed]
  37. Joseph, J. Predicting crime or perpetuating bias? The AI dilemma. AI Soc. 2025, 40, 2319–2321. [Google Scholar] [CrossRef]
  38. Malik, A.; Maciejewski, R.; Towers, S.; McCullough, S.; Ebert, D.S. Proactive Spatiotemporal Resource Allocation and Predictive Visual Analytics for Community Policing and Law Enforcement. IEEE Trans. Vis. Comput. Graph. 2014, 20, 1863–1872. [Google Scholar] [CrossRef]
  39. Sundharakumar, K.B.; Bhalaji, N.; Muthu Palaniappan, M. Spatio Temporal Modelling of Repeat Crimes and Hotspots Prediction Using Recurrent Deep Neural Networks. In Proceedings of the 2024 5th International Conference on Innovative Trends in Information Technology (ICITIIT), Kottayam, India, 15–16 March 2024; IEEE: Piscataway, NJ, USA, 2024; pp. 753–758. [Google Scholar] [CrossRef]
  40. Taha, K. Empirical and Experimental Insights into Data Mining Techniques for Crime Prediction: A Comprehensive Survey. ACM Trans. Intell. Syst. Technol. 2025, 16, 26. [Google Scholar] [CrossRef]
  41. Ribeiro, H.V.; Lopes, D.D.; Pessa, A.A.B.; Martins, A.F.; da Cunha, B.R.; Gonçalves, S.; Lenzi, E.K.; Hanley, Q.S.; Perc, M. Deep learning criminal networks. Chaos Solitons Fractals 2023, 172, 113579. [Google Scholar] [CrossRef]
  42. Alqahtany, S.S.; Syed, T.A. A Data-Driven Approach to Theft Crime Analysis: Enhancing Digital Forensics with Blockchain and Data Mining. In The 2nd International Conference on Innovation of Emerging Information and Communication Technology (ICIEICT 2024); Shaikh, A., Wiil, U.K., Alghamdi, A., Tan, Q., Eds.; Signals and Communication Technology; Springer: Cham, Switzerland, 2025; pp. 81–99. [Google Scholar] [CrossRef]
  43. İlgün, E.G.; Dener, M. Exploratory data analysis, time series analysis, crime type prediction, and trend forecasting in crime data using machine learning, deep learning, and statistical methods. Neural Comput. Appl. 2025, 37, 11773–11798. [Google Scholar] [CrossRef]
  44. Li, T.; Zhang, Y.; Zhao, J.; Zhang, H. Using Data-Mining to Solve Criminal Cases. Open Access Libr. J. 2023, 10, e09685. [Google Scholar] [CrossRef]
  45. Kaur, M.; Saini, M. Role of Artificial Intelligence in the crime prediction and pattern analysis studies published over the last decade: A scientometric analysis. Artif. Intell. Rev. 2024, 57, 202. [Google Scholar] [CrossRef]
  46. Gupta, S.K.; Shekhar, S.; Goel, N.; Saini, M. An End-to-End Framework for Dynamic Crime Profiling of Places. In Smart Cities: Concepts, Practices, and Applications; Kumar, K., Saini, G., Nguyen, D.M., Kumar, N., Shah, R., Eds.; CRC Press: Boca Raton, FL, USA, 2022. [Google Scholar] [CrossRef]
  47. Armoogum, S.; Dewi, D.A.; Armoogum, V.; Melanie, N.; Kurniawan, T.B. Unveiling Criminal Activity: A Social Media Mining Approach to Crime Prediction. J. Appl. Data Sci. 2024, 5, 1482–1494. [Google Scholar] [CrossRef]
  48. Jiang, D.; Wu, J.; Ding, F.; Ide, T.; Scheffran, J.; Helman, D.; Zhang, S.; Qian, Y.; Fu, J.; Chen, S.; et al. An integrated deep-learning and multi-level framework for understanding the behavior of terrorist groups. Heliyon 2023, 9, e18895. [Google Scholar] [CrossRef]
  49. Cano-Ciborro, V.; Medina, A.; Burgueño, A.; González-Rodríguez, M.; Díaz, D.; Zambrano, M.R. Mapping Public Space Micro-Occupations: Drone-Driven Predictions of Spatial Behaviors in Carapungo, Quito. Environ. Plan. B Urban Anal. City Sci. 2025, 52, 629–645. [Google Scholar] [CrossRef]
  50. Muñoz, V.; Vallejo, M.; Aedo, J.E. Machine Learning Models for Predicting Crime Hotspots in Medellin City. In Proceedings of the 2021 2nd Sustainable Cities Latin America Conference (SCLA), Medellin, Colombia, 25–27 August 2021; IEEE: Piscataway, NJ, USA, 2021; pp. 1–6. [Google Scholar] [CrossRef]
  51. Hoet, M.J. Crime Concentration and Hot Spot Dynamics: An Examination of Homicides in Santa Fe, Argentina. Int. Criminol. 2023, 3, 313–327. [Google Scholar] [CrossRef]
  52. Cartes, C.; Davies, T.P. Public disorder and transport networks in the Latin American context. Chaos Solitons Fractals 2021, 153, 111567. [Google Scholar] [CrossRef]
  53. Chainey, S.; Muggah, R. Homicide concentration and retaliatory homicide near repeats: An examination in a Latin American urban setting. Police J. Theory Pract. Princ. 2022, 95, 255–275. [Google Scholar] [CrossRef]
  54. Dakalbab, F.; Abu Talib, M.; Abu Waraga, O.; Bou Nassif, A.; Abbas, S.; Nasir, Q. Artificial intelligence & crime prediction: A systematic literature review. Soc. Sci. Humanit. Open 2022, 6, 100342. [Google Scholar] [CrossRef]
  55. Campedelli, G.M. Where are we? Using Scopus to map the literature at the intersection between artificial intelligence and research on crime. J. Comput. Soc. Sci. 2021, 4, 503–530. [Google Scholar] [CrossRef]
  56. Guembe, B.; Misra, S.; Azeta, A.; Lopez-Baldominos, I. Bibliometric analysis of artificial intelligence cyberattack detection models. Artif. Intell. Rev. 2025, 58, 177. [Google Scholar] [CrossRef]
  57. Monika; Bhat, A. Predictive Analytics of Crime Data in Social Media: A Systematic Review, Incorporating Framework, and Future Investigation Schedule. SN Comput. Sci. 2025, 6, 270. [Google Scholar] [CrossRef]
  58. Shah, N.; Bhagat, N.; Shah, M. Crime Forecasting: A Machine Learning and Computer Vision Approach to Crime Prediction and Prevention. Vis. Comput. Ind. Biomed. Art 2021, 4, 9. [Google Scholar] [CrossRef] [PubMed]
  59. Haley, P. The Impact of Biometric Surveillance on Reducing Violent Crime: Strategies for Apprehending Criminals While Protecting the Innocent. Sensors 2025, 25, 3160. [Google Scholar] [CrossRef]
  60. Kounadi, O.; Ristea, A.; Araujo Jr., A.; Leitner, M. A Systematic Review on Spatial Crime Forecasting. Crime Sci. 2020, 9, 7. [Google Scholar] [CrossRef]
  61. Jenga, K.; Catal, C.; Kar, G. Machine Learning in Crime Prediction. J. Ambient. Intell. Humaniz. Comput. 2023, 14, 2887–2913. [Google Scholar] [CrossRef]
  62. Mandalapu, V.; Elluri, L.; Vyas, P.; Roy, N. Crime Prediction Using Machine Learning and Deep Learning: A Systematic Review and Future Directions. IEEE Access 2023, 11, 60153–60170. [Google Scholar] [CrossRef]
  63. Travaini, G.V.; Pacchioni, F.; Bellumore, S.; Bosia, M.; De Micco, F. Machine Learning and Criminal Justice: A Systematic Review of Advanced Methodology for Recidivism Risk Prediction. Int. J. Environ. Res. Public Health 2022, 19, 10594. [Google Scholar] [CrossRef]
  64. Du, Y.; Ding, N. A Systematic Review of Multi-Scale Spatio-Temporal Crime Prediction Methods. ISPRS Int. J. Geo-Inf. 2023, 12, 209. [Google Scholar] [CrossRef]
  65. Roshankar, R.; Keyvanpour, M.R. GeoCrime Analytic Framework (G.C.A.F.): A Comprehensive Framework for Dynamic Spatial Temporal Crime Analysis. Appl. Spat. Anal. Policy 2025, 18, 33. [Google Scholar] [CrossRef]
  66. Reier Forradellas, R.F.; Náñez Alonso, S.L.; Jorge-Vazquez, J.; Rodriguez, M.L. Applied Machine Learning in Social Sciences: Neural Networks and Crime Prediction. Soc. Sci. 2021, 10, 4. [Google Scholar] [CrossRef]
  67. Thakkar, H.; Datta, S.; Bhadra, P.; Barot, H.; Jadav, J. Artificial Intelligence and Machine Learning in Fraud Detection: A Comprehensive Bibliometric Mapping of Research Trends and Directions. Ann. Libr. Inf. Stud. 2025, 72, 138–150. [Google Scholar] [CrossRef]
  68. Singh, K.; Bahuguna, R.; Memoria, M.; Kumar, R. Bibliometric Analysis of White- Collar crimes- Concept and Development Using Artificial Intelligence. In Proceedings of the 2023 International Conference on Device Intelligence, Computing and Communication Technologies (DICCT), Dehradun, India, 17–18 March 2023; IEEE: Piscataway, NJ, USA, 2023; pp. 317–320. [Google Scholar] [CrossRef]
  69. Page, M.J.; McKenzie, J.E.; Bossuyt, P.M.; Boutron, I.; Hoffmann, T.C.; Mulrow, C.D.; Shamseer, L.; Tetzlaff, J.M.; Akl, E.A.; Brennan, S.E.; et al. The PRISMA 2020 statement: An updated guideline for reporting systematic reviews. BMJ 2021, 372, n71. [Google Scholar] [CrossRef]
  70. Cortez, B.; Carrera, B.; Kim, Y.-J.; Jung, J.-Y. An architecture for emergency event prediction using LSTM recurrent neural networks. Expert Syst. Appl. 2018, 97, 315–324. [Google Scholar] [CrossRef]
  71. Alves, L.G.A.; Ribeiro, H.V.; Rodrigues, F.A. Crime prediction through urban metrics and statistical learning. Phys. A Stat. Mech. Its Appl. 2018, 505, 435–443. [Google Scholar] [CrossRef]
  72. Ramos, C.C.O.; Rodrigues, D.; de Souza, A.N.; Papa, J.P. On the Study of Commercial Losses in Brazil: A Binary Black Hole Algorithm for Theft Characterization. IEEE Trans. Smart Grid 2018, 9, 676–683. [Google Scholar] [CrossRef]
  73. Ramírez, T.; Hurtubia, R.; Lobel, H.; Rossetti, T. Measuring heterogeneous perception of urban space with massive data and machine learning: An application to safety. Landsc. Urban Plan. 2021, 208, 104002. [Google Scholar] [CrossRef]
  74. Castellón González, P.; Velásquez, J.D. Characterization and detection of taxpayers with false invoices using data mining techniques. Expert Syst. Appl. 2013, 40, 1427–1436. [Google Scholar] [CrossRef]
  75. Massaferro, P.; Di Martino, J.M.; Fernández, A. Fraud Detection in Electric Power Distribution: An Approach That Maximizes the Economic Return. IEEE Trans. Power Syst. 2020, 35, 703–710. [Google Scholar] [CrossRef]
  76. Velasco, R.B.; Carpanese, I.; Interian, R.; Paulo Neto, O.C.G.; Ribeiro, C.C. A decision support system for fraud detection in public procurement. Int. Trans. Oper. Res. 2021, 28, 27–47. [Google Scholar] [CrossRef]
  77. Pereira, J.F.Q.; Pimentel, M.F.; Amigo, J.M.; Honorato, R.S. Detection and identification of Cannabis sativa L. using near infrared hyperspectral imaging and machine learning methods: A feasibility study. Spectrochim. Acta Part A Mol. Biomol. Spectrosc. 2020, 237, 118385. [Google Scholar] [CrossRef] [PubMed]
  78. Guo, J.; Xu, Q.; Zeng, Y.; Liu, Z.; Zhu, X.X. Nationwide urban tree canopy mapping and coverage assessment in Brazil from high-resolution remote sensing images using deep learning. ISPRS J. Photogramm. Remote Sens. 2023, 198, 1–15. [Google Scholar] [CrossRef]
  79. ISO/IEC 27001:2022; Information Security, Cybersecurity and Privacy Protection—Information Security Management Systems—Requirements. International Organization for Standardization: Geneva, Switzerland, 2022. Available online: https://www.iso.org/es/norma/27001 (accessed on 14 November 2025).
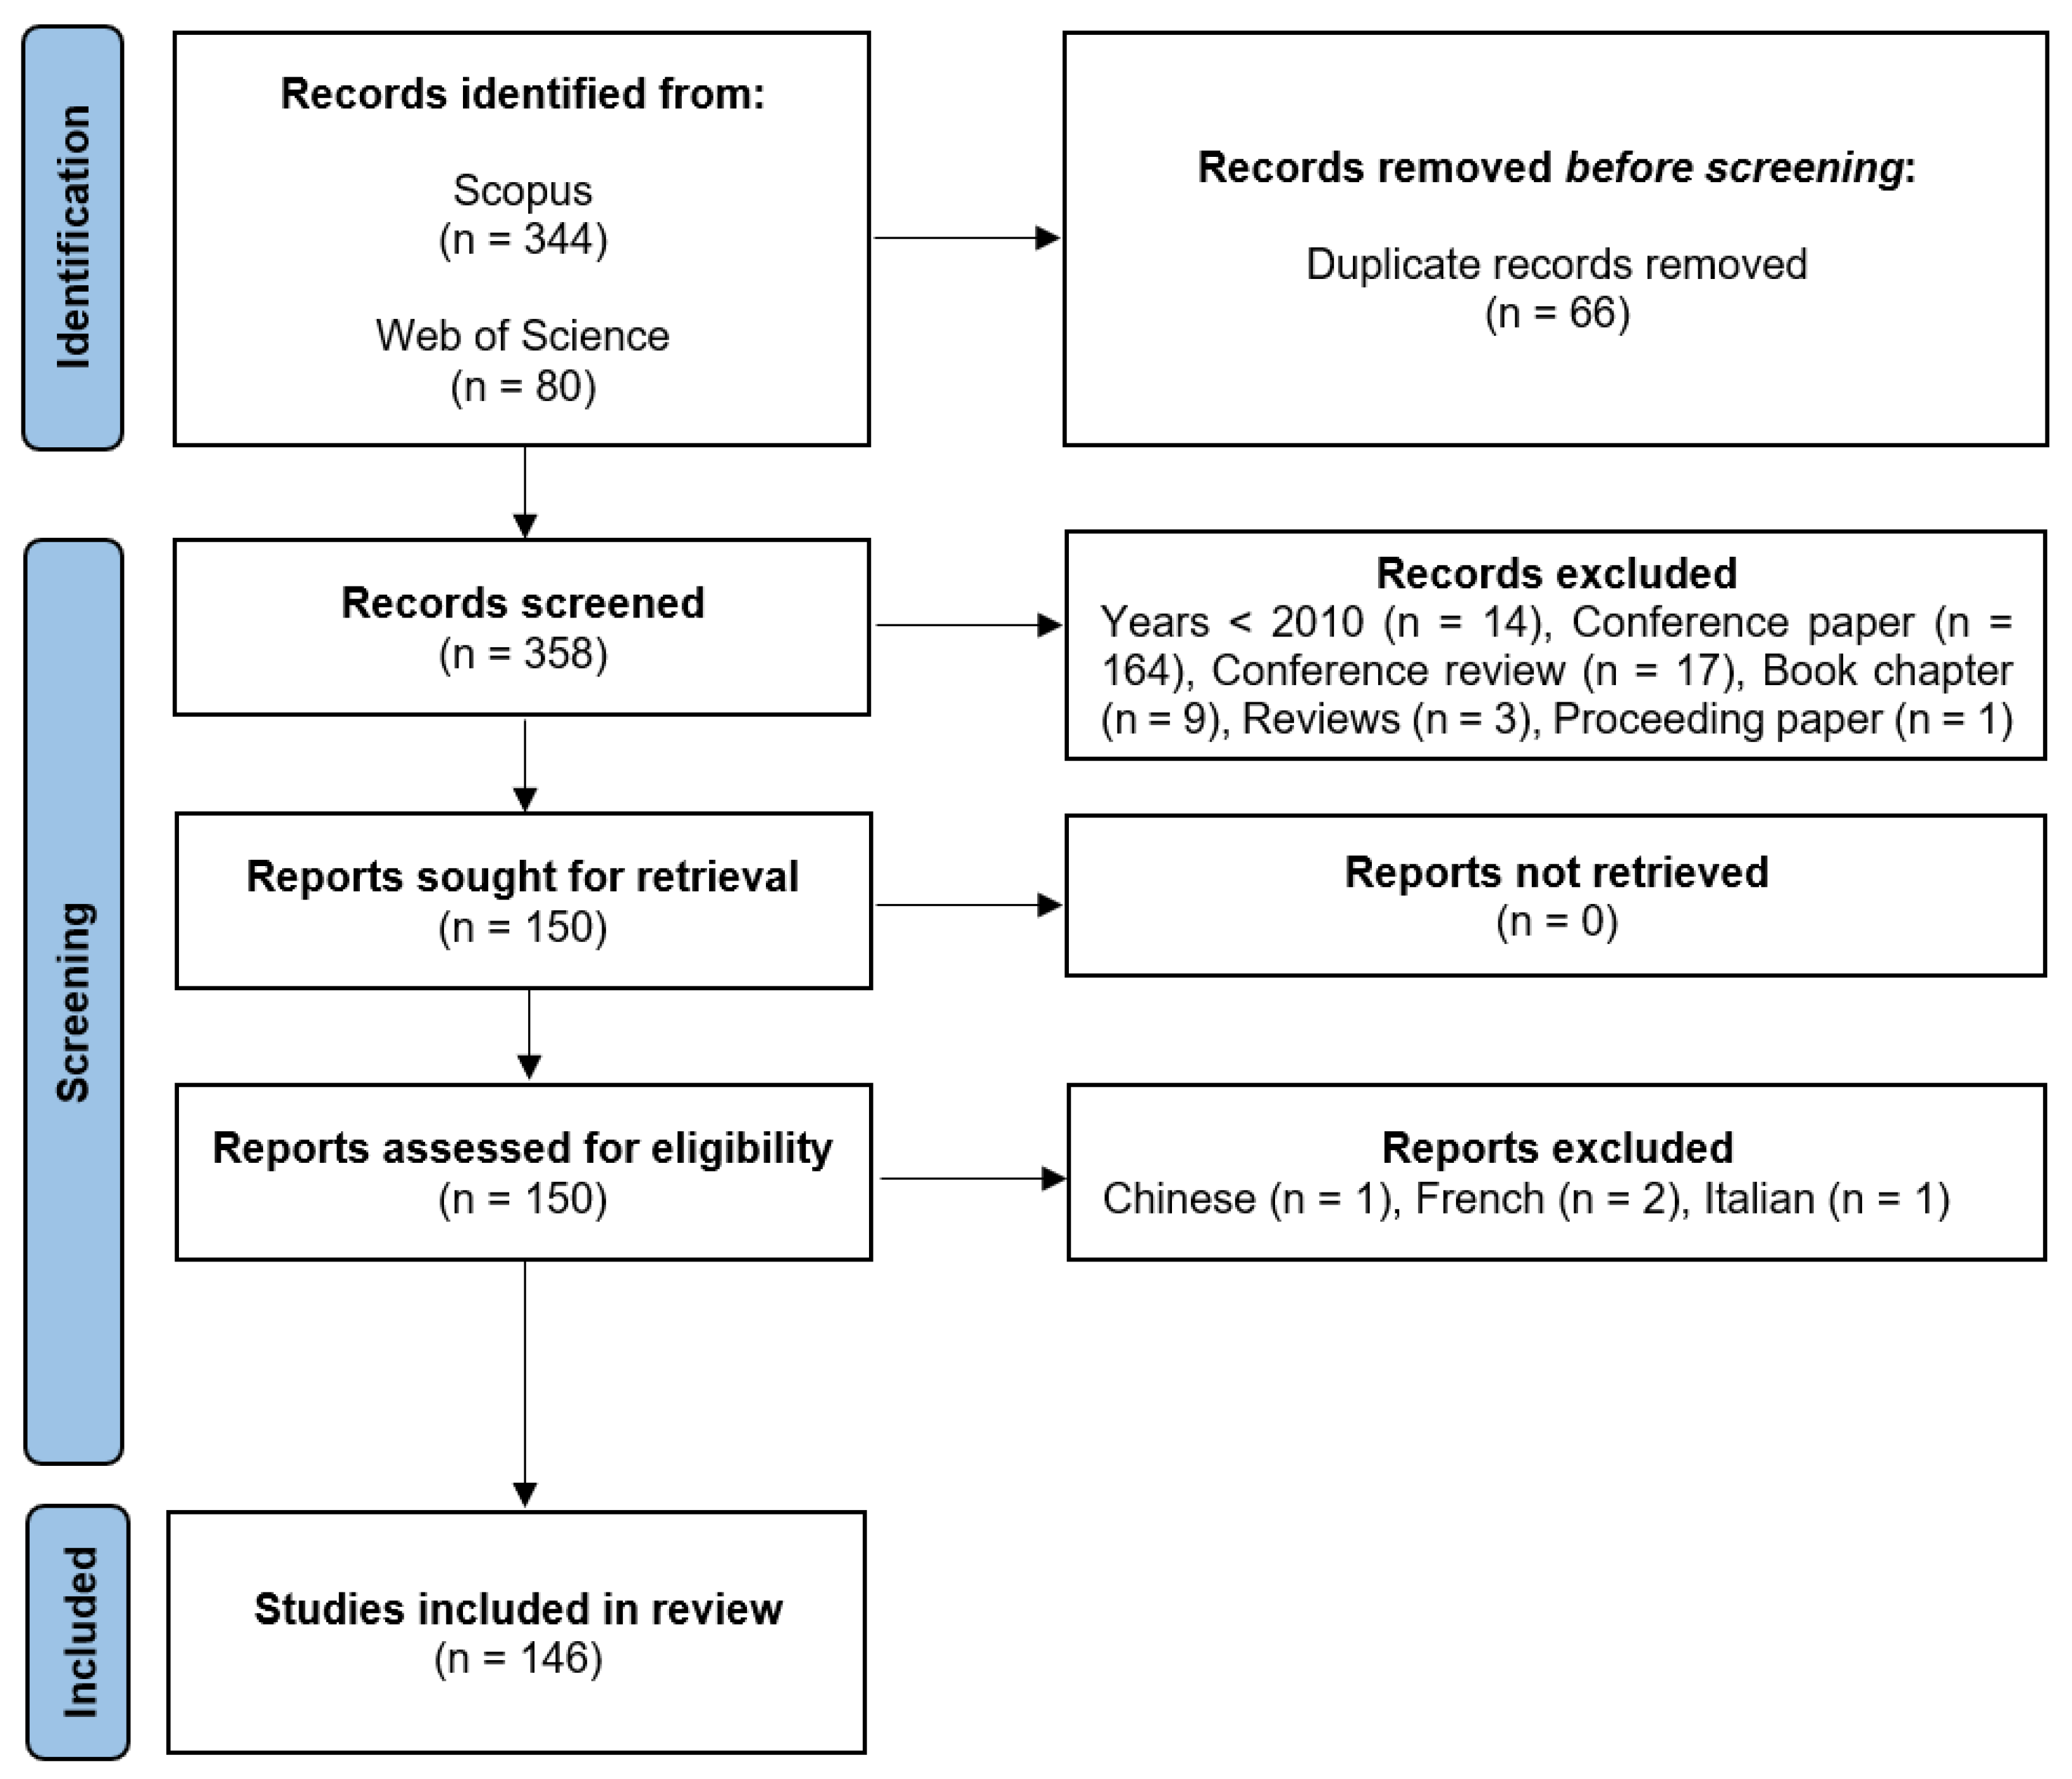
Figure 1. PRISMA flow adapted for bibliometric mapping. Language-based exclusions were applied at the metadata curation stage (French = 2; Italian = 1; Chinese = 1); none occurred at title/abstract screening.
Information 16 01001 g001
Figure 2. Annual publications (blue bars, left axis) and cumulative publications (black line, right axis) for the 146 studies (2010–5 October 2025). The 2025 bar reflects data up to 5 October (shaded).
Information 16 01001 g002
Figure 3. Geographical distribution of author affiliations in studies on Artificial Intelligence and Crime (2010–October 2025).
Information 16 01001 g003
Figure 4. International collaboration network among countries involved in research on Artificial Intelligence and Crime (2010–October 2025).
Information 16 01001 g004
Figure 5. Word cloud of keywords Plus.
Information 16 01001 g005
Figure 6. Word cloud of author keywords.
Information 16 01001 g006
Figure 7. Co-occurrence network of the author keywords.
Information 16 01001 g007
Figure 8. Thematic map of the author keywords.
Information 16 01001 g008
Table 1. Country-level publication metrics under full and fractional counting. n u is the number of unique articles with at least one affiliation in the country, n b denotes the total number of author–affiliation–country blocks (full counting), and F c is the fractional contribution.
Country n u n b n b / n u F c
Brazil541092.0247.62
Colombia22502.2720.12
Chile10252.508.13
Mexico10222.208.58
Ecuador10161.607.32
Peru9161.786.89
Argentina221.01.0
Costa Rica111.01.0
Uruguay221.01.0
Venezuela111.01.0
Table 2. The most important institutional affiliations in Latin America.
Affiliations (Country) n uf n bf n bf / n uf
Universidade Federal de Pernambuco (Brazil)9151.67
Universidade de São Paulo (Brazil)591.80
Universidade Estadual de Campinas (Brazil)581.60
Universidade Federal do Rio Grande do Norte (Brazil)372.33
Universidade do Estado do Rio de Janeiro (Brazil)351.67
Universidad Externado de Colombia (Colombia)362.0
Universidad Tecnológica de Bolívar (Colombia)351.67
Universidad Militar Nueva Granada (Colombia)351.67
Universidad de Cartagena (Colombia)341.33
Universidad Adolfo Ibáñez (Chile)341.33
Universidad Central del Ecuador (Ecuador)341.33
Pontificia Universidad Católica de Chile (Chile)2115.50
Pontifícia Universidade Católica do Rio de Janeiro (Brazil)252.50
Universidad Michoacana de San Nicolás de Hidalgo (Mexico)242.0
Universidad de los Andes (Colombia)242.0
Universidad de Lima (Peru)242.0
Universidad Nacional Mayor de San Marcos (Peru)242.0
Universidad Regional Autónoma de los Andes (Ecuador)242.0
Universidad de Valparaíso (Chile)231.5
Universidade do Vale do Rio dos Sinos (Brazil)231.5
Universidade Federal Rural de Pernambuco (Brazil)188.0
Universidade Federal do Pará (Brazil)177.0
Universidad Autónoma de Ciudad Juárez (Mexico)177.0
Universidade Federal do Rio Grande do Sul (Brazil)155.0
Universidad Autónoma de Baja California (Mexico)155.0
Universidad Estatal de Milagro (Ecuador)155.0
Corporación Universitaria Remington (Colombia)144.0
Instituto Jones dos Santos Neves (Brazil)144.0
Universidad de Bogotá Jorge Tadeo Lozano (Colombia)133.0
Universidad de Guanajuato (Mexico)133.0
Universidad de la República (Uruguay)133.0
Universidad Simón Bolívar (Colombia)133.0
Universidade Estadual Paulista “Júlio de Mesquita Filho” (Brazil)133.0
Universidade Federal do Ceará (Brazil)133.0
Universidade Federal do Rio de Janeiro (Brazil)133.0
Table 3. Scientific journals with the highest number of publications.
Source (s)Articles/Journal
Expert Systems with Applications (Q1), Revista Criminalidad (Q4)5
Artificial Intelligence and Law (Q1), RISTI–Revista Ibérica de Sistemas e Tecnologias de Informação (coverage discontinued in Scopus)4
PLOS ONE (Q1)3
Cities (Q1), Decision Support Systems (Q1), Forensic Science International (Q1), Humanities & Social Sciences Communications (Q1), IEEE Access (Q1), IEEE Latin America Transactions (Q3), IEEE Transactions on Smart Grid (Q1), IEEE Transactions on Visualization and Computer Graphics (Q1), Intelligent Data Analysis (Q2), International Journal of Advanced Computer Science and Applications (Q3), Journal of Computational Social Science (Q2), Neutrosophic Sets and Systems (Q3), Pesquisa Operacional (Q4), Revista Brasileira de Ciências Policiais (Q4), Revista Brasileira de Direito Processual Penal (Q3), Revista Científica General José María Córdova (Q2), Revista Eletrônica de Direito Processual (Q3)2
Table 4. Top ten most cited articles.
TitleYearCitationsCitations/YearStudy
An architecture for emergency event prediction using LSTM recurrent neural networks201813116.38[70]
Crime prediction through urban metrics and statistical learning201810212.75[71]
On the Study of Commercial Losses in Brazil: A Binary Black Hole Algorithm for Theft Characterization2018779.63[72]
Socio-economic, built environment, and mobility conditions associated with crime: a study of multiple cities20207111.83[27]
Measuring heterogeneous perception of urban space with massive data and machine learning: An application to safety20216813.60[73]
Characterization and detection of taxpayers with false invoices using data mining techniques2013675.15[74]
Fraud Detection in Electric Power Distribution: An Approach That Maximizes the Economic Return20206611.00[75]
A decision support system for fraud detection in public procurement2021397.80[76]
Detection and identification of Cannabis sativa L. using near infrared hyperspectral imaging and machine learning methods. A feasibility study2020376.17[77]
Nationwide urban tree canopy mapping and coverage assessment in Brazil from high-resolution remote sensing images using deep learning20233511.67[78]
Disclaimer/Publisher’s Note: The statements, opinions and data contained in all publications are solely those of the individual author(s) and contributor(s) and not of MDPI and/or the editor(s). MDPI and/or the editor(s) disclaim responsibility for any injury to people or property resulting from any ideas, methods, instructions or products referred to in the content.