Article

Stochastic Modeling of Electromagnetic Wave Propagation Through Extreme Dust Conditions in Underground Mines Using Vector Parabolic Approach

by
Emmanuel Atta Antwi
1,*,
Samuel Frimpong
1,
Muhammad Azeem Raza
1 and
Sanjay Madria
2
1
Mining and Explosive Department, Missouri University of Science and Technology, Rolla, MO 65401, USA
2
Computer Engineering Department, Missouri University of Science and Technology, Rolla, MO 65401, USA
*
Author to whom correspondence should be addressed.
Information 2025, 16(10), 891; https://doi.org/10.3390/info16100891 (registering DOI)
Submission received: 4 September 2025 / Revised: 30 September 2025 / Accepted: 9 October 2025 / Published: 13 October 2025

Abstract

Post-disaster underground (UG) mine environments are characterized by complex and rapidly changing conditions, adding extra attenuation to propagating electromagnetic (EM) waves. One such complex condition is the extreme generation of dust and sudden rise in humidity contributing to extra attenuation effects to propagating waves, especially under varying airborne humidity and dust levels. The existing wave propagation prediction models, especially those that factor in the effect of dust particles, are deterministic in nature, limiting their ability to account for uncertainties, especially during emergency conditions. In this work, the vector parabolic equation (VPE) model is modified to include dust attenuation effects. Using the complex permittivity of dust as a random variable, the Karhunen–Loève (KL) expansion is used to generate random samples of permittivity along the drifts for which each realization is solved using deterministic VPE method. The model is validated using a modified Friis method and experimentally obtained data from literature. The findings show that accounting for dust and humidity effects stochastically captures the extra losses that would have otherwise been lost using deterministic methods. The proposed framework offers key insights for designing resilient underground wireless systems, strengthening miner tracking, and improving safety during emergencies.

1. Introduction

The study of electromagnetic (EM) wave propagation in underground (UG) environments, such as mines and transportation tunnels, has gained significant importance due to its impact on the performance of communication, tracking, and monitoring systems. Over the past five decades, this field has been intensively investigated, driven further by the mandatory two-way communication and tracking requirements of the MINER Act of 2006 and the growing shift from wired to wireless systems. These developments underscore the critical role of EM wave propagation research in enhancing assisted and self-evacuation during emergencies.
A significant number of current technologies deployed to aid underground (UG) mine operations are heavily dependent on wireless communication systems, which serve as the backbone for real-time monitoring, automation, worker tracking, and emergency response. The UG mine is characterized by non-line-of-sight (NLOS) conditions, rough drift walls, and susceptibility to explosion and blockage from collapsed walls and roofs [1,2]. Additionally, the underground mine environment is highly unpredictable, with conditions changing rapidly—an issue that becomes even more severe during emergencies. Modeling the propagation behavior of waves, considering all these factors, is highly challenging. The models developed so far to predict EM wave propagation in underground mines are mostly deterministic.
Electromagnetic (EM) wave propagation in subterranean environments has been predominantly modeled using the vector parabolic equation (VPE) [3,4], the multimode waveguide model [5,6], and the ray tracing models [7,8]. While these models have advanced understanding, they often assume simplified conditions that overlook critical sources of variability. For example, Zhang and Sarris [9] extended the VPE model to account for variability in wall roughness losses, highlighting the need for models that capture environmental complexity. In underground (UG) mines, however, far greater challenges arise: fluctuating humidity, dust-laden air, accumulated debris, irregular tunnel geometries, and drift curvatures all interact to significantly alter wave behavior. These underground environments are also characterized by rugged terrains, irregular drift geometries, varying cross-sectional areas, and fluctuating environmental conditions [10]. Among these, the combined effects of airborne dust and high humidity are particularly detrimental, introducing scattering, absorption, and variability in the effective dielectric properties of the medium [11,12,13]. These dynamics not only degrade signal quality but also compromise the reliability of communication and tracking systems—capabilities that are indispensable for real-time monitoring, automation, and, most critically, post-disaster evacuation. As communication technologies in mining increasingly rely on wireless sensor networks (WSNs), mobile tracking systems, and automated machinery that necessitate dependable real-time connectivity, it is essential to create precise models that forecast and alleviate signal degradation in these challenging environments. Given that modern mining increasingly depends on wireless sensor networks (WSNs), mobile tracking technologies, and automated machinery, there is an urgent need for accurate propagation models that can account for these environmental uncertainties. Addressing this gap is essential to ensure dependable connectivity in UG mines and to enhance both operational efficiency and miner safety during routine operations and emergency scenarios.
Previous research on electromagnetic (EM) wave propagation has examined attenuation mechanisms in tunnels with emphasis on curvature [3,14,15,16], vehicular blockage [17,18], human presence, and tunnel geometry [19,20]. With respect to dust and humidity, most studies have been confined to surface environments such as deserts, where sand and dust storms (SDS) frequently occur [12,21,22]. These works demonstrated that airborne particulates and moisture, especially in severe storm conditions, can contribute to attenuation of propagating waves, particularly at higher frequencies. However, such investigations assume relatively predictable atmospheric conditions, unlike underground (UG) mines, where environmental factors are highly erratic. During mining emergencies—such as explosions or collapses—dust concentrations can rise sharply while water discharge elevates humidity levels, jointly altering the effective dielectric properties of air. These changes affect impedance, phase velocity, and overall wave attenuation in ways that are far more complex than in surface settings. Despite evidence of their importance, the combined and variable effects of dust and humidity on EM propagation in UG mines remain largely unexplored.
This paper addresses this gap by first incorporating dust attenuation effects into the VPE model and then applying the Karhunen–Loève (KL) expansion to represent the variability of the complex permittivity of dust particles as a stochastic process. In this model, the chosen stochastic variable is the complex permittivity of dust–humidity particles, since it inherently encapsulates both the dielectric storage (real part) and loss mechanisms (imaginary part) arising from absorption, scattering, and moisture-induced polarization effects [23]. This modeling approach also highlights the impact of particle size distribution, concentration, and relative humidity in the wave propagation analysis, thereby providing a more realistic representation of underground mining environments. The objective is to highlight the impacts of these effects and provide a framework for designing resilient wireless communication systems that can withstand extreme conditions, ultimately improving miner localization, operational efficiency, and post-disaster safety. Beyond mining, the findings have broader implications for subterranean communication environments where dust, humidity, and restricted line-of-sight pathways are prevalent.

2. Existing Body of Knowledge

The propagation of electromagnetic waves in dusty environments has been extensively studied, particularly in the context of sand and dust storms (SDS) [11,22,24,25]. Earlier research has focused on microwave and millimeter-wave (mmWave) bands, where attenuation becomes significant due to scattering and absorption by airborne particles. Attenuation is influenced by factors such as wave frequency, dust concentration, visibility, humidity, particle size, particle size distribution (PSD), particle shape, and moisture content. Chu [11] focused on the X-band (8–12 GHz), which is relevant for long-range communication. These studies initially overlooked lower frequencies, assuming negligible losses. However, later findings by Goldhirsh [26] revealed that attenuation at lower bands like the S-band (2–4 GHz) can become significant when visibility is reduced, especially in high-concentration SDS scenarios.
Key mechanisms of attenuation in SDS are scattering—predominantly when particle dimensions are smaller than the wavelength—and absorption, which becomes dominant when EM waves propagate through dense or lossy materials [12,13]. Scattering causes wave energy to spread in different directions, leading to reduced intensity at the receiver, while absorption converts EM energy into heat, primarily due to interactions with moisture and the dielectric properties of particles [27,28]. The dielectric constant of dust particles, both real and imaginary parts, plays a central role in determining the absorption characteristics. This dielectric response is influenced heavily by the hygroscopic water content (HWC) of the particles, which increases the loss tangent and thereby the attenuation [29,30]. Sharif [30] empirically established a relationship between humidity and dielectric constant, and addressed the limitation of earlier works, such as that by Ghobrial [29], which qualitatively noted the relationship without quantification.
Particle shape and size distribution are also pivotal in EM wave attenuation modeling. While many models simplify suspended dust particles as spherical, this assumption is only globally valid and often impractical in localized or harsh environments like underground mines. Particularly during mine emergencies, such as explosions or rockfalls, particles are generated on-site and tend to be irregular in shape. The review and assessment of EM wave propagation in SDS by Ghobrial and Sharief reported that particles in SDS do not have a fixed shape [31] and often fall within the size range of 0.05 to 150 μm [32,33,34,35]. It further stated that PSDs are generally modeled using exponential, Gaussian, or log-normal distributions, but later studies found that log-normal PSDs yielded predictions that matched measured attenuation values more closely [36]. The dielectric properties of these particles, especially their frequency-dependent behavior, remain relatively stable beyond 4 GHz [37], indicating that above this threshold, permittivity can be treated as nearly constant for modeling purposes.
Despite the breadth of prior studies on SDS attenuation in atmospheric contexts, relatively few studies have addressed the unique conditions of underground mining environments. One of the pioneering studies into the attenuation effect of dust particles by [38] proposed an analytical expression that quantifies the attenuation factor of dust particles on propagating EM waves. The authors concluded that the attenuation contribution of sand particles is negligible at ultra-high frequencies (UHFs). A later study by [39], however, observed that in severe dust generation conditions, for example, explosion and roof collapse, the attenuation factor by dust can be significant. Both studies [38,39] focused primarily on particle concentration but did not examine the variability in dust composition. The properties of dust can differ significantly depending on its source, and dust generated underground often exhibits characteristics distinct from surface dust. This gap highlights the need to consider not only concentration levels but also the diverse physical and chemical properties of dust particles, which ultimately affect permittivity when assessing their impact on wave propagation.

3. The Vector Parabolic Model

This paper builds upon the vectorial parabolic equation (VPE) framework proposed by Popov et al. [3,4], to model the propagation behavior of electromagnetic waves in underground drifts. The proposed VPE is given in Equation (1).
2 jk 0 W s = 2 x 2 + 2 y 2 W 2 k 0 2 x cos θ s + y sin θ s ρ s W
k 0 is designated as the free space wave number given by 2π/λ; θ is the rotational angle of the drift profile; ρ is the radius of curvature of the drift such that ρ = defines a straight drift; and W represents the complex wave amplitude propagating along the longitudinal direction s of the drift, as defined in Equation (2) [9]:
W = E x E y exp j k 0 s
The interaction of electromagnetic fields with the drift walls, along with the characterization of their electrical properties, can be accurately modeled using the Leontovich impedance boundary condition [40]. This relationship at the boundary is expressed in Equation (3):
W = j k 0 Q ¯ R ¯ Q ¯ W n
Q ¯ and R ¯ are the normal directional and impedance coupling matrices, respectively, as defined in Equations (4) and (5), respectively.
Q ¯ = n x n y n y n x
R ¯ = 1 Z 0 0 Z
In Equation (4), n = n x , n y is the unit normal vector to the drift boundary, and Z in Equation (5) represents the drift wall impedance as defined in Equation (6).
Z = 1 ε r j 60 λ σ
where ε r is the relative permittivity, λ is the wavelength of the wave, and σ is the conductivity of the drift wall.

4. Dust and Humidity Factor Integration and Assumptions

The VPE framework with the associated boundary condition described in Equation (1) and Equation (3), models the propagation characteristics of electromagnetic wave through empty drift. This assumes that the scattering and absorption phenomenon are very minimal given that there are no obstructions in the form of suspended dust particles and water droplets to trigger absorption and scattering effects. During emergencies such as explosions or ground falls, these particles can become more concentrated in the air due to disturbances in the strata and airflows, leading to increased attenuation of radio signals, mainly through absorption and scattering mechanisms [21,41]. The scattering and absorption phenomena introduced by the presence of dust particles in the drift are encapsulated in the propagation constant, as defined in Equation (7) [21,41,42].
k s = k 0 + 2 π k 0 0 N t x , y , r p f q r p d r p
where N t x , y , r p = N t x , y P r p ; x , y such that N t x , y is the total dust concentration; P r p is an appropriate particle size distribution function; r p is the dust particle size in meters; and f q is the forward scattering amplitude of the propagating wave as defined in Equation (8):
f q r p = ε d 1 ε d + 2 k 0 2 r p 3
ε d is the complex permittivity of dust.
The underground mine drift is usually modeled as lossy medium [43,44] due to the partially absorptive and reflective nature of the drift walls. The dust particles originating from the walls during mining activities or emergency events can significantly alter the propagation characteristics of the wave. Given that the effect of the dust particles is captured in the propagation constant, then it suffices to replace the free space wavenumber k 0 in Equation (1) with the expression in Equation (7). The VPE with dust effect is given in Equation (9):
2 j k s W s = 2 x 2 + 2 y 2 W 2 k s 2 x cos θ s + y sin θ s ρ s W
where k s k s x , y .
In this work, it is assumed that within a given cross-section of the drift, variations in dust concentration and humidity are negligible, so the dominant parameter is the total concentration. While the k s in Equation (7) may in principle vary with x and y, the transverse derivates δ k s δ x and δ k s δ y are neglected under this assumption.
The forward scattering amplitude in Equation (8), however, can be modified to account for the effect of humidity (water droplets) on the attenuation characteristics of the dust particles. This is because, in the underground environment, the suspended dust particles tend to absorb water, which significantly changes the dielectric properties of the dust particles [45]. In the context of dust in underground mining environments, where water is constantly present, the complex permittivity is defined as [33] and is given by Equation (10).
ε d = ε + i ε
ε is the real part; ε is the imaginary part, which represents the absorption of energy; and i = 1 . In Sharif [30], the relationship between dielectric constants and relative humidity was established using an empirical formula as given in (11). H : relative humidity (%).
ε = 5.52 + 0.04 H 7.78 × 10 4 H 2 + 5.56 × 10 6 H 3 ε = 0.16 + 0.02 H 3.71 × 10 4 H 2 + 2.76 × 10 6 H 3
In some cases, relative permittivity and conductivity ( σ ) are specified in which the complex permittivity can be determined using Equation (12).
ε d = ε j σ ω ε 0
ε is the relative permittivity and ε = σ ω ε 0 .
The Rayleigh scattering theory has an underpinning assumption that the dust particles are spherical in shape [4]. This assumption, however, may not be realistic due to the process that generates dust in the UG mines, especially during emergencies. This can result in many dust particles becoming non-spherical. Non-sphericity has been shown to introduce errors in dust attenuation calculations, as the scattering behavior deviates significantly from that of idealized spherical particles [46]. Ginoux [46] computed a non-sphericity factor to correct this deviation as shown in Equation (13).
Φ p = 2 λ 2 3 1 + λ 2 λ 2 1 a r c s i n 1 1 λ 2
The non-sphericity factor, Φ p , is accounted for by multiplying by the particle radius, r p . The modified forward scattering amplitude is then given by Equation (14).
f q r p = ε d 1 ε d + 2 k 0 2 Φ p r p 3
In this study, the particle size distribution of underground mine dust is represented using a log-normal probability density function, as defined in Equation (15), consistent with its established applicability to dust storm aerosols [24,47].
P r P = 1 r p ζ 2 π exp ln r p m 2 2 ζ 2
σ g is the standard deviation; ζ = ln σ p ; the natural logarithm of the standard deviation; and m = ln r p ; the natural logarithm of the mean size (radius) of the particles in micro-meters.

5. Stochastic VPE Formulation

This section presents the stochastic modeling approach that accounts for the variability in the complex permittivity of dust particles, which is a critical parameter influencing wave attenuation in a dust–humidity-filled environment. Emergency events can cause significant fluctuations in relative humidity and dust composition, both of which directly affect the complex permittivity of the suspended dust particles. Accurately capturing this variability is essential for realistic modeling of electromagnetic wave propagation in such environments. The parameterization of the dust particle permittivity is discussed, and then the incorporation of the random permittivity is provided.
The Karhunen–Loève Expansion (KLE) is the chosen approach to represent and parameterize the random processes in this study. The choice of KLE is based on the premise that it provides the most efficient (mean-square optimal) representation of a random field using orthogonal functions [48]. Moreover, the KLE has been used across different applications due to its strong and well-established theoretical and practical understanding [49]. In this specific application of KLE, the permittivity of the dust particles is sampled from a rectangular region at a specific location along the length of the drift. If a Gaussian random field random process describing the spatial variability of the complex permittivity of suspended dust particles in a 2D rectangular space is q x , y , ψ . Then for a specific realization of ψ Ω , is ε d ψ , ξ . Then for any specific realization of ξ Ω , ε d ψ ,   · is the deterministic function representing a specific spatial distribution of permittivity, and for a specific location ψ , ε d . , ξ denotes an outcome in the underlying probability space Ω . It is worth noting that ε d ψ , ξ = ε ψ , ξ + i ε ψ , ξ since the permittivity is complex-valued.
The KLE can be represented as shown in Equation (16) [49].
ε d ψ , ξ = ε d ¯ ξ + σ ε d j = 1 v j ϕ j ψ χ j ξ
ε d ¯ denotes mean permittivity, σ ε d represents the standard deviation of the permittivity within the dust-laden drift, χ j ξ   j 1 are independent standard normal random variables that can be generated via Monte Carlo method [9,49], and v j and ϕ j ψ correspond to the eigenvalues and eigenfunctions of the Fredholm integral equation of the second kind as shown in Equation (17).
0 D L β ε d ψ 1 , ψ 2 ϕ j ψ d ψ 2 = v j ϕ j ψ 1
D L is the total drift length and β ε d ψ 1 , ψ 2 is the covariance kernel. In this study, the exponential covariance is used due to its wide applicability and the existence of analytical solutions which reduces computational requirements compared to numerical approach [50,51]. The close form solutions of v j and ϕ j ψ 1 as given in Equations (18) and (19) [9].
v j = 2 l l 2 ξ j 2 + 1 ,   j 1
ϕ j x = l ξ j c o s ξ j + s i n ξ j x l 2 ξ j 2 + 1 D L x 2 + l
l represents the correlation length, and ξ j represents the solutions of Equation (20).
l 2 ξ j 2 1 s i n ξ j D L = 2 l ξ c o s ξ j D L
In order to implement the KL expansion, a decision has to be made on how many terms to keep such that the retained terms substantially capture the variance in the process. The truncated expansion is shown in Equation (21).
ε d ψ , ξ = ε d ¯ ξ + σ ε d j = 1 N K v j ϕ j ψ χ j ξ
N K is the number of retained terms.
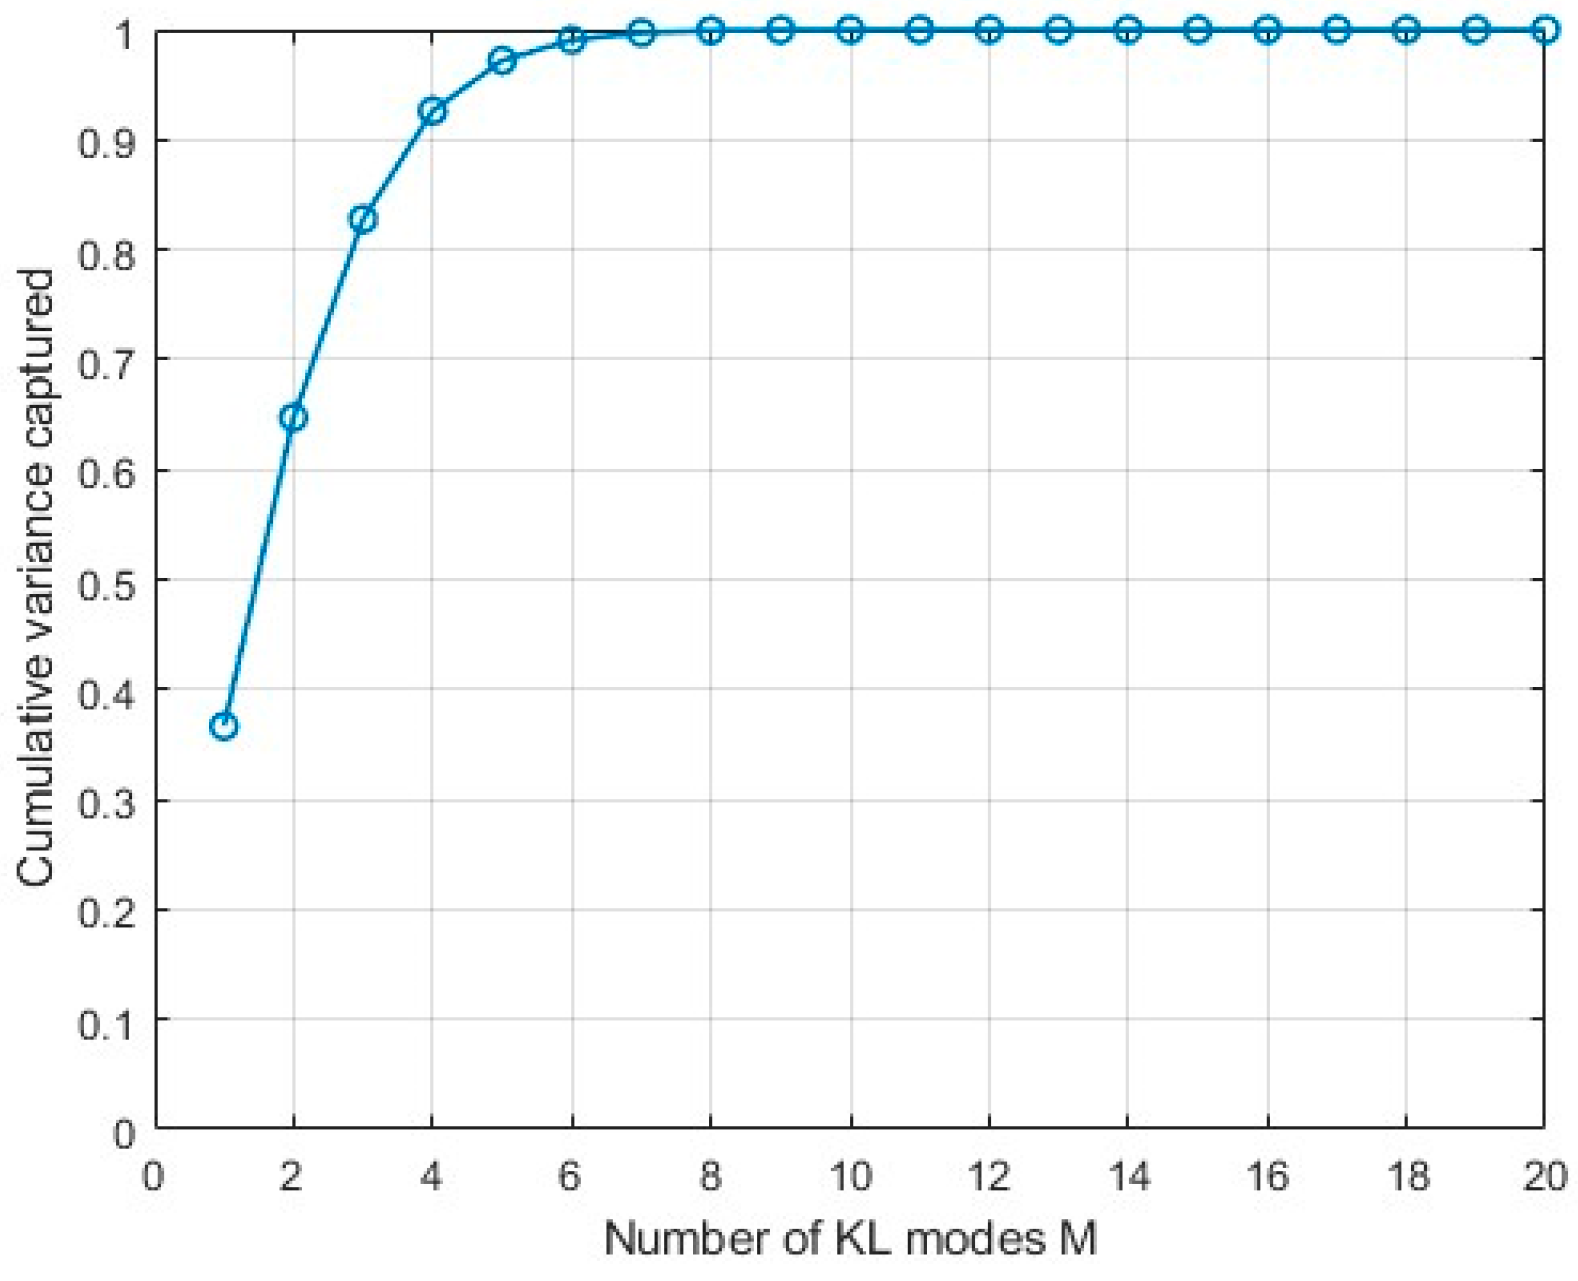
The number of terms retained is heavily dependent on the correlation length selected for application. Figure 1 shows how correlation length affects the number of retained terms and the associated error in the estimation. The correlation length physically explains how long movement along the tunnel axis would record a appreciable difference in dust concentration and humidity levels. Theoretically, large correlation length would result in low relative error and relatively low random variables, while low correlation length result in high relative error and high random variables. A good correlation length therefore must strike a good balance between accuracy and a good representation of random variable for complete description of the random processes. A correlation length of 2.5 m is chosen because on length must retain enough variables to accurately represent the random variable. Consequently, from Figure 2, the number of terms retained for this study is 7.
The standard deviation in this study was estimated based on the range of dielectric constant values of dust reported [30] as 1.374 − j0.142. Four realizations of the dielectric constants are shown in Figure 3 based on the stated standard deviations and the correlation length.

5.1. Dust Concentration and Humidity Effects

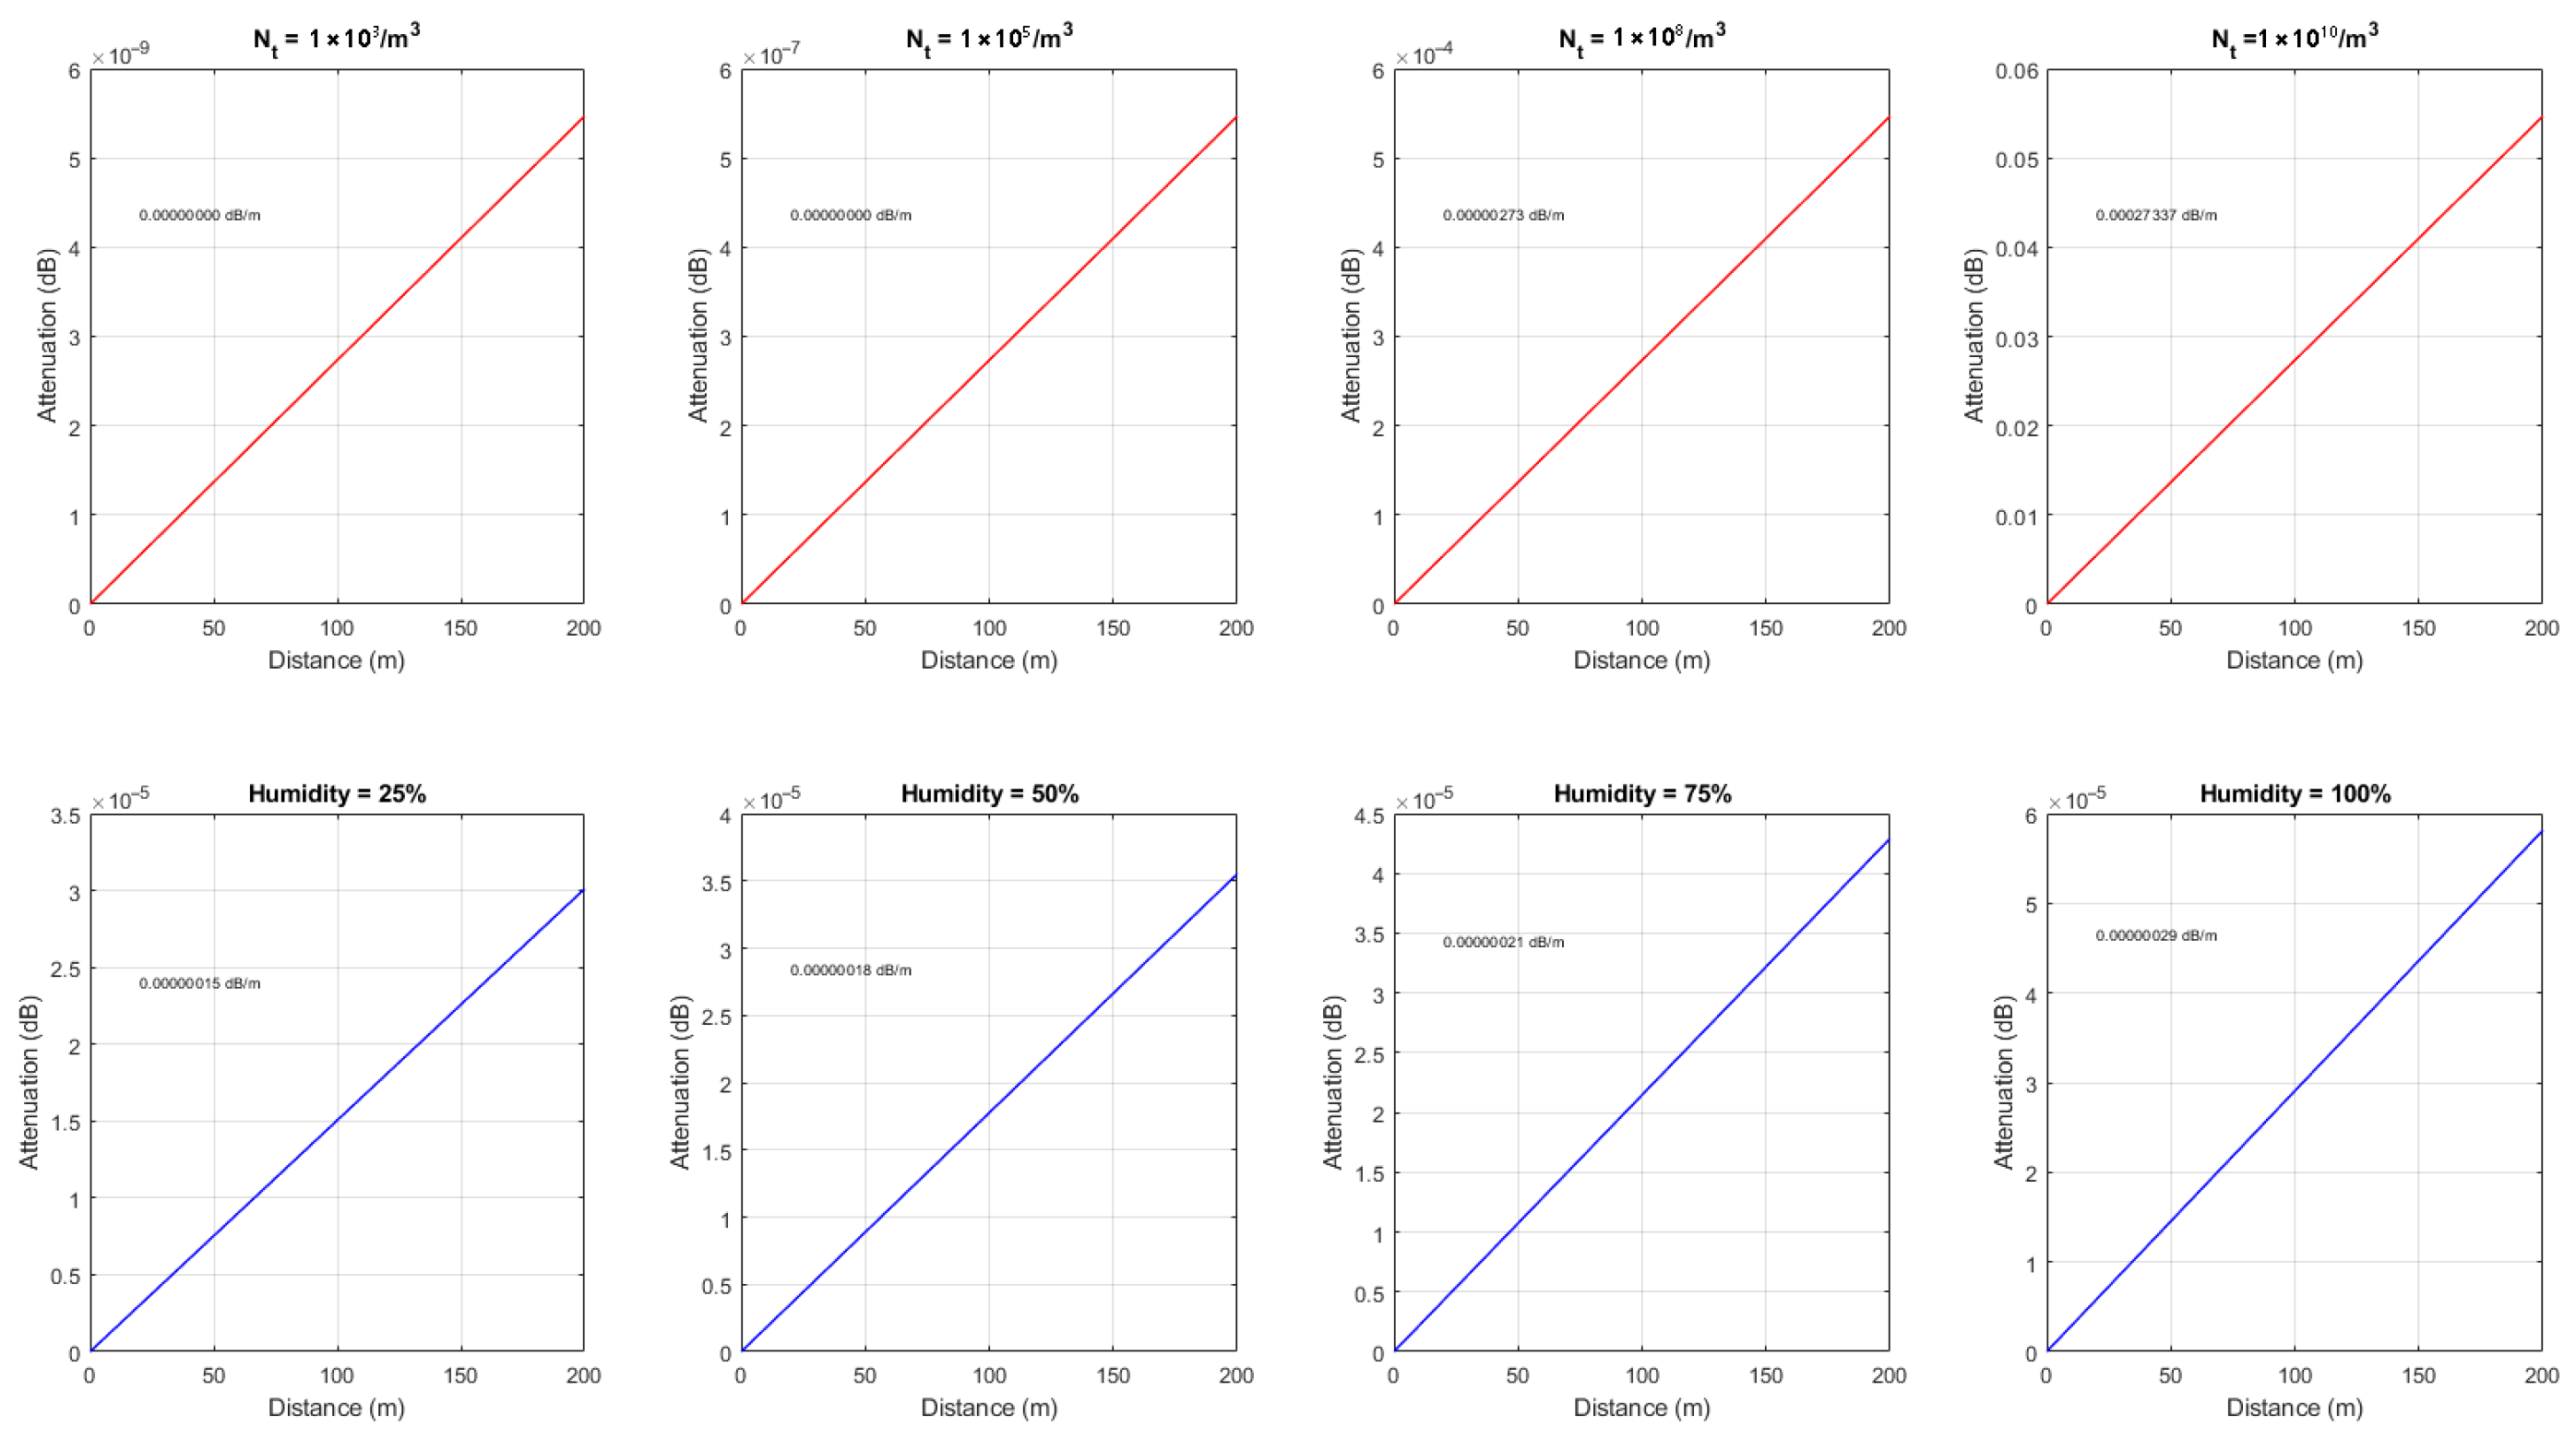
The results in Figure 4 illustrate attenuation trends evaluated from the standpoint of the propagation constant under varying dust concentrations (top row, humidity fixed at 95%) and varying humidity levels (bottom row, dust concentration fixed at 107/m3) For the dust-dominated case (top row), attenuation increases almost linearly with distance, with the slope determined by particle concentration. At very low dust levels ( N t = 10 3 / m 3 ), the impact on propagation is negligible, whereas higher concentrations (108–1010/m3) introduce progressively stronger attenuation, with the 1010/m3 case showing a clearly measurable degradation over 200 m. This indicates that dust concentration is the primary driver of attenuation under high-humidity conditions.
In contrast, for the humidity-dominated case (bottom row), increasing relative humidity from 25% to 100% produces only marginal changes in attenuation. Although a slight upward trend is observed with increasing humidity, the magnitude remains orders of magnitude lower compared to dust-driven effects.
Overall, the analysis confirms that, from the propagation constant perspective, dust concentration exerts a dominant influence on attenuation in underground environments, while humidity contributes a secondary but amplifying effect when coupled with high particle densities.

5.2. Stochastic VPE Process Output and Dynamics

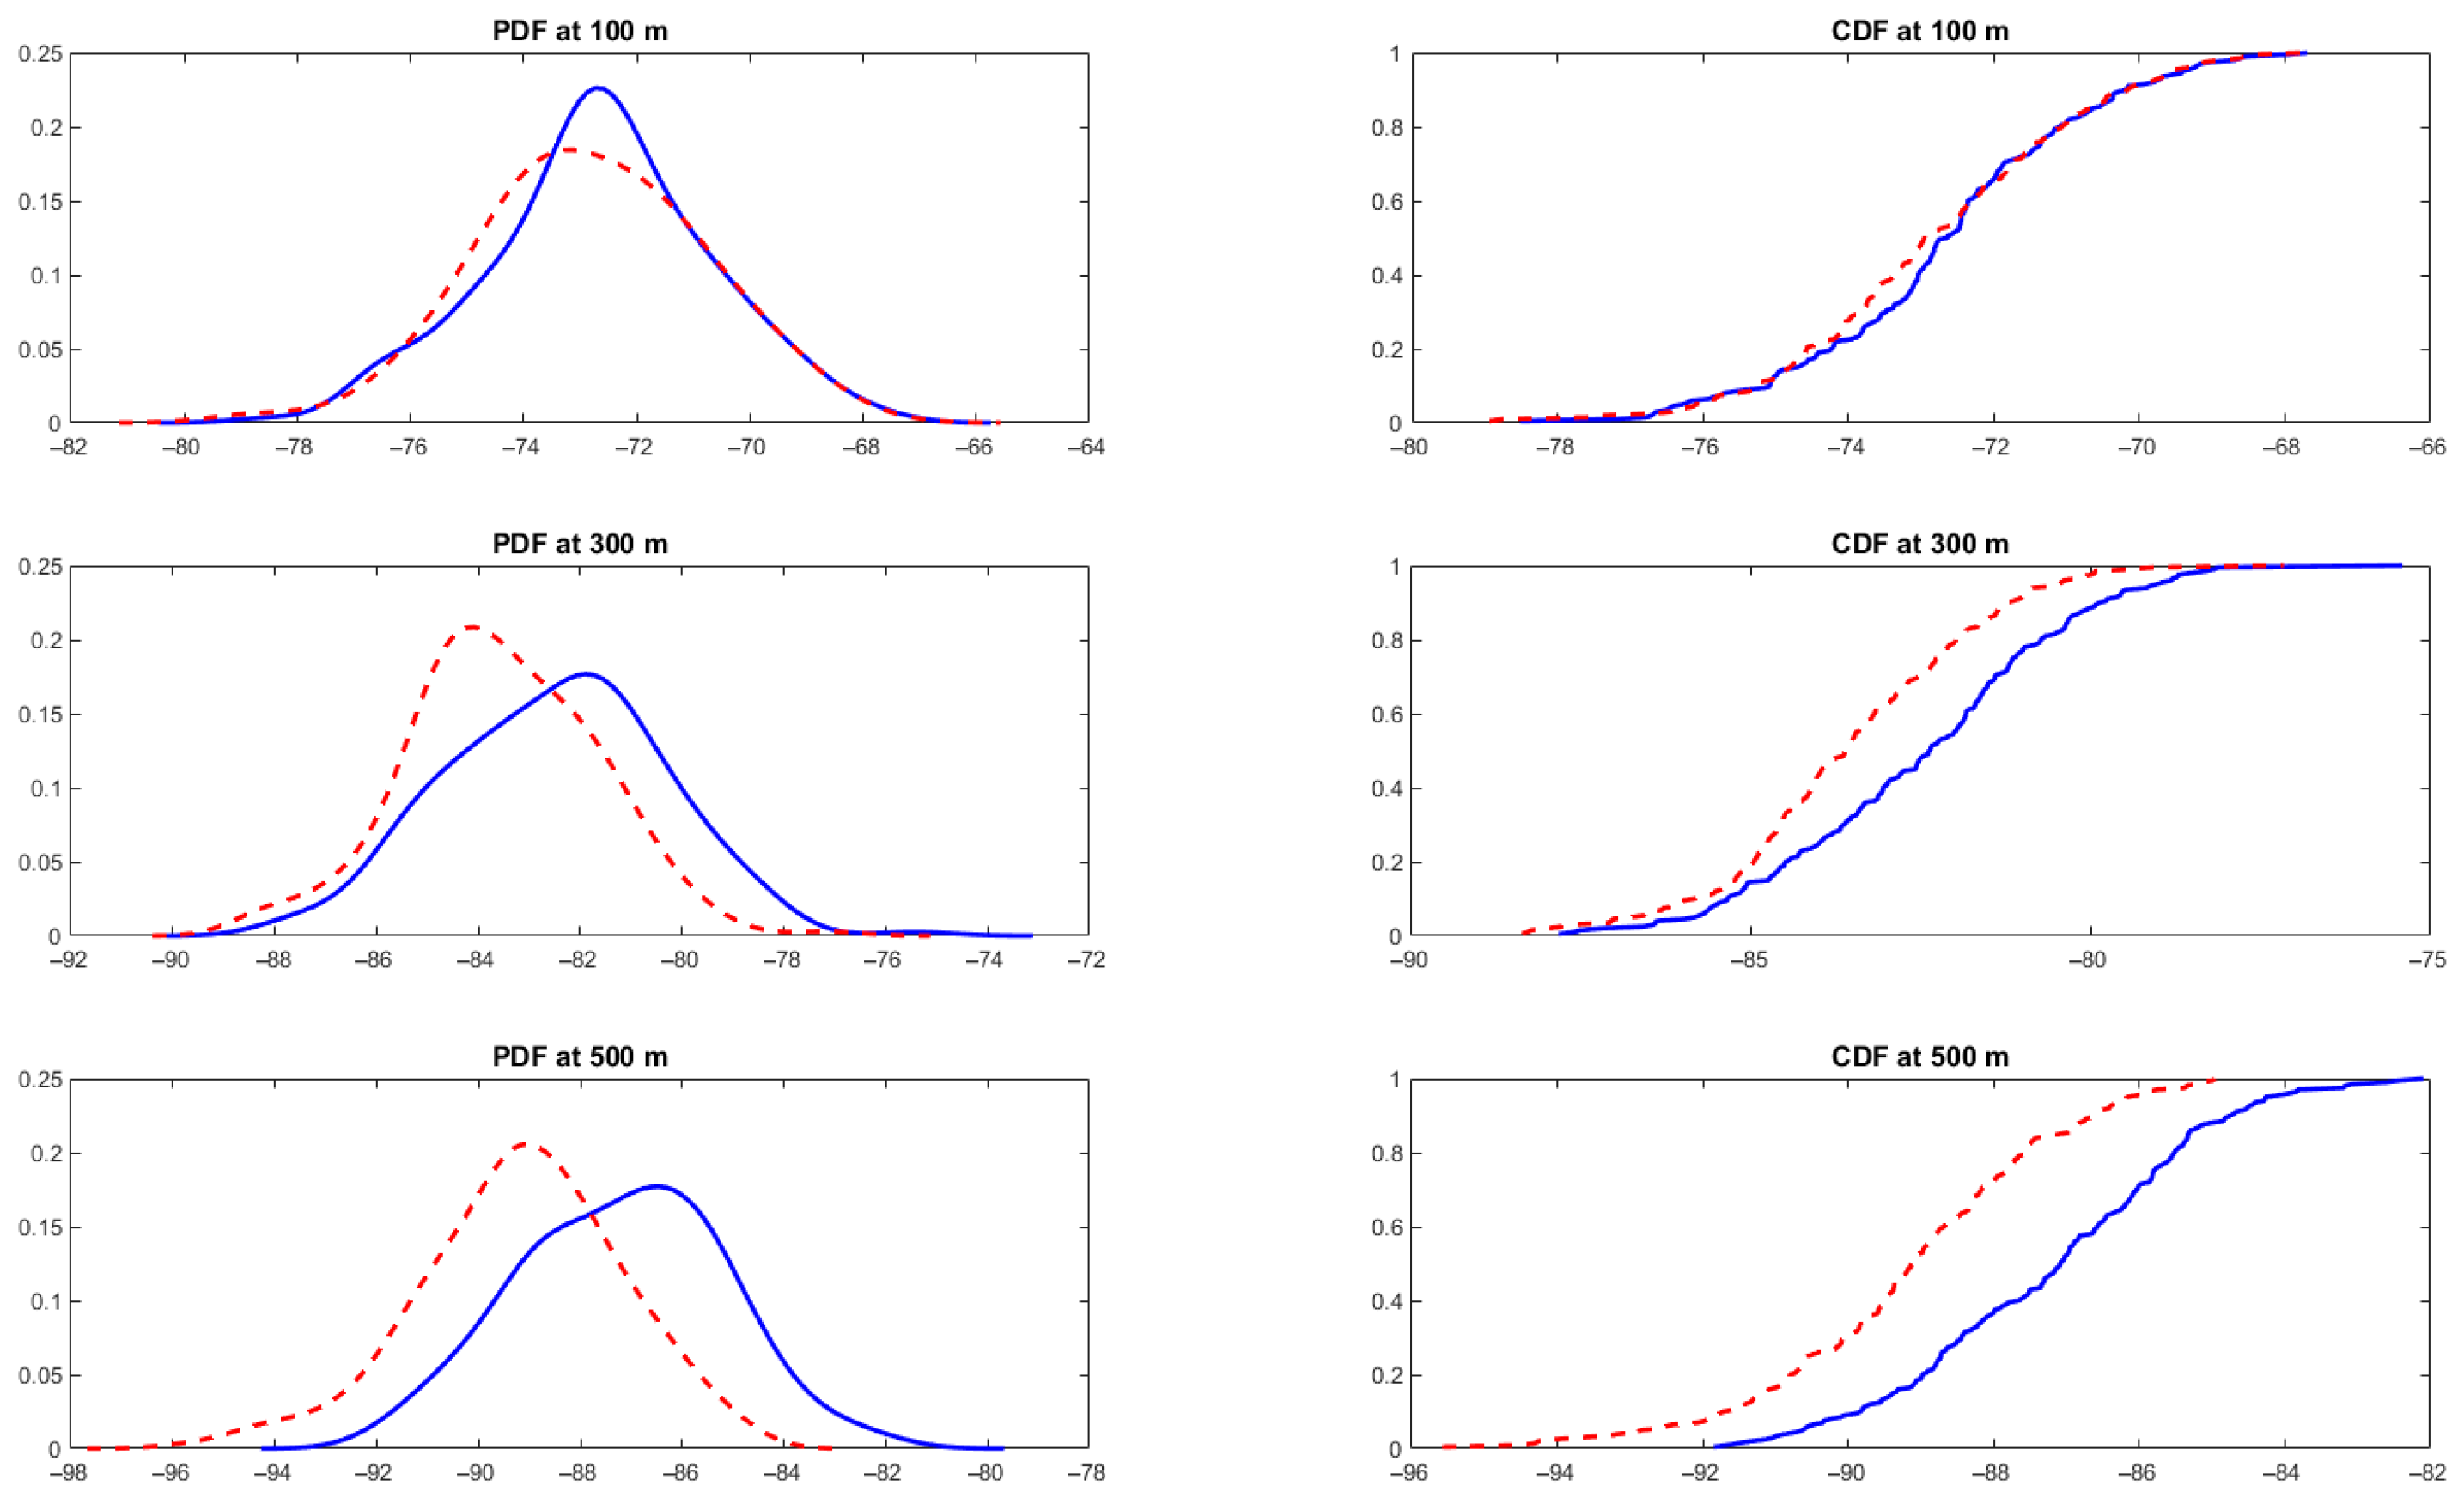
To assess the reliability of wireless signal propagation in underground environments under stochastic dust–humidity conditions, the probability density function (PDF) and cumulative distribution function (CDF) of the received signal strength (RSS) were generated at distances of 100 m, 300 m, and 500 m, as shown in Figure 5. In this analysis, a constant dust concentration of 1000 mg/m3 was assumed within a rectangular drift of 5 m width and 4 m height. These distributions quantify the statistical behavior of path loss under both empty (blue curves) and dusty (red curves) tunnel conditions, enabling risk-aware design of underground communication systems for miner tracking.
At 100 m, the PDF for both scenarios peaks near −72 dBm, with the dusty tunnel showing a slight leftward shift. The CDF indicates that over 85% of samples remain above −74 dBm, demonstrating that dust has limited influence at short ranges. This region can be considered low-risk, with stable connectivity achievable using modest transmission power.
At 300 m, the effect of dust becomes more pronounced. The dusty tunnel distribution shifts leftward relative to the no-dust case, centering closer to −84 dBm. The CDF shows that about 30–35% of RSS values in the dusty scenario fall below −85 dBm, compared to less than 20% in the empty tunnel. This identifies a moderate-to-high risk zone, where additional power margin or redundant transmission schemes may be required to maintain connectivity.
At 500 m, the gap between the two scenarios widens further. The PDF of the dusty tunnel centers near −92 dBm, while the no-dust case remains closer to −87 dBm. The CDF shows that almost 40% of RSS values in the dusty environment drop below −90 dBm, highlighting a critical risk of link instability and outage. Reliable communication at this range requires countermeasures such as higher transmission power, strategically placed relay nodes, or adaptive routing protocols responsive to fading conditions.
Overall, the probabilistic characterization across these distances shows that dust–humidity interactions amplify attenuation beyond the expected distance-dependent decay. By aligning transmission power and receiver sensitivity with the lower percentiles of the CDFs—particularly under dusty conditions—underground wireless systems can be optimized to ensure robust miner localization and tracking, even under emergency-induced environmental variability.

6. Model Validation

This section provides the details on how the proposed model was validated through the choice of validation criteria, sources of data and models used. Validation of the proposed model for electromagnetic (EM) wave propagation in a dust-laden drift is conducted through comparison with results derived from analytical models and experimentally obtained data reported in the literature. The authors could not conduct measurement campaigns due to the logistical challenges, safety risks, and high costs associated with underground field experiments.

6.1. Choice of Analytical Validation Method

In this study, the analytical models selected for validation purposes are the multimode propagation model [5,52], and the Friis propagation model [53]. Akyildiz et al. [5] proposed a close form solution to compute the received signal strength at any location within a drift as given in Equation (22).
P RX x , y , z = P TX G TX G RX 1 2 kr 0 C mn ¯ · E m , n eig x , y · e α mn + j β mn · z
where P R X x , y , z is the received signal strength (dBm), P T X is the transmitted power (dBm), G T X and G R X are the transmitter and receiver antenna gains, respectively, and r 0 is a chosen reference position (apart from antenna position). The eigenmode electric field distribution, E m , n e i g x , y is given by Equation (23) as [54,55]:
E m , n eig x , y = sin m π 2 w x + ψ x cos n π 2 h y + ψ y
where m , n = 0 ,   1 ,   2 ,   denoting mode indices, w and h are the drift width and height, respectively. C mn ¯ is the normalized mode intensity defined in Equation (24) [52], α mn and β mn are the attenuation and phase shift coefficients, respectively, defined in Equations (25) and (26), and ψ x and ψ y are the phase shifts in the x and y directions, also given by Equation (27).
C m , n = E 0 π wh 1 m π 2 wK 2 n π 2 hK 2 · sin m π 2 w x 0 + ψ x · cos n π 2 h y 0 + ψ y
α m n = 1 w m π 2 w K 2 R e 1 K ¯ v 1 + 1 h n π 2 h K 2 R e K ¯ h K ¯ h 1
β mn = K 2 m π 2 w 2 m π 2 h 2
ψ x = π 2   m   odd 0   m   even   and   ψ y = π 2   n   even 0   n   odd
In this study, the multimode propagation model results reported in [6] were used for validation, as the corresponding field measurements in that work provided the most reliable basis for comparison. This ensured that the analytical predictions could be systematically assessed against experimentally observed propagation behavior in underground drifts.
The Friis model is the second analytical model selected to validate this study. The Friis model was selected for its adaptability through the pathloss exponent (PLE) to diverse environments, including enclosed spaces such as underground mine tunnels, and for its suitability in far-field propagation scenarios common in underground mining and transportation tunnels [56]. The basic Friis model is defined in Equation (28) [53].
P R X d B m = P T X d B m + G T X d B i + G R X d B i + 20 log 10 λ 4 π 10 n log 10 d 10 log 10 L
where L represents the system losses such as losses in the antenna, and n is the pathloss exponent (PLE) which is defined in Table 10.1 in [53], and any other term holds the same mining as given in (23)–(27).
In this work, a modified Friis model (A2) that incorporates dust-induced losses was used for validation and derivation details are given in Appendix A.

6.2. Choice of Experimental Validation Data

The experimental data was obtained from the study done by Alok et al. [6]. In this study, a measurement campaign was conducted in an empty coal mine of drift dimensions 3 m high and 4 m wide. The authors used Zigbee nodes operating at 2.4 GHz over 120 m. For detailed setup information, refer to [6].

6.3. Validation Procedure and Results

For the purpose of validation, the proposed model is applied to model the propagation of electromagnetic waves in underground coal mine environment that has similar conditions as captured in mine used for the experimental data acquisition in [6]. The mine has rectangular cross-section measuring 3 m high, 4 m wide, and spanning 120 m. The operating frequency considered is 2.4 GHz, as used for the Zigbee nodes. The antenna was assumed to be transmitting at 0 dBm, with gains of 2 dBi for both transmitting and receiving antennas. In order to ascertain the impact of the variability of dust in the mine drift, the chosen variable of interest is the dielectric constant, ε d . The study in [38] provided ideal properties of dust for use in simulation, assuming a dielectric constant of 5.0 − j0.23 and a conductivity of 0.02 S/m. In cases where only real-valued dielectric constant is reported, the complex dielectric constant can be estimated using Equation (13). The parameters used in the validation are summarized in Table 1.
According to the procedure outlined in Section 5, multiple realizations of dust permittivity are generated based on the assumed statistical distribution of dielectric properties. For each realization, the deterministic Vector Parabolic Equation (VPE) is solved to obtain the corresponding propagation characteristics. The relative error is then evaluated as a function of the number of deterministic simulations, with the sampling size set to M = 10,000. Under the conditions considered in this study, approximately 100 deterministic VPE runs were sufficient to achieve convergence within the prescribed 1% error threshold.
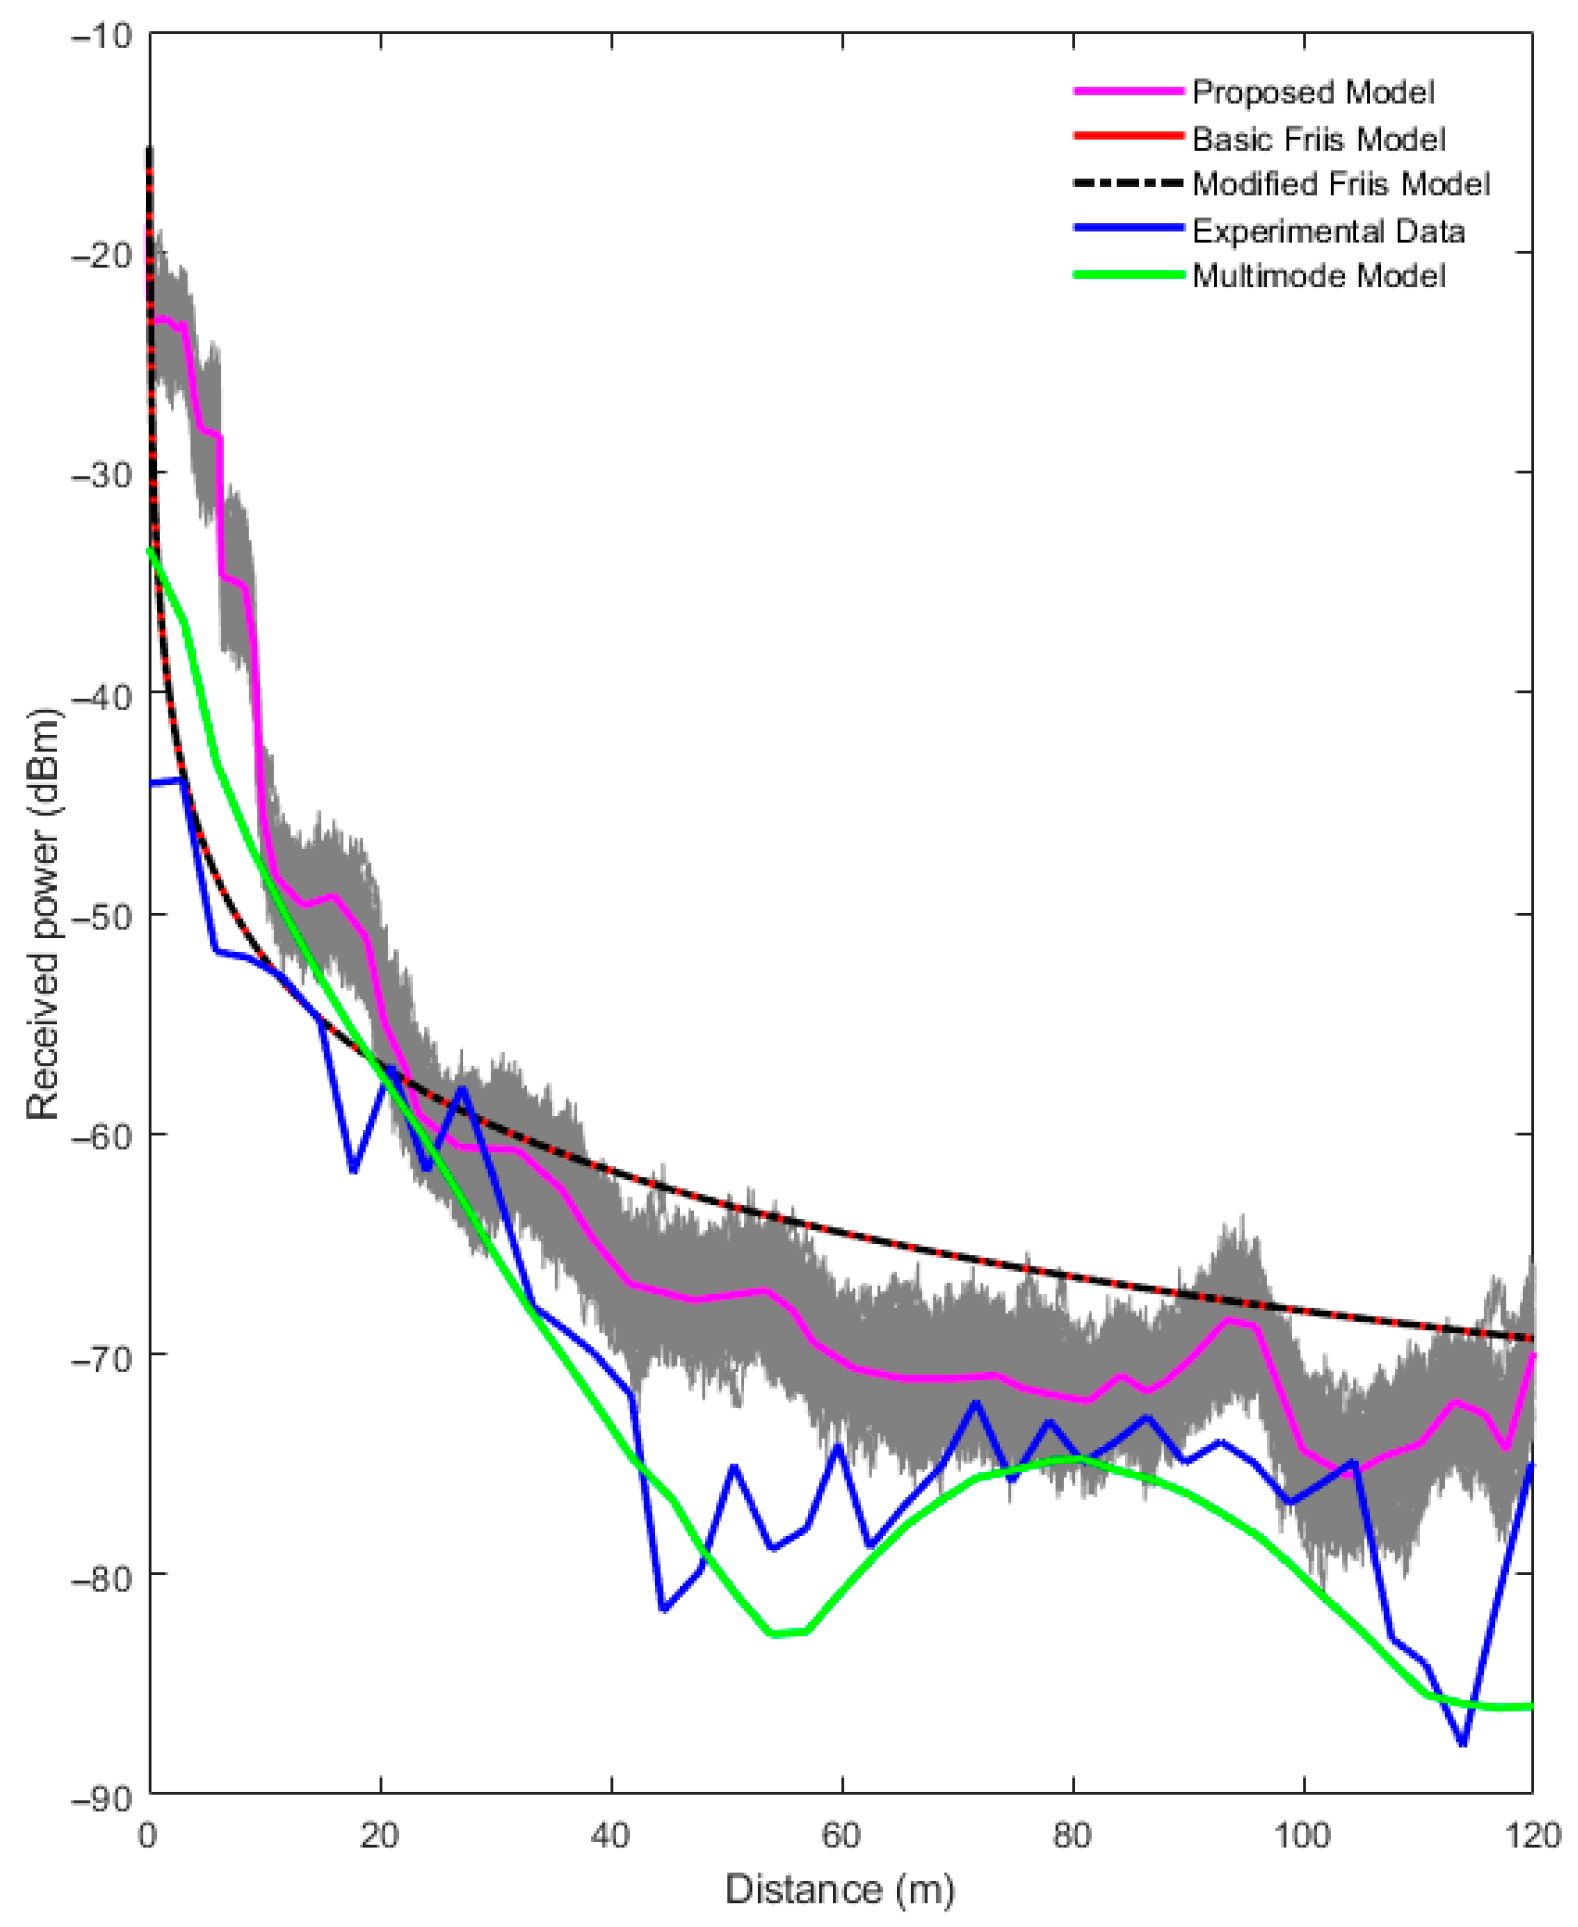
Figure 6 presents the validation results using the specified parameters. The basic and modified Friis models overlap, as the attenuation factor is very low, nearly negligible across the simulated distance. The grey cloud, generated from 100 deterministic simulations, represents the variability due to stochastic dust permittivity, with the magenta line denoting the mean trend. Compared with the Friis models, the proposed model demonstrates closer agreement with the experimental measurements, particularly in capturing the attenuation behavior along the tunnel. It can be observed that the multimode model has a close agreement with the measured data compared to the proposed model. The authors in [6] highlighted the presence of rough wall surfaces in the mine where the survey was conducted, which was eventually accounted for in the multimodal model. In the proposed model, the surface roughness effect was not considered, which could partly explain the extra loss in both the experimental and the multimodal model results. The execution time of each of the deterministic VPE simulations was approximately 43 s on Dell desktop with Intel i7-13700 Processor (Dell Inc., Round Rock, TX, USA).

7. Extended Results and Discussions

This section shows the further results generated based on different scenarios to demonstrate the applicability of the proposed model in real-world conditions.

7.1. Case Studies

The proposed model in this study is used to ascertain the effect of the presence of dust in the two case study scenarios–first in an arch-shaped drift as described in [57], and secondly, a room-and-pillar mine studied in [58].

7.1.1. First Case Study

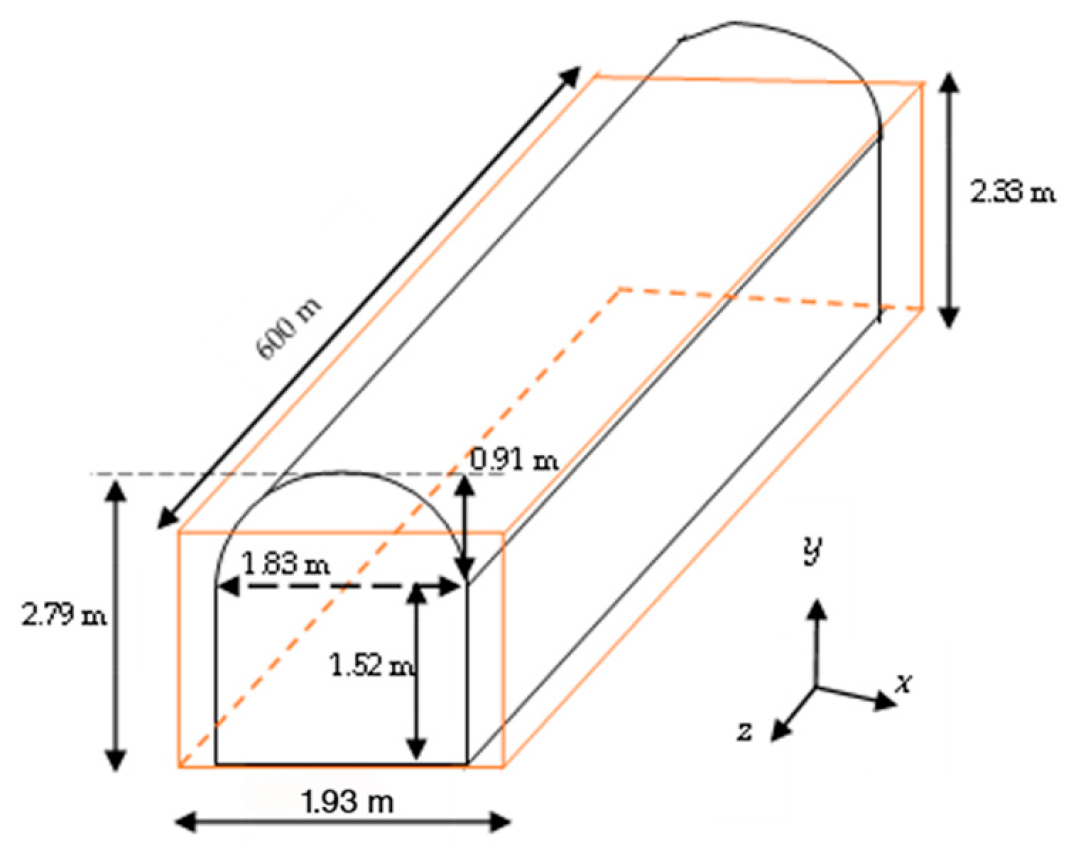
In the first case study, 600 m long arch-shaped tunnel with a relative permittivity ε d = 8.9 and σ = 0.15 S/m was assumed. Since the relative permittivity and conductivity are given in this case, the complex permittivity for the dusty tunnel case is computed using Equation (12). In terms of signal transmission, either vertically or horizontally excited electrically small dipole with unit moment was positioned immediately at the tunnel entrance. The frequencies considered for this study are 455 MHz and 915 MHz, which exhibit optimal attenuation characteristics in underground drifts. In this work, a vertically polarized dipole is selected to match the experimental setup. The details of the dimensions of the drift are shown in Figure 7. In this case study, the performance of the proposed model is compared against experimental data, as well as the results from ray tracing and modal techniques in [57]. In this simulation, the arch-shaped tunnel was converted into an equivalent rectangular tunnel using the formula provided in [59]. The resulting equivalent rectangular dimensions were 1.93 m in width and 2.33 m in height, corresponding to the arch-shaped geometry described in this study. The dust parameters used in this simulation are shown in Table 2.
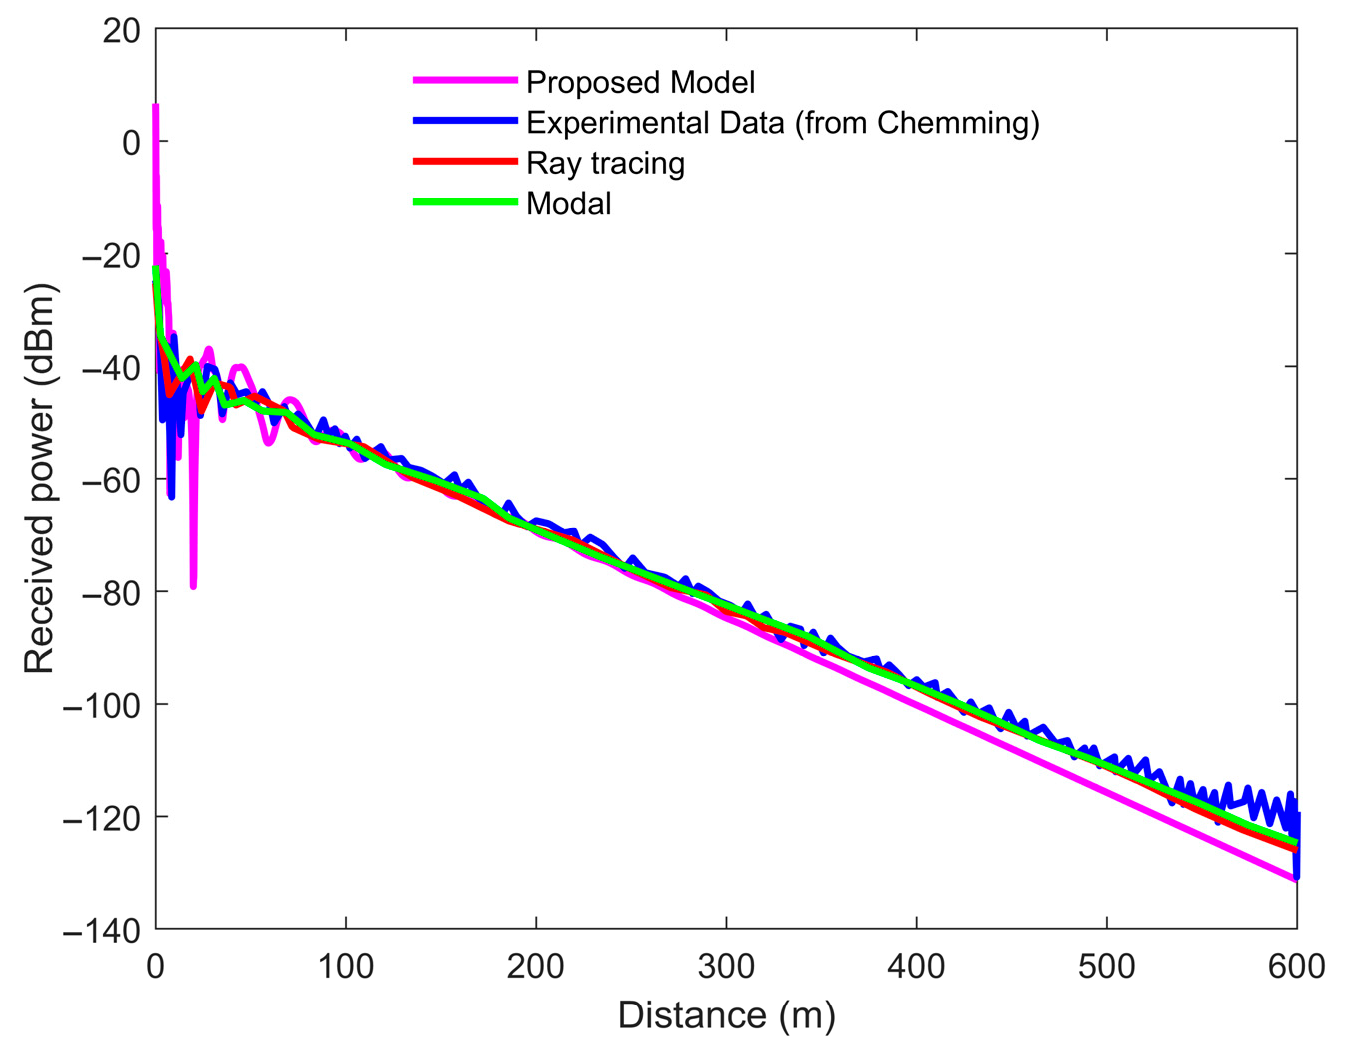
The simulation results obtained from the proposed model are compared to the experimental data, the ray tracing, and the modal results at 915 MHz, as shown in Figure 8. In the near-field region (0–50 m), the experimental data (blue) shows a sharp drop in received power, typical of tunnel propagation where modal coupling and interference dominate [61], while the proposed model (magenta) captures a similar sharp decline but with stronger fluctuations due to its explicit incorporation of dust and humidity effects, unlike the smoother ray tracing (red) and modal (green) cases that reflect more idealized assumptions. Beyond 100 m, all models follow the experimental trend of gradual power decay, with the proposed model aligning more closely to the measurements up to 300 m, whereas ray tracing and modal slightly underestimate attenuation by predicting higher power levels. After 300 m, the proposed model diverges below the experimental data, likely because its dust and humidity attenuation parameters compound losses more aggressively than observed. Meanwhile, the experimental data exhibits significant far-field fluctuations (400 m), potentially caused by multipath fading and possible measurement noise, which deterministic models cannot reproduce due to their smoothing nature. Overall, the proposed model shows superior mid-range performance by capturing environmental effects absent in the ray tracing and modal models.
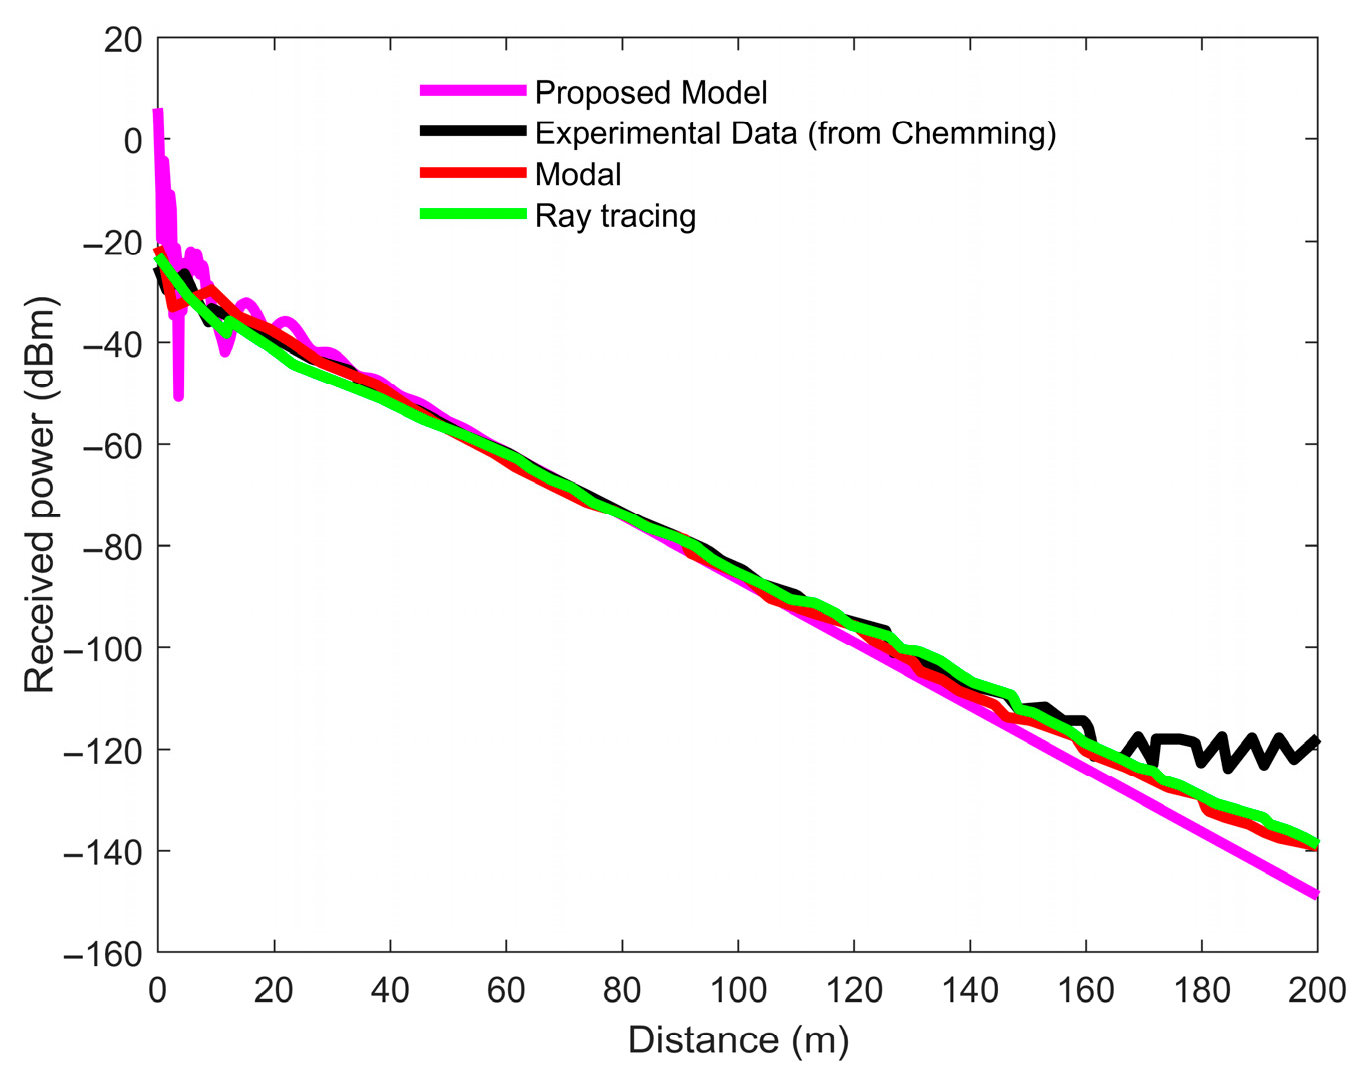
The same scenario was tested at 455 MHz but limited to a maximum range of 200 m, as shown in Figure 9. This limitation arose because the power measuring device had a noise floor of –120 dBm, meaning any signal power below this threshold could not be detected, which occurred at approximately the 200 m mark. It can be observed that the rapid power drop occurs within the first 20 m, after which the proposed model (magenta), ray tracing (green), and modal (red) closely follow the experimental data (black) until about 140 m, where the proposed model begins to reflect the pronounced impact of dust and humidity.

7.1.2. Second Case Study

In this application, the proposed model is applied to predict the propagation of electromagnetic waves in a bauxite mine of drift length 500 m in Greece. The drift has dimensions of 6 m high and 5 m wide. The experiment was conducted at operating frequencies of 450 MHz and 900 MHz. The permittivity and conductivity of the mine walls are given as 5 and 10−2 S/m, respectively. In this study, the transmitting antenna is assumed to be vertically polarized (dipole antenna). The transmitting and receiving antenna gains are assumed to be 2 dBi.
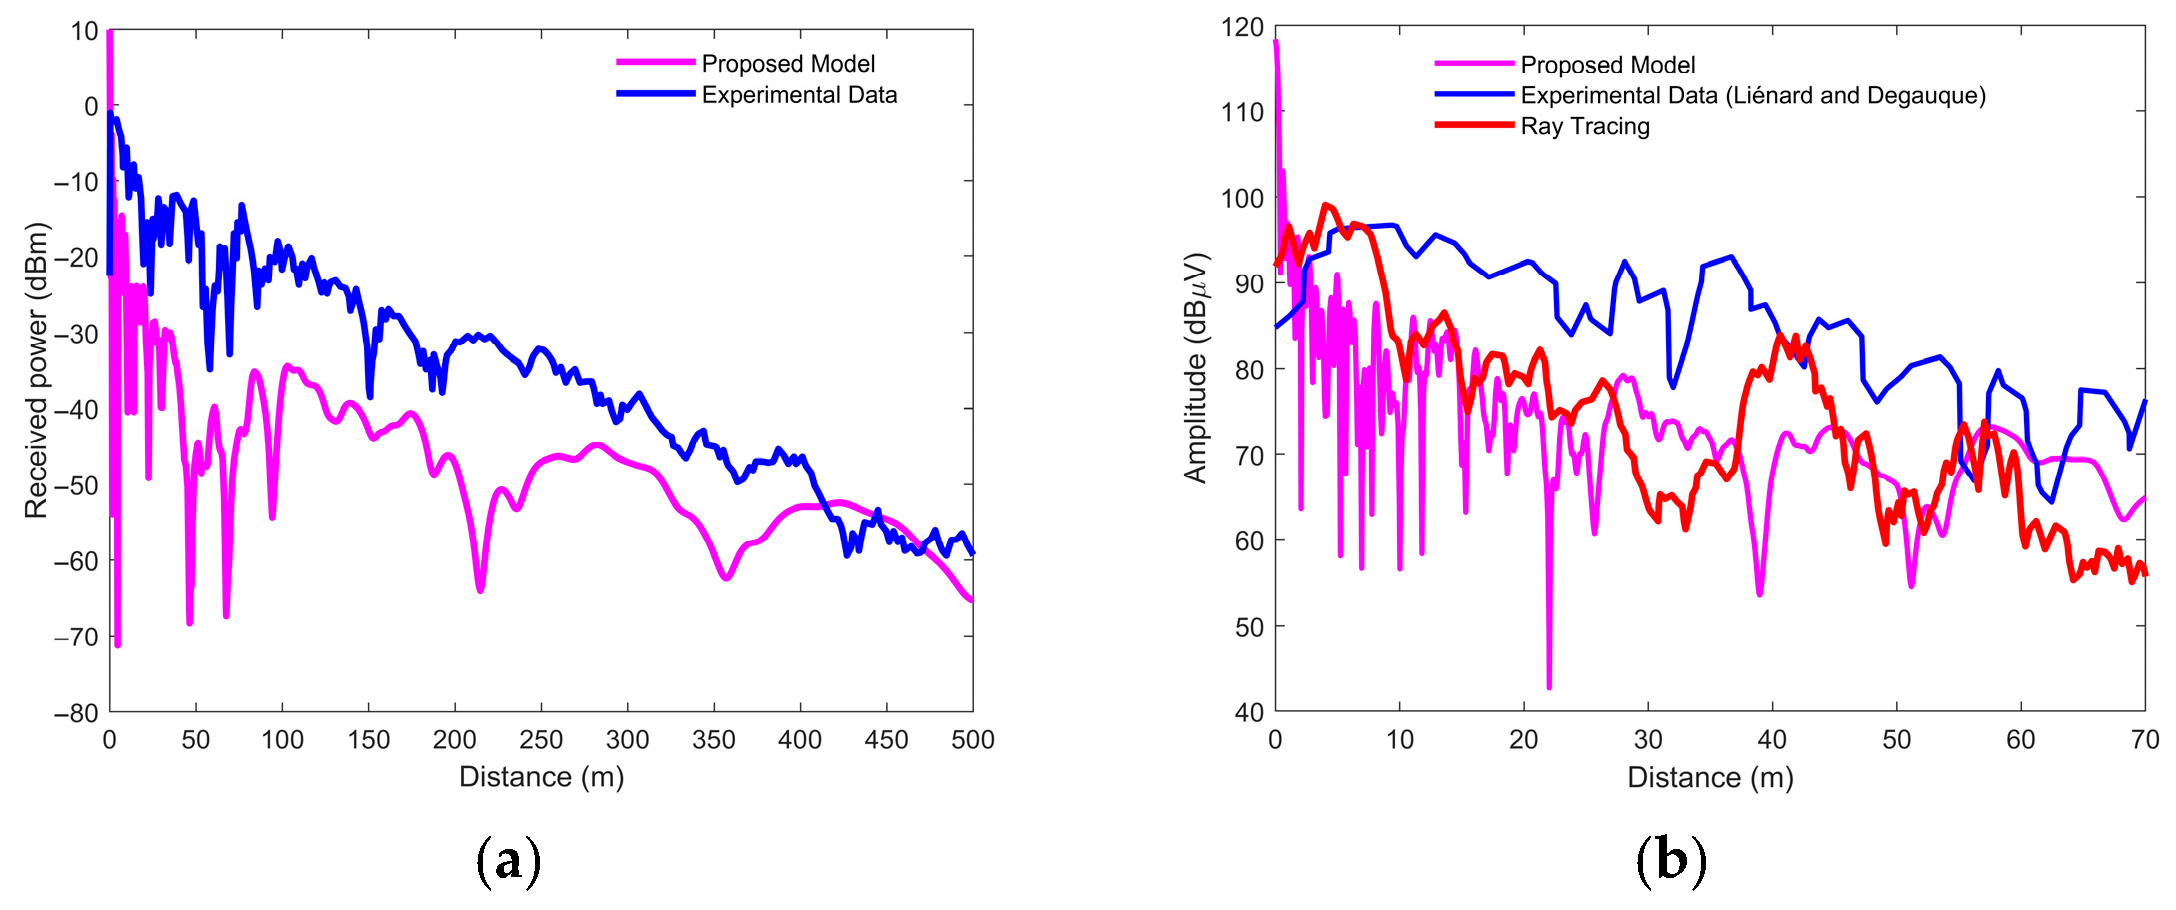
Figure 10a compares the proposed channel model (which incorporates dust and humidity effects) against experimental data gathered in a dust-free environment at 450 MHz [58]. A consistent decrease in RSS with distance is observed in both the experimental data and the proposed model’s results. However, the RSS predicted by the proposed model is significantly lower than the measured RSS. This marked disparity is directly attributed to the high attenuation effects introduced by the modeled dust and humidity. Furthermore, the pronounced fluctuations in the proposed model’s RSS underscore the impact of stochasticity within the modeling process. Figure 10b compares the field intensity (for the initial 100 m) among the measured data, the proposed model, and the ray tracing results previously reported in [58]. The equivalent field intensities (in dBµV) for the RSS (dBm) of the measured and proposed model are obtained using Equation (29) based on 50 Ω termination (standard in radio frequency measurements):
E d B μ V = P d B m + 107
Both the proposed and ray-tracing models show lower amplitudes compared to the measured data; however, the proposed model better captures the variations in the measurements, largely due to the incorporation of dust and humidity effects.
The comparative analysis of the received signal strength (RSS) at 900 MHz between the proposed model and measured data (Figure 11a) reveals four distinct propagation regions. Region 1 (0−80 m) is characterized by a rapid drop in RSS for both datasets, which is typical of near-field propagation and mode coupling within an underground drift. However, the proposed model shows pronounced lower RSS values than the measured data, likely due to extra attenuation from high levels of dust and humidity. In Region 2 (80–200 m), the measured RSS slightly increases and fluctuates, a behavior also seen in the proposed model, although at a greater attenuation, again attributable to environmental factors. Region 3 exhibits very close agreement between the model and measured data; this enhanced performance is likely due to the significant propagation of lower-order modes with higher energy, which helps overcome the attenuation caused by dust and humidity. Finally, Region 4 shows significant fluctuations in the proposed model’s RSS, which is likely caused by the reduction in wave energy over the increased distance, compounded by further interaction with dust and humidity. Figure 11b presents a comparison of field intensities over the first 100 m of the drift, showing the proposed model’s results, the ray tracing model’s results, and the measured data. The proposed model demonstrates consistent proximity to the measured data, with the minor observed differences primarily attributable to humidity and dust effects. In contrast, the ray tracing model exhibits significantly lower intensity values; this discrepancy is likely caused by the generation of multiple modes in the near-field region, which considerably impacts the accuracy of the ray tracing technique.
In summary, the proposed model is superior as it effectively captures the extra losses caused by high levels of humidity and dust and better represents the variability in the attenuation behavior compared to the ray tracing model.

8. Conclusions

This study developed and validated a stochastic vector parabolic equation (VPE) model to capture the variability of electromagnetic wave propagation in dust- and humidity-laden underground mine environments. By treating the complex permittivity of dust–humidity particles as a stochastic variable and applying the Karhunen–Loève expansion, the model effectively represented the randomness inherent in particle composition, size distribution, and moisture content. Validation against both analytical Friis-based predictions and experimental measurements confirmed the model’s ability to reproduce attenuation trends and account for additional losses not captured by deterministic approaches. Extended case studies demonstrated that dust concentration is the dominant factor influencing attenuation, with humidity exerting a secondary but amplifying effect. Probability density and cumulative distribution analyses of received signal strength further underscored the importance of risk-aware system design. Overall, the proposed framework provides a robust tool for predicting propagation under extreme and uncertain conditions, offering critical insights for the design of resilient underground wireless communication systems that enhance operational efficiency, miner localization, and safety during emergencies.

Author Contributions

Conceptualization, E.A.A., S.F. and M.A.R.; Methodology, E.A.A.; Software, E.A.A.; Validation, E.A.A.; Formal analysis, E.A.A., M.A.R. and S.M.; Investigation, E.A.A. and M.A.R.; Resources, E.A.A., S.F. and S.M.; Data curation, E.A.A.; Writing—original draft, E.A.A.; Writing—review & editing, E.A.A., S.F., M.A.R. and S.M.; Visualization, E.A.A. and S.F.; Supervision, S.F., M.A.R. and S.M.; Project administration, S.F., M.A.R. and S.M.; Funding acquisition, S.F. All authors have read and agreed to the published version of the manuscript.

Funding

This research was funded by Center for Disease Control and Prevention (CDC) and the National Institute for Occupational Safety and Health (NIOSH) U60 Program.

Institutional Review Board Statement

Not applicable.

Informed Consent Statement

Not applicable.

Data Availability Statement

The original contributions presented in this study are included inthe article. Further inquiries can be directed to the corresponding authors.

Conflicts of Interest

The authors declare no conflict of interest..

Appendix A

The Friis model in Equation (28) assumes empty tunnel conditions; however, validation requires that the dust attenuation effect is accounted for in a dusty environment. The work by Zhang and Zhang [38] proposed attenuation factor due to only dust in UG mining environment as given Equation (A1).
α d = 4.343 × 10 3 S 18 π c ρ λ ε d + 2 2 ε   dB / km
c is the dust concentration ( mg m 3 ), ρ represents the density of dust particles ( g m 3 ), and S is the sectional area of the tunnel.
The inclusion of the attenuation due to dust based on Equation (A1) is given by Equation (A2).
P R X d B m = P T X d B m + G T X d B i + G R X d B i + 20 log 10 λ 4 π 10 n log 10 d 10 log 10 L α d d

References

  1. Branch, P. Measurements and Models of 915 MHz LoRa Radio Propagation in an Underground Gold Mine. Sensors 2022, 22, 8653. [Google Scholar] [CrossRef]
  2. Javaid, F.; Wang, A.; Sana, M.U.; Husain, A.; Ashraf, I. An Optimized Approach to Channel Modeling and Impact of Deteriorating Factors on Wireless Communication in Underground Mines. Sensors 2021, 21, 5905. [Google Scholar] [CrossRef]
  3. Popov, A.V.; Zhu, N.Y. Modeling Radio Wave Propagation in Tunnels with a Vectorial Parabolic Equation. IEEE Trans. Antennas Propag. 2000, 48, 1403–1412. [Google Scholar] [CrossRef]
  4. Popov, A.V.; Vinogradov, V.A.; Zhu, N.Y.; Landstorfer, F.M. 3D Parabolic Equation Model of EM Wave Propagation in Tunnels. Electron. Lett. 1999, 35, 880–882. [Google Scholar] [CrossRef]
  5. Akyildiz, I.F.; Sun, Z.; Vuran, M.C. Signal Propagation Techniques for Wireless Underground Communication Networks. Phys. Commun. 2009, 2, 167–183. [Google Scholar] [CrossRef]
  6. Ranjan, A.; Sahu, H.B.; Misra, P. Modeling and Measurements for Wireless Communication Networks in Underground Mine Environments. Measurement 2020, 149, 106980. [Google Scholar] [CrossRef]
  7. Choudhury, B.; Jha, R.M. A Refined Ray Tracing Approach for Wireless Communications inside Underground Mines and Metrorail Tunnels. In Proceedings of the 2011 IEEE Applied Electromagnetics Conference (AEMC), Kolkata, India, 18–22 December 2011. [Google Scholar]
  8. Athanasiadou, G.E.; Nix, A.R. A Novel 3-D Indoor Ray-Tracing Propagation Model: The Path Generator and Evaluation of Narrow-Band and Wide-Band Predictions. IEEE Trans. Veh. Technol. 2000, 49, 1152–1168. [Google Scholar] [CrossRef]
  9. Zhang, X.; Sarris, C.D. Statistical Modeling of Electromagnetic Wave Propagation in Tunnels with Rough Walls Using the Vector Parabolic Equation Method. IEEE Trans. Antennas Propag. 2019, 67, 2645–2654. [Google Scholar] [CrossRef]
  10. Sunkpal, M.; Roghanchi, P.; Kocsis, K.C. A Method to Protect Mine Workers in Hot and Humid Environments. Saf. Health Work 2018, 9, 149–158. [Google Scholar] [CrossRef]
  11. Chu, T.S. Effects of Sandstorms on Microwave Propagation. Bell Syst. Tech. J. 1979, 58, 549–555. [Google Scholar] [CrossRef]
  12. Abuhdima, E.M.; Saleh, I.M. Effect of Sand and Dust Storms on Microwave Propagation Signals in Southern Libya. In Proceedings of the 2010 15th IEEE Mediterranean Electrotechnical Conference (MELECON), Valletta, Malta, 26–28 April 2010. [Google Scholar]
  13. Alozie, E.; Aliyu, I.; Ibhaze, A.E.; Abdulkarim, A.; Olakanmi, O.O.; Oloyede, A.A.; Abubakar, A.I.; Babatunde, A.E.; Oguejiofor, O.C.; Alhassan, I.A. A Review of Dust-Induced Electromagnetic Waves Scattering Theories and Models for 5G and Beyond Wireless Communication Systems. Sci. Afr. 2023, 21, e01816. [Google Scholar] [CrossRef]
  14. Liu, Y.; Zeng, Z.; Liu, X.; He, Z. Wave Propagation Modeling in Curved Tunnels with Three-Dimensional ADI-PE Method. In Proceedings of the 2020 IEEE MTT-S International Conference on Numerical Electromagnetic and Multiphysics Modeling and Optimization (NEMO), Hangzhou, China, 7–9 December 2020. [Google Scholar]
  15. Masson, E.; Combeau, P.; Cocheril, Y.; Berbineau, M.; Aveneau, L.; Vauzelle, R. Radio Wave Propagation in Curved Rectangular Tunnels at 5.8 GHz for Metro Applications, Simulations and Measurements. EURASIP J. Wirel. Commun. Netw. 2011, 2011, 202. [Google Scholar] [CrossRef]
  16. Nilsson, M.; Slettenmark, J.; Beckman, C. Wave Propagation in Curved Road Tunnels. In Proceedings of the IEEE Antennas and Propagation Society International Symposium 1998 Digest, Antennas: Gateways to the Global Network, Held in Conjunction with USNC/URSI National Radio Science Meeting, Atlanta, GA, USA, 21–26 June 1998. [Google Scholar]
  17. Yamaguchi, Y.; Abe, T.; Sekiguchi, T. Radio Wave Propagation Loss in the VHF to Microwave Region Due to Vehicles in Tunnels. IEEE Trans. Electromagn. Compat. 1989, 31, 87–91. [Google Scholar] [CrossRef]
  18. Sun, Z.; Akyildiz, I.F. Influences of Vehicles on Signal Propagation in Road Tunnels. In Proceedings of the 2010 IEEE International Conference on Communications (ICC), Cape Town, South Africa, 23–27 May 2010. [Google Scholar]
  19. Chen, S.-H.; Jeng, S.-K. SBR/Image Approach for Radio Wave Propagation in Furnished Environments. In Proceedings of the IEEE Antennas and Propagation Society International Symposium 1996 Digest, Baltimore, MD, USA, 21–26 July 1996. [Google Scholar]
  20. Masson, E.; Combeau, P.; Cocheril, Y.; Berbineau, M.; Aveneau, L.; Vauzelle, R. Radio Wave Propagation in Arch-Shaped Tunnels: Measurements and Simulations by Asymptotic Methods. C. R. Phys. Propag. Remote Sens. 2010, 11, 44–53. [Google Scholar] [CrossRef]
  21. Chiou, M.-M.; Kiang, J.-F. Microwave Propagation over Sand and Dust Storms. In Proceedings of the 2015 International Workshop on Electromagnetics: Applications and Student Innovation Competition (iWEM), Hsin-Chu, Taiwan, 4–6 November 2015. [Google Scholar]
  22. Eltahir, E.I.; Attada, R.; Guo, J.; Francis, D.; Banerjee, P.; Fonseca, R.; Anisimov, A.; Ben Bacha, H.; Lee, J.; Pydisetti, R.; et al. Sand and Dust Storm Attenuation Prediction Using Visibility and Humidity Measurements. IEEE Access 2024, 12, 79602–79612. [Google Scholar] [CrossRef]
  23. Ishimaru, A. Wave Propagation and Scattering in Random Media; Elsevier: New York, NY, USA, 1978. [Google Scholar] [CrossRef]
  24. Chen, H.-Y.; Ku, C.-C. Calculation of Wave Attenuation in Sand and Dust Storms by the FDTD and Turning Bands Methods at 10–100 GHz. IEEE Trans. Antennas Propag. 2012, 60, 2951–2960. [Google Scholar] [CrossRef]
  25. Mahmood, H.N.; Ismail, W. Visibility Parameter in Sand/Dust Storms’ Radio Wave Attenuation Equations: An Approach for Reliable Visibility Estimation Based on Existing Empirical Equations to Minimize Potential Biases in Calculations. Appl. Sci. 2020, 10, 7530. [Google Scholar] [CrossRef]
  26. Goldhirsh, J. A Parameter Review and Assessment of Attenuation and Backscatter Properties Associated with Dust Storms over Desert Regions in the Frequency Range of 1 to 10 GHz. IEEE Trans. Antennas Propag. 1982, 30, 1121–1127. [Google Scholar] [CrossRef]
  27. Faruk, N.; Popoola, S.I.; Surajudeen-Bakinde, N.T.; Oloyede, A.A.; Abdulkarim, A.; Olawoyin, L.A.; Ali, M.; Calafate, C.T.; Atayero, A.A. Path Loss Predictions in the VHF and UHF Bands Within Urban Environments: Experimental Investigation of Empirical, Heuristics and Geospatial Models. IEEE Access 2019, 7, 77293–77307. [Google Scholar] [CrossRef]
  28. Mezaal, M.T.; Aripin, N.B.M.; Othman, N.S.; Sallomi, A.H. Empirical Modelling of Dust Storm Path Attenuation for 5G mmWave. Results Eng. 2024, 22, 102092. [Google Scholar] [CrossRef]
  29. Ghobrial, S.I. Effect of Hydroscopic Water on Dielectric Constant of Dust at X-Band. Electron. Lett. 1980, 16, 393–394. [Google Scholar] [CrossRef]
  30. Sharif, S.M. Clutter and Backscatter Cross-Section of Dust Storms at X-Band. SES 1997, 41, 31–36. [Google Scholar]
  31. Ghobrial, S.; Sharief, S. Microwave Attenuation and Cross Polarization in Dust Storms. IEEE Trans. Antennas Propag. 1987, 35, 418–425. [Google Scholar] [CrossRef]
  32. Ahmed, A.S. Role of Particle-Size Distributions on Millimetre-Wave Propagation in Sand/Dust Storms. IEE Proc. H (Microw. Antennas Propag.) 1987, 134, 55–59. [Google Scholar] [CrossRef]
  33. Ghobrial, S.I.; Jervase, J.A. Microwave Propagation in Dust Storms at 10.5 GHz—A Case Study in Khartoum. IEICE Trans. Commun. 1997, E80-B, 1722–1727. [Google Scholar]
  34. Ansari, A.J.; Evans, B.G. Microwave Propagation in Sand and Dust Storms. IEE Proc. F (Commun. Radar Signal Process.) 1982, 129, 315–322. [Google Scholar] [CrossRef]
  35. Bagnold, R.A. The Physics of Blown Sand and Desert Dunes, 1st ed.; Methuen & Co. Ltd.: London, UK, 1941; pp. 1–9. [Google Scholar]
  36. Elsheikh, E.A.A.; Islam, M.R.; Alam, A.H.M.Z.; Ismail, A.F.; Al-Khateeb, K.; Elabdin, Z. The Effect of Particle Size Distributions on Dust Storm Attenuation Prediction for Microwave Propagation. In Proceedings of the International Conference on Computer and Communication Engineering (ICCCE’10), Kuala Lumpur, Malaysia, 11–13 May 2010. [Google Scholar]
  37. Lasne, Y.; Paillou, P.; Ruffie, G.; Malezieux, J.-M.; Demontoux, F.; Bruckler, L. Effect of Salinity on the Dielectric Properties of Geological Materials: Implication for Soil Moisture Detection by Means of Radar Remote Sensing. IEEE Trans. Geosci. Remote Sens. 2008, 46, 1674–1688. [Google Scholar] [CrossRef]
  38. Zhang, W.Y.; Zhang, J.L. Influence of Mine Dust on Propagation Characteristic of UHF Electromagnetic Wave in Tunnel. J. China Coal Soc. 2009, 34, 1554–1557. [Google Scholar]
  39. Cheng, L.F.; Li, J.; Zhang, L.L. Dust in Tunnel Influence to Propagation Characteristics of UHF Electromagnetic Waves. Appl. Mech. Mater. 2011, 143–144, 828–832. [Google Scholar] [CrossRef]
  40. Levy, M. Parabolic Equation Methods for Electromagnetic Wave Propagation; Institution of Electrical Engineers: London, UK, 2000. [Google Scholar]
  41. Dong, Q.; Li, Y.-L.; Xu, J.; Zhang, H.; Wang, M. Effect of Sand and Dust Storms on Microwave Propagation. IEEE Trans. Antennas Propag. 2013, 61, 910–916. [Google Scholar] [CrossRef]
  42. Chiou, M.-M.; Kiang, J.-F. PWE-Based Radar Equation to Predict Backscattering of Millimeter-Wave in a Sand and Dust Storm. IEEE Trans. Antennas Propag. 2017, 65, 785–793. [Google Scholar] [CrossRef]
  43. Li, Y.; Yu, B.; Huang, L. Path Loss Modeling of Wireless Signals in Underground Tunnels. IEEE Open J. Antennas Propag. 2025, 6, 64–74. [Google Scholar] [CrossRef]
  44. Uzunoglu, N.; Kanellopoulos, J. Scattering of a Plane Wave from Cylindrical Tunnels inside a Lossy Medium. In Proceedings of the 1981 Antennas and Propagation Society International Symposium, Los Angeles, CA, USA, 8–12 June 1981. [Google Scholar]
  45. Kocifaj, M.; Kómar, L.; Kundracik, F.; Markoš, P.; Petržala, J.; Videen, G. The Nature, Amplitude and Control of Microwave Attenuation in the Atmosphere. J. Geophys. Res. Atmos. 2021, 126, e2021JD034978. [Google Scholar] [CrossRef]
  46. Ginoux, P. Effects of nonsphericity on mineral dust modeling. J. Geophys. Res. 2003, 108, 4052. [Google Scholar] [CrossRef]
  47. Ruike, Y.; Zhensen, W.; Jinguang, Y. The Study of MMW and MW Attenuation Considering Multiple Scattering Effect in Sand and Dust Storms at Slant Paths. Int. J. Infrared Millim. Waves 2003, 24, 1383–1392. [Google Scholar] [CrossRef]
  48. Ghanem, R.G.; Spanos, P.D. Stochastic Finite Elements: A Spectral Approach; Springer: New York, NY, USA, 1991; pp. 15–97. [Google Scholar]
  49. Le Maître, O.P.; Knio, O.M. Spectral Methods for Uncertainty Quantification: With Applications to Computational Fluid Dynamics; Springer: New York, NY, USA, 2010; pp. 1–104. [Google Scholar]
  50. Stefanou, G. The stochastic finite element method: Past, present and future. Comput. Methods Appl. Mech. Eng. 2008, 198, 1031–1051. [Google Scholar] [CrossRef]
  51. Zheng, Z.; Dai, H. Simulation of multi-dimensional random fields by Karhunen–Loève expansion. Comput. Methods Appl. Mech. Eng. 2017, 324, 221–247. [Google Scholar] [CrossRef]
  52. Ranjan, A.; Misra, P.; Dwivedi, B.; Sahu, H.B. Studies on Propagation Characteristics of Radio Waves for Wireless Networks in Underground Coal Mines. Wirel. Pers. Commun. 2017, 97, 2819–2832. [Google Scholar] [CrossRef]
  53. Viswanathan, M. Wireless Communication Systems in Matlab; Mathuranathan Viswanathan: Columbia, DC, USA, 2020; pp. 247–262. [Google Scholar]
  54. Collins, R.E. Field Theory of Guided Waves; Wiley-IEEE: New York, NY, USA, 1991; pp. 329–410. [Google Scholar]
  55. Laakmann, K.D.; Steier, W.H. Waveguides: Characteristic modes of hollow rectangular dielectric waveguides. Appl. Opt. 1976, 15, 1334–1340. [Google Scholar] [CrossRef]
  56. Oladimeji, T.T.; Kumar, P.; Oyie, N.O. Propagation Path Loss Prediction Modelling in Enclosed Environments for 5G Networks: A Review. Heliyon 2022, 8, e11581. [Google Scholar] [CrossRef]
  57. Zhou, C. Ray Tracing and Modal Methods for Modeling Radio Propagation in Tunnels with Rough Walls. IEEE Trans. Antennas Propag. 2017, 65, 2624–2634. [Google Scholar] [CrossRef]
  58. Lienard, M.; Degauque, P. Natural Wave Propagation in Mine Environments. IEEE Trans. Antennas Propag. 2000, 48, 1326–1339. [Google Scholar] [CrossRef]
  59. El-Maghrabi, H.M.; Mahmoud, S.F.; El-Said, M. Modal Analysis of Wave Propagation in Straight and Curved Arched Tunnel Based on Equivalent Rectangular Tunnel Model. Appl. Comput. Electromagn. Soc. J. 2017, 32, 754–760. [Google Scholar]
  60. Zhou, C.; Waynert, J.A.; Plass, T.; Jacksha, R. Attenuation Constants of Radio Waves in Lossy-Walled Rectangular Waveguides. Prog. Electromagn. Res. 2013, 142, 75–105. [Google Scholar] [CrossRef]
  61. Qian, J.; Wu, Y.; Saleem, A.; Zheng, G. Path Loss Model for 3.5 GHz and 5.6 GHz Bands in Cascaded Tunnel Environments. Sensors 2022, 22, 4524. [Google Scholar] [CrossRef] [PubMed] [PubMed Central]
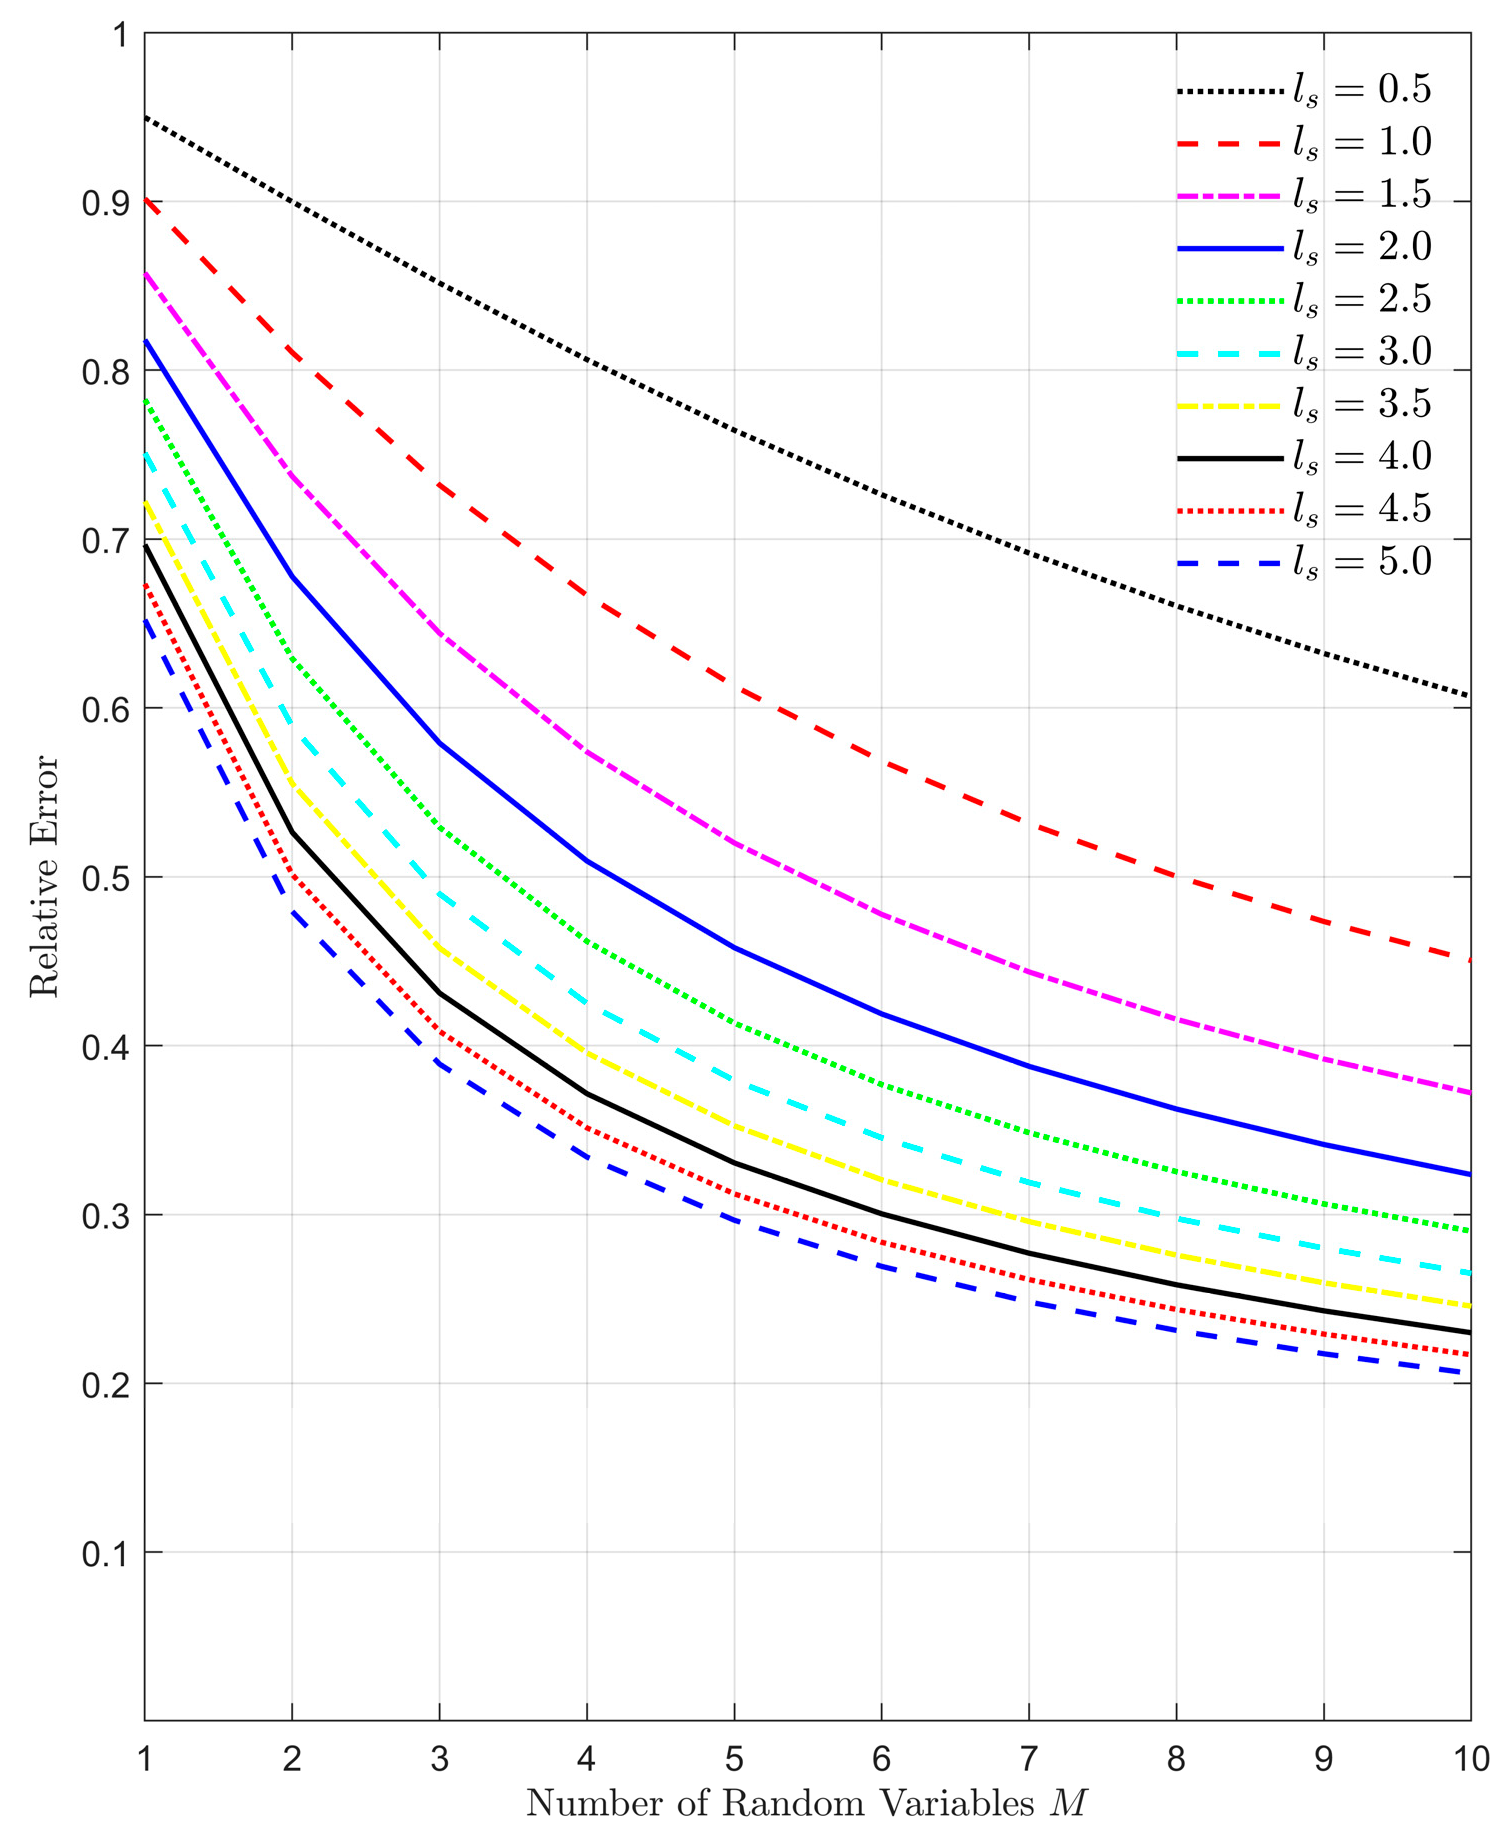
Figure 1. Choice of correlation length and the equivalent relative error.
Information 16 00891 g001
Figure 2. KL terms retained versus cumulative variance.
Information 16 00891 g002
Figure 3. Realization of the dielectric constant for real and imaginary components.
Information 16 00891 g003
Figure 4. Assessing the impact of particle concentrations and humidity levels on the propagation constant (the red and blue lines represent the attenuation (dB/m) for varying dust concentration and varying humidy levels respectively).
Information 16 00891 g004
Figure 5. PDF and CDF of RSS at 100 m, 300 m, and 500 m under stochastic dust–humidity conditions.
Information 16 00891 g005
Figure 6. Received signal strength (RSS) at 2.4 GHz in rectangular coal mine tunnel with spatial discretization steps of ∆x = ∆y = 0.05 m and ∆s = 0.1.
Information 16 00891 g006
Figure 7. Arch-shaped drift and its rectangular equivalent as used in case study 1 [60].
Information 16 00891 g007
Figure 8. Comparison of RSS between experimentally acquired data (blue) to proposed model (magenta), modal (green), and ray tracing (red) at 915 MHz.
Information 16 00891 g008
Figure 9. Comparison of RSS between experimentally acquired data (black) and proposed model (magenta), modal (red), and ray tracing (green) at 455 MHz.
Information 16 00891 g009
Figure 10. (a) Comparison of RSS between proposed model and experimental data at 450 MHz; (b) Comparison of the field intensities of proposed model and ray tracing model to experimental data at 450 MHz.
Information 16 00891 g010
Figure 11. (a) Comparison of RSS between proposed model and experimental data at 900 MHz; (b) Comparison of the field intensities of proposed model and ray tracing model to experimental data at 900 MHz.
Information 16 00891 g011
Table 1. Simulation parameters and assigned values.
ParameterValue
Drift height (m)3
Drift width (m)4
Drift length (m)120
Dust concentration ( mg / m 3 ) 10
Dust particle density ( g / m 3 )3.18
Operating frequency (GHz)2.4
Dielectric constant 5 j 0.23
Attenuation factor (dB/m) 2.8 × 10 7
Transmitting power (dBm)0
Transmitter gain (dBi)2
Receiver gain (dBi)2
Dust conductivity (S/m)0.02
Correlation length (m)2.5
Table 2. Dust simulation parameter for the first case study.
ParameterValue
Dust concentration ( mg / m 3 ) 100
Dust particle density ( g / m 3 )3.18
Operating frequency (MHz)915 and 455
Disclaimer/Publisher’s Note: The statements, opinions and data contained in all publications are solely those of the individual author(s) and contributor(s) and not of MDPI and/or the editor(s). MDPI and/or the editor(s) disclaim responsibility for any injury to people or property resulting from any ideas, methods, instructions or products referred to in the content.